1. Introduction
The transition toward a circular economy has encouraged the valorization of different waste materials as secondary resources in the construction sector. Construction and demolition wastes, recycled concrete aggregates, recycled concrete powder, industrial by-products, plastics, glass, and other discarded materials have increasingly been incorporated into cementitious composites, aggregates, bricks, and related construction products. These applications can reduce the consumption of virgin raw materials, divert waste from landfills, and lower the environmental burden associated with conventional construction materials. Recent studies have also shown that advanced treatment methods can improve the performance of recycled materials. For example, CO2 mineralization can enhance the microstructure, hydration behavior, mechanical performance, and durability of recycled concrete powder and cementitious materials. Likewise, carbonation treatment combined with fiber reinforcement has been shown to densify the interfacial transition zone, reduce porosity, and improve the mechanical response of recycled aggregate concrete, as demonstrated through in situ four-dimensional computed tomography analysis of microcrack evolution. These developments illustrate how waste streams can be transformed into value-added materials through technological innovation and circular resource-management strategies.
Although substantial progress has been made in the technological reuse of construction and industrial wastes, the effectiveness of circular economy strategies also depends on individuals’ willingness and capacity to separate, return, and channel discarded products through appropriate recovery systems. This challenge is particularly relevant for electronic waste, whose hazardous components, residual economic value, rapid obsolescence, and specialized treatment requirements make responsible recycling more complex than conventional solid-waste management.
For several decades, there has been growing interest among university students in recycling, particularly the recycling of electronic components. Authors such as Fang et al. [
1] highlight the need to address challenges including waste generation and resource scarcity, and to achieve sustainable economic benefits through a circular economy that considers not only the end-of-life stage, but all stages of the product life cycle.
Over time, the number of computers and telecommunications units destined for dismantling will increase, while the number of precious metals per unit is expected to decline sharply in the future, making segregation and processing more difficult. Therefore, it is necessary to raise awareness among new generations about novel processing methods capable of effectively separating a wide range of electronic-system scrap [
2]. Noon et al. [
3] notes that recycling, as an activity with significant potential to mitigate environmental impacts, is essential; however, the authors also emphasize the uncertainty and assumptions underlying the environmental credits attributed to recycling.
There is a notable scarcity of psychometric instruments in the scientific literature focused on the recycling of electronic components. In support of this claim, a detailed bibliographic search was conducted to identify existing recycling-related instruments.
Table 1 shows that several instruments are available, each with a specific structure and taxonomy. Based on the review of the studies presented, it can be observed that measurement predominantly relies on validated instruments with consistent purposes—such as assessing participation, awareness, and behaviors—while validity and reliability are treated as methodological standards.
As shown in the table, there is a need for specialized instruments that responsibly assess the level of knowledge regarding electronic-waste recycling, as well as its intrinsic factors, policy compliance, community participation, cultural influence, business practices, and technological adoption. This article aims to develop a new psychometric instrument, offering a distinct contribution by focusing on these specific aspects and on a population that has been under-researched to date.
In this study, computer e-waste recycling behavior is defined as the set of intentional decisions and actions undertaken by university students to responsibly manage obsolete or discarded computing equipment and components. These actions may include extending product life through repair or reuse, separating devices from general waste, donating or returning equipment, and delivering it to authorized collection, recovery, or recycling channels. The proposed scale does not directly assess the frequency or occurrence of these actions. Instead, it measures the perceived individual and contextual determinants that may enable or constrain them, including education and awareness, policy compliance, community participation, business and technological practices, technological innovation, and cultural and media influence.
The choice of university students was not based solely on accessibility. This population is strategically relevant because it combines high exposure to rapidly replaced digital technologies with participation in institutional environments capable of shaping environmental behavior. University students frequently use and replace computing devices, yet their disposal decisions are influenced not only by personal awareness but also by campus policies, collection infrastructure, technological information, peer norms, and educational initiatives. These characteristics make them an appropriate population for examining the interaction between individual and contextual determinants of computer e-waste recycling. In addition, validating the scale in higher education settings provides a practical tool that universities can use to identify dimensions in which students report comparatively less favorable perceptions, evaluate interventions, and monitor changes in perceived recycling-related determinants associated with circular economy and SDG 12 objectives.
Previous studies have developed or applied measurement instruments to examine different aspects of e-waste awareness, management, attitudes, and recycling-related determinants across diverse populations.
Table 1 provides a concise overview of selected studies, focusing on their purpose, study population, and whether reliability and validity evidence was reported.
Existing instruments have primarily focused on general e-waste awareness, participation in recycling programs, waste-separation beliefs, perceived barriers and benefits, or the service quality of collection platforms. Although these instruments have contributed valuable evidence, they generally assess isolated aspects of recycling or were developed for consumers, households, school students, or the general population. The instrument proposed in this study advances the literature by integrating, within a single multidimensional measure, individual, institutional, technological, community, cultural, and media-related determinants specifically associated with computer e-waste recycling among university students. This broader conceptual coverage enables the identification of not only students’ awareness and predispositions, but also the contextual conditions that facilitate or constrain responsible recycling behavior in higher education settings.
2. Materials and Methods
2.1. Theoretical Models of Pro-Environmental Behavior (TPB, NAM, VBN)
Pro-environmental behavior is generally understood as the result of interacting cognitive, normative, moral, and contextual determinants rather than as a consequence of environmental knowledge alone. Across the literature, three theoretical perspectives—the Theory of Planned Behavior (TPB), the Norm Activation Model (NAM), and the Value–Belief–Norm theory (VBN)—provide complementary explanations of why individuals adopt or fail to adopt environmentally responsible practices. Collectively, these frameworks suggest that behavior is more likely to occur when individuals evaluate the action positively, perceive social support for it, believe that they possess the resources and opportunities necessary to perform it, and consider it a personal or moral responsibility [
11].
The TPB emphasizes the deliberate and intention-based nature of behavior. From this perspective, favorable attitudes, supportive subjective norms, and perceived behavioral control jointly shape behavioral intention, which in turn influences actual action. This framework is particularly useful for explaining recycling decisions because individuals must not only recognize the environmental value of recycling but also perceive that the behavior is socially expected and practically feasible. However, in the case of computer e-waste, intention may not translate directly into action when formal collection systems, information, or accessible recycling infrastructure are absent. Thus, perceived control should be interpreted not only as an individual perception but also as a reflection of institutional and technological conditions [
12].
The NAM and VBN frameworks extend this explanation by emphasizing moral obligation, environmental values, and awareness of consequences [
13]. Their shared premise is that environmentally responsible behavior becomes more likely when individuals recognize the negative consequences of inadequate waste management, attribute some responsibility to themselves, and activate personal norms consistent with environmental protection. This perspective is especially relevant to computer e-waste because improper disposal may produce environmental and health impacts that are not immediately visible to users. Nevertheless, moral commitment alone may be insufficient when individuals lack knowledge about recycling procedures, certified collection points, data-security risks, or the final destination of discarded devices.
Taken together, these theories support a consensus-based interpretation in which computer e-waste recycling behavior emerges from the interaction of individual predispositions and enabling contextual conditions [
14]. Attitudes, environmental values, perceived responsibility, social norms, and behavioral control represent important antecedents, but their influence is conditioned by institutional communication, policy enforcement, community participation, technological alternatives, and the availability of formal recovery systems. Therefore, computer e-waste recycling should not be conceptualized exclusively as an individual behavioral decision; it should also be understood as a context-dependent practice embedded within a broader institutional and circular economy ecosystem.
This integrated perspective also reveals an important limitation in the existing literature. Although TPB, NAM, and VBN explain central motivational mechanisms, they do not always fully capture the organizational, technological, cultural, and market conditions that determine whether electronic waste can actually be recycled [
14,
15]. Consequently, research on computer e-waste requires multidimensional measurement approaches capable of assessing both internal determinants and external facilitators. Based on this interpretation, the present study incorporates dimensions related to education and awareness, policy compliance, community participation, business and technological practices, innovation and technological adoption, and cultural and media influence.
The TPB, NAM, and VBN were not used as independent or competing frameworks, but as complementary theoretical sources for identifying the individual and social mechanisms associated with computer e-waste recycling. The TPB informed the inclusion of attitudes toward recycling, perceived social expectations, and perceived enabling or constraining conditions. The NAM contributed awareness of environmental consequences, attribution of responsibility, and personal normative orientation, whereas the VBN framework supported the incorporation of environmental values, beliefs about the consequences of improper e-waste disposal, and moral commitment to responsible management.
These constructs were subsequently connected to the proposed dimensions of the scale. Education, awareness, and policy compliance reflected environmental knowledge, awareness of consequences, responsibility, and normative orientation derived mainly from NAM and VBN, together with regulatory beliefs related to perceived behavioral control. Community participation and education represented subjective norms, social support, and collective responsibility, primarily associated with TPB and NAM. Business and technological practices and innovation and technological adoption represented contextual components of perceived behavioral control, particularly the availability of organizational support, infrastructure, information, and technological alternatives. Cultural and media influence captured socially transmitted values, beliefs, subjective norms, and environmental meaning, drawing on TPB and VBN.
On this basis, the initial item pool was generated through a theory-informed literature review. Each candidate item was assigned to a theoretical construct and proposed dimension before expert evaluation. The theories therefore guided the conceptual specification and item-domain classification, while the literature review provided context-specific wording and indicators related to computer e-waste recycling (
Table 2).
2.2. E-Waste Behavioral Determinants
There are several common barriers that limit participation in formal electronic-waste recycling. Thao Ly et al. [
16] identifies six key factors: (1) low levels of public knowledge and awareness; (2) a lack of infrastructure and formal collection systems; (3) a gap between pro-recycling attitudes and willingness to make a financial commitment; (4) socioeconomic and demographic factors; (5) the absence of specific legal frameworks and effective regulations; and (6) a preference for informal channels due to the residual value of devices.
There is very limited knowledge about key aspects of e-waste, and this information deficit constitutes a fundamental barrier to adopting appropriate recycling behaviors and fostering financial commitment. The lack of easily accessible, user-friendly services makes it difficult for residents to channel their e-waste through formal systems, thereby encouraging informal arrangements—such as itinerant buyers/peddlers or direct resale for second-hand use—that are environmentally inadequate.
Although attitudes toward recycling are generally positive, only a small proportion of households are willing to pay for the service, reflecting a gap between the intention to participate and the willingness to bear economic costs. At the same time, low income and financial constraints deter part of the population from paying for recycling services. The lack of clear legislation and effective regulatory mechanisms for formal e-waste management further contributes to the predominance of the informal sector. Some households also prefer to keep obsolete electronic devices for sentimental or economic reasons, or to sell them to repair shops or informal intermediaries to generate income.
According to Yu et al. [
17], common barriers to the sustainable and efficient management of e-waste recycling include: (1) insufficient public awareness; (2) a lack of regulation and enforcement; (3) environmentally harmful processing practices; (4) orphan products; and (5) low participation in reverse supply chains. Taken together, these barriers reflect technical, regulatory, social, and ethical complexities that undermine the sustainability of electronic-waste management.
Low levels of environmental and ethical awareness among consumers lead to inappropriate e-waste disposal practices, particularly within the informal recycling sector. In addition, the absence or weakness of regulations that ensure environmentally responsible practices allows harmful informal methods to persist, which reduces recovery rates and drives pollution. The lack of formal collection points for “orphan” electronic products—those not covered by manufacturers or take-back programs—also hinders proper recycling. Finally, without clear incentives or subsidy mechanisms, both citizen and business participation in e-waste recycling remains limited.
2.3. Institutional and Policy-Level Recycling Frameworks
Universities, NGOs, and municipalities can serve as intermediaries in waste management and in promoting source segregation. It is important to build participatory, community-based governance systems that engage local groups—such as residents’ associations, self-help groups, and informal recycling workers—as partners in the planning, monitoring, and feedback processes of segregation systems. These actors should function as educators and accountability nodes, linking communities with municipal services and ensuring that segregation norms are adapted to local needs [
18].
The business sector implements Extended Producer Responsibility (EPR) within waste-management frameworks, including electrical and electronic waste, to ensure that manufacturers assume responsibility for managing plastic waste generated by their products. Some European countries, such as the Netherlands and France, apply modulated EPR fees adjusted according to product recyclability or recycled content, and this practice may serve as a reference point for Latin America in developing circular-economy strategies for plastics [
19].
Hamad & Ngonda [
20] note that communication campaigns delivered through social media, radio, and television are essential for promoting behavior change toward recycling and environmental responsibility. They also describe schools as strategic hubs for long-term cultural change, functioning as sites of knowledge transfer and intergenerational influence that can foster source separation and greater public responsibility.
2.4. Need for Multidimensional Measurement Tools for E-Waste Recycling Determinants
In this study, a measurement instrument is understood as a standardized set of items, response options, scoring procedures, and theoretically defined dimensions designed to systematically quantify a latent construct that cannot be observed directly. Specifically, the instrument translates the individual, institutional, technological, social, and cultural determinants of computer e-waste recycling behavior into measurable indicators through participants’ responses to Likert-type items.
The measurement instrument developed in this study is the Perceived Determinants of Computer E-Waste Recycling Scale for University Students. It is a 28-item multidimensional Likert-type scale designed to assess five domains associated with responsible computer e-waste recycling: education, awareness, and policy compliance; community participation and education; business and technological practices; innovation and technological adoption; and cultural and media influence.
Measuring the perceived determinants associated with computer e-waste recycling requires psychometric instruments capable of capturing the multidimensional and context-dependent nature of the factors that may facilitate or constrain such behavior. Responsible e-waste disposal involves decisions that integrate technical knowledge and risk perceptions. Consequently, a unidimensional approach may underestimate behavioral variability by collapsing, into a single score, determinants that operate at different levels.
From a theoretical standpoint, pro-environmental behavior models posit that environmental behavior emerges from the interaction between internal and external factors. Therefore, a multidimensional instrument is warranted when each dimension is conceptually grounded as a distinct component of the explanatory process underlying the behavior. In this study, multidimensionality is justified by considering three complementary sets of components: (1) individual antecedents; (2) contextual facilitators; and (3) components of the behavioral process.
Building on this rationale, the development of a multidimensional psychometric instrument is supported to differentially assess the individual antecedents, contextual facilitators, and behavioral process components associated with computer e-waste recycling behavior. Such a structure not only enhances conceptual clarity but also facilitates descriptive comparisons across dimensions, allowing researchers and higher education institutions to identify areas in which students report comparatively less favorable perceptions and that may therefore warrant further investigation.
In the literature, computer e-waste recycling behavior is explained by determinants operating at different levels; therefore, the proposed instrument adopts a multidimensional structure understood as multilevel behavioral determinants, rather than as equivalent components of the behavior itself. From the individual perspective, the instrument incorporates environmental and regulatory literacy, consistent with models such as the TPB and NAM. At the social level, it includes community participation and social support, which shape subjective norms and individuals’ willingness to act. This organization makes it possible to distinguish between individual predispositions and contextual conditions, thereby clarifying the conceptual framework and strengthening the instrument’s interpretive validity in a university population.
2.5. Method
To achieve the objectives of this study, an unstructured experimental design (ex post facto) was used to evaluate the psychometric properties (reliability and validity) of the developed instrument. Data were collected through direct engagement with university students in the region. The sample was selected using a non-probabilistic approach during August and September 2025, based on convenience sampling due to direct access to these groups. Participation was voluntary and anonymous, and informed consent was obtained prior to data collection.
Data collection was carried out during class hours, with prior authorization from the instructors responsible for the student groups. The study objectives were explained in detail, and clear instructions were provided for completing the instrument. Google Forms was used to efficiently and systematically record participants’ responses. The final sample consisted of 385 students.
University students were selected as the target population because of their intensive use of computing devices, their exposure to institutional sustainability initiatives, and their potential role as future professionals and agents of environmental change.
2.6. Instrument Development Procedure
To develop the instrument, an extensive review of the literature on knowledge and practices related to computer e-waste recycling was conducted, drawing articles from the Scopus database. A total of 20 articles were identified and used to design and develop the psychometric instrument (
Table 3). A Likert scale was employed, with response options ranging from strongly disagree (minimum value) to strongly agree (highest value).
For consistency throughout the manuscript, the five dimensions are hereafter identified using the following notation: D1 = Education, Awareness, and Compliance with Computer E-Waste Recycling Policies; D2 = Community Participation and Education in Computer E-Waste Recycling; D3 = Business and Technological Practices in Computer E-Waste Recycling; D4 = Innovation and Technological Adoption in Computer E-Waste Recycling; and D5 = Cultural and Media Influence on Computer E-Waste Recycling.
Following the literature review, 77 items were generated, taking into account the recommendations of Hair et al. [
40], who suggest that, at minimum, a sample size equivalent to five times the number of instrument items should be collected in order to analyze psychometric properties. In this study, the process began with 77 items.
To establish the instrument’s content validity, an expert-judgment procedure was conducted in which experts evaluated each item according to three criteria: appropriateness, relevance, and clarity. A cutoff of Aiken’s V ≥ 0.70 was adopted to indicate adequate content, following that proposed by Charter [
41].
In addition, the recommendations of Pérez and Carretero-Dios [
42] were followed to assess comprehension validity, construct validity, and reliability. Statistical analyses were performed using IBM SPSS Statistics 25 (v31.0, 2025 Release version, Armonk, NY, USA) and IBM SPSS AMOS 24 (v.24.0, Armonk, NY, USA).
2.7. Item Reduction and Model Refinement Procedure
Item reduction was conducted sequentially using both statistical and theoretical criteria. First, items were reviewed for content validity, comprehension, distributional adequacy, and corrected item–total correlations. Items were considered for removal when they showed inadequate content validity, unclear or redundant wording, skewness or kurtosis outside the predefined acceptable range, or corrected item–total correlations below 0.40.
Second, exploratory factor analysis was performed using principal axis factoring with oblique Oblimin rotation. Factor loadings of at least 0.30 were considered minimally acceptable. Items were also examined for cross-loadings. A cross-loading was considered problematic when an item loaded at 0.30 or higher on more than one factor and the difference between its two highest loadings was less than 0.20. In such cases, the item was reviewed for conceptual correspondence with the intended dimension, wording ambiguity, and redundancy before a decision was made.
Third, the confirmatory factor model was refined iteratively. Items were considered for removal when they showed weak standardized factor loadings, large standardized residuals, conceptual redundancy, or modification indices indicating misspecification. Item removal was conducted one item at a time, beginning with the item showing the weakest combination of statistical performance and theoretical relevance. After each deletion, the model was re-estimated and changes in RMSEA, SRMR, CFI, TLI, GFI, AGFI, and NFI were examined. Items were not removed solely to improve goodness-of-fit indices; theoretical coverage of each dimension was reviewed at every stage to preserve content validity.
Modification indices were inspected to identify potential localized areas of model strain. Correlated residuals were not freely added as a purely data-driven strategy. Residual covariances were permitted only when the corresponding items shared clearly overlapping wording or content and when such a relationship could be theoretically justified. Any residual correlations retained in the final model were specified before the final estimation and are reported explicitly (
Table 4).
To provide a transparent overview of the refinement process,
Table 5 summarizes the principal stages through which the initial 77-item pool was reduced to the final 28-item solution. Item retention and removal were based on the combined consideration of item-level psychometric properties, exploratory factorial evidence, confirmatory model performance, theoretical relevance, conceptual redundancy, and preservation of content coverage. A complete item-level audit trail for all 77 items is provided in
Supplementary Table S1.
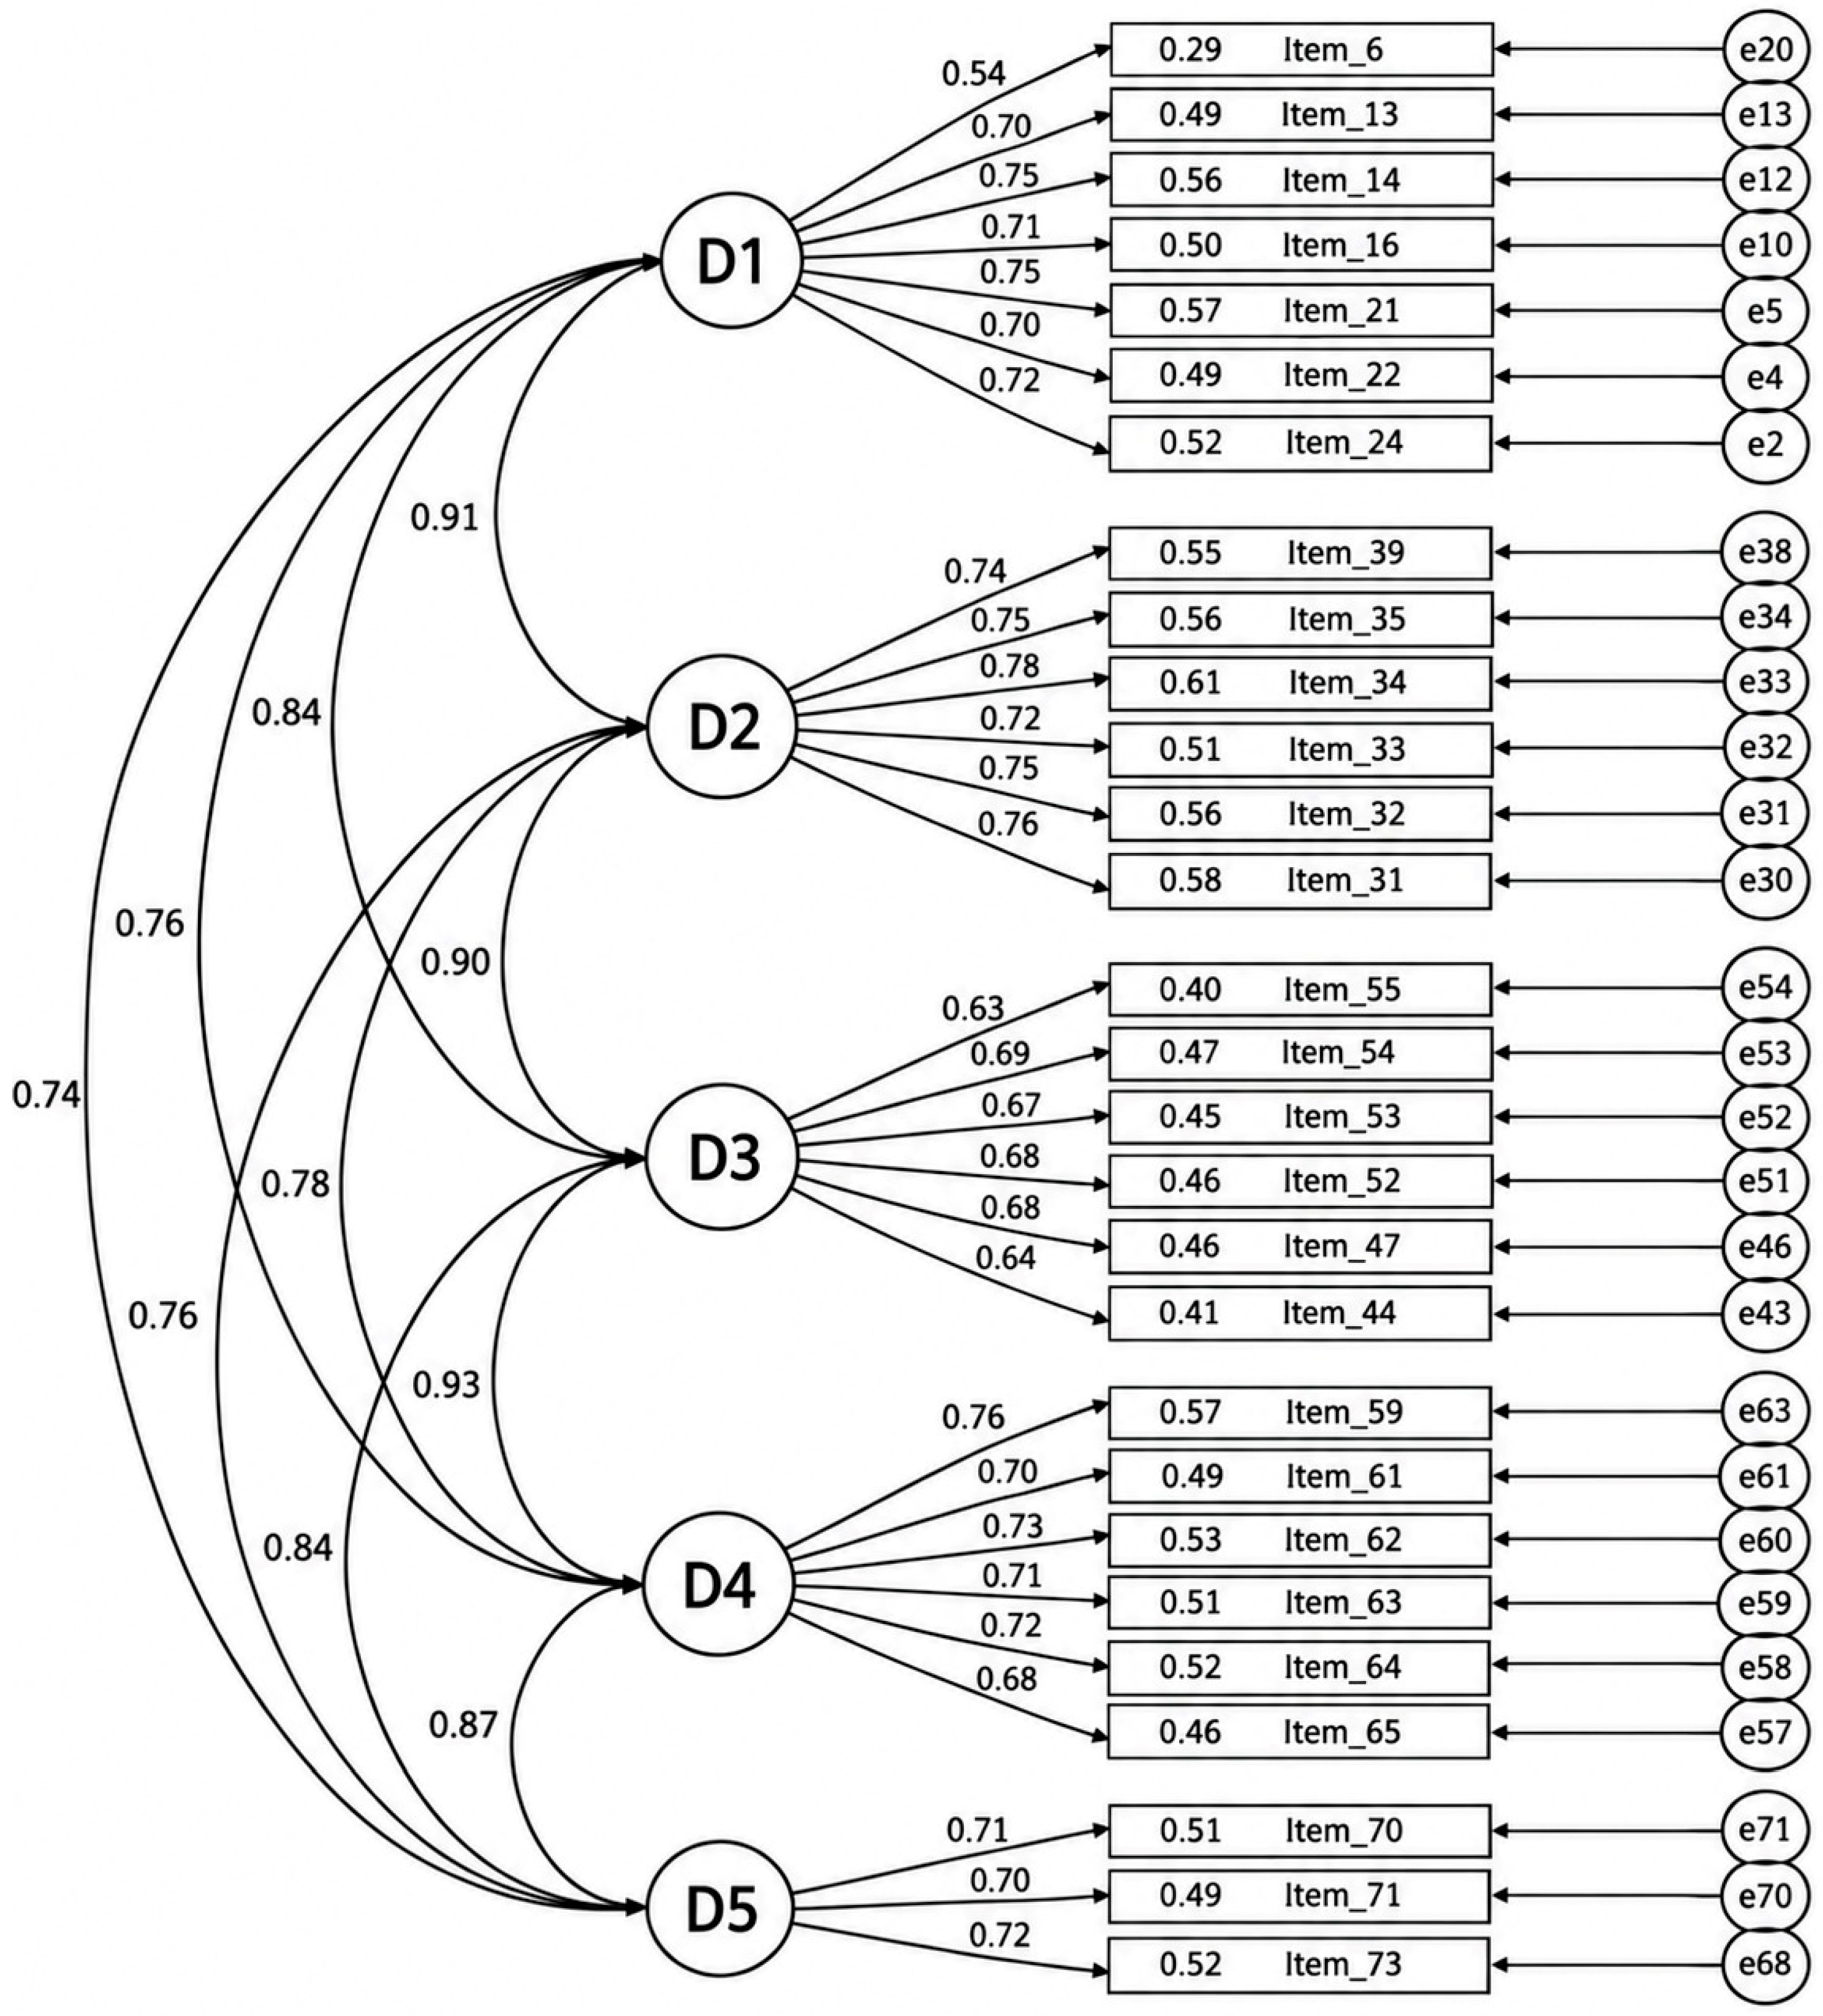
Overall, the refinement process resulted in the removal of 49 items (63.6%), yielding a more parsimonious 28-item solution distributed across five correlated dimensions. The final model comprised seven items in Dimension 1, six items each in Dimensions 2, 3, and 4, and three items in Dimension 5.
To examine whether the five first-order dimensions could be represented by a broader latent construct, a second-order confirmatory factor model was estimated in AMOS 24. In this hierarchical model, the 28 observed items loaded on their corresponding first-order factors, while the five first-order factors loaded on a higher-order factor representing the perceived determinants of computer e-waste recycling. The second-order model was compared with the correlated five-factor model using χ
2, degrees of freedom, χ
2/df, RMSEA, SRMR, CFI, TLI, GFI, AGFI, NFI, AIC, and ECVI. Model selection was based on the combined consideration of global fit, parsimony, and theoretical interpretability (
Table 6).
2.8. Description and Scoring of the Final Instrument
The final measurement instrument developed in this study was the Perceived Determinants of Computer E-Waste Recycling Scale for University Students, is a self-administered, multidimensional Likert-type scale designed to assess the individual and contextual determinants associated with responsible computer e-waste recycling among university students. The final version consists of 28 items distributed across five correlated dimensions.
Participants indicate their level of agreement with each statement using a five-point response scale: 1 = strongly disagree, 2 = disagree, 3 = neither agree nor disagree, 4 = agree, and 5 = strongly agree. Higher scores indicate stronger awareness, more favorable perceptions, greater institutional and community support, and more positive conditions for responsible computer e-waste recycling.
For the calculation of scores for each dimension, the arithmetic mean of the responses to the items comprising that dimension is used exclusively. For example, the score for the first dimension is calculated as the mean of its seven items, and the same procedure is applied to the remaining dimensions according to their respective number of items. This approach standardizes dimensional scores on the original 1–5 response scale, thereby facilitating descriptive comparisons across dimensions despite differences in the number of items. Given that the instrument was designed as a multidimensional measure, dimensional scores are recommended for descriptive interpretation. These scores should not be interpreted diagnostically or causally. Specifically, a low score cannot be attributed exclusively to individual-level characteristics or to deficiencies in institutional, technological, regulatory, or broader contextual conditions. Accordingly, dimensional and total scores are calculated using the following equations:
where represents the response to item belonging to dimension. Because all items are scored from 1 to 5, each dimensional score ranges from 1 to 5. No overall score is calculated in the present version of the instrument.
The five dimensions represent complementary determinants of computer e-waste recycling. Dimension 1 assesses education, environmental awareness, and knowledge of or compliance with recycling policies. Dimension 2 evaluates community participation, educational initiatives, and collective involvement in recycling activities. Dimension 3 measures perceptions of business responsibility, technological practices, and organizational support for e-waste management. Dimension 4 assesses innovation, technological adoption, and access to tools or systems that facilitate recycling. Dimension 5 evaluates the influence of culture, communication, and media on recycling attitudes and practices (
Table 7).
The final instrument consists of 28 items distributed across five dimensions: D1, Education, Awareness, and Compliance with Computer E-Waste Recycling Policies (7 items); D2, Community Participation and Education in Computer E-Waste Recycling (6 items); D3, Business and Technological Practices in Computer E-Waste Recycling (6 items); D4, Innovation and Technological Adoption in Computer E-Waste Recycling (6 items); and D5, Cultural and Media Influence on Computer E-Waste Recycling (3 items). The complete wording of the 28 retained items, their assignment to the five dimensions, their original item identification within the 77-item pool, and their standardized CFA loadings are provided in
Supplementary Table S1.
4. Discussion
In the current context, this study developed and validated an instrument to assess university students’ perceived individual and contextual determinants associated with computer e-waste recycling, including awareness, normative orientation, community participation, institutional and technological support, and cultural and media influence. Given the growing importance of fostering an environmental stewardship culture and having a tool capable of assessing multiple dimensions of recycling, this contribution is essential. It can enable future generations of university students to use the instrument to determine their perceived levels of awareness, predispositions, institutional support, and contextual conditions associated with computer e-waste recycling and based on that information, identify dimensions in which students report comparatively less favorable perceptions and that may therefore warrant further investigation.
Most existing instruments assess individuals’ participation and behaviors regarding recycling and waste management, as well as the awareness and sustainability associated with these practices. They typically examine factors influencing participation, perceived benefits of waste separation, and, in some cases, the service quality of platforms or systems for collecting electronic waste [
1,
4,
5,
6,
7,
8,
9,
10]. However, very few provide a broad and comprehensive perspective by evaluating computer e-waste recycling in a multidimensional manner, simultaneously considering awareness and education, policy compliance, and community participation—an added value of the present study. In addition, it incorporates the assessment of factors such as corporate technological practices, innovation, and cultural and media influence.
The advances previous measurement approaches in several ways. First, whereas earlier instruments have generally concentrated on awareness, participation, waste-separation beliefs, perceived barriers, or collection-service quality, the integrates five complementary domains within a single measurement framework. These domains cover education and regulatory awareness, community participation, business and technological practices, innovation and technological adoption, and cultural and media influence. This structure responds to the context-dependent nature of computer e-waste recycling, in which responsible action depends not only on individual attitudes but also on the availability of institutional policies, collection mechanisms, technological solutions, and supportive social environments.
Second, the scale was developed specifically for university students, a population characterized by intensive use of computing equipment and exposure to institutional sustainability initiatives. Previous instruments were frequently developed for households, consumers, secondary-school students, or general populations; therefore, their content may not fully reflect the educational, organizational, and technological conditions present in higher education institutions. The scale addresses this gap by incorporating perceived factors that universities can examine and potentially address through curricular activities, communication campaigns, collection systems, partnerships with formal recyclers, and technological interventions.
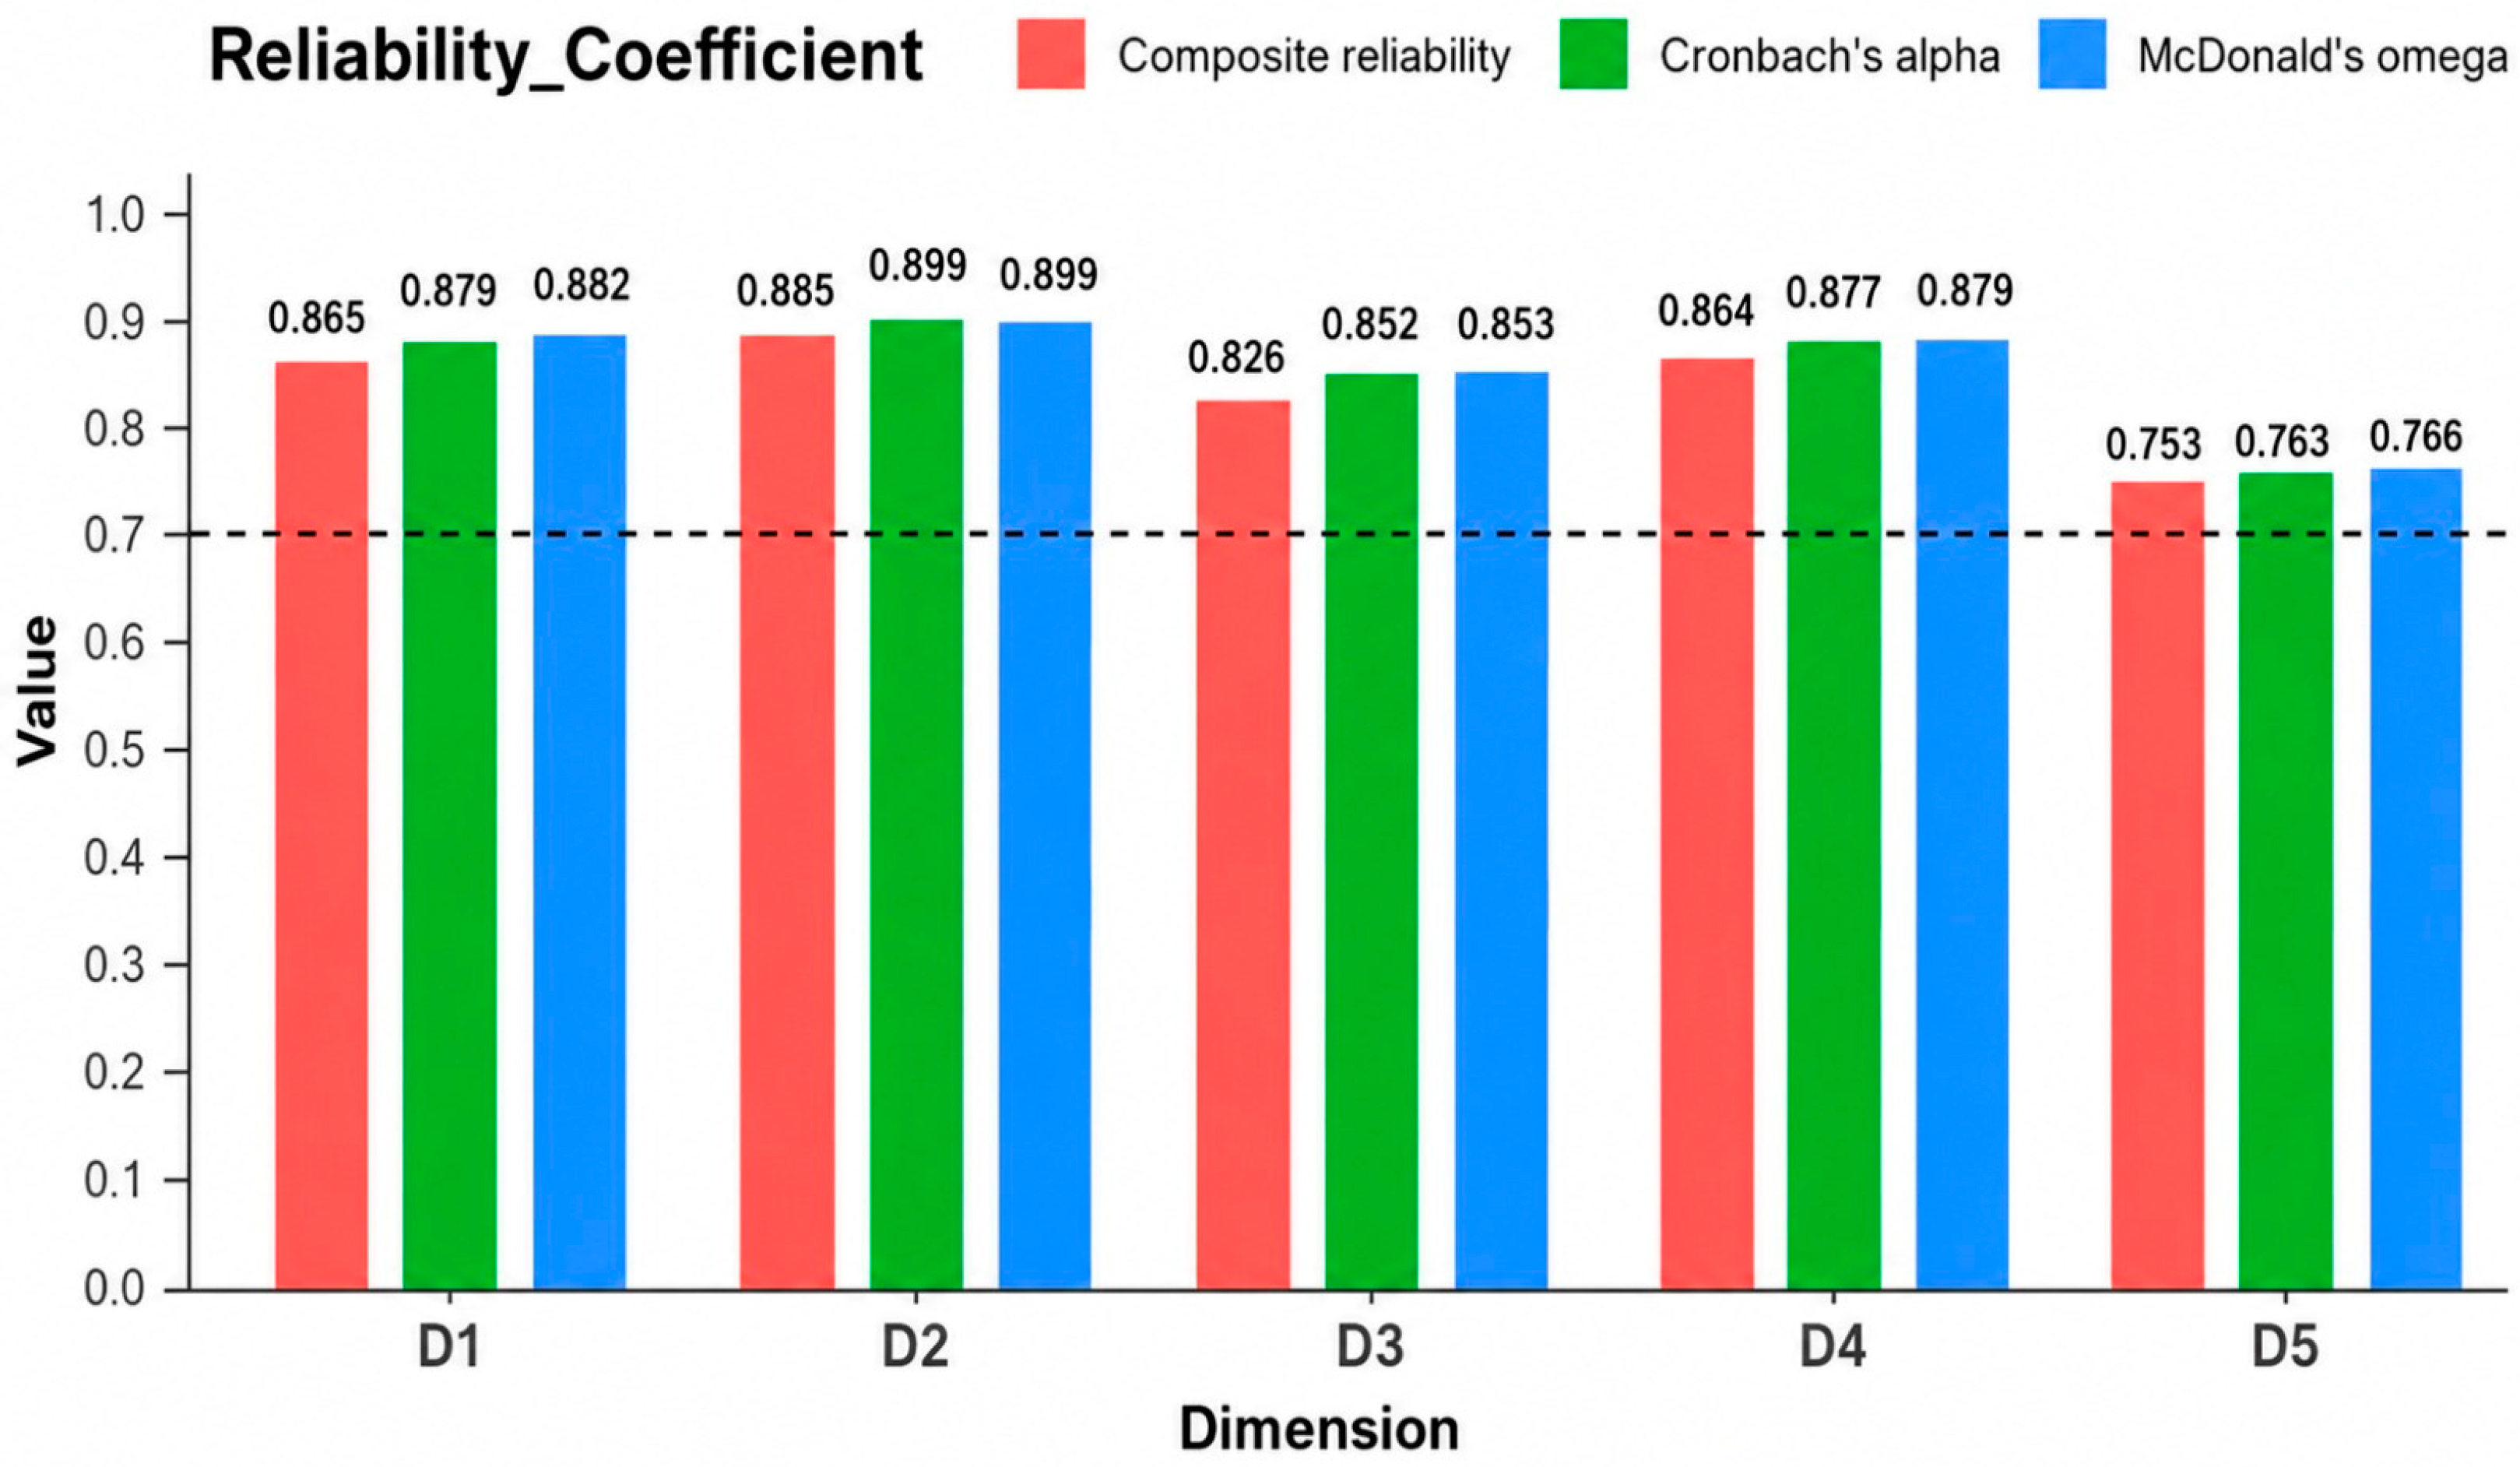
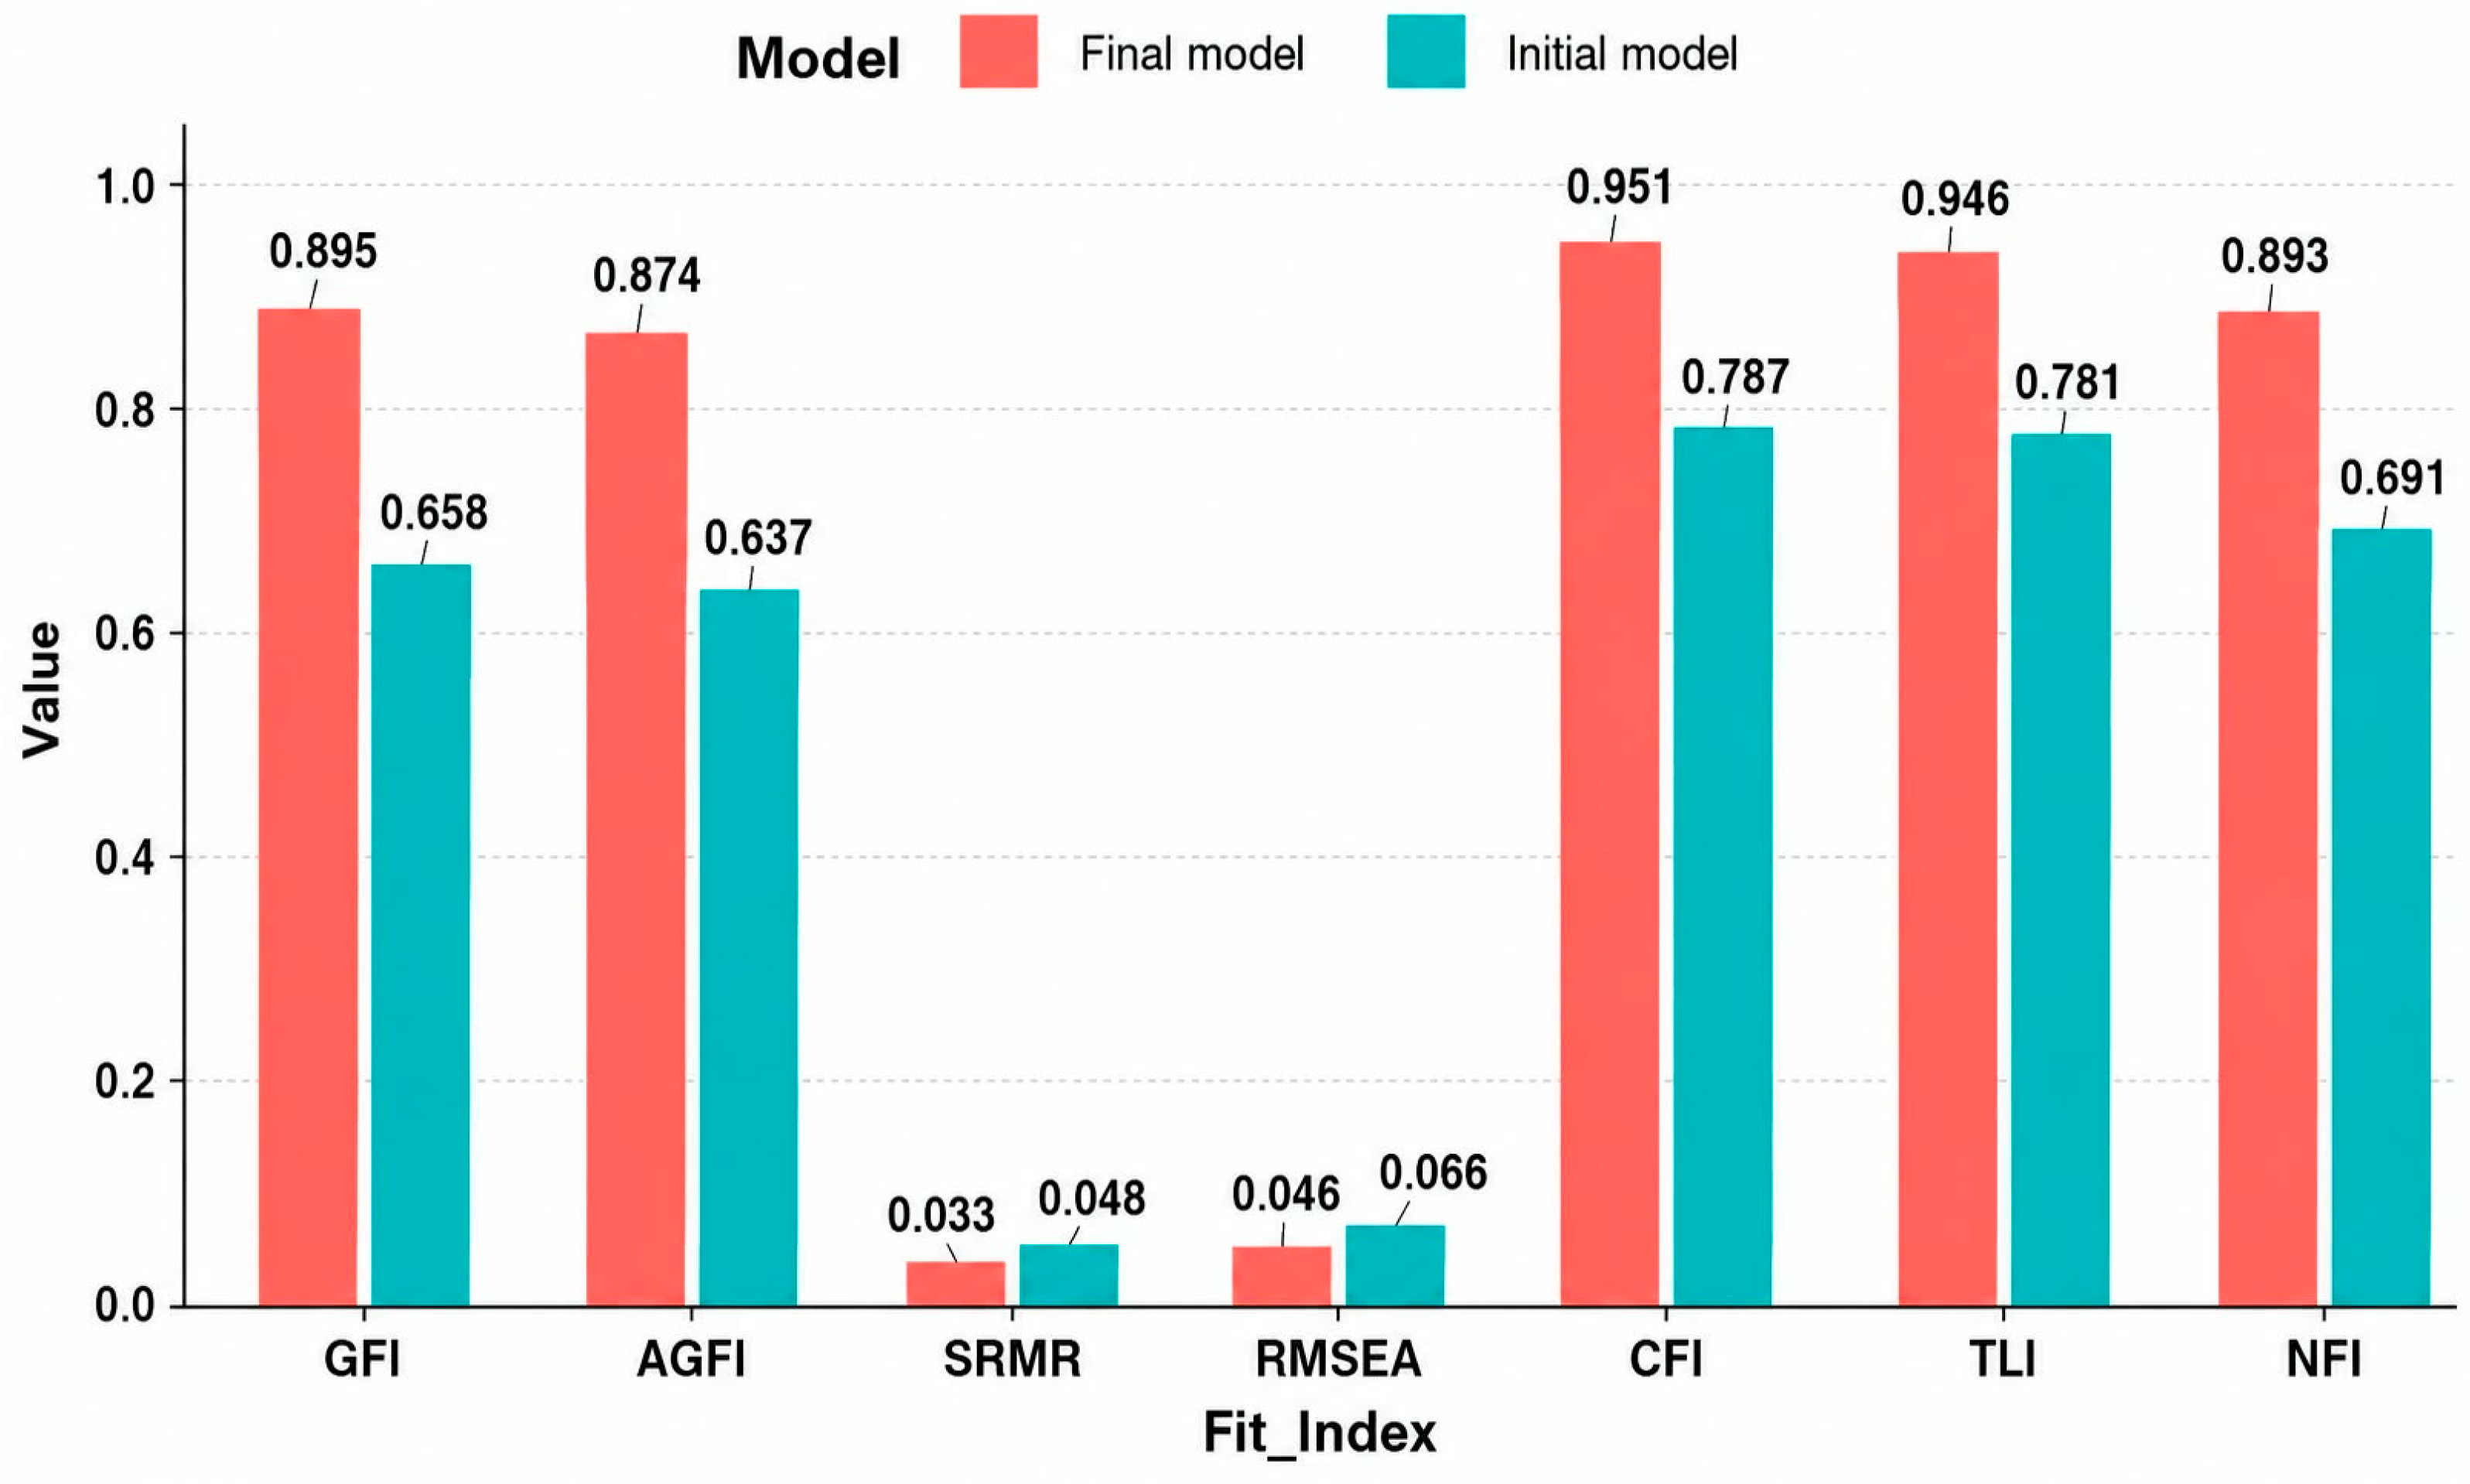
Third, the proposed instrument combines broad theoretical coverage with measurement efficiency. The initial pool of 77 items was reduced to 28 items, representing a 63.6% reduction while preserving the five theoretically established dimensions. The final model demonstrated satisfactory fit (RMSEA = 0.046, SRMR = 0.033, CFI = 0.951, and TLI = 0.946), and dimensional reliability remained adequate, with Cronbach’s alpha values ranging from 0.763 to 0.899 and McDonald’s omega values ranging from 0.766 to 0.899. Thus, the final scale reduces respondent burden while retaining multidimensional coverage and adequate psychometric performance.
The comparison with a higher-order factor model provided additional evidence regarding the dimensional structure of the instrument. Although the second-order model achieved acceptable fit indices, it performed less favorably than the correlated five-factor solution. The significant chi-square difference, the reduction in CFI, and the higher AIC and ECVI values indicate that the five dimensions should not be interpreted simply as interchangeable manifestations of a single general construct. Instead, they represent closely related but empirically differentiated domains of the perceived determinants of computer e-waste recycling. This finding supports the use of dimensional scores are recommended for descriptive interpretation.
Fourth, the scale offers greater descriptive specificity than measures that generate only a general recycling score. Its dimensional structure allows universities to compare students’ reported perceptions across environmental education and policy knowledge, community participation, organizational and business support, technological innovation, and cultural and media influence. Comparatively lower scores in a given dimension may indicate areas that warrant further investigation; however, they should not be interpreted as independently identifying the source or cause of a deficiency. This dimensional approach may inform the planning and evaluation of context-sensitive interventions without assuming that the scale directly measures actual recycling behavior.
To develop the psychometric instrument, the steps recommended by Pérez and Carretero-Dios [
42] were followed. An initial version of the instrument was created with a total of 77 items grouped into five dimensions. The items were developed using a Likert scale. During the psychometric evaluation process, sample adequacy was verified based on the recommendations of Hair et al. [
40]. To ensure comprehension validity, items that did not meet the established ranges were removed, based on the skewness and kurtosis coefficients recommended by Meroño et al. [
53]. For construct validity through EFA, no items were discarded because all achieved the minimum loading saturation, in accordance with the recommendations of Cattell [
54].
For the CFA, several adjustments were made to remove items showing the weakest loadings within their respective five dimensions, following Bentler’s [
49] criteria. In the final version, the final model showed satisfactory fit according to RMSEA, SRMR, CFI, and TLI. Although the NFI improved substantially from 0.691 in the initial model to 0.893 in the final model, it remained slightly below the conventional 0.90 criterion. Accordingly, the NFI was interpreted as marginal, and the overall model fit was evaluated on the basis of the combined evidence from multiple fit indices. In addition, the instrument’s overall internal consistency and the composite reliability of the final version were confirmed, demonstrating excellent psychometric properties, as measured by Cronbach’s alpha both for the five dimensions and for the total scale, consistent with the recommendations of Heinzl et al. [
51].
According to the statistical analyses performed, the final instrument comprised 28 items across five dimensions. The first dimension, “Education, Awareness, and Compliance with Computer E-Waste Recycling Policies,” included seven items; the second dimension, “Community Participation and Education in Computer E-Waste Recycling,” comprised six items; the third dimension, “Business and Technological Practices in Computer E-Waste Recycling,” included six items; the fourth dimension, “Innovation and Technological Adoption in Computer E-Waste Recycling,” comprised six items; and finally, the fifth dimension, “Cultural and Media Influence on Computer E-Waste Recycling,” included three items.
The emergence of institution-centered dimensions can be interpreted as evidence that computer e-waste recycling among university students is not solely an individual-level behavior but a context-dependent practice shaped by the enabling environment. The emergence of institution-centered dimensions can be interpreted as evidence that computer e-waste recycling among university students is not solely an individual-level behavior but a context-dependent practice shaped by the enabling environment. Unlike conventional household recycling, e-waste disposal requires formal collection channels, accessible drop-off points, clear procedures, and institutional communication due to data security concerns and hazardous components. Therefore, students’ responses tend to cluster around perceptions of institutional readiness—policies, educational campaigns, compliance mechanisms, and community-based initiatives—which operate as structural determinants of recycling opportunities rather than purely attitudinal drivers.
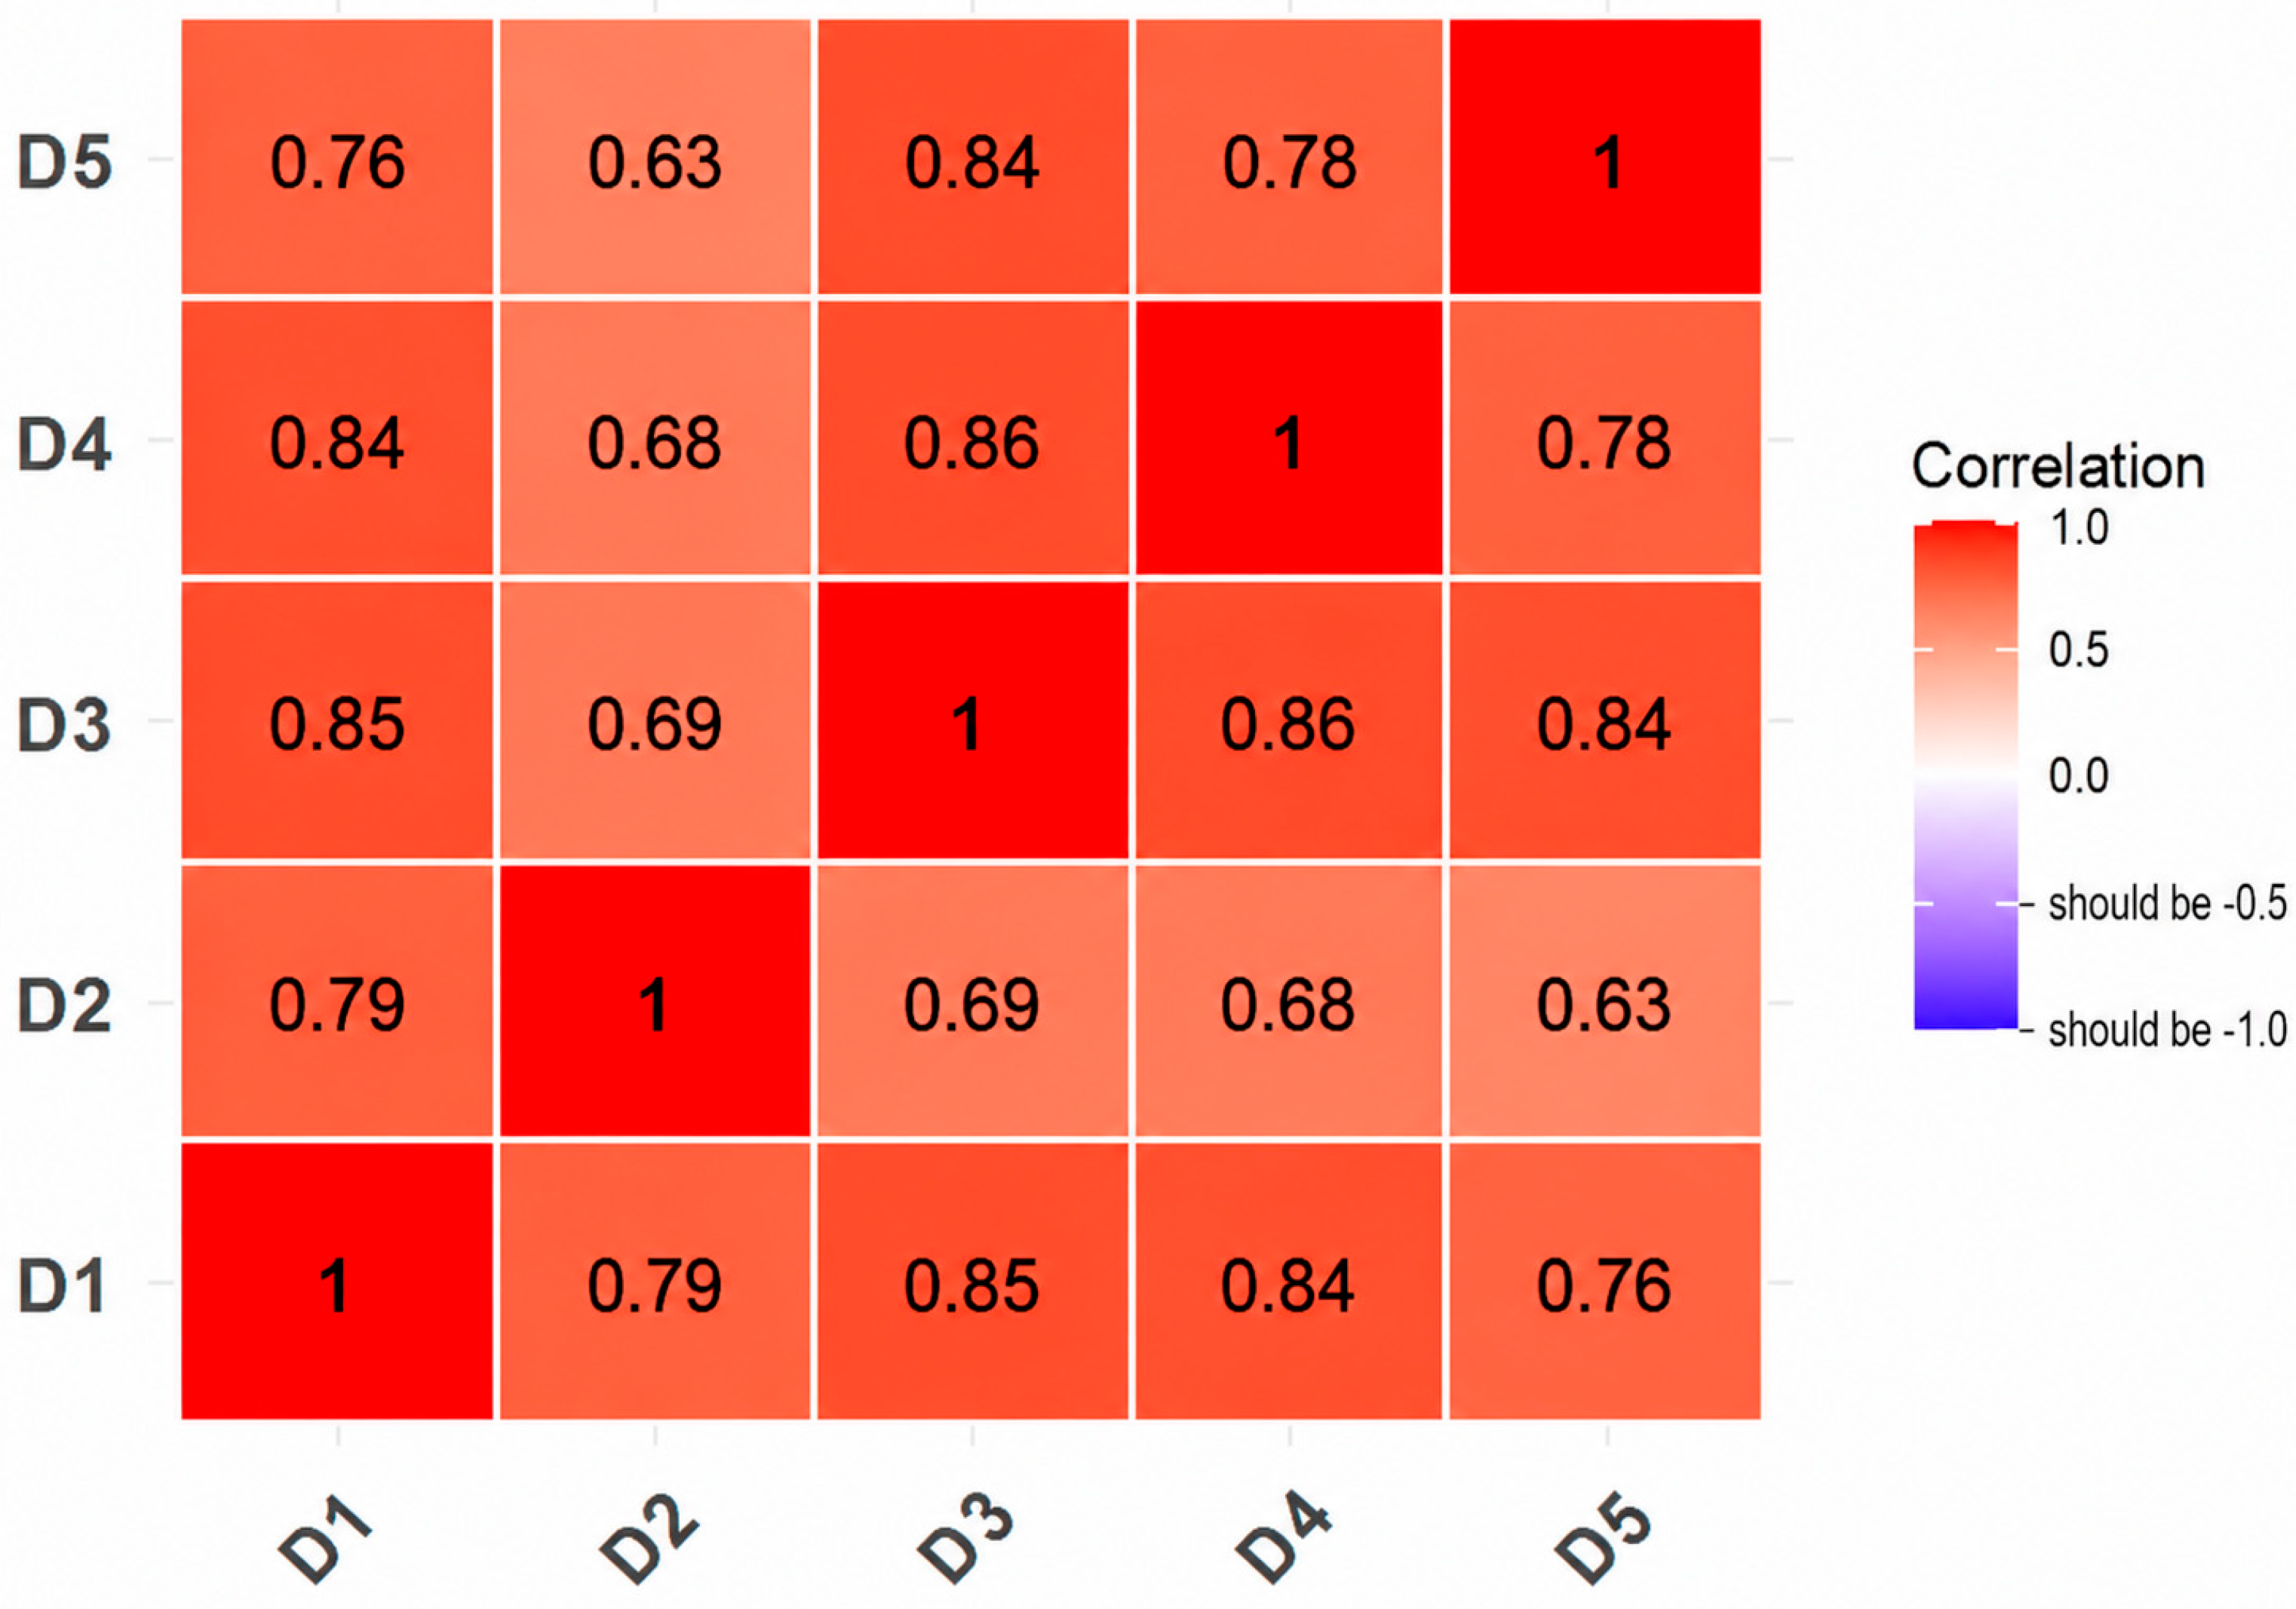
Additionally, the relatively high inter-factor correlations observed in the latent correlation matrix suggest that the five dimensions may reflect tightly coupled components of a broader underlying construct—namely an integrated e-waste recycling ecosystem in the university context. This pattern is theoretically plausible because awareness, community participation, technological practices, innovation, and cultural/media influence tend to co-evolve within institutional settings. From a measurement perspective, these results invite future research to test hierarchical specifications (e.g., a second-order model or bifactor structure) and to complement model fit with convergent/discriminant validity evidence (e.g., AVE, HTMT) to further confirm the distinctiveness of each domain.
Although the results demonstrate solid validity and reliability, certain limitations arise from the sample used. The data were obtained from university students in the region through non-probabilistic sampling, which restricts the generalizability of the findings to other cultural and educational contexts. Therefore, the lack of randomization within a single country may affect how well the results translate to diverse populations and different realities. This limits representativeness and may bias the findings toward students who are more available or more interested in the topic. To mitigate this limitation, future studies should employ probabilistic sampling or quota sampling with controlled proportions, replicate the study across different regions or states and institution types, and conduct cross-cultural validation if the instrument is applied in another country.
Regarding the theoretical and practical implications of this study, the validated scale contributes to higher education by providing a multidimensional framework for descriptively assessing students’ perceptions of key individual and contextual determinants associated with responsible computer e-waste management within university communities. Beyond describing general environmental awareness, the instrument allows institutions to compare perceptions across dimensions such as knowledge and normative orientation, community participation mechanisms, and perceived organizational and technological support. Comparatively less favorable scores may help identify areas that warrant further investigation and may inform the development of context-sensitive institutional actions. Such scores should not, however, be interpreted as independently identifying the cause or location of a specific deficiency.
As a result, universities can use the scale to inform targeted actions such as integrating e-waste topics into curricula and co-curricular training, strengthening campus communication and outreach campaigns, improving the visibility and accessibility of certified collection points, and establishing partnerships with formal recyclers and technology firms for take-back and reverse logistics initiatives. In addition, the scale can be applied in pre–post designs to examine changes in students’ perceived individual and contextual determinants following these interventions over time, supporting institutional sustainability goals and providing evidence aligned with SDG 12 (Responsible Consumption and Production).
At the institutional level, the scale can be used as a monitoring tool for SDG 12-oriented campus sustainability programs, allowing universities to establish baseline levels of students’ perceived individual and contextual determinants and to evaluate changes in these perceptions after implementing collection schemes, awareness campaigns, or circular procurement strategies.
This study has several limitations. The use of a non-probability convenience sample drawn from a single institution, the Autonomous University of Carmen in Mexico, limits the generalizability of the findings. Differences across universities, regions, and countries in e-waste infrastructure, environmental regulations, institutional policies, and cultural norms may influence participants’ responses. In addition, measurement invariance across institutions, regions, countries, and relevant population groups was not examined. Consequently, the equivalence of the five-factor structure and its scores across diverse populations cannot yet be assumed.
A further limitation is that the exploratory factor analysis and confirmatory factor analysis were conducted using the same sample of 385 participants. Although this approach allowed the preliminary factor structure to be explored and subsequently evaluated, the CFA did not constitute an independent cross-validation because it tested a model derived and refined using the same dataset. Consequently, the goodness-of-fit indices may be optimistic and may partly reflect sample-specific characteristics or model overfitting. Therefore, the stability and replicability of the five-factor structure should be interpreted with caution until it is confirmed in an independent sample. Future studies should use separate samples for scale exploration and confirmation, either by randomly splitting a sufficiently large sample or, preferably, by conducting the CFA in a new multicenter sample.
An additional limitation concerns the integration of determinants operating at different levels of analysis within a single measurement framework. The five dimensions encompass perceptions related to individual-level characteristics, such as awareness and normative orientations, as well as various meso- and macro-level contextual conditions, including institutional support, business practices, technological accessibility, regulatory environments, and cultural or media influences. Although this multidimensional structure provides a comprehensive representation of students’ perceptions of the computer e-waste recycling ecosystem, it also constrains the diagnostic interpretation of low scores. Specifically, a low score cannot be unequivocally attributed either to individual-level deficiencies, such as limited awareness or unfavorable attitudes, or to shortcomings in the external environment, such as inadequate university infrastructure, limited access to formal collection systems, insufficient institutional support, or inadequate policy implementation. Therefore, these scores should be interpreted descriptively as students’ perceived assessment of the broader recycling ecosystem and its associated determinants, rather than causally or diagnostically as evidence of deficiencies located at a specific individual, institutional, or structural level.
Because the instrument is based on self-reported Likert-type responses, scores may be affected by social desirability bias. Participants may report favorable attitudes, awareness, or perceptions of socially expected recycling practices without necessarily engaging in observable recycling actions. Therefore, the scale should not be interpreted as a direct measure of actual recycling frequency or verified recycling behavior. Future studies should examine criterion-related validity by comparing scale scores with behavioral indicators, such as the documented use of formal collection points, participation in university recycling programs, or the number of devices donated, returned, repaired, or recycled during a specified period.
An additional limitation is the absence of criterion-related validity evidence. The present study evaluated content validity, factorial validity, and internal consistency; however, scale scores were not compared with external behavioral criteria or previously validated measures of related constructs. Therefore, the findings do not establish whether the instrument predicts actual computer e-waste recycling behavior or whether its scores are associated with independently measured pro-environmental behavior. The current psychometric evidence should consequently be interpreted as supporting the measurement of perceived individual and contextual determinants associated with recycling, rather than verified behavioral outcomes.
Future studies should examine criterion-related validity by comparing scale scores with objective or independently verifiable behavioral indicators, such as documented e-waste drop-offs at campus collection points, participation records from recycling programs, or the number of devices donated, repaired, returned, or recycled during a specified period. Concurrent validity should also be examined through correlations with established measures of general pro-environmental behavior, recycling intention, environmental responsibility, or ecological citizenship. Longitudinal designs would additionally allow researchers to determine whether baseline scale scores predict subsequent participation in formal e-waste recycling activities.
Future studies should replicate the validation process using probabilistic and more diverse samples, conduct cross-cultural and measurement-invariance analyses, and test the scale in longitudinal and intervention-based designs. Additional psychometric analyses, including second-order or bifactor models, HTMT estimates, and cross-validation with independent samples, are also recommended. Finally, future research should incorporate behavioral indicators, such as actual e-waste return and recycling records, to complement self-reported responses and strengthen criterion-related validity.





 ,
,