Article

Does Land Registration Enhance Soil Health Restoration and Household Food Security? Evidence from Smallholder Farmers in Malawi


by
Wongani Chirwa
1,2,
Patrick Chimseu
1,2,
Lumbani Benedicto Banda
3 and
Innocent Pangapanga-Phiri
1,2,4,*
1
Centre for Agricultural Research and Development (CARD), Bunda College, Lilongwe University of Agriculture and Natural Resources, Lilongwe P.O. Box 219, Malawi
2
Department of Agricultural and Applied Economics, Bunda College, Lilongwe University of Agriculture and Natural Resources, Lilongwe P.O. Box 219, Malawi
3
Department of Environmental and Natural Resources Management, Bunda College, Lilongwe University of Agriculture and Natural Resources, Lilongwe P.O. Box 219, Malawi
4
Africa Centre of Excellence for Agricultural Policy Analysis (APA), Bunda College, Lilongwe University of Agriculture and Natural Resources, Lilongwe P.O. Box 219, Malawi
*
Author to whom correspondence should be addressed.
Sustainability 2026, 18(17), 9145; https://doi.org/10.3390/su18179145
Submission received: 23 June 2026 / Revised: 28 July 2026 / Accepted: 12 August 2026 / Published: 7 September 2026
(This article belongs to the Section Sustainable Food)

Abstract

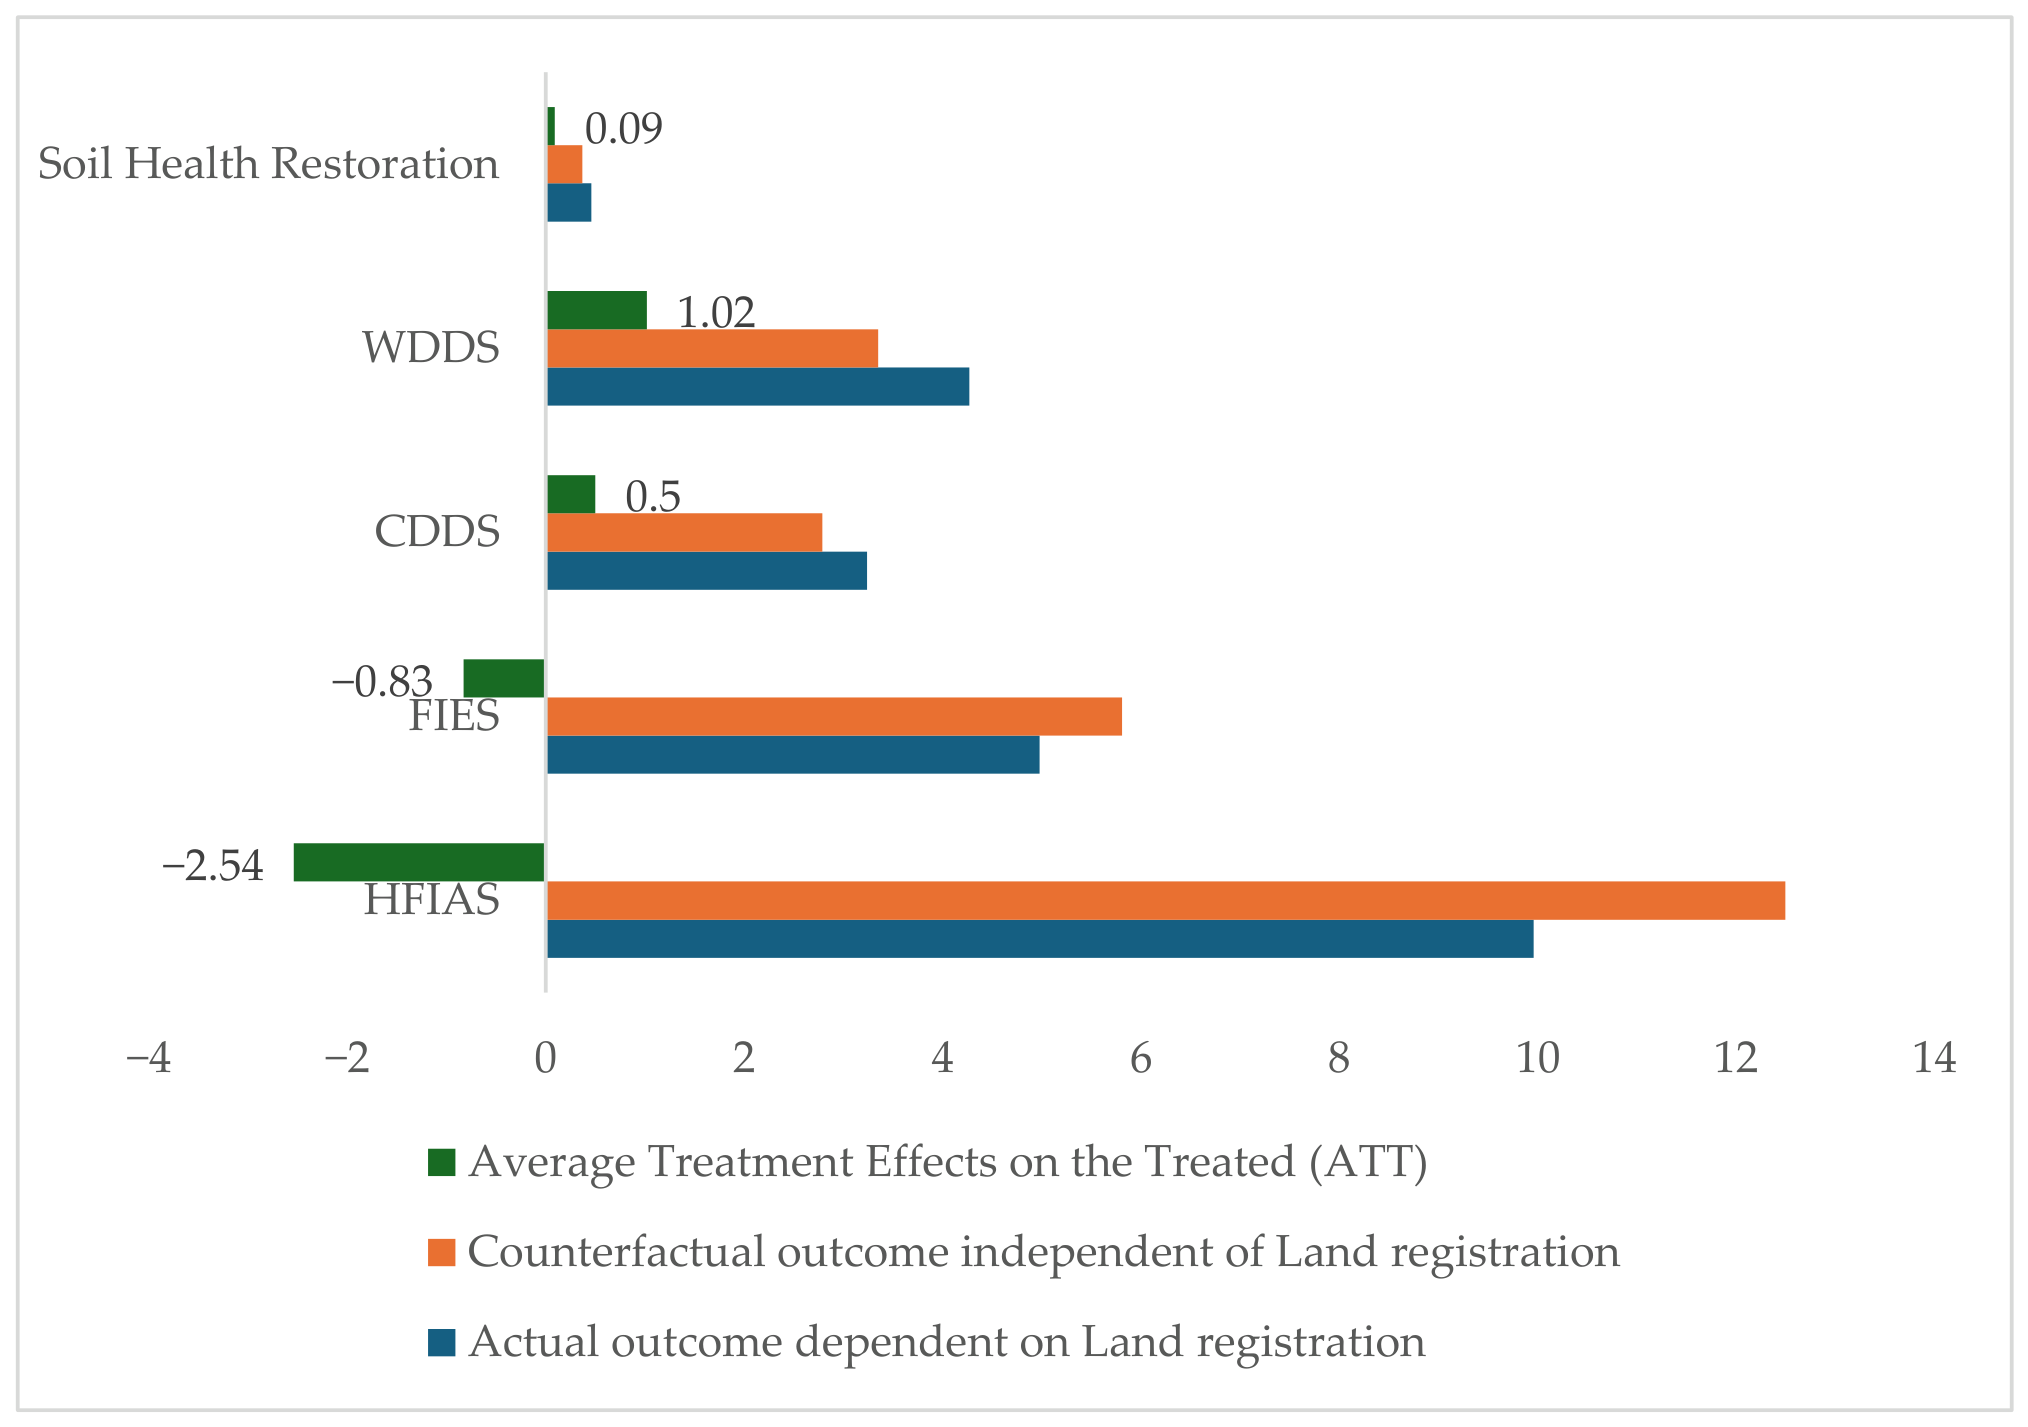
Tenure insecurity among smallholder farmers undermines incentives for long-term soil health restoration investments, thereby limiting agricultural productivity and household food security. This study examines the impacts of land registration on soil health restoration and household food security among smallholder farmers in Malawi. Using representative data from 506 households, the study employs a corrected selectivity endogenous switching regression model to account for selection bias, reverse causality and unobserved heterogeneity. Food security is measured using multiple indicators to capture its multidimensional nature, including the Women’s Dietary Diversity Score (WDDS), Children’s Dietary Diversity Score (CDDS), the Household Food Insecurity Access Scale (HFIAS), and the Household Food Insecurity Experience Scale (HFIES). The results indicate that land registration significantly improves soil health restoration by 9% (p < 0.00) and food security outcomes across indicators, with average treatment effects on the treated (ATT) of 1.02 for WDDS, 0.50 for CDDS, −0.83 for HFIES, and −2.54 for HFIAS, all significant at the 1% level. Furthermore, household and farm characteristics, such as the age of the household head, membership in farmer groups, landholding size, and adoption of sustainable land management practices enhance welfare. The study suggests that scaling up targeted land registration, alongside promoting complementary sustainable land management practices, has the potential to improve soil health restoration and strengthen food security in Malawi’s smallholder farming systems.

1. Introduction

Achieving Sustainable Development Goals (SDGs) 1 and 2, ending poverty, hunger, food insecurity, and all forms of malnutrition by 2030, remains a central global objective [1]. Initiatives to achieve these SDGs are being implemented, with huge investment demands, at global, regional, national, as well as community level [2,3]. Yet, progress has been uneven and slow. Globally, one in eleven people experience food insecurity, and the situation is more severe in sub-Saharan Africa, where one in five people face hunger [4]. This deviation from global targets has been exacerbated by multiple, interlinked challenges. Ongoing conflicts have disrupted agricultural production, markets, and food supply chains [5]; climate change continues to damage crops and livestock systems [6]; and economic instability, particularly through inflation and rising input costs, has restricted access to affordable and nutritious food [7,8].
Malawi exemplifies these challenges. Despite being an agrarian economy, the country faces persistent and worsening food insecurity, ranking among the most affected nations in sub-Saharan Africa. Between 2010 and 2020, the prevalence of food insecurity rose by nearly 50% [9]. According to the Malawi Vulnerability Assessment Committee (MVAC), about 3.8 million people were acutely food insecure in 2023, a 64% increase from 2021 levels. Several factors contribute to this crisis. Economic constraints, including currency devaluation and persistent inflation, have reduced household purchasing power and increased the cost of imported agricultural inputs such as fuel, fertilizers, and pesticides, particularly affecting cereal production in the Central and Northern regions [10]. Demographic pressure, combined with the predominance of smallholder agriculture and limited adaptive capacity to climate shocks, further intensifies vulnerability [11,12]. The devastation caused by Tropical Cyclone Freddy in 2023, resulting in widespread flooding and landslides across 15 southern districts, led to significant crop losses, livelihood disruptions, and infrastructure damage, further constraining national food availability [13,14].
Beyond these immediate shocks, land degradation poses a widespread and worsening threat to agricultural productivity in Malawi. According to Burke et al. [15] and Omutu et al. [16], the efficiency of nitrogen fertilizer declined from 9.6 kg to 2 kg of output per kg of fertilizer applied between 1984 and 2022. Worse still, national soil acidity has worsened, with an average pH decline of 0.68 units and a 10% loss of topsoil [16]. Hence, the decline in soil health directly threatens the productivity gains needed to meet SDG 1 and 2 targets. On the other hand, sustainable land management (SLM) practices, including soil and water conservation measures, organic matter retention, and agroforestry, are widely promoted to combat land degradation. However, adoption among smallholder farmers in the region remains persistently low [17]. A growing body of literature attributes this low uptake, at least in part, to insecure land tenure, which discourages farmers from making long-term investments in land they do not formally control [18,19,20]. This constraint is acute in Malawi, where customary tenure systems remain the dominant form of land holding and often leave farmers without documented, legally enforceable rights [20]. Beyond limiting investment incentives, insecure tenure also restricts farmers’ ability to use land as collateral for credit, further constraining access to inputs such as fertilizers and improved seeds [18,21].
Recognizing these challenges, the Government of Malawi enacted the Customary Land Act (2016) to formalize the management of customary land and strengthen land governance, particularly in rural areas [18,21]. The Act provides a framework for registering customary land under the Registered Land Act, granting formal recognition and legal protection to individuals, families, and communities. Despite the potential of land registration reforms to improve land governance, empirical evidence on their impacts on soil health restoration and household food security remains limited and varies depending on context [18,19,22,23], thereby making it difficult to make generalizations on the impacts of such land reforms. While contextual differences may partially explain the observed variations [19], they may also reflect methodological limitations, particularly the use of approaches that do not adequately account for the non-random nature of participation in land registration [21,22,23]. This consequently weakens the causal inferences, thereby making it difficult to generalize the impacts of land registration on land management investments and food security. The existing literature documents that secure tenure enhances investment in land improvements [24], reduces disputes [25], and promotes equitable access to land resources [26].
Although several studies have examined the implications of land registration and tenure security in Malawi (e.g., [18,19,20,21,23,25,26,27,28,29,30,31,32]), most have focused on productivity [18,19,25], investment behavior [20,24], or land dispute resolution and governance [26,28]. To date, most of these studies lack a linkage, especially on how formal land registration leads to improvements in both soil health restoration and food security. Given that food security is multidimensional, encompassing availability, access, utilization, and stability, this study employs multiple indicators to capture its complexity. These include the Child Dietary Diversity Score (CDDS), Women’s Dietary Diversity Score (WDDS), Household Food Insecurity Experience Scale (HFIES), and Household Food Insecurity Access Scale (HFIAS). To assess soil health restoration, the study uses a composite proxy reflecting household-level soil management practices, such as the application of soil amendments (lime, organo-mineral fertilizers, and biochar), agroforestry tree planting (e.g., Gliricidia, Tephrosia, and Faidherbia albida), and conservation techniques (e.g., legume intercropping, crop rotation, mulching, and minimum tillage). Households employing all three categories of practices are considered to maintain healthier soils.
The novelty of this study lies in its integrated analysis of land registration, soil health restoration, and household food security within the context of Malawi’s ongoing land reform agenda. While previous research has extensively examined the relationship between land tenure security and agricultural productivity, investment incentives, or land dispute resolution [19,26,28], few have explored how formalization of customary land rights translates into biophysical and welfare outcomes. This research therefore bridges an important empirical and policy gap by linking land reforms to ecological sustainability and household resilience. Furthermore, by employing an endogenous switching regression (ESR) model, the study advances methodological rigor in estimating causal effects while addressing selection bias inherent in non-random participation in land registration. The multidimensional measurement of food security using dietary diversity and food insecurity experience indices, combined with a composite proxy for soil health restoration, also offers a comprehensive and context-sensitive framework for understanding the nexus between institutional reforms and household resilience in Malawi. Therefore, the study stipulates the following hypotheses. Firstly, land registration significantly improves household soil health restoration. Secondly, land registration significantly improves household food security outcomes.

2. Materials and Methods

2.1. Conceptual and Theoretical Framework

Figure 1 highlights causal pathways through which land registration can enhance soil health restoration and food security. Conceptually, this study assumes that land certification and titling enhance food security in Malawi by strengthening tenure security, promoting investments in soil health restoration practices, and increasing agricultural productivity. Under the 2016 Customary Land Act, land certification provides legal recognition of ownership and use rights, thereby reducing the risk of encroachment or expropriation by private entities or the state [33]. Secure tenure empowers smallholder farmers with confidence and authority to make long-term investments in their land, such as applying organic and mineral fertilizers, lime, and biochar; planting agroforestry trees like Tephrosia vogelii and Faidherbia albida; and adopting conservation practices, including minimum tillage, mulching, and crop rotation. These sustainable land management practices enhance soil fertility, improve land productivity, and strengthen the resilience of farming systems. Moreover, land certification enables farmers to use their titled plots as collateral to access agricultural credit, which can be invested in inputs such as improved seeds, fertilizers, and pesticides [20,27,30]. By facilitating access to both resources and credit, land certification supports productivity growth that can directly improve household food availability and, through commercial production, expand the local food supply. Consequently, the framework underscores the transformative role of secure land rights in fostering sustainable agricultural intensification and advancing food security outcomes in Malawi’s smallholder sector [34].
As developed by [35], we model household decisions regarding land registration through certification and titling. Theoretically, the study suggests that rational households will opt to register land if the expected gain from registering land exceeds that of maintaining the current situation. Households are more inclined to register land when the anticipated benefits enhance tenure security, reducing risks of disputes or expropriation [33]. Secure tenure promotes investments in soil health restoration, such as applying organic and mineral fertilisers, lime, biochar, or planting agroforestry trees (e.g., Tephrosia, Faidherbia albida), and adopting conservation agriculture practices like minimum tillage and mulching. These investments improve soil fertility and agricultural productivity, directly supporting household food security through increased subsistence production or market surplus. Furthermore, titled land can serve as collateral for loans, facilitating access to inputs like fertilisers, seeds, and pesticides, thus further boosting productivity.
However, households weigh these benefits against costs such as registration fees, administrative burdens, and time, which can be considerable. The decision to register land can be expressed mathematically as:
R i =   U i R U i N R > 0  
where R i is a latent variable representing the net utility of registration for a household, U i R is the utility of registering land, and U i N R is the utility of the status quo (unregistered land). The household registers if R i > 0 . Further, R i can be presented as a function of observable characteristics, as defined in Equation (2), where (β) is a vector parameter to be estimated, ( X i ) is a vector of explanatory variables (e.g., household income, land size, access to credit, education, gender, cultural tenure system), and ( ε i ) is the error term capturing unobserved factors.
R i = β X i + ε i with   R i = 1   i f   R i > 0 . 0   o t h e r w i s e    

2.2. Estimation Strategy

We hypothesize that some households will choose to register their land while others will not [36,37,38,39]. Consequently, the impact of land registration or reform can be identified by comparing the outcome variables between registered and non-registered households, allowing for a robust estimation of the causal effects of land certification on key outcomes such as food security and soil health restoration. In non-random studies, such as those by [12,40,41,42], households may self-select into treatment and control groups, indicating the potential presence of self-selection. Consequently, when comparing outcome variables, farmers with prior advantages in observable characteristics may exhibit better outcomes, potentially leading to biased and inconsistent estimates if ordinary least squares (OLS) methods are employed.
Various methods, e.g., [10,14,42,43,44], have been adopted to derive unbiased estimates using non-experimental data. These methods consist of propensity score matching (PSM), inverse probability weighted regression adjustment (IPWRA), instrumental variable (IV), and endogenous switching regressions (ESR). Among these, a propensity score matching (PSM) technique has been widely used to address self-selection bias in impact evaluation [10,41,44]. In addition, PSM is adopted in situations where decisions are influenced by observable factors such as access to markets [12] and access to extension services [42]. However, there could be unobserved characteristics that could influence the decision to register land, such as farmers’ utility preferences, farmers’ skills, and innovativeness [45]. Hence, using PSM could yield biased and inconsistent estimates due to the presence of unobserved heterogeneity. Secondly, farmers may self-select, and their decision to adopt these technologies could influence outcomes like WDDS, CDDS, FIES, HFIAS and soil health restoration. Thirdly, the relationship between land registration and food security or soil health restoration may not be solely unidirectional, hence risking potential reverse causality. For example, households with healthier soils or those who are food secure may already have the financial resources, labour capacity, or ability needed to pursue land registration.
In this context, the study employs the Endogenous Switching Regression (ESR) to assess the impact of land registration on soil health restoration and food security because it minimizes the risk of these three biases. According to [45], an ESR method can be applied in two steps to evaluate the impact of implementing land registration. The first step involves applying a probit regression model to ascertain the likelihood of participating in land registration. The second stage examines the relationships between the observable traits of farmers who registered their land and the outcome variables. These two stages are given as follows.
Y i R = β i R X i R + v i R if   G i = 1   for   land   registration   in   regime   1
Y i N R = β i N R X i N R + v i N R if   G i = 0   for   those   that   did   not   register   in     regime   2
The latent variable Y i R represents the likelihood that a farming household will register their land. The vectors X i R , and X i N R , represent production, socioeconomic and institutional regressors for treatment and control, β i R and β i N R represent a vector of parameters that need to be estimated for both adopters and non-adopters, and v i R , v i N R represents the stochastic error term. Due to selection bias and endogeneity, the study assumes non-zero values of correlation between v i N and v i A . Further, the study assumes that the three errors, thus, ε i , v i N and v i A have a trivariate normal distribution with zero mean and variance–covariance structure presented as follows.
Covariance   ( ε i , v i N R , v i R ) = σ ε 2 σ R ε σ N R ε σ R ε σ R 2 σ N R σ N R ε σ N R σ N R 2
where σ ε 2 ,   σ R 2 , and σ N R 2 are variances of the error terms in the selection equation and outcome models for adopters and non-adopters. Further, σ A ε is the covariance between ε i , and v i A and σ N ε is the covariance between ε i and v i N . Since Y i R and Y i N R do not occur at the same time, the covariance between v i N R , and v i R is undefined. The mean values of the truncated error terms are presented as:
E v R G = 1 = σ A ε = σ R ε γ R
E v N R G = 0 = σ N ε = σ R ε γ N R
In the first stage, γ R and γ N R can be estimated and included in the outcome equations for treatment and control groups if an exogenous instrument relevant to the situation is provided. For the proper design of the ESR model, the selection model must have at least one variable that influences the decision to register land but does not affect the outcome variable (WDDS, CHDDS, HFIES, and HFIAS). The impact of land registration can be modelled by estimating the WDDS, CDDS, HFIES, and HFIAS under observed and counterfactual scenarios. In the observed scenario, the expected value of the outcome variables for registered land ( Y i R ) can be expressed as:
E Y R G = 1 = β X R σ A ε γ A
Households that registered their land may behave differently from an average household with the same characteristics due to unobserved characteristics. Hence, σ A ε γ A , in the equation above, takes selection bias into consideration. The expected outcome (WDDS, CHDDS, HFIES, and HFIAS) for adopters had they decided not to register land is modelled as follows:
E Y N R G = 1 = β X N R σ N R ε γ R
Therefore, the impact of land registration on food security is the difference between the two equations above; thus, the average treatment effect on the treated (ATT) is presented as follows.
A T T = E Y R G = 1 E Y N R G = 1 = X β R β N R + ( σ R ε σ N R ε ) γ R
Robust ESR estimation requires instrumental variables that are both theoretically and empirically justified. Guided by theory and prior literature [12,42,46,47,48], a valid instrument must be strongly correlated with the choice variable (land registration) and must not directly affect the outcome variables (WDDS, CDDS, HFIAS, HFIES and soil health restoration). This study employs three perception-based proxy variables as instruments: (i) farmers’ perception that land registration confers legal ownership; (ii) farmers’ perception that land registration reduces the risk of land disputes, eviction, and expropriation; and (iii) farmers’ perception that land registration encourages investment in land, driven by confidence in future returns. Following [46], endogeneity and weak instrument tests are presented as follows:
Y i = β i X i + v i
Y i = Z i ϒ i + ε i
where Equation (11) is the structural form and Equation (12) is the reduced form. Hence, the study tests the null hypothesis that ϒ i = 0 in the reduced form against the alternative that ϒ i 0 . Rejecting the null hypothesis implies the presence of endogeneity and necessitates the use of a strong instrument.

2.3. Measurement of Outcome Variables

Measuring food security is a multidimensional process, meaning that no single indicator can fully capture all the aspects of sustainability, availability, access, utilization, and stability. This study identifies several indicators as proxies for food security: the Child Dietary Diversity Score (CDDS), the Women’s Dietary Diversity Score (WDDS), the Household Food Insecurity Experience Scale (HFIES), and the Household Food Insecurity Access Scale (HFIAS). Recognizing that food distribution is not equal within households, we consider minimum dietary diversity for both women of reproductive age (18–64 years) and children aged 6–59 months. The Household Dietary Diversity Score (HDDS) serves as a valuable indicator of food access, as it measures the quality of food available to households rather than just the quantity.
The Women’s and Children’s Dietary Diversity Scores are calculated as follows:
D D S =   i H i   i = 1 , 2 , 3 , 0
where H i represent the food group consumed, and each food group is represented by a binary value where 1 indicates that a household consumed a particular food group and 0 indicates that it did not. For example, a household with a Dietary Diversity Score of 10 would have consumed every food group within the last 24 h. The relevant food groups include fish and meat, pulses, eggs, fats and oils, cereals and grains, fruits and vegetables, dairy, roots and tubers, sugars, and condiments. The WDDS and CDDS measure dietary diversity for women (15–49 years) and children (6–23 months), respectively, based on the consumption of nine and seven food groups in the past 24 h, with higher scores indicating greater dietary diversity and improved nutritional outcomes [49].
The Household Food Insecurity Access Scale (HFIAS), developed by FANTA [49,50], assesses household food insecurity over the past 30 days. A higher HFIAS score indicates greater food insecurity. The scale includes nine questions, with households responding based on their experiences in the last four weeks: “seldom” (once or twice), “sometimes” (three to ten times), and “often” (more than ten times). Scores range from 0 (food secure) to 27 (maximum insecurity), with higher scores indicating food insecurity [50]. The FIES survey includes eight questions aimed at determining whether, during a certain period, the respondent has experienced specific conditions that suggest a reduced ability to access food [49].
Soil health restoration is assessed using a binary proxy variable indicating whether a household adopts a comprehensive soil health restoration package, defined as the simultaneous implementation of three practices: agroforestry, cultural practices, and soil amendments. Agroforestry includes planting nitrogen-fixing trees (e.g., Gliricidia sepium or Faidherbia albida) to enhance soil fertility and structure. Cultural practices encompass crop rotation and intercropping with legumes, which improve soil nutrient content and reduce erosion. Soil amendments involve applying organic inputs (e.g., compost, manure) to enhance soil organic matter and microbial activity. Households are classified as adopting the soil health restoration package (1) if they implement all three practices concurrently, and non-adopting (0) otherwise.

2.4. Study Area and Data Sources

This study used secondary data that were obtained from the Centre for Agricultural Research and Development (CARD), which is an agricultural public policy research institute based at Bunda College of the Lilongwe University of Agriculture and Natural Resources (LUANAR) in Malawi. The dataset comprised cases and records of 512 smallholder farmer households. Data were collected using a semi-structured questionnaire in Nkhotakota and Chikwawa districts of Malawi. These districts were purposively selected to represent contrasting land tenure systems, i.e., those that registered and those that did not register their land. These contrasting tenure regimes provide a useful context for examining how local land governance arrangements shape land registration, soil health restoration, and household food security outcomes. In addition, in both districts, the Government of Malawi is implementing land regularization, in which smallholder households are incentivised to register their land parcels for agricultural production. Moreover, these land reforms are complemented by climate-smart agricultural practices for enhancing soil health restoration, agricultural production, and household food security.
A two-stage stratified random sampling design was employed. At the first stage, the district was used as the stratification basis to reflect different land tenure systems. Nkhotakota is predominantly matrilineal, where land rights are commonly inherited through the female line, whereas Chikwawa is largely patrilineal, with land rights typically passed through the male line. Within each district, Mikalango and Mwansambo extension planning areas (EPAs) were purposively selected because these were the EPAs where land registration activity was being implemented. Two agricultural sections were then randomly selected from each EPA, namely Mikalango and Mwansambo. At the second stage, households were selected via random sampling techniques from a household list obtained from the extension officers. This approach ensured adequate representation of households across different tenure systems and enhanced the robustness of the empirical analysis. The sample was allocated almost equally across the two study districts, resulting in 250 households from Nkhotakota and 262 households from Chikwawa, for a total sample of 512 households. The sample size was determined based on the estimated smallholder farming population across the two districts.
The household-level data for this study were collected using a semi-structured questionnaire administered to smallholder farmers. Table 1 below shows variables, their description and how they were measured in this study. The questionnaire captured detailed information on household socio-demographic characteristics, including age, gender, education level, household size, and farming experience of the household head. It further gathered data on land tenure and land reform participation, such as land ownership status, land registration and certification, perceived tenure security, land acquisition history, plot characteristics, and boundary clarity. In addition, the survey collected farm-level and management data covering landholding size, crop production, input use, access to extension and credit services, adoption of sustainable land management and soil health restoration practices (including organic and inorganic soil amendments, conservation agriculture, agroforestry, and erosion control measures), as well as indicators of agricultural productivity. To assess household welfare, the questionnaire included multiple food security and nutrition modules, capturing dietary diversity, food access constraints, and food insecurity experiences at both household and individual levels.
Qualitative data were collected through focus group discussions and key informant interviews guided by a structured checklist to complement and contextualize the household survey findings. The checklist elicited information on community-level land tenure arrangements, customary land governance structures, land registration processes, and local perceptions of land reforms. Discussions explored experiences with tenure security, including land disputes, inheritance practices, gender dimensions of land access, and enforcement of land rights. The checklist also covered community perceptions of soil health restoration trends, drivers of land degradation, and collective and individual land management practices. In addition, qualitative discussions examined perceived links between land reforms, investment incentives, agricultural productivity, and food security, as well as institutional and implementation challenges affecting the effectiveness of land reform initiatives. These qualitative insights triangulated quantitative results and deepened understanding of the mechanisms through which land reforms influence soil health restoration and household food security outcomes.

3. Results

3.1. Descriptive Statistics of Household Characteristics

Table 2 presents descriptive statistics comparing the socioeconomic, agricultural, and institutional characteristics of households with registered and unregistered land. The results reveal significant differences, supporting the hypothesis that land certification affects tenure security, agricultural investment, and food security. The average age of household heads was 46.9 years, with registered households slightly older (47.6 years) than unregistered households (45.6 years), although this difference was not statistically significant (p = 0.160). Most households (80.6%) were male-headed, with no significant gender difference between the groups (p = 0.987). Literacy rates were higher among registered households, with 75.4% literate in Chichewa and 23.1% in English; these differences were significant at the 1% level. Education levels also differed significantly (p < 0.001), with registered household heads averaging 5.8 years of schooling compared to 4.6 years for unregistered households. Household sizes were similar across both groups. Land holdings averaged 2.6 acres overall, with registered households owning significantly larger parcels (2.9 acres) than unregistered households (1.9 acres), a significant difference at the 1% level.
Participation in farmer organizations was significantly higher among registered households, with 41.4% compared to 23.8% for non-registered households (p < 0.001). Registered households were also significantly more likely to adopt agricultural practices that promote soil health restoration. For instance, 74.8% used vetiver grass for soil conservation, compared to 58.6% of non-registered households (p < 0.001). Crop rotation with legumes was practised by 54.0% of registered households versus 38.9% of non-registered households (p < 0.001). Intercropping with legumes was slightly higher among registered households at 33.6%, compared to 26.1% in non-registered households but these differences were not statistically significant (p = 0.080). Additionally, the use of soil-improving species such as Tephrosia vogelii was common among registered households (4.4% vs. 1.1%, p = 0.044), as was Faidherbia albida (25.6% vs. 16.7%, p = 0.021). Registered households also more frequently employed mixed organic and inorganic fertilizers, with 24.3% adoption compared to 16.0% among non-registered households (p = 0.029). Overall, these results highlight that land registration is associated with greater engagement in sustainable and productivity-enhancing agricultural practices.
Unregistered households reported greater use of minimum tillage practices, with 9.4% employing this method compared to 4.3% of registered households (p = 0.022). Soil erosion was also less prevalent among registered households, affecting 40.3% versus 51.4% of unregistered households (p = 0.016), suggesting more effective land management practices among those with registered land. Registered households consistently exhibited superior food security outcomes. The Household Food Insecurity Access Scale (HFIAS) score was lower for registered households at 9.6 compared to 13.8 for unregistered households (p < 0.001), indicating reduced food insecurity. Similarly, Household Dietary Diversity Scores (HDDS) were higher among registered households, with children under 5 scoring 3.7 versus 2.8 for unregistered households (p < 0.001), and women aged 18–64 scoring 4.5 versus 3.6 (p < 0.001). The Household Food Insecurity Experience Scale (HFIES) also reflected improved outcomes for registered households, with scores of 4.8 versus 6.0 for unregistered households (p < 0.001). These findings collectively indicate that land registration is associated with better land management and enhanced food security.

3.2. Weak Instrument and Endogeneity Test

Results in Table 3 present weak instruments and an endogeneity test. The study’s selection of instrumental variables (IVs) is guided by both theoretical considerations and prior research. Three proxy variables are employed as IVs: (i) farmers’ perception that land registration confers legal ownership, (ii) farmers’ perception that land registration reduces the risk of land disputes, eviction, and expropriation, and (iii) farmers’ perception that land registration encourages investment in their land, with confidence in future returns. These variables are chosen because they are strongly correlated with the likelihood of a farmer registering land but are plausibly exogenous to food security outcomes (WDDS, CDDS, HFIAS, HFIES) and soil health restoration, affecting them only indirectly through land registration.
The choice of legal recognition, reduced land dispute risk, and willingness to invest as instruments is grounded in the random utility framework outlined in Section 2.1: these perception variables directly shape the latent utility differential that determines a household’s decision to register land, since farmers rationally weigh perceived legal, security, and investment benefits against the costs of registration. This perception-based approach aligns with prior studies in agricultural technology adoption, such as [51], who used farmers’ perceptions of climate change as an instrument for adaptation decisions in an ESR framework, while [52] similarly employed perception-based variables in the selection equation for soil and water conservation technology adoption. We argue that farmers’ perceptions regarding registration impact their decision to register rather than directly affecting soil health restoration or food security, as perceptions alone do not provide the necessary legal protections or investment security.
To ensure the validity of these instruments, the study adheres to standard econometric principles by conducting robustness checks, including tests for endogeneity and weak instruments, with the zero first-stage test employed to assess instrument strength. The study ran both the Anderson–Rubin test and Wald test, and they were significant at 1%, with chi-square statistics of 11.63 and 33.14, respectively. Following the reduced-form econometric estimation, we reject the null hypothesis that the instruments are weak and that land registration is exogenous. This suggests the presence of endogeneity, and the instruments used are strong.

3.3. Determinants of Land Registration Among Smallholder Farmers in Malawi

Table 4 and Appendix A.1 report the estimates from the endogenous switching regression model (ESR), examining the determinants of land registration and its effects on food security and dietary outcomes, including HFIAS, HFIES, CDDS, and WDDS, for households that registered their land versus those that did not. Across all model estimates, the parameter σ R ε , capturing the correlation between unobservable in the land registration and outcome equations, was statistically significant. This indicates initial differences between households that registered land and those that did not generate self-selection into land registration (see more detail in Appendix A.1). The joint independence test further reveals significant differences in the HFIAS, HFIES, CDDS, and WDDS functions between registered and unregistered households, highlighting variation in the impact of factors such as the age of the household head, membership in farmer groups, land size, crop rotation with legumes, intercropping with legumes, and the use of vetiver grass for soil and water conservation. These findings underscore the advantages of the ESR over a simple treatment effect model, as it explicitly accounts for endogeneity and selection bias, providing more reliable estimates of the impact of land registration on household outcomes.
The selection equation results in Table 4 indicate that both the age of the household head and membership in farmer groups significantly increase the likelihood of land registration. Specifically, a one-year increase in age raises the probability of registering land, suggesting that older household heads, with greater experience and awareness of tenure benefits, prioritize securing land for future generations, especially in contexts with weak customary land systems. This finding aligns with [53], who reported that older household heads in Ethiopia were more likely to adopt sustainable land management practices, and with [54], who found that age influences the adoption of climate-smart agricultural practices under secure tenure in Afghanistan. Similarly, membership in farmer groups enhances the probability of land registration, likely by improving awareness of legal frameworks such as Malawi’s Customary Land Act and providing access to training, resources, and information on the benefits of formal tenure, including reduced land disputes. Ref. [55] supports this, noting that farmer group participation in Rwanda significantly boosts adoption of land management practices through knowledge sharing and resource access, which can extend to decisions about land registration. Collectively, these results underscore the importance of both individual characteristics and social networks in shaping formal land tenure decisions.
An increase in land size by one acre significantly raises the likelihood of land registration. Larger landholdings, associated with higher economic value and greater exposure to disputes, incentivize farmers to secure formal titles to protect their investments. This finding is consistent with [53], who found that larger land holdings in Ethiopia were associated with increased adoption of water-harvesting systems post-registration, reflecting greater incentives for tenure security and soil health restoration investments among farmers with larger plots. Agronomic practices, such as crop rotation and intercropping with legumes, also increase the probability of land registration. These practices, which enhance soil fertility and productivity, indicate that farmers investing in sustainable agriculture are more likely to seek formal tenure to safeguard their long-term investments. Ref. [54] identified intercropping and crop rotation with legumes as climate-smart practices influenced by land tenure security in Afghanistan, suggesting that secure tenure encourages such practices to improve soil health restoration. Similarly, ref. [56] noted that intercropping with legumes enhances soil fertility in Senegal, with tenure security playing a critical role in adoption.
Furthermore, the adoption of soil and water conservation measures, such as planting vetiver grass, significantly increases the likelihood of land registration. This reflects farmers’ commitment to long-term land management and soil health restoration, as vetiver grass is an effective erosion-control measure. Despite not being addressed in the literature, refs. [53,54] highlight that soil and water conservation practices are more prevalent under secure tenure, supporting the link between vetiver grass planting and land registration. This finding underscores the potential of land registration to promote sustainable land management practices that enhance soil health restoration.

3.4. The Impact of Land Registration on Household Food Security and Soil Health Restoration

The study examined the impact of land registration on soil health restoration and food security. As shown in Figure 2, land registration significantly enhances food security. Households with registered land reported HFIAS and HFIES scores of 9.96 and 4.98, respectively, compared to counterfactual scores of 12.50 and 5.81, indicating reductions of 2.54 and 0.83 points, both statistically significant at the 1% level. These findings suggest that formal land registration strengthens household food security, likely by increasing tenure security and encouraging agricultural investment. Land registration also improved dietary diversity: households with registered land achieved WDDS and CDDS of 4.27 and 3.24, respectively, compared to counterfactual scores of 3.25 and 2.74. This represents increases of 1.02 and 0.50 points, both significant at the 1% level, reflecting differences in consumption patterns between women and children within households. Further, the study reveals a significant impact of land registration on soil health restoration. Households that registered their land experienced a 46% improvement in soil health restoration, compared to a 37% improvement if they had not registered. This indicates that if a household chooses to register its land, assuming all other factors remain constant, soil health restoration would improve by 9%. This finding suggests that land registration positively affects soil management practices, likely by enhancing tenure security, which encourages long-term investments in sustainable land use.

4. Discussion

The study conceptualized 2 hypotheses in the evaluation of the impacts of land registration on food security and soil health restoration. Consistent with Hypotheses 1 and 2, the ESR results indicate that land registration significantly improved both food security and soil health restoration outcomes. This is reflected in the ATT results, where HFIAS and HFIES declined substantially among registered households, reflecting improved food access and reduced food insecurity. On the other hand, dietary diversity scores and soil health restoration proxy increased as well. This could be partially explained by the fact that food security indicators, particularly dietary diversity and food access measures, can respond within a single agricultural season to changes in household income, credit access, or production decisions enabled by registration. Soil health restoration, by contrast, is a biophysical outcome shaped by cumulative processes, organic matter accumulation, structural stability, and nutrient cycling that typically unfold over multiple cropping seasons. Therefore, we suggest that the statistically significant soil health restoration effect observed in this study should be interpreted as an early-stage signal of a longer-term process, rather than evidence that soil health restoration is unresponsive to land registration.
Beyond these average treatment effects, the analysis offers insight into who registers land, extending a growing body of evidence linking land tenure to investment and welfare outcomes in Malawi. Notably, the gender of the household head was not a statistically significant determinant of either the probability of land registration or of downstream food security and soil health restoration outcomes, which contrasts with [24], who found that the effects of tenure insecurity on agricultural performance within Malawi’s customary tenure system were strongly gender-differentiated, with women’s land rights shaping investment and cash-crop decisions differently from men’s. This difference could be partially explained by the mere fact that our study combined both patrilineal and matrilineal systems. On the investment side, [57], using plot-level panel data with household fixed effects, found that tenure insecurity significantly discouraged investment in soil conservation among Malawi’s smallholders; the present study’s soil health restoration findings are consistent with this logic, as resolving tenure insecurity through registration is associated with improved soil management outcomes. Similarly, ref. [27] found that establishing well-defined land boundaries significantly increased investment in selected soil and water conservation practices. Relatedly, this study directly addresses the empirical gap identified by [19], who outlined the theoretical pathways linking land tenure reform, tenure security, and food security in poor agrarian economies but noted the shortage of rigorous causal estimates connecting them; by applying an ESR framework that corrects for selection on both observed and unobserved factors, the present study provides exactly this kind of evidence.
This study is subject to several limitations that should be considered when interpreting its findings. Firstly, the analysis relies on cross-sectional data, which precludes observation of within-household changes over time and limits our ability to draw firm conclusions about the long-term dynamic effects of land registration on soil health restoration. Secondly, the model does not explicitly control for exposure to climate shocks beyond household-reported flooding or for land leasing and rental market participation, both of which could independently influence soil management decisions and food security outcomes. Nevertheless, since both the registered and non-registered land users were surveyed within the same villages, the effects of climate shocks can be assumed to operate uniformly across the two groups. Thirdly, the soil health restoration measure used in this study is a composite proxy based on household-reported adoption of soil management practices, rather than direct field-based physical or chemical soil testing (e.g., soil organic carbon, Electrical Conductivity, pH, or nutrient content). While this proxy captures meaningful variation in management behaviour, it does not directly measure soil biophysical outcomes, and future research incorporating laboratory soil analysis would strengthen causal claims linking registration to actual soil quality change. Finally, the sample is drawn from two districts selected to represent contrasting matrilineal and patrilineal tenure systems; while this design was intentional and theoretically motivated, it may limit the generalizability of the findings to other regions of Malawi with different agroecological conditions, land pressure, or governance contexts, and future studies extending the analysis to additional districts would help establish broader external validity.
These findings have important implications for Malawi’s land governance reforms. Land registration has been linked to significant improvements in food security, suggesting that formalizing customary land rights should be prioritized within food security and social protection strategies. However, because soil health restoration improves more gradually, land registration alone is insufficient; it must be accompanied by agronomic support, including extension services for soil conservation, access to organic amendments, and multi-season monitoring of soil health restoration. As noted by [18], successful implementation needs to be genuinely participatory, involving traditional chieftaincy structures.

5. Conclusions

This study shows that farmland registration positively impacts soil health restoration and household food security. Additionally, household and farm characteristics such as the age of the household head, membership in farmer groups, landholding size, and the adoption of sustainable land management practices influence the decision to register land. The study suggests that bundling extension services with registration can strengthen land tenure security and encourage investment in sustainable practices, leading to improved soil quality and food security. These findings suggest that land registration reforms can offer benefits beyond property rights security. Promoting farmland registration could be a key strategy for advancing sustainable land management and soil health restoration. The evidence supports expanding Malawi’s Customary Land Act in line with the Malawi 2063 Agenda’s goals for sustainable agriculture and poverty reduction, highlighting four specific priorities: (1) combining registration with extension services for soil conservation (such as crop rotation with legumes, intercropping, vetiver grass) and (2) implementing registration through farmer groups and traditional leaders rather than centralized administration. Note that the study relies on cross-sectional data from 512 households in two districts, using household-reported soil health indicators instead of laboratory tests, and lacks explicit climate controls. These factors should be considered when interpreting the results.

Author Contributions

Conceptualization, I.P.-P., W.C., L.B.B. and W.C.; methodology, W.C.; software, P.C.; validation, L.B.B., P.C. and W.C.; formal analysis, W.C., I.P.-P. and P.C.; investigation, W.C.; resources, I.P.-P. and L.B.B.; data curation, W.C., I.P.-P. and P.C.; writing—original draft preparation, W.C., I.P.-P., P.C. and L.B.B.; writing—review and editing, I.P.-P.; visualization, I.P.-P.; supervision, I.P.-P. All authors have read and agreed to the published version of the manuscript.

Funding

This research received no external funding.

Institutional Review Board Statement

Not applicable.

Informed Consent Statement

Not applicable.

Data Availability Statement

The research data are available from the authors and will be shared accordingly upon request.

Acknowledgments

We would like to acknowledge individuals from CARD-LUANAR who were instrumental in organizing data for this paper. Namely, Richard Nyoni, Maria Phoka, Iness Gondwe, Keston Simkhonde and Sithembile Kasambala. Further, during the preparation of this manuscript, the authors used Grammarly v.1.178.0.0 and Microsoft 365 Copilot v.2607 for readability purposes. The authors have reviewed and edited the output and take full responsibility for the content of this publication.

Conflicts of Interest

The authors declare no conflicts of interest.

Appendix A

Appendix A.1. Determinants of Land Registration Among Smallholder Farmers in Malawi

Table A1. Results from endogenous switching regression models.
Household Food Insecurity Access ScoreHousehold Food Insecurity Experience ScaleChildren’s Dietary Diversity (CDDS)Women’s Dietary Diversity (WDDS)Soil Health
Registered LandUnregistered LandSelection EquationUnregistered LandRegistered LandSelection EquationUnregistered LandRegistered LandSelection EquationUnregistered LandRegistered LandSelection EquationUnregistered LandRegistered LandSelection Equation
Age of household head0.0120−0.01490.0117 **−0.00180.0049 *0.0115 **−0.0021−0.0043 ***0.0100 *0.0041−0.00210.0099 *−0.00410.00270.0107 *
(0.025)(0.042)(0.005)(0.003)(0.003)(0.005)(0.002)(0.001)(0.005)(0.003)(0.001)(0.005)(0.008)(0.003)(0.005)
Gender of household head−0.77101.1755−0.18650.03160.0542−0.1712−0.01040.1402 ***−0.04390.10810.0539−0.04340.4876 *0.0446−0.1712
(1.044)(1.204)(0.202)(0.093)(0.108)(0.198)(0.071)(0.039)(0.191)(0.098)(0.054)(0.192)(0.292)(0.137)(0.200)
Literacy in Chichewa1.49292.02120.0896−0.02210.13880.1630−0.1160 *−0.0816−0.0256−0.0956−0.1339 **−0.0256−0.14890.4434 ***0.1511
(1.013)(1.419)(0.201)(0.089)(0.111)(0.200)(0.070)(0.065)(0.197)(0.092)(0.059)(0.197)(0.262)(0.150)(0.199)
Literacy in English−1.7274 *−1.11110.0621−0.0088−0.01180.1141−0.05390.03180.1165−0.03100.08830.1159−0.27900.2739 **0.1434
(1.023)(1.449)(0.224)(0.097)(0.123)(0.228)(0.112)(0.054)(0.222)(0.130)(0.057)(0.224)(0.424)(0.131)(0.241)
Education−0.0662−0.7238 ***0.0371−0.01560.00960.0257−0.0218 *0.00320.0305−0.00460.00690.0306−0.0093−0.0406 **0.0285
(0.147)(0.255)(0.031)(0.016)(0.017)(0.031)(0.013)(0.008)(0.031)(0.016)(0.008)(0.031)(0.056)(0.019)(0.031)
Household size0.16960.7202 *−0.0478−0.0029−0.0053−0.05140.0058−0.0206 **−0.0472−0.0160−0.0032−0.0476−0.0782−0.0307−0.0545
(0.216)(0.392)(0.042)(0.021)(0.021)(0.044)(0.016)(0.010)(0.042)(0.028)(0.012)(0.042)(0.064)(0.031)(0.043)
Farmer group−0.92140.17370.2797 *−0.0028−0.2852 ***0.3106 *−0.0733−0.01390.3094 *0.11030.00420.3083 *0.0931−0.14370.3022 *
(0.839)(1.515)(0.165)(0.078)(0.094)(0.168)(0.079)(0.041)(0.161)(0.096)(0.044)(0.162)(0.234)(0.108)(0.168)
Land size−0.1039−0.97660.1220 ***−0.1024 ***−0.01860.1422 ***0.02270.00810.1355 ***0.02340.01650.1355 ***0.0875−0.01610.1526 ***
(0.195)(0.631)(0.045)(0.039)(0.023)(0.054)(0.024)(0.010)(0.045)(0.036)(0.011)(0.045)(0.088)(0.026)(0.049)
Crop rotation with legumes−0.0060−1.04330.4898 ***0.2292 ***0.01290.4680 ***0.07800.03430.5839 ***0.04530.05380.5844 ***−0.18720.2193 *0.4669 ***
(0.885)(1.115)(0.155)(0.074)(0.093)(0.161)(0.064)(0.036)(0.157)(0.087)(0.049)(0.157)(0.271)(0.122)(0.160)
Intercropping with legumes3.3497 ***5.8919 ***0.6697 ***0.1656 **0.1762 *0.7514 ***−0.02510.07860.8387 ***−0.02370.1483 ***0.8376 ***0.6343 **0.3785 ***0.7711 ***
(0.971)(1.924)(0.184)(0.077)(0.097)(0.187)(0.089)(0.048)(0.185)(0.125)(0.049)(0.187)(0.304)(0.111)(0.191)
Vetiver Grass−0.66040.97540.3301 **0.0256−0.03810.3288 **0.04960.00670.3305 **−0.03770.00770.3312 **0.5558 *0.24990.3294 **
(1.005)(1.129)(0.154)(0.065)(0.101)(0.156)(0.057)(0.039)(0.155)(0.074)(0.049)(0.155)(0.284)(0.165)(0.159)
Faidherbia albida−0.36140.4611−0.1068−0.2561 **−0.1629 *0.01260.02640.0819−0.00050.16150.1934 ***−0.00130.21510.6217 ***0.0035
(0.856)(1.602)(0.196)(0.111)(0.092)(0.196)(0.077)(0.057)(0.185)(0.100)(0.052)(0.185)(0.253)(0.111)(0.197)
Mixture of Manure and fertilizer0.34405.3568 ***−0.05870.08250.0478−0.1147−0.14250.0829−0.0482−0.11580.1256 **−0.05030.6741 **0.2469 **−0.1261
(0.951)(1.817)(0.213)(0.110)(0.100)(0.208)(0.092)(0.054)(0.203)(0.144)(0.053)(0.203)(0.316)(0.110)(0.216)
Presence of organisms in the soil1.64550.3198−0.0948−0.1511 *0.1445−0.07990.04830.0746−0.19170.03670.1198−0.1926−0.5848−0.2751−0.0517
(2.351)(1.804)(0.463)(0.089)(0.291)(0.501)(0.112)(0.091)(0.486)(0.092)(0.096)(0.487)(0.649)(0.328)(0.485)
Soil erosion−0.34800.51630.1889−0.08340.02600.16110.06740.00200.19630.01000.06800.1952−0.3962 *−0.12310.1495
(0.820)(1.235)(0.154)(0.074)(0.096)(0.161)(0.061)(0.045)(0.156)(0.080)(0.045)(0.157)(0.218)(0.109)(0.160)
Soil quality 1.4669 **1.9297 **−0.17500.06130.0610−0.1737−0.1649 ***−0.0819 ***−0.1942 *−0.0804−0.1455 ***−0.1938 *−0.4667 **−0.0908−0.1817
(0.584)(0.799)(0.112)(0.046)(0.062)(0.115)(0.042)(0.028)(0.109)(0.055)(0.034)(0.109)(0.189)(0.084)(0.117)
Flooding0.83640.1455−0.11610.00640.0996−0.0886−0.0817−0.0184−0.1369−0.0284−0.0766−0.13640.10200.0226−0.0973
(0.866)(1.051)(0.158)(0.074)(0.095)(0.160)(0.061)(0.049)(0.157)(0.092)(0.047)(0.157)(0.224)(0.119)(0.166)
Access to climate services−3.5919 ***2.6875 *0.21730.1834 **−0.14740.19300.0241−0.00810.1181−0.1775 **−0.03830.11660.1106−0.12560.1853
(1.139)(1.378)(0.179)(0.072)(0.090)(0.177)(0.057)(0.048)(0.174)(0.081)(0.067)(0.174)(0.236)(0.157)(0.179)
Legal recognition 0.5462 *** 0.4801 *** 0.4783 *** 0.4803 *** 0.5056 ***
(0.159) (0.158) (0.156) (0.158) (0.164)
Reduce land disputes 0.8152 *** 0.7543 *** 0.6977 *** 0.7029 *** 0.7662 ***
(0.147) (0.154) (0.152) (0.153) (0.153)
Farmer’s willingness to invest 0.6826 **
(0.320)
lnsigma0 1.8717 *** −4.5110 * −5.3981 * −3.5365 *** −1.9977 ***
(0.056) (2.492) (3.110) (1.067) (0.678)
lnsigma1 1.6784 *** −0.7981 *** −4.7541 *** −4.1658 *** −3.2447 ***
(0.027) (0.152) (0.949) (0.859) (0.485)
athrho0 −0.6635 * −1.5350 *** 1.4084 *** −1.6009 *** −1.7711 ***
(0.348) (0.429) (0.305) (0.196) (0.678)
athrho1 0.1274 −0.0696 −1.5836 *** −1.6786 *** −1.7462 **
(0.362) (0.602) (0.356) (0.471) (0.837)
Constant9.3309 ***4.0036−1.6340 ***1.9784 ***1.0642 **−1.5420 **1.4250 ***1.3774 ***−1.3799 **1.2627 ***1.5009 ***−1.3776 **−0.0348−0.8926 *−1.5110 **
(3.526)(3.894)(0.615)(0.272)(0.461)(0.657)(0.212)(0.147)(0.638)(0.251)(0.161)(0.639)(0.948)(0.455)(0.641)
Wald chi72.9235 88.9269 57.8864 61.4498 49.1404
Prob > chi20.0000 0.0000 0.0000 0.0000 0.0001
Observations512 512 512 512 512
Standard errors in parentheses. * p < 0.10, ** p < 0.05, *** p < 0.01.

Appendix A.2. Average Treatment Effects on the Treated of Land Registration on Soil Health Restoration and Food Security (HFIAS, HFIES, WDDS, CDDS)

Actual Outcome Dependent on Land RegistrationCounterfactual Outcome Independent of Land RegistrationAverage Treatment Effects on the Treated (ATT)
Household Food Insecurity Access Scale (HFIAS)9.96
(0.18)
12.50
(0.27)
−2.54 ***
(0.25)
Household Food Insecurity Experience Scale (HFIES)4.98
(0.05)
5.81
(0.06)
−0.83 ***
(0.10)
Children’s Dietary Diversity Score (CDDS)3.24
(0.02)
2.79
(0.02)
0.50 ***
(0.03)
Women’s Dietary Diversity Score (WDDS)4.27
(0.04)
3.35
(0.02)
1.02 ***
(0.05)
Soil health restoration0.46
(0.01)
0.37
(0.01)
0.09 ***
(0.01)
Standard errors in parentheses. * p < 0.10, ** p < 0.05, *** p < 0.01.

References

  1. Leal Filho, W.; Lovren, V.O.; Will, M.; Salvia, A.L.; Frankenberger, F. Poverty: A central barrier to the implementation of the UN Sustainable Development Goals. Environ. Sci. Policy 2021, 125, 96–104. [Google Scholar] [CrossRef] [Scilit]
  2. Grosso, G.; Mateo, A.; Rangelov, N.; Buzeti, T.; Birt, C. Nutrition in the context of the Sustainable Development Goals. Eur. J. Public Health 2020, 30, i19–i23. [Google Scholar] [CrossRef] [Scilit] [PubMed]
  3. Atukunda, P.; Eide, W.B.; Kardel, K.R.; Iversen, P.O.; Westerberg, A.C. Unlocking the potential for achievement of the UN Sustainable Development Goal 2—‘Zero Hunger’—In Africa: Targets, strategies, synergies and challenges. Food Nutr. Res. 2021, 65, 10–29219. [Google Scholar] [CrossRef] [Scilit] [PubMed]
  4. FAO. The State of Food Security and Nutrition in the World 2022; FAO: Rome, Italy, 2022. [Google Scholar] [CrossRef] [Scilit]
  5. WFP (World Food Programme). Malawi Annual Country Report 2024; World Food Programme: Rome, Italy, 2024. [Google Scholar]
  6. FAOSTAT. Food Balances Data; FAO: Rome, Italy, 2023; Available online: https://www.fao.org/faostat/en/#data/FBS (accessed on 5 May 2026).
  7. The World Bank. Investing in Opportunity: Ending Poverty; World Bank: Washington, DC, USA, 2018. [Google Scholar]
  8. World Bank. Malawi Economic Monitor, 20th Edition: The Rising Cost of Inaction; World Bank: Washington, DC, USA, 2025. [Google Scholar]
  9. NSO (National Statistical Office). The Fifth Integrated Household Survey (IHS5) 2019–2020; National Statistical Office: Zomba, Malawi, 2020.
  10. Moyo, R.; Chirwa, G.C. The economic implications of noncommunicable diseases on food security and resilience in Malawi. J. Agric. Food Res. 2025, 19, 101646. [Google Scholar] [CrossRef] [Scilit]
  11. Salima, W.; Manja, L.P.; Chiwaula, L.S.; Chirwa, G.C. The impact of credit access on household food security in Malawi. J. Agric. Food Res. 2023, 11, 100490. [Google Scholar] [CrossRef] [Scilit]
  12. Chirwa, W.; Pangapanga Phiri, I.; Phiri, H.; Tufa, A.; Ngoma, H. Does adoption of improved soybean varieties and their complementary agronomic practices enhance household food security among smallholder farmers in Malawi. Afr. J. Agric. Resour. Econ. 2024, 19, 147–165. [Google Scholar] [CrossRef] [Scilit] [PubMed]
  13. FSIN (Food Security Information Network). FSIN Joint Analysis for Better Decisions; FSIN: Rome, Italy, 2024. [Google Scholar]
  14. Pangapanga Phiri, I.; Mungatana, E.D.; Pangapanga, L.; Nkoka, F.S. Understanding the impact of sustainable landscape management practices on farm productivity under intensifying tropical cyclones: Evidence from Southern Malawi. Trop. Cyclone Res. Rev. 2022, 11, 265–276. [Google Scholar] [CrossRef] [Scilit]
  15. Burke, W.J.; Jayne, T.S.; Snapp, S.S. Nitrogen efficiency by soil quality and management regimes on Malawi farms: Can fertilizer use remain profitable? World Dev. 2022, 152, 105792. [Google Scholar] [CrossRef] [Scilit]
  16. Omuto, C.T.; Vargas, R.; Kupunda, G.; Chonongera, D.; Malawi, L.; Mmangisa, M.; Mbata, J. Soil Nutrient Loss Assessment in Malawi; Technical Report; FAO: Rome, Italy, 2018. [Google Scholar]
  17. Katengeza, S.P.; Rashid, K.; Tione, S.; Holden, S.T.; Tilahun, M. Toward Sustainable Impact of Farm Input Subsidies in Malawi: Is Integration with Climate-Smart Agriculture a Practical Solution? Sustainability 2026, 18, 3929. [Google Scholar] [CrossRef] [Scilit]
  18. Chikaya Banda, J.; Chilonga, D. Key challenges to advancing land tenure security through land governance in Malawi: Impact of land reform processes on implementation efforts. Land Use Policy 2021, 110, 104994. [Google Scholar] [CrossRef] [Scilit]
  19. Holden, S.T.; Ghebru, H. Land tenure reforms, tenure security and food security in poor agrarian economies: Causal linkages and research gaps. Glob. Food Secur. 2016, 10, 21–28. [Google Scholar] [CrossRef] [Scilit]
  20. Mbudzya, J.; Obedy, E.G.; Owour, G. Influence of land tenure security on household food security among smallholder farmers in Narok County, Kenya. Afr. J. Rural Dev. 2022, 7, 20–37. [Google Scholar]
  21. Zuka, S.P. Customary land titling and intergenerational wealth transfer in Malawi: Will secondary land rights holders maintain their land rights? Land Use Policy 2019, 81, 680–688. [Google Scholar] [CrossRef] [Scilit]
  22. Bae, Y.J. Analyzing the changes of the meaning of customary land in the context of land grabbing in Malawi. Land 2021, 10, 836. [Google Scholar] [CrossRef] [Scilit]
  23. Ibrahim, H.K.; Hendriks, S.L.; Schönfeldt, H.C. The effect of land tenure across food security outcomes among smallholder farmers using a flexible conditional difference in difference approach. Int. J. Agric. Sustain. 2023, 21, 2220900. [Google Scholar] [CrossRef] [Scilit]
  24. Deininger, K.; Xia, F.; Holden, S. Gendered incidence and impacts of tenure insecurity on agricultural performance in Malawi’s customary tenure system. J. Dev. Stud. 2019, 55, 597–619. [Google Scholar] [CrossRef] [Scilit]
  25. Melesse, M.B.; Bulte, E. Does land registration and certification boost farm productivity? Evidence from Ethiopia. Agric. Econ. 2015, 46, 757–768. [Google Scholar] [CrossRef] [Scilit]
  26. Deininger, K.; Xia, F.; Kilic, T.; Moylan, H. Investment impacts of gendered land rights in customary tenure systems: Substantive and methodological insights from Malawi. World Dev. 2021, 147, 105654. [Google Scholar] [CrossRef] [Scilit]
  27. Mkandawire, N.D.; Mangisoni, J.; Pangapanga, I.; Machila, K. Assessing the impact of land tenure security on farm level investment in soil and water conservation practices: Evidence from smallholder farmers in Malawi. Land Use Policy 2025, 159, 107803. [Google Scholar] [CrossRef] [Scilit]
  28. Peters, P.E. “Our daughters inherit our land, but our sons use their wives’ fields”: Matrilineal matrilocal land tenure and the New Land Policy in Malawi. J. East. Afr. Stud. 2010, 4, 179–199. [Google Scholar] [CrossRef] [Scilit]
  29. Holden, S.T.; Deininger, K.; Ghebru, H. Impacts of low-cost land certification on investment and productivity. Am. J. Agric. Econ. 2009, 91, 359–373. [Google Scholar] [CrossRef] [Scilit]
  30. Kishindo, P. Customary land tenure and the new land policy in Malawi. J. Contemp. Afr. Stud. 2004, 22, 213–225. [Google Scholar] [CrossRef] [Scilit]
  31. Place, F.; Otsuka, K. Tenure, agricultural investment, and productivity in the customary tenure sector of Malawi. Econ. Dev. Cult. Change 2001, 50, 77–99. [Google Scholar] [CrossRef] [Scilit]
  32. Matchaya, G. Land ownership security in Malawi. Afr. J. Agric. Res. 2009, 4, 1–13. [Google Scholar]
  33. Holden, S.; Kaarhus, R.; Lunduka, R. Land Policy Reform: The Role of Land Markets and Women’s Land Rights in Malawi; Report; Noragric: Ås, Norway, 2006. [Google Scholar]
  34. Zuka, S.; Matinga, B. Customary Land Reform and Institutional Change in Malawi: The Case of Customary Land Act. In Proceedings of the Conference on Land Policy in Africa, Addis Ababa, Ethiopia, 10–13 November 2016. [Google Scholar]
  35. McFadden, D. Conditional logit analysis of qualitative choice behavior. In Frontiers in Econometrics; Academic Press: Cambridge, MA, USA, 1974; pp. 105–142. [Google Scholar]
  36. Rosenbaum, P.R. Observational Studies; Springer: New York, NY, USA, 1995. [Google Scholar]
  37. Rosenbaum, P.R.; Rubin, D.B. The central roles of the propensity score in observational studies for causal effects. Biometrika 1983, 70, 41–55. [Google Scholar] [CrossRef] [Scilit]
  38. Guo, S.; Fraser, M.W. Propensity Score Analysis: Statistical Methods and Applications; SAGE Publications: Thousand Oaks, CA, USA, 2010. [Google Scholar]
  39. Imbens, G.W.; Rubin, D.B. Causal Inference for Statistics, Social, and Biomedical Sciences: An Introduction; Cambridge University Press: Cambridge, UK, 2015. [Google Scholar]
  40. Pangapanga-Phiri, I.; Mungatana, E.D. Adoption of climate-smart agricultural practices and their influence on the technical efficiency of maize production under extreme weather events. Int. J. Disaster Risk Reduct. 2021, 61, 102322. [Google Scholar] [CrossRef] [Scilit]
  41. Tufa, A.H.; Alene, A.D.; Manda, J.; Akinwale, M.G.; Chikoye, D.; Feleke, S.; Wossen, T.; Manyong, V. The productivity and income effects of adoption of improved soybean varieties and agronomic practices in Malawi. World Dev. 2019, 124, 104631. [Google Scholar] [CrossRef] [Scilit]
  42. Mgomezulu, W.R.; Edriss, A.-K.; Machira, K.; Pangapanga Phiri, I. Towards sustainability in the adoption of sustainable agricultural practices: Implications on household poverty, food and nutrition security. Innov. Green Dev. 2023, 2, 100054. [Google Scholar] [CrossRef] [Scilit]
  43. Tione, G.; Tveitereid Westengen, O.; Holden, S.T.; Katengeza, S.P.; Makate, C. Contribution of community seed banks to farmer seed systems and food security in Northern and Central Malawi. Food Policy 2025, 133, 102792. [Google Scholar] [CrossRef] [Scilit]
  44. Rosenbaum, P.R.; Rubin, D.B. Assessing sensitivity to an un-observed binary covariate in an observational study with binary outcome. J. R. Stat. Soc. Ser. B (Methodol.) 1983, 45, 212–218. [Google Scholar] [CrossRef] [Scilit]
  45. Lokshin, M.; Sajaia, Z. Maximum likelihood estimation of endogenous switching regression models. Stata J. 2004, 4, 282–289. [Google Scholar] [CrossRef] [Scilit]
  46. Wooldridge, J.M. Introductory Econometrics: A Modern Approach, 6th ed.; Cengage Learning: Mason, OH, USA, 2015. [Google Scholar]
  47. Teklewold, H.; Kassie, M.; Shiferaw, B.; Köhlin, G. Cropping system diversification, conservation tillage and modern seed adoption in Ethiopia: Impacts on household income, agrochemical use and demand for labor. Ecol. Econ. 2013, 93, 85–93. [Google Scholar] [CrossRef] [Scilit]
  48. Khonje, M.G.; Manda, J.; Mkandawire, P.; Tufa, A.H.; Alene, A.D. Adoption and welfare impacts of multiple agricultural technologies: Evidence from eastern Zambia. Agric. Econ. 2018, 49, 599–609. [Google Scholar] [CrossRef] [Scilit]
  49. FAO. Methods for Estimating Comparable Rates of Food Insecurity Experienced by Adults Throughout the World; FAO: Rome, Italy, 2016. [Google Scholar]
  50. Maxwell, D.; Vaitla, B.; Coates, J. How do indicators of household food insecurity measure up? An empirical comparison from Ethiopia. J. Food Policy 2014, 47, 107–116. [Google Scholar] [CrossRef] [Scilit]
  51. Di Falco, S.; Veronesi, M.; Yesuf, M. Does adaptation to climate change provide food security? A micro-perspective from Ethiopia. Am. J. Agric. Econ. 2011, 93, 829–846. [Google Scholar] [CrossRef] [Scilit]
  52. Abdulai, A.; Huffman, W. The adoption and impact of soil and water conservation technology: An endogenous switching regression application. Land Econ. 2014, 90, 26–43. [Google Scholar] [CrossRef] [Scilit]
  53. Gedefaw, A.A. Analysis of the contribution of land registration to sustainable land management in East Gojjam Zone, Ethiopia. Land 2023, 12, 1157. [Google Scholar] [CrossRef] [Scilit]
  54. Samim, S.A.; Deng, X.; Chandio, A.A.; Li, Z. Heterogeneous impacts of land tenure on the adoption intensity of climate smart agricultural practices in small scale farming in Afghanistan. Environ. Dev. Sustain. 2025, 27, 1–31. [Google Scholar] [CrossRef] [Scilit]
  55. Nahayo, A.; Omondi, M.O.; Zhang, X.H.; Li, L.Q.; Pan, G.X.; Joseph, S. Factors influencing farmers’ participation in crop intensification program in Rwanda. J. Integr. Agric. 2017, 16, 1406–1416. [Google Scholar] [CrossRef] [Scilit]
  56. Faye, B.; Du, G.; Li, Y.; Li, Q.; Diène, J.C.; Mbaye, E.; Kama, R. Connecting the farmers’ knowledge and behaviors: Detection of influencing factors to sustainable cultivated land protection in Thiès Region, Senegal. J. Rural Stud. 2025, 116, 103634. [Google Scholar] [CrossRef] [Scilit]
  57. Lovo, S. Tenure insecurity and investment in soil conservation. Evidence from Malawi. World Dev. 2016, 78, 219–229. [Google Scholar] [CrossRef] [Scilit]
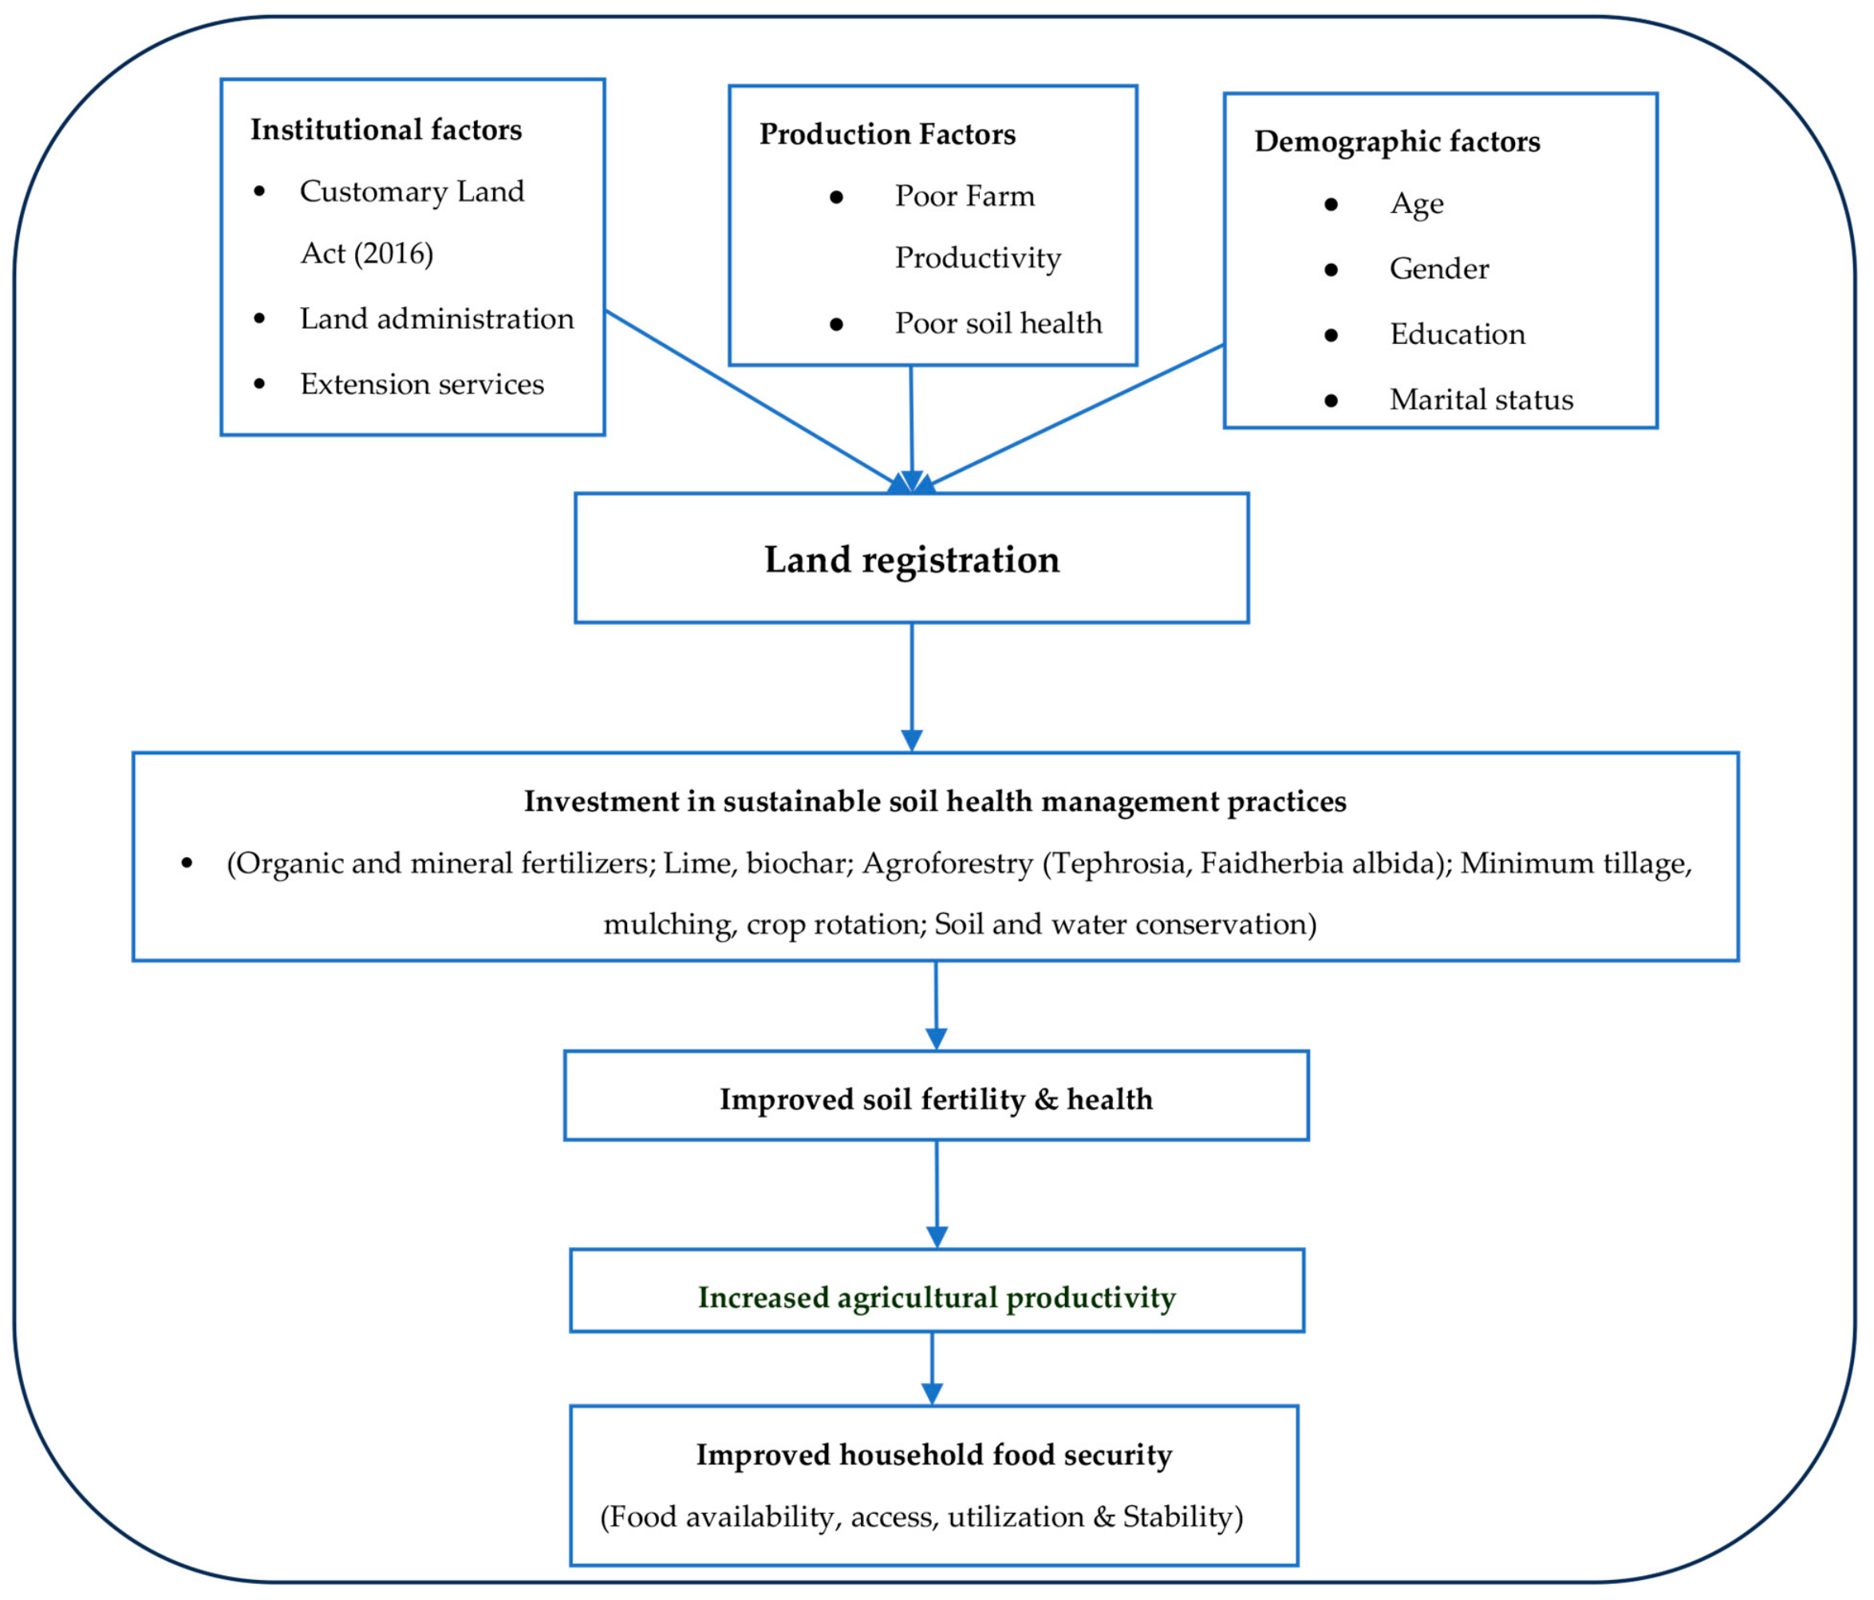
Figure 1. Conceptual Framework; source (Authors). Note that the relationships presented in the figure are only presented as linear for simplicity, but we acknowledge that they are non-linear in practice.
Sustainability 18 09145 g001
Figure 2. Average treatment effects on the treatment of land registration on soil health restoration and food security.
Sustainability 18 09145 g002
Table 1. Variable description and Measurement.
Variable NameVariable DescriptionMeasurement
Household & socio-demographic characteristics
AgeAge of the household head in yearsContinuous (years)
GenderGender of the household headBinary (1 = male, 0 = female)
Literacy in ChichewaWhether the household head can read or write in the local languageBinary (1 = yes, 0 = no)
Literacy in EnglishWhether the household head can read or write in EnglishBinary (1 = yes, 0 = no)
EducationHighest class of education attained by the household headyears of schooling)
Household sizeNumber of persons living in the same houseContinuous (count)
Farmer group membershipWhether the household head is a member of any farmers’ group, association, or companyBinary (1 = yes, 0 = no)
Solar panelWhether the household owns a solar panel (proxy for household asset wealth)Binary (1 = yes, 0 = no)
Land sizeSize of the household’s main land parcelContinuous (hectares)
Land tenure and registration
Land registrationWhether the household has formally registered its main land parcel under the Customary Land Act (2016)Binary (1 = registered, 0 = not registered)
Legal recognitionFarmer’s perception that land registration confers legal ownershipBinary (1 = yes, 0 = no)
Reduce land disputesFarmer’s perception that land registration reduces the risk of land disputes, eviction, and expropriationBinary (1 = yes, 0 = no)
Willingness to investFarmer’s perception that land registration encourages investment in land due to confidence in future returnsBinary (1 = yes, 0 = no)
Soil health restoration and sustainable land management practices
Vetiver grassWhether the household uses vetiver grass as a soil and water conservation measureBinary (1 = yes, 0 = no)
Crop rotation with legumesWhether the household practices crop rotation with legumesBinary (1 = yes, 0 = no)
Intercropping with legumesWhether the household practices intercropping with legumesBinary (1 = yes, 0 = no)
Minimum tillageWhether the household practices minimum tillageBinary (1 = yes, 0 = no)
Tephrosia vogeliiWhether the household has Tephrosia vogelii as an agroforestry treeBinary (1 = yes, 0 = no)
Faidherbia albidaWhether the household has Faidherbia albida as an agroforestry treeBinary (1 = yes, 0 = no)
Mixture of organic manure and inorganic fertilizerWhether the household applies a mixture of manure and inorganic fertilizer on its main land parcelBinary (1 = yes, 0 = no)
Soil health restoration Composite variable constructed from adoption of soil amendments, agroforestry, and conservation practicesBinary (1 = If farmer practices all three categories, 0 = no)
Food security outcomes
WDDSWomen’s Dietary Diversity ScoreContinuous (0–10 food groups)
CDDSChildren’s Dietary Diversity ScoreContinuous (0–10 food groups)
HFIASHousehold Food Insecurity Access ScaleContinuous (0–27)
HFIESHousehold Food Insecurity Experience Scale (FAO Voices of the Hungry protocol)Continuous/Ordinal (1–8)
Table 2. Descriptive statistics 1.
Variable Name Variable Description Total (N = 506) (100%)Land Registered (n = 325) (63%)Did not Register the Land
(n = 181)
(37%)
Test
AgeAge of the household head in years46.866 (15.475)47.588 (15.311)45.569 (15.724)0.160
GenderGender of the household head0.806 (0.396)0.806 (0.396)0.806 (0.397)0.987
Literacy in ChichewaIf the household head can read or write in the Local language0.711 (0.454)0.754 (0.431)0.635 (0.483)0.005
Literacy in EnglishIf the household head can read or write in English0.190 (0.392)0.231 (0.422)0.116 (0.321)0.002
EducationThe highest class of education that the household head reached5.374 (3.412)5.794 (3.415)4.619 (3.284)0.000
Household sizeNumber of persons living in the same house5.318 (1.766)5.391 (1.795)5.188 (1.712)0.216
Household incomeTotal household income in the last 12 months765,145.652 (87,120)862,652.574 (117,860) 651,804.274 (129,187) 0.228
Farmer group Is the household head a member of any farmers’ group, association, or company?0.350 (0.478)0.414 (0.493)0.238 (0.427)0.000
Solar PanelDo you have a solar panel?0.359 (0.480)0.352 (0.478)0.372 (0.485)0.655
Land sizeThe land size of the main land parcel 2.558 (1.843)2.906 (2.018)1.933 (1.259)0.000
Vetiver grassIf the household has vetiver grass as a soil and water conservation measure0.690 (0.463)0.748 (0.435)0.586 (0.494)0.000
Crop rotation with legumesIf the household practices crop rotation with legumes0.486 (0.500)0.540 (0.499)0.389 (0.489)0.000
Intercropping with legumesIf the household practices intercropping with legumes0.310 (0.463)0.336 (0.473)0.261 (0.440)0.080
Minimum tillageIf the household practices minimum tillage0.062 (0.240)0.043 (0.204)0.094 (0.293)0.022
TephrosiaIf the household has Tephrosia as an agroforestry tree0.032 (0.177)0.044 (0.206)0.011 (0.105)0.044
Faidherbia albidaIf the household has Faidherbia albida as an agroforestry tree0.224 (0.417)0.256 (0.437)0.167 (0.374)0.021
Mixture of Organic Manure and inorganic fertilizerIf the household applies a mixture of manure and inorganic fertilizer on their main land parcel0.213 (0.410)0.243 (0.430)0.160 (0.368)0.029
Soil ErosionIs soil erosion a major problem on this plot0.443 (0.497)0.403 (0.491)0.514 (0.501)0.016
Access to extension and advisory services Access to extension advisory1.147 (0.354)1.123 (0.329)1.189 (0.393)0.047
Farmer organisation If the farmer uses the farmer organization as a source of extension and advisory services0.144 (0.352)0.124 (0.330)0.188 (0.392)0.082
Household Food Insecurity Access ScaleHousehold Food Insecurity Access Scale11.093 (7.567)9.560 (6.980)13.845 (7.816)0.000
Household Dietary Diversity Score Household Dietary Diversity Score for children under 5 years3.327 (1.748)3.656 (1.888)2.826 (1.374)0.000
Household Dietary Diversity Score Household Dietary Diversity Score for women aged 18 to 64 years4.140 (1.964)4.474 (2.087)3.553 (1.569)0.000
Household Food Insecurity Experience ScaleHousehold Food Insecurity Experience Scale5.200 (2.977)4.778 (3.088)5.956 (2.607)0.000
1 Standard errors in parentheses.
Table 3. Weak instrument and endogeneity test.
TestStatisticp-Value
ARChi2 (3) =11.630.000
WaldChi2 (3) = 33.140.000
Table 4. Results from endogenous switching regression models.
HFIASHFIESCDDSWDDSSoil Health Restoration
Age of household head0.0117 **0.0115 **0.0100 *0.0099 *0.0107 *
(0.005)(0.005)(0.005)(0.005)(0.005)
Gender of household head−0.1865−0.1712−0.0439−0.0434−0.1712
(0.202)(0.198)(0.191)(0.192)(0.200)
Literacy in English0.06210.11410.11650.11590.1434
(0.224)(0.228)(0.222)(0.224)(0.241)
Education0.03710.02570.03050.03060.0285
(0.031)(0.031)(0.031)(0.031)(0.031)
Household size−0.0478−0.0514−0.0472−0.0476−0.0545
(0.042)(0.044)(0.042)(0.042)(0.043)
Farmer group0.2797 *0.3106 *0.3094 *0.3083 *0.3022 *
(0.165)(0.168)(0.161)(0.162)(0.168)
Land size0.1220 ***0.1422 ***0.1355 ***0.1355 ***0.1526 ***
(0.045)(0.054)(0.045)(0.045)(0.049)
Crop rotation with legumes0.4898 ***0.4680 ***0.5839 ***0.5844 ***0.4669 ***
(0.155)(0.161)(0.157)(0.157)(0.160)
Intercropping with legumes0.6697 ***0.7514 ***0.8387 ***0.8376 ***0.7711 ***
(0.184)(0.187)(0.185)(0.187)(0.191)
Vetiver Grass0.3301 **0.3288 **0.3305 **0.3312 **0.3294 **
(0.154)(0.156)(0.155)(0.155)(0.159)
Faidherbia albida−0.10680.0126−0.0005−0.00130.0035
(0.196)(0.196)(0.185)(0.185)(0.197)
Mixture of Manure and fertilizer−0.0587−0.1147−0.0482−0.0503−0.1261
(0.213)(0.208)(0.203)(0.203)(0.216)
Presence of organisms in the soil−0.0948−0.0799−0.1917−0.1926−0.0517
(0.463)(0.501)(0.486)(0.487)(0.485)
Soil erosion0.18890.16110.19630.19520.1495
(0.154)(0.161)(0.156)(0.157)(0.160)
Soil quality −0.1750−0.1737−0.1942 *−0.1938 *−0.1817
(0.112)(0.115)(0.109)(0.109)(0.117)
Flooding−0.1161−0.0886−0.1369−0.1364−0.0973
(0.158)(0.160)(0.157)(0.157)(0.166)
Access to climate services0.21730.19300.11810.11660.1853
(0.179)(0.177)(0.174)(0.174)(0.179)
Legal recognition0.5462 ***0.4801 ***0.4783 ***0.4803 ***0.5056 ***
(0.159)(0.158)(0.156)(0.158)(0.164)
Reduce land disputes0.8152 ***0.7543 ***0.6977 ***0.7029 ***0.7662 ***
(0.147)(0.154)(0.152)(0.153)(0.153)
Willingness to invest0.6826 **
(0.320)
lnsigma01.8717 ***−4.5110 *−5.3981 *−3.5365 ***−1.9977 ***
(0.056)(2.492)(3.110)(1.067)(0.678)
lnsigma11.6784 ***−0.7981 ***−4.7541 ***−4.1658 ***−3.2447 ***
(0.027)(0.152)(0.949)(0.859)(0.485)
athrho0−0.6635 *−1.5350 ***1.4084 ***−1.6009 ***−1.7711 ***
(0.348)(0.429)(0.305)(0.196)(0.678)
athrho10.1274−0.0696−1.5836 ***−1.6786 ***−1.7462 **
(0.362)(0.602)(0.356)(0.471)(0.837)
Constant−1.6340 ***−1.5420 **−1.3799 **−1.3776 **−1.5110 **
(0.615)(0.657)(0.638)(0.639)(0.641)
Wald chi72.923588.926957.886461.449849.1404
Prob > chi20.00000.00000.00000.00000.0001
Observations512512512512512
Standard errors in parentheses; * p < 0.10, ** p < 0.05, *** p < 0.01.
Disclaimer/Publisher’s Note: The statements, opinions and data contained in all publications are solely those of the individual author(s) and contributor(s) and not of MDPI and/or the editor(s). MDPI and/or the editor(s) disclaim responsibility for any injury to people or property resulting from any ideas, methods, instructions or products referred to in the content.