Article

Romanian Tourists’ Attitudes Towards the Oltenia Region Ecotourism in the Context of Sustainable Territorial Development

by
Alexandra-Lucia Zaharia
1,
Ionuț-Adrian Drăguleasa
2,*,
Amalia Niță
1,* and
Daniel Simulescu
1
1
Geography Department, Faculty of Sciences, University of Craiova, 13 A. I. Cuza Street, 200585 Craiova, Romania
2
Laboratory for Research in Applied Geography, Center of Interdisciplinary Research in Sciences, Tourism and Territorial Analysis, Faculty of Sciences, University of Craiova, 13 A. I. Cuza Street, 200585 Craiova, Romania
*
Authors to whom correspondence should be addressed.
Sustainability 2026, 18(17), 8989; https://doi.org/10.3390/su18178989
Submission received: 30 June 2026 / Revised: 22 August 2026 / Accepted: 29 August 2026 / Published: 2 September 2026
(This article belongs to the Special Issue Advancing Sustainable Resources Management)

Abstract

National parks, such as Domogled-Valea Cernei and Cozia, alongside protected areas like the Mehedinți Plateau Geopark or the Field of Lapiezuri in Ponoare, represent key assets for attracting tourists interested in nature and sustainability. This study investigates how tourists perceive sustainable ecotourism in Romania’s South-West Oltenia Region and identifies the primary determinants of their travel preferences. Specifically, it examines shifts in destination choices, the orientation toward safer and more sustainable locations, and changes in trip frequency and duration. Data were collected between June and December 2025 via a structured questionnaire administered to 500 visitors to these protected areas. To test the research hypotheses, the data were analyzed using multiple statistical methods, including regression analysis, the Chi-square test, an independent-samples t-test, Pearson correlation, and Analysis of Variance (ANOVA). The statistical results largely confirmed the proposed hypotheses. Notably, a significant relationship between tourist age and visit frequency was identified, indicating distinct behavioral patterns across age groups. Furthermore, perceptions of service quality varied significantly by gender, highlighting divergent experiences and expectations between male and female visitors.

1. Introduction

The global COVID-19 pandemic delivered a severe shock to the tourism, hospitality, and ecotourism sectors [1,2,3], negatively impacting the practice of sustainable ecotourism while altering tourist preferences and behaviors [4,5,6]. In the post-SARS-CoV-2 pandemic context, the demand for nature (outdoor) activities in protected areas, peri-urban forests, and spa areas has increased considerably [7,8,9] because tourists want to escape crowded areas [10,11,12]. Outdoor activities—such as hiking, climbing, cycling, biodiversity exploration, and foraging for medicinal plants—provide visitors to protected areas with opportunities to relieve stress, get physical exercise, and increase their emotional well-being [13]. These benefits are becoming increasingly vital as individuals seek safe, invigorating ways to escape the pressures of travel restrictions, quarantine, mandatory mask use, and border closures. The COVID-19 pandemic has highlighted the importance of natural environments, such as protected areas and national and natural parks, as sanctuaries for mental health; thus, many tourists and visitors have turned to the natural environment for physical and mental recovery [14] as well as relaxation, rest, and rejuvenation [15].
The primary objective of ecotourism development is to protect natural areas and their floristic and faunal biodiversity [16]. Consequently, it is crucial to safeguard ecosystems while minimizing threats that could adversely affect protected environments [17,18,19]. To this end, ecotourism is the only form of travel that supports the conscious conservation of cultural–historical resources and nature while having a lower impact on tourists relative to other forms of tourism and financially benefitting the host (local) population [20].
Protected areas (PAs) serve a dual purpose regarding resource valorization: first, they are the primary mechanism for conserving regional floral and faunal biodiversity; second, they contribute significantly to local community well-being [21,22]. Indeed, PAs provide extensive socio-ecological benefits, including physical health improvement [23,24], mental health enhancement [25], and social and cultural enrichment [26,27]. In this context, ecotourism functions as a pivotal mediator between protected environments and local populations, offering tangible economic advantages such as attracting investment, creating jobs, and generating supplementary income through the sale of traditional products and handicrafts. When managed sustainably, ecotourism serves as a vital tool for achieving multiple Sustainable Development Goals (SDGs) by promoting natural resource conservation, green marketing strategies [28,29], job creation, and sustainable production and consumption patterns [30].
Tourists’ and visitors’ perceptions of the development of ecotourism and their behaviors play a fundamental role in the sustainable development of protected areas post-COVID-19 pandemic [31]. Also, the local community’s perceptions of the impact of ecotourism in the Simien Mountains National Park in Ethiopia, for instance, have favorable social, economic, and environmental impacts, with significant differences depending on certain research variables, such as the gender, education, and locations of tourists [32]. Research has shown that residents and tourists’ perceptions of authenticity and values greatly influence their intention to revisit the Qilian Mountains National Park in China and the way they behave regarding the environment (i.e., whether their behaviors are responsible), highlighting a very positive perception of the development of ecotourism and its benefits [33]. On the other hand, Yang et al. (2023) found that residents and ecotourists’ perceptions have a weak impact on ecological and environmental protection policies [34].
According to recent findings, the development of ecotourism in Nepal’s Jagadishpur Reservoir is viewed favorably by both local communities and visitors for its potential to support local livelihoods and protect biodiversity, with landscape aesthetics and researcher-led birdwatching highlighted as primary attractions [35]. Similar patterns have emerged in Turkey, where forest villagers support expanding ecotourism mainly because of the economic and income-generating opportunities it creates [36]. Regarding community priorities, Trišić et al. (2023) demonstrated that residents rank ecological integrity and socio-cultural preservation as the most critical foundations for long-term sustainable tourism [37]. In a related study on “Rusanda” Nature Park in Serbia, Trišić et al. (2023) further emphasized that residents and visitors identify ecotourism as a highly viable strategy, operating synergistically alongside scientific, wellness, rural, wine, and nature-based tourism [38].
The diversity of resources and scenic landscapes in the protected areas of the South-West Oltenia Region provides a clear advantage for developing various sustainable tourism models suited to all age groups. Effective ecotourism planning should build on this foundation through targeted updates, such as aligning marketing efforts with current traveler demands [39] and upgrading equipment for outdoor activities like hiking, cycling, mountaineering, and paragliding, while ensuring strict measures are in place to prevent ecological damage [40,41,42]. Maintaining key infrastructure—including mountain trails, emergency refuges, and information centers—remains equally important, alongside the use of modern tools such as QR-code signboards that provide on-site details for visitors. Ultimately, these natural and cultural sites act as central features of the region, drawing international tourists while highlighting the destination’s broader environmental and historical significance [43].
In the South-West Oltenia region, rich natural landscapes, distinct biodiversity, and valuable cultural heritage form a strong foundation for ecotourism development. Protected areas—including Domogled-Valea Cernei National Park, Cozia National Park, the Mehedinți Plateau Geopark, and the Câmpul de Lapiezuri natural reserve—serve as key assets for nature-oriented and eco-conscious travelers. Realizing this potential, however, requires clearer insight into visitor preferences and perceptions, particularly given shifting travel behaviors following the pandemic. Accordingly, in this study, we examine how tourists perceive sustainable ecotourism across South-West Oltenia and seek to identify the main factors driving their choices.
This study includes twelve research hypotheses because it investigates tourists’ attitudes towards ecotourism from a multidimensional perspective. Rather than examining a single determinant, the study considers the influence of several socio-demographic characteristics (gender, age, education, labor market status, residential environment, region of residence, and income), together with behavioral and perceptual factors related to ecotourism. Each hypothesis addresses a distinct relationship derived from the literature and is tested using the statistical method most appropriate for the measurement level pertaining to the variables involved. Consequently, the set of hypotheses provides a comprehensive framework for explaining tourists’ attitudes and behaviors towards ecotourism in the South-West Oltenia Region.

2. Materials and Methods

2.1. Study Area

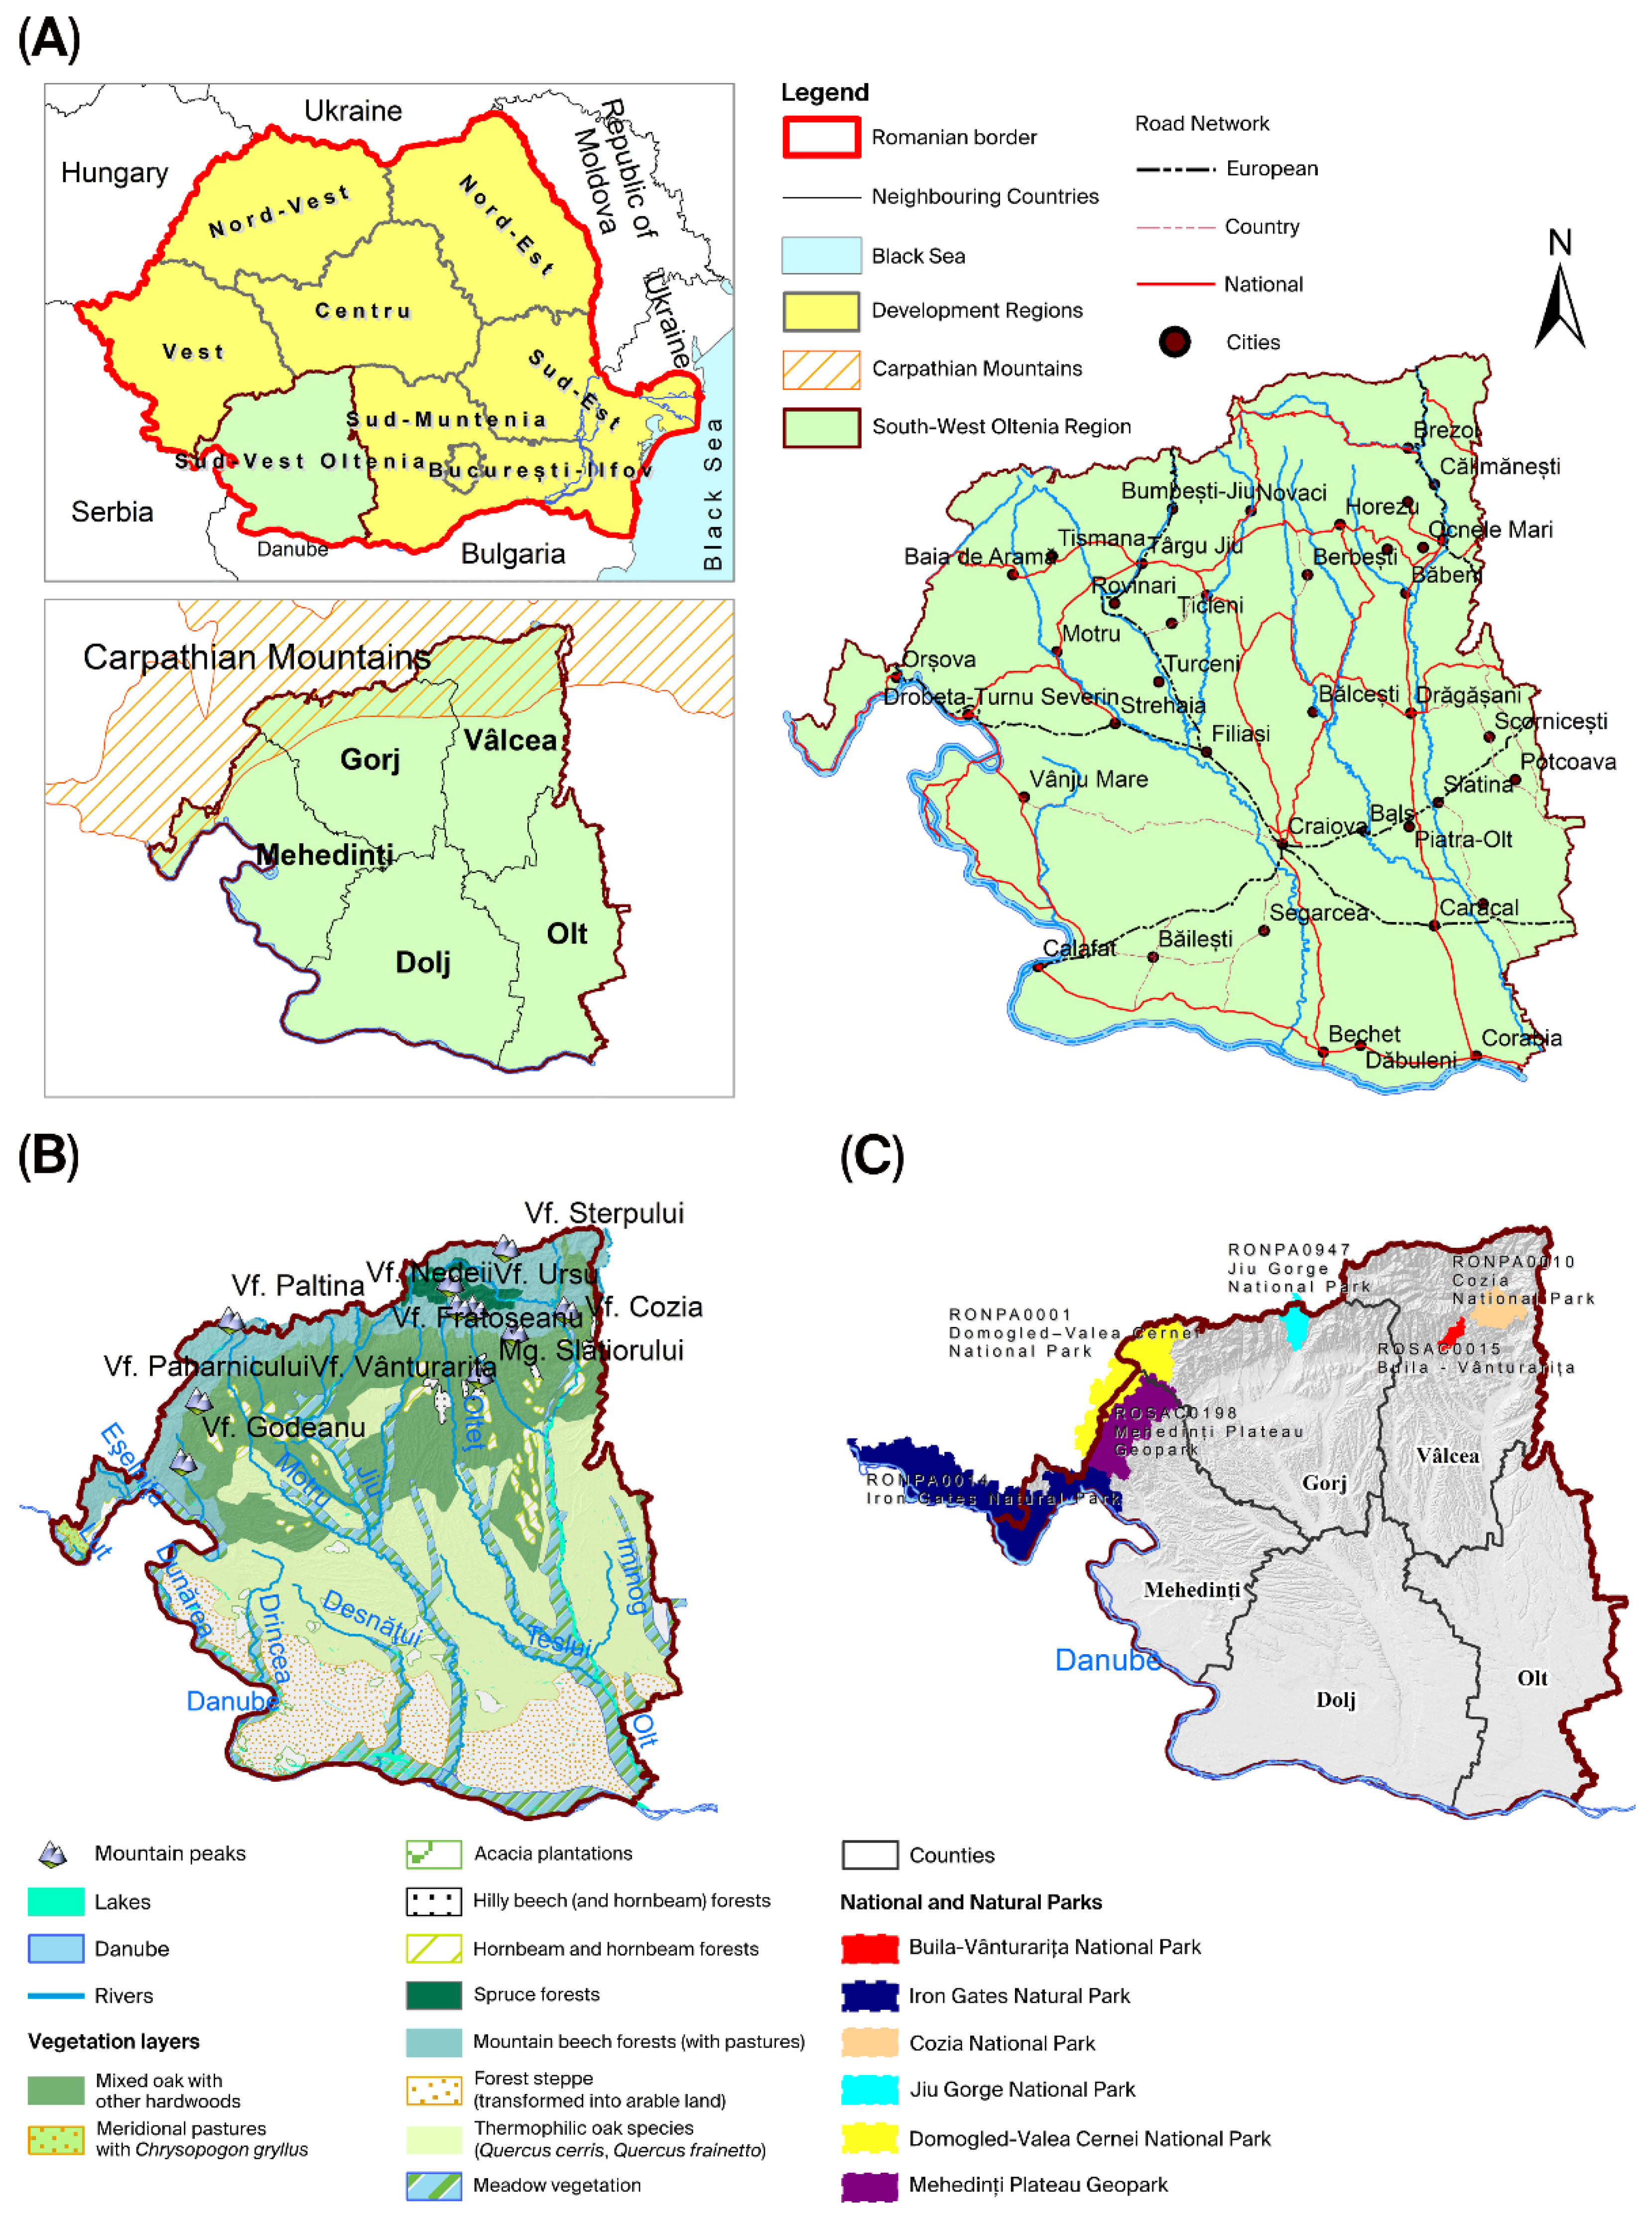
The South-West Oltenia region (Figure 1A) includes Dolj, Olt, Vâlcea, Gorj, and Mehedinți counties, which were the basis for the political and administrative entity of Romania.
Demographic data from the National Institute of Statistics (NIS) show that the resident population of the South-West Oltenia Region was 1,848,028 as of 1 January 2025, reflecting a decline of 7669 residents relative to 2024 [44].
In terms of physical geography, vegetation in Oltenia follows a distinct altitudinal gradient dictated by the regional topography, which descends from northern mountain ranges—such as Parâng, Retezat-Godeanu, and Căpățânii—to the southern Danube Plain. Given that peak elevations exceed 2400 m, the highest vegetation zone consists of mountain beech forests interspersed with high-altitude meadows and spruce forests (Figure 1B). In the ecological literature, national parks are recognized as the primary framework for nature conservation [45]. Their appeal lies in scenic landscapes, exceptional natural and cultural–historical assets, and a balanced integration of environmental components, including relief, climate, hydrography, soils, and flora. Consequently, several researchers view national parks as vital long-term investments for future generations aimed at mitigating anthropogenic pressures on protected ecosystems.
Currently, the South-West Oltenia Region encompasses four national parks and two natural parks (Figure 1C): Cozia National Park, Buila-Vânturarița National Park, Jiu Gorge National Park, Domogled-Valea Cernei National Park, Mehedinți Plateau Geopark, and Iron Gates Natural Park. Among these, Buila-Vânturarița National Park is the smallest national park in Romania, covering an area of 4186 hectares.
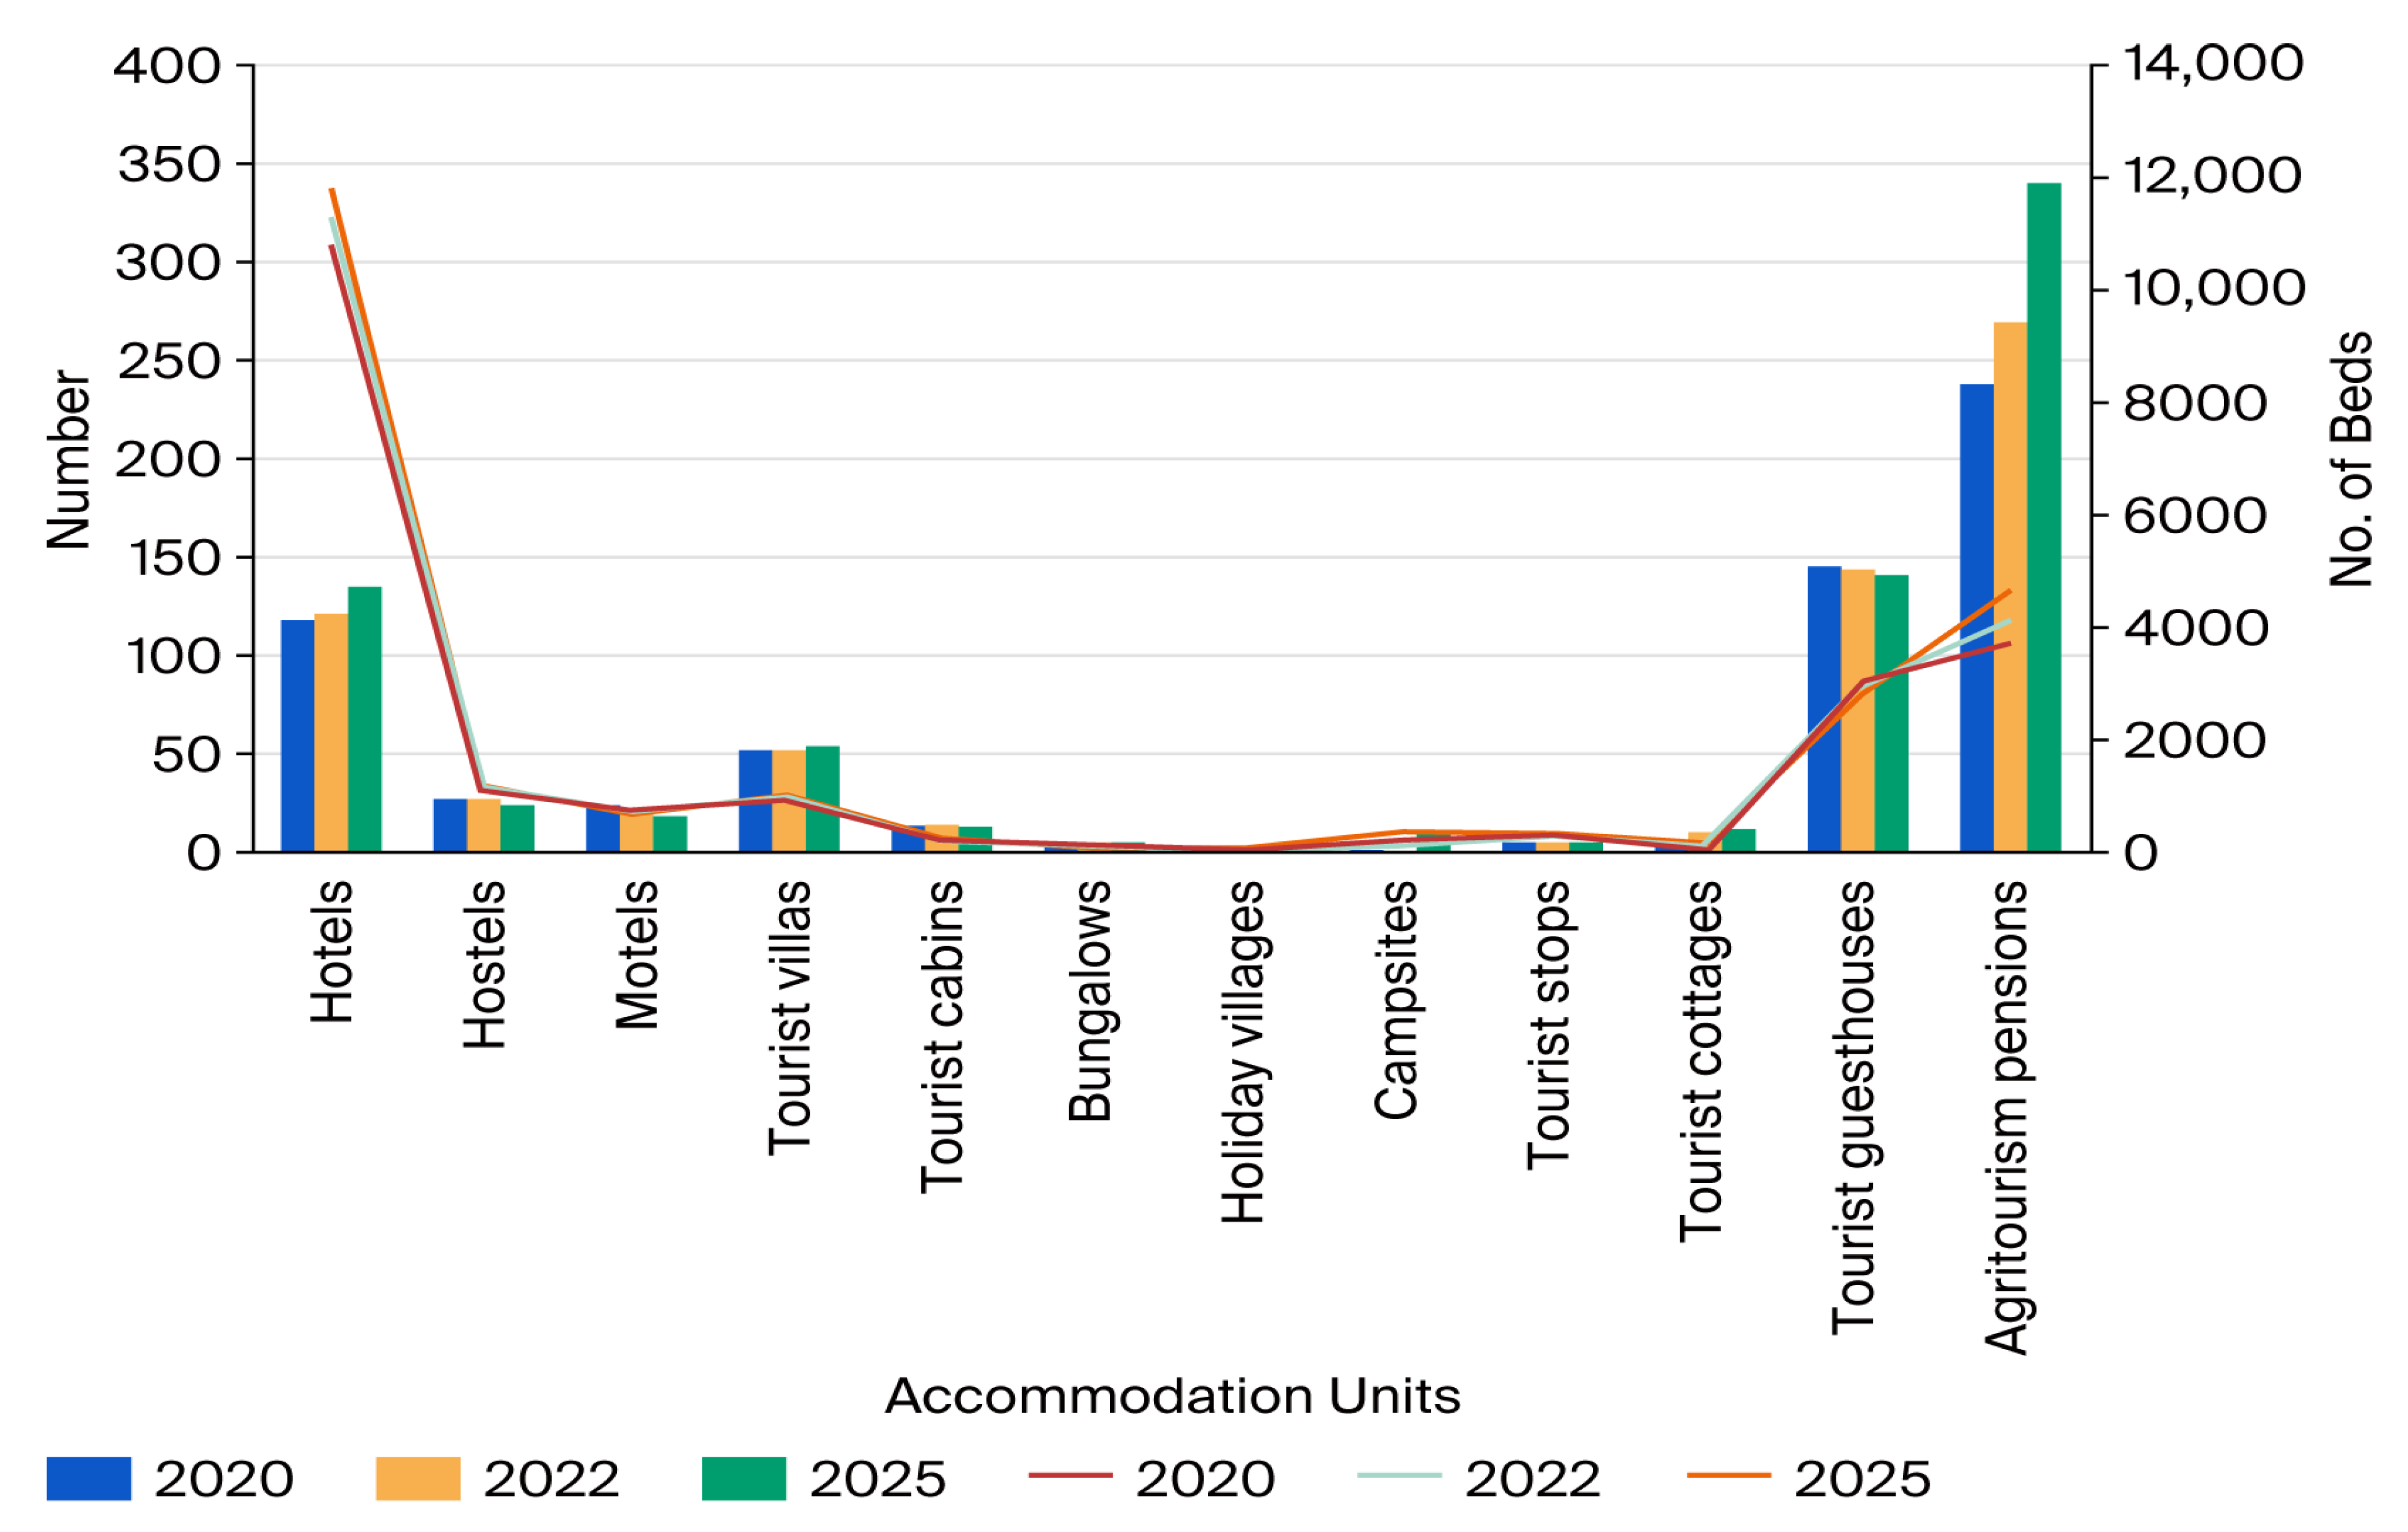
An analysis of tourist accommodation capacity across key benchmark years—2020 (pre-pandemic), 2022 (during the height of the COVID-19 pandemic), and 2025 (a period of sectoral recovery)—reveals that agritourism guesthouses were the only type of accommodation to maintain continuous growth. Specifically, their numbers expanded from 238 establishments in 2020 to 340 in 2025, marking an addition of 102 units (Figure 2).
Recent studies suggest that this expansion reflects both operational resilience during crises and a shift in post-pandemic traveler preferences toward alternative, low-density options like agritourism and rural guesthouses over conventional hotels, hostels, and motels [46,47]. This trend highlights a growing demand for authentic rural tourism experiences across the region.
Regarding the current accommodation capacity of active tourism establishments, the number of hotel beds has steadily increased: from 11,158 in 2020 to 11,433 in 2022 and 11,951 in 2025. A similar positive trend can be observed in the agritourism guesthouse sector, where capacity grew from 3720 beds in 2020 to 4155 in 2022, reaching 4705 in 2025.

2.2. Data Sources and Methodology

In this study, we examine the post-COVID-19 pandemic period’s impact on travel behavior and interest in ecotourism, aiming to highlight emerging opportunities for sustainable development within the regional tourism sector. The key aspects investigated include shifts in travel preferences, the orientation toward safer and more sustainable destinations, and changes in trip frequency and duration. To process the survey data, a range of statistical techniques were employed using Statistical Package for the Social Sciences (IBM SPSS Statistics), version 22.0. We selected techniques that matched the nature of the variables and the specific hypotheses formulated. These analytical methods included independent-samples t-tests, one-way ANOVA, Chi-square tests of independence, Pearson correlation analyses, and linear regression models. Based on a structured questionnaire administered to a sample of 500 respondents between June and December 2025, the findings offer a comprehensive perspective of post-pandemic tourist behavior. We used a varied set of statistical methods, with each selected according to the specifics of the hypotheses formulated and the nature of the data collected. These methods include the independent-samples t-test, ANOVA, Chi-square test, Pearson correlation, and regression analysis. Next, we will detail the theoretical foundations of these methods, their relevance to this study, and how they were applied.
The t-test is used to compare the means of two independent groups in order to determine whether there is a statistically significant difference between them. The null hypothesis (H0) assumes that the means of the two groups are equal, while the alternative hypothesis (H1) suggests there is a significant difference [48]. The conditions of application include normality of distribution and homogeneity of variances, which are evaluated using the Levene test. This method is useful in analyzing binary categorical variables, such as gender, in relation to continuous variables such as the desire to practice ecotourism.
ANOVA is used to compare the means of multiple groups to assess whether the differences observed between groups are statistically significant [49]. The null hypothesis (H0) states that all group means are equal, while the alternative hypothesis (H1) suggests that at least one group differs significantly. One-way ANOVA is applicable when one has a categorical variable (age, education level, etc.) and a continuous dependent variable (e.g., length of visits).
The Chi-square (χ2) test is used to analyze the association between categorical variables. It determines whether the observed frequencies in a contingency table differ significantly from those expected under the null hypothesis [50]. It is a suitable method for nominal or ordinal variables, such as labor market status and post-pandemic travel frequency. The results include the Chi-square value and its significance, indicating the existence or absence of a relationship.
The Pearson correlation measures the strength and direction of the linear relationship between two continuous variables [51]. The value of the Pearson coefficient (r) ranges from −1 to 1, where values close to −1 indicate a strong inverse relationship, and values close to 1 indicate a strong direct relationship. The statistical significance of the correlation is tested to determine whether the identified relationship can be generalized to the reference population.
Regression analysis is used to evaluate the relationship between one or more independent variables (predictors) and a continuous dependent variable [48]. The simple linear regression model is expressed by the equation
Y = β 0 + β 1 X + ϵ
where Y is the dependent variable, X is the predictor, β 0 is the intercept, β 1 is the regression coefficient, and ϵ is the error.
Regression analysis allows quantification of the impact of predictors on the dependent variable and estimation of the statistical significance of the relationship.
Table 1 presents the hypothesis, main indicators, and statistical methods used in this research.
Table 1 outlines the alignment between the research hypotheses, key indicators, and statistical methods applied in the testing procedure. Analytical techniques were selected on the basis of the types of variables and specific operational objectives: independent-samples t-tests were conducted to compare means between two independent groups; one-way ANOVA was utilized for comparisons across multiple groups; Chi-square tests of independence were used to assess associations between categorical variables; Pearson correlation was used to evaluate linear relationships between continuous variables; and simple linear regression analyses were performed to determine the predictive influence of independent variables on target outcomes.
Coding procedures and measurement scales were structured such that they matched the operational nature of each variable, ensuring data consistency and enabling appropriate statistical testing for the proposed hypotheses.
The empirical analysis incorporated three distinct sets of variables: socio-demographic, behavioral, and perception-based indicators. The socio-demographic metrics encompassed gender, age, education level, employment status, residential area, region of residence, and net monthly income. The behavioral metrics evaluated travel frequency, length of stay in protected areas, transport modes, destination selection, and budget allocation for ecotourism offerings. Perception-based metrics were captured using five-point Likert scales, measuring respondents’ motivation to engage in ecotourism, perceived feasibility of ecotourism activities, destination selection criteria, and satisfaction levels regarding natural resources and tourism infrastructure.
Table 2 presents the complete variable framework, detailing measurement scales, coding protocols, and their corresponding research hypotheses.
Table 3 presents the descriptive statistics of the main variables included in the empirical analysis. All variables were measured on the basis of 500 valid responses. The results reveal high mean scores for the desire to practice ecotourism (mean = 4.63; SD = 0.591), satisfaction with tourism resources (mean = 4.57; SD = 0.680), and destination selection criteria (mean = 4.49; SD = 0.878), suggesting there were generally positive attitudes towards ecotourism among the respondents. In contrast, the perceived possibility of practicing ecotourism had a moderate average value (mean = 2.60; SD = 1.136), while the average duration of visits to protected areas (mean = 0.79; SD = 0.735), post-pandemic travel frequency (mean = 1.94; SD = 0.903), monthly net income (mean = 1.34; SD = 1.234), and the budget allocated to ecotourism products (mean = 0.19; SD = 0.494) reflect the coding scales applied in the questionnaire rather than absolute quantitative measures. Overall, these descriptive statistics provide an overview of the central tendency and variability in the principal research variables and constitute the basis for the subsequent inferential statistical analyses.

3. Results and Discussion

3.1. Respondents’ Profiles

Analyzing the respondents’ demographic and socio-economic characteristics offers key insights into sample diversity and helps explain how these background variables shape attitudes toward sustainable ecotourism. The collected dataset encompasses a broad range of individual profiles, detailing gender, age, educational attainment, employment status, residential area, region of origin, and net monthly income.
Of the 500 respondents, a clear majority (77%) identified as female, while 22% identified as male, and 1% declined to state their gender. This gender disparity suggests a higher level of engagement or willingness among female participants to complete the survey, which may subtly influence overall perceptions of ecotourism given gender-based differences in environmental priorities and values.
Regarding age distribution, respondents over 60 years old constitute the largest group (51%), followed by those aged 26–40 (23%). The remaining cohorts—41–60-year-olds (16%) and 18–25-year-olds (10%)—are less represented. This concentration indicates older adults’ greater willingness to participate in survey research or a stronger affinity for ecotourism activities within this demographic. Additionally, this pattern may reflect broader regional travel trends, wherein ecotourism aligns particularly well with the preferences of mature visitors.
Furthermore, an overwhelming 92% of the respondents reported holding higher-education degrees (bachelor’s, master’s, or doctorate). By contrast, other education levels represented a minor share: 5% of the respondents only completed high school, 2% attended post-secondary programs, and less than 1% attained only lower levels of secondary education. This high-educational-attainment profile likely enhanced the respondents’ awareness of sustainability principles, fostering a stronger appreciation for tourism models centered on natural and cultural heritage preservation.
The labor market status results reflect a predominance of active people: 56% of the respondents were employees, and 33% were students. Other categories are represented in smaller proportions, such as people who are both employees and students (4%), retirees (4%), self-employed (1%), entrepreneurs (1%) and unemployed (below 1%). This profile indicates significant engagement in activity, either professional or educational, which could influence tourism preferences and motivations regarding choosing ecotourism destinations.
Regarding area of residence, 73% of the respondents lived in urban areas, while 27% came from rural areas. This disproportion highlights a significant concentration of respondents from urban areas, suggesting that the urban population shows a greater interest in ecotourism or that the questionnaire was more accessible in urban areas.
Regarding regions of origin, most of the respondents came from the South-West Oltenia Region (38%), followed by the Bucharest-Ilfov Region (26%) and the North-East Region (13%). Other regions were less represented, such as the North-West Region (7%), the South-East Region (5%), the South-Muntenia Region (4%), the West Region (4%), and the Center Region (3%). This distribution can be explained by the relevance of the South-West Oltenia Region as a tourist destination of interest in the context of this research as well as the possibility of accessing participants in these areas.
The majority of the respondents (73%) declared a monthly net personal income below 1281 lei, which suggests a preponderance of people with low incomes. Other income ranges were significantly less represented, such as 3001–4000 lei (13%), 1282–2000 lei (10%), and 2001–3000 lei (4%), while only one respondent declared an income above 4001 lei. This distribution may influence perceptions of the accessibility of ecotourism as well as decisions related to spending associated with this type of tourism.

3.2. Analysis of Research Results

Analyzing research results is an essential step in validating formulated hypotheses and acquiring a comprehensive understanding of the phenomenon studied. In this research, specific statistical methods were applied, such as the t-test, ANOVA, the Chi-square test, Pearson correlation, and linear regression analysis, each selected according to the typology of the variables involved in the study and the objectives pursued. The results obtained were interpreted in the context of the specialized literature, providing a perspective on tourists’ perceptions of sustainable ecotourism post-COVID-19 pandemic in the South-West Oltenia region. These analyses highlight the significant relationships between the demographic, economic, and behavioral variables pertaining to the respondents and provide concrete answers to the research hypotheses.
H1. 
Gender influences the desire to practice ecotourism.
Our research hypothesis that gender influences the motivation to engage in ecotourism builds upon the established literature documenting gender-based variations in environmental attitudes and travel behaviors. Previous empirical studies indicate that women frequently demonstrate higher levels of environmental concern and a stronger inclination toward ecotourism activities than men. For instance, Balińska et al. (2024) [52] observed that female Generation Z respondents exhibited significantly more favorable attitudes toward ecotourism and greater participation intent compared to their male counterparts. Grounded in these insights, this study hypothesizes that gender similarly shapes the desire to participate in ecotourism within the Oltenia Region.
The descriptive analysis indicated that women had a slightly higher mean score for the desire to practice ecotourism relative to men. To determine whether this difference was statistically significant, an independent-samples t-test was performed.
The t-test analyzing the influence of gender on the desire to practice ecotourism indicated that the variability between groups was different, as shown by the Levene Test for equality of variances, with an F-value of 14.507 and a significance level of p = 0.000, indicating that the hypothesis of equality of variances must be rejected (Table 4).
For the t-test, when equality of variances was assumed, the t-value was 1.683 with 493 degrees of freedom and a significance level of p = 0.093. The mean difference between groups was 0.106, with a 95% confidence interval between −0.018 and 0.230. When inequality of variance was assumed, the t-value was 1.403 with 140.805 degrees of freedom, and the significance level p = 0.163, with the same mean difference of 0.106 and a 95% confidence interval between −0.043 and 0.256 (Table 4).
The results show that there are no statistically significant differences between genders in terms of willingness to practice ecotourism, as the p-values are greater than the significance threshold of 0.05.
H2. 
Age influences the duration of visits to protected areas.
Our research hypothesis that age influences the duration of visits to protected areas was formulated on the basis of observations reported in the literature, which indicate that tourism preferences and behavior differ significantly across generations. Previous studies have highlighted that young people, especially those from the Millennial generation, prefer shorter but more frequent visits, while people from older age groups tend to allocate more time to recreational activities, including ecotourism [53].
Also, according to research conducted by Kolster et al. (2025), older visitors are more likely to appreciate nature-related activities and spend more time in protected areas [54]. Based on this evidence, the research hypothesis was formulated to analyze whether there are significant age-based differences in the duration of visits.
To examine whether the duration of visits to protected areas differs across age groups, a one-way ANOVA was conducted. The assumption of homogeneity of variances was satisfied prior to testing (Levene’s test: F = 0.060, and p = 0.981), confirming that the dataset fulfilled the necessary requirements for standard ANOVA execution.
The ANOVA results show that there are statistically significant differences between age categories in terms of the duration of visits to protected areas, with an F value = 8.000 and a significance level p = 0.000 (p < 0.05). The variability between groups is represented by a sum of squares of 12.439 and a mean of squares of 4.146, and the variability within groups is represented by a sum of squares of 257.089 and a mean of squares of 0.518. The total variability is 269.528 (Table 5). These results validate the hypothesis that age influences the duration of visits to protected areas.
H3. 
Tourists’ levels of education affect perceptions of the possibility of practicing ecotourism.
Our research hypothesis that tourists’ levels of education affect perceptions of the possibility of practicing ecotourism was substantiated by previous research showing that education plays a significant role in shaping attitudes towards sustainable tourism. Studies have shown that individuals with higher levels of education have a more comprehensive understanding of the positive impact of ecotourism on the environment and local communities [55].
Education also increases awareness of the need to conserve natural resources and increases confidence in the benefits of ecotourism with respect to sustainable development [56,57]. This hypothesis was formulated to explore whether there are significant differences in perceptions of practicing ecotourism depending on tourists’ levels of education.
To examine whether perceptions of the possibility of practicing ecotourism differed according to the respondents’ education levels, a one-way ANOVA was performed. It showed no statistically significant differences in how the respondents rated the possibility of practicing ecotourism across education levels (F = 1.204, p = 0.308) (Table 6). With a p > 0.05, we could not reject the null hypothesis. The data indicate that a tourist’s level of education has no real bearing on whether they see ecotourism as a viable option.
The F value obtained was 1.204, with a significance level of p = 0.308. Since p > 0.05 (Table 6), the null hypothesis, which stated that there would be no significant differences between the education groups, could not be rejected. Thus, the results suggest that level of education does not influence perceptions of the possibility of practicing ecotourism.
H4. 
Labor market status influences post-pandemic travel frequency.
Our hypothesis that labor market status influences post-pandemic travel frequency was formulated on the basis of research indicating that professional involvement and financial stability are determinants of tourism behavior. Studies show that employees and entrepreneurs travel more frequently because they have more financial resources and opportunities to relax during vacations [58]. In contrast, unemployed or retired people tend to have more restricted tourism behaviors, being constrained by limited income [59].
The results of the Chi-square test show a significant association between labor market status and post-pandemic travel frequency. The Pearson Chi-Square value is 37.220, and the associated significance (p = 0.005) indicates that the relationship between the two variables is statistically significant at a 95% confidence level. Also, the Likelihood Ratio result, with a value of 37.775 and p = 0.004, supports this conclusion. The linear association between the two variables is marginally significant, with a value of 3.887 and p = 0.049 (Table 7).
The results of the symmetric association measures indicate that there is a significant relationship between labor market status and post-pandemic travel frequency.
The Phi value is 0.273, suggesting there is a moderate-intensity association between the two variables.
The Cramer’s V value is 0.158, indicating a moderately weak association.
Both values are statistically significant, with a significance level of p = 0.005, indicating that the association between the variables is not random.
The hypothesis that labor market status influences post-pandemic travel frequency can thus be confirmed.
H5. 
Residential environment influences preferences regarding means of transport in protected areas.
Our hypothesis that residential environments influence preferences regarding means of transport in protected areas was based on observations that rural and urban residents have different levels of access to means of transport as well as distinct priorities in their choices. Studies have revealed that urban residents prefer fast and convenient means of transport, such as personal cars or airplanes, because of their hectic lifestyles and greater access to infrastructure [60].
In contrast, people in rural areas may opt for public transport or buses, especially because of financial limitations and reduced access to modern infrastructure [61].
This hypothesis is important for understanding how residential environments influence tourist behaviors, especially in the context of ecotourism.
The results of the Chi-square test for the association between residential environments and transportation preferences yielded a Pearson Chi-Square value of 7.737, with 3 degrees of freedom (df) and an associated significance (Asymp. Sig.) of 0.052 (Table 8). This value is very close to the significance threshold of 0.05, but does not exceed it, suggesting that there is no statistically significant association at the 95% confidence level between residential environments and transportation preferences.
The Likelihood Ratio test yielded a value of 9.637, with the same statistical significance of 0.022, which may suggest a weak but significant association between the variables. The Linear-by-Linear Association yielded a value of 4.194 and a significance level of 0.041, indicating a significant linear relationship. In total, 500 valid cases were analyzed, confirming that all available data were used in this analysis.
The results of the symmetric association measures for the relationship between residential environments and transportation preferences yielded a Phi coefficient value of 0.124, with a significance level of 0.052. This result indicates there is a weak association between the variables, and the p-value above the 0.05 threshold suggests that this association is not statistically significant at a 95% confidence level.
The Cramer’s V coefficient, which evaluates the strength of the relationship between the two variables, has the same value of 0.124 and a significance level of 0.052, confirming that the link between residential environments and transportation preferences is weak and statistically insignificant.
The hypothesis that residential environments influence preferences for means of transportation cannot be confirmed, as the results of the association measures (Phi and Cramer’s V) have significance values (p = 0.052) higher than the 0.05 threshold, indicating that the relationship between the two variables is not statistically significant.
H6. 
Region of residence influences the choice of tourist destination post-pandemic.
Our hypothesis that region of residence influences tourist-destination choice post-pandemic is based on the observation that regional factors, such as geographical proximity, accessibility, and cultural preferences, play essential roles in tourists’ decision to choose certain destinations. Previous research has shown that residents of regions close to mountains or the coast are more likely to prefer regional tourist destinations, while people from more remote regions frequently opt for foreign destinations [62,63].
The COVID-19 pandemic altered tourist preferences, driving interest toward closer and safer destinations from a health perspective—a trend that varies across regions of residence [64,65]. Testing this hypothesis helps clarify regional tourism dynamics and provides a foundation for adjusting local marketing strategies.
Overall, the Pearson Chi-Square test confirmed that region of residence significantly influences post-pandemic destination choices.
The symmetric association measures for the relationship between region of residence and post-pandemic tourist destinations yielded a Phi coefficient value of 0.340 and an associated p-value of 0.001 (Table 9), indicating a moderate association between the two variables and statistical significance.
The Cramer’s V coefficient value is 0.170, which is also statistically significant (p = 0.001), confirming the existence of a relationship between the variables analyzed. Thus, the results suggest that there is a significant association between region of residence and preferences regarding post-pandemic tourist destinations.
H7. 
Monthly net income influences the budget allocated for eco-tourism products.
Our hypothesis that monthly net income influences the budget allocated for eco-tourism products is based on observations indicating that income level plays a crucial role in shaping consumer behavior, including in the field of eco-tourism. Studies show that people with higher incomes are more willing to allocate more generous budgets for eco-tourism products, considering their quality and sustainability to be priorities [66].
Eco-tourism products are often more expensive because of environmentally friendly practices and strict sustainability standards, making them more accessible to middle- and high-income groups [67]. Following the pandemic, higher-income travelers have shown stronger interest in sustainable tourism, preferring high-quality experiences over mass travel [68].
The Pearson Correlation results indicate that there is a very weak positive correlation between monthly net income and the budget allocated for ecological tourism products (r = 0.052). This correlation is statistically insignificant since the value associated with the probability (p = 0.248) is higher than the conventional significance threshold of 0.05 (Table 10). Thus, we cannot conclude that there is a significant relationship between monthly net income and the budget allocated for ecological tourism products.
H8. 
Practicing ecotourism in protected areas influences satisfaction with tourism resources.
Our hypothesis that practicing ecotourism in protected areas influences satisfaction with tourism resources is based on the premise that tourists’ involvement in ecotourism activities leads to a deeper appreciation of the value and quality of natural resources.
According to recent studies, ecotourism experiences favor the direct connection of visitors with natural and cultural environments, leading to a positive perception of them [69,70].
Also, practicing ecotourism involves tourists’ participation in activities that emphasize sustainability and conservation, thereby increasing levels of satisfaction with tourist facilities and resources [71]. In addition, protected and preserved tourist resources within ecotourism create an authentic experience, improving visitors’ perceptions of the quality and uniqueness of these destinations [72,73].
The results of the t-test indicate the following (Table 11):
According to the Levene test, homogeneity of variances was not met, since the F value is 14.977 and the associated significance (Sig.) is 0.000 (less than 0.05). Therefore, the t-test results are used for the case where the variances are not equal.
The t-test for independent-samples shows a statistically significant difference between the two groups. The t-value is 7.968, with a degree of freedom (df) of 44.980, and the significance (Sig. 2-tailed) is 0.000, indicating a significant difference between the means at a confidence level of 95%.
The mean difference between the two groups is 1.0382, and the confidence interval for this difference is between 0.7757 and 1.3006, confirming the significance of the difference.
Our hypothesis that practicing ecotourism in protected areas influences satisfaction with tourism resources can be accepted because the difference between the groups that practice and do not practice ecotourism is statistically significant (p = 0.000).
H9. 
The desire to practice ecotourism influences the duration of visits to protected areas.
Our hypothesis that the desire to practice ecotourism influences the duration of visits to protected areas is based on the premise that a greater interest in ecotourism is associated with deeper involvement and a more extensive allocation of time for exploring natural resources. Studies show that tourists who show an increased desire to participate in ecotourism activities tend to plan longer visits to benefit from a complete experience in protected areas [74,75].
Also, the desire to understand and experience nature sustainably leads tourists to spend more time in locations that promote ecotourism, thus giving them the opportunity to interact more closely with its specific elements [76,77].
Research indicates that this correlation can be explained by the sustainability and conservation values associated with ecotourism, which require commitment and dedicated time [78,79].
The summary of the regression model shows that there is a positive, but weak, correlation between the desire to practice ecotourism and the duration of visits to protected areas, as indicated by the correlation coefficient R = 0.176. The R Squared coefficient (R2) value is 0.031, which means that only 3.1% of the variation in the duration of visits can be explained by the desire to practice ecotourism.
The Adjusted R Squared value, 0.029, confirms that the model explains a similar proportion of the variation, taking into account the adjustment for the number of variables.
The standard error of the estimate is 0.724, indicating the average deviation of the model predictions from the observed values. These results suggest that the relationship between the variables is significant, but of low intensity.
The results of the coefficients in the regression model indicate that the intercept has a value of −0.229, which suggests that when the willingness to practice ecotourism is 0, the duration of visits to protected areas would have this theoretical value. However, this value is not statistically significant (p = 0.372), which means that the intercept does not contribute significantly to the model (Table 12).
The regression coefficient for willingness to practice ecotourism is 0.220, indicating that a one-unit increase on the willingness scale corresponds to a 0.220-unit increase in visit duration. This coefficient reached statistical significance (p < 0.001), indicating that there is a real relationship between motivation to practice ecotourism and the length of visits. Meanwhile, the standardized Beta value of 0.176 points to a positive, though relatively weak, association between the two variables.
H10. 
The possibility of practicing ecotourism influences the frequency of post-pandemic travel.
Our hypothesis that the possibility of practicing ecotourism influences the frequency of post-pandemic travel is based on the premise that the accessibility of ecotourism activities and the specific infrastructure for ecotourism can influence tourists’ travel behavior.
Studies suggest that tourists are more likely to travel frequently to places that offer clear and attractive opportunities to practice ecotourism, especially in the context of post-pandemic concerns related to safety, sustainability, and social distancing [80,81].
Furthermore, perceptions of the possibility of carrying out ecotourism activities are often associated with overall satisfaction and the intention to repeat the tourist experience [82,83,84]. In the context of the COVID-19 pandemic, the increased interest in nature-based tourism is considered an emerging trend, suggesting there is a direct link between the possibilities offered by ecotourism and the frequency of travel [85,86].
The regression model yielded a correlation coefficient (R) value of 0.055, which indicates an extremely weak relationship between the possibility of practicing ecotourism and the frequency of post-pandemic travel.
The value of the R Squared coefficient (0.003) shows that only 0.3% of the variation in travel frequency can be explained by the possibility of practicing ecotourism. The Adjusted R Squared value, 0.001, confirms that the model does not significantly improve the prediction of travel frequency.
The standard error of the estimate (0.903) suggests a high variability in travel frequency in relation to the predictor. Thus, the model cannot explain the relationship between the variables in a significant manner.
The model-constant value is 2.053, which indicates the average frequency of post-pandemic trips when the possibility of practicing ecotourism is zero.
The coefficient of the variable “possibility of practicing ecotourism” is −0.044, suggesting there is a weak inverse relationship between the possibility of practicing ecotourism and the frequency of engaging in post-pandemic trips. However, this coefficient is not statistically significant, with a p-value of 0.217 (p > 0.05), indicating that the independent variable does not have a significant impact on the dependent variable (Table 13). The results suggest that our hypothesis that the possibility of practicing ecotourism influences the frequency of post-pandemic trips is not supported.
H11. 
Destination selection criteria influence satisfaction with tourist facilities.
Our hypothesis that destination selection criteria influence satisfaction with tourist facilities is based on the observation that tourists select destinations based on factors such as proximity, cost, service quality, and specific tourist offerings. Research shows that these criteria are correlated with perceptions of overall satisfaction, and choosing destinations that meet tourists’ expectations contributes to a positive experience [87,88].
Furthermore, the assessment of satisfaction with tourist facilities directly reflects the extent to which these expectations are met or exceeded [89,90]. The importance ascribed to selection criteria is also influenced by previous experiences, income level, and tourist typology [91,92].
In the context of the pandemic, factors such as safety and accessibility have become essential in making travel decisions, underlining the relevance of this hypothesis.
The summary results of the regression model show that the R Squared value is 0.010, which indicates that only 1% of the variation in satisfaction with tourist facilities is explained by the criteria for choosing destinations.
The adjusted R Squared value is 0.008, which confirms that this predictor has an almost insignificant influence on the dependent variable. The Std. Error of the Estimate, with a value of 0.8187, indicates considerable variability in the observed values that is not explained by the model.
The results of the regression model coefficients show that the intercept (constant) is 2.857, which represents the average value of satisfaction with tourist facilities when the criteria for choosing destinations are equal to zero.
The unadjusted coefficient for the criteria for choosing destinations is 0.095, indicating that for each unit of increase in this predictor, satisfaction with tourist facilities increases on average by 0.095 (Table 14). The standardized value of the coefficient (Beta) is 0.101, suggesting a weak positive relationship between the variables.
The t-test associated with the predictor coefficient is 2.271, with a significance level (Sig.) of 0.024, indicating that this relationship is statistically significant at a threshold of 0.05.
H12. 
The importance of tourism services influences satisfaction with tourism resources.
Our hypothesis that the importance of tourism services shapes satisfaction with natural and cultural resources stems from past research showing that service quality drives overall destination appraisals. High-quality services—including accommodation, infrastructure, guided tours, and on-site facilities—play a direct role in delivering a positive visitor experience [93,94].
Furthermore, tourists’ satisfaction with an ecotourism destination’s natural and cultural assets depends heavily on the degree to which supporting services make these resources accessible and usable [95,96,97]. In ecotourism settings, service quality also signals environmental responsibility and sustainability, reinforcing the relevance of this hypothesis [98].
This coding allows direct interpretation of the relationship between the perceived importance of tourism services and the level of satisfaction with tourism resources, providing a solid basis for applying statistical analyses, such as Pearson correlation, to assess the direction and strength of the relationship between these variables.
The results of the Pearson correlation indicate that there is a weak but statistically significant positive relationship between the importance of tourism services and satisfaction with tourism facilities (r = 0.179, p < 0.001) (Table 15). This finding suggests that as respondents consider tourism services to be more important, their satisfaction with tourism facilities tends to increase slightly. The statistical significance (p < 0.001) confirms that this relationship is not random. The total number of cases analyzed was 500.


4. Conclusions

This study explored the factors that influence tourists’ perceptions, preferences, and behaviors related to sustainable ecotourism. The statistical analysis yielded important conclusions in terms of understanding the tourism phenomenon in the post-pandemic context. Gender does not significantly influence the desire to practice ecotourism, and level of education is not associated with the perception of the possibility of practicing ecotourism. In contrast, age is a significant factor influencing the duration of visits to protected areas, and labor market status was found to be associated with the frequency of post-pandemic travel.
In addition, the results revealed that there were no significant links between a respondent’s residential environment and their choice of transportation. By contrast, region of origin clearly shaped post-pandemic destination choices, indicating the need for regionally tailored tourism strategies. Surprisingly, monthly net income showed no meaningful correlation with the budget set aside for ecotourism products, suggesting that financial constraints may not be the primary hurdle in this regard.
On the experiential side, actively participating in ecotourism had a strong, positive effect on how tourists rated natural and cultural resources, showcasing the value of sustainable travel. A stronger desire to engage in ecotourism also translated into longer stays in protected areas. Lastly, travelers who assigned greater importance to support services reported greater satisfaction with destination resources, underscoring the role that service quality plays in shaping the overall visitor experience.
The conclusions suggest there is a need to develop integrated policies to promote ecotourism in the South-West Oltenia region that respond to the preferences and needs of various categories of tourists. The emphasis should be placed on diversifying offers, investing in ecotourism infrastructure, and ecological education, all of which contribute to increasing the sustainability of tourism in the region.
Ecotourism offers a path towards protecting natural environments while driving economic and social progress for local communities. Integrating sustainable practices allows destinations to leverage their natural and cultural assets responsibly while meeting modern travelers’ expectations. This shift matches a broader global demand for authentic experiences—those centered on preserving biodiversity, safeguarding cultural heritage, and minimizing ecological footprints. Overall, these findings fulfill the study’s core objective: pinpointing what drives Romanian tourists’ attitudes toward ecotourism in South-West Oltenia. The data show that traveler behavior stems from a mix of socio-demographic traits, travel habits, and personal perceptions rather than any single factor. Examining these variables together provides a clearer picture of what fuels sustainable travel habits, offering solid empirical grounding for targeted ecotourism strategies.
On a practical level, the results offer clear takeaways for regional authorities, Destination Management Organizations (DMOs), and park administrators. One-size-fits-all marketing is ineffective in this context; policy and promotion need to reflect the distinct preferences of different visitor segments. Targeted investments in sustainable infrastructure, educational programming, better service quality, and resource conservation can boost visitor satisfaction while keeping regional destinations competitive in the long run.
While centered on South-West Oltenia, these patterns likely hold true for other regions with protected natural spaces, rich biodiversity, and developing ecotourism sectors. As a result, the strategies outlined here can guide similar regions trying to balance ecological preservation with tourism growth, adding practical and academic value beyond this single case study.
By grounding tourist attitudes and behaviors in concrete data from South-West Oltenia, this study adds useful empirical evidence to the broader literature on sustainable travel, providing a dependable basis for future destination planning.
A few limitations are worth noting. First, the cross-sectional survey design captures tourist perceptions at a single moment in time. Second, the exclusive focus on South-West Oltenia reduces the direct applicability of the results to other regions. Future research could expand into other Romanian or European destinations, track behavioral shifts over time through longitudinal studies, and incorporate additional variables—like environmental awareness, destination image, digital service availability, or climate change concerns—to build a more comprehensive model of ecotourism growth.

Author Contributions

Conceptualization, A.-L.Z., A.N., I.-A.D., and D.S.; methodology, I.-A.D., A.-L.Z. and A.N.; software, I.-A.D., A.N. and A.-L.Z.; validation, I.-A.D., A.-L.Z., A.N. and D.S.; formal analysis, I.-A.D., A.N. and A.-L.Z.; investigation, A.-L.Z., A.N., I.-A.D. and D.S.; resources, I.-A.D., A.-L.Z. and A.N.; data curation, I.-A.D., A.-L.Z. and A.N.; writing—original draft preparation, I.-A.D., A.-L.Z., A.N. and D.S.; writing—review and editing, I.-A.D., A.-L.Z., A.N. and D.S.; visualization, I.-A.D., A.-L.Z., A.N. and D.S.; supervision, I.-A.D., A.-L.Z. and A.N.; project administration, I.-A.D., A.-L.Z., A.N. and D.S. All authors have read and agreed to the published version of the manuscript.

Funding

This paper was supported by the research fund (50%) of the University of Craiova, Romania.

Institutional Review Board Statement

Ethical review and approval were waived for this study in accordance with the University of Craiova’s institutional guidelines, as the research involved anonymous survey responses and posed minimal risk to participants. According to the university’s Ethics Committee Regulation (2024), this type of research does not require prior ethical approval.

Informed Consent Statement

Informed consent for participation was obtained from all subjects involved in the study.

Data Availability Statement

The original contributions presented in this study are included in the article.

Acknowledgments

The authors are grateful to the anonymous reviewers and editors for their valuable and constructive suggestions, which have significantly improved the quality of this paper.

Conflicts of Interest

The authors declare no conflicts of interest.

Abbreviations

The following abbreviations are used in this manuscript:
PAsProtected Areas
SDGsSustainable Development Goals
GISGeographic Information System (Software)
DMOsDestination Management Organizations
NISNational Institute of Statistics
SPSSStatistical Package for the Social Sciences (Software)

References

  1. Gössling, S.; Schweiggart, N. Two years of COVID-19 and tourism: What we learned, and what we should have learned. J. Sustain. Tour. 2022, 30, 915–931. [Google Scholar] [CrossRef] [Scilit]
  2. Dasan, J.; Ahmedy, F.; Shamsul, S.; Godoong, E.; Sipaut, C.S.; Jeffree, M.S. Post-COVID-19 challenges for a sustainable community-based ecotourism: A case study of rural community in Sabah, North of Borneo. SAGE Open 2022, 12, 2158. [Google Scholar] [CrossRef] [Scilit] [PubMed]
  3. Turtureanu, A.G.; Pripoaie, R.; Cretu, C.M.; Sîrbu, C.G.; Marinescu, E.Ş.; Chiţu, F.; Talaghir, L.G. An exploratory and comparative assessment of the tourist circulation at the level of some countries of the South-Eastern European union in the current pandemic context. Econ. Res.-Ekon. Istraž. 2023, 36, 1–25. [Google Scholar] [CrossRef] [Scilit]
  4. Persada, S.F.; Prasetyo, Y.T.; Maharani, I.G.A.P.; Apriyansyah, B.; Ong, A.K.S.; Young, M.N.; Nadlifatin, R.; Setiyati, E.A.; Shanti, M.; Kumalasari, R.D.; et al. How Tourists Reacted to Ecotourism during COVID-19: Insights on Its Sustainability from a Multivariate Analysis Based on the Case of Banyuwangi. Sustainability 2023, 15, 1440. [Google Scholar] [CrossRef] [Scilit]
  5. Mazilu, M.; Niță, A.; Băbăț, A.; Drăguleasa, I.A.; Grigore, M. Risk and Sustainable tourism resilience in the Post Economic Crisis and COVID-19 pandemic period. Present Environ. Sustain. Dev. 2024, 18, 235. [Google Scholar] [CrossRef] [Scilit]
  6. Jones, E.; Atzori, R.; González, A.F.; Shirsat, A. Starting anew: Ecotourism and resilience principles as a framework for building wildlife destination sustainability in a post-COVID-19 pandemic world. J. Ecotourism 2024, 23, 229–259. [Google Scholar] [CrossRef] [Scilit]
  7. Crețan, R.; Chasciar, D.; Dragan, A. Forests and Their Related Ecosystem Services: Visitors’ Perceptions in the Urban and Peri-Urban Spaces of Timișoara, Romania. Forests 2024, 15, 2177. [Google Scholar] [CrossRef] [Scilit]
  8. Light, D.; Crețan, R.; Chapman, A.; Dragan, A.; Arba-Harambașa, F.Y. Trigger events, moments, and destination evolution in a post-socialist context. Tour. Geogr. 2025, 27, 313–332. [Google Scholar] [CrossRef] [Scilit]
  9. Niță, A.; Drăguleasa, I.-A. Empirical Investigation of the Motivation and Perceptions of Tourists Visiting Spa Resorts in the Vâlcea Subcarpathians, Romania. Sustainability 2025, 17, 6590. [Google Scholar] [CrossRef] [Scilit]
  10. Humagain, P.; Singleton, P.A. Exploring tourists’ motivations, constraints, and negotiations regarding outdoor recreation trips during COVID-19 through a focus group study. J. Outdoor Recreat. Tour. 2021, 36, 100447. [Google Scholar] [CrossRef] [Scilit] [PubMed]
  11. Păcurar, C.M.; Albu, R.-G.; Păcurar, V.D. Tourist Route Optimization in the Context of COVID-19 Pandemic. Sustainability 2021, 13, 5492. [Google Scholar] [CrossRef] [Scilit]
  12. Wendt, M.; Sæþórsdóttir, A.D.; Waage, E.R.H. A Break from Overtourism: Domestic Tourists Reclaiming Nature during the COVID-19 Pandemic. Tour. Hosp. 2022, 3, 788–802. [Google Scholar] [CrossRef] [Scilit]
  13. Coventry, P.A.; Brown, J.V.E.; Pervin, J.; Brabyn, S.; Pateman, R.; Breedvelt, J.; Gilbody, S.; Stancliffe, R.; McEachan, R.; White, P.C.L. Nature-based outdoor activities for mental and physical health: Systematic review and meta-analysis. SSM-Popul. Health 2021, 16, 100934. [Google Scholar] [CrossRef] [Scilit] [PubMed]
  14. Jackson, S.B.; Stevenson, K.T.; Larson, L.R.; Peterson, M.N.; Seekamp, E. Outdoor Activity Participation Improves Adolescents’ Mental Health and Well-Being during the COVID-19 Pandemic. Int. J. Environ. Res. Public Health 2021, 18, 2506. [Google Scholar] [CrossRef] [Scilit] [PubMed]
  15. Dragan, A.; Crețan, R.; Terian, M.I. Landscapes of Watermills: A Rural Cultural Heritage Perspective in an East-Central European Context. Heritage 2024, 7, 4790–4813. [Google Scholar] [CrossRef] [Scilit]
  16. Üzülmez, M.; Ercan İştin, A.; Barakazı, E. Environmental Awareness, Ecotourism Awareness and Ecotourism Perception of Tourist Guides. Sustainability 2023, 15, 12616. [Google Scholar] [CrossRef] [Scilit]
  17. Gössling, S. Ecotourism: A means to safeguard biodiversity and ecosystem functions? Ecol. Econ. 1999, 29, 303–320. [Google Scholar] [CrossRef] [Scilit]
  18. Agyeman, Y.B.; Yeboah, A.O.; Ashie, E. Protected areas and poverty reduction: The role of ecotourism livelihood in local communities in Ghana. Community Dev. 2019, 50, 73–91. [Google Scholar] [CrossRef] [Scilit]
  19. Gligor, V.; Crețan, R.; Nicula, E.A.; Alexe, M.; Nicula, A.S. Assessing multifunctional mountain landscape in an Eastern European framework. Geogr. Res. 2026, 64, e70066. [Google Scholar] [CrossRef] [Scilit]
  20. Almeyda, A.M.; Broadbent, E.N.; Wyman, M.S.; Durham, W.H. Ecotourism impacts in the Nicoya Peninsula, Costa Rica. Int. J. Tour. Res. 2010, 12, 803–819. [Google Scholar] [CrossRef] [Scilit]
  21. Rota, N.; Canedoli, C.; Azzimonti, O.L.; Padoa-Schioppa, E. How Do People Experience the Alps? Attitudes and Perceptions in Two Protected Areas in Italy. Sustainability 2023, 15, 3341. [Google Scholar] [CrossRef] [Scilit]
  22. Sethy, M.K.; Senapati, A.K. Perceptions towards ecotourism practice and the willingness to pay: Evidence from Chilika coastal wetland ecosystem, Odisha. Int. J. Geoherit. Park. 2023, 11, 497–513. [Google Scholar] [CrossRef] [Scilit]
  23. Lemieux, C.J.; Eagles, P.F.J.; Slocombe, D.S.; Doherty, S.T.; Elliott, S.J.; Mock, S.E. Human health and well-being motivations and benefits associated with protected area experiences: An opportunity for transforming policy and management in Canada. Parks 2012, 18, 71–85. [Google Scholar]
  24. Keniger, L.E.; Gaston, K.J.; Irvine, K.N.; Fuller, R.A. What are the Benefits of Interacting with Nature? Int. J. Environ. Res. Public Health 2013, 10, 913–935. [Google Scholar] [CrossRef] [Scilit] [PubMed]
  25. LaPage, W. Pursuing happiness through parks-the obesity argument for continued investment in public parks. Park. Recreat. 2005, 40, 8–13. [Google Scholar]
  26. Romagosa, F.; Eagles, P.F.; Lemieux, C.J. From the inside out to the outside in: Exploring the role of parks and protected areas as providers of human health and well-being. J. Outdoor Recreat. Tour. 2015, 10, 70–77. [Google Scholar] [CrossRef] [Scilit]
  27. Oldekop, J.A.; Holmes, G.; Harris, W.E.; Evans, K.L. A global assessment of the social and conservation outcomes of protected areas. Conserv. Biol. 2016, 30, 133–141. [Google Scholar] [CrossRef] [Scilit] [PubMed]
  28. Hornoiu, R.; Tănase, O.M.; Nistoreanu, P. Ecorom—Indicators system proposal of quality certification in ecotourism. Amfiteatru Econ. J. 2009, 11, 330–338. Available online: https://hdl.handle.net/10419/168672 (accessed on 3 June 2026).
  29. Nistoreanu, P.; Aluculesei, A.-C.; Avram, D. Is Green Marketing a Label for Ecotourism? The Romanian Experience. Information 2020, 11, 389. [Google Scholar] [CrossRef] [Scilit]
  30. Romeo, R.; Russo, L.; Parisi, F.; Notarianni, M.; Manuelli, S.; Carvao, S. Mountain Tourism—Towards a More Sustainable Path; Food and Agriculture Organization (FAO): Rome, Italy, 2021. [Google Scholar] [CrossRef] [Scilit]
  31. Oltean, F.D.; Curta, P.A.; Nagy, B.; Huseyn, A.; Gabor, M.R. Changes in Tourists’ Perceptions of Community-Based Ecotourism (CBET) After COVID-19 Pandemic: A Study on the Country of Origin and Economic Development Level. ISPRS Int. J. Geo-Inf. 2025, 14, 146. [Google Scholar] [CrossRef] [Scilit]
  32. Meretu, T.A.; Abebe, E.T.; Gessese, G.M. A Tale of Two Worlds: Community perceptions on ecotourism impacts in the World Heritage Site of the Simien Mountains National Park. Preprints 2023, 2023040776. [Google Scholar] [CrossRef] [Scilit]
  33. Wang, Y.; Zhao, R.; Yan, Z.; Wang, M.; Pan, Y.; Wu, R. A comparative study of environmental responsibility behavior in ecotourism from the perceptions of residents and tourists: A case of Qilian Mountains National Park in China. PLoS ONE 2023, 18, e0281119. [Google Scholar] [CrossRef] [Scilit] [PubMed]
  34. Yang, L.; Hu, X.; Lee, H.M.; Zhang, Y. The Impacts of Ecotourists’ Perceived Authenticity and Perceived Values on Their Behaviors: Evidence from Huangshan World Natural and Cultural Heritage Site. Sustainability 2023, 15, 1551. [Google Scholar] [CrossRef] [Scilit]
  35. Aryal, B.; Chhetri, V.T.; Khanal, P. Perception of local people and visitors towards ecotourism development in Jagadishpur reservoir. Int. J. Environ. 2022, 11, 71–85. [Google Scholar] [CrossRef] [Scilit]
  36. Gültekin, Y.S. Ecotourism through the perception of forest villagers: Understanding via mediator effects using structural equation modeling. Environ. Sci. Pollut. Res. 2022, 29, 70899–70908. [Google Scholar] [CrossRef] [Scilit] [PubMed]
  37. Trišić, I.; Stanić Jovanović, S.; Štetić, S.; Nechita, F.; Candrea, A.N. Satisfaction with Sustainable Tourism—A Case of the Special Nature Reserve “Meadows of Great Bustard”, Vojvodina Province. Land 2023, 12, 1511. [Google Scholar] [CrossRef] [Scilit]
  38. Trišić, I.; Privitera, D.; Ristić, V.; Štetić, S.; Stanić Jovanović, S.; Nechita, F. Measuring Residents’ and Visitors’ Satisfaction with Sustainable Tourism—The Case of “Rusanda” Nature Park, Vojvodina Province. Sustainability 2023, 15, 16243. [Google Scholar] [CrossRef] [Scilit]
  39. Encalada, L.; Boavida-Portugal, I.; Cardoso Ferreira, C.; Rocha, J. Identifying Tourist Places of Interest Based on Digital Imprints: Towards a Sustainable Smart City. Sustainability 2017, 9, 2317. [Google Scholar] [CrossRef] [Scilit]
  40. Koemle, D.B.A.; Morawetz, U.B. Improving mountain bike trails in Austria: An assessment of trail preferences and benefits from trail features using choice experiments. J. Outdoor Recreat. Tour. 2016, 15, 55–65. [Google Scholar] [CrossRef] [Scilit]
  41. Figueiredo, E. Imagine there’s no rural: The transformation of rural spaces into places of nature conservation in Portugal. Eur. Urban Reg. Stud. 2008, 15, 159–171. [Google Scholar] [CrossRef] [Scilit]
  42. Padoa-Schioppa, E.; Baietto, M. Effects of tourism pressure on herd composition in the Sherpa villages of Sagarmatha National Park (Everest, Nepal). Int. J. Sustain. Dev. World Ecol. 2008, 15, 412–418. [Google Scholar] [CrossRef] [Scilit] [PubMed]
  43. Popescu, L.; Albă, C.D.; Mazilu, M.; Șoșea, C. ‘Should I Go or Should I Stay?’ Why Do Romanians Choose the Bulgarian Seaside for Their Summer Holiday? Sustainability 2023, 15, 11802. [Google Scholar] [CrossRef] [Scilit]
  44. National Institute of Statistics. TEMPO Online. Available online: http://statistici.insse.ro:8077/tempo-online/#/pages/tables/insse-table (accessed on 18 May 2026).
  45. Oleśniewicz, P.; Pytel, S.; Markiewicz-Patkowska, J.; Szromek, A.R.; Jandová, S. A Model of the Sustainable Management of the Natural Environment in National Parks—A Case Study of National Parks in Poland. Sustainability 2020, 12, 2704. [Google Scholar] [CrossRef] [Scilit]
  46. Gordan, M.-I.; Peț, E.; Popescu, G.; Brad, I.; Milin, A.I.; Adamov, T.C.; Ciolac, R.; Pascariu, A.R.; Iancu, T. Factors Influencing the Accommodation Prices of Romanian Rural Tourism. Sustainability 2023, 15, 191. [Google Scholar] [CrossRef] [Scilit]
  47. Gordan, M.-I.; Popescu, C.A.; Călina, J.; Adamov, T.C.; Mănescu, C.M.; Iancu, T. Spatial Analysis of Seasonal and Trend Patterns in Romanian Agritourism Arrivals Using Seasonal-Trend Decomposition Using LOESS. Agriculture 2024, 14, 229. [Google Scholar] [CrossRef] [Scilit]
  48. Field, A. Discovering Statistics Using SPSS; SAGE Publications: Thousand Oaks, CA, USA, 2009. [Google Scholar]
  49. Tabachnick, B.G.; Fidell, L.S. Using Multivariate Statistics, 6th ed.; Pearson Education: London, UK, 2013. [Google Scholar]
  50. Agresti, A. Categorical Data Analysis, 3rd ed.; John Wiley Sons: Hoboken, NJ, USA, 2013. [Google Scholar]
  51. Dancey, C.P.; Reidy, J. Statistics Without Maths for Psychology, 4th ed.; Pearson Education: Harlow, UK, 2007. [Google Scholar]
  52. Balińska, A.; Jaska, E.; Werenowska, A. Environmentally and Socially Responsible Behavior of Women from Generation Z in the Context of Tourist Activity. Sustainability 2024, 16, 5603. [Google Scholar] [CrossRef] [Scilit]
  53. Rita, P.; Brochado, A.; Dimova, L. Millennials’ travel motivations and desired activities within destinations: A comparative study of the US and the UK. Curr. Issues Tour. 2019, 22, 2034–2050. [Google Scholar] [CrossRef] [Scilit]
  54. Kolster, A.; Rautiainen, L.J.; Aalto, U.L.; Jansson, A.; Partonen, T.; Sachs, A.L.; Litt, J.S.; Masό-Aguado, M.; Pitkälä, K.H. The importance of nature and wishes for nature-based experiences among older adults in assisted living facilities. Geriatr. Nurs. 2025, 63, 300–306. [Google Scholar] [CrossRef] [Scilit] [PubMed]
  55. Nigatu, T.F.; Tegegne, A.A. Potential resources, local communities’ attitudes and perceptions for outdoor recreation and ecotourism development in urban fringe Harego and Bededo conserved forest, South Wollo Zone Ethiopia. Geoj. Tour. Geosites 2021, 39, 11421–11429. [Google Scholar] [CrossRef] [Scilit]
  56. Huang, C.-C.; Li, S.-P.; Chan, Y.-K.; Hsieh, M.-Y.; Lai, J.-C.M. Empirical Research on the Sustainable Development of Ecotourism with Environmental Education Concepts. Sustainability 2023, 15, 10307. [Google Scholar] [CrossRef] [Scilit]
  57. Gajić, T.; Vukolić, D.; Spasojević, A.; Blešić, I.; Petrović, M.D.; Bugarčić, J.; Bugarčić, M.; Drašković, B.D.; Milivojević, M. Exploring Attitudes on the Sustainable Balance Between Nature Conservation and Economic Development Through Ecotourism—Lessons from EU and Non-EU Countries. Land 2025, 14, 395. [Google Scholar] [CrossRef] [Scilit]
  58. Abuhay, T.; Teshome, E.; Mulu, G. A tale of duality: Community perceptions towards the ecotourism impacts on Simien Mountains National Park, Ethiopia. Reg. Sustain. 2023, 4, 453–464. [Google Scholar] [CrossRef] [Scilit]
  59. Alegre, J.; Pou, L.; Sard, M. High unemployment and tourism participation. Curr. Issues Tour. 2019, 22, 1138–1149. [Google Scholar] [CrossRef] [Scilit]
  60. Lin, H.-H.; Hsu, I.-C.; Lin, T.-Y.; Tung, L.-M.; Ling, Y. After the Epidemic, Is the Smart Traffic Management System a Key Factor in Creating a Green Leisure and Tourism Environment in the Move towards Sustainable Urban Development? Sustainability 2022, 14, 3762. [Google Scholar] [CrossRef] [Scilit]
  61. Waleghwa, B.; Ioannides, D. “Everyone Wants to Drive There”: Challenges to Transport Sustainability in Rural Tourism Destinations. Int. J. Tour. Res. 2024, 26, e2810. [Google Scholar] [CrossRef] [Scilit]
  62. Camacho-Murillo, A.; Gounder, R.; Richardson, S. Regional destination attributes that attract domestic tourists: The role of man-made venues for leisure and recreation. Heliyon 2021, 7, e07383. [Google Scholar] [CrossRef] [Scilit] [PubMed]
  63. Li, Z.; Zhang, H.; Xu, Y.; Fang, T.; Wang, H.; Tang, G.A. How does cultural distance affect tourism destination choice? Evidence from the correlation between regional culture and tourism flow. Appl. Geogr. 2024, 166, 103261. [Google Scholar] [CrossRef] [Scilit]
  64. Samdin, Z.; Abdullah, S.I.N.W.; Khaw, A.; Subramaniam, T. Travel risk in the ecotourism industry amid COVID-19 pandemic: Ecotourists’ perceptions. J. Ecotourism 2022, 21, 266–294. [Google Scholar] [CrossRef] [Scilit]
  65. Stanciu, M.; Popescu, A.; Sava, C.; Moise, G.; Nistoreanu, B.G.; Rodzik, J.; Bratu, I.A. Youth’s perception toward ecotourism as a possible model for sustainable use of local tourism resources. Front. Environ. Sci. 2022, 10, 940957. [Google Scholar] [CrossRef] [Scilit]
  66. Iskakova, K.; Bayandinova, S.; Aliyeva, Z.; Aktymbayeva, A.; Baiburiyev, R. Current State and Prospects for the Ecological Tourism Development of Kazakhstan. In Ecological Tourism in the Republic of Kazakhstan; Springer International Publishing: Cham, Switzerland, 2021; pp. 237–278. [Google Scholar] [CrossRef] [Scilit]
  67. Ezeh, P.C.; Dube, K. Willingness to Pay in Tourism and Its Influence on Sustainability. Sustainability 2024, 16, 10630. [Google Scholar] [CrossRef] [Scilit]
  68. Dobre, C.; Linca, A.-C.; Toma, E.; Iorga, A. Sustainable Development of Rural Mountain Tourism: Insights from Consumer Behavior and Profiles. Sustainability 2024, 16, 9449. [Google Scholar] [CrossRef] [Scilit]
  69. Boadu, B.; Jiang, X.; Sampene, A.K. Nudging Eco-Tourism Behaviour Through Tourist Experience Satisfaction: Examining the Mediating and Moderating Mechanisms of Destination Bonds and Ecocentrism. Tour. Hosp. 2025, 6, 275. [Google Scholar] [CrossRef] [Scilit]
  70. Thi Khanh, C.N.; Phong, L.T. Impact of environmental belief and nature-based destination image on ecotourism attitude. J. Hosp. Tour. Insights 2020, 3, 489–505. [Google Scholar] [CrossRef] [Scilit]
  71. Chan, J.K.L.; Marzuki, K.M.; Mohtar, T.M. Local Community Participation and Responsible Tourism Practices in Ecotourism Destination: A Case of Lower Kinabatangan, Sabah. Sustainability 2021, 13, 13302. [Google Scholar] [CrossRef] [Scilit]
  72. Boley, B.B.; Green, G.T. Ecotourism and natural resource conservation: The ‘potential’for a sustainable symbiotic relationship. J. Ecotourism 2016, 15, 36–50. [Google Scholar] [CrossRef] [Scilit]
  73. Peptenatu, D.; Andronache, I.; Ahammer, H.; Radulovic, M.; Costanza, J.K.; Jelinek, H.F.; Di Ieva, A.; Koyama, K.; Grecu, A.; Gruia, A.K.; et al. A new fractal index to classify forest fragmentation and disorder. Landsc. Ecol. 2023, 38, 1373–1393. [Google Scholar] [CrossRef] [Scilit]
  74. Purwoko, A.; Nurrochmat, D.R.; Ekayani, M.; Rijal, S.; Garura, H.L. Examining the Economic Value of Tourism and Visitor Preferences: A Portrait of Sustainability Ecotourism in the Tangkahan Protection Area, Gunung Leuser National Park, North Sumatra, Indonesia. Sustainability 2022, 14, 8272. [Google Scholar] [CrossRef] [Scilit]
  75. Carvache-Franco, M.; Carvache-Franco, O.; Borja-Morán, J.; Bustamante-Ruiz, S.; Aguay-Tomalá, A.; Carvache-Franco, W. Motivations of Ecotourists and Their Relationship with Sociodemographic Aspects, Satisfaction, and Loyalty: Puntilla de Santa Elena Marine Fauna Production Reserve, Ecuador. Sustainability 2024, 16, 8843. [Google Scholar] [CrossRef] [Scilit]
  76. Pham, H.S.T.; Khanh, C.N.T. Ecotourism intention: The roles of environmental concern, time perspective and destination image. Tour. Rev. 2021, 76, 1141–1153. [Google Scholar] [CrossRef] [Scilit]
  77. Lee, T.H.; Jan, F.-H. Ecotourism behavior of nature-based tourists: An integrative framework. J. Travel Res. 2018, 57, 792–810. [Google Scholar] [CrossRef] [Scilit]
  78. D’Souza, C.; Taghian, M.; Marjoribanks, T.; Mort, G.S.; Manirujjaman, M.D.; Singaraju, S. Sustainability for ecotourism: Work identity and role of community capacity building. In Ecotourism Essentials; Routledge: Abingdon, UK, 2024; pp. 24–40. [Google Scholar]
  79. Castillo-Salazar, I.P.; Sanagustín-Fons, V.; Pardo, I.L. Ecotourism as a Catalyst for Sustainable Development: Conservation Governance in Mountain Regions. Societies 2025, 15, 196. [Google Scholar] [CrossRef] [Scilit]
  80. Perera, P.; Jayakody, C.; Jayapali, U.; Newsome, D. Challenges and opportunities for the resumption of nature tourism in post-pandemic Sri Lanka. Int. J. Geoheritage Park. 2023, 11, 234–246. [Google Scholar] [CrossRef] [Scilit]
  81. Salvatore, R. The Tourism Transition of Green Destinations in the Post-pandemic. In Nature-based Tourism and Wellbeing: Impacts and Future Outlook; CABI: Wallingford, UK, 2024; pp. 181–191. [Google Scholar] [CrossRef] [Scilit]
  82. Quynh, N.; Hoai, N.T.; Loi, N.V. The role of emotional experience and destination image on ecotourism satisfaction. Span. J. Mark.-ESIC 2021, 25, 312–332. [Google Scholar] [CrossRef] [Scilit]
  83. Constantin, C.P.; Ispas, A.; Candrea, A.N. Examining the Relationships between Visitors Profile, Satisfaction and Revisit Intentions: Evidence from Romanian Ecotourism Destinations. Land 2022, 11, 186. [Google Scholar] [CrossRef] [Scilit]
  84. Tabaeeian, R.A.; Yazdi, A.; Mokhtari, N.; Khoshfetrat, A. Host-tourist interaction, revisit intention and memorable tourism experience through relationship quality and perceived service quality in ecotourism. J. Ecotourism 2023, 22, 406–429. [Google Scholar] [CrossRef] [Scilit]
  85. Komasi, H.; Hashemkhani Zolfani, S.; Cavallaro, F. The COVID-19 Pandemic and Nature-Based Tourism, Scenario Planning Approach (Case Study of Nature-Based Tourism in Iran). Sustainability 2022, 14, 3954. [Google Scholar] [CrossRef] [Scilit]
  86. Newsome, D.; Perera, P. Nature-based tourism: Before, during, and after COVID-19. In The Routledge Handbook of Nature Based Tourism Development; Routledge: Abingdon, UK, 2023; pp. 9–22. [Google Scholar]
  87. Mihai, V.C.; Dumitras, D.E.; Oroian, C.; Chiciudean, G.O.; Arion, F.H.; Mureșan, I.C. Exploring the Factors Involved in Tourists’ Decision-Making and Determinants of Length of Stay. Adm. Sci. 2023, 13, 215. [Google Scholar] [CrossRef] [Scilit]
  88. Cheraghzadeh, M.; Rahimian, M.; Gholamrezai, S. Effective factors on tourist satisfaction with the quality of ecotourism destination: Evidence from Iran. Environ. Dev. Sustain. 2024, 26, 28699–28726. [Google Scholar] [CrossRef] [Scilit]
  89. Mafi, M.; Pratt, S.; Trupp, A. Determining ecotourism satisfaction attributes–a case study of an ecolodge in Fiji. J. Ecotourism 2020, 19, 304–326. [Google Scholar] [CrossRef] [Scilit]
  90. Kodariawan, R.; Huda, S.; Winarno, S.T.; Hendrarini, H. Analysis of Tourist Perceptions of Ecotourism Facilities in Surabaya Mangrove Forest. J. Penelit. Pendidik. IPA 2025, 11, 533–544. [Google Scholar] [CrossRef] [Scilit]
  91. Chaminuka, P.; Groeneveld, R.A.; Selomane, A.O.; Van Ierland, E.C. Tourist preferences for ecotourism in rural communities adjacent to Kruger National Park: A choice experiment approach. Tour. Manag. 2012, 33, 168–176. [Google Scholar] [CrossRef] [Scilit]
  92. Constantin, C.P.; Papuc-Damașcan, V.; Blumer, A.; Albu, R.-G.; Suciu, T.; Candrea, A.N.; Ispas, A. Profiling Visitors to Romanian Ecotourism Destinations. Sustainability 2021, 13, 2958. [Google Scholar] [CrossRef] [Scilit]
  93. Giao, H.N.K.; Vuong, B.N.; Phuong, N.N.D.; Dat, N.T. A model of factors affecting domestic tourist satisfaction on eco-tourism service quality in the Mekong Delta, Vietnam. Geo J. Tour. Geosites 2021, 36, 663–671. [Google Scholar] [CrossRef] [Scilit]
  94. Sumanapala, D.; Wolf, I.D.; Weiler, B. Enhancing tour guide training for delivering nature-based tourism experiences in a developing country. J. Qual. Assur. Hosp. Tour. 2025, 26, 464–488. [Google Scholar] [CrossRef] [Scilit]
  95. Dumitrașcu, A.V.; Teodorescu, C.; Cioclu, A. Accessibility and Tourist Satisfaction—Influencing Factors for Tourism in Dobrogea, Romania. Sustainability 2023, 15, 7525. [Google Scholar] [CrossRef] [Scilit]
  96. Le, T.T. Influences of the ecotourism industry in Mekong Delta–Vietnam: The mediating role of Tourist Satisfaction. Cogent Bus. Manag. 2024, 11, 2353570. [Google Scholar] [CrossRef] [Scilit]
  97. Thong, J.-Z.; Lo, M.-C.; Ramayah, T.; Mohamad, A.A. Destination resources as precursors of ecotourism competitiveness: A study of totally protected areas in Sarawak, Malaysia during COVID-19 pandemic. J. Ecotourism 2024, 23, 194–216. [Google Scholar] [CrossRef] [Scilit]
  98. Baloch, Q.B.; Shah, S.N.; Iqbal, N.; Sheeraz, M.; Asadullah, M.; Mahar, S.; Khan, A.U. Impact of tourism development upon environmental sustainability: A suggested framework for sustainable ecotourism. Environ. Sci. Pollut. Res. 2023, 30, 5917–5930. [Google Scholar] [CrossRef] [Scilit] [PubMed]
Figure 1. The geographical locations of the counties of the Oltenia region at the national level. Source: Data were processed by the authors in Geographic Information System (GIS), version 10.8. (A) The map in Figure 1A provides detailed information on the location and characteristics of the Oltenia region, highlighting geographical, administrative, and topographical aspects relevant to ecotourism studies or environmental analyses in this region of Romania; (B) In Figure 1B, the vegetation in the Oltenia region is far from uniform. This structural complexity not only highlights the ecological diversity but also shows how the local flora adapts to the specific stresses of the respective subzones due to a constant interplay of biological and geographical factors; (C) The geospatial location of national and natural parks in South-West Oltenia Region.
Sustainability 18 08989 g001
Figure 2. The number of accommodation units and beds in Oltenia region. Source: Data were processed by the authors according to the NIS [44].
Sustainability 18 08989 g002
Table 1. Research hypotheses, main indicators, and statistical methods used.
Research HypothesisMain IndicatorsStatistical Method Used
H1Gender–desire to practice ecotourismIndependent-samples t-test
H2Age–uration of visits to protected areasOne-way ANOVA
H3Education level–perceived possibility of practicing ecotourismOne-way ANOVA
H4Labor market status–post-pandemic travel frequencyChi-square test
H5Residential environment–transportation preferencesChi-square test
H6Region of residence–post-pandemic tourist destinationsChi-square test
H7Monthly net income–budget allocated to ecotourism productsPearson correlation
H8Practicing ecotourism–satisfaction with tourism resourcesIndependent-samples t-test
H9Desire to practice ecotourism–duration of visits to protected areasLinear regression analysis
H10Perceived possibility of practicing ecotourism–post-pandemic travel frequencyLinear regression analysis
H11Destination selection criteria–satisfaction with tourist facilitiesLinear regression analysis
H12Importance of tourism services–satisfaction with tourism resourcesPearson correlation
Source: Data were processed by the author using Microsoft Excel 2024.
Table 2. Main research variables, measurement scales, and coding.
VariableMeasurement ScaleCodingRelated Hypothesis
GenderNominalFemale = 0; male = 1; prefer not to answer = 2H1
Desire to practice ecotourismFive-point Likert scale1 = Totally disagree... 5 = totally agreeH1, H9
AgeOrdinal18–25 = 0; 26–40 = 1; 41–60 = 2; >60 = 3H2
Duration of visits to protected areasOrdinal1 day = 0... more than 7 days = 4H2, H9
Education levelOrdinalSecondary = 0... higher education = 3H3
Perceived possibility of practicing ecotourismFive-point Likert scale1–5H3, H10
Labor market statusNominalCategories were coded numericallyH4
Post-pandemic travel frequencyOrdinalCategories were coded numericallyH4, H10
Residential environmentNominalUrban = 0; rural = 1H5
Preferred means of transportNominalCategories were coded numericallyH5
Region of residenceNominalCategories were coded numericallyH6
Tourist destination choiceNominalCategories were coded numericallyH6
Monthly net incomeOrdinalIncome categoriesH7
Budget allocated to ecotourism productsOrdinalBudget categoriesH7
Practicing ecotourismBinaryNo = 0; yes = 1H8
Satisfaction with tourism resourcesFive-point Likert scale1–5H8, H12
Destination selection criteriaFive-point Likert scale1–5H11
Satisfaction with tourist facilitiesFive-point Likert scale1–5H11
Source: Data were processed by the author using Microsoft Excel 2024.
Table 3. Descriptive statistics pertaining to the main research variables.
NMinimumMaximumMeanStd. Deviation
Desire to practice
ecotourism
500154.630.591
Duration of visits to protected areas500040.790.735
Perceived possibility of practicing ecotourism500152.601.136
Post-pandemic travel frequency500031.940.903
Monthly net income500041.341.234
Budget allocated to ecotourism products500030.190.494
Satisfaction with tourism resources500154.570.680
Destination selection criteria500154.490.878
Satisfaction with tourist facilities500153.280.822
Source: Data were processed by the author using SPSS version 22.0.
Table 4. Results of the t-test analyzing the influence of gender on the desire to practice ecotourism.
Levene’s Test for Equality of Variancest-Test for Equality of Means
FSig.tdfSig. (2-Tailed)Mean DifferenceStd. Error Difference95% Confidence Interval of the Difference
LowerUpper
Desire to practice
ecotourism
14.5070.0001.6834930.0930.1060.063−0.0180.230
1.403140.8050.1630.1060.076−0.0430.256
Source: Data were processed by the author using SPSS version 22.0.
Table 5. Results of the ANOVA for the duration of visits to protected areas stratified by age categories.
Sum of SquaresdfMean SquareFSig.
Between Groups12.43934.1468.0000.000
Within Groups257.0894960.518
Total269.528499
Source: Data were processed by the author using SPSS version 22.0.
Table 6. Results of the ANOVA on the possibility of practicing ecotourism according to level of education.
Sum of SquaresdfMean SquareFSig.
Between Groups4.65431.5511.2040.308
Within Groups639.1444961.289
Total643.798499
Source: Data were processed by the author using SPSS version 22.0.
Table 7. Chi-square test results for the association between labor market status and travel frequency post-pandemic.
ValuedfAsymp. Sig. (2-Sided)
Pearson Chi-Square37.220180.005
Likelihood Ratio37.775180.004
Linear-by-Linear Association3.88710.049
N of Valid Cases500
Source: Data were processed by the author using SPSS version 22.0.
Table 8. Chi-square test results for the association between residential environments and transportation preferences.
ValuedfAsymp. Sig. (2-Sided)
Pearson Chi-Square7.73730.052
Likelihood Ratio9.63730.022
Linear-by-Linear Association4.19410.041
N of Valid Cases500
Source: Data were processed by the author using SPSS version 22.0.
Table 9. Symmetric association measures for region of residence and post-pandemic tourist destinations.
ValueApprox. Sig.
Nominal by NominalPhi0.3400.001
Cramer’s V0.1700.001
Source: Data were processed by the author using SPSS version 22.0.
Table 10. Pearson correlation between monthly net income and budget for ecological tourism products.
Monthly Net IncomeBudget for Eco-Friendly Tourism Products
Monthly Net IncomePearson Correlation10.052
Sig. (2-tailed) 0.248
N500500
Budget for eco-friendly tourism productsPearson Correlation0.0521
Sig. (2-tailed)0.248
N500500
Source: Data were processed by the author using SPSS version 22.0.
Table 11. t-test results for comparing satisfaction with tourism resources between groups that practice and do not practice ecotourism.
Levene’s Test for Equality of Variancest-Test for Equality of Means
FSig.tdfSig. (2-Tailed)Mean DifferenceStd. Error Difference95% Confidence Interval of the Difference
LowerUpper
Satisfaction with
tourism resources
Equal variances assumed14.9770.00010.4504980.0001.03820.09930.84301.2333
Equal variances not assumed 7.96844.9800.0001.03820.13030.77571.3006
Source: Data were processed by the author using SPSS version 22.0.
Table 12. Regression model coefficients for the influence of the desire to practice ecotourism on the duration of visits to protected areas.
ModelUnstandardized CoefficientsStandardized CoefficientstSig.
BStd. ErrorBeta
1(Constant)−0.2290.256 −0.8940.372
The desire to practice ecotourism0.2200.0550.1763.9990.000
Source: Data were processed by the author using SPSS version 22.0.
Table 13. Regression model coefficients for the influence of the possibility of practicing ecotourism on the frequency of post-pandemic travel.
ModelUnstandardized CoefficientsStandardized CoefficientstSig.
BStd. ErrorBeta
1(Constant)2.0530.101 20.3230.000
The possibility of
practicing ecotourism
−0.0440.036−0.055−1.2370.217
Source: Data were processed by the author using SPSS version 22.0.
Table 14. Regression model coefficients for the influence of destination choice criteria on satisfaction with tourist facilities.
ModelUnstandardized CoefficientsStandardized CoefficientstSig.
BStd. ErrorBeta
1(Constant)2.8570.191 14.9780.000
Criteria for choosing destinations0.0950.0420.1012.2710.024
Source: Data were processed by the author using SPSS version 22.0.
Table 15. Pearson correlation between the importance of tourist services and satisfaction with tourist facilities.
Correlations
The Importance of Tourist ServicesSatisfaction with Tourist
Facilities
Importance of tourist servicesPearson Correlation10.179
Sig. (2-tailed) 0.000
N500500
Satisfaction with tourist facilitiesPearson Correlation0.1791
Sig. (2-tailed)0.000
N500500
Source: Data were processed by the author using SPSS version 22.0.
Disclaimer/Publisher’s Note: The statements, opinions and data contained in all publications are solely those of the individual author(s) and contributor(s) and not of MDPI and/or the editor(s). MDPI and/or the editor(s) disclaim responsibility for any injury to people or property resulting from any ideas, methods, instructions or products referred to in the content.