Article

Energy Literacy and Billing Transparency in Electricity Markets During the Energy Transition: Evidence from a Single-Supplier Survey in Upper Silesia, Poland

by
Marzena Czarnecka
1,*,
Krzysztof Zamasz
2,
Marcin Marszałek
3,
Michał Domagała
4 and
Aleksandra Lubicz-Posochowska
1
1
Department of Energy Transformation, University of Economics in Katowice, 40-287 Katowice, Poland
2
Institute of Energy Transformation, WSB University, ul. Cieplaka 1C, 41-300 Dąbrowa Górnicza, Poland
3
Department of Business and Commercial Law, WSPiA University of Rzeszów, 35-310 Rzeszów, Poland
4
Department of Public Economic Law, The John Paul II Catholic University of Lublin, 20-950 Lublin, Poland
*
Author to whom correspondence should be addressed.
Sustainability 2026, 18(17), 8868; https://doi.org/10.3390/su18178868 (registering DOI)
Submission received: 22 June 2026 / Revised: 21 August 2026 / Accepted: 24 August 2026 / Published: 29 August 2026

Abstract

Energy-transition policy increasingly asks households and small firms to behave as informed players in liberalised electricity markets. How far they can actually play that part, however, depends on two things at once: how energy-literate they are, and how clearly their bills speak to them. Although both strands are separately well researched, they are rarely measured jointly, on the same respondents, and at the level of the bill itself—the document through which almost every consumer actually meets the market. Working from a case study of Polish electricity customers, we examine how self-assessed knowledge of billing relates to perceived bill comprehensibility and to the detailed understanding of individual invoice elements. The evidence comes from a mixed-mode CATI/CAWI survey of 602 respondents—individual consumers, prosumers and micro/small enterprises—all served by a single major supplier in the Upper Silesia region. Because the achieved sample is dominated by older respondents of one supplier, the study is framed throughout as an exploratory, regional investigation. Three findings stand out. First, self-assessed energy literacy, perceived bill comprehensibility and the detailed understanding of individual invoice elements are positively interrelated (Spearman’s ρ between 0.49 and 0.61, p < 0.001), indicating that consumer competence and information design are complementary correlates of comprehension. Second, declared knowledge and understanding are socially patterned: they run higher among respondents aged 35–54 and those in a better financial position and lower among older and financially vulnerable customers, while a third of respondents find their current bill hard to understand. Third, Ward’s cluster analysis distinguishes three internally consistent layers of billing information—detailed billing parameters, transactional and payment content, and regulatory and legal content—of which the regulatory and legal layer is read least often. Because the data come from one supplier in one region, the findings are indicative rather than nationally representative and should be generalised only with care. The paper’s contribution is to measure energy literacy, perceived transparency and detailed bill comprehension jointly on the same respondents and to document—for a Central European retail market undergoing rapid price change—that the regulatory layer of the bill is precisely the layer consumers read least. For policy, the findings support piloting simpler bill structures, communication aimed at vulnerable groups, and energy education that equips consumers to take part in the market as the transition unfolds; given the sample, these implications are advanced as directions to be tested rather than as validated prescriptions.

1. Introduction

Europe’s energy transformation has been quietly rewriting the consumer’s job description—turning the household from a passive recipient of electricity into an active participant in the market. Policies built around liberalised markets, renewable deployment and demand-side participation all lean on the same assumption: that consumers can make informed choices about how much they use, whom they buy from, and what efficiency investments are worth making. Whether they actually hold the knowledge and interpretive skill to do so is a question the literature has not yet answered with any confidence.
Research on consumer behaviour in energy markets has so far clustered around three themes. The first is energy literacy—what consumers know about energy systems, prices and efficiency measures—and the findings here are consistently sobering: household energy literacy remains low [1,2], which dulls the effect of price signals and policy incentives alike. The second strand looks at behavioural responses to prices, from elasticity and demand-side management through to nudges designed to trim consumption. The third concerns participation in the transition itself, whether through prosumer schemes, community-energy initiatives or demand-response programmes.
Energy literacy and billing transparency are not merely consumer-protection concerns; they are enabling conditions for the sustainable energy transition [3]. When households cannot read or act on the information embedded in their bills, the demand-side participation essential to Sustainable Development Goal 7 (affordable and clean energy) and Goal 12 (responsible consumption and production) is weakened. By examining how consumers perceive and understand the electricity bill, this study connects the micro-level of household decision-making to the macro-level goals of decarbonisation, market efficiency and social equity in the energy transition.
For all this activity, some conspicuous gaps remain. Surprisingly little attention has gone to the electricity bill itself, even though it is the primary interface between the market and the consumer—the most direct source of information about consumption, pricing and regulatory mechanisms and a document whose complexity often defeats that very purpose. Nor do existing studies usually examine, inside a single design, the three variables that matter most here: what consumers know about billing mechanisms, how transparent they find their bills, and how well they can read the detail. The combination is what counts, because sound decisions require not merely access to information but the capacity to interpret it correctly.
Two further gaps concern people and content. On the people side, the empirical evidence on how socio-economic characteristics—age, gender, financial situation—shape the ability to understand electricity-market information is still thin, and these determinants are usually studied one at a time rather than within an integrated framework. On the content side, bills increasingly carry regulatory and policy material, including references to energy-transition mechanisms, tariffs and market rules; yet we know little about whether consumers actually read and process these layers, or how they tell transactional information (the amount due, the consumption figures) apart from the regulatory and technical text that surrounds it.
This study takes up those gaps by viewing consumer decision-making in electricity markets through the lens of information comprehension and energy literacy. Drawing on survey data from 602 respondents and pairing non-parametric statistics with hierarchical cluster analysis, it asks (i) what consumers know about electricity-billing mechanisms, (ii) how comprehensible they find their bills, (iii) how knowledge and bill interpretation relate to one another, and (iv) which information consumers actually consult when they read a bill. By tying energy literacy to the transparency of billing information and to consumers’ socio-economic characteristics, the study shows how information design shapes participation in energy markets during the transition.
The article contributes to the literature in five complementary ways. First, it develops an integrated analytical perspective that links knowledge of electricity-pricing mechanisms with the perceived transparency and interpretability of bills—dimensions earlier work has tended to keep apart. Second, it shows empirically how consumers really use their bills as a source of market information: the transactional content gets read; the regulatory and policy content largely does not. Third, it documents significant differences in billing knowledge and comprehension across demographic groups, above all by age and financial situation, which argues for targeted rather than one-size-fits-all communication. Fourth, it uses hierarchical cluster analysis to separate three informational layers within the bill—detailed billing parameters, transactional and payment information, and regulatory and legal content—providing a systematic descriptive account of how consumers interact with energy-market information. And fifth, it suggests that the current structure of electricity bills may itself be holding back consumer participation in liberalised markets, so that clearer, better-organised billing could improve decision-making and serve the wider goals of energy-transition policy.
A word on positioning is in order at the outset. The evidence analysed here comes from customers of one major supplier in one Polish region, with older consumers strongly over-represented in the achieved sample. The study is therefore best read as an exploratory regional investigation: its purpose is to establish, on unusually detailed single-supplier data, how the three constructs at the heart of bill comprehension behave and interrelate and thereby to provide a documented baseline and a set of testable hypotheses for the cross-regional comparisons and experimental designs that alone can support general policy prescriptions. The significance claimed for the results is calibrated to that role throughout the paper.
The remainder of the article is organised as follows. Section 2 reviews the literature on energy literacy, its economic and financial context, and its links with energy poverty and closes by drawing these strands together into an explicit statement of the research gap and a conceptual framework. Section 3 sets out the materials and methods—the hypotheses, research design, questionnaire, sample and analytical strategy. Section 4 reports the results, moving from self-declared knowledge through the correlational analysis to the cluster structure of the bill. Section 5 discusses what the findings mean, and Section 6 concludes with policy and educational implications, limitations and directions for future work.

2. Theoretical Background and Literature Review

2.1. Energy Literacy: Concept and Evidence

Energy literacy is most commonly defined as the body of knowledge that enables consumers to judge which actions save energy and to make informed decisions about energy use [4,5,6]. The framework developed by the U.S. Department of Energy remains the most widely cited and treats energy literacy as an understanding of the nature and role of energy together with the ability to apply that understanding to decisions and problems [5,7]. DeWaters and Powers [8,9] operationalised this as a tripartite construct spanning cognitive, affective and behavioural dimensions, and their instrument, validated on large samples of secondary-school students, established a reference for subsequent measurement. Subsequent work broadened the concept to a citizenship-oriented understanding that integrates affective and behavioural aspects [8,10] and situated it within the wider pursuit of sustainable consumption [11,12].
Empirically, the evidence is consistent: household energy literacy is low across the countries studied [1,2,13], which dulls the effect of price signals and discourages efficiency investment [14]. The economic and financial strand links this deficit to the structure of bills: consumers respond to prices in bounded, heuristic ways [15], and even carefully designed market instruments fail when recipients cannot interpret the information presented to them [16,17]. Although the bill is the principal interface between supplier and customer, billing frequency, payment methods and the technical means of data transmission have been studied more often than the legibility of the document itself [18,19,20]. Two theoretical anchors frame these findings—the economics of information, which locates the problem in asymmetric information between supplier and consumer [17,21], and the behavioural account of bounded rationality and cognitive load [15,22,23], which predicts that a dense, technical bill will be processed selectively rather than fully. From this evidence a clear gap follows: although energy literacy, price response and transition participation are each well documented, they are rarely measured jointly at the level of the bill itself and on the same respondents—the gap the present study addresses.

2.2. Energy Literacy and Energy Poverty

A particularly important part of this research concerns the mitigation of energy poverty. The literature runs across the whole range of interventions, from direct subsidies for bills—which act fast and bring immediate consumer relief—through to investment in new technologies, whose impact is more delayed but also more durable and, in the long run, more satisfying [24]. Financial literacy comes through these studies as a factor that can materially reduce energy poverty, chiefly by creating incentives to invest in modern, energy-efficient technologies and to adopt the practices that go with them [25,26].
Financial literacy and the energy knowledge bound up with it together lay the groundwork for behavioural change. You can see it in decisions as ordinary as choosing the right tariff under which to buy electricity [27,28]. The cumulative payoff is not only better energy efficiency but a measurable easing of energy poverty [29]—a relationship visible not just in developing economies but in highly developed ones too [30].

2.3. Education, Age and Behavioural Outcomes

Taken together, the studies reviewed above support several broader conclusions. First, it is possible to pin down a coherent, workable definition of energy literacy, and the work of DeWaters and Powers [8,9] offers a particularly useful frame, drawing as it does a distinction between the cognitive, affective and behavioural dimensions of energy competence. Second, energy education—including education delivered through modern technologies—appears to produce the intended results in energy saving and pro-environmental behaviour when it is aligned with local and national policy and backed by appropriate investment in infrastructure. The effect is sharpest when such initiatives are aimed at younger groups [9,31].
A further point, which the literature makes almost in passing but which matters a great deal from a regulatory standpoint, is that legal education is an indispensable part of energy literacy. Knowing one’s rights as an energy consumer—combined with basic technical knowledge and with financial literacy, especially the ability to read a bill—is what allows consumers to behave in the way the legislator presumably had in mind when drafting the rules. Without that combination, the opportunities the transition opens up are likely to stay, for a large share of the population, more theoretical than real.

2.4. Institutional and Economic Background: The Polish Market and the Bill

The findings reported below are best read against the specific institutional setting in which they were generated, since much of what makes a Polish electricity bill hard to read is a direct product of that setting. Poland’s retail electricity market has been formally liberalised since 2007, when household customers gained the legal right to switch supplier. In practice, however, the market retains strong structural features inherited from its state-owned past: a handful of large, vertically integrated groups—TAURON Polska Energia among them—dominate distribution and supply within their historical regions, and switching rates among households have stayed comparatively low. For most consumers, then, the annual or bi-monthly bill remains the single most regular point of contact with a market they are, in principle, free to shop around in but seldom do.
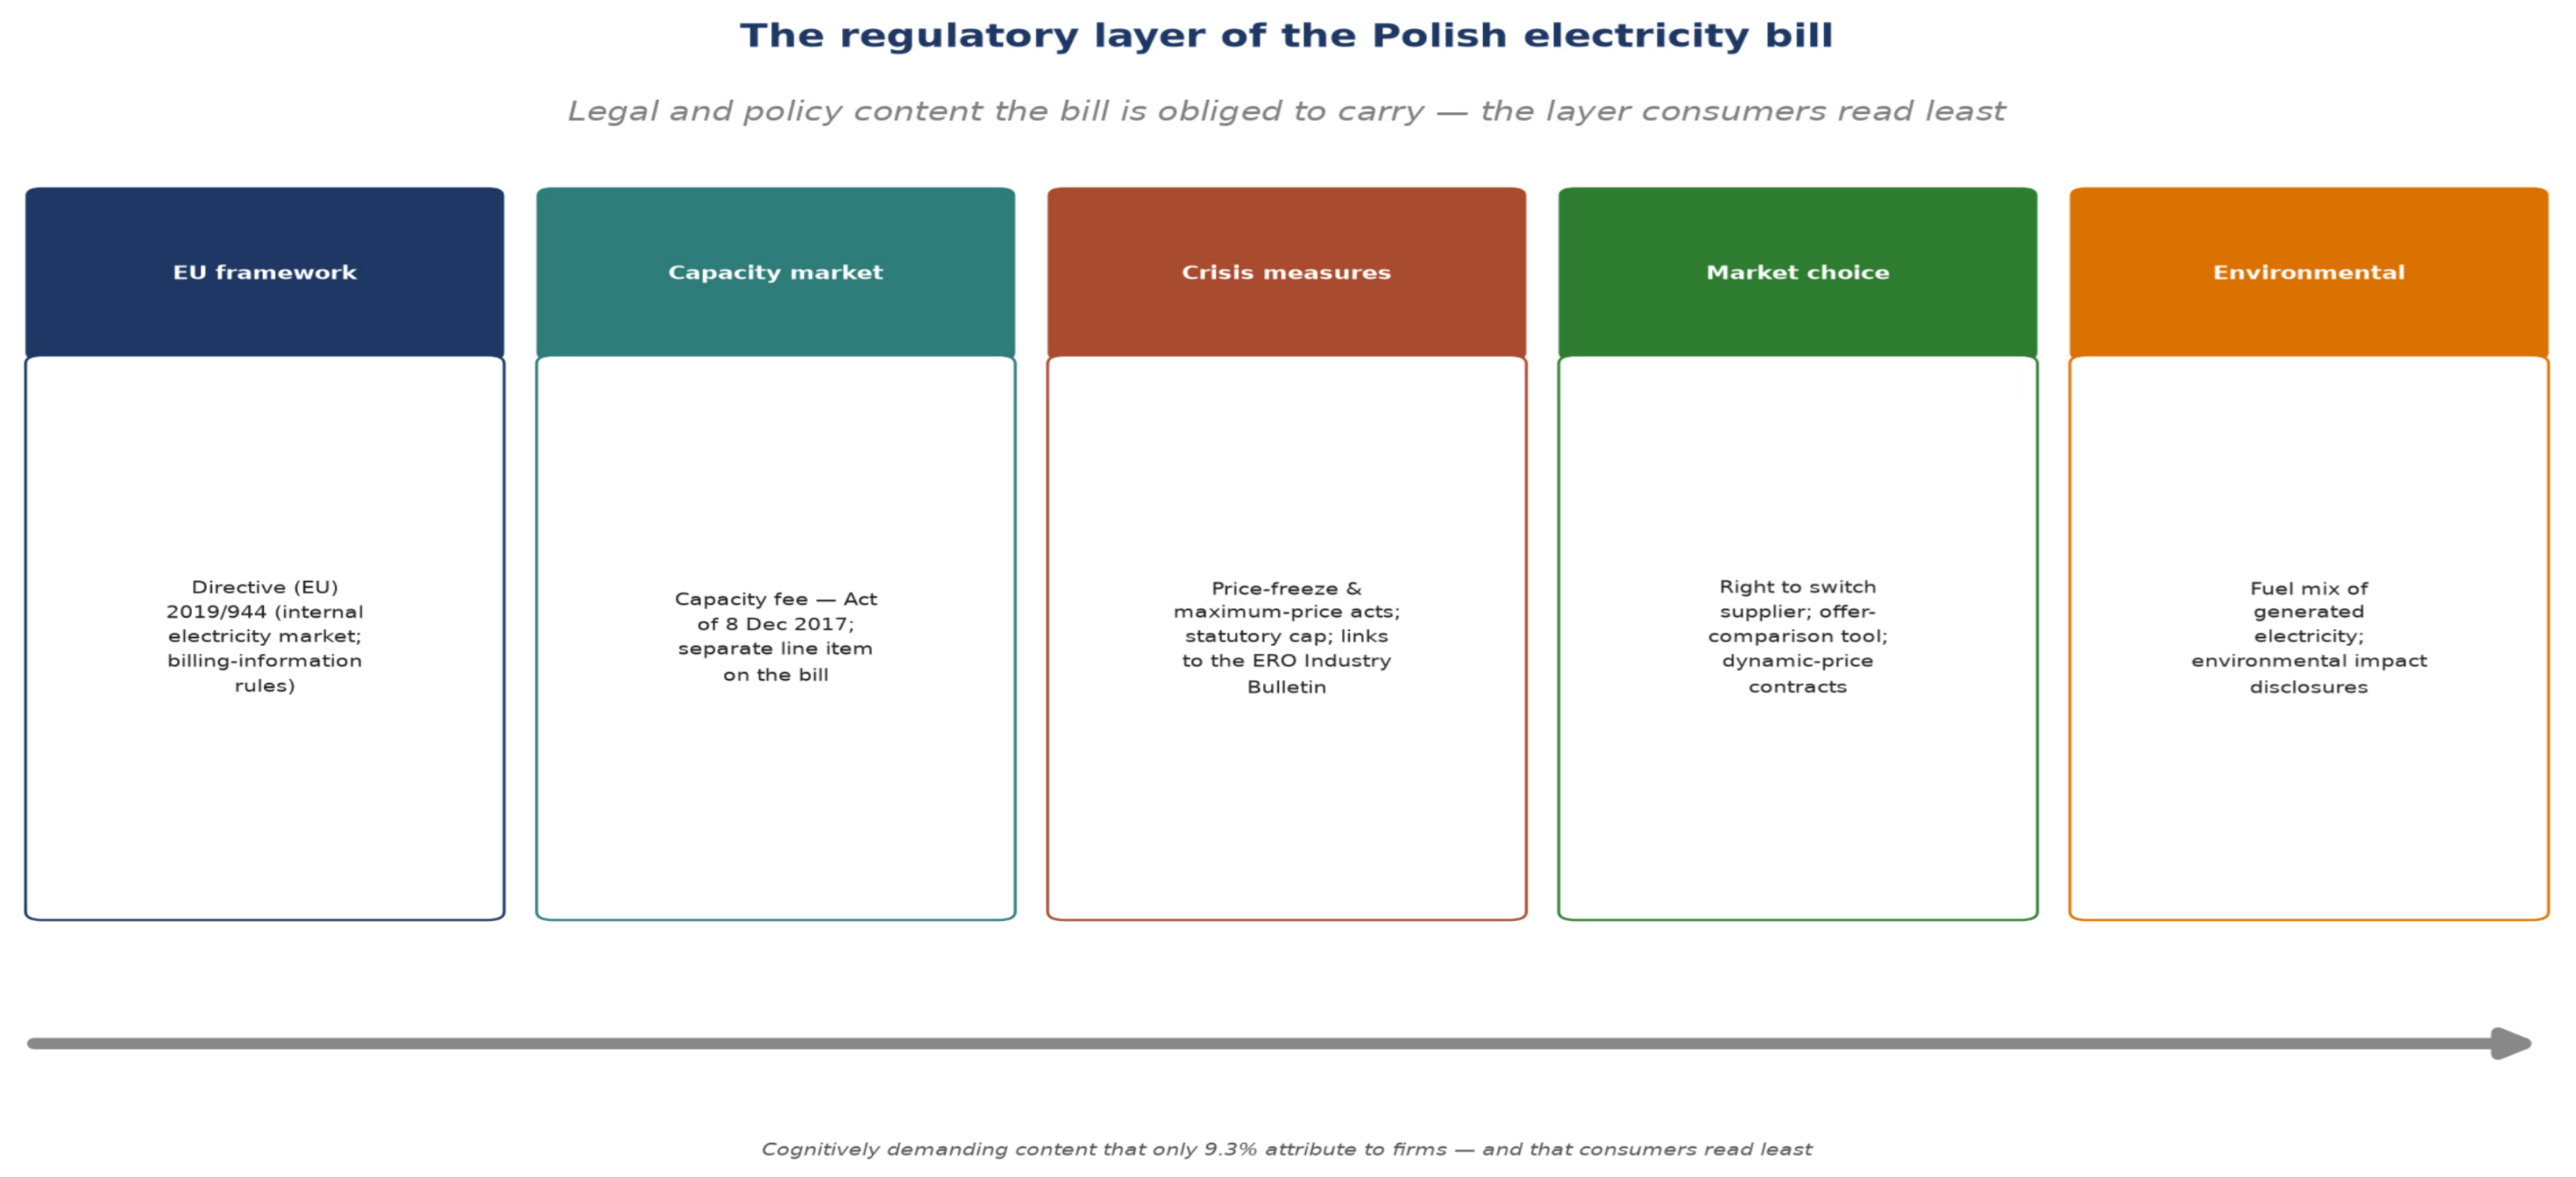
The legal architecture that shapes the content of that bill has several layers, mapped in Figure 1 and itemised in Table 1. At the European level, Directive (EU) 2019/944 [32] on the internal market for electricity sets out common rules on the information a bill must contain and on the consumer’s right to clear, comparable pre-contractual and billing information. At the national level, a series of instruments has been layered on top of this framework, each leaving its own trace on the invoice: the capacity fee introduced by the Act of 8 December 2017, which appears as a distinct charge; the quality, transitional and cogeneration components of the network charge; the RES levy; and, more recently, the emergency price-freeze and maximum-price measures adopted in response to the 2022–2023 energy crisis, which oblige suppliers to print statutory references, effective dates and links to the Energy Regulatory Office’s Industry Bulletin directly on the bill [33].
The cumulative effect is a document that is, in a precise sense, over-determined by regulation. Each new protective or market-opening measure adds a line, a footnote or a statutory citation, so that the very instruments designed to protect and empower the consumer also thicken the text through which that consumer must wade. This institutional backdrop matters for the interpretation of our results in two ways. First, it explains why so many respondents attribute the complexity of bills to legislation rather than to their supplier (Section 4.3): to a considerable extent, they are right. Second, it sharpens the policy dilemma at the heart of the study—how to keep the bill legally complete while making it humanly legible—which we take up in Section 6. Figure 1 summarises the principal regulatory instruments that the Polish bill is obliged to carry.

2.5. The Research Gap

The international literature on electricity markets is predominantly macroeconomic and system-oriented in its focus. Reviews of capacity-market mechanisms concentrate on stimulating investment in dispatchable capacity and on safeguarding system adequacy [34], while analyses of EU market models treat market restructuring as a response to macroeconomic challenges and foreground zonal and nodal designs together with structural prosumer behaviour [35]. More recent surveys of market models for future power systems emphasise renewable integration, demand-side flexibility and investment incentives for capacity, while acknowledging that the modelling of consumer behaviour remains underdeveloped [36]. Even the literature on retail-market liberalisation addresses the consumer mainly through the lens of market concentration and regulation, where low customer engagement is treated as a side-effect to be corrected by switching mechanisms rather than by deeper education [37]. In this perspective, the end consumer—the individual household—figures largely as a component of aggregate demand or as an engagement problem, rather than as a boundedly rational agent whose knowledge conditions the effectiveness of market participation.
A parallel but separate strand of empirical research documents low consumer knowledge of bills and consumption, yet remains fragmented and unconnected to the question of systematic household cost optimisation. Survey evidence from India shows that the overwhelming volume of information on bills, combined with the absence of real-time feedback, deters consumers from understanding their own usage and from devising strategies to reduce it [38]. A recent study from the United States explicitly diagnoses consumer (mis)understanding of electricity bills and limited awareness of the structure of charges [39]. A critical review of the household energy-literacy concept highlights the absence of common definitions and measures, which obstructs comparison and longitudinal research and calls explicitly for their unification [40]. The classic Dutch study confirms that many households are unaware of their energy consumption and that higher literacy correlates with conservation behaviour [1]. A literature review of perceived energy use further demonstrates that consumers systematically overestimate the consumption of low-energy appliances and underestimate that of high-energy ones, relying on heuristics [41]. Research on energy-related financial literacy likewise shows that consumers are frequently unaware of the savings achievable by switching to more efficient appliances [42]. A further sub-strand documents tariff complexity as a cognitive barrier: a study of perceptions of real-time pricing on a sample of 1005 respondents shows that perceived tariff complexity significantly weakens the effect of financial literacy on tariff acceptance and that simplification is crucial for the energy transition [43]. This literature establishes a genuine deficit of knowledge but remains in isolation: it concentrates on diagnosis and on appeals for unified measurement, without formulating a coherent microeconomic framework linking consumer education to effective household cost optimisation.
A third strand—behavioural experiments on bills—demonstrates empirically that micro-level informational and educational interventions generate measurable savings, but likewise does not embed them in a systematic account of household cost optimisation. The seminal OPOWER study, covering 600,000 households in the United States, found an average consumption reduction of 2.0%—equivalent to a short-run price increase of 11–20%—at a cost of 3.3 cents per kilowatt-hour saved, with households in the highest consumption decile reducing usage by 6.3% [44]. Natural-field experiments confirmed that social nudges lower peak consumption by 2–4%, and by nearly 7% when combined [45], while environmental and health-based messaging generated savings of around 8%, rising to 19% among families with children [46]. Reviews of field experiments nevertheless show that effects are heterogeneous and moderated by contextual factors [47,48] and that beyond the United States the effects are often weaker and not always cost-effective [49]. Energy literacy has also been confirmed as a significant predictor of households’ willingness to provide demand-side flexibility [50]. This strand provides strong evidence for the efficacy of micro-interventions, but treats them in isolation—evaluating single tools rather than embedding them in a microeconomic account of how consumer education enables households to optimise their energy costs on a sustained basis.
Taken together, the strands reviewed above define the research gap that the present study addresses. First, the macroeconomic literature on capacity markets, liberalisation, renewable integration and system-level tariff design overlooks the consumer as a boundedly rational agent burdened by knowledge deficits. Second, the energy-literacy and bill-comprehension literature diagnoses this deficit but does not connect it to a microeconomic mechanism of cost optimisation, remaining at the level of calls for unified measurement. Third, the behavioural literature demonstrates the efficacy of interventions but treats them piecemeal, without framing the consumer as an agent pursuing a rational household cost policy. The common feature is the absence of a bridge between the diagnosis of low knowledge and an analytical framework that allows households to optimise their electricity expenditure effectively. The present article fills this gap by adopting a microeconomic approach to consumer education, in which knowledge of bill structure, tariff awareness and energy competence function as an endogenous decision factor conditioning a household’s ability to optimise its costs. In so doing, it integrates previously separate strands—macroeconomic, energy-literacy and behavioural—and shifts the analytical centre of gravity from aggregated system variables to the consumer’s micro-decisions, treating consumer education as an independent and measurable instrument of cost reduction rather than a mere backdrop to analyses of capacity markets or system integration.
This gap is not merely a feature of the international literature; it is equally visible in domestic analyses and is reinforced by Polish evidence. Reports of the Polish Economic Institute document that 69% of Polish households worried about energy prices in the preceding twelve months and that 65% reduced their consumption, primarily for economic reasons, while diagnosing a limited cultural and social capital resulting from an insufficiently active educational policy in the area of climate and energy [51]. The Institute’s behavioural report further indicates that nudges on bills yield 27.3 kWh of savings per USD of outlay, against 14.0 kWh for education and 3.41 kWh for price reductions [52]—a result consistent with Allcott’s findings [44] and confirming that micro-level interventions are an order of magnitude more cost-effective than price instruments. At the same time, the macroeconomic orientation dominant in the Institute’s own work—energy-mix scenarios [53], renewable balancing [54] and capacity-market analyses—confirms that even in the domestic discourse the microeconomic and educational dimension remains marginalised in favour of capacity and integration, reinforcing the relevance of this gap.
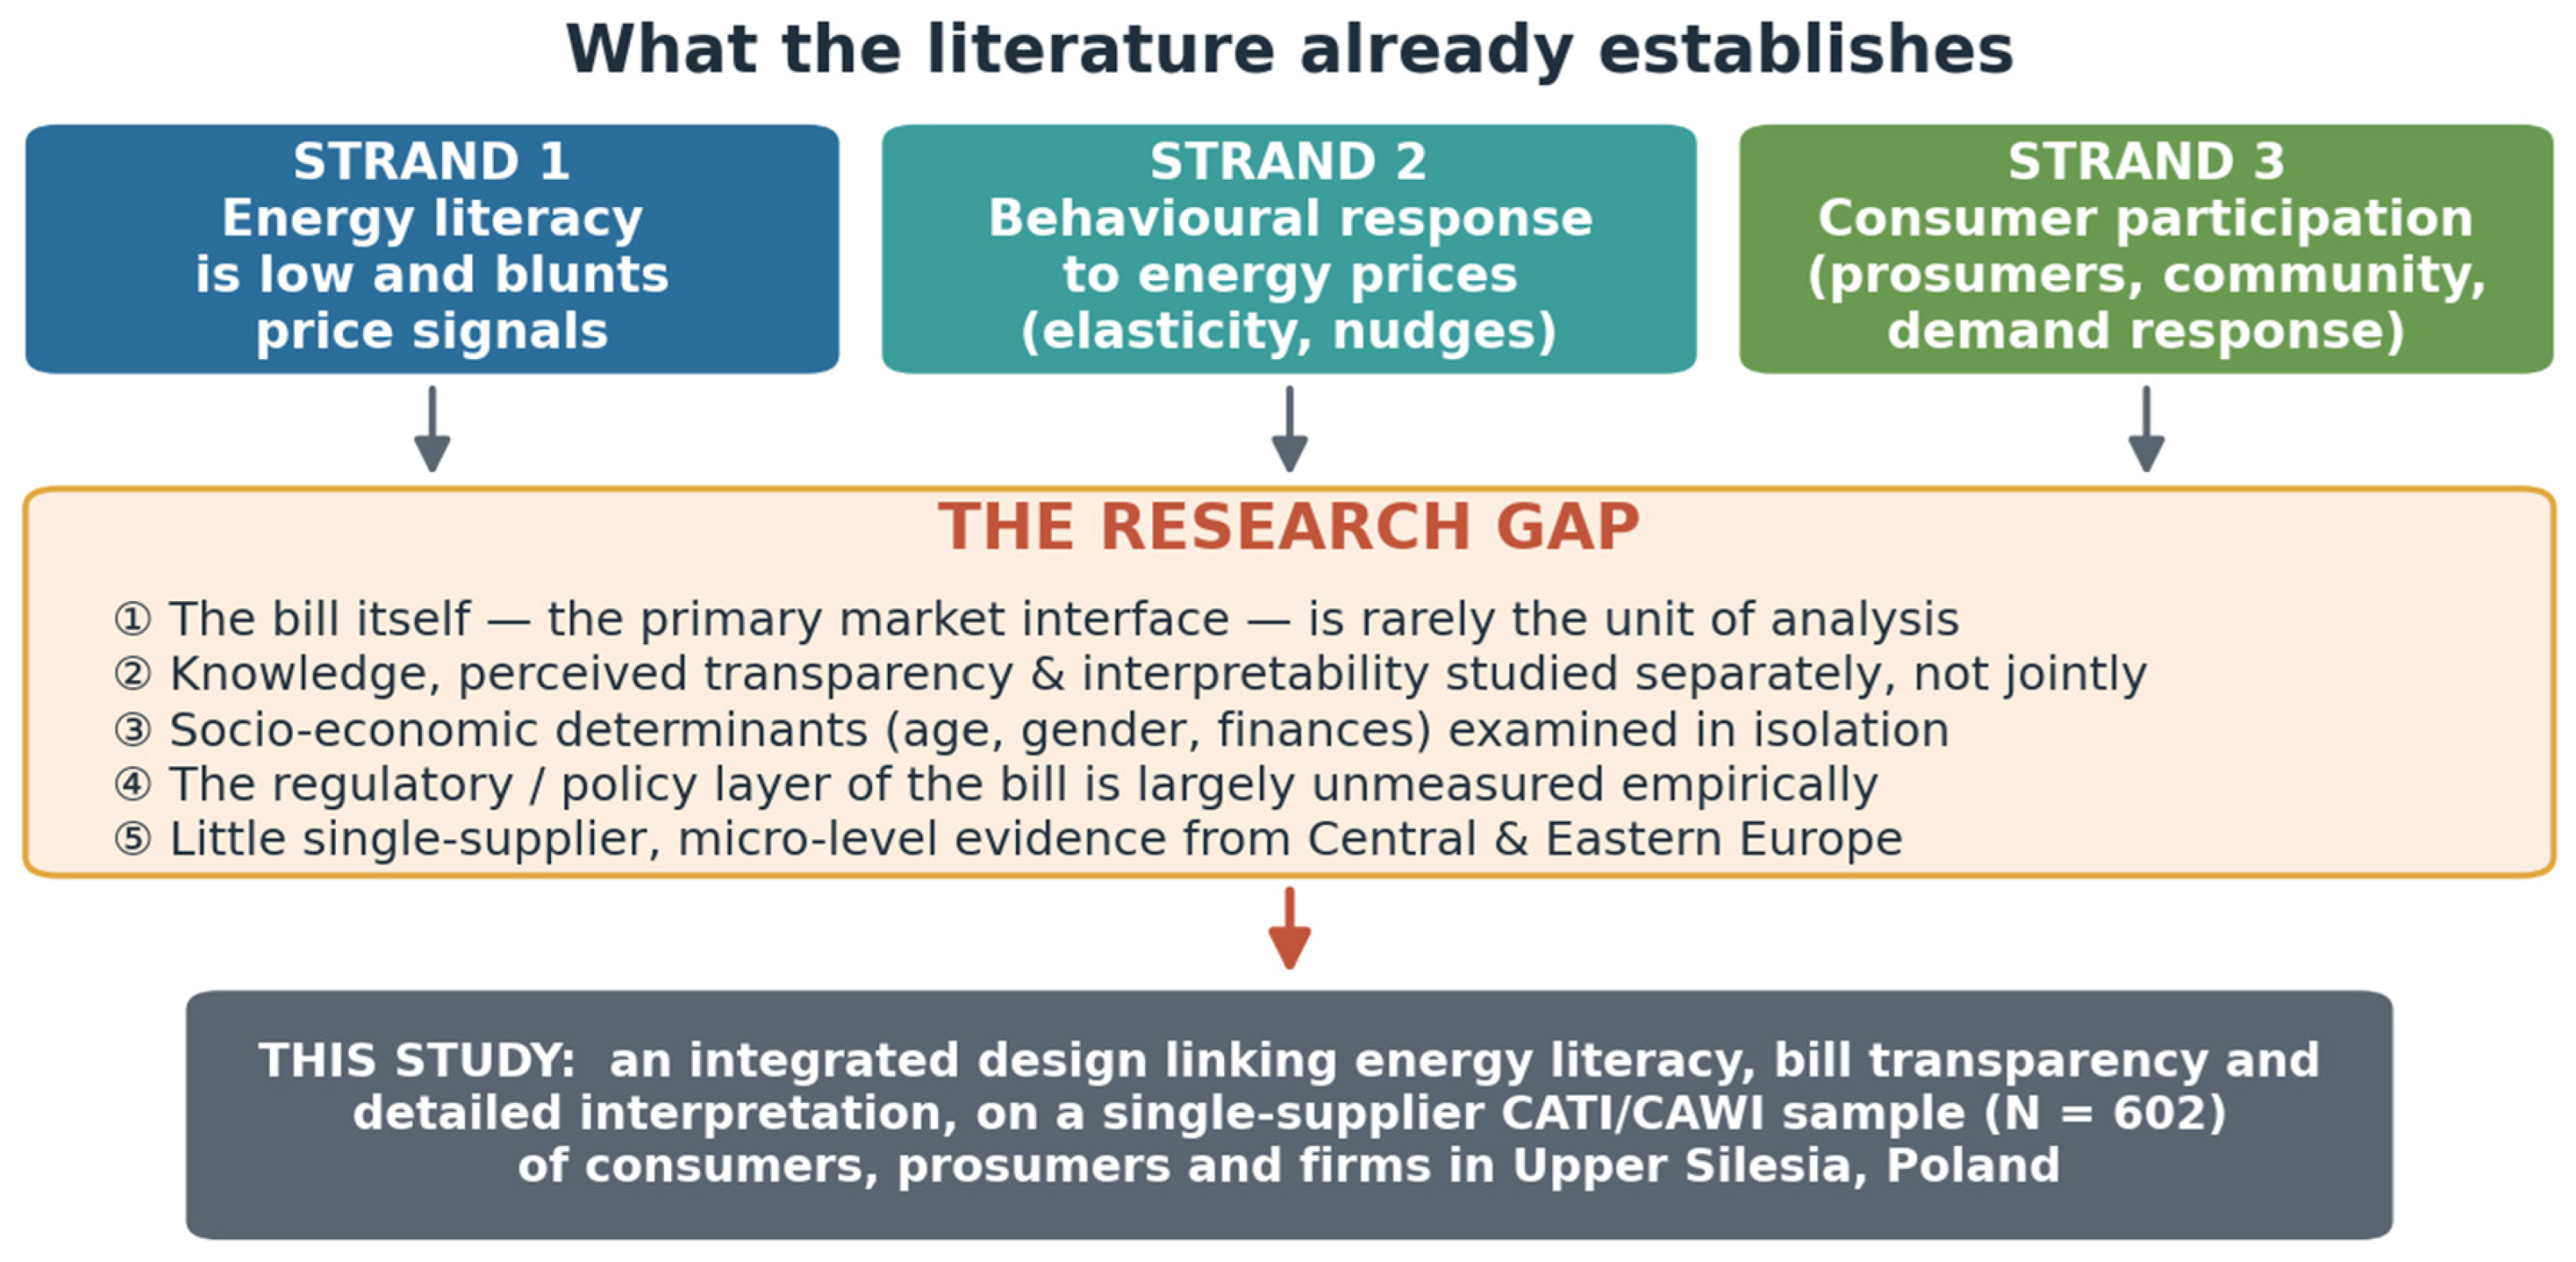
Pulling the three strands together brings the gap this study addresses into sharp relief. The literature has established, separately and convincingly, that household energy literacy is low and weakens price signals; that consumers respond to prices in bounded, heuristic ways; and that participation in the transition, through prosumer and demand-response schemes, is uneven. What it has not done is bring these insights to bear on the one document through which almost every consumer actually meets the market—the electricity bill. Five specific shortfalls follow from this, and Figure 2 sets them out schematically.
First, the bill itself is rarely the unit of analysis. Although it is the primary interface between supplier and customer, most studies treat billing as a background variable rather than as the object to be explained. Second, the three constructs at the heart of comprehension—what consumers know, how transparent they find the bill, and how well they can read its detail—are typically examined in isolation, so that their mutual relationships go unmeasured. Third, the socio-economic determinants of comprehension (age, gender, financial situation) are usually studied one variable at a time, outside any integrated framework that would let their joint contribution be assessed. Fourth, the regulatory and policy layer of the bill—the very content through which the energy transition reaches the household—has attracted almost no direct empirical scrutiny, even as it grows in volume and importance. And fifth, micro-level, single-supplier evidence from Central and Eastern Europe, where market liberalisation and rapid price change have collided with an ageing customer base, remains scarce.
Addressing these shortfalls calls for a design that measures the three constructs together, on the same respondents, and relates them to socio-economic characteristics and to the actual reading of different layers of the bill. That is precisely what the present study sets out to do, on a single-supplier sample of 602 consumers, prosumers and firms in Upper Silesia. The framework that guides this effort is described next.

2.6. Conceptual Framework

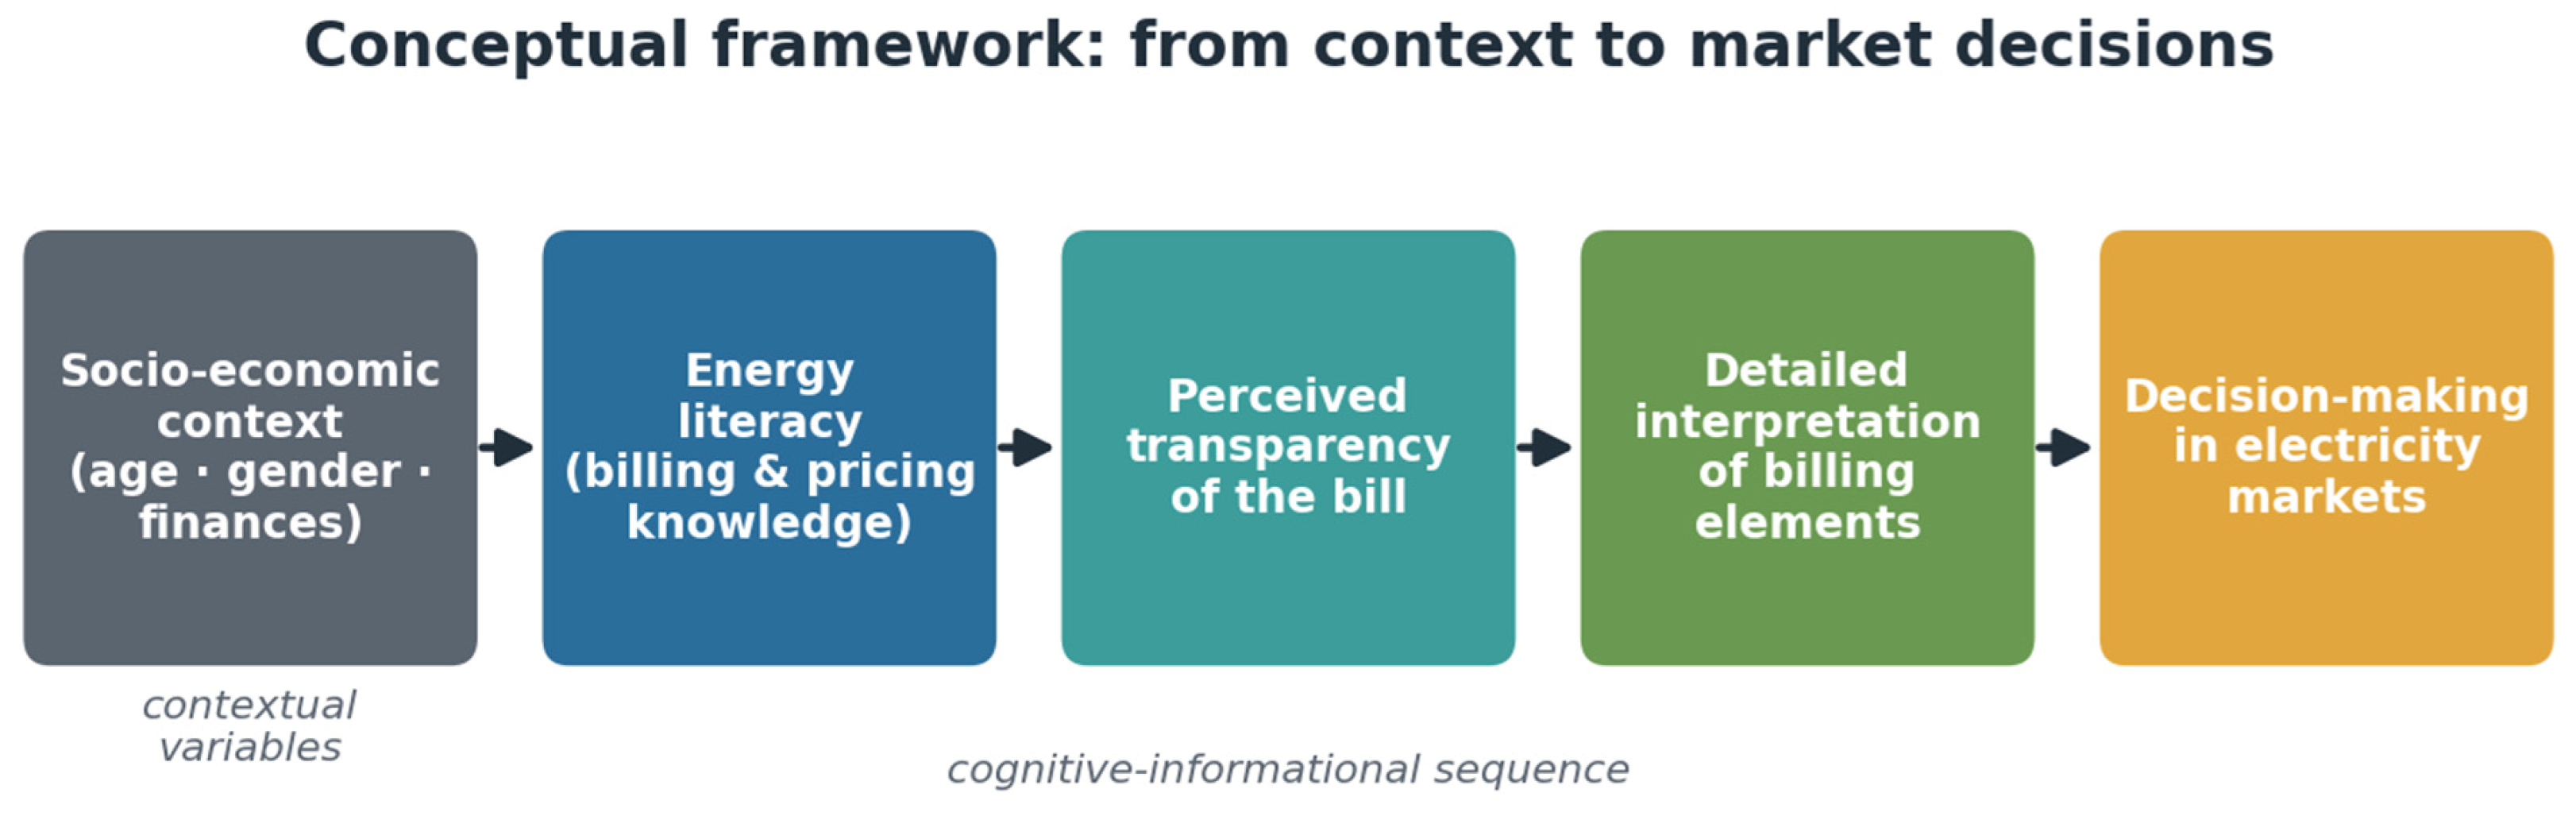
Building on the literature reviewed above, the study adopts an integrated conceptual framework in which consumer decision-making in electricity markets is shaped by a sequence of cognitive processes embedded in a socio-economic context (Figure 3). Socio-economic factors—age, gender and financial situation in particular—act as contextual variables that influence the level of energy literacy, understood here as knowledge of electricity pricing and billing mechanisms. Energy literacy, in turn, affects the perceived transparency of bills—the clarity with which charges, tariffs and price structures are presented—which then bears on the consumer’s ability to interpret detailed billing information such as individual charges, tariff components and consumption data. These cognitive processes ultimately shape decision-making in electricity markets, including responses to price signals, supplier choice, and participation in transition mechanisms such as prosumer schemes or demand-response programmes.
Two behavioural notions inform this framework from the outset and motivate the hypotheses formulated in Section 2.7. The first is bounded rationality [15]: consumers process billing information selectively, under cognitive limits, leaning on simplifying heuristics and concentrating on the elements they perceive as most salient—which leads us to expect systematic, socially patterned differences in self-assessed knowledge (H1) and a functional, selective reading of the bill (reflected in the layered structure examined in Section 4.5). The second is cognitive load [22]: because an overloaded document can be judged complete and yet remain uninterpretable, perceived informational sufficiency need not track comprehension (H2); relatedly, the economics of information [17,21] leads us to expect the asymmetry between supplier and customer to persist despite formal disclosure obligations. These notions are used as interpretive lenses that shaped the design and the hypotheses ex ante; the study’s descriptive, correlational character (Section 3.1) means that the results can be consistent with them but cannot test them as causal mechanisms, and the between-group differences reported below are accordingly presented as descriptive differences, not as direct evidence of boundedly rational decision processes.

2.7. Research Questions and Hypotheses

The study is organised around one overarching question: to what extent do electricity consumers understand their bills, and what determines how they perceive and assess billing information? The five hypotheses derived ex ante from the literature review and the conceptual framework are stated below with their theoretical grounding; Table 2 maps them onto the questionnaire content, the analytical tests and the section in which each result is reported.
From the literature reviewed above and the framework of Figure 3, five hypotheses were derived ex ante. Their theoretical grounding is indicated with each statement; Section 3 describes how each was operationalised, and Table 2 (Section 2.7) maps them onto the questionnaire content and the analytical tests.
Two clarifications concern the set as a whole. First, hypotheses H1–H3 address the core constructs announced in the title—energy literacy, billing transparency and their comprehension—while H4 and H5 play a deliberately complementary, contextual role: they capture the expectations and attitudes that condition the policy reading of the core results (Section 4.6 and Section 4.7) and are not advanced as part of the paper’s central claim. Second, the constructs of H2 and H3 are operationalised as follows. The perceived amount of information (H2) is measured by the agreement item analysed in Section 4.2. Regulatory awareness (H3) is measured behaviourally through two indicators described in Section 4.3—the attribution of bill complexity and the identification of the party that determines the bill’s content—with low awareness indicated by the failure to recognise the statutory determination of bill content, not by any evaluative judgement about regulation itself.
H1. 
There are statistically significant differences in self-declared knowledge of electricity billing according to demographic characteristics (gender, age, financial situation). This expectation follows from the socio-economic patterning of energy and financial literacy documented in Section 2.2, Section 2.3 and Section 2.4 [11,18,19,20,21,22,23,24] and from the contextual role assigned to socio-economic factors in the conceptual framework.
H2. 
The perception of the amount of information contained in the bill is independent of the type of customer (consumer, prosumer, enterprise). Because all customer categories receive a document of essentially the same regulated content, and because cognitive load rather than information volume is expected to be the binding constraint on comprehension [22], no systematic differences in perceived informational sufficiency are anticipated across customer types.
H3. 
Customers display a low level of regulatory awareness concerning the legal determinants of bill content. This follows from the evidence that regulatory and policy content is the least engaged layer of market information addressed to consumers [55,56] and from the expectation, grounded in bounded rationality [15], that attention concentrates on transactionally salient elements.
H4. 
Expectations regarding changes to the bill are multidimensional and depend on the customer segment, reflecting the distinct market positions of individual consumers, prosumers and enterprises discussed in Section 2.4.
H5. 
Attitudes towards energy from renewable sources are socially differentiated and associated with demographic characteristics, in line with the literature on the social acceptance of renewables [57,58] and with the New Ecological Paradigm tradition [59].

3. Materials and Methods

3.1. Research Design and Approach

The study forms part of a wider research project on the functioning of the electricity market in Poland, with particular attention to consumer knowledge, the comprehensibility of billing information, and the social perception of the energy transition. The project is comprehensive in scope, taking in different categories of market participant—individual consumers, prosumers and enterprises—which makes it possible to view the problem from several angles at once and to compare attitudes and behaviours across groups that differ in how deeply they are engaged with the market.
In design terms, the study follows an explicitly deductive and largely positivist logic of inquiry: it moves from theoretically grounded hypotheses (Section 3.1) to their empirical testing on quantitative survey data, aiming to describe how energy literacy and bill comprehension are distributed across the customer base and to test how these constructs relate to respondents’ socio-economic characteristics. This orientation is deliberate rather than incidental. As Sovacool, Axsen and Sorrell [60] argue in their review of methods in energy social science, the quality of a study turns less on the sophistication of any single technique than on how well the chosen design fits the research question and on how explicitly that design is stated; method should follow the logic of inquiry on a “fit for purpose” basis. A standardised cross-sectional survey, analysed with non-parametric and exploratory multivariate techniques, was therefore chosen as the design best matched to the descriptive and explanatory aims set out above—in preference to a more elaborate but less transparent alternative.
Within the project, a quantitative study was conducted using a standardised computer-assisted telephone interview (CATI), complemented in selected segments by a computer-assisted web interview (CAWI). Several considerations dictated the choice of CATI as the dominant technique. First, it yields a representative sample in a relatively short time while keeping full control over data collection. Second, it reaches different categories of respondent regardless of their digital competence—no small matter in studies of energy competence, where a substantial share of consumers are older people for whom an online questionnaire would itself be a barrier. Third, the standardisation of the interview keeps responses comparable and makes it easier to build synthetic indicators.

3.2. Questionnaire Design and Measurement Items

The questionnaire was developed from validated instruments in the energy-literacy and billing-transparency literature. The energy-knowledge and behavioural module was based on the tripartite (cognitive, affective, behavioural) framework of DeWaters and Powers [8,9], adapted to the reading of the electricity bill and informed by the Polish application of Gołębiowska [2] and the energy-related financial-literacy instrument of Kalmi, Trotta and Kažukauskas [61]. The billing-readability module drew on the European Commission’s consumer billing study [55], experimental work on bill redesign [62,63] and national research commissioned by the Polish Energy Regulatory Office [56]. Environmental-attitude items were adapted from the New Ecological Paradigm scale [59], retaining energy-relevant items within the time constraints of a telephone interview. The energy-transition module drew on European research on the social acceptance of renewables [58] and on perception studies including Djurisic et al. [57]. Following the design-oriented work of Dominitz, Parush and Metcalfe [64], the bill itself was treated as the central unit of analysis.
The specific measurement items, response scales and value coding for each module are listed in Appendix A. The instrument was reviewed by the commissioning partner and refined in a pilot (Section 3.4) before the main fieldwork.

3.3. Questionnaire Structure

Several main thematic blocks were distinguished. The first covers basic knowledge of the energy market—familiarity with concepts such as the supplier and the distribution system operator, the right to switch supplier, and the tariff mechanism. The second focuses on the bill itself, with questions about how often respondents read its content, their ability to identify particular items, and their subjective sense of its comprehensibility. The third concerns behaviour and attitudes around energy saving and renewables, including declared readiness to take up a prosumer initiative. The fourth relates to the social perception of the transition, including its costs and the expectations directed at the State. The final part contains demographic questions. The full wording of the questionnaire items (in English translation), with each item’s source and response scale, is provided in Appendix A.

3.4. Sample and Field Procedures

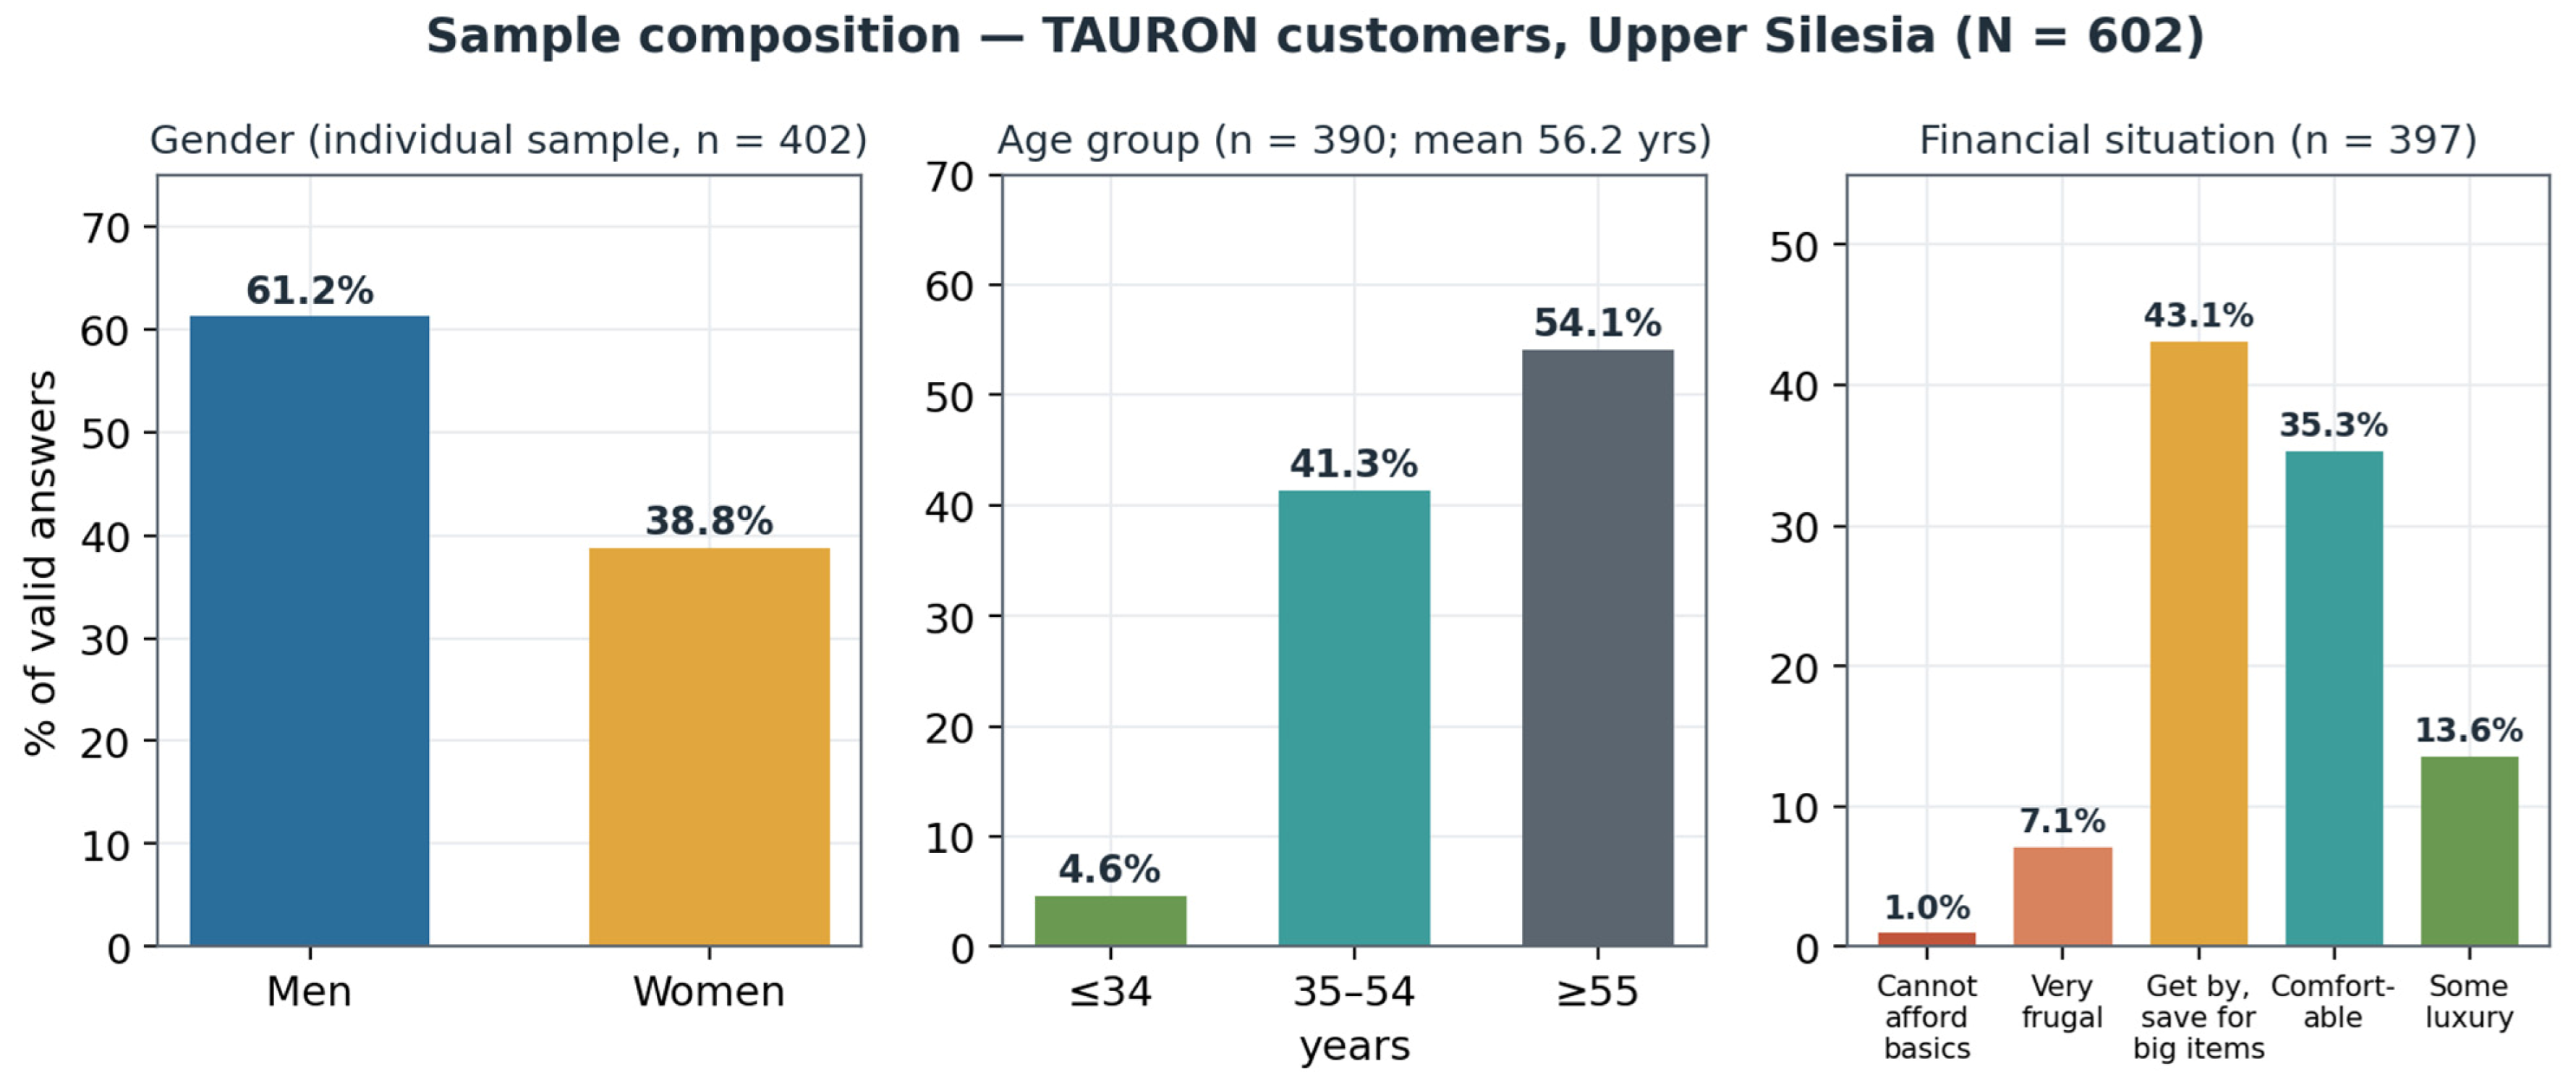
The study was conducted on a sample of customers of a major Polish supplier (TAURON Polska Energia) operating in the Upper Silesia region. The achieved sample comprised N = 602 respondents across three customer categories: individual consumers, prosumers and enterprises (micro and small businesses). The sample was built through a quota-random procedure on basic demographic characteristics (gender, age, place of residence, education), and its size was set to secure a 95% confidence level with a maximum estimation error of approximately four percentage points (the conventional 95% margin at p = 0.5 for n = 602 is ±4.0 pp). Within the CATI study a sub-sample of prosumers was also distinguished, allowing comparisons between this group and the remaining categories. The quota targets, the population benchmarks from which they were derived, the achieved numbers of respondents in each customer category, and the response and refusal rates of the fieldwork are documented in Appendix B. The socio-demographic profile of the individual respondents is summarised in Table 3 and shown in Figure 4.
The design of the sample and of the field procedures was oriented towards the four sources of error that threaten the validity of survey research—sampling, coverage, non-response and measurement error [60]. Sampling error was controlled through the target precision noted above: for a binary item with a roughly even split in a large population, a realised sample of this size corresponds to a conventional design-based margin of error of approximately ±4.0 percentage points at the 95% confidence level (1.96·√(0.25/n) for n = 602), in line with the sample sizes conventionally recommended in the survey-methods literature. It should be noted, however, that this figure is a design-based, simple-random-sample approximation: because the present sample was drawn by a quota-random rather than a strict probability procedure, the design-based margin of error should be read as an indicative precision benchmark rather than a literal confidence interval, and it does not account for design effects, coverage bias or non-response. This precision statement concerns sampling error alone—the accuracy with which characteristics of the surveyed supplier’s customer base are estimated—and implies nothing about representativeness beyond that base; it is therefore fully compatible with the indicative, non-representative reading of the results stated in the Abstract and reiterated at the end of this section. Coverage error was mitigated by the choice of CATI as the dominant mode: because a substantial share of electricity consumers are older people with limited digital competence, an exclusively internet-based frame would have systematically under-covered precisely the groups whose energy literacy is of greatest interest here. Measurement error was addressed through the standardisation of the interview and through the pilot, which served to catch ambiguous or burdensome items before the main fieldwork. Non-response error is the hardest to exclude: although the quotas aligned the realised sample with the population’s demographic structure on observed characteristics, the possibility that respondents differ systematically from non-respondents in their underlying attitudes towards energy cannot be ruled out, and the results are read with that reservation in mind.
A pilot stage of several dozen interviews was carried out to verify the comprehensibility of the questions, the duration of the interview and the technical operation of the CATI script; its conclusions fed into the final editing of the instrument. Because the CAWI complement was confined to selected segments, differences between interview modes cannot be excluded; no formal mode-bias checks were carried out on the archived data, the distribution of respondents by mode is reported in Appendix B, and the possibility of residual mode effects is registered among the study’s limitations (Section 6). The main study was conducted in a single wave, which made it possible to avoid the influence of shifts in the market situation and of media coverage on the results.
The sample was marked by an over-representation of older people—the mean age was 56.24 years, and more than half of respondents fell in the 55+ group. The skew reflects the interaction of the sampling frame with differential availability and consent: the frame was the supplier’s active-contact customer database, in which the registered account holder—more often male and older—is the contact person, and older customers were both easier to reach by telephone and more willing to complete an interview. Men predominated (61.2%), with women at 38.8%. In terms of material situation, households of stable but moderate income, characteristic of the middle class, prevailed. No post-stratification weighting (for example, raking) was applied to these data: with only 18 respondents aged 34 or younger, the extreme weights required to align the sample with the population age structure would have produced unstable estimates and a spurious impression of representativeness. The analyses that follow therefore describe the surveyed customer base—predominantly older customers of a single supplier in Upper Silesia—and the title, abstract and conclusions are framed accordingly; no claim to statistical representativeness of Polish households and small businesses is made. The study was anonymous and based on respondents’ informed consent.

3.5. Data Analysis

The analysis combined descriptive statistics (distributions, measures of central tendency and dispersion) with inferential tests of group differences and of association. The use of non-parametric tests (the Mann–Whitney U test for two groups and the Kruskal–Wallis test for three or more) followed from the ordinal nature of the variables and the departure of their distributions from normality; the normality of the age variable, for instance, was rejected by both the Kolmogorov–Smirnov (D(390) = 0.071; p < 0.001) and the Shapiro–Wilk (W(390) = 0.988; p = 0.002) tests. The strength and direction of associations between ordinal variables were quantified with Spearman rank correlation coefficients. Exact test statistics and degrees of freedom, where applicable, are consolidated together with the corresponding p-values and available effect sizes in Table 4 (Section 4.8); entries not recoverable from the archived outputs are marked there and will be supplied from the raw data. Given the small number of planned comparisons, no formal correction for multiple testing was applied; interpretation therefore rests on the magnitude and consistency of effects rather than on any single significance threshold.
On the basis of the thematic blocks, synthetic indices were also constructed: an index of energy knowledge, an index of bill comprehensibility, and an index of acceptance of the transition. The item composition of each index, together with the coding of its constituent items and the aggregation procedure, is documented in Appendix A. After their reliability had been verified (Cronbach’s α), these indices were used in comparisons between groups. To identify latent structures of attention to different categories of billing information, a hierarchical cluster analysis using Ward’s method was applied to items describing how often respondents read particular elements of the bill. Ward’s method, rather than factor analysis, was chosen because the underlying items are dichotomous (read/did not read), which does not meet the distributional assumptions of factor analysis, and because the aim was to classify concrete bill elements into homogeneous blocks rather than to recover latent factors.
Because the central variables are ordinal and depart from normality, rank-based tests and correlations were preferred to their parametric counterparts, and the exploratory aim of identifying latent structures of attention to billing content was pursued through hierarchical clustering rather than confirmatory modelling the data could not support. Two interpretive cautions, emphasised in the methodological literature [60], run through the whole analysis. First, the cross-sectional design and the rank correlations reported below establish association rather than causation: where energy literacy and perceived comprehensibility move together, the direction of influence cannot be inferred from these data alone. Second, statistical significance is kept distinct from practical significance; effect sizes and response proportions are therefore reported alongside the test statistics, so that the substantive weight of a difference—not merely its detectability—can be judged.
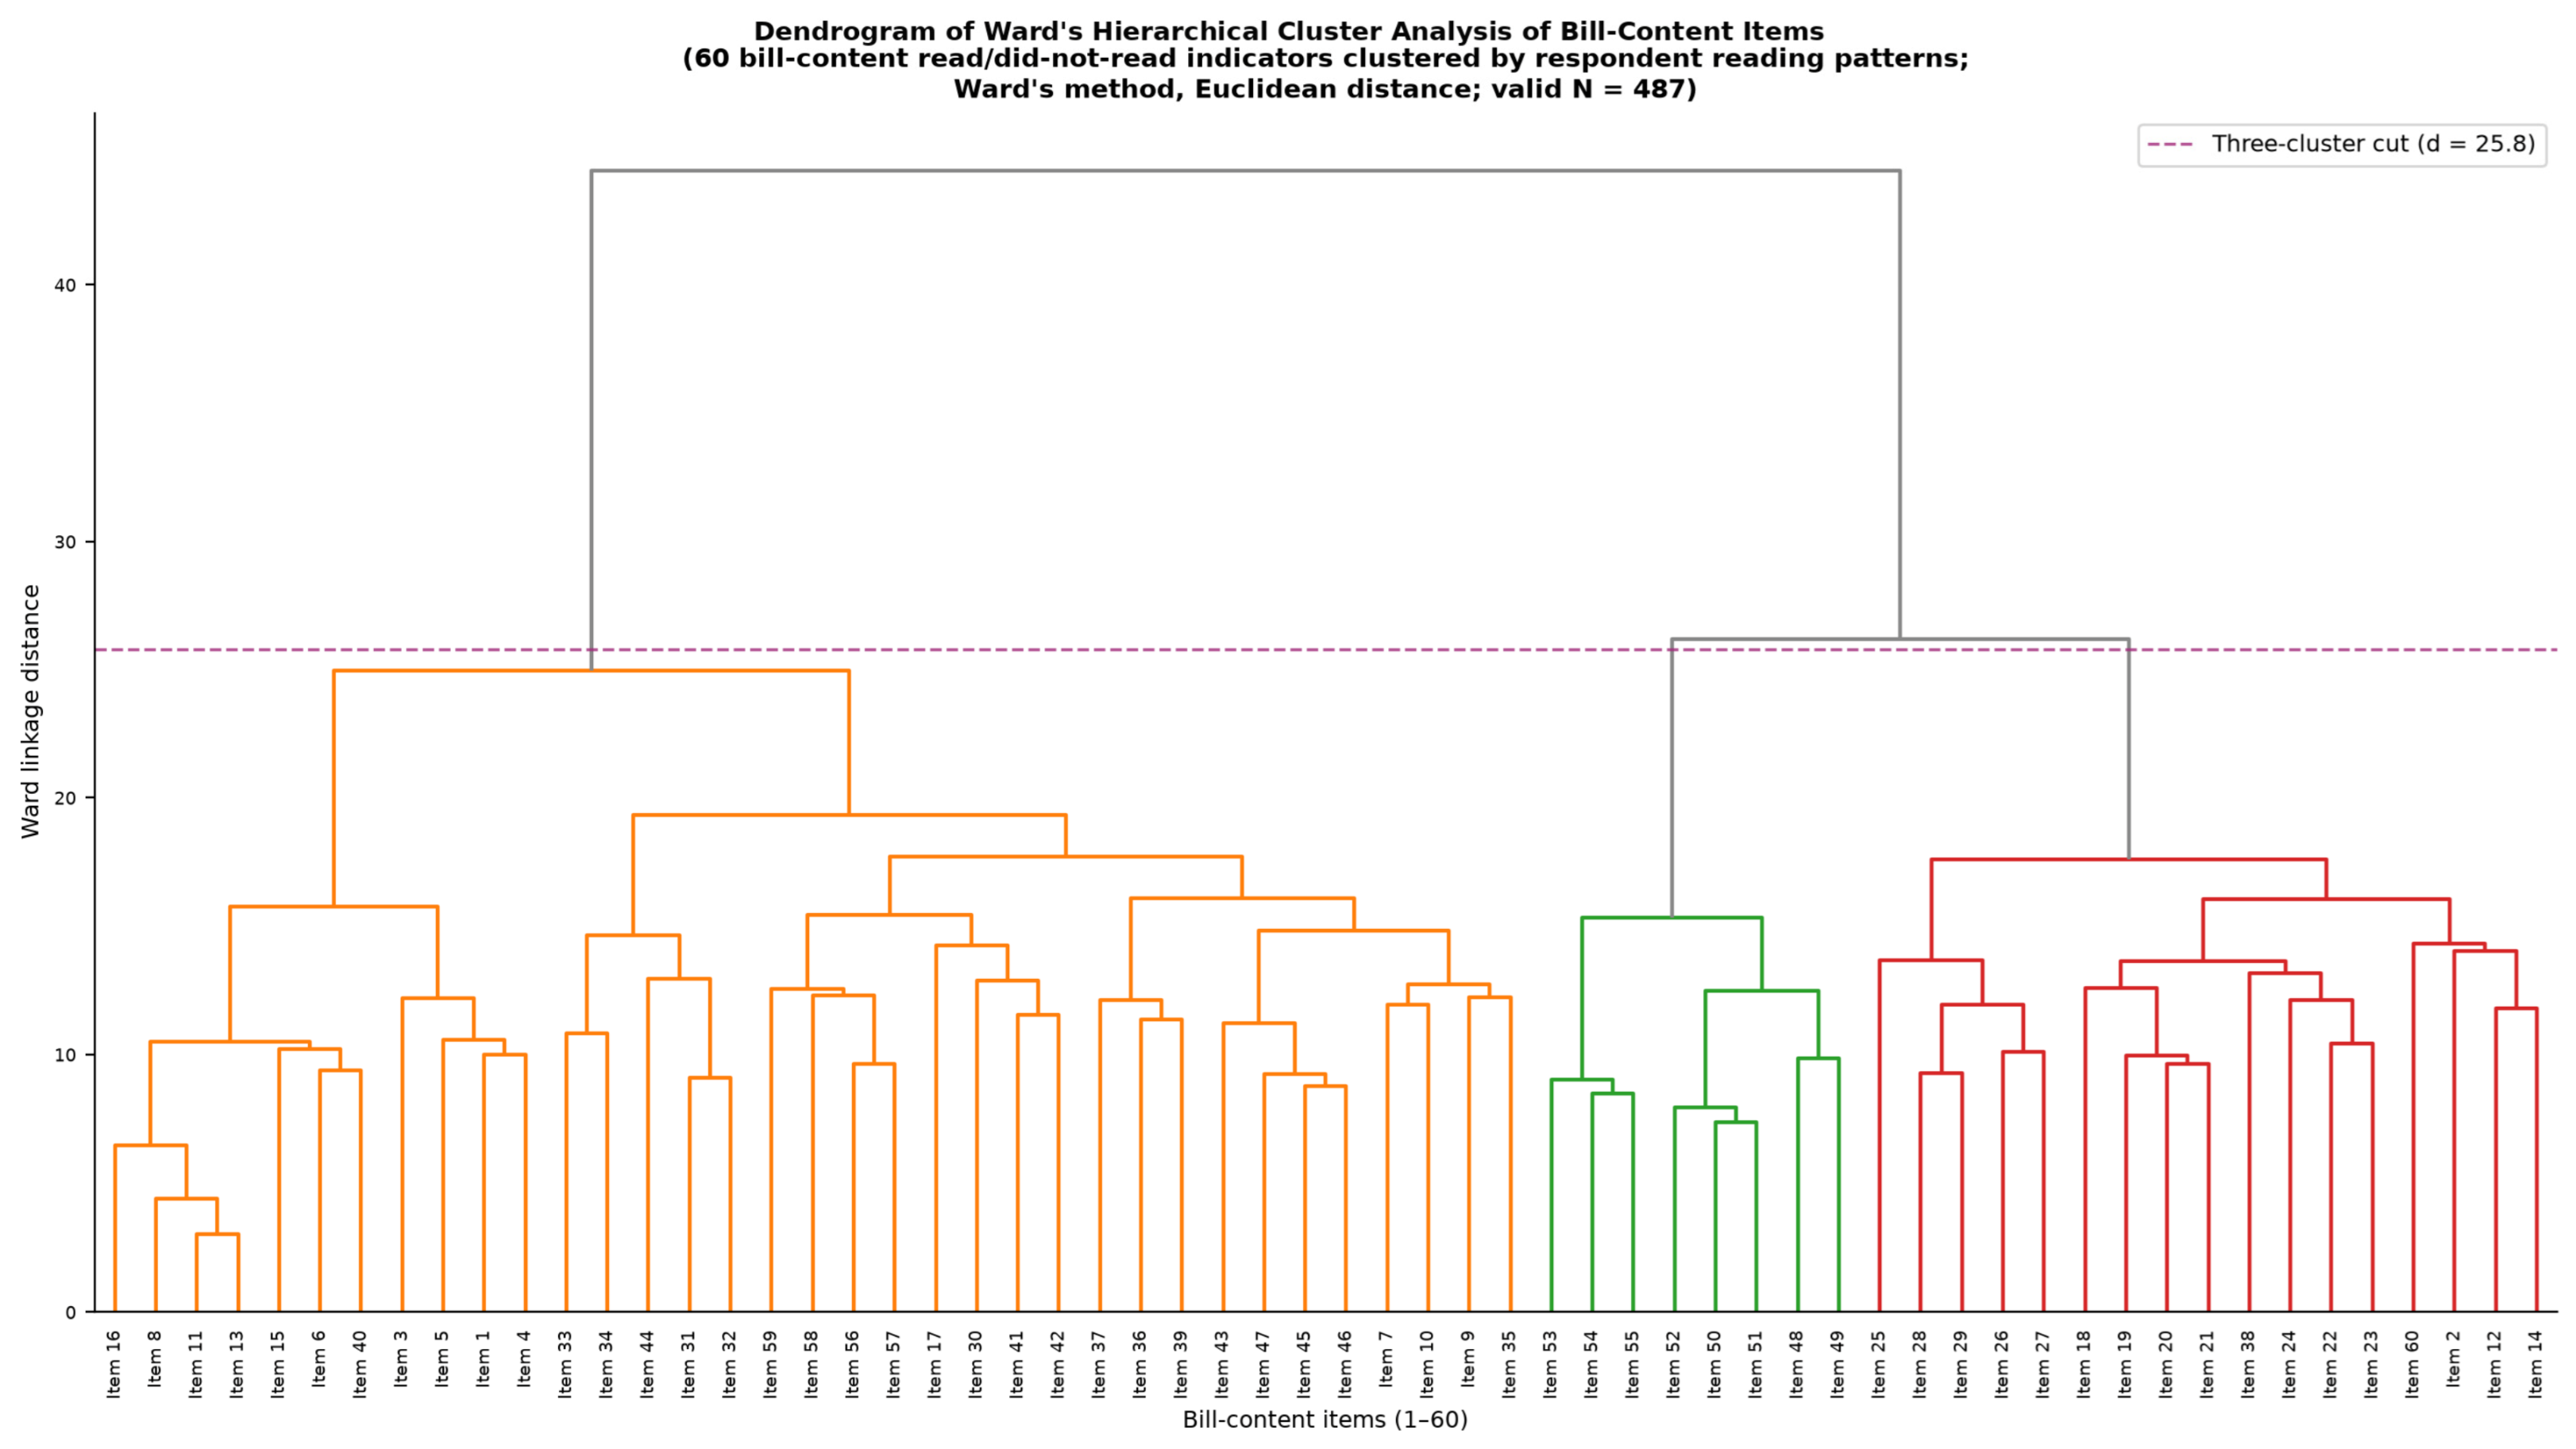
The clustering itself deserves closer comment, since cluster analysis rests on less settled conventions than the inferential tests used elsewhere. The number of clusters was not handed down by the method; it was fixed at three on the basis of the dendrogram produced by Ward’s procedure, read together with the substantive interpretability of the resulting groups. We treat this three-cluster solution as a defensible reading of the data rather than a uniquely correct one, because there is no universally agreed criterion for choosing the number of clusters and the technique does not support significance testing [60]. For transparency, the dendrogram on which the three-cluster reading rests is reproduced in Appendix C, and the full item composition of each cluster is reported in Table 1 (Section 4.5). Formal internal-validation criteria (for example, silhouette widths or the Caliński–Harabasz index) were not computed for the archived solution; they are committed, together with a stability check on resampled data, as part of the follow-up analyses. The reliability coefficients reported for each cluster (Cronbach’s α) (0.925 for the detailed-billing-parameters cluster, 0.797 for the transactional/payment cluster, and 0.892 for the regulatory/legal cluster) call for similar care: a high α confirms that the items within a cluster are answered consistently, but it is sensitive to the number of items and does not, on its own, establish that the clusters are dimensionally distinct. These coefficients are therefore presented as evidence of internal consistency, not as proof of construct validity.
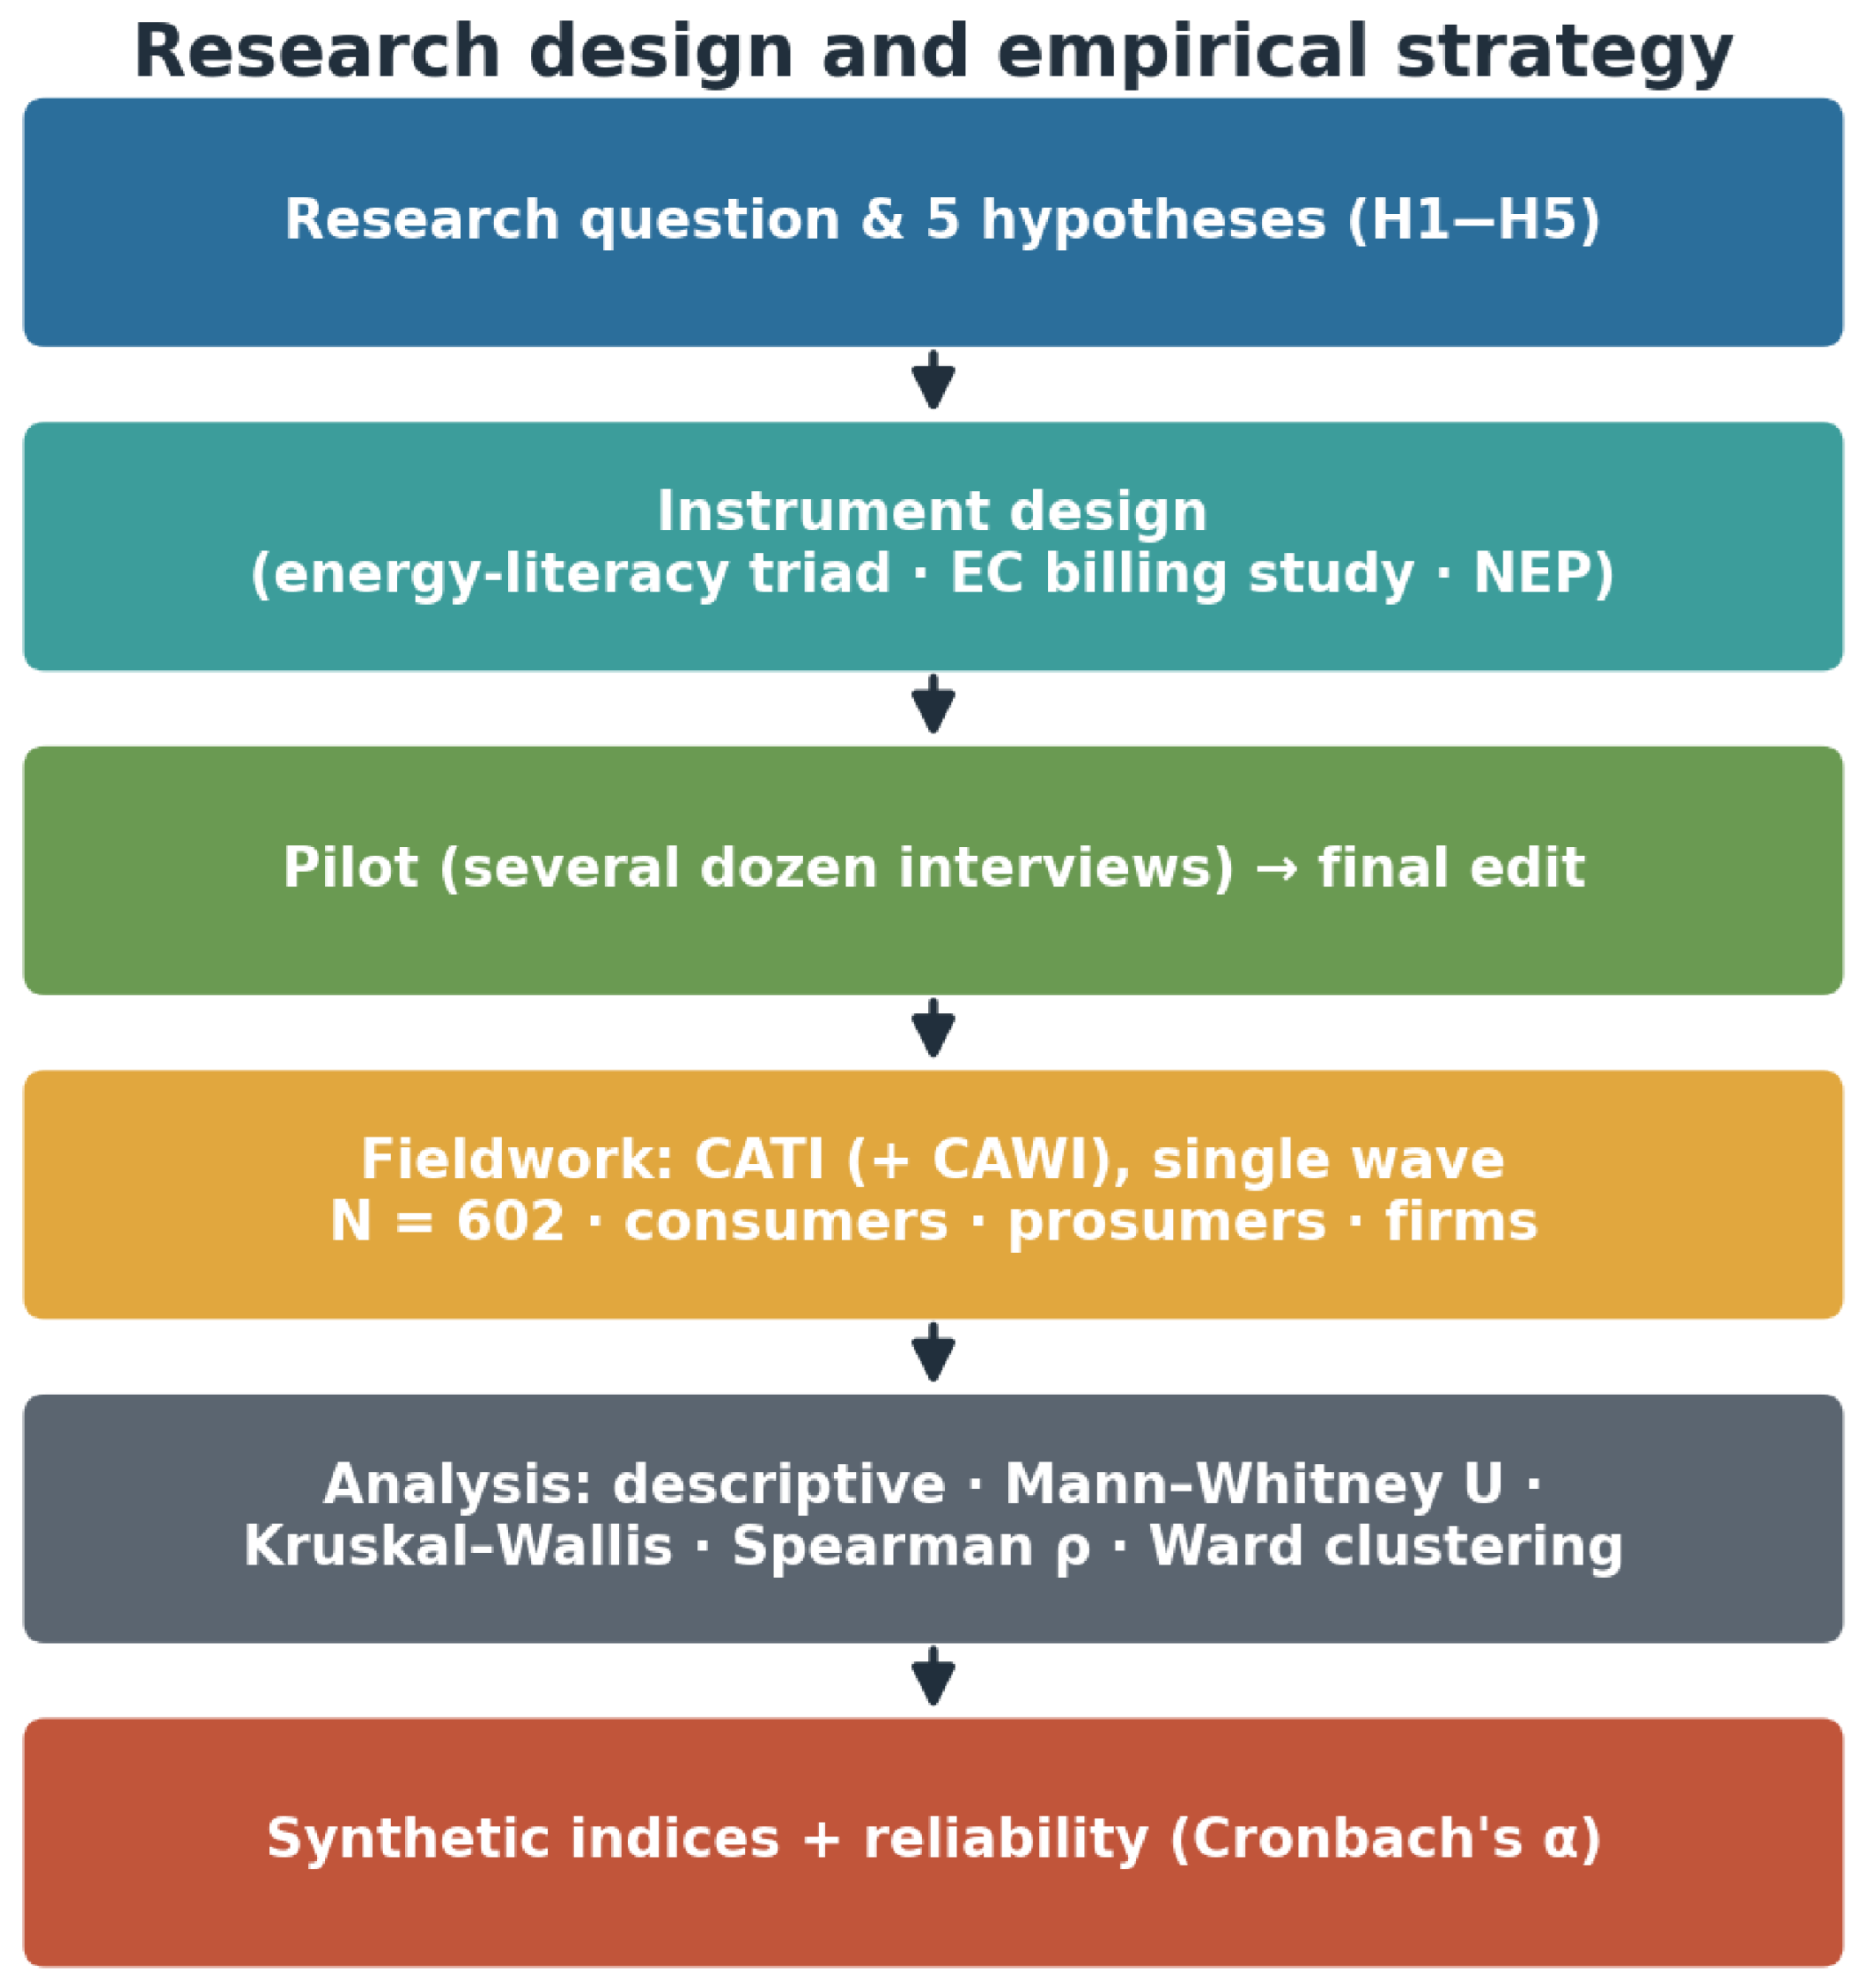
Figure 5 summarises the resulting research design as a sequence of steps.

4. Results

4.1. Self-Declared Knowledge of Electricity Billing

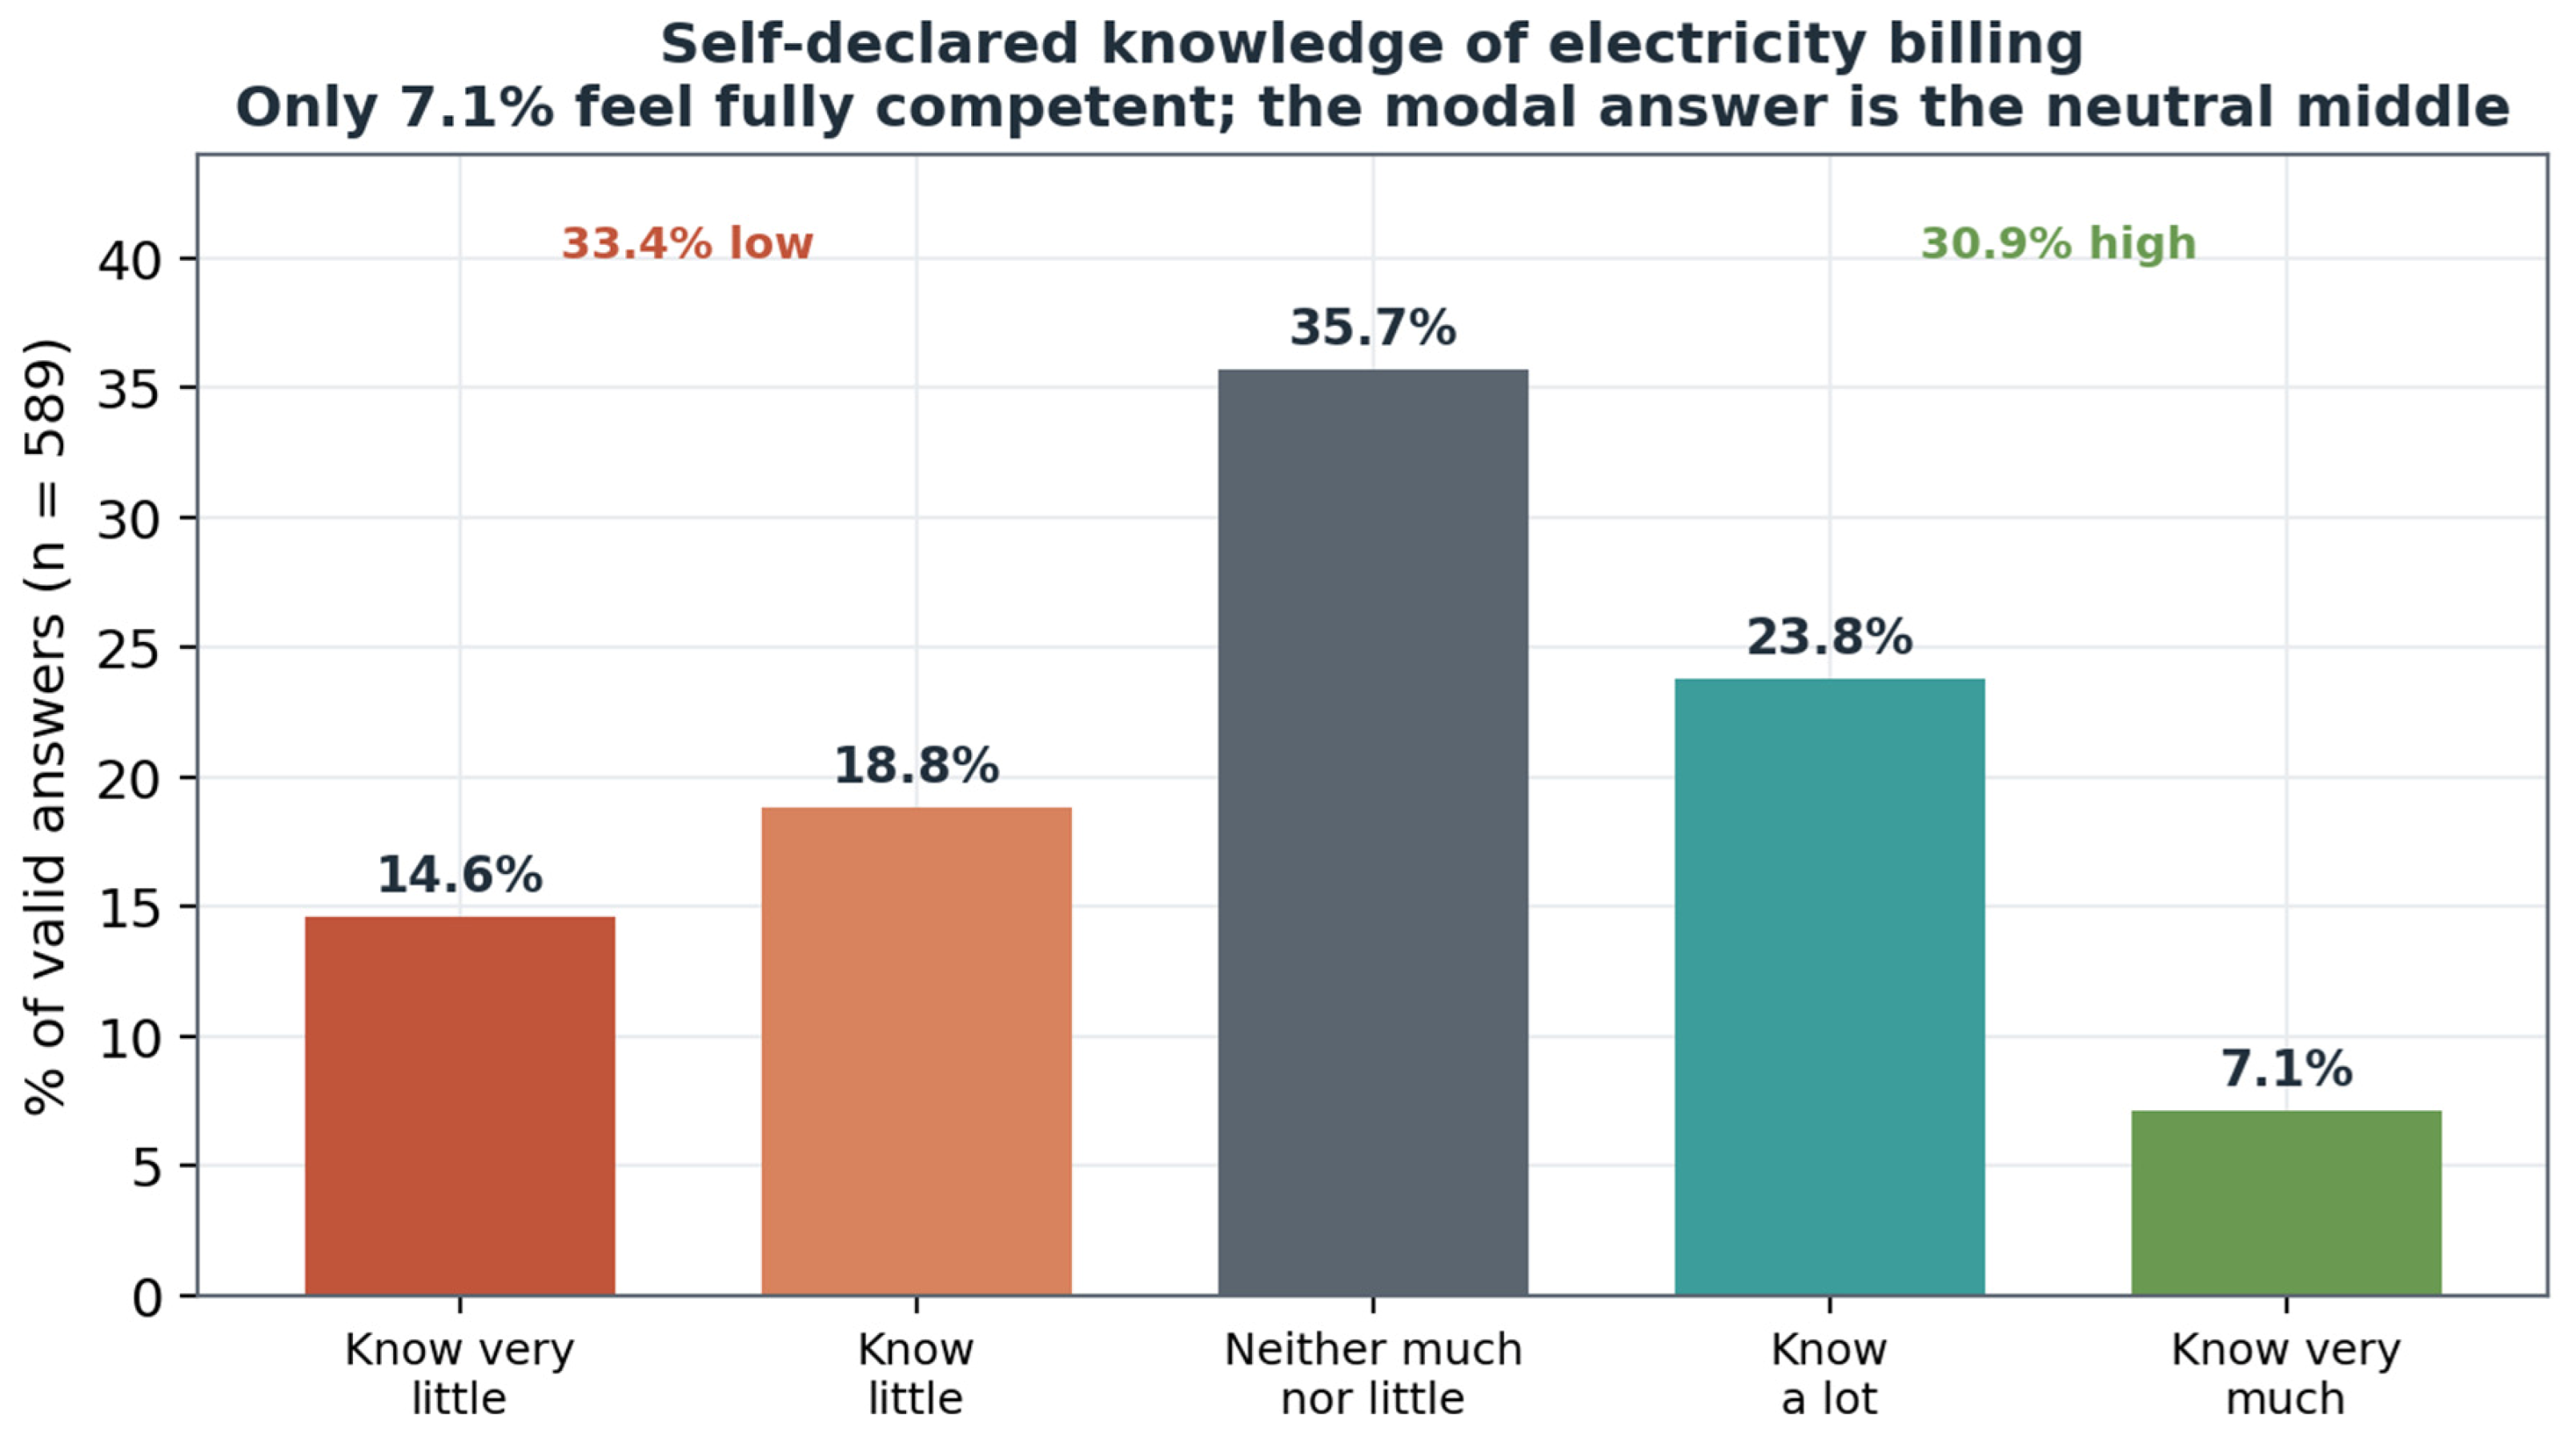
Figure 6 shows the distribution of self-declared knowledge of electricity billing. The dominant category was the neutral answer (“neither much nor little”), chosen by 35.7% of respondents. Only 7.1% declared a very high level of knowledge, while 14.6% admitted to knowing very little and a further 18.8% to knowing little—so that, summing the tails, the negative side (33.4%) slightly outweighs the positive (30.9%). A concentration of answers in the safe middle of a scale, coupled with so few respondents willing to call themselves experts, is a familiar signal in social research: it points less to genuine indifference than to a widespread lack of confidence in one’s own grasp of how the bill is put together.
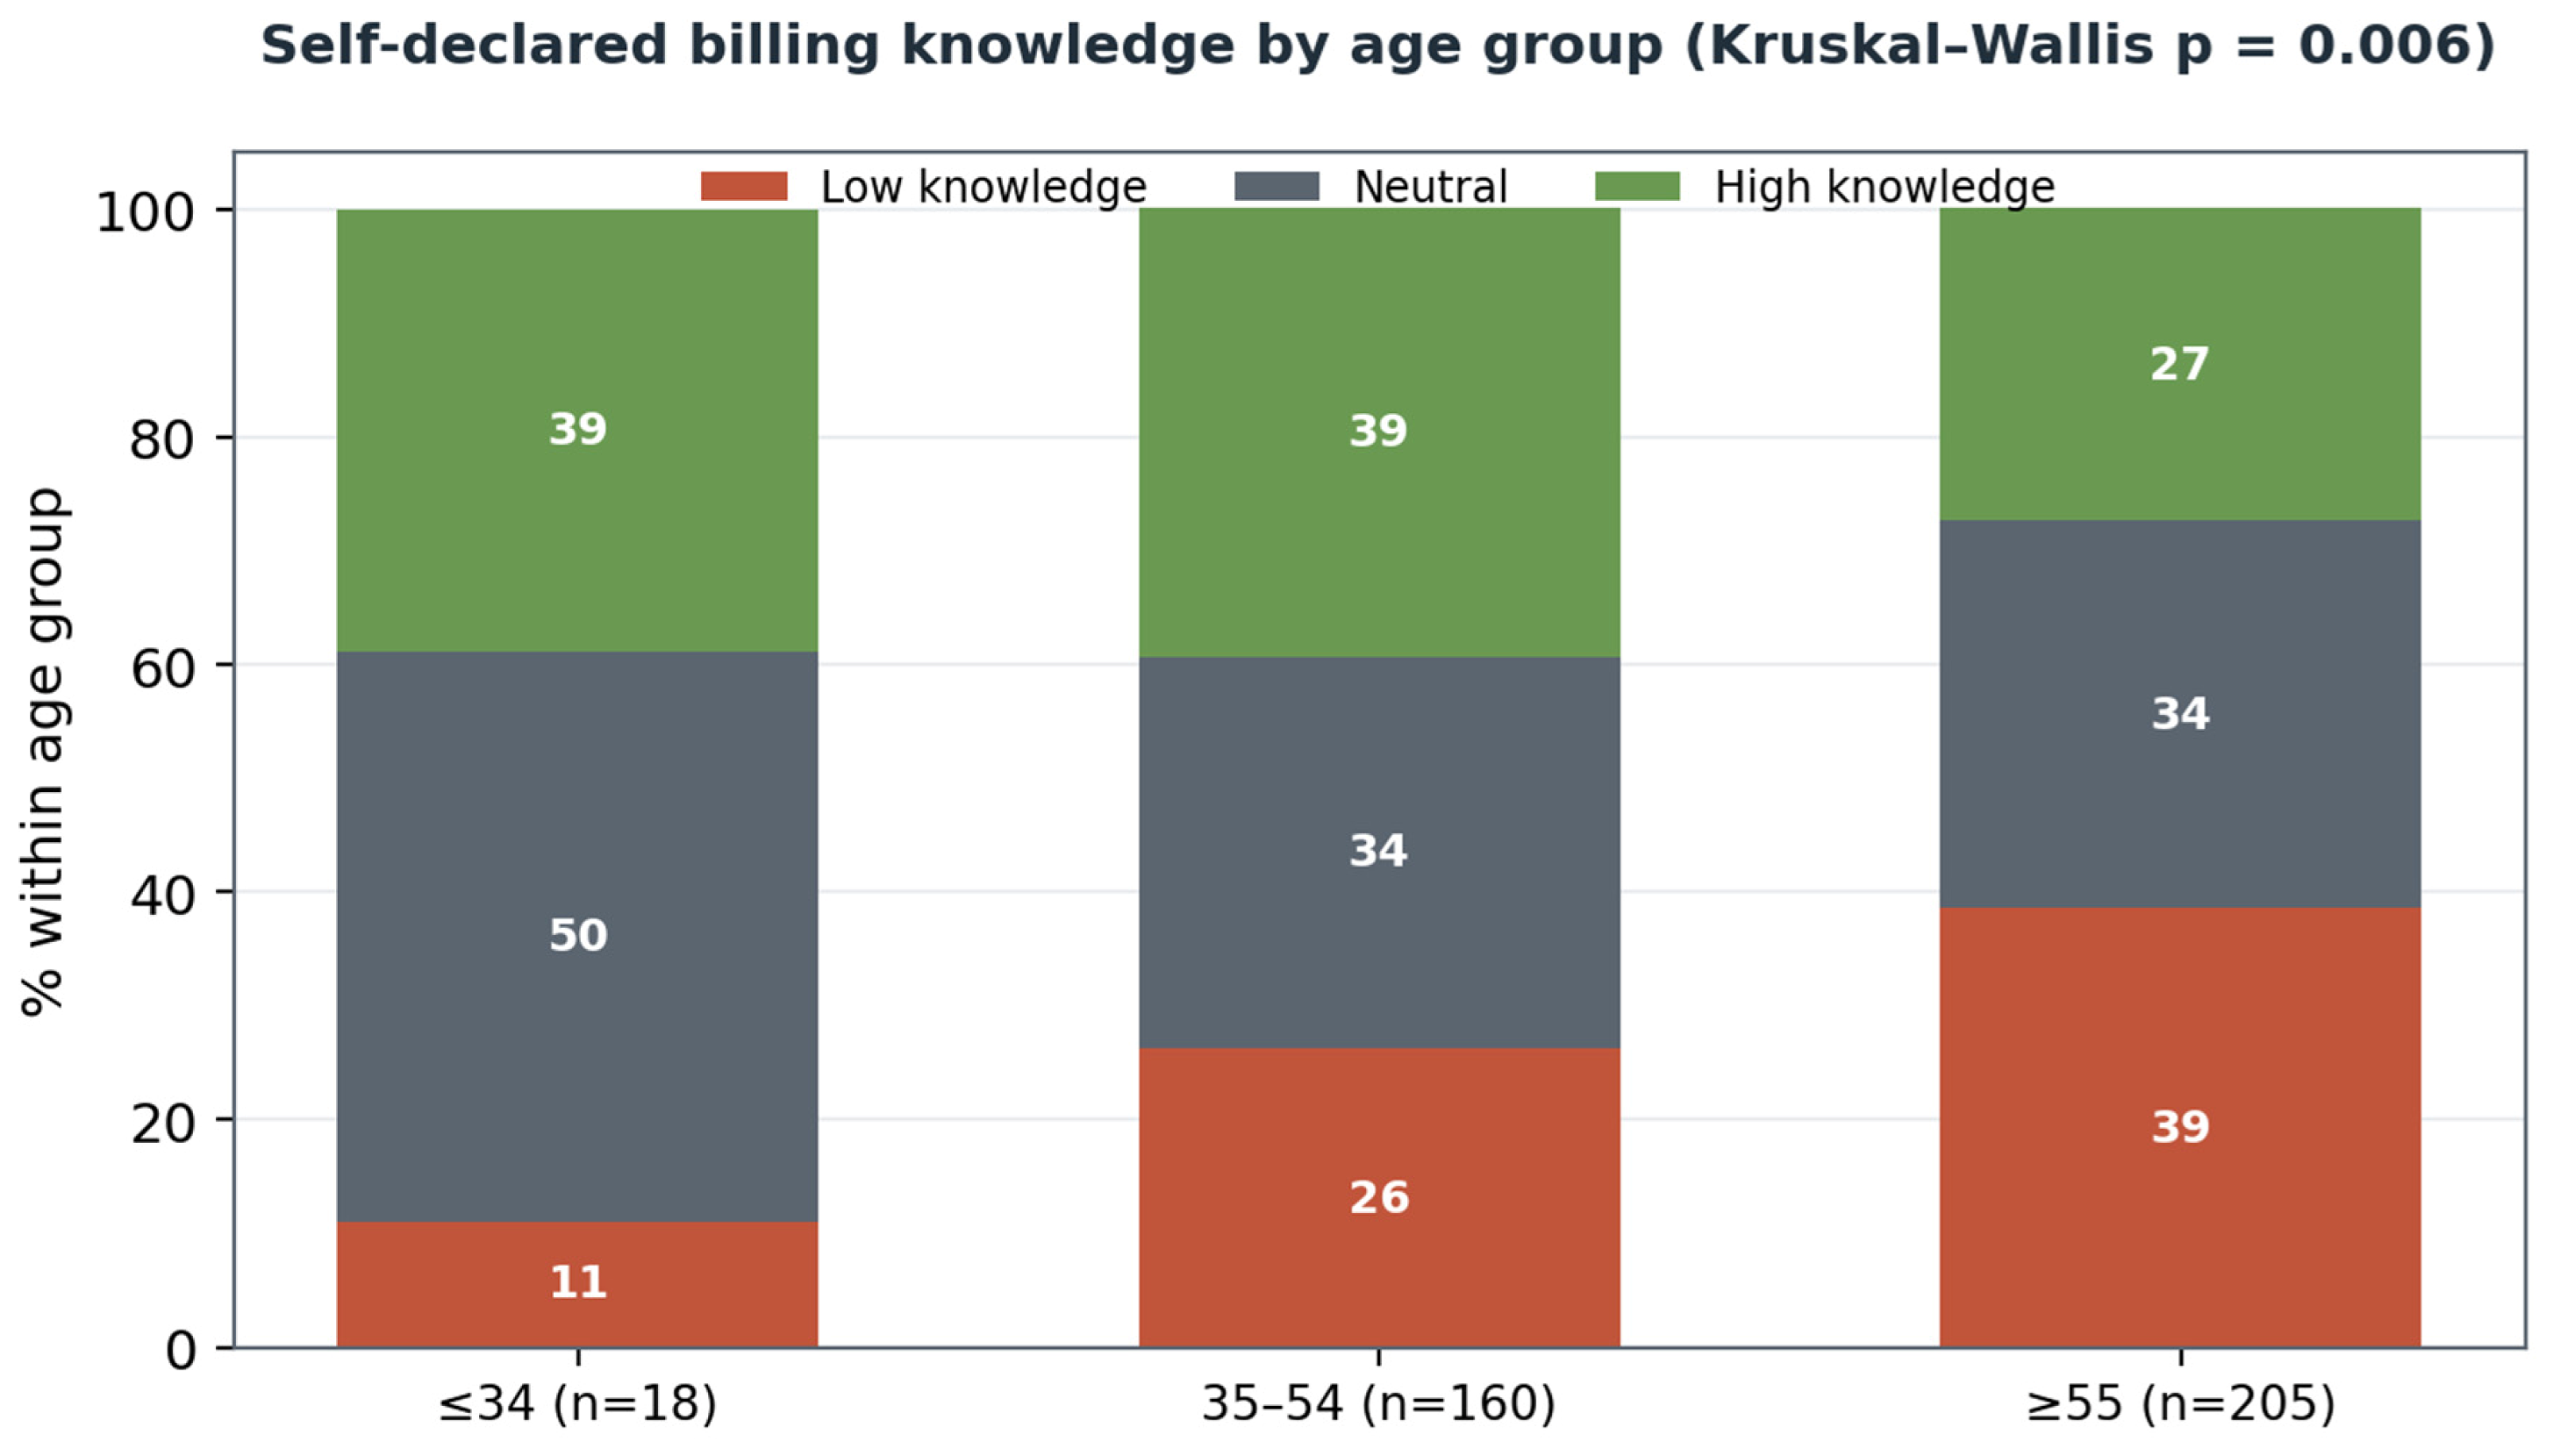
The statistical tests support H1; all comparisons in this subsection are unadjusted bivariate contrasts and should be read together with the structural analysis of Section 4.8 and the limitations discussed in Section 5. Significant differences appeared between women and men (p = 0.026), between age groups (p = 0.006), and by material situation (p = 0.001). Men declared higher competence than women—taken together, 37.2% of men said they knew “a lot” or “very much” against 25.5% of women, while women more often retreated to the neutral middle (39.9% vs. 33.1%). The age gradient is starker still, and Figure 7 displays it. The highest sense of competence was reported by those aged 35–54 (39.4% high), with the youngest group close behind (38.9% high, and—tellingly—not a single respondent under 34 claiming to know “very little”); the lowest came from the 55-plus group, where 38.6% placed themselves in the two lowest categories and only 5.9% in the highest. Respondents reporting a better financial situation likewise declared higher billing knowledge than those describing their household as financially constrained.

4.2. Perception of the Amount of Information on the Bill

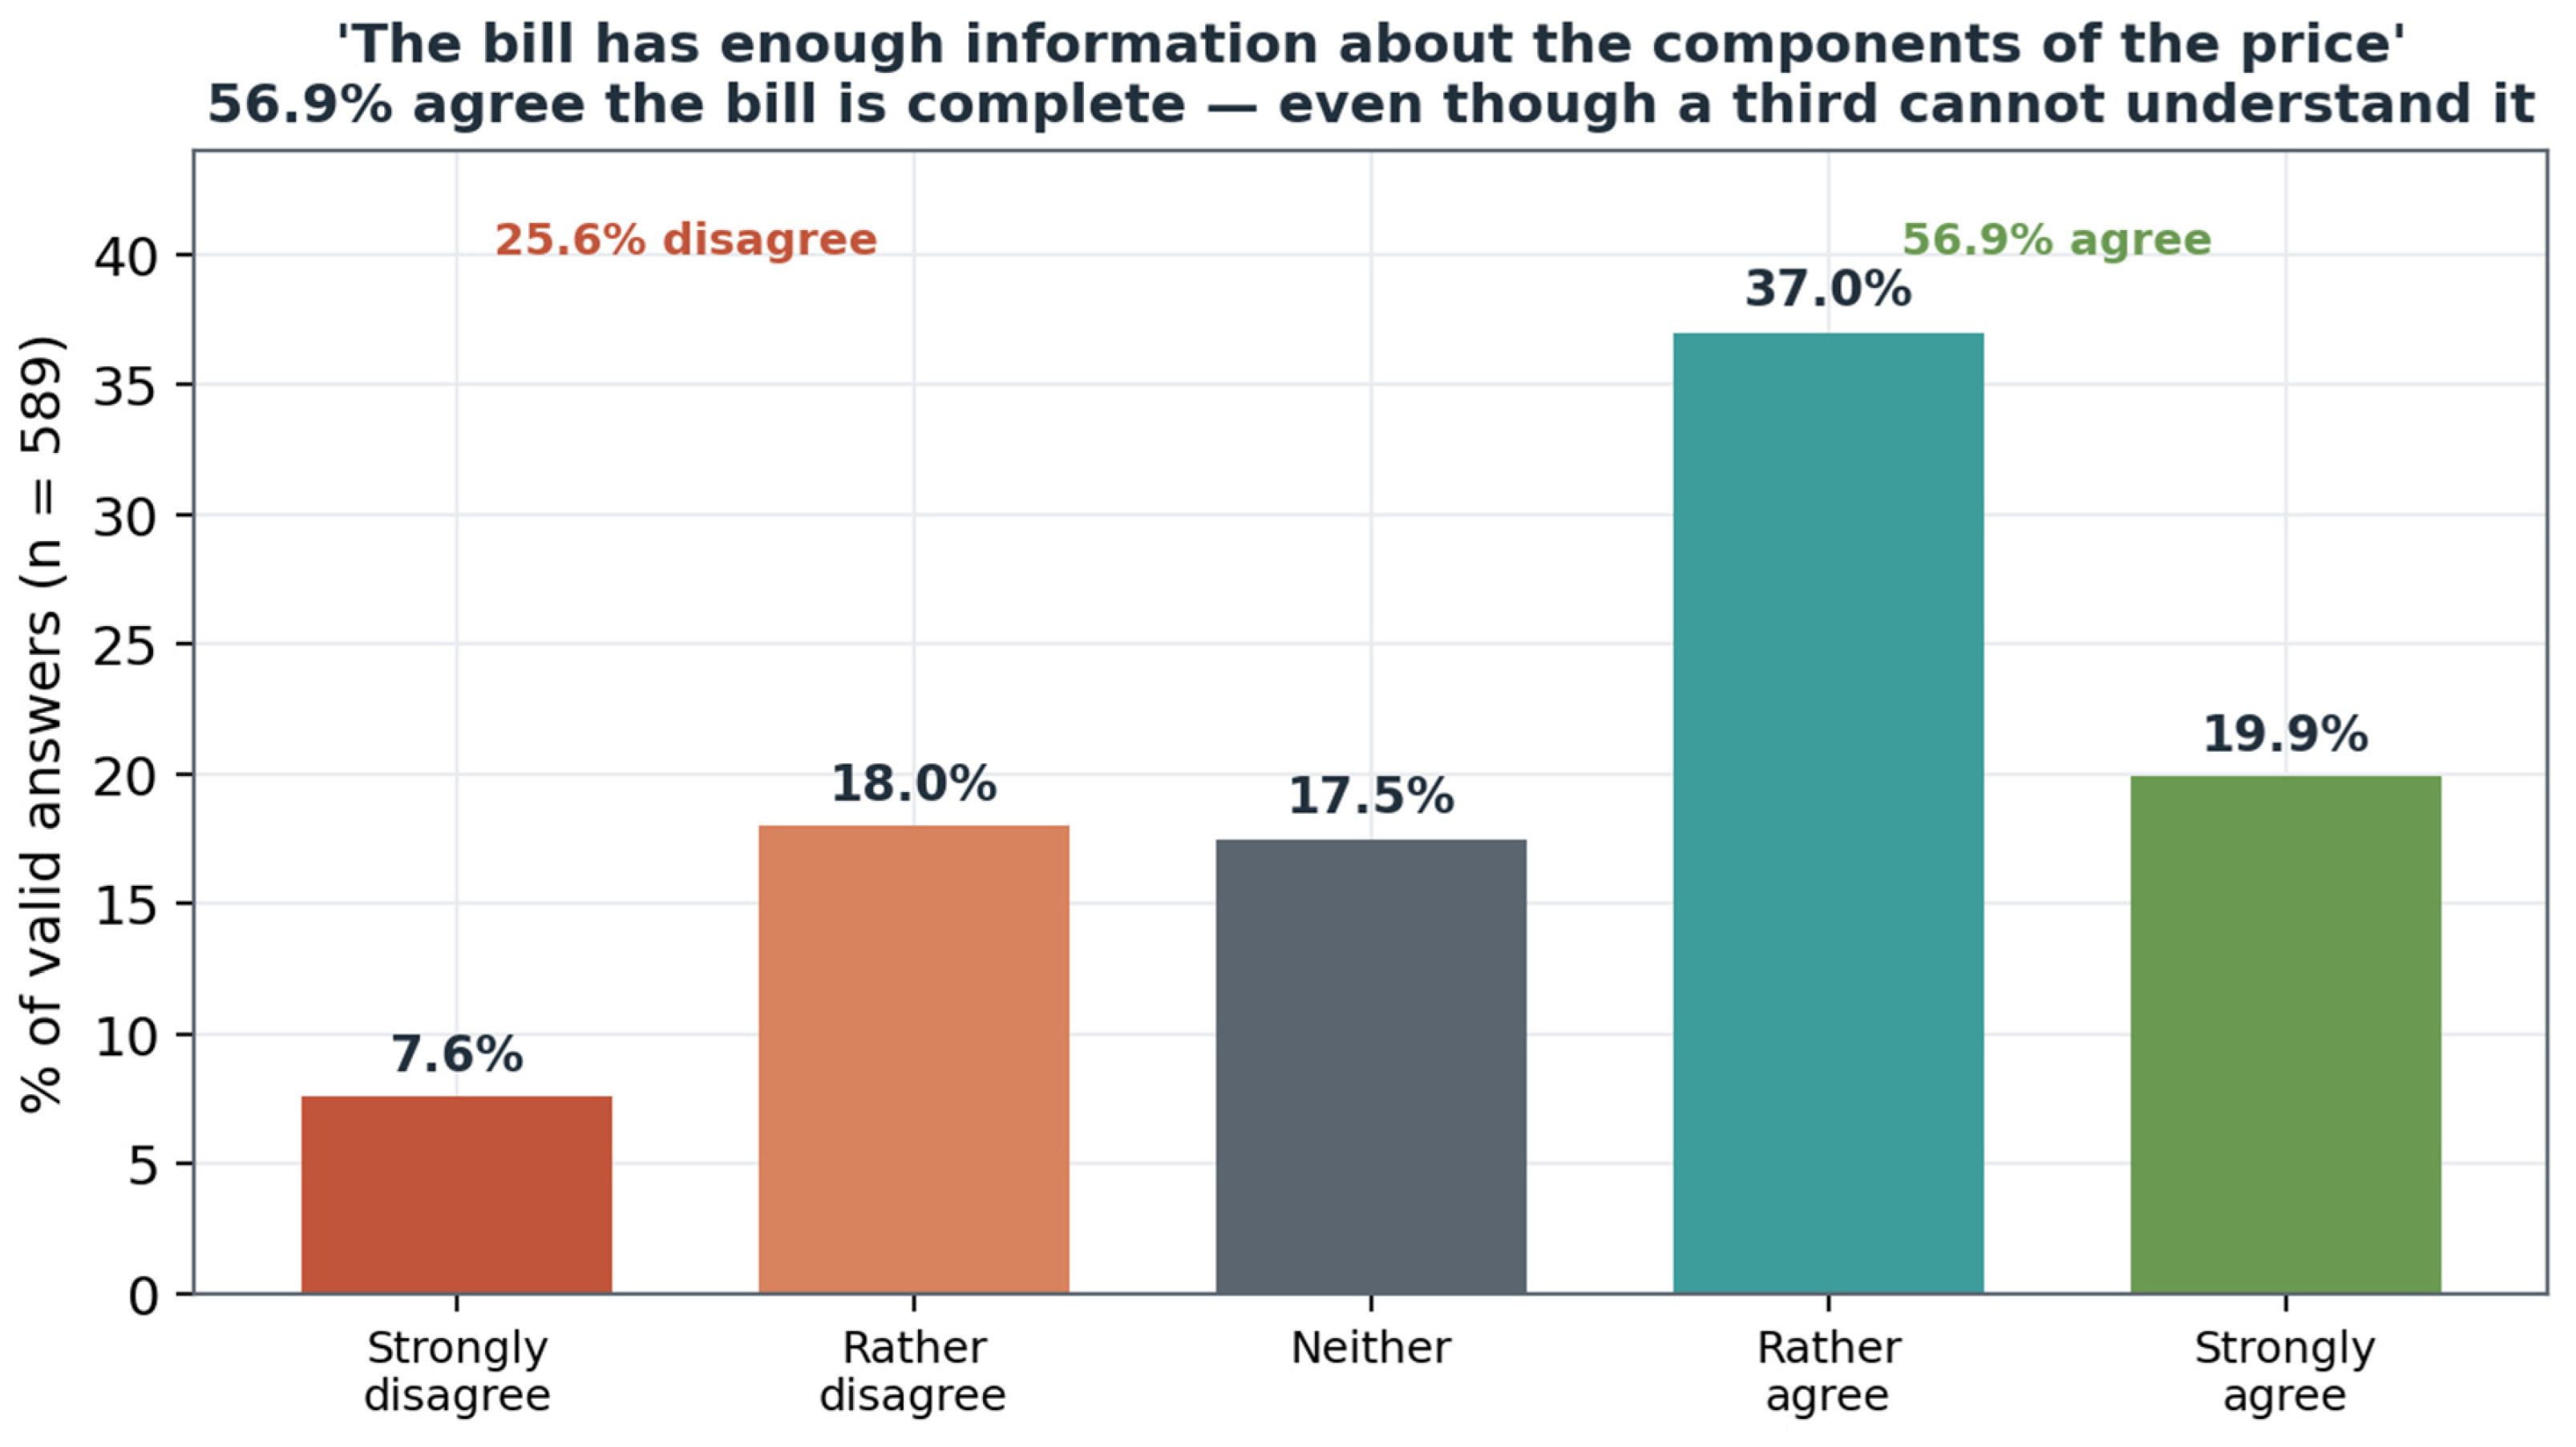
Most respondents (56.9%) judged that the bill contains a sufficient amount of information about the components of the price. The full distribution (Figure 8) shows that 19.9% strongly agreed and 37.0% rather agreed the bill is informationally complete, against only 25.6% who disagreed and 17.5% who could not say. The Kruskal–Wallis test found no statistically significant differences between customer groups (p = 0.950). Strictly, this result does not demonstrate that perceptions are uniform: under the frequentist framework a non-significant test cannot establish equivalence, which would require a dedicated procedure such as two one-sided tests (TOST). H2 is therefore not rejected by the data rather than positively confirmed, and the descriptive similarity of the distributions across customer roles should be read in that light. The reading is striking when set against the comprehension figures: a clear majority believe nothing important is missing from the bill, yet a third cannot understand it. The principal challenge, in other words, lies not in the quantity of information presented but in its interpretability—a point we return to as the paradox of informational completeness in Section 5.

4.3. Perceived Influence of Legal Regulation on Bill Complexity

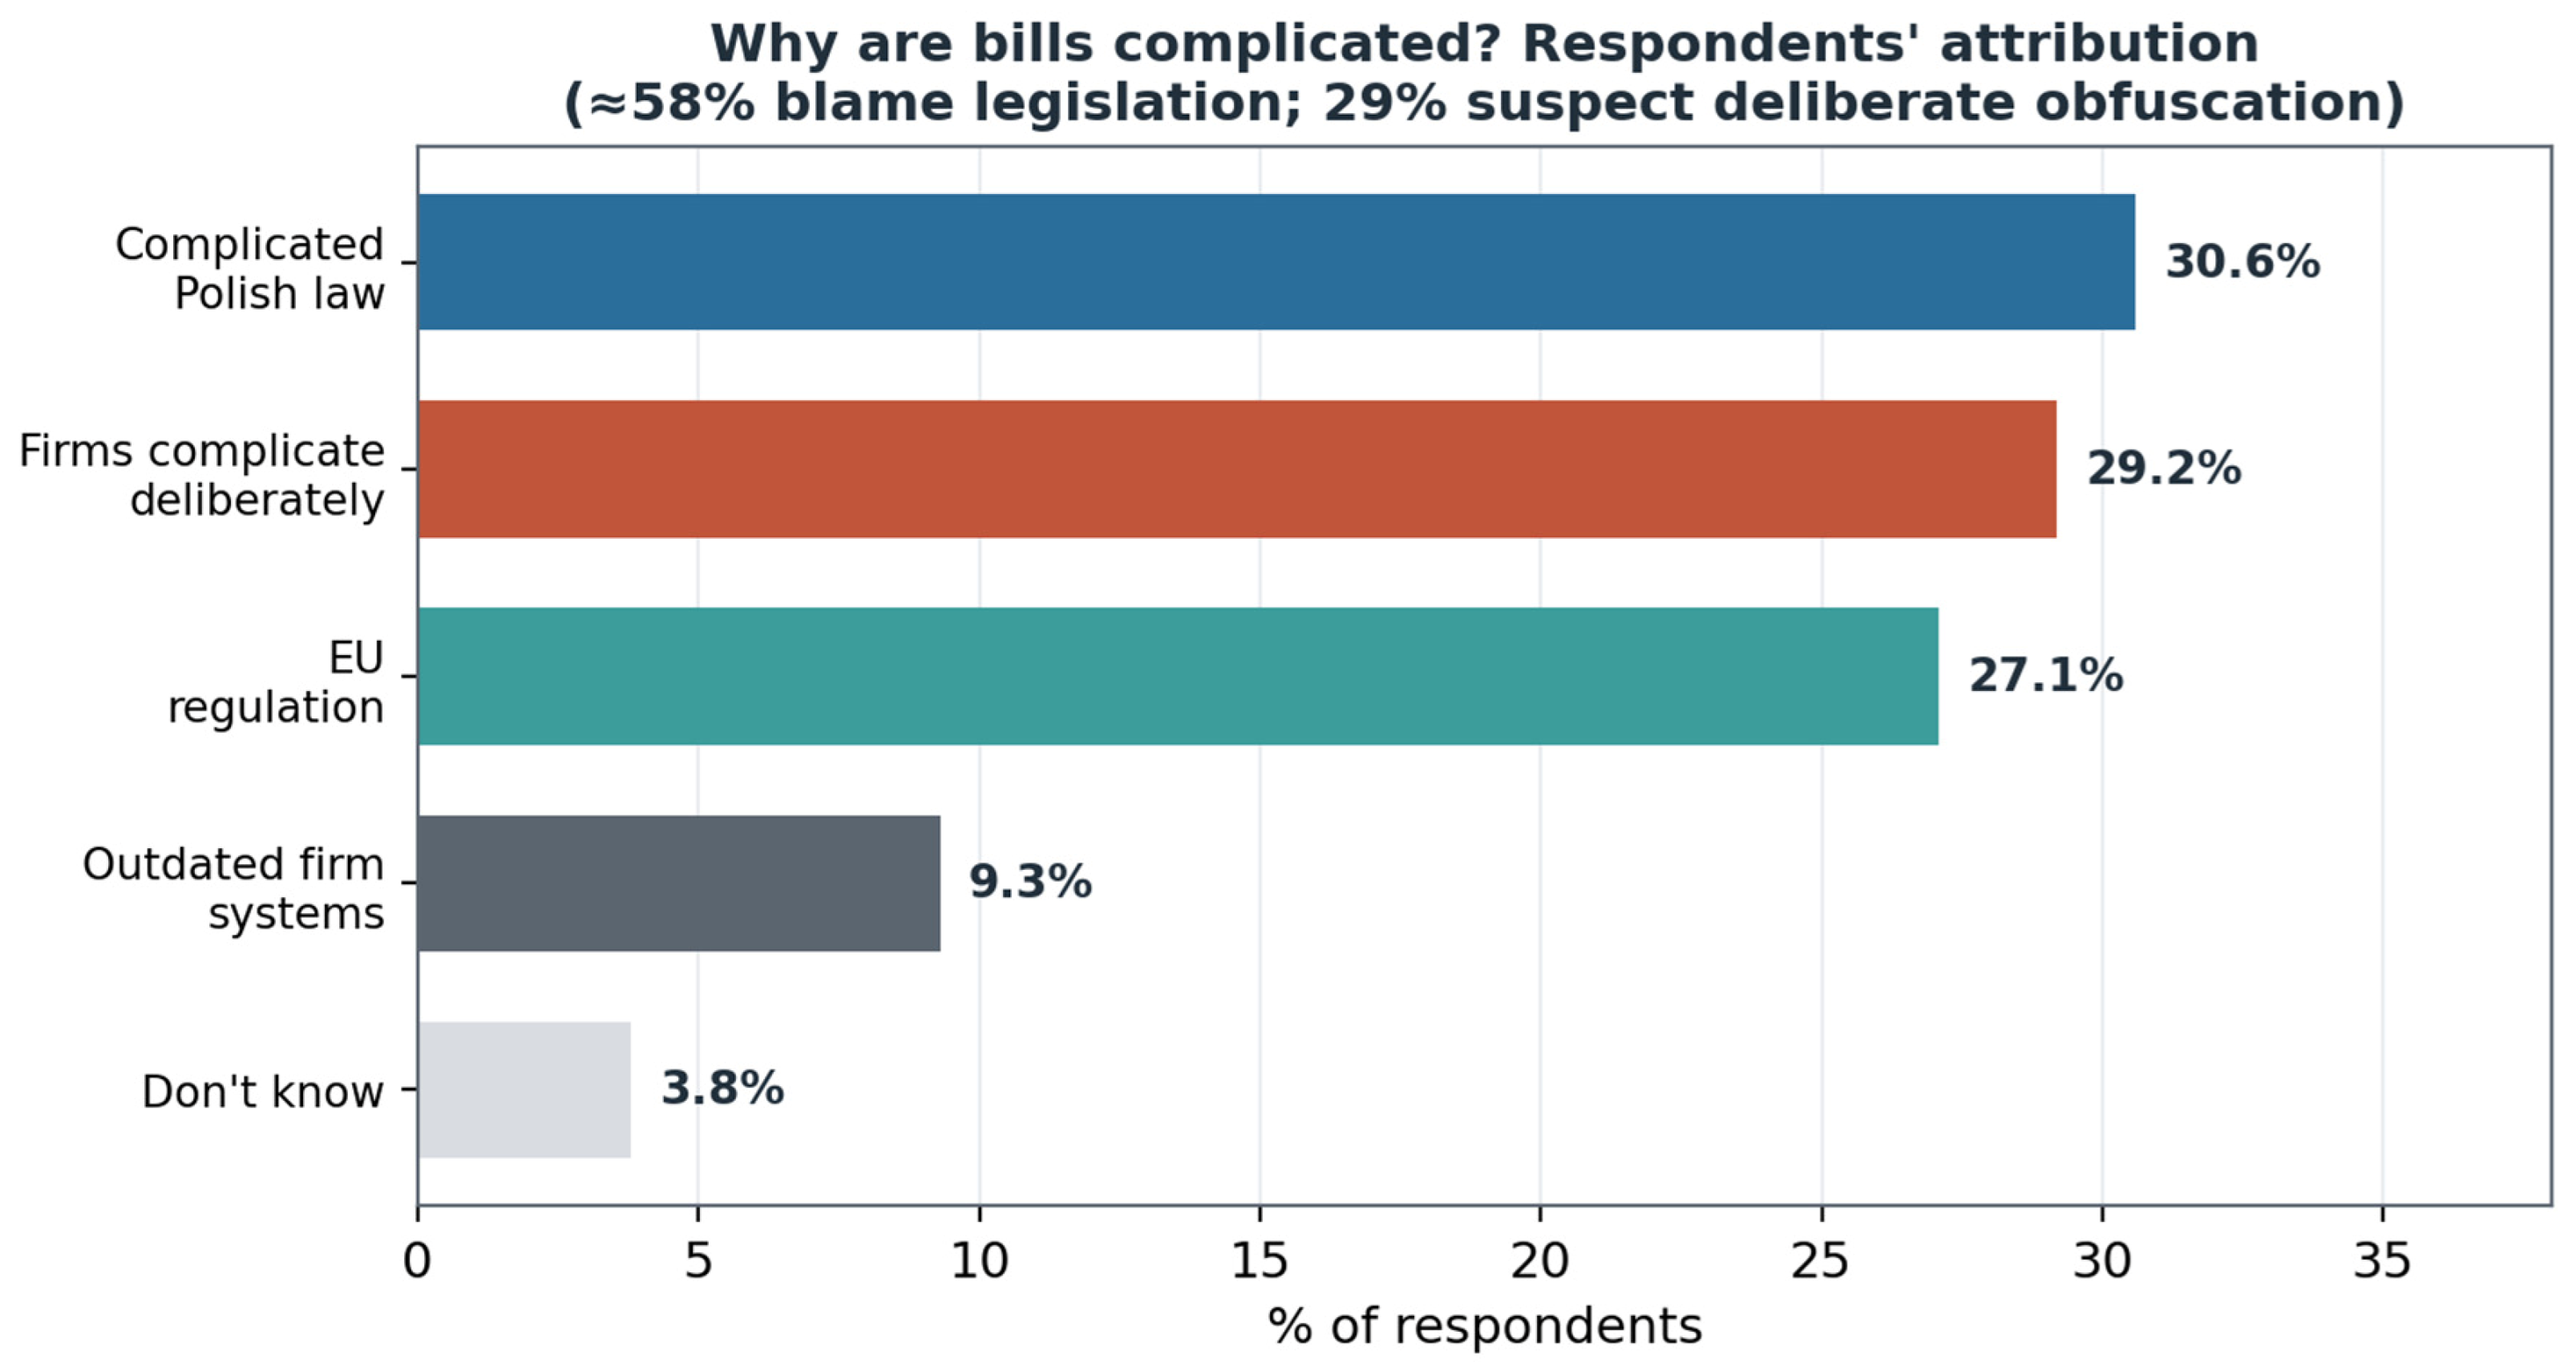
The largest group of respondents (30.6%) put the complexity of bills down to complicated provisions of Polish law. Add the share pointing to European regulation (27.1%), and it emerges that nearly 58% see the content of bills as imposed from above by legislation. Almost one in three (29.2%) took a more sceptical line, holding that energy companies deliberately complicate bills to hide the true costs from customers—a clear signal of a trust deficit in the sector. Only 9.3% identified outdated company systems and procedures as the problem, which suggests customers tend to see energy firms as operationally competent but hemmed in by law, or else as acting in bad faith. The very low share of “don’t know” responses (3.8%) shows that respondents had a firmly formed view: the subject of bills stirs emotion and touches almost everyone. Read on their own, these attributions would be weak evidence for H3: pointing to legislation is not in itself a mistake, since the content of the bill is indeed heavily determined by law, and perceived causes of complexity are not the same thing as knowledge of the regulatory framework. The probative weight lies in the combination with the direct question analysed next—it is the inability to identify who determines the bill’s content, rather than the attribution of complexity as such, that indicates low regulatory awareness. Figure 9 displays the full pattern of attributions.
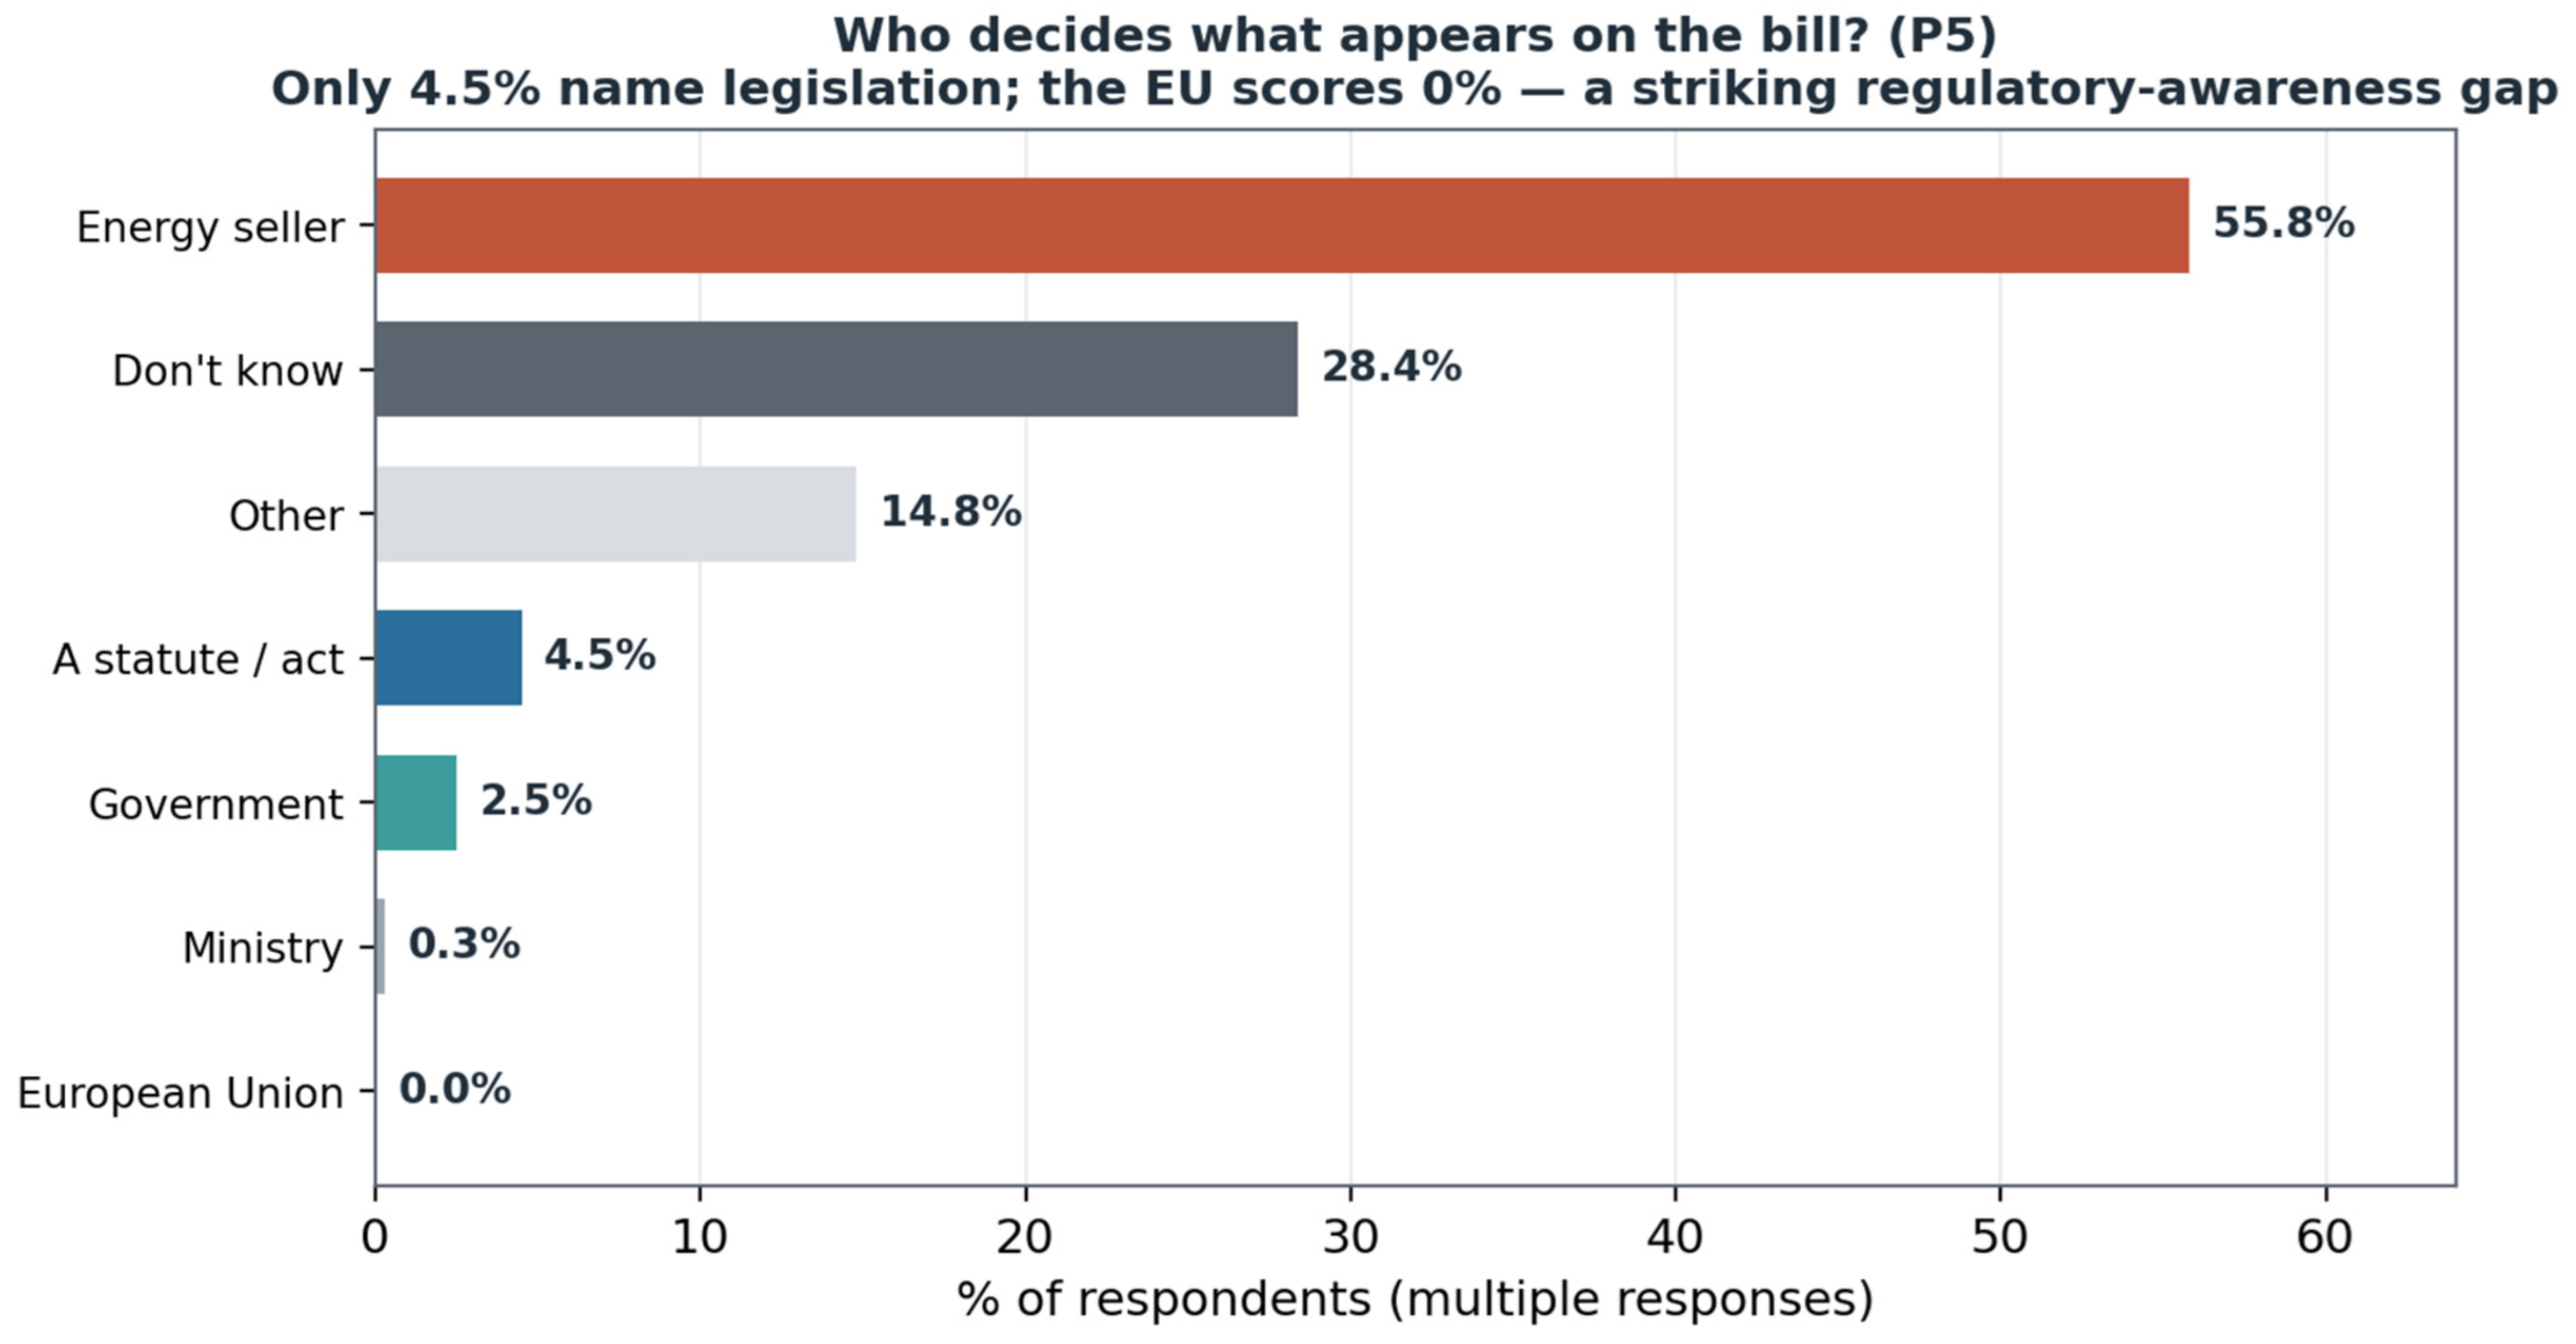
A second, more pointed question probed the same terrain from the opposite direction: not what makes the bill complicated, but who actually decides what goes on it. Here the regulatory-awareness deficit shows up even more starkly (Figure 10). A clear majority—55.8%—named the energy seller as the party that determines the bill’s content, treating the document as a purely commercial artefact issued by a company rather than one whose shape is prescribed by law. Only 4.5% pointed to a statute, 2.5% to the government and 0.3% to a ministry, and—remarkably—not a single respondent (0%) named the European Union, despite the decisive influence of EU directives on the Polish energy market. Nearly three in ten (28.4%) simply could not say who shapes the bill at all. Taken together with the attribution pattern in Figure 9, this is the sharpest single piece of evidence for H3: consumers experience the bill’s regulatory content without recognising it as regulatory, so that the legal scaffolding of the document is at once ever-present and invisible.
The open-ended answers of those who chose “other” (14.8% of respondents) reinforce the point rather than softening it. The single largest sub-group—35.2% of the open answers—named specific internal parts of the supplier (the management board, the accounting department, the IT team), which only deepens the picture of the bill as the seller’s own creation. Where respondents did reach beyond the company, they most often invoked objective, apolitical forces: 16.5% pointed to market and technical factors (their own consumption, the tariff, the metering system) and a further 12.1% to the distributor and its infrastructure, so that close to 29% treated the bill as a neutral readout of measurement and technology rather than an instrument of policy. Notably, while the closed question all but erased the regulator, 13.2% of the open answers spontaneously named the Energy Regulatory Office (ERO), suggesting that the figure of the “regulator” is more firmly lodged in public awareness than abstract terms such as “ministry” or “government”. Explicit references to specific laws or regulations remained rare (12.1% of the open answers), which again underlines how thin consumers’ legal awareness is in this domain.

4.4. Energy Literacy and Bill Comprehension: Correlations

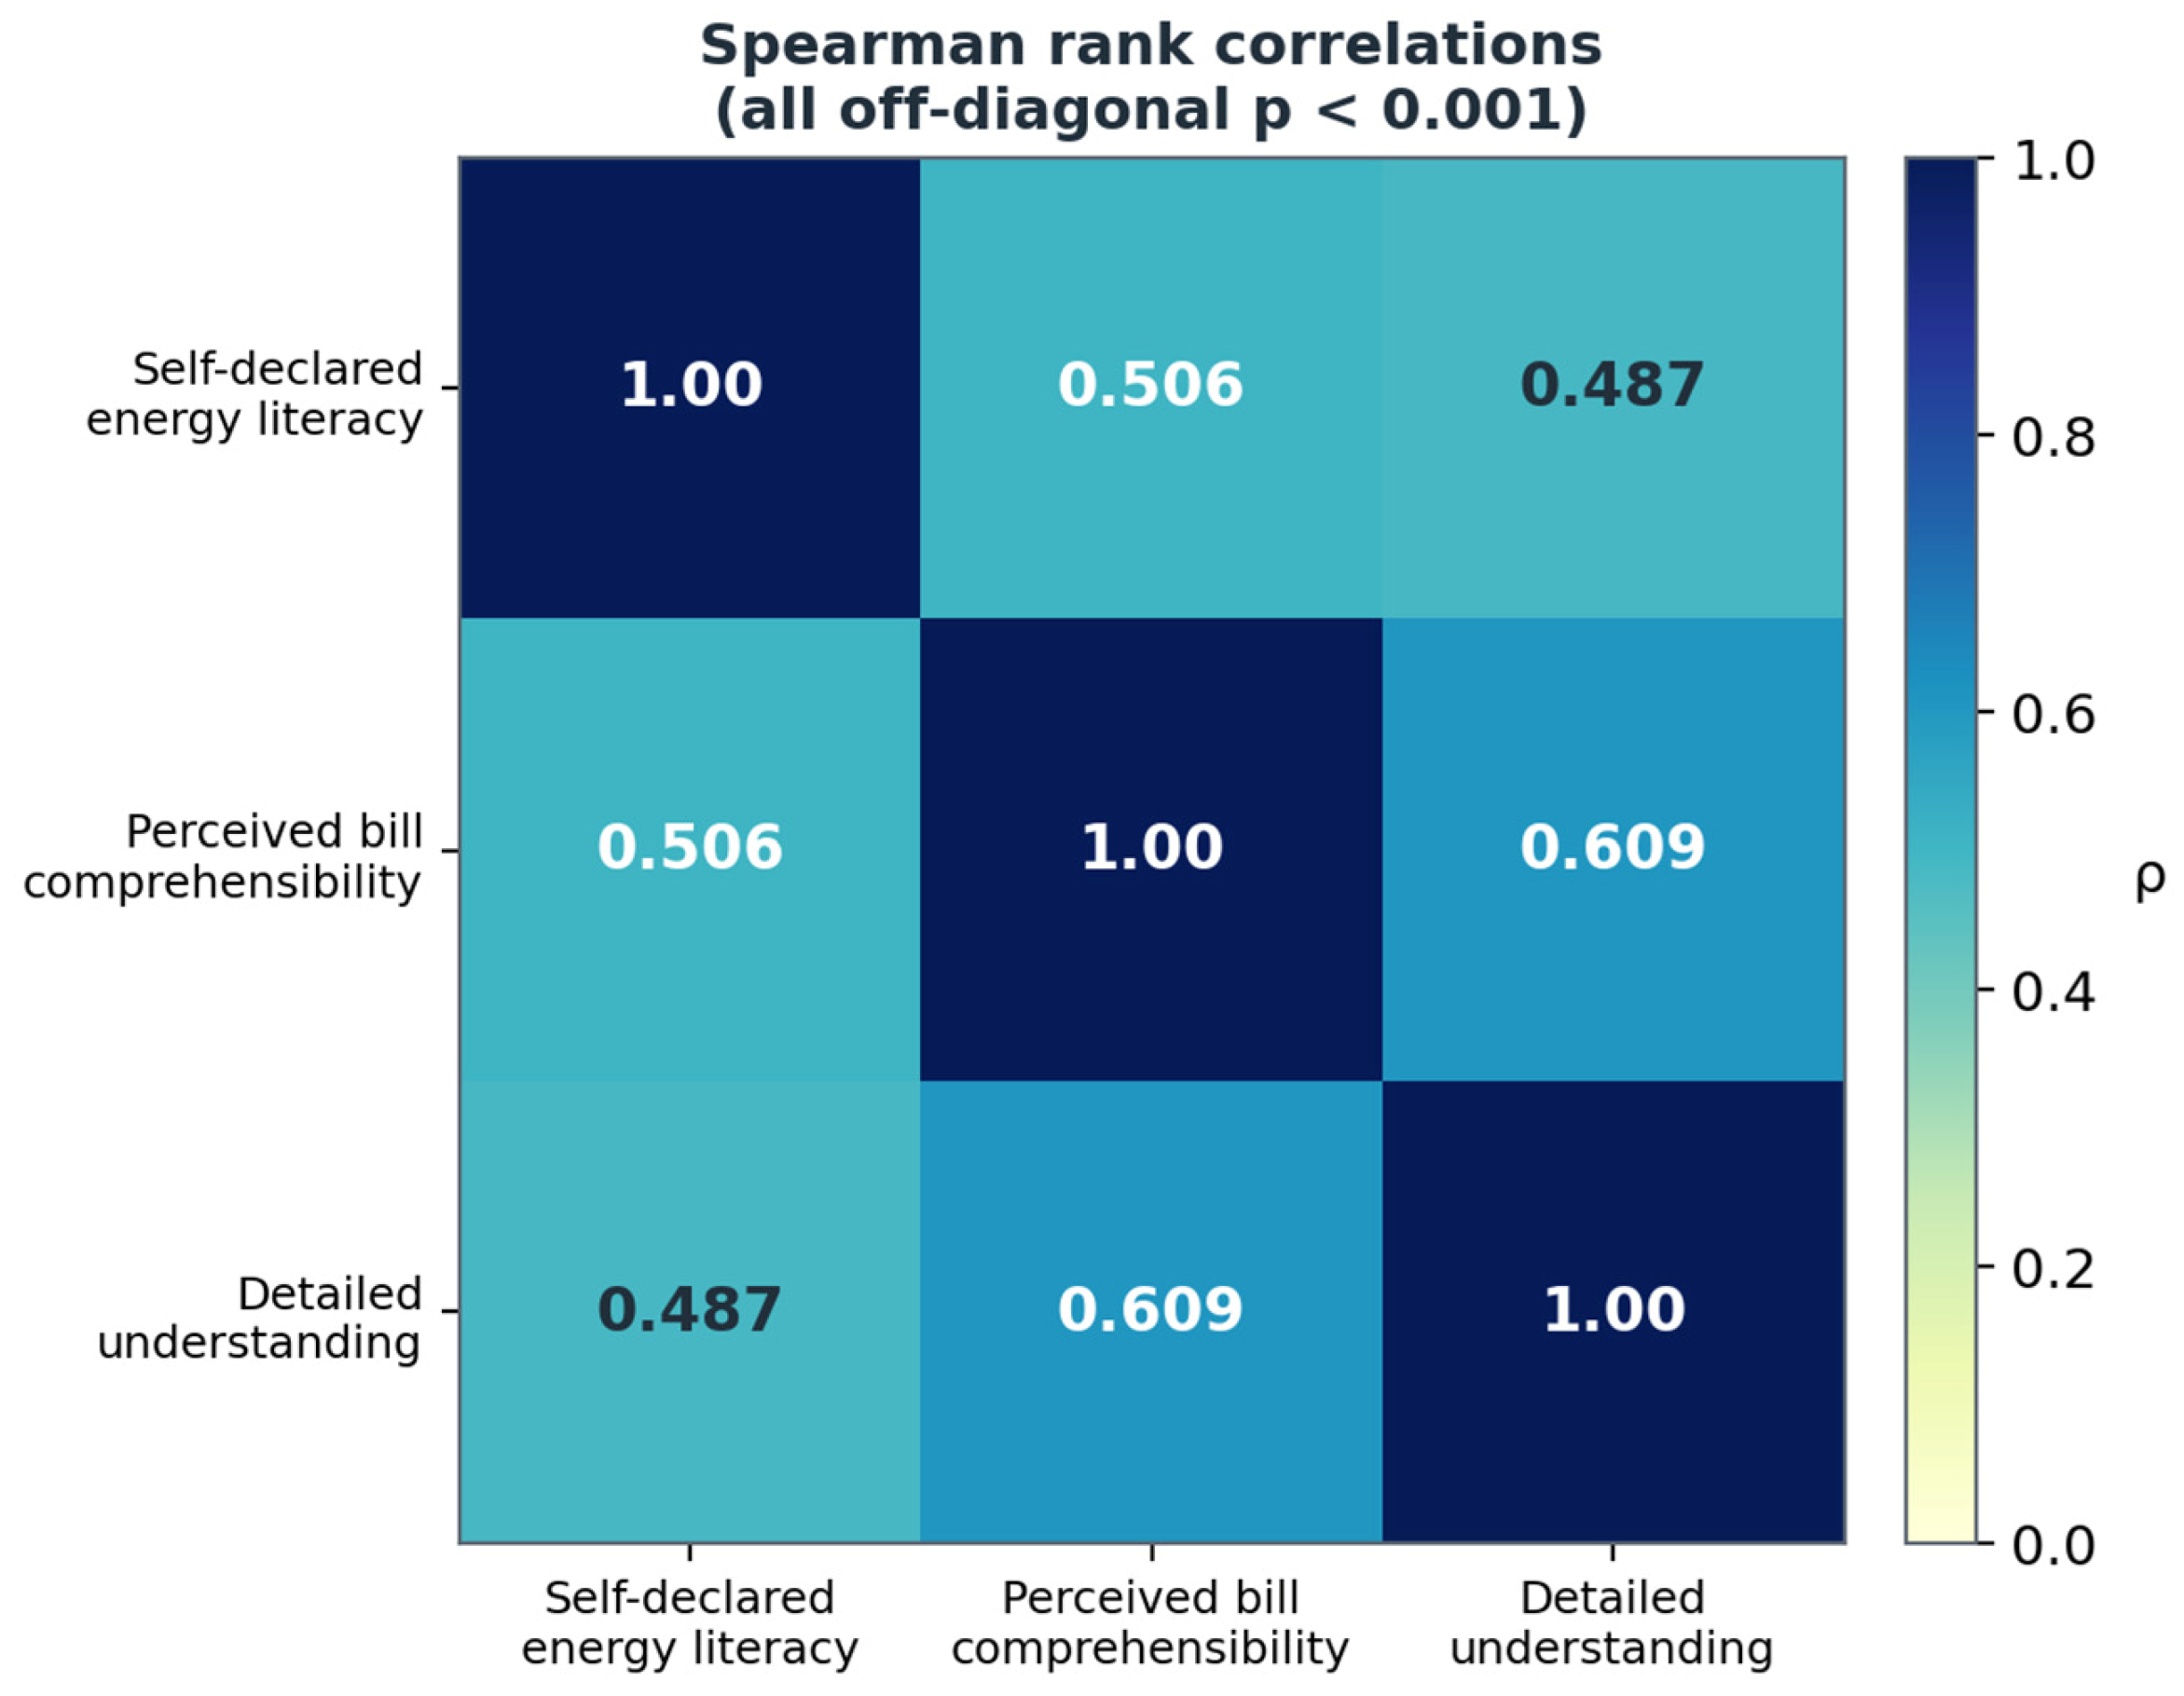
The relationship between self-declared energy literacy, perceived bill comprehensibility and detailed understanding of invoice elements was examined with Spearman rank correlations. Self-declared literacy correlated positively and moderately with the perceived comprehensibility of the current bill (ρ = 0.506, p < 0.001) and with detailed understanding of invoice information (ρ = 0.487, p < 0.001). The strongest association ran between perceived comprehensibility and detailed understanding (ρ = 0.609, p < 0.001). At the same time, 33.1% of respondents assessed the current bill as not understandable, confirming that the gap between the formal disclosure of billing information and its effective interpretation by customers remains wide. The full correlation structure is shown in Figure 11 and reported in Table 5.
These findings support the conceptual framework adopted: energy literacy is bound up with the perceived clarity of the bill, which in turn is closely tied to the ability to read its detail. Levels of knowledge and understanding are higher among respondents aged 35–54 and those reporting better financial status and lower in older and financially vulnerable groups—an indication that vulnerability in the electricity market is structured along familiar socio-economic lines.

4.5. Cognitive Structure of the Bill (Ward’s Cluster Analysis)

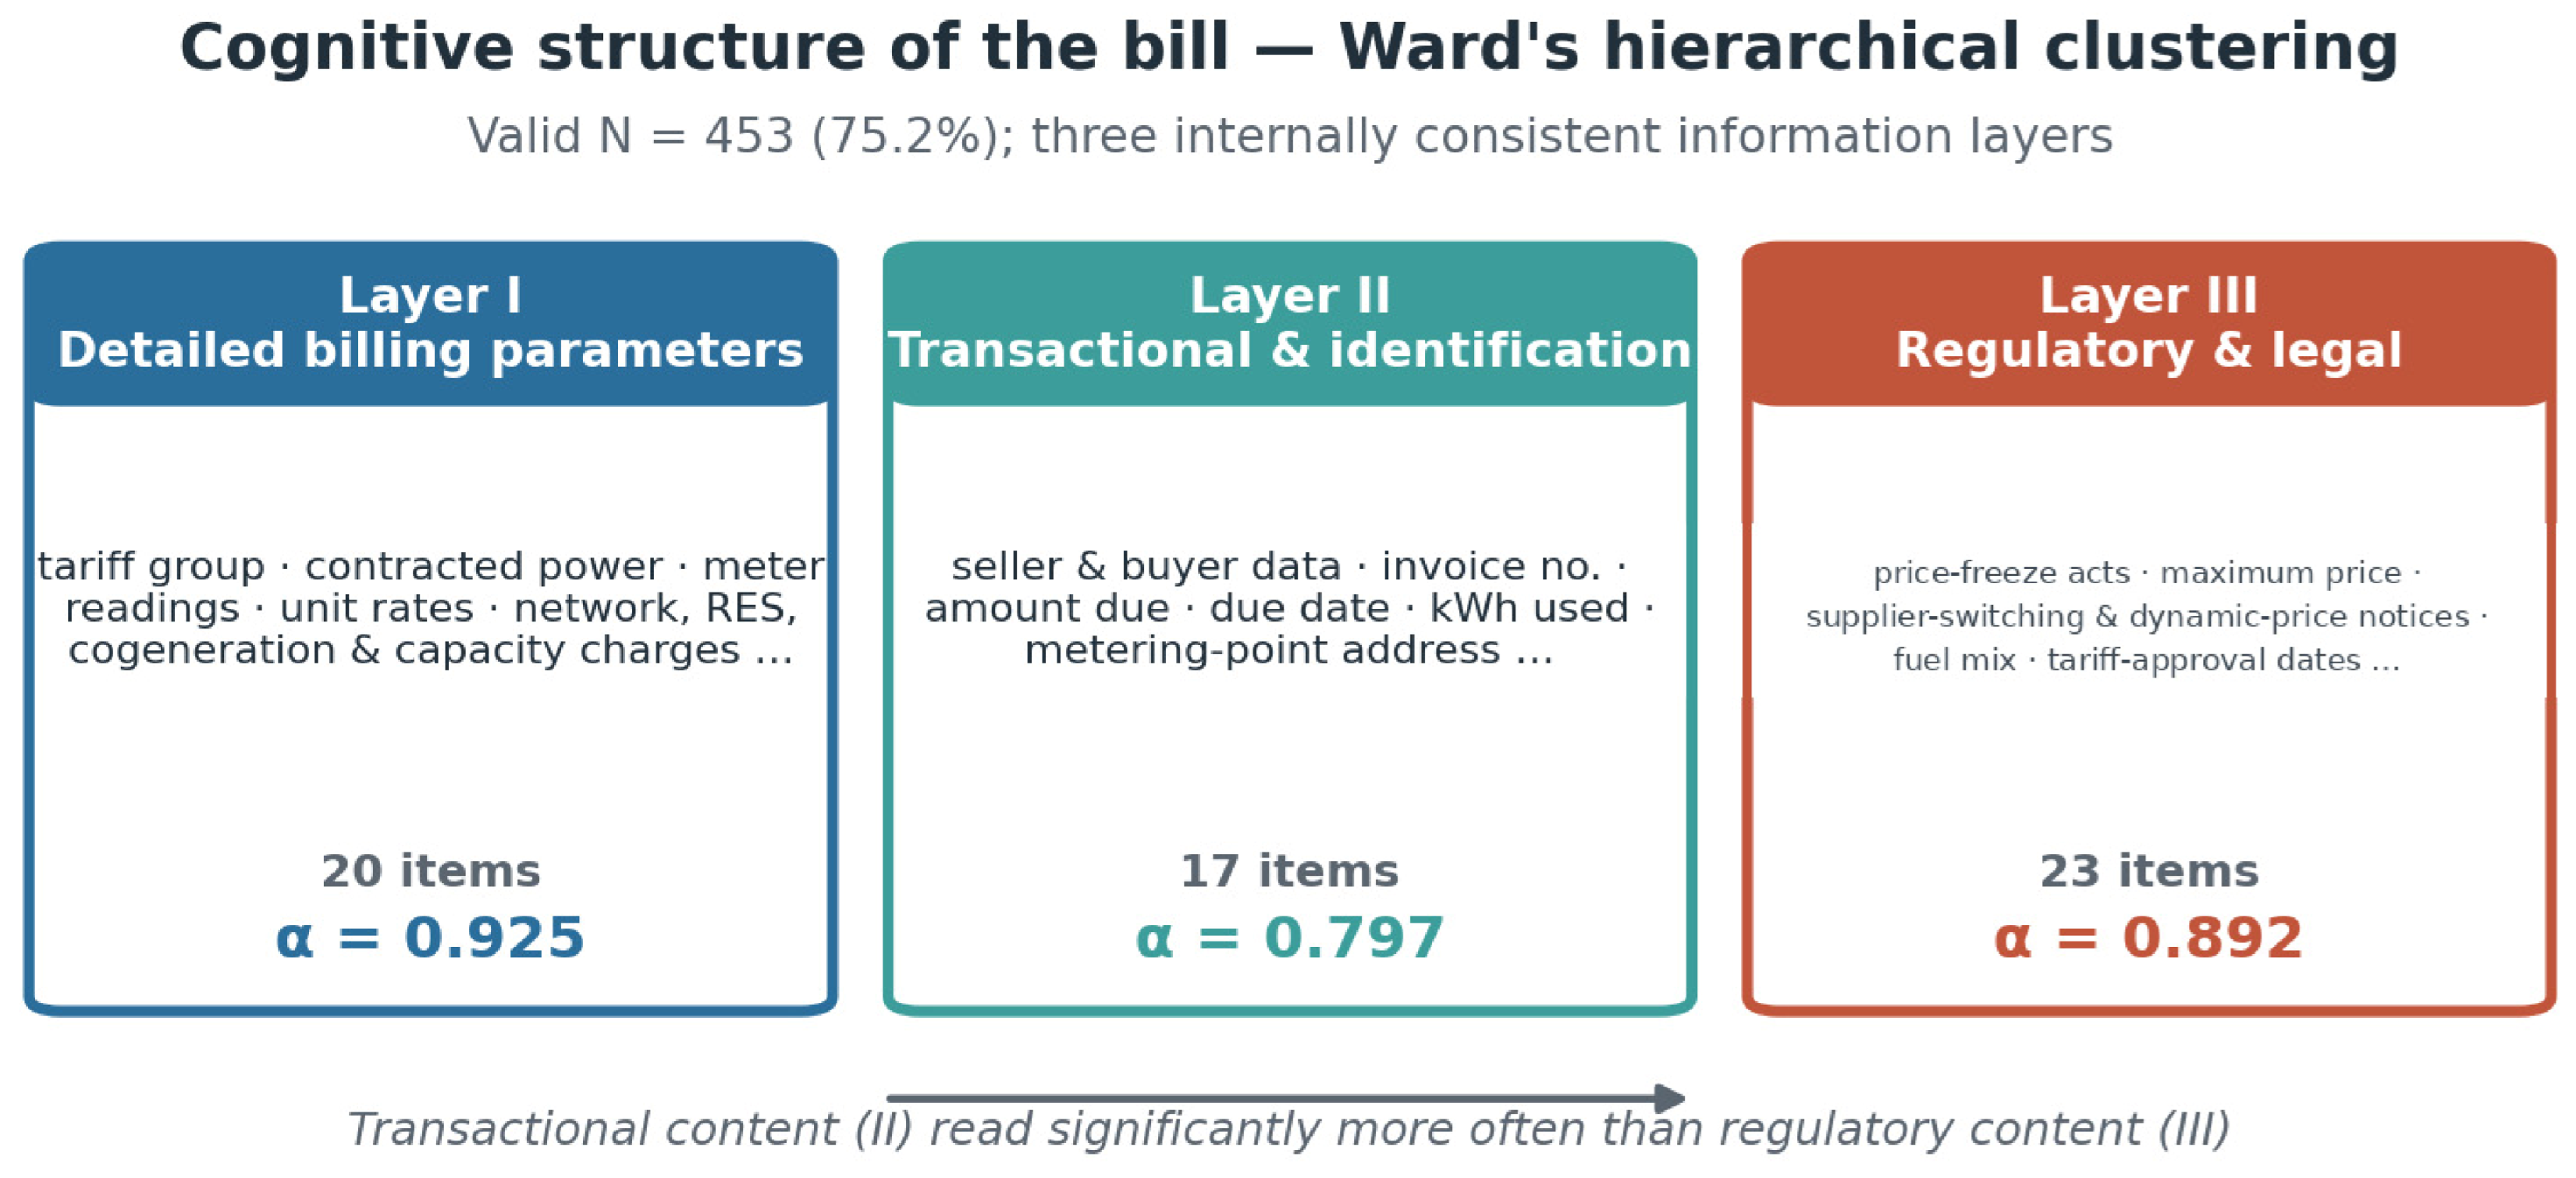
Hierarchical cluster analysis using Ward’s method, applied to items describing how often respondents read particular categories of information (valid N = 453; 75.2% of the sample), identified three coherent clusters: (i) detailed billing parameters (20 items); (ii) transactional and payment information (17 items); and (iii) regulatory and legal information (23 items) (reliability coefficients are reported in Section 3.5). The internal-consistency coefficients indicate that reading behaviour is highly coherent within each cluster; being the product of an exploratory, data-dependent procedure; however, they do not by themselves establish that the clusters are dimensionally distinct (see Section 3.5). Figure 12 sets out the three layers and their composition, and Table 1 reports the reliability statistics.
Transactional and payment information was read significantly more often than regulatory and legal information, pointing to a functional, selective mode of processing the bill. The very high reliability of the detailed-parameters cluster (α = 0.925) shows that, when consumers do engage with technical detail, they tend to do so in a coordinated way across related items. Across the sample as a whole, though, attention to transactional content plainly predominates over attention to regulatory content. This descriptive pattern is consistent with the selective-attention expectation set out ex ante in Section 2.6: customers concentrate on the elements most directly tied to immediate financial outcomes, while regulatory information—increasingly relevant for participation in the transition—stays marginal in their cognitive processing of the document. The bearing of the three-layer structure on the study’s core question is direct: it identifies which parts of the bill actually function as an information channel and which do not and thereby locates the specific layer—the regulatory and legal one—at which transparency policy currently fails to reach the consumer. What the present data cannot do is relate cluster membership to market behaviour such as tariff choice, switching willingness or energy-saving measures; that step, which would turn the typology from a descriptive structure into a behavioural segmentation, is identified in Section 6 as the priority for the next wave of the study.

4.6. Expectations Concerning Changes in the Bill

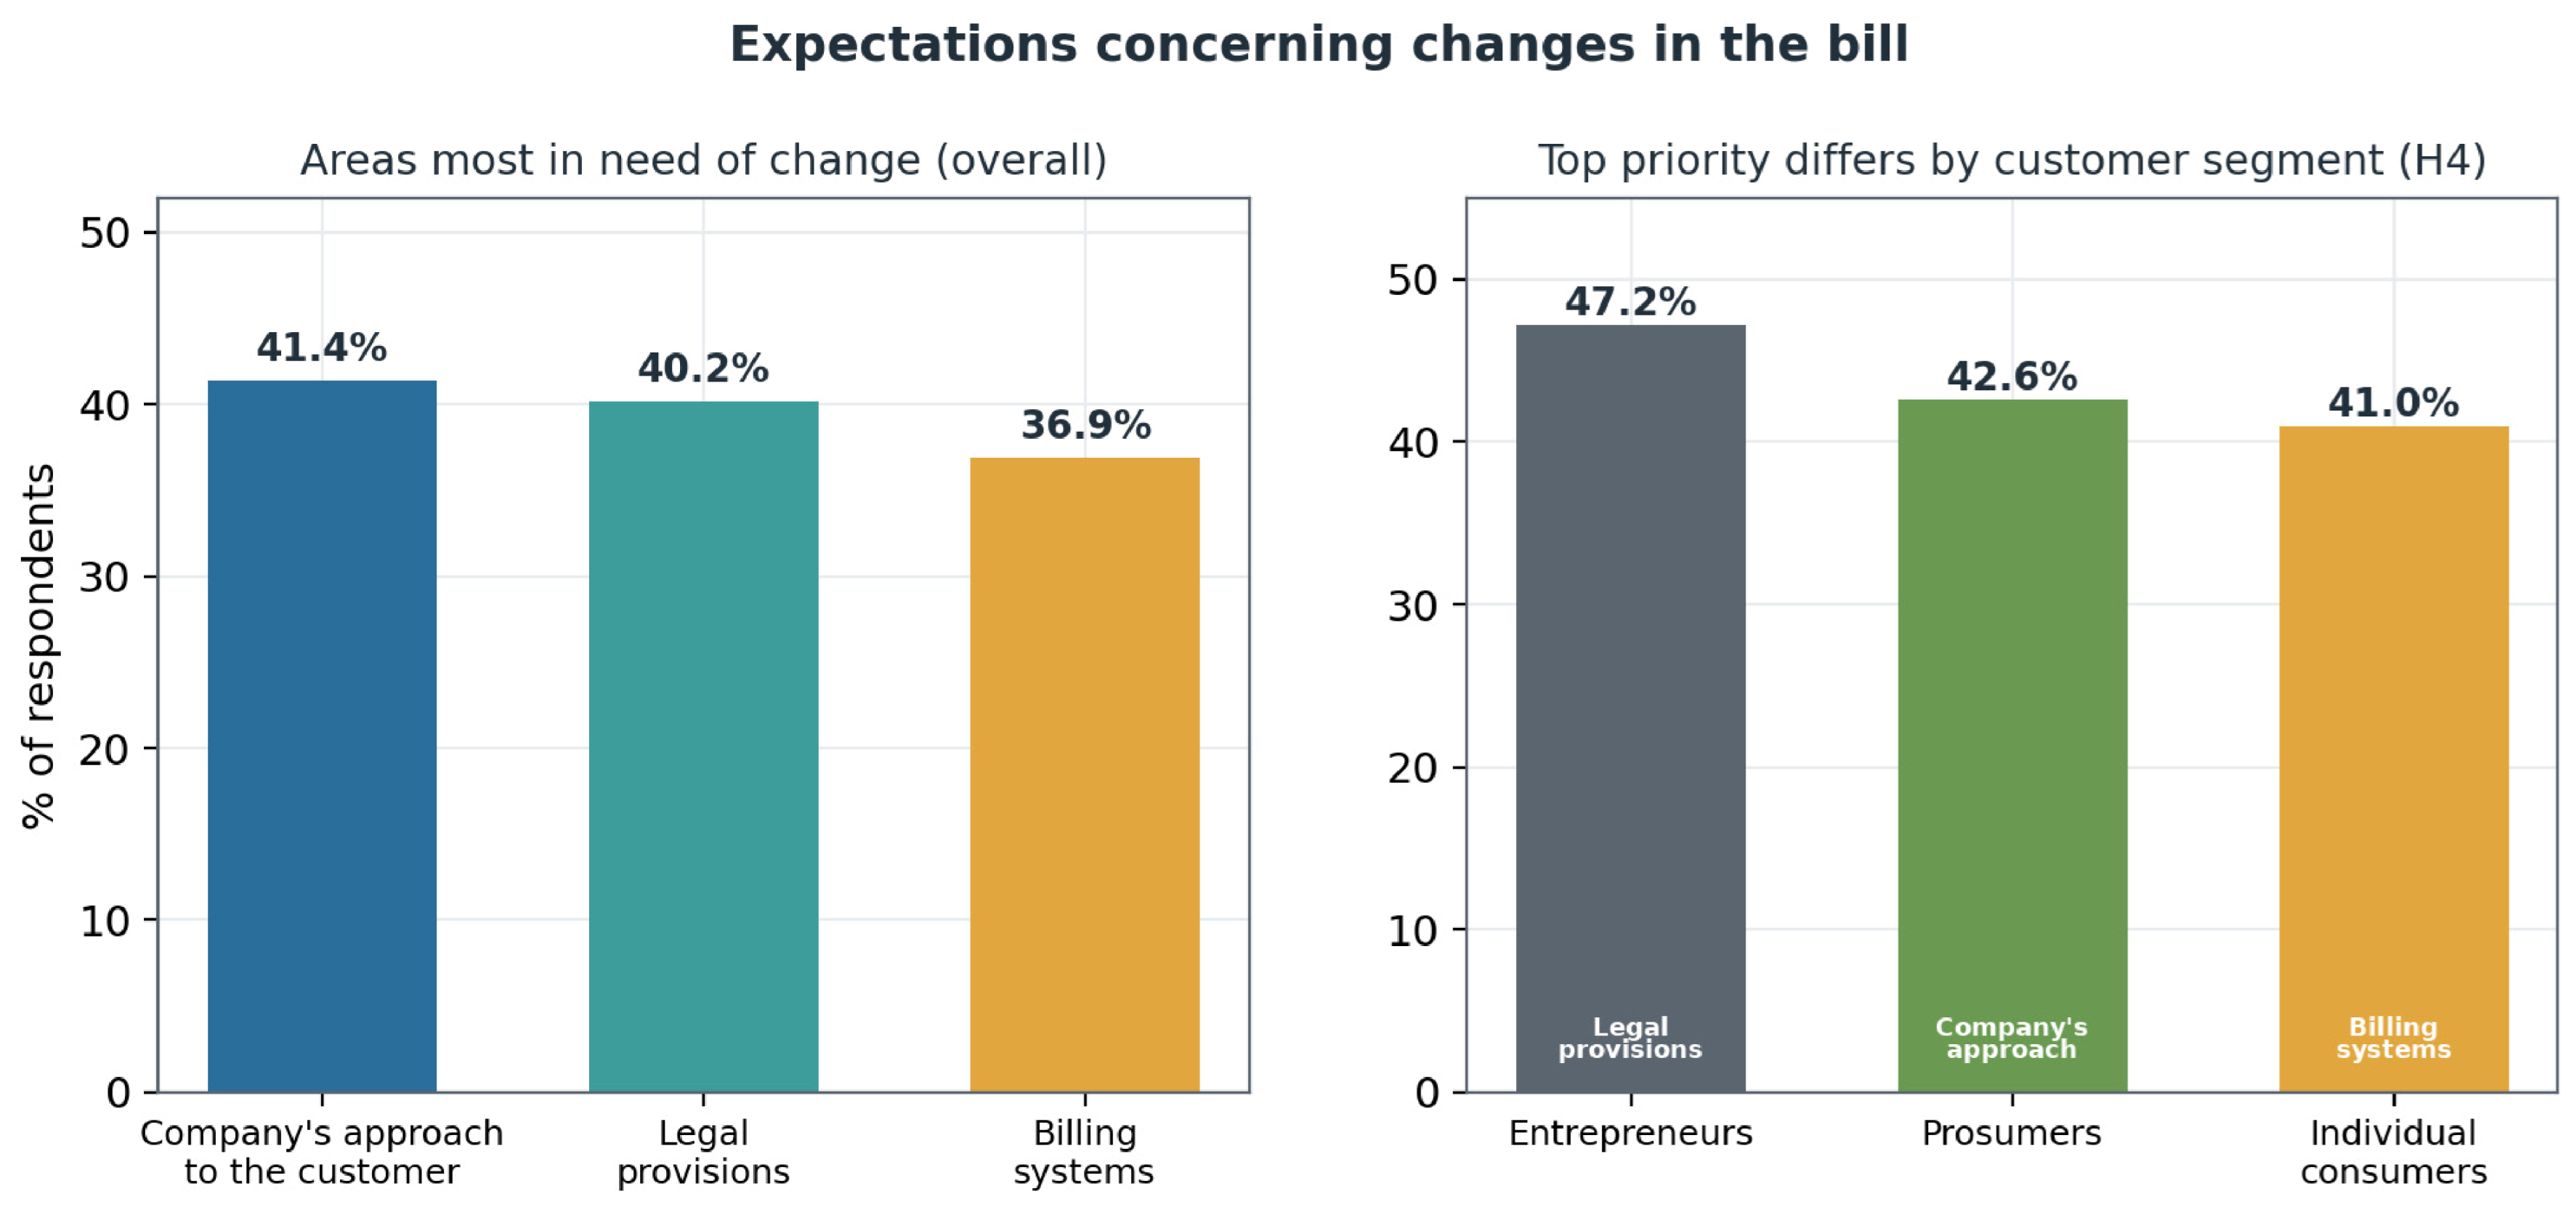
The areas most often flagged as needing change were the energy company’s approach to the customer (41.4%), legal provisions (40.2%) and billing systems (36.9%). Differences between customer groups confirm H4 and point to a segmentation of expectations across customer types, as shown in Figure 13.
It is worth noting how few respondents were content with the status quo: only 4.4% felt the bill needs no change at all, and the same small share could not offer an opinion. Because respondents could name more than one problem, the shares sum to well above 100% (mean 1.6 areas per respondent), which itself signals that dissatisfaction is broad rather than pinned to a single flaw. Table 6 sets out the full pattern of responses by customer segment.
Cross-tabulation revealed significant differences in calls for simpler bills depending on customer type. Entrepreneurs saw the main problems as lying in complicated legal provisions (47.2%), whereas for prosumers the key issue was a change in how the company relates to the customer (42.6%). Individual consumers most often pointed to the need to modify billing systems (41.0%). Gender significantly differentiated the perception of barriers to comprehension: women, more often than men, called for simpler communication language (30.1% vs. 19.1%), while men more often located the problem in the regulatory sphere—pointing to legal provisions (42.3%) and to the company’s general approach to the customer (44.3%). Both groups rated billing systems as needing change to a similar degree (about 36%).

4.7. Attitudes Towards Renewable Energy Sources

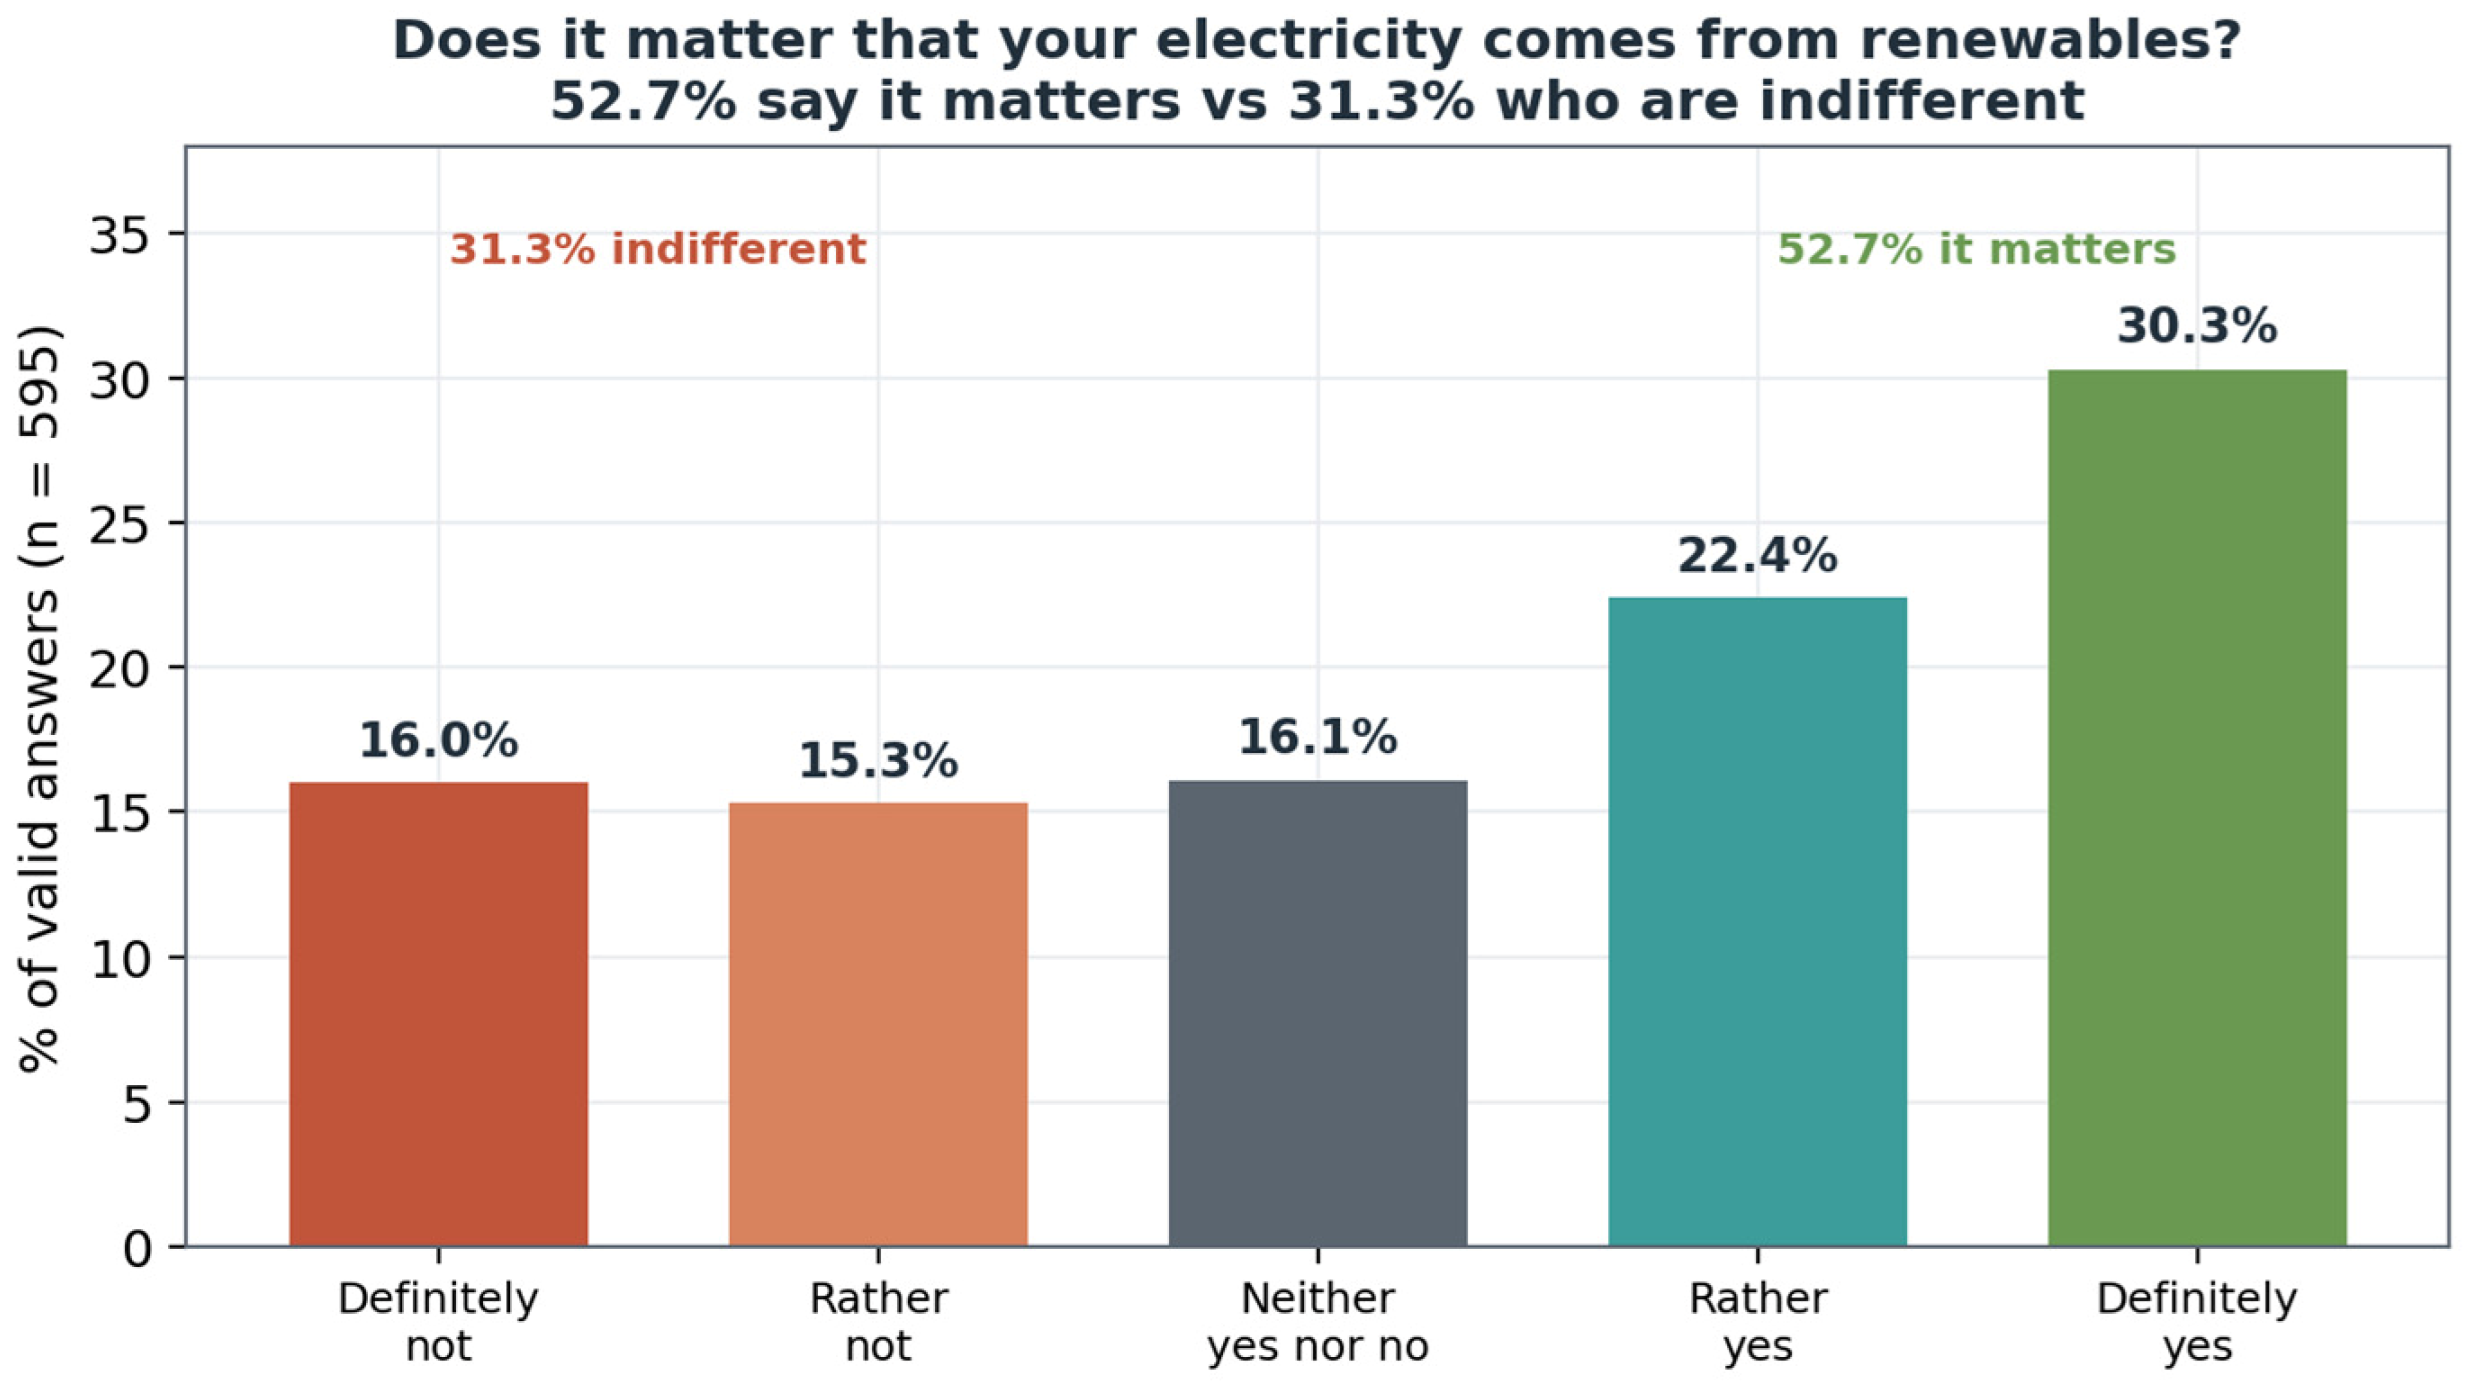
More than half of respondents (52.7%) said the origin of their energy mattered to them—which can be read as an effect of growing environmental awareness and of broader social trends and climate policy. The full distribution (Figure 14) is instructive: 30.3% answered “definitely yes” and 22.4% “rather yes”, against 16.0% “definitely not” and 15.3% “rather not”, with 16.1% sitting on the fence. The analysis showed significant differences by gender (p = 0.029), no significant differences by age, and a positive correlation with material situation. The share for whom renewables matter (52.7%) exceeded the share expressing scepticism (31.3%) by more than 20 percentage points.
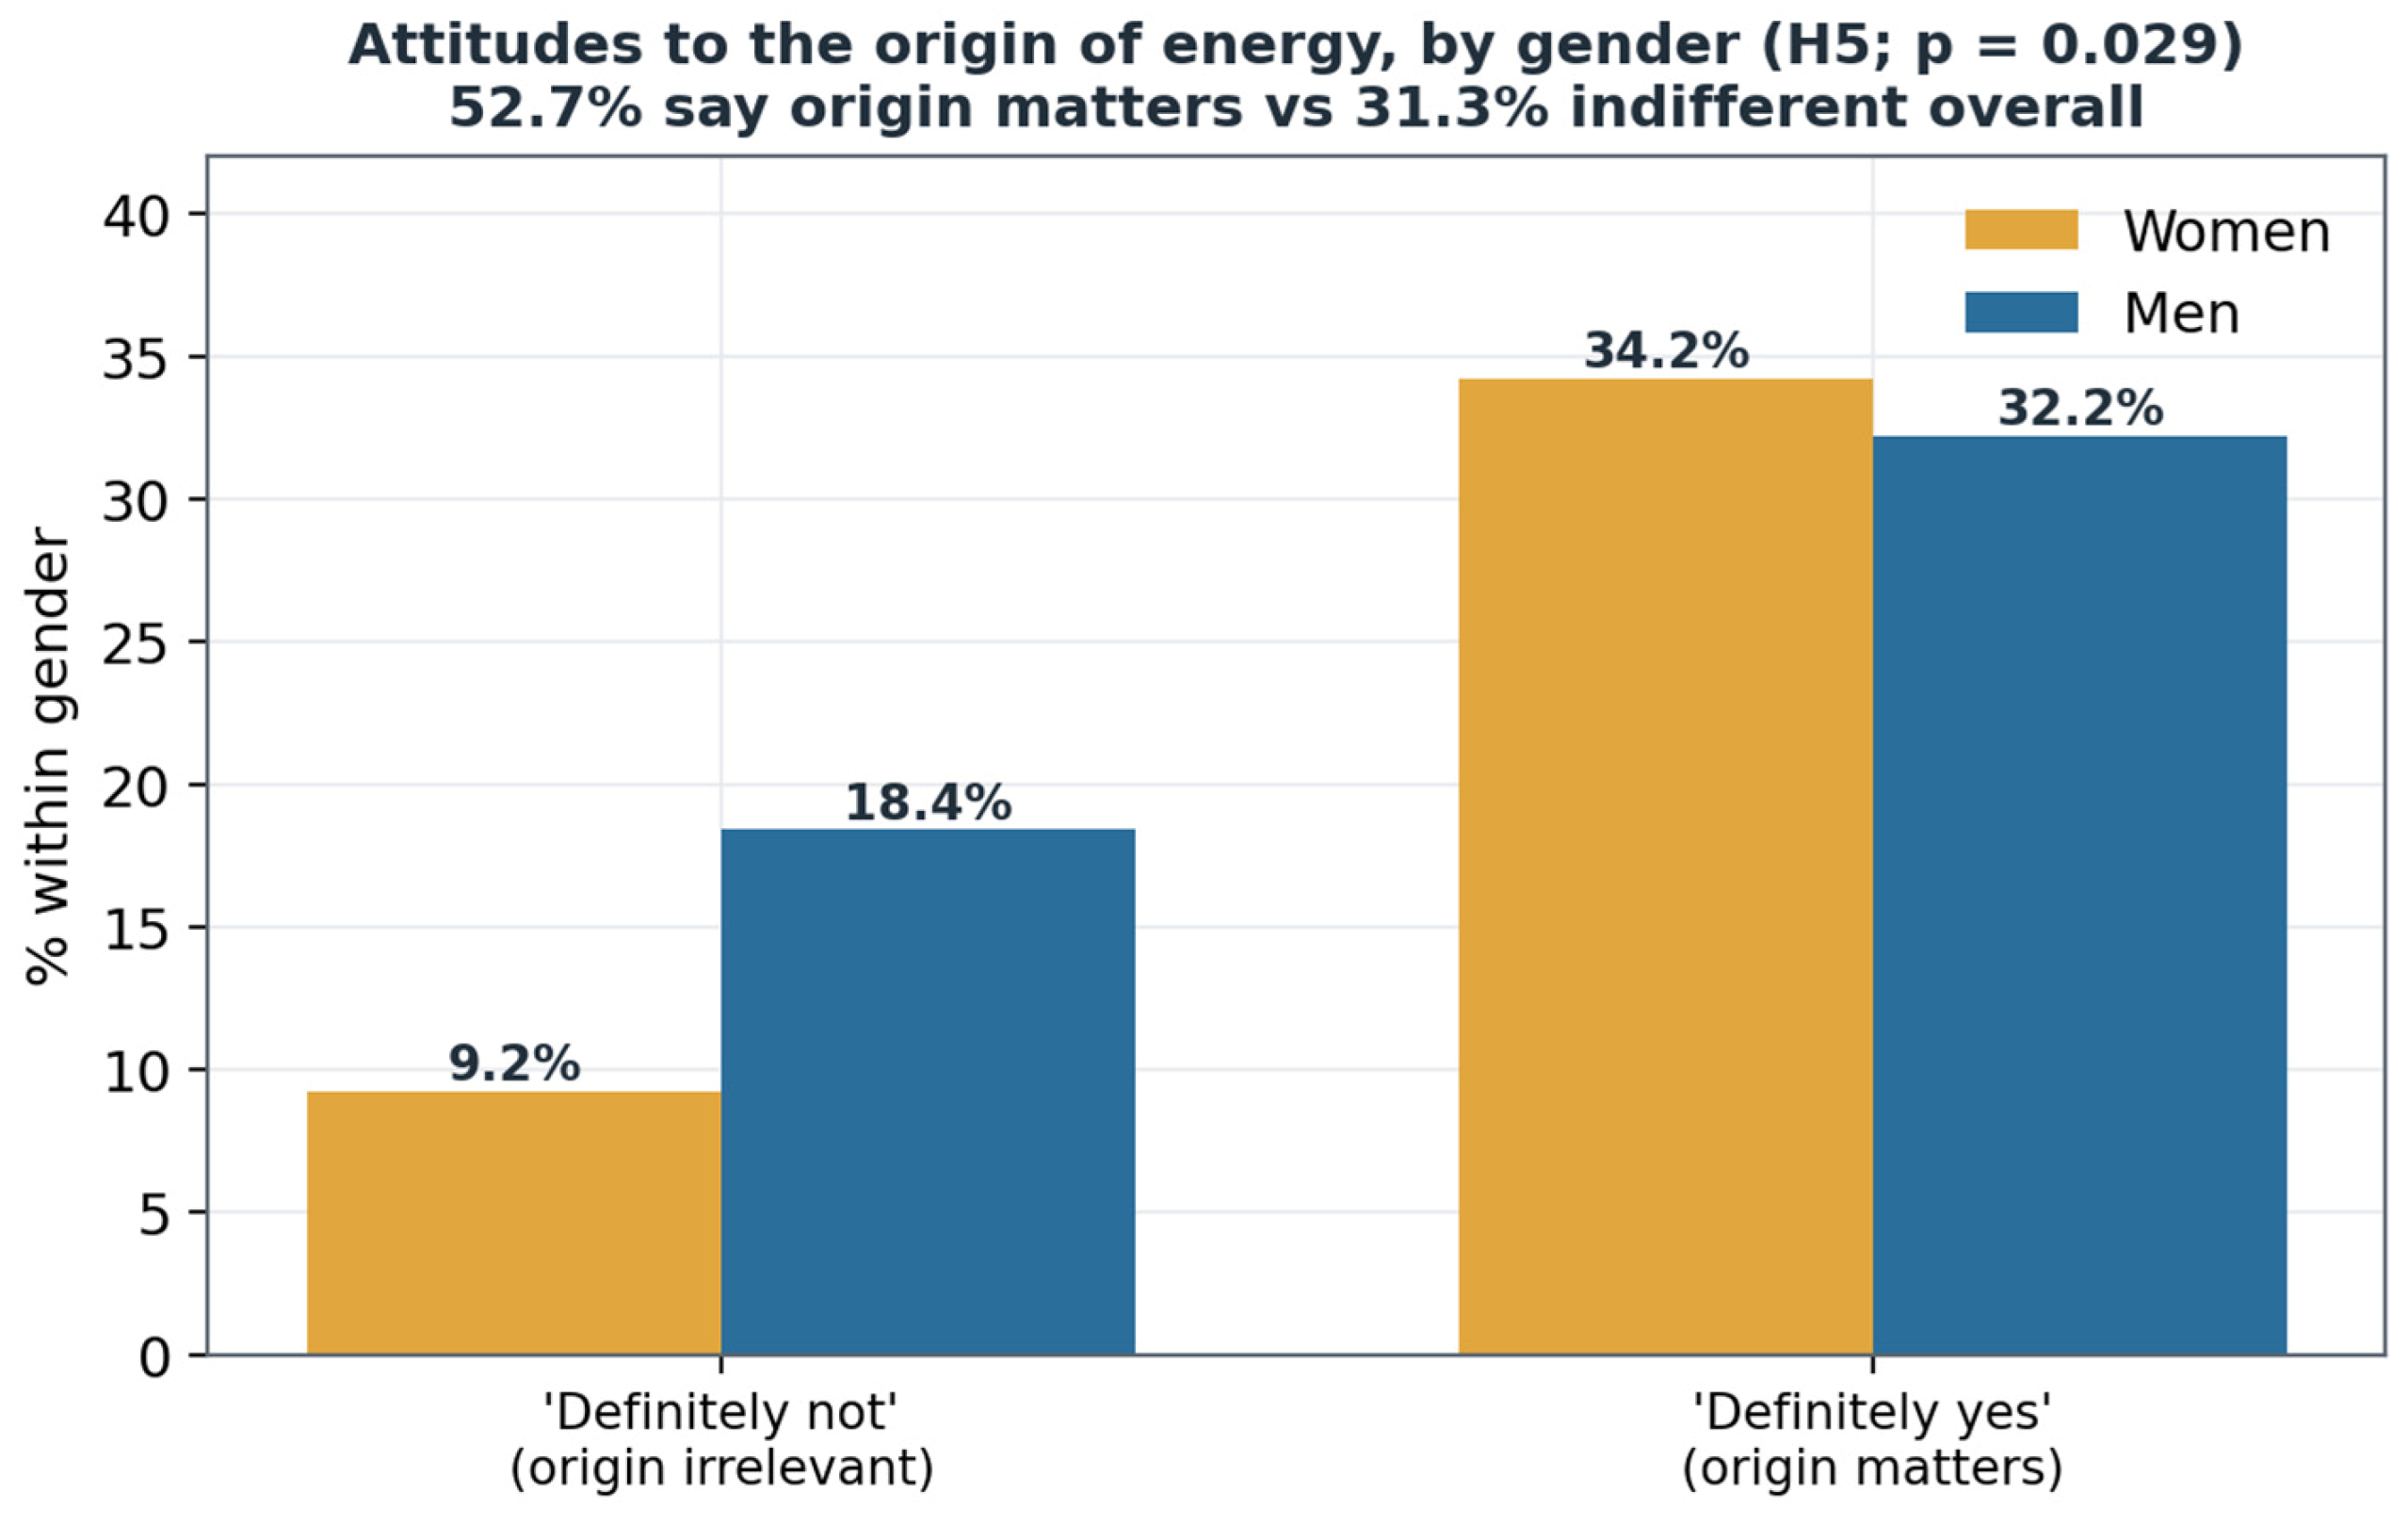
These results partly support H5. Cross-tabulation revealed gender differences in attitudes to renewables: women less often than men declared a lack of interest in the origin of energy (9.2% of women vs. 18.4% of men in the “definitely not” category). Among the most environmentally conscious (“definitely yes”) the differences were smaller, with women slightly ahead (34.2% vs. 32.2%). The gender contrast is shown in Figure 15.

4.8. Gender, Age and Material Situation: Structural Relationships

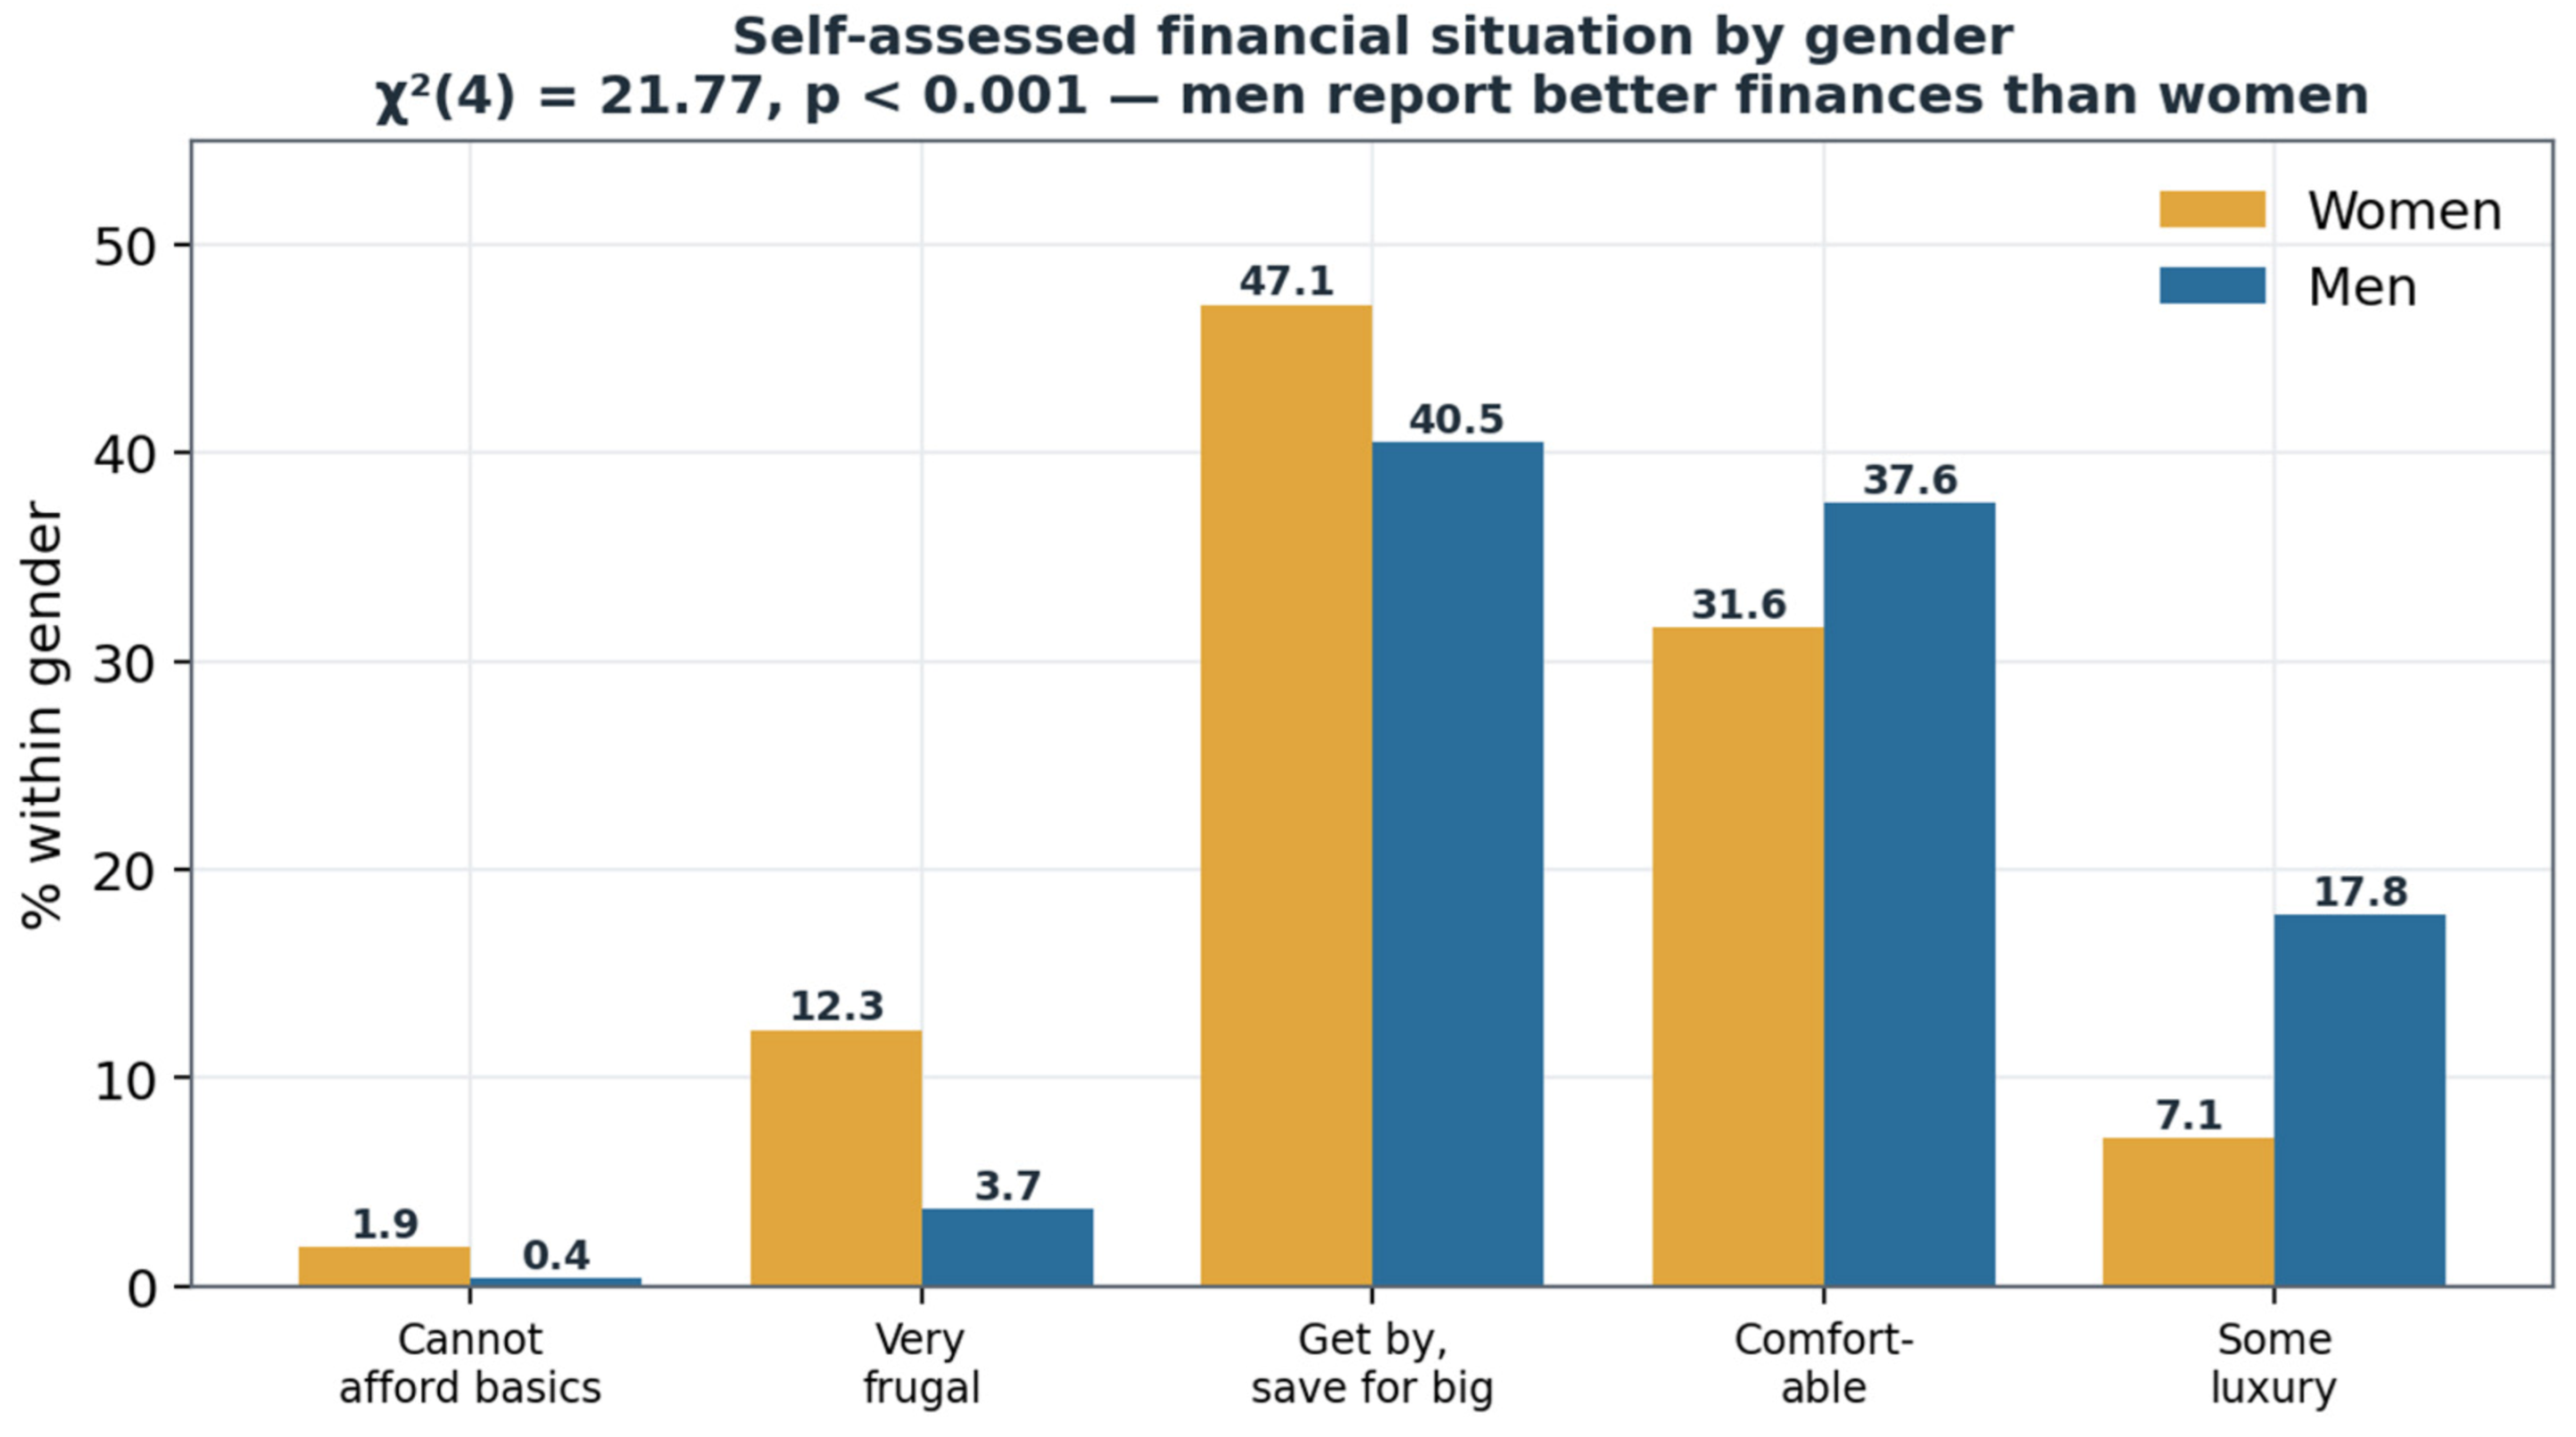
Because the socio-economic gradient runs through several of the results above, it is worth examining the structure of the sample’s demographics in its own right. Two relationships stand out. First, gender and material situation are strongly linked. Men rated their household finances markedly better than women did: 17.8% of men placed themselves in the top “some luxury” category against only 7.1% of women, and taking the two highest categories together (“comfortable” plus “some luxury”) the gap widens to 55.4% of men versus 38.7% of women. At the other end, women were more than three times as likely as men to report having to be very frugal (12.3% vs. 3.7%). A chi-square test confirms that this is not noise: gender and material situation are significantly associated (χ2(4) = 21.77, p < 0.001). Figure 16 and Table 7 present the full distribution.
Second, and in contrast, age and material situation are statistically independent in this sample. Neither the chi-square test (χ2(8) = 13.65, p = 0.091) (Table 8) nor the non-parametric Kruskal–Wallis test (p = 0.065) detected a significant relationship between a respondent’s age and their reported financial standing. This matters for how the earlier results are read: where age differences in billing knowledge and comprehension appear (Section 4.1 and Section 4.4), they cannot simply be re-described as income differences in disguise, because in these data the two characteristics do not travel together. The age gradient in comprehension is therefore an effect in its own right—plausibly reflecting cohort differences in exposure to digital tools, formal energy education and the liberalised market—rather than a proxy for the financial gradient. The gender gradient, by contrast, is partly bound up with the financial one, which is consistent with the pattern by which women, who report tighter household finances, also more often call for simpler billing language (Section 4.6).

5. Discussion

The results lend empirical support to the integrated framework of Section 2.6. Consumer engagement with the bill is bound up not primarily with the sheer volume of information the document discloses, but with the interplay between energy literacy, perceived transparency and the detailed interpretability of billing elements. The moderately strong correlations between self-declared literacy and both perceived comprehensibility (ρ = 0.506) and detailed understanding (ρ = 0.487), together with the still stronger link between perceived comprehensibility and detailed understanding (ρ = 0.609), indicate that information design and consumer competence are complementary correlates of comprehension: in these data they co-vary in a consistent pattern, even if whether they causally reinforce one another is a question only experimental or longitudinal designs could settle. This is consistent with the broader literature reviewed in Section 2, which converges on the conclusion that even carefully designed market instruments fail to deliver when consumers cannot interpret the information addressed to them [42,65]. What the present data add to the literature is not the direction of these associations, which earlier studies anticipate, but their joint measurement on the same respondents at the level of the bill itself, together with the identification of the specific layer of the document that the association fails to reach—evidence that, to our knowledge, has not previously been reported for Central and Eastern European retail markets.
How do these levels compare internationally? Direct quantitative benchmarking is constrained by the absence of common definitions and instruments across studies—the critical review cited above calls precisely for their unification [40]—so the comparison must remain qualitative. Read in that register, the pattern found here is consistent with, rather than anomalous against, the international evidence: low and confidence-laden self-assessed literacy echoes the American and Dutch findings on consumers’ limited grasp of bills and consumption [47,48,49,50]; the socio-economic patterning of literacy parallels the Finnish evidence on energy-related financial literacy [61]; and the modest share of respondents claiming high billing knowledge is in line with the low household energy literacy reported for Poland on a national quota sample [2]. What cannot yet be said is whether Polish bill comprehension is better or worse than in Germany, France or the Baltic states: the European Commission’s comparative billing study [55] documents how consumers use their bills across Member States but does not yield construct-equivalent literacy scores. Fielding a harmonised module of objective items alongside the national instrument—permitting exact cross-country comparison—is identified in Section 6 as part of the follow-up programme.
These associations must, though, be read with care, and above all not read causally. The framework of Section 2.6 posits a directional sequence—from literacy, through perceived transparency, to the detailed interpretation of billing elements—but the cross-sectional, rank-order correlations reported here cannot establish that direction. The same coefficients are equally consistent with reverse influence, whereby repeated experience of easy-to-read bills raises consumers’ assessment of their own competence, and with confounding by common causes—education, numeracy, general cognitive ability, or prior engagement with the market—that might lift self-declared literacy and perceived comprehensibility at the same time. Because all three constructs are measured by self-report within a single instrument, part of the observed covariation may further reflect common-method variance rather than a substantive link between distinct phenomena. One specific mechanism deserves emphasis. Under the Dunning–Kruger pattern, respondents with the least competence may overestimate their understanding while the most competent find the bill simple, a combination that could by itself generate correlations of the size reported here. Because the survey contained no objective knowledge items against which self-assessments could be validated, perceived and actual competence cannot be separated in these data, and the possibility that common-method bias and self-perception jointly inflate the reported coefficients is acknowledged as a major limitation of the study, not a peripheral caveat; the coefficients are best read as upper bounds on any substantive association. The correlations are therefore best read as descriptive co-variation consistent with the proposed framework, not as evidence that raising energy literacy will, on its own, improve bill comprehension: establishing the direction and size of any causal effect would require longitudinal panel data or randomised interventions, such as controlled redesigns of the bill or targeted educational programmes of the kind discussed in Section 6.
The perception of the amount of information is harder to reconcile. That 56.9% of respondents consider the bill to carry a sufficient amount of information, while at the same time 33.1% assess the current bill as not understandable, points to a paradox of informational completeness. Through the lens of cognitive load theory, the paradox can be read—cautiously, as interpretation rather than test—as suggesting that the bill offers enough cues to convince customers nothing important has been left out, while still falling short of being interpretable; through the lens of the economics of information, it reflects the persistence of information asymmetry between supplier and customer, despite the formal disclosure obligations that market regulation imposes.
The hierarchical cluster analysis offers a descriptive, data-organising contribution by showing that consumer attention to the bill is organised along three internally consistent informational layers—detailed billing parameters, transactional/payment information, and regulatory/legal information—with the regulatory and legal layer consistently receiving less attention than the transactional/payment layer. This has direct implications for the transition: as bills increasingly carry regulatory and policy content (references to tariffs, market rules and instruments tied to the transition), the very part of the bill that conveys this information is the part consumers are least likely to read. Liberalised markets presuppose informed consumer choice; yet the documents meant to enable that choice are systematically truncated in the consumer’s reading.
The socio-economic patterning of energy literacy and bill comprehension is consistent with the literature on energy poverty and financial literacy [18,19,20,21,22,23,24]. The finding that knowledge and understanding are higher among respondents aged 35–54 and those in a better financial position and lower among older and financially constrained respondents identifies the segments for whom regulatory disclosure is least effective. These are also, in general, the segments most exposed to the welfare consequences of mispriced or misunderstood supply. Two qualifications attach to this reading. The group differences underlying it are unadjusted bivariate contrasts; and although the structural analysis of Section 4.8 shows age and material situation to be statistically independent in this sample—which limits the scope for the age gradient to be an income gradient in disguise—gender and material situation are associated, and only a multivariate specification (for instance, ordinal logistic regression with simultaneous controls) could isolate the net effect of each characteristic. Such models are identified in Section 6 as a priority for follow-up analyses rather than estimated here. The gender differences observed—women more often advocating simpler language and men more often pointing to regulatory factors—suggest, in addition, that communication strategies should not be uniform: different segments read the same bill through different cognitive and linguistic lenses.
This socio-economic gradient should, moreover, be read as a cautious estimate of the disadvantage borne by the most vulnerable consumers, for reasons connected with the composition of the sample. Although the quota-random procedure aligned the realised sample with the population on observed demographic characteristics, the achieved sample was dominated by households of stable, middle-range income; the energy-poor and the most financially constrained—precisely the groups for whom billing opacity carries the gravest welfare consequences—are therefore likely to be under-represented. Non-response compounds the concern, because consumers with the lowest literacy and the weakest engagement with energy-market information are plausibly also the least likely to agree to, and complete, an interview on that very subject. If so, the comprehension deficit recorded here understates the true gap among those who most need protection, and the measured socio-economic gradient is flatter than the gradient in the underlying population. The practical implication runs counter to any reassurance the headline figures might suggest: the targeted communication and educational measures set out below are, if anything, more urgent than those figures imply, since the consumers least visible in these data are also those least equipped to navigate a liberalised market unaided. The specific gaps can be named. Consumers aged 34 or younger make up only 4.6% of the individual sample, against a mean respondent age of 56.24 years, so the billing competence of the youngest market entrants—the cohort most likely to run prosumer installations, dynamic tariffs and app-based billing—remains effectively unmeasured here. Men are over-represented (61.2%), households declaring a difficult financial situation form a small minority, and consumers outside the supplier’s active-contact database, including those without stable telephone or internet access, fall outside the CATI/CAWI frame altogether. Had these groups been more strongly represented, the aggregate levels of declared literacy and bill comprehension reported here would in all likelihood have been lower and the socio-economic gradient steeper—an outcome that would strengthen, not weaken, the case for the simplification and targeted-communication measures of Section 6. The policy recommendations there should therefore be read as a lower bound on what effective protection of energy-poor and otherwise vulnerable consumers would require.
H3, on the low level of regulatory awareness, is supported by the pattern of attributions of bill complexity: nearly 58% of respondents attribute that complexity to legislation, while only 9.3% identify the operational systems of energy companies as the source, and 29.2% take an outright sceptical stance towards those companies’ motives. This combination—a deferential attribution to law alongside mistrust of suppliers—signals a deficit of systemic understanding rather than of specific information items. It also implies that interventions confined to making individual data items more visible on the bill are unlikely to suffice: what is needed is a more thorough recalibration of how the regulatory content of the bill is communicated. The direct question about who shapes the bill (Section 4.3, Figure 10) puts this beyond doubt: with 55.8% crediting the seller, only 4.5% naming legislation and none naming the EU, consumers do not merely underrate the regulatory hand behind the bill—they largely fail to see it at all. This has an uncomfortable corollary for transparency policy. A regulatory instrument that obliges suppliers to print statutory content on the bill can satisfy its own disclosure logic in full while remaining, from the consumer’s side, invisible as regulation; the letter of the law is met, but the civic purpose behind it—an informed consumer who understands the rules of the market—is not.
The segmentation of expectations across customer types (H4) reinforces the point. Entrepreneurs point above all to legal provisions, prosumers to the relational approach of energy companies, and individual consumers to billing systems. These different priorities reflect the distinct positions of each group in the market: entrepreneurs are more exposed to regulatory complexity affecting business costs; prosumers, being themselves market participants, are especially sensitive to the quality of the relationship with the supplier; individual consumers, in turn, meet the bill mainly as an interface and so privilege its operational design. Effective policy should mirror this segmentation rather than treat customers as a homogeneous mass.
The independence of age and material situation documented in Section 4.8 sharpens the policy reading of these results. Because a respondent’s age tells us little about their household finances in this sample, the two gradients we observe in comprehension—the age gradient and the financial one—are, to a first approximation, separate axes of disadvantage rather than a single underlying one. A consumer can be financially comfortable yet, at 70, struggle with an app-based dynamic tariff; another can be young and at ease with the digital interface yet financially precarious. Communication and protection measures therefore cannot be collapsed onto one dimension: an intervention pitched solely at low-income households would still miss the older, comfortably off consumer who cannot read the regulatory layer, and a purely digital-literacy campaign would still miss the young consumer for whom the barrier is cost rather than comprehension. The gender pattern sits across both axes, since women in the sample report both tighter finances and a stronger preference for simpler language.
Finally, attitudes towards renewables (H5) show a clear majority orientation in favour of taking the origin of energy into account, with significant gender differences but no significant age effect. Environmental awareness in this sample thus cuts across age groups, even where energy literacy itself shows strong age effects. The combination is telling: respondents express interest in the climate-related content the bill conveys, while remaining largely unable, or unwilling, to read the part of the bill that mediates between climate policy and their own household. Closing that gap is, on this evidence, the central informational challenge of the transition at the consumer interface.

6. Conclusions

A preliminary word about scope is needed. The evidence base of this study is regional, single-supplier and dominated by older respondents (Section 3.4 and Section 5), and its design is descriptive and correlational. The implications set out below are therefore formulated as testable directions for the design of billing and communication policy—candidates for piloting and experimental evaluation, in the first instance within the surveyed market—rather than as prescriptions validated by the present data; where the text speaks of what should be done, it speaks in that conditional register.

6.1. General Conclusions

The findings point towards changes that would render knowledge of energy issues more accessible and easier to convey—leaner, too, and free of the informational overload that exhausts the reader while creating only the illusion of an informed consumer. Communicated skilfully, knowledge builds competence. That holds for payment and transactional information, and it holds even more for regulatory and legal content, which is inherently harder to grasp. The findings suggest that bills would gain from shedding the specialist legal vocabulary and the technical terms that never surface in everyday speech and that breed mistrust and discouragement; wherever possible, commonly understood phrasing should take their place. Simpler language and clearer layout would encourage customers to engage with the whole bill and to act on it—reducing the amount due, saving energy, changing habits, responding to price signals, or weighing initiatives of their own, such as prosumer schemes.
Getting there calls for at least two lines of action: legislative measures on the one hand, educational and communication initiatives on the other.

6.2. Legislative Implications

On the legislative side, what is needed is a legal framework for simplifying the bill’s structure and improving its transparency. Independently of the obligation to implement Directive (EU) 2019/944 [32] in full as regards bill content, the behavioural evidence on standardised disclosure—from nutrition labelling to financial-product information sheets—indicates that comparability and comprehension are best served when the essential core of an information document follows a common, prescribed format. The framework should therefore standardise the core of the bill: a common ordering, labelling and placement of the items consumers demonstrably read first, as identified below. Design freedom can be left to suppliers at the periphery of the document—supplementary explanations, visual identity, and digital presentation—where differentiation cannot impair comparability. An unrestricted invitation to compete on the overall look of the bill, by contrast, would risk the opposite of transparency, since freedom over the presentation of essential content can as easily obscure as clarify. Whether the standardised core should later be extended or relaxed is an empirical question, to be settled by repeating and extending the research underlying this analysis. Within that framework, two things are needed regardless of any minimum information standard: presentation, verbal and graphical alike, adapted to the perceptive capacities of the broadest possible customer base; and a clear identification of the genuinely essential information, its relative importance, and the order in which it appears on the first and subsequent parts of the bill. The empirical results suggest starting with what customers see as most important—the total amount payable, the billing period and the quantity consumed. This ordering is not conjecture: it follows directly from the reading hierarchy documented by the cluster analysis of Section 4.5, in which transactional and payment content is read first and most, detailed billing parameters selectively, and regulatory content least. Once that layer is intelligible, further communication can usefully disclose the components of the price, the origin of the energy sold, and comparisons of consumption with previous periods and with the average customer. Legal and regulatory information should then follow. A structured layout, an appropriate colour scheme, infographics and charts can all help, since images and figures are absorbed more readily than text. On costs, the evidence already cited gives grounds for cautious optimism about this class of measures—the OPOWER programme delivered savings at 3.3 cents per kilowatt-hour [44], and Polish behavioural evidence attributes to billing nudges a cost-effectiveness an order of magnitude better than price instruments [52]—but a formal cost–benefit assessment of the specific solutions proposed here, including implementation costs on the supplier side, remains to be carried out and should precede any mandatory roll-out. These solutions answer consumers’ complaints about overloaded, overly complex bills—bearing in mind that current structures may unintentionally discourage interest in the full content of the document and with it in the benefits of voluntary initiatives in the liberalised market and of participation in the transition.

6.3. Educational and Communication Implications

Educational and information activities are more complex and would have to run through several channels of engagement with the public. The natural first step is multi-level educational outreach—spreading knowledge about the market and the transition through schools. Democratising that knowledge, making it available to everyone regardless of family finances or of what parents and other household members happen to know, should awaken interest in energy consumption at home and elsewhere, and encourage habits and attitudes conducive to saving energy. Knowledge and skills should be built at every stage of education, whatever the learner’s age; the more of this there is, the likelier it becomes that knowledge and cognitive engagement will shape decisions in energy markets—the choice of supplier, consumption behaviour, engagement with transition mechanisms. Mobile applications could complement these measures as a channel for learning about bills, letting consumers analyse their own consumption and compare offers at any moment. Consumer access to the bill, and the ability to compare bills and draw conclusions from them, rounds out both the legislative and the educational and communication measures.

6.4. Main Empirical Findings

Several broader conclusions follow. First, customer knowledge of energy settlements is moderate and strongly socially differentiated. Second, the volume of information on the bill is not the principal barrier; its interpretation is. Third, customers do not grasp the regulatory character of the bill—a deficit of systemic knowledge. Fourth, the bill is read functionally and selectively. Fifth, customer expectations regarding change are multidimensional and segmentation-sensitive. Sixth, attitudes towards renewables point to a growing, if socially uneven, environmental awareness.

6.5. Limitations of the Study and Directions for Future Research

The findings underline that billing transparency is a structural lever for sustainable energy consumption: a bill that consumers can read and understand is a precondition for the informed demand-side behaviour on which the sustainable energy transition depends. Improving the legibility of the bill therefore advances the social and behavioural dimensions of sustainable development alongside its technical and economic ones.
The study has limitations that should temper the reading of its results. The empirical material comes from customers of a single major Polish supplier in the Upper Silesia region, and although the sample reflects the heterogeneity of that customer base across consumers, prosumers and enterprises, generalisation to the whole Polish market—let alone to other national markets—should be cautious. The mixed-mode design is a further limitation: because the CAWI complement was confined to selected segments, mode effects on comparability cannot be ruled out and were not empirically tested. Energy literacy was measured by self-declaration rather than by objective tests of knowledge. Self-assessed literacy conflates actual competence with confidence and may be distorted by systematic over- or under-estimation of one’s own knowledge; respondents who find their bills opaque may, in addition, rate their literacy lower for that very reason, which would inflate the correlations reported above through shared self-perception rather than a tangible link. Reliance on self-report is consistent with parts of the existing literature, but future research should pair self-assessment with objective instruments—for example, knowledge items on the components of the tariff, on the distinction between supply and distribution charges, and on the regulatory mechanisms of the transition—drawing on the cognitive, affective and behavioural dimensions of the DeWaters and Powers energy-literacy questionnaire. Such objective measures would make it possible to validate self-reports, to separate perceived from actual competence, and to test whether the literacy–comprehension association survives objective measurement. Future work could also track longitudinally how comprehensibility changes after redesigns of bill content and structure, in the spirit of the experimental studies referenced in Section 3, and could extend the comparative analysis across customer segments to the vulnerable groups under-represented in the present sample. Three further extensions are within immediate reach of the existing design. Cross-tabulating cluster membership (Section 4.5) with behavioural indicators—tariff choice, willingness to switch supplier, and uptake of energy-saving measures—would turn the descriptive three-layer typology into a behavioural segmentation of direct policy relevance. Multivariate models (ordinal logistic regression or ANCOVA-type specifications) would isolate the net effects of age, gender and material situation that the bivariate contrasts reported here cannot separate. And equivalence procedures such as TOST would allow claims of similarity across customer groups—treated here, deliberately, as non-rejections—to be tested affirmatively. More broadly, and in line with calls for multi-method and comparative designs in energy social science [60], the self-reported, single-supplier character of the present evidence could be strengthened by triangulating survey data with behavioural or observational measures of how consumers actually use their bills, and by replicating the design across suppliers and regions, so that the findings can be tested for robustness beyond the Upper Silesian context.


Author Contributions

Conceptualization, M.C. and K.Z.; methodology, M.C., K.Z. and M.D.; formal analysis, M.C. and A.L.-P.; investigation, M.C., M.M. and A.L.-P.; data curation, A.L.-P. and M.M.; writing—original draft preparation, M.C.; writing—review and editing, M.C., K.Z., M.M., M.D. and A.L.-P.; supervision, M.C. and M.D. All authors have read and agreed to the published version of the manuscript.

Funding

This research received no external funding.

Institutional Review Board Statement

This study involved human participants. Participation was voluntary and anonymous, and informed consent was obtained before participation. The study was classified under Category B of the Human Subjects Research Ethics Policy of the University of Economics in Katowice, under which formal Ethics Committee or IRB approval is not required for studies where participation is voluntary and anonymous, no sensitive personal or identifiable data are collected, no intervention or experimental manipulation is involved, participants are adults, and applicable institutional and national regulations do not require formal ethics approval. The present survey—an anonymous, voluntary CATI questionnaire of adult electricity consumers with informed consent, involving no intervention, deception, vulnerable populations, or sensitive data—satisfies all of these conditions. Accordingly, in line with the Code of Ethics of the University of Economics in Katowice and the Komisja ds. Etyki Badań Naukowych z Udziałem Człowieka (established by Rector’s Order of 21 April 2022; Rules and Regulations: Order No. 41/22), formal ethical-committee approval was not required for this type of study. The instrument and fieldwork protocol were reviewed by the commissioning partner before data collection.

Informed Consent Statement

Informed consent was obtained from all subjects involved in the study.

Data Availability Statement

The original contributions presented in this study are included in the article. Further inquiries can be directed to the corresponding author.

Conflicts of Interest

The authors declare no conflicts of interest.

Abbreviations

The following abbreviations and symbols are used in this manuscript: CATI—computer-assisted telephone interview; CAWI—computer-assisted web interview; DSO—distribution system operator; ERO—Energy Regulatory Office; EU—European Union; NEP—New Ecological Paradigm; RES—renewable energy sources; TOST—two one-sided tests; VAT—value-added tax; α—Cronbach’s alpha (internal consistency); ρ—Spearman’s rank correlation coefficient; χ2—Pearson’s chi-square statistic; V—Cramér’s V (effect size); U—Mann–Whitney test statistic; H—Kruskal–Wallis test statistic; SD—standard deviation.

Appendix A. Questionnaire Items

This appendix reproduces, in English translation, the full wording of the questionnaire items administered in the CATI/CAWI survey, together with the source or inspiration of each item and its response scale. Items are grouped by the thematic blocks described in Section 3.3: (A) basic knowledge of the energy market; (B) the electricity bill—reading frequency, item identification and perceived comprehensibility; (C) behaviour and attitudes concerning energy saving and renewables, including the abridged NEP-inspired module; (D) social perception of the energy transition and its costs; and (E) socio-demographics.

Appendix A.1. Instrument Overview

The study used a standardised questionnaire administered in two modes: a 15 min computer-assisted telephone interview (CATI) and a complementary computer-assisted web interview (CAWI). The CATI instrument, fielded to individual consumers, prosumers and micro/small enterprises, comprised seven thematic blocks: (1) screening and eligibility; (2) self-assessed and objective knowledge of electricity billing; (3) comprehension and readability of the bill; (4) a 60-element bill-content battery, each element rated for familiarity and perceived necessity; (5) regulatory awareness (who or what determines bill content); (6) expectations for bill reform and attitudes to the energy transition; and (7) demographics. The CAWI instrument was a shortened variant that retained the bill-content battery, the demographic block and screening items but omitted the knowledge, comprehension and energy-transition blocks. The full item wording in Polish is given in the fieldwork questionnaires; the constructs, response scales, value coding and battery structure are documented below in English.

Appendix A.2. Response Scales and Value Coding

Table A1. Response scales and value coding used in the questionnaire.
Scale TypeItemsResponse Options and Coding
Self-assessed knowledge (5-pt)P11 = very little … 5 = very much; 6 = Don’t know -> missing
Likert agreement (5-pt)P2, L1P7, L2P7, E1, T4, L1T6, L2T61 = strongly disagree … 5 = strongly agree; 6 = Don’t know -> missing
Comprehension (4-pt)P31 = understand none … 4 = understand all; 5 = Don’t know -> missing
Yes/NoRR2, P6, T11 = Yes, 2 = No, 3 = Don’t know -> missing
Multi-select (binary per option)P4i1-i8, P5i1-i7, Z1i1-i7, T2i1-i5each option: 1 = selected, 0 = not selected
Bill-element familiarityP8 (×60)1 = Yes (reads it), 2 = No, 4 = does not know what it is, 5 = Don’t know -> missing
Bill-element necessityP8 (×60)1 = Yes (needed), 2 = No, 5 = Don’t know -> missing
Financial situation (5-pt)M31 = basic needs unmet … 5 = can afford luxury; 6 = refusal -> missing
SexM11 = female, 2 = male
AgeM2numeric (years)
Firm sizeS11 = ≤9, 2 = 10–49, 3 = 50–249, 4 = ≥250 employees
Survey weightwagapost-stratification weight (PBS)
Note. “Don’t know” and refusal codes were treated as missing in all analyses. “-> missing” denotes recoding to system-missing before scale construction and testing.

Appendix A.3. Item Inventory by Construct

Table A2. Item inventory of the CATI questionnaire, grouped by thematic block.
Code(s)BlockItem (Short English Description)
RR1; RR2; R1_B2B1. ScreeningConsent to participate; pays the TAURON electricity bill; business-customer (B2B) flag
P12. KnowledgeSelf-assessed knowledge of how the electricity bill is settled (5-pt)
P62. KnowledgeKnows how the final amount on the bill is calculated (Yes/No)
T12. KnowledgeKnows what the energy transition is (Yes/No)
P23. Bill comprehensionThe current TAURON bill is understandable (5-pt Likert)
P33. Bill comprehensionUnderstands the information placed on the bill (4-pt)
P4i1–i83. Bill comprehensionWhich bill elements are incomprehensible (multi-select: fixed/variable split, time-zone pricing, time-zone consumption, other surcharges, over-/under-payment, etc.)
L1P7; L2P73. Bill comprehensionBill contains enough information; payment calculation is clear (Likert)
P8 (×60, ×2)4. Bill-content battery60 bill elements rated for familiarity and perceived necessity (see Appendix A.4)
P5i1-i75. Regulatory awarenessWho/what determines bill content: supplier, ministry, EU, government, legislator, other, nobody (multi-select)
P10; P11; P125. Regulatory awarenessReasons for bill content; missing information; compensation/price-freeze information
Z1i1–i76. Expectations & transitionWhat should change to simplify the bill (multi-select)
Z26. Expectations & transitionBehavioural changes made to control consumption
E16. Expectations & transitionDoes it matter whether electricity comes from renewables? (5-pt Likert)
T2i1–i56. Expectations & transitionWhat the energy transition means: CO2 reduction, energy saving, EU norms, non-coal sources, lower prices (multi-select)
T3; T4; T56. Expectations & transitionPublic-spending priorities; is the transition necessary; who should finance lower prices
L1T6; L2T66. Expectations & transitionSolidarity in transition costs; subsidising coal mining raises prices (Likert)
M1; M2; M37. DemographicsSex; age (years); household financial situation (5-pt)
S1; S27. DemographicsFirm size (employees); industry (B2B only)

Appendix A.4. The 60-Element Bill-Content Battery (P8)

The battery comprises the 60 information elements that, under prevailing regulations, appear on every electricity bill. Each element is rated on two dimensions: familiarity (“Czy zapoznaje sie z ta informacja”—do you read this) and perceived necessity (“Czy ta informacja jest potrzebna”—is this information needed). The 60 elements are organised into seven sections (wstawki):
Table A3. Structure of the 60-element bill-content battery.
SectionElementsContent
1. Supplier and recipient identification1–6Supplier name/address, registration data (NIP, KRS), correspondence address, contact data, recipient number, buyer data
2. Invoice and detailed settlement7–18Invoice number, billing period, separate sale/distribution settlement, VAT rate, amount due, amount in words, payment deadline, issuing centre, issue date, consumption (kWh), prior-year consumption, excise
3. Regulatory and official-decision information19–24Capacity-fee change (2017 Act), tariff approval date (URE Bulletin), protective-measures/price-freeze laws, freeze-information website, statutory maximum price, distribution-tariff name
4. Supplier choice25–29Right to switch supplier, comparison tool, dynamic-price contract, fuel-mix structure, average-consumption/efficiency information
5. Technical and contact data30–34Distribution system operator, emergency phone, customer-service hours, readings website, self-service portal
6. Point of consumption and technical data35–47Detailed-settlement annex, point-of-consumption number, object name, allowable interruption times, point name/address, tariff group, contracted power, reading type, meter number, reading date, current/previous reading
7. Detailed rates and settlement of charges48–60Variable/fixed sale rate, network fixed/variable components, transitional fee, quality fee, RES fee, cogeneration fee, distribution subscription, capacity fee, and remaining itemised charges
Coding: familiarity 1 = Yes, 2 = No, 4 = does not know what it is, 5 = Don’t know; necessity 1 = Yes, 2 = No, 5 = Don’t know. These seven sections map onto the three informational layers identified by the hierarchical cluster analysis (section 4): detailed billing parameters (sections 6 and 7), transactional and payment information (sections 1, 2 and 5), and regulatory and legal information (sections 3 and 4).

Appendix A.5. Synthetic Indices

Three synthetic indices were constructed from the questionnaire items. The item composition, recoding, and scoring procedure for each index are documented in Table A4 below. Internal consistency was assessed with Cronbach’s α; all indices were deemed acceptable for use in group comparisons despite the moderate reliability of the energy-knowledge index, which combines subjective and objective knowledge items.
Table A4. Composition, recoding, and scoring of the three synthetic indices.
IndexItemsOriginal CodingRecodingScoringCronbach’s αValid N
Energy knowledgeP1 (self-assessed knowledge of billing) P6 (knows how bill is calculated) T1 (knows what energy transition is)P1: 1–5 (6 = DK) P6: 1 = Yes, 2 = No (3 = DK) T1: 1 = Yes, 2 = No (3 = DK)P1: 1–5 retained P6: 1 → 1, 2 → 0 T1: 1 → 1, 2 → 0 DK → missingSum of recoded items; range 0–7; rescaled to 0–1000.39568
Bill comprehensibilityP2 (bill is understandable) P3 (understands bill information) L1P7 (bill has enough information) L2P7 (calculation method sufficient)P2: 1–5 (6 = DK) P3: 1–4 (5 = DK) L1P7: 1–5 (6 = DK) L2P7: 1–5 (6 = DK)All items: DK→ missing; scales retained as-isItems standardised to 0–1 range and averaged; ×1000.81557
Transition acceptanceT4 (transition is necessary) L1T6 (all consumers should share costs) L2T6 (mining subsidies raise prices) E1 (renewable energy matters)All items: 1–5 (6 = DK)DK → missing; scales retained as-isItems standardised to 0–1 range and averaged; ×1000.72568
Notes. P1–P6, L1P7, L2P7, T1, T4, L1T6, L2T6, and E1 refer to questionnaire items as coded in the CATI instrument (Appendix A). DK = “Don’t know” response option. The energy-knowledge index combines one subjective self-assessment (P1) with two objective knowledge items (P6, T1); the moderate α reflects the heterogeneity of these knowledge dimensions rather than a deficiency in the scale. The bill-comprehensibility and transition-acceptance indices show good and acceptable internal consistency, respectively. All indices were used in non-parametric group comparisons (Kruskal–Wallis, Mann–Whitney) reported in Section 4.

Appendix B. Fieldwork Documentation

This appendix documents the fieldwork parameters and outcomes of the CATI survey conducted by PBS DGA on behalf of the University of Economics in Katowice in 2025. The survey targeted customers of TAURON Polska Energia in the Upper Silesia region and adjacent areas.
Table A5. Quota design and achieved sample by customer category.
Customer CategoryQuota TargetAchieved% of Sample
Individual consumers (B2C)20020033.2%
Prosumers (B2C)20020233.6%
Enterprises (B2B)20020033.2%
Total600602100.0%
The primary stratification variable was customer category, with equal quotas of n = 200 per group, derived from the supplier’s customer-base composition. Gender and age were monitored within the B2C strata (individual consumers and prosumers). Place of residence was controlled through the sampling frame—the supplier’s active-contact customer database in the Upper Silesia region—rather than as an individual-level quota. Education was not collected as a demographic variable in this survey, as the focal demographics were customer category, age, gender, and financial situation.
Table A6. Gender distribution by customer category (B2C only).
GenderConsumersProsumersTotal B2C%
Female966015638.8%
Male10414224661.2%
Total200202402100.0%
Table A7. Age distribution (B2C respondents; n = 390 with valid age).
Age Groupn%
18–2971.8%
30–39338.5%
40–499524.4%
50–598722.3%
60+16843.1%
Total390100.0%
Mean (SD)56.2 (13.2)
The sample over-represents older respondents (mean age 56.2 years, 43.1% aged 60+), reflecting the interaction of the sampling frame with differential availability and consent rates among older versus younger customers. A post-stratification weight (mean = 1.000, range 0.19–2.54) was computed by PBS to adjust for known deviations from the population marginals.
Table A8. Self-assessed financial situation of household (B2C; n = 402).
Categoryn%
1. Not enough for basics41.0%
2. Very frugal287.0%
3. Enough but save for big items17142.5%
4. Enough for many things14034.8%
5. Can afford luxury5413.4%
6. Refused51.2%
Table A9. Enterprise demographics (B2B; n = 200).
Company Sizen%Industryn%
1–9 employees16783.5%Trade4723.5%
10–492713.5%Services9648.0%
50–24910.5%Manufacturing2311.5%
250+31.5%Agriculture42.0%
Refused21.0%Other3015.0%
Table A10. CATI fieldwork disposition and response rates.
DispositionCount
Target sample600
Completed interviews (CATI)602
Eligible respondents contactedInformation maintained by PBS DGA
Cooperation rate (completed/eligible contacted)Detailed AAPOR dispositions held by fieldwork agency
Weight designPost-stratification (raking) on customer category
Weight range0.186–2.541
Weight mean1.000
Detailed AAPOR-standard contact-level disposition data (including the number of telephone numbers dialled, eligible contacts, refusals, and screen-outs) are maintained by the fieldwork agency (PBS DGA) and were not available at the individual-record level in the dataset transferred to the research team. The cooperation rate among eligible respondents who proceeded past the initial screening questions (consent to participate, confirmation of TAURON customer status) was 100%, as the dataset contains only completed interviews.
Table A11. Distribution of respondents by interview mode.
ModeTotal NB2C NB2B N
CATI602402200
CAWI (complement)500500
Total1102902200
The CAWI complement was administered to a separate sample of 500 individual consumers and prosumers drawn from the same supplier’s customer base. The two samples were not matched at the individual level; mode-comparability was assessed at the aggregate level. Key mode effects (Mann–Whitney U tests; CATI-ind n = 402 vs. CAWI n = 500): age differed significantly (CATI mean 56.2 vs. CAWI 42.8; U = 148,924, p < 0.001, rank-biserial r = −0.527); gender composition differed (CATI 38.8% female vs. CAWI 67.0% female; χ2(1) = 71.42, p < 0.001, V = 0.281). The mean proportion of bill items read was 0.566 (CATI) vs. 0.097 (CAWI; ρ = 0.834, p < 0.001), indicating substantially higher engagement in the CATI mode. These differences confirm that the two modes tap populations with different demographic profiles and engagement levels and caution against pooling the two samples without adjustment.

Appendix C. Dendrogram of the Hierarchical Cluster Analysis

The dendrogram in Figure A1 was produced by Ward’s hierarchical clustering method applied to the 60 bill-content indicators. Each indicator is a dichotomised read/did-not-read variable derived from the P8 battery (item familiarity question). The coding was as follows: 1 = Yes (reads the information) → 1; 2 = No (does not read) → 0; 4 = does not know what it is → 0 (treated as did not read, since unfamiliarity implies non-reading); and 5 = Don’t know/hard to say → missing. Cases with any missing values across the 60 items were excluded listwise, yielding a valid N = 487. The distance measure was Euclidean, consistent with the variance-minimisation criterion of Ward’s method. No additional standardisation was applied, as all indicators are on the same 0–1 scale after dichotomisation. The three-cluster solution was determined by reading the dendrogram together with the substantive interpretability of the resulting groups, as described in Section 3.5.
Figure A1. Dendrogram of Ward’s hierarchical cluster analysis of 60 bill-content indicators. Items clustered by respondent reading patterns (valid N = 487). Three colour groups indicate the three-cluster solution: (i) detailed billing parameters, (ii) transactional and payment information, (iii) regulatory and legal information. The dashed line marks the cut point yielding the three-cluster solution.
Sustainability 18 08868 g0a1

References

  1. Brounen, D.; Kok, N.; Quigley, J.M. Energy Literacy, Awareness, and Conservation Behavior of Residential Households. Energy Econ. 2013, 38, 42–50. [Google Scholar] [CrossRef] [Scilit]
  2. Gołębiowska, B. Energy Literacy in Poland. Ekon. I Sr. 2020, 2, 121–143. [Google Scholar] [CrossRef]
  3. Dwyer, C. The Relationship between Energy Literacy and Environmental Sustainability. Low Carbon Econ. 2011, 2, 123–137. [Google Scholar] [CrossRef]
  4. Appiah, M.K.; Gyening, E.K.; Teye, P.K.; Frimpong, C.; Nsowah, A. The Implications of Energy Literacy on Energy Savings Behavior: A Model of Contingent Effects of Energy Value and Attitude. Energy Rep. 2023, 10, 72–85. [Google Scholar] [CrossRef] [Scilit]
  5. U.S. Department of Education. Energy Literacy: Essential Principles and Fundamental Concepts for Energy Education. Available online: https://www.usgbc.org/resources/energy-literacy-essential-principles-and-fundamental-concepts-energy-education (accessed on 18 April 2026).
  6. Santillán, O.S.; Cedano, K.G. Energy Literacy: A Systematic Review of the Scientific Literature. Energies 2023, 16, 7235. [Google Scholar] [CrossRef] [Scilit]
  7. U.S. Department of Energy. Energy Literacy: Essential Principles for Energy Education. Available online: https://www.energy.gov/energysaver/energy-literacy-essential-principles-energy-education (accessed on 18 April 2026).
  8. DeWaters, J.; Powers, S. Establishing Measurement Criteria for an Energy Literacy Questionnaire. J. Environ. Educ. 2013, 44, 38–55. [Google Scholar] [CrossRef] [Scilit]
  9. DeWaters, J.E.; Powers, S.E. Energy Literacy of Secondary Students in New York State (USA): A Measure of Knowledge, Affect, and Behavior. Energy Policy 2011, 39, 1699–1710. [Google Scholar] [CrossRef] [Scilit]
  10. Andolfi, L.; Pavić, I. Know Better, Power Smarter: How Energy Literacy Relates to Household Energy Use. Energy Res. Soc. Sci. 2025, 130, 104419. [Google Scholar] [CrossRef] [Scilit]
  11. Martins, A.; Madaleno, M.; Dias, M.F. Energy Literacy: What Is out There to Know? Energy Rep. 2020, 6, 454–459. [Google Scholar] [CrossRef] [Scilit]
  12. Adams, J.; Kenner, A.; Leone, B.; Rosenthal, A.; Sarao, M.; Boi-Doku, T. What Is Energy Literacy? Responding to Vulnerability in Philadelphia’s Energy Ecologies. Energy Res. Soc. Sci. 2022, 91, 102718. [Google Scholar] [CrossRef] [Scilit]
  13. Schwartz, T.; Denef, S.; Stevens, G.; Ramirez, L.; Wulf, V. Cultivating Energy Literacy: Results from a Longitudinal Living Lab Study of a Home Energy Management System. In Proceedings of the SIGCHI Conference on Human Factors in Computing Systems; ACM: New York, NY, USA, 2013; pp. 1193–1202. [Google Scholar]
  14. Koomson, I.; Churchill, S.A.; Smyth, R. Financial Literacy and Clean Energy Adoption in South Africa. Energy Econ. 2025, 151, 108927. [Google Scholar] [CrossRef] [Scilit]
  15. Simon, H.A. A Behavioral Model of Rational Choice. Q. J. Econ. 1955, 69, 99–118. [Google Scholar] [CrossRef] [Scilit]
  16. Best, R.; Taylor, M.; Gutiérrez-Alvarez, R.; Parra, D. Energy Bill Pressure Stimulates Investment Intentions Primarily for High-Socioeconomic Households in Australia. Energy Econ. 2026, 154, 109111. [Google Scholar] [CrossRef] [Scilit]
  17. Akerlof, G.A. The Market for “Lemons”: Quality Uncertainty and the Market Mechanism. Q. J. Econ. 1970, 84, 488–500. [Google Scholar] [CrossRef] [Scilit]
  18. Eryilmaz, D.; Gafford, S. Can a Daily Electricity Bill Unlock Energy Efficiency? Evidence from Texas. Electr. J. 2018, 31, 7–11. [Google Scholar] [CrossRef] [Scilit]
  19. Erdayandi, K.; Cordeiro, L.C.; Mustafa, M.A. Privacy-Preserving and Accountable Billing in Peer-to-Peer Energy Trading Markets with Homomorphic Encryption and Blockchain. Sustain. Energy Grids Netw. 2025, 41, 101568. [Google Scholar] [CrossRef] [Scilit]
  20. Norman, D.A. The Design of Everyday Things; Basic Books: New York, NY, USA, 2013. [Google Scholar]
  21. Stiglitz, J.E. The Contributions of the Economics of Information to Twentieth Century Economics. Q. J. Econ. 2000, 115, 1441–1478. [Google Scholar] [CrossRef] [Scilit]
  22. Sweller, J. Cognitive Load During Problem Solving: Effects on Learning. Cogn. Sci. 1988, 12, 257–285. [Google Scholar] [CrossRef] [Scilit]
  23. He, S.; Blasch, J.; van Beukering, P.; Wang, J. Energy Labels and Heuristic Decision-Making: The Role of Cognition and Energy Literacy. Energy Econ. 2022, 114, 106279. [Google Scholar] [CrossRef] [Scilit]
  24. Zhou, L.; Katris, A.; Turner, K. Energy Bill Support versus Home Thermal Retrofits: Assessing the Dynamic Economic Impacts of Fuel Poverty Mitigation Initiatives in the United Kingdom. Energy Res. Soc. Sci. 2026, 135, 104588. [Google Scholar] [CrossRef] [Scilit]
  25. Andolfi, L.; Ortega Moreno, B. Smart Choices: The Influence of Energy Literacy on Energy Technology Adoption. In Proceedings of the 16th International Conference on Applied Energy (ICAE 2024), Niigata, Japan, 1–5 September 2024; Available online: https://orbilu.uni.lu/handle/10993/61947 (accessed on 12 July 2026).
  26. Zhang, C.; Qu, K.; Li, Z. Reducing Household Electricity Use through Smart Meters: The Role of Improved Consumer Energy Awareness. Energy Build. 2025, 347, 116318. [Google Scholar] [CrossRef] [Scilit]
  27. Reis, I.F.G.; Lopes, M.A.R.; Antunes, C.H. Energy Literacy: An Overlooked Concept to End Users’ Adoption of Time-Differentiated Tariffs. Energy Effic. 2021, 14, 39. [Google Scholar] [CrossRef] [Scilit]
  28. Bañales, S.; Dormido, R.; Duro, N. Explainable AI for Predicting Household Demand Flexibility: Insights from Smart Meter Data and Price-Based Programs. Energy AI 2026, 24, 100686. [Google Scholar] [CrossRef] [Scilit]
  29. Tao, M.; Lin, B.; Poletti, S.; Pan, A. Can Financial Literacy Ease Energy Poverty? Some Lessons at the Household Level in China. Util. Policy 2024, 91, 101835. [Google Scholar] [CrossRef] [Scilit]
  30. Rūtelionė, A.; Stasiškienė, Ž. Energy Literacy and Energy Poverty in Austria, Bulgaria, Greece, Italy and Lithuania: Insights from the E-Lit Adults Project. Environ. Res. Eng. Manag. 2025, 81, 5–6. [Google Scholar] [CrossRef] [Scilit]
  31. Kovačič, D.; Ulbin, A.; Abina, A.; Zidanšek, A.; Krajnc, D. Energy Literacy among Young Adults in the European Countries. J. Policy Soc. 2024, 2, 466. [Google Scholar] [CrossRef] [Scilit]
  32. European Union. Directive (EU) 2019/944 of the European Parliament and of the Council of 5 June 2019 on common rules for the internal market for electricity and amending Directive 2012/27/EU (recast). Off. J. Eur. Union 2019, 158, 125. [Google Scholar]
  33. Eurostat. Electricity Price Statistics—Statistics Explained; European Commission: Luxembourg, 2025; Available online: https://ec.europa.eu/eurostat/statistics-explained/index.php?title=Electricity_price_statistics (accessed on 19 April 2026).
  34. Duggan, J.E. Capacity Market Mechanism Analyses: A Literature Review. Curr. Sustain. Energy Rep. 2020, 7, 186–192. [Google Scholar] [CrossRef] [Scilit]
  35. Borowski, P.F. Zonal and Nodal Models of Energy Market in European Union. Energies 2020, 13, 4182. [Google Scholar] [CrossRef] [Scilit]
  36. Einsiedler, J.; Von Hindte, G.; Mori, V.; Moser, A. Analysis of Electricity Market Models for Future Power Systems. In Proceedings of the 2025 International Conference on the European Energy Market (EEM); IEEE: New York, NY, USA, 2025. [Google Scholar] [CrossRef] [Scilit]
  37. Stagnaro, C.; Amenta, C.; Croce, G.; Lavecchia, L. Managing the Liberalization of Italy’s Retail Electricity Market: A Policy Proposal. Energy Policy 2020, 136, 111150. [Google Scholar] [CrossRef] [Scilit]
  38. Joshi, G.; Sen, V. Residential Consumer Understanding of Electricity Bills: The Case of the Indian Consumer. Int. J. Asian Bus. Inf. Manag. 2021, 12, 1–16. [Google Scholar] [CrossRef] [Scilit]
  39. Mamkhezri, J. Out of Sight, Out of Mind? Consumer Awareness and (Mis)understanding of Electricity Bills in the United States. Energy Res. Soc. Sci. 2025, 124, 104271. [Google Scholar] [CrossRef] [Scilit]
  40. Van den Broek, K.L. Household Energy Literacy: A Critical Review and a Conceptual Typology. Energy Res. Soc. Sci. 2019, 57, 101256. [Google Scholar] [CrossRef] [Scilit]
  41. Azevedo, I.; Davis, M.; Krishnamurti, T.; Lesic, V.; de Bruin, W.B. Consumers’ Perceptions of Energy Use and Energy Savings: A Literature Review. Environ. Res. Lett. 2018, 13, 033004. [Google Scholar] [CrossRef] [Scilit] [PubMed]
  42. Empower the Consumer! Energy-Related Financial Literacy and Its Implications for Economic Decision Making. Available online: https://research.vu.nl/en/publications/empower-the-consumer-energy-related-financial-literacy-and-its-im/ (accessed on 19 April 2026).
  43. Andolfi, L.; Burcheri, L.M.; Marxen, H. The Residential Perception of Real-Time Electricity Tariffs. In Proceedings of the 2025 International Conference on the European Energy Market (EEM); IEEE: New York, NY, USA, 2025. [Google Scholar] [CrossRef] [Scilit]
  44. Allcott, H. Social Norms and Energy Conservation. J. Public Econ. 2011, 95, 1082–1095. [Google Scholar] [CrossRef] [Scilit]
  45. Brandon, A.; List, J.A.; Metcalfe, R.D.; Price, M.K.; Rundhammer, F. Testing for Crowd Out in Social Nudges: Evidence from a Natural Field Experiment in the Market for Electricity. Proc. Natl. Acad. Sci. USA 2019, 116, 5293–5298. [Google Scholar] [CrossRef] [Scilit] [PubMed]
  46. Delmas, M.A.; Asensio, O.I. Nonprice Incentives and Energy Conservation. Proc. Natl. Acad. Sci. USA 2015, 112, E510–E515. [Google Scholar] [CrossRef] [Scilit] [PubMed]
  47. Sinea, A.; Kollmann, A.; Klöckner, C.; Caffaro, F.; Carrus, G.; Tiberio, L.; Biresselioglu, M.E.; Veselý, Š. Norms, Prices, and Commitment: A Comprehensive Overview of Field Experiments in the Energy Domain and Treatment Effect Moderators. Front. Psychol. 2022, 13, 967318. [Google Scholar] [CrossRef] [Scilit] [PubMed]
  48. Bonan, J.; Cattaneo, C.; d’Adda, G.; Tavoni, M. Can Social Information Programs Be More Effective? The Role of Environmental Identity for Energy Conservation. J. Environ. Econ. Manag. 2021, 109, 102467. [Google Scholar] [CrossRef] [Scilit]
  49. Andor, M.A.; Fels, K.M. Social Norms and Energy Conservation Beyond the US. J. Environ. Econ. Manag. 2020, 103, 102351. [Google Scholar] [CrossRef] [Scilit]
  50. Andolfi, L.; Marxen, H.; Frank, M. Are You Flexible Enough? The Impact of Energy Literacy and Environmental Values on Flexibility Provision. In Proceedings of the 2024 International Conference on the European Energy Market (EEM); IEEE: New York, NY, USA, 2024. [Google Scholar] [CrossRef] [Scilit]
  51. Polski Instytut Ekonomiczny (PIE). Cztery Oblicza Ubóstwa Energetycznego; PIE: Warsaw, Poland, 2024. [Google Scholar]
  52. Polski Instytut Ekonomiczny (PIE). Prościej, Taniej i Skuteczniej. Ekonomia Behawioralna w Służbie Obywatelowi; PIE: Warsaw, Poland, 2019. [Google Scholar]
  53. Polski Instytut Ekonomiczny (PIE). Scenariusze Polskiego Miksu Energetycznego 2040; PIE: Warsaw, Poland, 2023. [Google Scholar]
  54. Polski Instytut Ekonomiczny (PIE). Bilansowanie OZE w Systemie Elektroenergetycznym; PIE: Warsaw, Poland, 2020. [Google Scholar]
  55. European Commission. Consumer Study on Pre-Contractual Information and Billing in the Energy Market—Improved Clarity and Comparability; Publications Office of the European Union: Luxembourg, 2018. [Google Scholar]
  56. Urząd Regulacji Energetyki. Rachunki Pod Kontrolą Konsumenta; ERO: Warsaw, Poland, 2025.
  57. Djurisic, V.; Cerovic Smolovic, J.; Misnic, N.; Rogic, S. Analysis of public attitudes and perceptions towards renewable energy sources in Montenegro. Energy Rep. 2020, 6, 395–403. [Google Scholar] [CrossRef] [Scilit]
  58. Zoellner, J.; Schweizer-Ries, P.; Wemheuer, C. Public Acceptance of Renewable Energies: Results from Case Studies in Germany. Energy Policy 2008, 36, 4136–4141. [Google Scholar] [CrossRef] [Scilit]
  59. Dunlap, R.E.; Van Liere, K.D.; Mertig, A.G.; Jones, R.E. Measuring Endorsement of the New Ecological Paradigm: A Revised NEP Scale. J. Soc. Issues 2000, 56, 425–442. [Google Scholar] [CrossRef] [Scilit]
  60. Sovacool, B.K.; Axsen, J.; Sorrell, S. Promoting Novelty, Rigor, and Style in Energy Social Science: Towards Codes of Practice for Appropriate Methods and Research Design. Energy Res. Soc. Sci. 2018, 45, 12–42. [Google Scholar] [CrossRef] [Scilit]
  61. Kalmi, P.; Trotta, G.; Kažukauskas, A. Energy-Related Financial Literacy and Electricity Consumption: Survey-Based Evidence from Finland. J. Consum. Aff. 2021, 55, 1062–1089. [Google Scholar] [CrossRef] [Scilit]
  62. Brühl, J.; Smith, G.; Visser, M. Simple is good: Redesigning utility bills to reduce complexity and increase understanding. Util. Policy 2019, 60, 100934. [Google Scholar] [CrossRef] [Scilit]
  63. Karjalainen, S. Consumer Preferences for Feedback on Household Electricity Consumption. Energy Build. 2011, 43, 458–467. [Google Scholar] [CrossRef] [Scilit]
  64. Dominitz, S.; Parush, A.; Metcalfe, D. Domestic Electricity Consumers and the Interactive Bill: Design Intervention for Improved Energy Literacy and Empowerment. Energy Res. Soc. Sci. 2023, 103, 103209. [Google Scholar] [CrossRef] [Scilit]
  65. Gaskell, G.; Pike, R. Residential Energy Use: An Investigation of Consumers and Conservation Strategies. J. Consum. Policy 1983, 6, 285–302. [Google Scholar] [CrossRef] [Scilit]
Figure 1. The regulatory layer of the Polish electricity bill. Successive EU and national instruments each add obligatory content to the invoice; this is the layer consumers read least (see Section 4.5).
Sustainability 18 08868 g001
Figure 2. Constructing the research gap. Three well-established strands of the literature converge on, but do not jointly address, the electricity bill as the site where energy literacy, transparency and interpretation meet. The present study occupies that intersection.
Sustainability 18 08868 g002
Figure 3. Conceptual framework linking socio-economic context, energy literacy, perceived transparency, detailed interpretation and market decision-making. The sequence is analytical rather than strictly causal; the cross-sectional data reported below establish association, not direction (see Section 5).
Sustainability 18 08868 g003
Figure 4. Sample composition of individual respondents by gender, age group and self-assessed financial situation.
Sustainability 18 08868 g004
Figure 5. The research design and empirical strategy, from research question and hypotheses through instrument design, piloting and single-wave fieldwork to analysis and index construction.
Sustainability 18 08868 g005
Figure 6. Distribution of self-declared knowledge of electricity billing (n = 589). The modal response is the neutral middle; only 7.1% feel fully competent.
Sustainability 18 08868 g006
Figure 7. Self-declared billing knowledge collapsed into low/neutral/high, by age group (Kruskal–Wallis p = 0.006). Confidence peaks in the 35–54 group and falls sharply after 55.
Sustainability 18 08868 g007
Figure 8. Agreement that the bill carries enough information about the components of the price (n = 589). A majority judge the bill complete—the barrier is interpretation, not volume.
Sustainability 18 08868 g008
Figure 9. Respondents’ attribution of bill complexity. Roughly 58% attribute complexity to legislation (Polish and EU combined), while 29.2% suspect deliberate obfuscation by suppliers and only 9.3% blame outdated company systems.
Sustainability 18 08868 g009
Figure 10. Who do consumers think decides what appears on the bill? (question P5; multiple responses possible). Legislation is named by only 4.5% and the EU by none, while 55.8% credit the seller alone.
Sustainability 18 08868 g010
Figure 11. Spearman rank correlation matrix for the three comprehension constructs. All off-diagonal coefficients are significant at p < 0.001.
Sustainability 18 08868 g011
Figure 12. The three-layer cognitive structure of the electricity bill, from Ward’s hierarchical clustering. Each layer is internally consistent; transactional content (Layer II) is read significantly more often than regulatory content (Layer III).
Sustainability 18 08868 g012
Figure 13. Expectations concerning changes in the bill. (Left): Areas most in need of change across all respondents. (Right): The top-priority area differs by customer segment—legal provisions for entrepreneurs, the company’s approach for prosumers, and billing systems for individual consumers.
Sustainability 18 08868 g013
Figure 14. Does it matter that the electricity used comes from renewable sources? Distribution of responses (n = 595). A clear majority say it matters.
Sustainability 18 08868 g014
Figure 15. Attitudes towards the origin of energy, by gender. Women are markedly less likely than men to dismiss the origin of energy as irrelevant.
Sustainability 18 08868 g015
Figure 16. Self-assessed financial situation by gender. Men report better household finances than women across the distribution (χ2(4) = 21.77, p < 0.001).
Sustainability 18 08868 g016
Table 1. Composition and internal consistency of the three billing-information clusters (Ward’s method; valid N = 453).
Cluster (Information Layer)Content (Examples)ItemsCronbach’s αMagnitude
I. Detailed billing parametersTariff group; contracted power; meter readings; unit sale rates; network, transitional, quality, RES, cogeneration and capacity charges; average gross price per kWh200.925Excellent
II. Transactional & identificationSeller/buyer data; invoice number; billing period; VAT rate; amount due; due date; kWh used; metering-point number and address170.797Acceptable
III. Regulatory & legalPrice-freeze and statutory maximum price; tariff approval dates; supplier-switching and dynamic-price notices; fuel mix; DSO/emergency contacts; payment slip230.892Good
Note. Valid N = 453 (75.2%); 149 observations (24.8%) excluded listwise. High α indicates internal consistency of reading behaviour within each layer, not construct distinctness.
Table 2. Hypotheses, corresponding constructs, analytical tests and reporting location.
HypothesisConstruct/Questionnaire BlockAnalytical TestSection 4
H1Self-declared billing knowledge × demographicsMann–Whitney U; Kruskal–WallisSupported (Section 4.1)
H2Perceived amount of information × customer typeKruskal–WallisNot rejected (Section 4.2)
H3Attribution of bill complexityDescriptive; cross-tabulationSupported (Section 4.3)
H4Expectations of change × customer segmentCross-tabulation (chi-square)Supported (Section 4.6)
H5Attitudes to renewables × demographicsCross-tabulation; correlationPartly supported (Section 4.7)
Table 3. Socio-demographic profile of individual respondents (valid answers). Percentages are of valid responses; base N differs by item owing to item non-response.
CharacteristicCategoryn% of Valid
Gender (n = 402)Men24661.2
Women15638.8
Age group (n = 390)≤34 years184.6
35–54 years16141.3
≥55 years21154.1
Financial situation (n = 397)Cannot afford basic needs41.0
Must be very frugal287.1
Get by, but save for larger purchases17143.1
Comfortable without special saving14035.3
Can afford some luxury5413.6
Note. Mean age = 56.24 years (SD = 13.25; range 23–86). Age distribution departs from normality (Kolmogorov–Smirnov D = 0.071, p < 0.001; Shapiro–Wilk W = 0.988, p = 0.002).
Table 4. Summary of inferential statistical tests reported in the results.
Hyp.Variables/ComparisonTestStatisticdfpEffect SizeOutcome
H1Self-declared billing knowledge × Gender (men > women)Mann–Whitney Uaa0.026aSupported
H1× Age groupKruskal–Wallis Haa0.006aSupported
H1× Material situationKruskal–Wallis Haa0.001aSupported
H2Perceived amount of information × Customer groupKruskal–Wallis Haa0.950aNot rejected (ns)
H5Attitude to renewables × Genderaaa0.029aPartly supported
H5× Age groupKruskal–Wallis Haa >0.05aNot supported
Gender × Material situationPearson χ221.774 <0.001V = 0.23Significant
Age × Material situationPearson χ213.6580.091V = 0.13Independent
Age × Material situationKruskal–Wallis Haa0.065ans
Note. Hyp. = hypothesis; ns = not significant. All non-parametric tests are two-tailed. a The article reports exact p-values for the Mann–Whitney and Kruskal–Wallis tests but not the corresponding U/H statistics or their effect sizes (ε2, rank-biserial r); these should be supplied from the raw data. For the Pearson χ2 tests, Cramér’s V was computed as √(χ2/[N(min(k1,k2) − 1)]), with N = 397 for the gender × material-situation test. Effect-size magnitude per Cohen: |r| 0.10/0.30/0.50 = small/medium/large; V at df = 1: 0.10/0.30/0.50; df = 2: 0.07/0.21/0.35.
Table 5. Spearman rank correlations between self-declared energy literacy, perceived bill comprehensibility and detailed understanding of invoice information (N valid = 602; ** p < 0.001).
Variable123
1. Self-declared energy literacy0.506 **0.487 **
2. Perceived bill comprehensibility0.506 **0.609 **
3. Detailed understanding of invoice information0.487 **0.609 **
Note. Valid N = 602. ** p < 0.001. Coefficients are Spearman ρ, which simultaneously serves as the effect-size estimate: ρ = 0.506 (large) and ρ = 0.487 (medium-to-large) for the associations with self-declared literacy; ρ = 0.609 (large) for perceived comprehensibility with detailed understanding.
Table 6. Areas most in need of change to make the bill simpler, by customer segment (multiple responses possible; column percentages within segment). N = 597.
Area to ChangeConsumers (%)Prosumers (%)Entrepreneurs (%)All (%)
Company’s approach to the customer39.042.642.641.4
Legal provisions39.034.747.240.2
Billing systems41.031.238.536.9
Language used on the bill25.521.320.022.3
Something else8.011.97.29.0
Nothing needs to change5.53.54.14.4
Don’t know4.54.04.64.4
Note. Multiple responses permitted, so columns sum above 100%. Base: Consumers n = 200, prosumers n = 202, entrepreneurs n = 195; total n = 597. The top priority differs by segment (bold in Figure 13).
Table 7. Self-assessed financial situation by gender (row percentages; χ2(4) = 21.77, p < 0.001).
Financial SituationWomen (%)Men (%)
Cannot afford basic needs1.90.4
Must be very frugal12.33.7
Get by, but save for larger purchases47.140.5
Comfortable without special saving31.637.6
Can afford some luxury7.117.8
Total100.0 (n = 155)100.0 (n = 242)
Note. Row percentages within gender. Pearson χ2(4) = 21.77, p < 0.001; N valid = 397. Age and material situation were, by contrast, independent (χ2(8) = 13.65, p = 0.091; Kruskal–Wallis p = 0.065).
Table 8. Chi-square tests of independence for socio-demographic structural relationships.
VariablesTestχ2dfpCramér’s VDecisionN
Gender × Material situationPearson χ221.774<0.0010.23Significant397
Age × Material situationPearson χ213.6580.0910.13Independent397
Note. Row percentages for the gender × material-situation cross-tabulation are reported in Table 7. For Age × Material situation the non-parametric Kruskal–Wallis test is consistent with the χ2 result (p = 0.065). Effect-size magnitude: V = 0.23 (small-to-medium, df = 1) and V = 0.13 (small, df = 2).
Disclaimer/Publisher’s Note: The statements, opinions and data contained in all publications are solely those of the individual author(s) and contributor(s) and not of MDPI and/or the editor(s). MDPI and/or the editor(s) disclaim responsibility for any injury to people or property resulting from any ideas, methods, instructions or products referred to in the content.