Article

Safety Performance in Leeto La Polokwane Bus Rapid Transit System, South Africa

1
Department of Urban and Regional Planning, University of Venda, Thohoyandou 0950, South Africa
2
Department of Urban and Regional Planning, University of Johannesburg, Johannesburg 2092, South Africa
*
Author to whom correspondence should be addressed.
Sustainability 2026, 18(17), 8780; https://doi.org/10.3390/su18178780
Submission received: 19 June 2026 / Revised: 10 August 2026 / Accepted: 13 August 2026 / Published: 27 August 2026

Abstract

Sustainable public transport in South Africa has become a policy priority over the past few decades. Safety is recognised as a fundamental component of this agenda. In many cities, public transport systems are often characterised by poor safety standards, which undermine ridership and public confidence. In the City of Polokwane, despite the successful recent completion of the first phase of Leeto La Polokwane bus system, an Intelligent Transportation System designed for sustainable transport management, the safety performance of the system and its subsequent influence on travel behaviour remain underexplored. This study addresses this gap by investigating the safety performance of the Leeto La Polokwane Phase 1A and its relationship with commuters’ sustainable travel mode choice. Commuter surveys (n = 344), field observations, and actual ridership data were used to collect data. Principal component analysis extracted two key factors (commuter safety and crime prevention), which together explained 63.14% of the total variance in commuters’ perceptions of safety. Commuters reported a neutral perception of commuter safety (mean = 4.03) and a negative perception of crime prevention (mean = 3.90). Multinomial logistic regression revealed that commuters’ perceptions of safety, particularly concerns related to crime prevention, were statistically significant predictors of sustainable travel mode choice. Multiple linear regression further showed that operational continuity and system maturation were positively associated with ridership growth, with operating days (β = 0.307, p = 0.044) and time in operation (β = 0.670, p < 0.001) emerging as significant predictors. Although taxi protests (β = −0.036, p = 0.804) and school holidays (β = −0.199, p = 0.181) were negatively correlated with ridership. The study concludes that safety is a critical determinant of sustainable public transport use that extends beyond the onboard environment to include the entire commuter journey. To improve public transport safety requires a holistic strategy that integrates safe pedestrian infrastructure, effective crime prevention, operational reliability, and strengthened institutional collaboration.

1. Introduction

Rapid urbanisation increases the demand for efficient and intelligent public transport systems for sustainable transport management. A critical component of realising this demand is increasing public transport ridership [1], which is consistently constrained by both the actual experience and perceived level of personal safety. According to reference [2], perceptions of personal safety are believed to have a significant influence on public transport ridership and travel mode choice. Negative perceptions of safety discourage both current commuters and potential users from using public transport. Commuters’ perception of safety, whether walking to and from the stop/station or waiting to board and onboard, plays an important role in influencing their decision to use public transport in the future [3]. Feeling insecure or unsafe in public transport leads to barriers in everyday mobility for commuters. This in turn results in people taking precautionary measures such as only travelling at certain times of the day or on certain routes, or even by avoiding public transport completely [4,5]. Therefore, it is imperative to better understand safety performance, both the actual safety conditions and commuters’ perceptions of safety within public transport systems, to improve service attractiveness and increase ridership.
Studies conducted in the United Kingdom suggest that about 10% of the population would reconsider using public transport if safety concerns were adequately addressed [2,6,7,8,9]. An analysis of safety on public transport in other developed countries such as the United States, Italy, Sweden and France indicated that safety concerns among commuters have an important impact on travel mode choice [10,11,12,13]. These indicate that even in developed countries, where public transport infrastructure and service standards are relatively advanced, safety performance remains a critical factor influencing travel behaviour. In developing countries, particularly sub-Saharan Africa, commuters spend up to a third of their income on commuting trips using public transport. The high reliance on public transport makes safety and security issues even more critical because they do not directly affect ridership but also mobility choices, accessibility to opportunities, and overall quality of urban life. In South Africa, despite mega investments in improving public transport since 2010, including launching the Gautrain rapid rail in Gauteng and the BRT systems in various cities, safety concerns in public transport systems have widely remained a major challenge affecting commuter travel behaviour and public transport ridership.
Against this background, the City of Polokwane has also invested in improving its public transport system through the implementation of the Leeto La Polokwane BRT system. The system was introduced as part of broader efforts to modernise urban public transport, improve accessibility, and provide safer and more reliable mobility options for residents. Phase 1A of the system represents the first major milestone towards achieving an integrated and efficient public transport network in the city. However, despite these infrastructural and operational improvements, there is still limited empirical evidence on how safety performance within the system influences commuter perceptions and sustainable travel mode choice. Most existing studies on public transport safety performance in South Africa have largely focused on metropolitan cities [14,15,16,17,18,19], secondary cities like Polokwane remain under-researched. Therefore, it is imperative to examine both the actual safety conditions and commuters’ perceptions of safety within Phase 1A of the Leeto La Polokwane BRT system to understand its effectiveness in promoting public transport ridership and supporting sustainable travel mode choice. Therefore, this study aims to investigate the safety performance of Leeto La Polokwane Phase 1A. The specific objectives of the study are as follows:
Identify latent factors influencing commuters’ perceptions of safety in the Leeto La Polokwane Phase 1A.
Explore commuters’ perceptions of safety across different demographic groups.
Determine the relationship between safety perceptions and sustainable travel mode choice.
Analyse monthly ridership trends and identify operational factors associated with ridership growth.

2. Literature Review

2.1. Safety Performance in Public Transport Systems

Safety is widely recognised as one of the most important determinants of public transport service quality and sustainable urban mobility. It is generally defined as both the actual level of protection from crime, violence and traffic accidents and the perceived sense of security that users experience based on these conditions and other psychological factors [14,20,21]. Consequently, safety encompasses both objective measures of protection and subjective perceptions that influence commuters’ confidence in using public transport. According to ref. [22], definitions of safety and security in the literature can be broadly classified into two perspectives. The first conceptualises safety in relation to the prevention of harm and physical injury, while the second associates these concepts with crime, victimisation, fear of crime, and the implementation of preventive measures. Similarly, reference [23] argues that safety involves protection from crime, disorder and the fear of such events, which highlight both the physical and psychological dimensions of personal well-being. Altogether, these perspectives suggest that safety extends beyond the mere absence of crime or accidents to include commuters’ perceptions of risk and their confidence in the transport environment.
Previous studies have shown that commuters evaluate safety throughout the entire travel journey, including walking to and from stops or stations, waiting for services, boarding and alighting, and travelling onboard public transport vehicles. As a result, safety performance of public transport systems is influenced not only by operational factors, such as driver behaviour and accident risk, but also by environmental conditions, including pedestrian infrastructure, lighting surveillance systems, security personnel and the quality of waiting facilities. These factors collectively determine the extent to which public transport is perceived as a safe, attractive and reliable travel option. In the context of this study, safety performance refers to both the actual and perceived levels of safety experienced by commuters throughout the entire travel journey. Safety performance encompasses pedestrian access routes, bus stops, waiting areas, onboard travel, and protection from crime and traffic-related risks. This conceptualisation recognises that commuters’ travel decisions are shaped not only by objective safety conditions but also by their perceptions of safety across the entire travel environment. Therefore, investigating safety performance provides an important basis for understanding how safety influences sustainable travel mode choice and ridership in the Leeto La Polokwane Phase 1A.

2.2. Commuters’ Perceptions of Safety in Public Transport

Commuters’ perceptions of safety refer to users’ subjective evaluations of the extent to which they feel protected from crime, violence, accidents, and other risks while accessing, waiting for, and travelling on public transport. These perceptions are shaped by both personal experiences and the physical and operational characteristics of the transport environment and are recognised as important determinants of public transport use and travel behaviour. According to reference [20], how people perceive transit environments depends on environmental factors, individual qualities, and situational contexts, such as the transport mode, type of transport node (bus stop or station), and the quality of the places they traverse from their home to a transport node. Previous studies indicate that commuters’ perceptions of safety are multidimensional and extend beyond the onboard travel experience. For instance, ref. [2] revealed that concerns about personal security while walking to public transport stops, waiting for services, and travelling onboard significantly influence commuters’ willingness to use public transport. Ref. [22] argued that inadequate lighting, poor surveillance, isolated waiting areas, and limited security measures increase fear of crime and reduce commuters’ confidence in public transport systems. Ref. [24] further revealed that the concerns associated with low-skilled bus drivers and poor compliance with road traffic regulations are leading to declining ridership of the Lagos BRT system.
Therefore, factors such as pedestrian infrastructure, lighting, surveillance systems, visible security personnel, waiting conditions, service reliability, and driver behaviour collectively influence commuters’ perceptions of public transport safety performance. Consequently, deficiencies in these attributes may increase perceived risk, discourage public transport use, and reduce commuters’ willingness to adopt sustainable travel modes. Although objective safety measures, such as reduced crime rates and fewer traffic accidents, are important indicators of system performance, commuters’ travel decisions are often influenced more by their perceptions of safety than by actual safety conditions. Negative perceptions may therefore discourage public transport use even where objective safety risks are relatively low. Understanding commuters’ perceptions of safety is therefore essential to identify the service attributes that require improvement and develop interventions that encourage public transport use and support sustainable urban mobility.

2.3. Commuters’ Perceptions of Safety and Sustainable Travel Mode Choice

Sustainable travel mode refers to the decision to use transport modes that minimise environmental impacts while promoting social equity and economic efficiency [25,26]. According to ref. [27], reducing the need to travel and travel distances and achieving a modal shift to public transport, cycling and walking are among the main objectives of a sustainable urban mobility paradigm. Public transport is widely recognised as a cornerstone of sustainable urban mobility because it reduces automobile dependency, traffic congestion, energy consumption and greenhouse gas emissions. Among different modes of public transport, BRT systems have emerged as an effective solution to address the challenges of automobile travel dependency. This is supported by ref. [28], who indicated that the BRT system is one of the major projects to achieve sustainable urban mobility objectives by seeking to realise a modal shift from car use to public transport use. Similarly, ref. [24] found that motorists’ decisions to use the Lagos BRT system were influenced by their desire to reduce transport externalities, including traffic congestion, fuel consumption, vehicle emissions, and associated health impacts. These findings demonstrate that BRT systems can contribute significantly to sustainable travel behaviour by encouraging commuters to shift from private vehicles to public transport.
However, the efficiency of the BRT system in promoting sustainable travel behaviour depends not only on service availability and accessibility but also on commuters’ perceptions of safety. Previous studies consistently identify perceived safety as one of the most influential determinants of travel mode choice. For instance, ref. [29] found that fear of crime, inadequate lighting, limited surveillance, and the absence of security personnel at stations and bus stops significantly reduce commuters’ perceptions of safety and discourage public transport use, particularly among women and other vulnerable users. Ref. [30] identified safety and security as key determinants of public transport service quality and demonstrated that improvements in perceived safety contribute to increased intentions to continue using public transport. Therefore, the relationship between perceived safety and travel mode choice is particularly important in BRT systems. Understanding commuters’ perceptions of safety provides an important basis for ex-plaining travel mode choice and developing interventions that encourage sustainable urban mobility.

2.4. Safety Performance of South African BRT Systems

South Africa has invested significantly in BRT systems as part of its strategy to improve urban mobility, reduce transport inequalities and promote sustainable public transport. Since the introduction of Rea Vaya in Johannesburg, several BRT systems, including MyCiTi (Cape Town), A Re Yeng (Tshwane), Go George (George) and Leeto La Polokwane, have been implemented to improve accessibility, service reliability and commuter mobility [31,32]. Existing studies on BRT systems in South Africa have primarily focused on the implementation, operational performance, service quality, accessibility, passenger satisfaction, and institutional challenges. While some studies acknowledge the importance of safety, it is generally explored as a component of service quality or commuter satisfaction or discussed in the context of operational challenges rather than being investigated as a multidimensional construct comprising commuter safety and crime prevention. For instance, ref. [31] reported that shortly after the introduction of the Rea Vaya, violent attacks on buses highlighted the security challenges associated with implementing formal public transport systems in environments characterised by competition with informal transport operators. These findings demonstrate that safety remains an important concern for the successful operation and long-term sustainability of BRT systems.
Beyond the BRT literature, several South African studies have explored safety in other public transport modes [14,19,33,34,35]. Ref. [14] investigated the interrelations of perceived security and safety with using public transportation for commute trips and non-commute trips in Johannesburg. The findings revealed that insecurity when using public transport, lack of police and guards in the public transit system, poor quality vehicles and infrastructure were the factors that significantly influence public transit ridership for commute trips. Similarly, ref. [19] identified that personal security on public transport is a major concern in South African cities. Ref. [34] investigated experiences of harassment between females’ and males’ commuters in Cape Town. The findings revealed that females experience harassment more often, and this influences their choices regarding care trips. These studies demonstrate that commuters’ perceptions of safety are shaped by both operational and environmental conditions and play an important role in travel behaviour.
Despite these contributions, limited empirical evidence exists on how different dimensions of safety influence sustainable travel mode choice and ridership within South African BRT systems, particularly in secondary cities. Most existing studies examine safety as part of service quality or commuter satisfaction, rather than distinguishing between commuter safety and crime prevention. This study addresses this gap by investigating safety performance as a multidimensional construct and investigating its influence on sustainable travel mode choice and ridership in the Leeto La Polokwane Phase 1A.

3. Materials and Methods

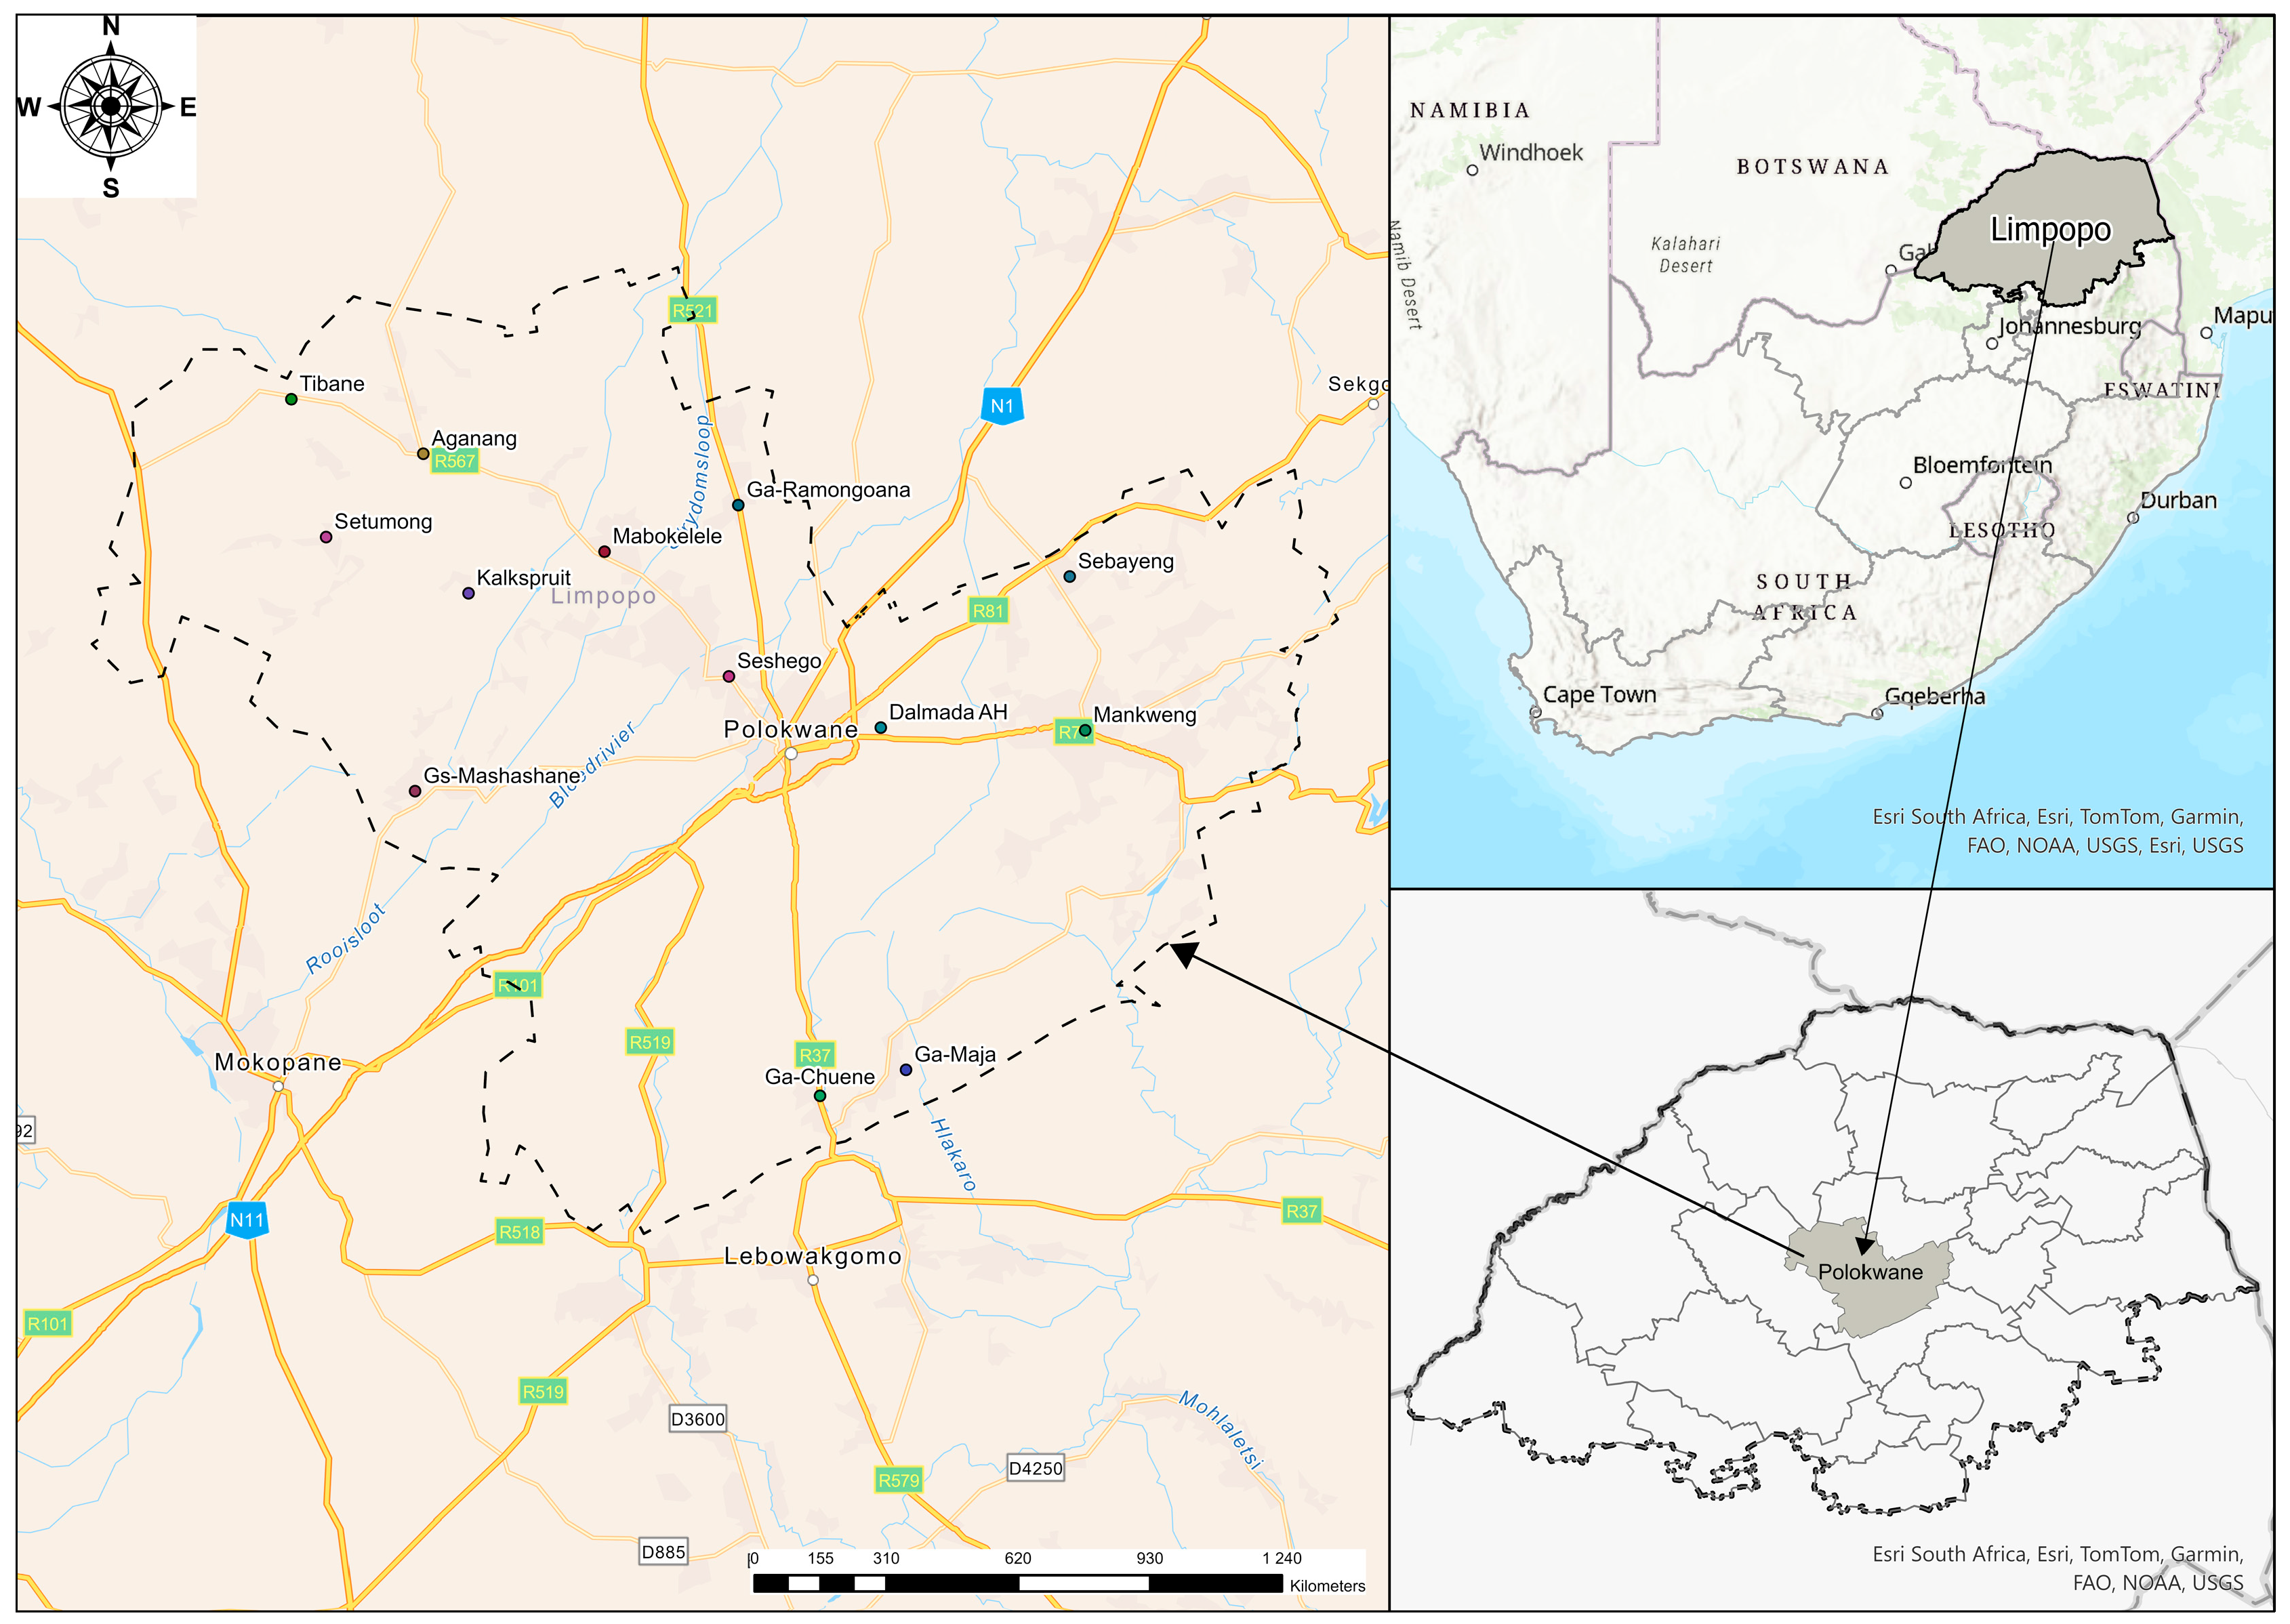
The study adopted a case study research design comprising a mixed-methods approach as its overarching methodological strategy. The City of Polokwane was selected as the case study area because Leeto La Polokwane BRT operates entirely within its jurisdiction. Figure 1 depicts the locality of the City of Polokwane.
As shown in Figure 1, the City of Polokwane is situated in the central region of the Limpopo Province, which is the northernmost province in South Africa that shares boundaries with the Gauteng, Northwest and Mpumalanga provinces. Polokwane boasts exceptional accessibility and connectivity to the wider area because it is positioned along the N1 National Road and at the convergence point of significant road networks. The N1 roads establish connections from Polokwane to Zimbabwe and the more extensive metropolitan regions of Tshwane and Johannesburg in Gauteng to the south. The R567 via N11 connects Polokwane to Botswana. Within the city, the study focused specifically on areas served by Leeto La Polokwane Phase 1A, which include Seshego, Nirvana, Madiba Park, Flora Park, and Polokwane Central.

3.1. Data Collection

3.1.1. Commuter Surveys

This study used a commuter survey (questionnaire) to capture subjective commuters’ perceptions of safety. The questionnaires were administered from 8 February 2024 to 29 August 2024. To investigate the commuters’ perceptions of public transport systems, questionnaires have been used by [36,37,38]. The selection of a questionnaire as a data collection tool for this study was further supported by [39], who highlighted that questionnaires are an effective means of gathering a wide range of data from large populations. During the survey, 375 questionnaires were distributed to in-transit commuters of Leeto La Polokwane. A total of 356 responses were retrieved, of which 344 (96.6%) were completed and recorded successfully. This sample size was sufficient, as recommended by previous studies that a good sample size to determine commuters’ perceptions of public transport systems should be above 300 for meaningful advanced statistical analysis [36,40,41,42]. Table 1 depicts the demographic distribution of the sampled commuters of Leeto La Polokwane Phase 1A.
The survey questionnaires were completed through face-to-face interviews conducted with commuters. Participants were sampled using convenience and snowball sampling approaches. It was initially planned that the study will sample commuters using a stratified random sampling approach. These commuters were grouped into four strata: Polokwane CBD, Flora Park, Nirvana, Seshego Zone 1 and Zone 2 and 3. However, it became evident that using stratified random sampling for this research was not feasible due to commuters’ travel patterns. Commuters typically plan their journeys in advance and arrive at bus stops only 3–5 min before the buses arrive, leaving insufficient time to complete the survey questionnaires, which required a minimum of 10 min. The researchers also attempted to recruit participants while they were on board the buses. However, many respondents would reach their destinations before finishing the questionnaires. Consequently, the only viable option for recruiting participants was to adopt convenience sampling and snowball sampling focus on the Polokwane CBD.
Questionnaires were distributed at Polokwane City Square, a public open space at 15 Thabo Mbeki Street in Polokwane CBD. The City Square was used because most commuters use it as a waiting area before boarding their buses during afternoon peak hours after leaving work. Streets such as Thabo Mbeki Street, Kerk Street, Landros Mare Street, General Joubert Street, Market Street, Bodenstein Street, Grobler Street and Schoeman Street within the Polokwane CBD were also used to recruit participants. Commuters referred researchers to various offices where there are commuters of Leeto La Polokwane such as the City of Polokwane Municipality (located at the corner of Landros Mare and Bodenstein Streets, Polokwane), the Department of Water (situated at 49 Genl Joubert Street, Polokwane Central), the Co-operative Governance, Human Settlements and Traditional Affairs (CoGHSTA) office (located at 20 Rabe Street, Polokwane Central), and the Seshego Library (located at 12 45th Avenue, Seshego-B, Polokwane).
All participants sampled were asked to present the Leeto Travel card to confirm if they are registered commuters of the system before questionnaires were administered. The survey questionnaire was designed to capture in-transit commuters’ perceptions of safety using closed-ended questions. The survey questionnaire was grouped into three sections. The first section elicited the demographic profile of commuters, such as gender, age, employment status, employment sector, and monthly income. The second section contains key dimensions related to respondents’ travel behaviour, such as car ownership, period of using the bus, frequency of using the bus, and trip purpose. The third section focused on commuters’ perceptions of safety variables, as depicted in the below Table 2.
As shown in Table 2, commuters’ perceptions of safety were measured with 10 variables. Commuters were asked to rate the variables on the 7-point Likert scale ranging from strongly disagree to strongly agree (where 1 = strongly disagree, 2 = disagree, 3 = somewhat disagree, 4 = neutral, 5 = somewhat agree, 6 = agree, and 7 = strongly agree). A 7-point scale was adopted because it provides greater sensitivity and discriminatory power than a commonly used 5-point scale, which allowed participants to express more nuanced perceptions towards the safety of Leeto La Polokwane. The use of a 7-point scale is supported by [43], who found that 7-point rating scales generally produce higher reliability, validity, and discriminatory power than scales with fewer response categories. Normality was checked using Kolmogorov–Smirnov and Shapiro–Wilk tests. The results indicated that all 10 safety variables significantly deviated from a normal distribution, p < 0.001 for both tests across all variables. Accordingly, the null hypothesis of normality was rejected for each item, which confirmed that the data was not normally distributed.
Cronbach’s alpha was used to test the reliability of the survey instrument. The initial 10 variables yielded a Cronbach’s α = 0.600, which indicated marginal internal consistency reliability. The results revealed that 3 variables (1. There is less likely to have an accident; 6. Commuters feel safe on the bus; and 8. Commuters’ luggage is safe) demonstrated negative corrected item-total correlations. This suggested that these variables were not measuring the same underlying construct as the remaining variables. Consequently, these variables were excluded from the reliability analysis to improve the internal consistency. The revised 7-variable scale yielded a Cronbach’s α = 0.793, which indicated acceptable internal consistency reliability. Therefore, the 7 retained variables were used in statistical analyses.

3.1.2. Field Observations

Field observations were used to collect empirical data on the actual safety conditions of the Leeto La Polokwane. The method used was participant observation because the researcher actively participated in the Leeto La Polokwane service activities while observing. The observations were done through walking to ticket-selling points and bus stops and by riding the Leeto buses. The observations were made and recorded relating to various indicators of safety: lighting at stops and along pedestrian access routes, security measures inside buses, presence of security personnel, availability of surveillance systems, and the overall physical environment. Both positive and negative observations were noted. In some cases, observations were done during off-peak and peak hours. A smartphone was used to capture photographs during field observations.

3.1.3. Actual Ridership Data

The actual ridership data were used to delineate the behavioural shifts toward sustainable travel modes. Ridership data from 21 October 2021 to 31 March 2024 was collected from the City of Polokwane. The data comprise daily commuter transaction records derived from the smart card Automated Fare Collection of Leeto La Polokwane. Each tap event corresponds to a validated boarding and includes anonymised transaction metadata (date, time, and bus route).

3.2. Methods of Data Analysis

3.2.1. Exploratory Factor Analysis

Exploratory factor analysis (EFA) using the principal component analysis (PCA) was used to reduce a large number of correlated variables into a smaller set of principal components to identify latent factors that determine commuters’ perceptions of the safety of Leeto La Polokwane. This technique mitigates issues like multicollinearity and simplifies analysis, allowing researchers to find the most significant factors influencing commuters’ perceptions of safety. In this study, PCA with Varimax rotation method was performed to categorise 7 observed variables into distinct factors influencing commuters’ perception of safety. The Kaiser–Mayer–Olkin (KMO) measure of sampling adequacy and Bartlett’s sphericity test were used to assess the sampling adequacy and the existence of patterned relationships in the data. The results from the goodness of fit for safety data were suitable for factor analysis, as shown by the substantial findings of Bartlett’s test of sphericity ( x 2 = 864,214, df = 21, p-value < 0.001) and the KMO measure of 0.724, which exceeds the minimum threshold for sampling adequacy, supporting the decision to proceed with factor analysis [14,24,28]. Therefore, factor analysis was both statistically feasible and theoretically relevant for this study.

3.2.2. Mean Score Value Calculation

The mean score values were used to analyse the commuters’ perceptions of Leeto La Polokwane Phase 1A. The mean score represented the average level of agreement of respondents with each safety variable. Data were collected using a 7-point Likert scale, where responses ranged from 1 = strongly disagree to 7 = strongly agree. The higher scores indicated strong commuters’ perceptions of safety. The two latent factors, namely commuter safety and crime prevention, identified through EFA, were used to calculate the mean scores. Composite mean scores were subsequently calculated for the items loading on each latent factor. The factor mean score represented the average level of agreement of respondents with the safety-related statements comprising that factor. The mean score for each factor was calculated by summing the total responses across the items constituting the factor and dividing by the number of respondents ( n = 344), using the following formula:
X - = i = 1 n X i n
where X - is the mean score of the variable, X i = individual respondent’s score on the Likert scale (ranging from 1 = strongly disagree to 7 = strongly agree), and n = total number of valid responses for that variable. The overall mean score for each factor was then calculated across all respondents. Mean scores were also calculated separately for the demographic categories of gender, age, and monthly income to examine differences in perceived safety across demographic groups. Therefore, they represented the average level of commuter agreement or perceptions with each latent safety factor. The results were interpreted using mean value thresholds depicted in Table 3.

3.2.3. Multinomial Logistic Regression

A multinomial logistic regression model was employed to statistically examine the relationship between safety perceptions and sustainable travel mode choice. The multinomial logistic regression model is a widely used tool for analysing factors that influence commuter decision factors in travel mode choice studies. For instance, ref. [44] used multinomial logistic regression model to investigate the factors influencing access mode choice and measure the accessibility of multimodal public transport systems in Indian cities, while ref. [45] used a multinomial logistic regression model to investigate factors that affect the travel mode choice of a college community at the University of Toledo, Ohio. Therefore, the model was considered appropriate for this study because the dependent variable, travel mode choice used to access Leeto La Polokwane bus stops, consists of three unordered travel mode categories.
In this study, the dependent variable was travel mode choice, which represented the mode used by commuters to access the Leeto bus stops. The dependent consisted of 3 unordered travel mode categories, names (1) walking, (2) minibus taxis, and (3) private vehicle. The independent variables comprised the latent safety factors derived from the EFA. The factor scores were included in the model as predictor variables because they represented the underlying dimensions of commuters’ safety perceptions. In addition, car ownership and period of bus use were incorporated as control variables to account for differences in travel behaviour that may influence mode choice independently of safety perceptions. The multinomial logistic regression was expressed as
l n ( P ( Y = j ) P ( Y = j ) ) = β 0 j + β 1 j X 1 + β 2 j X 2 + β 3 j X 3 + β 4 j X 4
where P ( Y = j ) is the probability of selecting travel mode j, P ( Y = 1 ) is the probability of selecting the reference travel mode, χ 1 represents factor 1 (commuter safety), χ 2 represents factor 2 (crime prevention), χ 3 represents car ownership, and χ 4 represents period of bus use. The parameter β 0 j represents the intercept, while β i j represents the regression coefficient of predictor i for travel mode j. The model significance was evaluated using the likelihood ratio chi-square test, whereas the contribution of individual predictors was assessed using the likelihood ratio test and Wald statistics. The model’s explanatory power was evaluated using Cox and Snell, Nagelkerke and McFadden pseudo R 2 statistics.

3.2.4. Multiple Linear Regression

A multiple linear regression model was used to determine whether monthly ridership was associated with operational and contextual factors. This model was critical to explore statistical assessment of whether operating days, taxi protests, school holidays, and temporal trends significantly influenced monthly ridership of the Leeto la Polokwane. The model was selected because it estimates the extent to which each independent variable contributes to explaining variation in the dependent variable while controlling for the effects of the other predictors. The study used monthly ridership (number of commuter trips) as the dependent variable, while the explanatory variables included the number of operating days, taxi protests, school or festive holiday periods, and time (month sequence). These variables were selected as they represent operational continuity, service disruptions, seasonal variation, and temporal trends that may influence public transport ridership. The multiple linear regression model was expressed using the formula
R i d e r s h i p i = β 0 + β 1 ( S e r v i c e D a y s i ) + β 2 ( P r o t e s t i ) + β 3 ( H o l i d a y i ) + β 4 ( T i m e i ) + ε i
where Ridership = monthly commuters’ trips, Service Days = operational days per month, Protest = 1 if protests/service disruptions occurred, Holiday = 1 during school/festive holidays, and Time = month number (captures general growth). Statistical significance was evaluated at the 5% significance level (p < 0.05). Prior to interpretation of the regression model, the assumptions of multiple linear regression were assessed. Multicollinearity among the explanatory variables was evaluated using the Variance Inflation Factor (VIF) and tolerance statistics, while autocorrelation of residuals was assessed using the Durbin-Watson statistic.

4. Results

4.1. Safety Conditions of Transport Infrastructure

The results on the safety conditions of Leeto buses revealed that buses are equipped with low-floor designs aligned with curbside pavements. These designs provide easy access for commuters with physical disabilities, using mobility aids, and those travelling with small children or strollers. In terms of onboard safety features, the buses are equipped with closed-circuit television (CCTV) systems to enhance commuter security. All operational buses have onboard officials who assist commuters during boarding and throughout the journey. These officials provide onboard support services, such as helping commuters load funds onto smart travel cards, attend to commuters with special needs, and enforce compliance with bus regulations.
The conditions of bus stops and waiting areas in the literature have been identified as a significant factor influencing both commuters’ mobility choices and their perceptions of public transport safety [46,47]. This is because visually appealing and well-managed waiting environments contribute to a sense of safety for commuters [48,49]. The results revealed the absence of critical facilities at the bus stops across all bus routes, such as sheltered waiting, surveillance systems, adequate lighting, and the presence of security personnel. The absence of these critical facilities exposes commuters to harsh weather conditions and increases the vulnerability of commuters to crime, particularly during morning and evening peak hours when commuters are more likely to be alone or disembarking at isolated stops. Some bus stops of the system have encroached into the roadway due to the absence of designated lay-bys. This encroachment disrupts the general flow of traffic, which contributes to unnecessary congestion and increases the likelihood of conflicts between vehicles and pedestrians. Overall, the current state of lay-bys does little to improve the provision of adequate public transport facilities. The lack of dedicated lay-by infrastructure not only compromises operational efficiency but also presents significant safety risks. The current situation calls for an urgent need for infrastructure upgrades to ensure the system meets both functional and safety standards for all commuters.

4.2. Latent Factor Influencing Commuters’ Perceptions of Safety

4.2.1. Exploratory Factor Analysis of Safety Perceptions

Kaiser’s criterion, which suggests that all factors with an eigenvalue greater than 1.0 should be retained for interpretation [50], was applied to extract principal factors. The cumulative percentage of variance explained by the extracted factors was also evaluated to ensure sufficient explanatory power. The results of PCA identified two factors with eigenvalues > 1.0 that explained a total variance of 63.14%. It is important to note that only variables with a value of 0.5 and above were considered highly loaded and were interpreted in this study. Five out of the seven variables included in the survey were highly loaded in the latent factor 1, with factor loadings exceeding the acceptable threshold of 0.5, while two out of seven variables were loaded with factor loadings exceeding the acceptable threshold of 0.5 in the latent factor 2. Therefore, all retained variables exceeded the recommended factor loading threshold of 0.5. The acceptable threshold confirmed the significance of loaded variables as contributors to the latent factors influencing commuters’ perceptions of safety. Table 4 depicts the results of the identified latent factor influencing commuters’ perceptions of the safety of Leeto La Polokwane.
As shown in Table 4, the principal component analysis extracted two latent factors that explain commuters’ perceptions of safety when using the Leeto La Polokwane BRT system. The first factor, commuter safety, emerged as the dominant dimension, accounting for 45.80% of the total variance explained. This factor comprises five variables with factor loadings ranging from 0.556 to 0.786, which reflect commuters’ perceptions of personal safety while accessing and waiting for public transport, the availability of crime prevention measures at bus stops, and confidence in drivers’ safe driving behaviour. The highest loading was recorded for the variable “Commuters feel safe when walking to bus stations/stops” (0.786), followed closely by “Commuters feel safe when walking to buy tickets at selling points” (0.785). These results indicate that perceptions of personal security during access to the public transport system are the strongest contributors to this latent construct.
The second factor, crime prevention, explained an additional 17.33% of the total variance and consisted of two variables with factor loadings of 0.832 and 0.695. These variables relate to the adequacy of safety and security measures during ticket transactions with staff and the availability of crime prevention measures inside buses. The relatively high loading of the transaction safety variable (0.832) suggests that commuters place considerable importance on security during interactions with transport personnel. Collectively, the two extracted factors explain 63.14% of the total variance, which indicates that they provide a satisfactory representation of the underlying dimensions influencing commuters’ perceptions of safety.

4.2.2. Perceptions of Commuter Safety and Crime Prevention

The mean scores were calculated for the two latent safety factors identified through exploratory factor analysis, namely commuter safety and crime prevention, to assess commuters’ perceptions of safety on the Leeto La Polokwane Phase 1A. Overall, commuters recorded a mean score of 4.03 for commuter safety, which indicated a neutral perception of safety. In contrast, crime prevention recorded a mean score of 3.90, which indicated a negative perception of the adequacy of crime prevention measures. These results suggest that while commuters were generally neutral regarding their overall safety travel, they expressed less favourable perceptions of the adequacy of crime prevention measures within the system. Table 5 summarises the mean scores across the demographic groups.
Table 5 presents the mean safety perception scores across gender, age, and monthly income groups. Female commuters recorded a neutral perception of commuter safety (mean = 4.20), whereas male commuters reported a negative perception (mean = 3.94). Across age groups, commuters aged 18–30 years and 51–60 years expressed neutral perceptions of commuter safety, while those aged 31–40 years and 41–50 years reported negative perceptions. Regarding crime prevention, most demographic groups expressed negative perceptions, with only commuters aged 51–60 years and those earning between R1 501 and R33 000 per month reporting neutral perceptions. Overall, these findings indicate that perceptions of crime prevention were less favourable than perceptions of commuter safety across most demographic groups.

4.2.3. Relationship Between Safety Perceptions and Sustainable Travel Mode Choice

The results revealed that the multinomial logistic regression model was a statistically significant fit to the model of whether commuters’ perceptions of safety influence sustainable travel mode choice. The likelihood ratio χ 2 = 74.023, df = 12, p < 0.001 indicated that the explanatory variables jointly improved the prediction of travel mode choice compared with the intercept-only model. The model explained between 18.9% and 28.5% of the variation in travel mode choice, as indicated by the McFadden ( R 2 = 0.189, Cox and Snell ( R 2 = 0.194), and Nagelkerke ( R 2 = 0.285) pseudo- R 2 statistics. The likelihood ratio test revealed that both latent safety factors significantly contributed to explaining travel mode choice, as depicted in Table 6.
The results depicted in Table 6 revealed that commuter safety significantly improved model fit, while crime prevention demonstrated an even stronger contribution. These findings demonstrate that commuters’ perceptions of safety, particularly those related to personal security and crime prevention, are significant determinants of travel mode choice. Among the control variables, car ownership significantly influenced travel mode choice, while period of bus use also had a significant effect. These results suggest that travel mode decisions are shaped not only by commuters’ safety perceptions but also by their level of access to private vehicles and their familiarity with the Leeto La Polokwane services. The parameter estimates provide further insights into the direction of these relationships, as depicted in Table 7.
The results presented in Table 7 demonstrate that for the comparison between minibus taxi and walking, crime prevention exhibited a statistically significant negative coefficient (β = −0.717, Wald = 9.794, p = 0.002; OR = 0.488), which indicated that higher perceptions of crime prevention were associated with a lower likelihood of choosing minibus taxi relative to the travel mode. In contrast, commuter safety was not statistically significant (p = 0.066). Car ownership also significantly reduced the likelihood of choosing minibus taxi (β = −2.340, p < 0.001; OR = 0.096), while shorter periods of bus use were associated with greater odds of selecting minibus taxi compared with long-term users. The results revealed that for the comparison between private vehicle and walking, commuter safety was statistically significant (β = −0.860, Wald = 6.099, p = 0.014; OR = 0.423), whereas crime presentation was not statistically significant in the comparison, except for commuters who had used the bus between 9 and 11 months, who exhibited significantly higher odds of selecting private vehicle than the reference category (OR = 17.685, p = 0.026). Therefore, the multinominal logistic regression demonstrates that commuters’ safety perceptions are statistically associated with travel mode choice. The results further indicate that different attributes of safety affect different travel mode decisions in the City of Polokwane. Crime prevention has a stronger influence on one mode comparison, while general commuter safety is more influential in another.

4.3. Monthly Ridership Trends

4.3.1. Descriptive Analysis of Monthly Ridership Trends

The results of commuters’ ridership trends of Phase 1A ridership data show an upward trend in ridership since its full launch in October 2021. The system recorded 7912 commuters in 2021, 530,992 in 2022, 921,652 in 2023, and 251,602 in the first four months of 2024 alone. The increase in commuter ridership reflects a strong acceptance of the system by the residents of Polokwane. Studies in the literature revealed a similar commuting pattern of increased ridership during the first few years of services and later perceived decline in the ridership [19,27,33,34,35]. For example, Lagos BRT showed a significant increase in ridership since it was launched in 2008, with daily commuters increasing from 180,000 in 2013 to 260,000 in 2015; in the last few years, the BRT suffered from underuse, with a rise in safety concerns and inefficiency [36]. Therefore, to sustain ridership, the City of Polokwane must ensure that the system maintains high safety standards to retain frequent riders, encourage infrequent users, and attract non-users. Table 8 depicts a monthly breakdown of service days and numbers of commuter trips from October 2021 to April 2024.
From the results depicted in Table 8, there were noted ridership patterns; from October 2021 to January 2022 (over 88 days of service), the system served 13,534 commuters’ trips. However, after six months (172 days of service), the number of trips had increased to 44,256, which indicated an additional 30,722 trips in three months (between January and April 2022). This increase suggested that the service gained traction over time, partly because the service was launched when many residents were preparing for the festive season holidays in October and November and had limited opportunities to familiarise themselves with the service. Furthermore, mobility and economic activities in Polokwane during December and January are limited because residents are primarily on holiday, which may have impacted ridership.
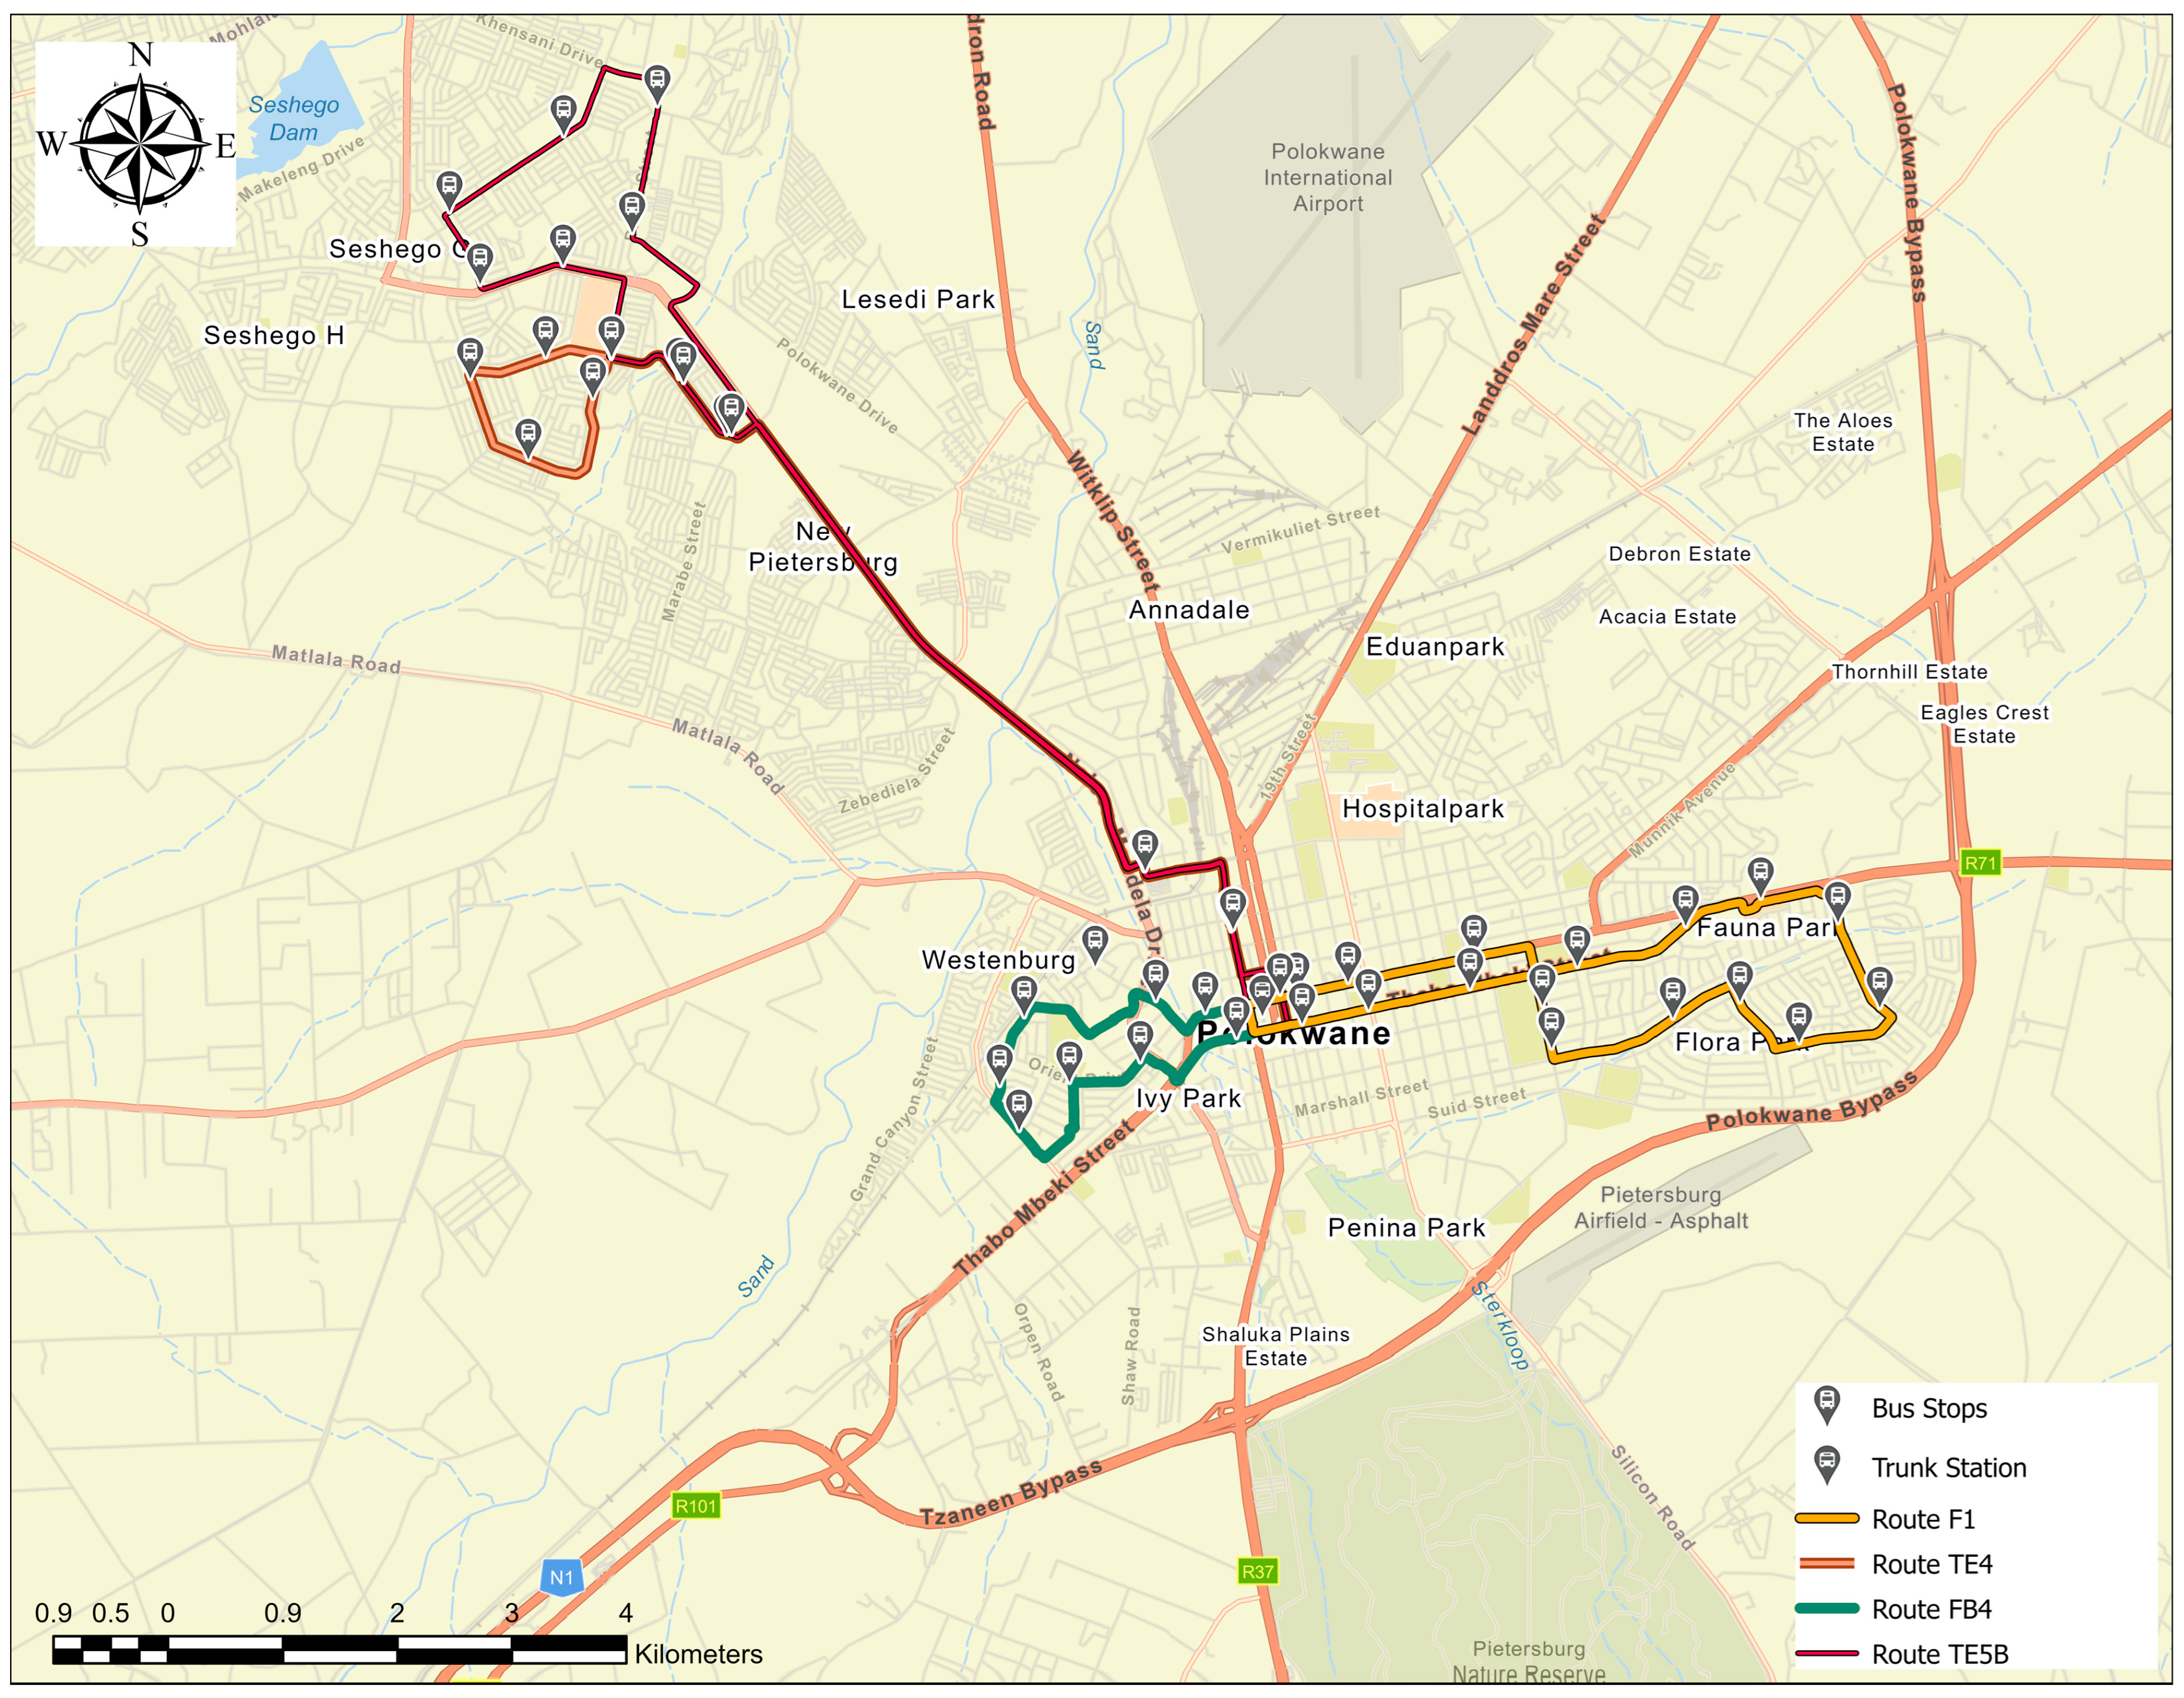
Figure 2 depicts the spatial distribution of the operational routes of Leeto La Polokwane Phase 1A. Table 9 presents the monthly commuter ridership trends by route for 2021 and 2022, while Table 10 presents the monthly commuter ridership trends by route for 2023. Table 11 presents the corresponding monthly commuter ridership trends by route for 2024. Together, these figures provide a longitudinal representation of route-level ridership patterns and highlight changes in commuter utilisation across the operational period.
The ridership trends of Leeto La Polokwane Phase 1A from its launch in late 2021 through 2024 reveal a trajectory of gradual stabilisation, seasonal fluctuation, and persistent vulnerability to external disruptions. The service launched in October 2021, a period coinciding with the festive season, which curtailed opportunities for potential commuters to familiarise themselves with the new system and resulted in notably low ridership across all routes. Throughout the first half of 2022, average daily ridership remained below 243 commuters per day, which suggests that users were still acclimatising to the service and integrating its timetable into their daily routines. A marked inflexion point occurred in July 2022, when daily average ridership surged significantly, most notably on routes F1 (from 212 to 709), TE4 (from 243 to 635), and TE5B (from 104 to 330). This indicated a period of stabilisation and growing public acceptance. However, this upward momentum was temporarily interrupted by a taxi operator protest on 26 July 2022, which precipitated a decline in monthly ridership on routes F1 and F4B due to safety concerns, though routes TE4 and TE5B continued their upward trajectory. Following this disruption, ridership rebounded and continued to grow across all routes.
By 2023, annual ridership had improved notably over the previous year, yet clear seasonal patterns emerged. Ridership consistently declines during school holiday periods, particularly in March and from June to July. Routes F1, TE4, and TE5B exhibited greater sensitivity to these breaks than route F4B, which primarily served working commuters. Notably, route F1 demonstrated the most consistent year-on-year growth, which suggests that residents from upmarket suburbs such as Flora Park, Fauna Park, and Bendor Par, who traditionally prefer private automobile use, were gradually building trust in and satisfaction with the bus service. Conversely, route F4B maintained comparatively low ridership levels, largely attributable to sustained resistance and safety threats from local taxi associations operating along its corridor. The positive trajectory continued into 2024, with January ridership exceeding that of the previous year, signalling well-established commuting habits. Nonetheless, route-specific vulnerabilities persisted; while F1, TE5B, and F4B recorded ridership gains in February 2024, route TE4 experienced a decline due to ongoing safety threats from taxi drivers. Furthermore, the anticipated seasonal dip in March 2024 was exacerbated by a taxi association protest on 18 March 2024, which forced commuters to seek alternative transport. Overall, routes TE5B, TE4, and F4B remain more vulnerable to service disruptions than route F1, as they operate along road corridors where Leeto La Polokwane directly competes with informal paratransit operators who actively resist formalised public transport interventions.

4.3.2. Factors Influencing Monthly Ridership

Multiple linear regression was conducted to explore whether operational and contextual factors explained monthly ridership trends. The regression model was statistically significant (F = 5.988, p = 0.002), explaining 48.9% of the variation in monthly ridership ( R 2 = 0.489; adjusted R 2 = 0.408). The number of operating days was positively associated with monthly ridership (β = 0.307, p = 0.044), while the month sequence (time) was the strongest positive predictor of ridership (β = 0.670, p < 0.001), indicating a continued increase in ridership over the study period. Although taxi protests (β = −0.036, p = 0.804) and school holiday periods (β = −0.199, p = 0.181) were negatively associated with ridership, these relationships were not statistically significant.
These results indicated that operational continuity, measured by the number of operating days and temporal growth of the Leeto La Polokwane, were the primary factors associated with monthly ridership. In contrast, taxi protest/service disruptions and school holiday periods showed negative associations with ridership. However, the analysis did not find the statistically significant evidence that taxi protest/service disruptions or school holiday periods influenced monthly ridership. These results complement the multinomial logistic regression analysis by demonstrating that, although operational continuity is important for maintaining ridership, commuters’ travel mode choice is more strongly explained by perceived safety factors, including safety while walking to and waiting at bus stops, the availability of crime prevention measures, and driver behaviour.

5. Discussion and Policy Implications

The identification of two distinct latent factors, commuter safety (45.80% variance explained) and crime prevention (17.33%) in the study, provides compelling evidence that safety perceptions are multidimensional. Commuters during the travel journey differentiate between personal safety and institutional measures to prevent crime. The highest factor loadings for commuter safety were associated with walking to bus stops (0.786) and walking to buy tickets (0.785), which indicated that the access phase of the journey generates the strongest safety concerns. These findings align with [2], who found that perceptions of personal security while walking to and from public transport stops significantly influence willingness to use public transport. The factor loadings for crime prevention were associated with safety during staff transactions and adequate prevention measures for crime in vehicles. This study suggests commuters are particularly attuned to institutional security protocols, which align with [10], who demonstrated that commuters’ perceptions of safety in railway stations were significantly influenced by the visibility and professionalism of security personnel, as well as the transparency of security procedures. Field observations revealed critical infrastructure deficiencies, such as the absence of sheltered waiting areas, inadequate lighting and CCTV, lack of security personnel, and bus stop encroachment into roadways, that directly undermine both safety dimensions. Demographic analysis showed lower-income commuters (R0–R1,500) reported the most negative perceptions (commuter safety 3.84; crime prevention 3.41), which make them particularly vulnerable as captive users, while both genders reported negative crime prevention perceptions (3.89–3.91). These results suggest that institutional security improvements would benefit all users.
The multinomial logistic regression confirmed that safety perceptions significantly influence sustainable travel mode choice, explaining 18.9–28.5% of variation, with both commuter safety ( χ 2 = 6.700, p = 0.035) and crime prevention ( χ 2 = 12.424, p = 0.002) significantly improving model fit. In the minibus taxi versus walking comparison, crime prevention was significant (β = −0.717, p = 0.002; OR = 0.488). These findings indicate that higher crime prevention perceptions reduce the likelihood of choosing minibus taxis, which suggest effective security measures encourage walking access to the system. This aligns with findings by reference [2], who demonstrated that safety perceptions influence how commuters access the system. In the private vehicle versus walking comparison, commuter safety was significant (β = −0.860, p = 0.014; OR = 0.423), which means higher perceptions of walking and waiting safety reduce the likelihood of choosing private vehicles, aligning with [16] on safety as a barrier to public transport use. Importantly, different safety dimensions influenced different modal comparisons: crime prevention was more influential in shifting commuters from minibus taxis, while commuter safety was more influential in shifting from private vehicles. The period of bus use also emerged as significant, with commuters using the bus for less than 3 months (OR = 6.711) and 4–8 months (OR = 6.732) being significantly more likely to choose minibus taxis over walking, suggesting a learning effect where familiarity with the system gradually shifts commuters toward more sustainable walking access.
Ridership grew substantially from 7912 commuters (2021) to 530,992 (2022) and 921,652 (2023), with multiple linear regression confirming operational continuity (β = 0.307, p = 0.044) and system maturation (β = 0.670, p < 0.001) as the strongest positive predictors, together explaining 48.9% of variation. This demonstrates the importance of service reliability, which is consistent with the work by [31] on Rea Vaya in Johannesburg, and suggests commuters gradually incorporate services into daily routines as familiarity grows. However, the socioeconomic profile (73.0% non-car owners and 32.0% earning R0–R1500) indicates that ridership is largely driven by captive users with limited alternatives. Although the consistent growth on route F1 (which serves upmarket suburbs) suggests that the system is increasingly attracting choice users. Route-specific vulnerabilities emerged: route F1 demonstrated the most resilience, while route F4B suffered low ridership due to sustained taxi resistance, and routes TE4 and TE5B remained more vulnerable to disruptions due to direct competition with informal operators. While taxi protests and school holidays showed negative associations with ridership in descriptive analysis, these were not statistically significant in the regression. This possibly reflects data aggregation effects or that operational continuity and maturation are the dominant medium-term drivers.
The policy implications emphasise that improving public transport safety requires a holistic approach integrating safe pedestrian infrastructure (lighting, sidewalks, crossings), secure waiting environments (sheltered areas, CCTV, real-time information), effective crime prevention (visible security personnel, staff training, incident reporting), and operational safety (driver training, vehicle maintenance). Institutional coordination is essential, including formal-informal integration through fare integration, route coordination, and regular dialogue between the City of Polokwane, taxi associations, and bus operators, alongside multi-stakeholder safety committees and systematic monitoring and evaluation. Investment priorities should be phased: short-term (0–2 years) focus on lighting, CCTV, security personnel, and driver training; medium-term (2–5 years) on sheltered waiting areas, integrated ticketing, and real-time information; and long-term (5–10 years) on pedestrian infrastructure upgrades, institutional reforms, and network expansion. For other South African secondary cities, these findings demonstrate that safety must be central in BRT planning, infrastructure deficiencies require systematic attention, institutional challenges with informal operators necessitate governance reforms, and phased implementation with operational continuity can drive ridership growth. Future research should employ longitudinal designs to track perception changes over time, comparative studies across secondary cities, qualitative research on lived safety experiences, and economic analysis of safety intervention cost–benefit to strengthen the evidence base for sustainable urban mobility policy.


6. Conclusions

The study provided empirical evidence on the relationship between safety performance, sustainable travel mode choice, and ridership in the Leeto La Polokwane Phase 1A. The study demonstrated that safety is a critical determinant of sustainable public transport use and extends beyond the onboard environment to include the entire commuter journey. The identification of commuter safety and crime prevention as the latent factors highlighted the importance of first- and last-mile conditions in shaping overall safety perceptions. The study further indicated that current ridership is largely sustained by commuters with limited transport alternatives. While this has supported system uptake in the short term, it highlights the importance of maintaining safe, reliable, and attractive public transport services to ensure long-term sustainability. Therefore, the study recommends that improving public transport safety requires a holistic approach that integrates safe pedestrian infrastructure, effective crime prevention measures, reliable operations, and institutional collaboration.

Author Contributions

Conceptualization, B.R.; methodology, B.R.; software, B.R.; validation, B.R.; formal analysis, B.R.; investigation, B.R.; resources, B.R.; data curation, B.R.; writing—original draft preparation, B.R.; writing—review and editing, E.I., J.C., and T.G.; visualization, B.R.; supervision, E.I., J.C., and T.G.; project administration, B.R.; funding acquisition, B.R. All authors have read and agreed to the published version of the manuscript.

Funding

This research was funded by the National Research Foundation (NRF), DSI-NRF Research Developments Grant for New Generation of Academics Programme Scholars (Reference: NGAP2204052105) (Grant No: 149138). The manuscript publication charges were funded by the University of Venda Research Office and the University of Johannesburg.

Institutional Review Board Statement

The study was conducted in accordance with the Declaration of University of Venda, and the protocol was approved by the Faculty of Science, Engineering and Agriculture (FSEA) Research Ethics Committee of FSEA/22/URP/15/1707 on 19 November 2022.

Informed Consent Statement

Informed consent for participation was obtained from all subjects involved in the study.

Data Availability Statement

The data supporting reported results will be made available on request.

Conflicts of Interest

The authors declare no conflicts of interest.

References

  1. Tilleman, K.J.; Chowdhury, S.; Henning, T.F. LGBTQI+ personal safety and security in public transport: A systematic literature review and practice-ready takeaways. Transp. Rev. 2025, 45, 605–641. [Google Scholar] [CrossRef] [Scilit]
  2. Delbosc, A.; Currie, G. Modelling the causes and impacts of personal safety perceptions on public transport ridership. Transp. Policy 2012, 24, 302–309. [Google Scholar] [CrossRef] [Scilit]
  3. Agrawal, A.; Pilla, F.; Mölter, A. Commuters’ perception of safety in public transport: A review of approaches, gaps and emerging research opportunities. Transp. Rev. 2025, 45, 1048–1084. [Google Scholar] [CrossRef] [Scilit]
  4. Ceccato, V.; Langefors, L.; Näsman, P. The impact of fear on young people’s mobility. Eur. J. Criminol. 2023, 20, 486–506. [Google Scholar] [CrossRef] [Scilit]
  5. Stjernborg, V. Triggers for feelings of insecurity and perceptions of safety in relation to public transport; the experiences of young and active travellers. Appl. Mobil. 2025, 10, 269–289. [Google Scholar] [CrossRef] [Scilit]
  6. Crime Concern. People’s Perceptions of Personal Security and Their Concerns About Crime on Public Transport: Literature Review; The Department: London, UK, 2002. [Google Scholar]
  7. Solymosi, R.; Cella, K.; Newton, A. Did they report it to stop it? A realist evaluation of the effect of an advertising campaign on victims’ willingness to report unwanted sexual behaviour. Secur. J. 2018, 31, 570–590. [Google Scholar] [CrossRef] [Scilit]
  8. Power, N.; McManus, M.A.; Lynch, R.; Bonworth, J. Fear of crime on the rail networks: Perceptions of the UK public and British Transport Police. Crime Prev. Community Saf. 2016, 18, 91–104. [Google Scholar] [CrossRef] [Scilit]
  9. Kim, H. Service design for public transportation to address the issue of females’ fear of crime. Transportation 2021, 48, 167–192. [Google Scholar] [CrossRef] [Scilit]
  10. Coppola, P.; Silvestri, F. Assessing travelers’ safety and security perception in railway stations. Case Stud. Transp. Policy 2020, 8, 1127–1136. [Google Scholar] [CrossRef] [Scilit]
  11. Ceccato, V.; Langefors, L.; Näsman, P. Young people’s victimization and safety perceptions along the trip. Nord. J. Criminol. 2021, 22, 106–125. [Google Scholar] [CrossRef] [Scilit]
  12. Chowdhury, S.; Van Wee, B. Examining women’s perception of safety during waiting times at public transport terminals. Transp. Policy 2020, 94, 102–108. [Google Scholar] [CrossRef] [Scilit]
  13. Fan, Y.; Guthrie, A.; Levinson, D. Waiting time perceptions at transit stops and stations: Effects of basic amenities, gender, and security. Transp. Res. Part A Policy Pract. 2016, 88, 251–264. [Google Scholar] [CrossRef] [Scilit]
  14. Pisa, N.; Masoumi, H.E.; Mapamba, L.S.; Chakamera, C. Associations of Public Transport Ridership with Subjective Safety and Security in Johannesburg, South Africa. Transp. Res. Procedia 2025, 82, 1023–1038. [Google Scholar] [CrossRef] [Scilit]
  15. Govender, K.K. Public transport service quality in South Africa: A case study of bus and mini bus services in Johannesburg. Afr. J. Bus. Manag. 2014, 8, 317. [Google Scholar]
  16. Behrens, R.; Jobanputra, R. The impact of traffic safety and crime on travel behaviour and attitudes in Cape Town: A review of empirical evidence. In Safety, Sustainability and Future Urban Transport; Eicher Goodearth: New Delhi, India, 2013. [Google Scholar]
  17. Biko, N.; Grosse-Weischede, F.; Vanderschuren, M. Addressing gender-specific experiences of personal security while travelling: The case of Cape Town2025. In Proceedings of the Southern African Transport Conference (SATC), Pretoria, South Africa, 7–10 July 2025. [Google Scholar]
  18. Risimati, B.; Gumbo, T.; Chakwizira, J. (Eds.) Innovative Initiatives Usage to Improve Efficiency in the City of Johannesburg Public Transportation. CITIES 2050–Creating Habitats for the 3rd Millennium: Smart–Sustainable–Climate Neutral. In Proceedings of REAL CORP 2021, 26th International Conference on Urban Development, Regional Planning and Information Society; CORP–Competence Center of Urban and Regional Planning: Vienna, Austria, 2021. [Google Scholar]
  19. Ryseck, B.; Behrens, R. Opportunities and Challenges for Addressing Personal Security on Public Transport Through ICTs in South African Cities. Transp. Mobil. Futur. Urban Afr. 2022, 323–347. [Google Scholar] [CrossRef] [Scilit]
  20. Adesanya, A.A.; Tayo, Y.A.; Das, B. Commuters’ security and safety perception of the bus rapid transit system: An experience of an emerging mega city in sub-Saharan Africa. Afr. Transp. Stud. 2026, 4, 100086. [Google Scholar] [CrossRef] [Scilit]
  21. Coppola, P.; Silvestri, F. Gender inequality in safety and security perceptions in railway stations. Sustainability 2021, 13, 4007. [Google Scholar] [CrossRef] [Scilit]
  22. Ceccato, V.; Cats, O.; Wang, Q. The geography of pickpocketing at bus stops: An analysis of grid cells. In Safety and Security in Transit Environments: An Interdisciplinary Approach; Springer: Cham, Switzerland, 2015; pp. 76–98. [Google Scholar]
  23. Smith, M.J. Addressing the security needs of women passengers on public transport. Secur. J. 2008, 21, 117–133. [Google Scholar] [CrossRef] [Scilit]
  24. Aminu, S.A.; Pearse, O.E. Transportation Externalities Reduction and Ridership of Bus Rapid Transit (BRT) In Lagos Metropolis. J. Sustain. Dev. Afr. 2018, 20, 212–231. [Google Scholar]
  25. Canitez, F.; Alpkokin, P.; Kiremitci, S.T. Sustainable urban mobility in Istanbul: Challenges and prospects. Case Stud. Transp. Policy 2020, 8, 1148–1157. [Google Scholar] [CrossRef] [Scilit]
  26. Grande-Ayala, C.E. An assessment of accessibility from a socially sustainable urban mobility approach in mass transit projects: Contributions from the northern central american triangle. Sustainability 2024, 16, 3766. [Google Scholar] [CrossRef] [Scilit]
  27. Banister, D. The sustainable mobility paradigm. Transp. Policy 2008, 15, 73–80. [Google Scholar] [CrossRef] [Scilit]
  28. Siedler, C.E. Can bus rapid transit be a sustainable means of public transport in fast growing cities? Empirical evidence in the case of Oslo. Transp. Res. Procedia 2014, 1, 109–120. [Google Scholar] [CrossRef] [Scilit]
  29. Ceccato, V.; Loukaitou-Sideris, A. Transit Crime and Sexual Violence in Cities: International Evidence and Prevention; Routledge: London, UK, 2020. [Google Scholar]
  30. Eboli, L.; Mazzulla, G. Service quality attributes affecting customer satisfaction for bus transit. J. Public Transp. 2007, 10, 2. [Google Scholar] [CrossRef] [Scilit]
  31. Venter, C. Are we giving BRT passengers what they want? User preference and market segmentation in Johannesburg. In Proceedings of the Southern African Transport Conference, Pretoria, South Africa, 4–7 July 2016. [Google Scholar]
  32. Tsotetsi, M.K.; Letlhogile, N.R.; Sithole, T.; Thaba, S. Rea Vaya BRT system progress and service delivery to commuters since implementation. In Proceedings of the International Conference on Industrial Engineering and Operations Management, Washington, DC, USA, 27–29 September 2018. [Google Scholar]
  33. Kruger, T.; Landman, K. Crime and public transport: Designing a safer journey. In Proceedings of the 26th Southern African Transport Conference (SATC 2007), Pretoria, South Africa, 9–12 July 2007. [Google Scholar]
  34. Vanderschuren, M.J.; Phayane, S.R.; Gwynne-Evans, A.J. Perceptions of gender, mobility, and personal safety: South Africa moving forward. Transp. Res. Rec. 2019, 2673, 616–627. [Google Scholar] [CrossRef] [Scilit]
  35. Renee, P. A Study of Safety and Security of Pedestrians Travelling Towards the Bellville, Claremont and Mitchells Plain Public Transport Interchanges in the Cape Town Municipal Area. Master’s Thesis, Stellenbosch University, Stellenbosch, South Africa, 2020. [Google Scholar]
  36. Watthanaklang, D.; Jomnonkwao, S.; Champahom, T.; Wisutwattanasak, P. Exploring accessibility and service quality perceptions on local public transportation in Thailand. Case Stud. Transp. Policy 2024, 15, 101144. [Google Scholar] [CrossRef] [Scilit]
  37. Atombo, C.; Wemegah, T.D. Indicators for commuter’s satisfaction and usage of high occupancy public bus transport service in Ghana. Transp. Res. Interdiscip. Perspect. 2021, 11, 100458. [Google Scholar] [CrossRef] [Scilit]
  38. Girma, M.; Woldetensae, B.; Nuriye, G.; Lika, T. Importance performance analysis for evaluating city bus service quality in Addis Ababa, Ethiopia. Urban Plan. Transp. Res. 2022, 10, 451–465. [Google Scholar] [CrossRef] [Scilit]
  39. Roopa, S.; Rani, M.S. Questionnaire designing for a survey. J. Indian Orthod. Soc. 2012, 46, 273–277. [Google Scholar] [CrossRef] [Scilit]
  40. Golob, T.F. Structural equation modeling for travel behavior research. Transp. Res. Part B Methodol. 2003, 37, 1–25. [Google Scholar] [CrossRef] [Scilit]
  41. Wu, X.; Cao, X.J.; Ding, C. Exploring rider satisfaction with arterial BRT: An application of impact asymmetry analysis. Travel Behav. Soc. 2020, 19, 82–89. [Google Scholar] [CrossRef] [Scilit]
  42. Lin, Z.; Vlachos, I. An advanced analytical framework for improving customer satisfaction: A case of air passengers. Transp. Res. Part E Logist. Transp. Rev. 2018, 114, 185–195. [Google Scholar] [CrossRef] [Scilit]
  43. Preston, C.C.; Colman, A.M. Optimal number of response categories in rating scales: Reliability, validity, discriminating power, and respondent preferences. Acta Psychol. 2000, 104, 1–15. [Google Scholar] [CrossRef] [Scilit] [PubMed]
  44. Tanwar, R.; Agarwal, P.K. Measuring accessibility for multimodal public transport system using multinomial logit model. KSCE J. Civ. Eng. 2025, 29, 100193. [Google Scholar] [CrossRef] [Scilit]
  45. Akter, T.; Alam, B.M. Travel mode choice behavior analysis using multinomial logit models towards creating sustainable college campus: A case study of the University of Toledo, Ohio. Front. Future Transp. 2024, 5, 1389614. [Google Scholar] [CrossRef] [Scilit]
  46. Cartenì, A.; Henke, I.; Picone, M. The value of waiting spaces: Tourists’ willingness to pay for high-quality bus terminals. Transp. Res. Interdiscip. Perspect. 2024, 26, 101129. [Google Scholar] [CrossRef] [Scilit]
  47. Yendra, D.; Haworth, N.; Watson-Brown, N. A comparison of factors influencing the safety of pedestrians accessing bus stops in countries of differing income levels. Accid. Anal. Prev. 2024, 207, 107725. [Google Scholar] [CrossRef] [Scilit] [PubMed]
  48. Zandiatashbar, A.; Laurito, A. An empirical analysis of the link between built environment and safety in Chicago’s transit station areas. J. Am. Plan. Assoc. 2023, 89, 225–239. [Google Scholar] [CrossRef] [Scilit]
  49. Abenoza, R.F.; Ceccato, V.; Susilo, Y.O.; Cats, O. Individual, travel, and bus stop characteristics influencing travelers’ safety perceptions. Transp. Res. Rec. 2018, 2672, 19–28. [Google Scholar] [CrossRef] [Scilit]
  50. Hair, J.F. Multivariate Data Analysis; Pearson: Upper Saddle River, NJ, USA, 2009. [Google Scholar]
Figure 1. The locality of the City of Polokwane.
Sustainability 18 08780 g001
Figure 2. Spatial distribution of the operational routes of Leeto La Polokwane Phase 1A.
Sustainability 18 08780 g002
Table 1. Summary of d demographic distribution of the sampled commuters.
DemographicsVariablesFrequency%
GenderMale21361.9%
Female12937.5%
Other20.6%
Age category 18–3018052.3%
31–409126.5%
41–506418.6%
51–6092.6%
Car Ownership Status Car Owners 9327.0%
Non-Car Owners25173.0%
Monthly Income0–R150011032.0%
R1501–R700013739.8%
R7001–R16,0005616.3%
R16,001–R33,0004011.6%
More than R33,00010.3%
Table 2. Commuters’ perceptions of safety variables used for survey questionnaire.
  • There is less likely to have an accident.
  • The driver drives smoothly, does not rush or brake suddenly.
  • The safety and security measures are appropriate during transactions with staff.
  • Adequate prevention measures for crime are available at bus stops.
  • Adequate prevention measures for crime are available in vehicles.
  • Commuters feel safe on the bus.
  • Commuters feel safe when walking to bus stations/stops.
  • Commuters’ luggage is safe.
  • Commuters feel safe around the bus station/stops when waiting for the bus.
  • Commuters feel safe when walking buying tickets at selling points
Table 3. Commuters’ perceptions mean value thresholds interpretation.
Scale ValueMean RangePerception Category
1–21.00–2.99Strongly Negative
33.00–3.99Negative
44.00–4.99Neutral
55.00–5.99Positive
6–76.00–7.00Strongly Positive
Table 4. Latent factors influencing commuters’ perceptions of safety.
Factor VariablesFactor Loadings
Commuter SafetyCommuters feel safe when walking to bus stations/stops.0.786
Commuters feel safe when walking buying tickets at selling points 0.785
Commuters feel safe around the bus station/stops when waiting for the bus0.752
Adequate prevention measures for crime are available at bus stops0.713
The driver drives smoothly, does not rush or brake suddenly.0.556
Crime PreventionThe safety and security measures are appropriate during transactions with staff.0.832
Adequate prevention measures for crime are available in vehicles.0.695
Table 5. Mean safety perception scores across demographic groups.
Demographic Characteristics CategoryCommuter Safety
(Mean)
InterpretationCrime Prevention (Mean)Interpretation
GenderMale3.94Negative 3.89Negative
Female4.20Neutral3.91Negative
Other3.30Negative 2.75Strongly Negative
Age (years)18–304.14Neutral3.98Negative
31–403.96Neutral3.73Negative
41–503.82Negative 3.80Negative
51–604.18Neutral4.56Neutral
Monthly incomeR0–R15003.84Negative 3.41Negative
R1501–R70004.27Neutral4.26Neutral
R7001–R16,0003.99Negative4.04Neutral
R16,001–R33,0003.85Negative 3.80Negative
>R33,0002.20Strongly Negative3.50Negative
Table 6. Summary of likelihood ratio test results.
Predictor x 2 dfp-ValueInterpretation
Commuter Safety6.70020.035Significant
Crime Prevention12.42420.002Significant
Car ownership24.3692<0.001Significant
Period of bus use31.3296<0.001Significant
Table 7. Multinomial logistic regression parameter estimates for travel mode choice.
ComparisonPredictorβSEWaldp-ValueOdds Ratio Exp(B)95% CI for Exp(B)
Minibus Taxi vs. WalkingCommuter Safety−0.4820.2623.3790.0660.6170.369–1.032
Crime Prevention−0.7170.2299.7940.0020.4880.312–0.765
Car ownership (Yes)−2.3400.55717.646<0.0010.0960.032–0.287
Bus use < 3 months1.9040.57510.949<0.0016.7112.173–20.725
Bus use 4–8 months1.9070.55411.869<0.0016.7322.275–19.920
Bus use 9–11 months2.0801.1813.1020.0788.0020.791–80.979
Private Vehicle vs. WalkingCommuter Safety−0.8600.3486.0990.0140.4230.214–0.837
Crime Prevention−0.3080.3260.8930.3450.7350.387–1.393
Car ownership (Yes)−1.0800.7472.0910.1480.3400.079–1.468
Bus use < 3 months0.5290.8890.3540.5521.6980.297–9.701
Bus use 4–8 months0.2810.8840.1010.7511.3240.234–7.486
Bus use 9–11 months2.8731.2904.9600.02617.6851.411–221.599
Table 8. Leeto La Polokwane Phase 1A monthly service days and the number of commuter trips.
MonthNumber of DaysNumber of Commuters Trips
20212022202320242021202220232024
January-313030-562253,82475,785
February -272829-872170,64179,942
March -272730-10,17468,87663,120
April -303013-11,82790,39232,755
May -3031--18,764116,321
June -3030--28,667110,007
July -3031--56,75459,856
August-2831--67,38286,556
September-3030--91,16469,693
October-2931--85,74572,081
November 262430-343573,05482,771
December 312628-447773,11840,634
Total573423571027912530,992921,652251,602
Table 9. Monthly commuters’ ridership trends per route for the year 2021 and 2022.
MonthRoute F1Route F4BRoute TE4Route TE5B
November 202111852131699338
December 20211265192479534
January 202217182022934673
February 202226701034830875
March 202237844094934833
April 2022242513854081144
May 202263552277277210
June 20229473361210,1965386
July 202221,276651819,0529908
August 202219,890492727,21515,350
September 202225,399857935,35421,832
October 202228,126921730,27418,128
November 202222,496665425,44418,460
December 202220,617546227,89619,143
Table 10. Monthly commuters’ ridership trends per route for the year 2023.
Month Route F1 Route F4BRoute TE4 Route TE5B
January 202316,502709317,16013,069
February 202320,122830524,78117,433
March 2023725711,27221,52415,129
April 202325,20217,02428,87619,290
May 202337,42919,99032,00326,899
June 202334,44619,12730,17926,255
July 202318,549857715,52817,202
August 202327,25710,47819,98728,834
September 202319,282826918,15923,983
October 202321,003904017,51424,524
November 202324,50410,41720,84027,010
December 202312,813537110,32112,129
Table 11. Monthly commuters’ ridership trends per route for the year 2024.
Month Route F1 Route F4BRoute TE4 Route TE5B
January 202422,97610,77818,62523,406
February 202426,54110,92618,56623,909
March 202418,76687,8716,75018,817
April 202411,128423079859412
Disclaimer/Publisher’s Note: The statements, opinions and data contained in all publications are solely those of the individual author(s) and contributor(s) and not of MDPI and/or the editor(s). MDPI and/or the editor(s) disclaim responsibility for any injury to people or property resulting from any ideas, methods, instructions or products referred to in the content.