Article

Spatiotemporal Patterns and Drivers of County-Level Health Resource Allocation in Hunan Province, China: A Health Equity Perspective


1
Yiyang Natural Resources Planning and Surveying Institute, Yiyang 413000, China
2
School of Architecture and Urban Planning, Hunan City University, Yiyang 413000, China
3
Hunan Provincial Key Laboratory of Key Technologies of Digital Urban and Rural Spatial Planning, Yiyang 413000, China
4
Key Laboratory for Urban Planning Information Technology in Hunan Provincial Universities, Yiyang 413000, China
*
Author to whom correspondence should be addressed.
Sustainability 2026, 18(17), 8760; https://doi.org/10.3390/su18178760
Submission received: 17 July 2026 / Revised: 17 August 2026 / Accepted: 21 August 2026 / Published: 26 August 2026

Abstract

The equitable allocation of health resources is fundamental to building healthy cities and advancing sustainable regional development. Using panel data for 122 county-level units in Hunan Province, China, from 2011 to 2022, this study constructs an evaluation index system for healthcare resource allocation and applies trend surface analysis, spatial autocorrelation, the Dagum Gini coefficient, and geographically and temporally weighted regression (GTWR) to examine the spatiotemporal evolution, equity, and driving factors of health resource allocation. The results show the following. (1) The level of health resource allocation in Hunan Province rose steadily, with the composite score increasing by 74%, yet a persistent spatial pattern of higher allocation in the east and north than in the west and south remained; hot spots clustered in Changsha, while cold spots concentrated in parts of Southern Hunan and Western Hunan. (2) Regional disparities narrowed gradually, and the Dagum decomposition identified transvariation density as the dominant source of inequality, with an average contribution of 53.58%, exceeding intra-group and inter-group differences. (3) The effects of the drivers exhibited marked spatiotemporal heterogeneity. Per capita GDP promoted health resource allocation mainly in developed regions, while urbanization exerted stronger positive effects in less-developed regions. The positive effect of per capita disposable income gradually shifted from less-developed to developed regions over time, and population density generally showed a positive effect, with stronger influences concentrated in the Greater Western Hunan region. This study contributes to a deeper understanding of how regional disparities and heterogeneous driving mechanisms shape health resource allocation, providing evidence for more adaptive and equitable healthcare governance.

1. Introduction

Equitable access to health resources underpins population health and constitutes a precondition for health equity [1,2]. The World Health Organization characterizes health inequities as systematic and avoidable disparities rooted in social determinants, among which the uneven distribution of health resources stands out as a key and modifiable driver [3,4,5]. China exemplifies this tension in a pronounced form. Four decades of rapid urbanization have greatly expanded public service infrastructure, yet persistent regional economic disparities have channeled health resources toward developed areas [6,7]. Accelerated population aging is meanwhile enlarging and reshaping healthcare demand. Although the 2009 national healthcare reform has substantially increased overall supply, spatial imbalances in allocation persist, constraining both the equity of public services and the sustainability of urban development [8].
Addressing these disparities has become a policy priority at both international and national levels. As early as 1980, the British government released the Black Report, which first documented health inequalities and their primary causes [9]. In 1998, the World Health Assembly adopted the promotion of health equity within and between countries, together with health for all, as overarching goals of global development [10]. Within this broader global context, health equity has gradually evolved from a normative principle into an important objective of health governance and policy practice. China has aligned with this evolving perspective by progressively incorporating health equity into its national development strategies and healthcare reform agenda, with increasing emphasis placed on equal access to healthcare services and the balanced allocation of health resources. In China, the Outline of the Healthy China 2030 Plan (2016) established equity and justice as one of its fundamental principles, and the Healthy China Action Plan (2019–2030) subsequently designated health equity as a key strategic goal for healthy city development and integrated it into urban planning [11,12]. Against this backdrop, optimizing the spatial allocation of health resources serves both as a critical lever for alleviating the current inadequacies in medical facility supply and uneven distribution, and as a means to reduce barriers to healthcare access and cross-regional patient flows, thereby effectively safeguarding the equal rights of residents across different regions to quality medical services.
Health resource allocation has long been an important topic in health geography, public administration, and urban and rural planning, with the core objective of promoting the optimal allocation of healthcare resources and achieving effective and spatially balanced provision of essential medical services [13,14]. Existing studies have primarily examined this issue from two perspectives: the spatial patterns of healthcare resource supply and demand, and the equity of resource allocation. Regarding supply–demand relationships, scholars have widely applied GIS-based spatial analysis and spatial statistical methods to investigate the spatial distribution of healthcare resources, the matching between supply and population demand, and the formation mechanisms of spatial disparities [15,16,17]. Previous research has mainly focused on the national scale [16,17,18] and developed eastern coastal regions [19,20,21], with provincial [22,23] and prefecture-level city scales [24] being the dominant analytical units. In recent years, with the advancement of equalization of basic public services and urban–rural integration, increasing attention has been paid to central and western China, and research has gradually extended to finer spatial scales, such as counties and townships, to reveal spatial inequalities in primary healthcare resource allocation [25]. Furthermore, some studies have explored the driving mechanisms of healthcare resource allocation by employing multiple regression models and spatial econometric approaches to examine the impacts of economic development, demographic structure, fiscal investment, and policy institutions on healthcare resource supply and demand patterns [26,27]. In terms of healthcare resource allocation equity, research has gradually shifted from focusing on the balanced distribution of resource quantities toward emphasizing spatial equity in access to healthcare services [28,29]. Existing studies have commonly employed inequality measurement approaches, such as the Gini coefficient and Theil index, to evaluate disparities in the distribution of healthcare institutions, hospital beds, and health professionals, thereby assessing the degree of equity in regional healthcare resource allocation [30,31]. Building upon these approaches, some scholars have further incorporated spatial analytical methods to integrate allocation equity with geographical patterns, examining healthcare resource equity from perspectives including service coverage, spatial accessibility, and equality of healthcare opportunities [28,32]. Overall, existing studies have continuously enriched the theoretical perspectives and methodological approaches for understanding healthcare resource allocation, providing important foundations for identifying regional disparities, optimizing the spatial layout of public health resources, and promoting equitable healthcare services.
However, several aspects of existing research require further advancement: (1) Existing studies have paid limited attention to the long-term dynamic evolution of healthcare resource allocation at the county scale. As fundamental units for the provision of basic public services in China, counties serve as important spatial interfaces connecting urban healthcare resources with rural residents’ needs and provide a critical analytical scale for examining disparities in primary healthcare resource allocation. (2) Existing analyses of regional disparities in healthcare resource allocation have mainly focused on evaluating overall inequality, while the underlying sources and contribution structures of these disparities remain insufficiently explored. Therefore, approaches capable of decomposing inequality sources are needed to further identify the structural characteristics and formation mechanisms of uneven healthcare resource allocation. (3) Existing studies on the driving mechanisms of healthcare resource allocation have largely adopted static perspectives, making it difficult to capture the spatial heterogeneity and temporal evolution of influencing factors. Given the substantial differences among counties in terms of development stages, demographic characteristics, and policy environments, the same factor may generate varying degrees of influence or even opposite effects across different regions. Therefore, spatiotemporally dynamic analytical approaches are needed to investigate the influencing factors and mechanisms of healthcare resource allocation from an integrated perspective of space and time.
Against this background, this study adopts a health equity perspective and takes Hunan Province as a case. We construct a county-level evaluation index system and trace the spatiotemporal evolution of health resource allocation across 122 counties from 2011 to 2022. To further identify the structural sources of regional disparities, we employ the Dagum Gini coefficient, which, unlike traditional inequality measures, can decompose overall inequality into within-region disparities, between-region disparities, and transvariation effects, thereby providing a more comprehensive understanding of the sources and spatial mechanisms of inequality. We then identify the spatiotemporally heterogeneous driving factors with a geographically and temporally weighted regression model. The findings are expected to clarify where the disparities in health resource allocation originate and how their drivers vary across regions and over time, thereby informing differentiated policies for advancing health equity in China and other transitional health systems.

2. Materials and Methods

2.1. Data Sources and Study Area

Hunan Province comprises 122 county-level administrative units across 14 prefecture-level cities, with substantial internal disparities in economic development, demographic characteristics, and geographic conditions. This study selects the 122 county-level units as the analytical units and constructs a panel dataset covering the period from 2011 to 2022. The data were obtained from the Hunan Statistical Yearbook, the Hunan Provincial County Statistical Yearbooks, and the Sixth and Seventh National Population Censuses of China. According to the research objectives, the dataset consists of two categories of indicators. The first category includes health resource allocation indicators, which are used to characterize the supply capacity of county-level healthcare systems. These indicators cover healthcare facilities and bed resources, including hospitals, outpatient departments, community healthcare centers, clinics, and village health stations, as well as healthcare workforce resources, including licensed (assistant) physicians, registered nurses, pharmacists, medical technicians, and other healthcare professionals. The second category comprises demographic and socioeconomic indicators, including permanent resident population and county-level economic indicators, which are incorporated to examine the determinants of spatial disparities in health resource allocation.
The panel dataset contains three missing observations, corresponding to the indicators of registered nurses, pharmacists, and other health technicians per 10,000 population in Shaoshan County in 2015. These missing observations account for approximately 0.019% of all indicator observations. Regression imputation was applied to estimate the missing values, and the reliability of the imputed results was evaluated by examining their temporal consistency with observations from adjacent years within the same county.
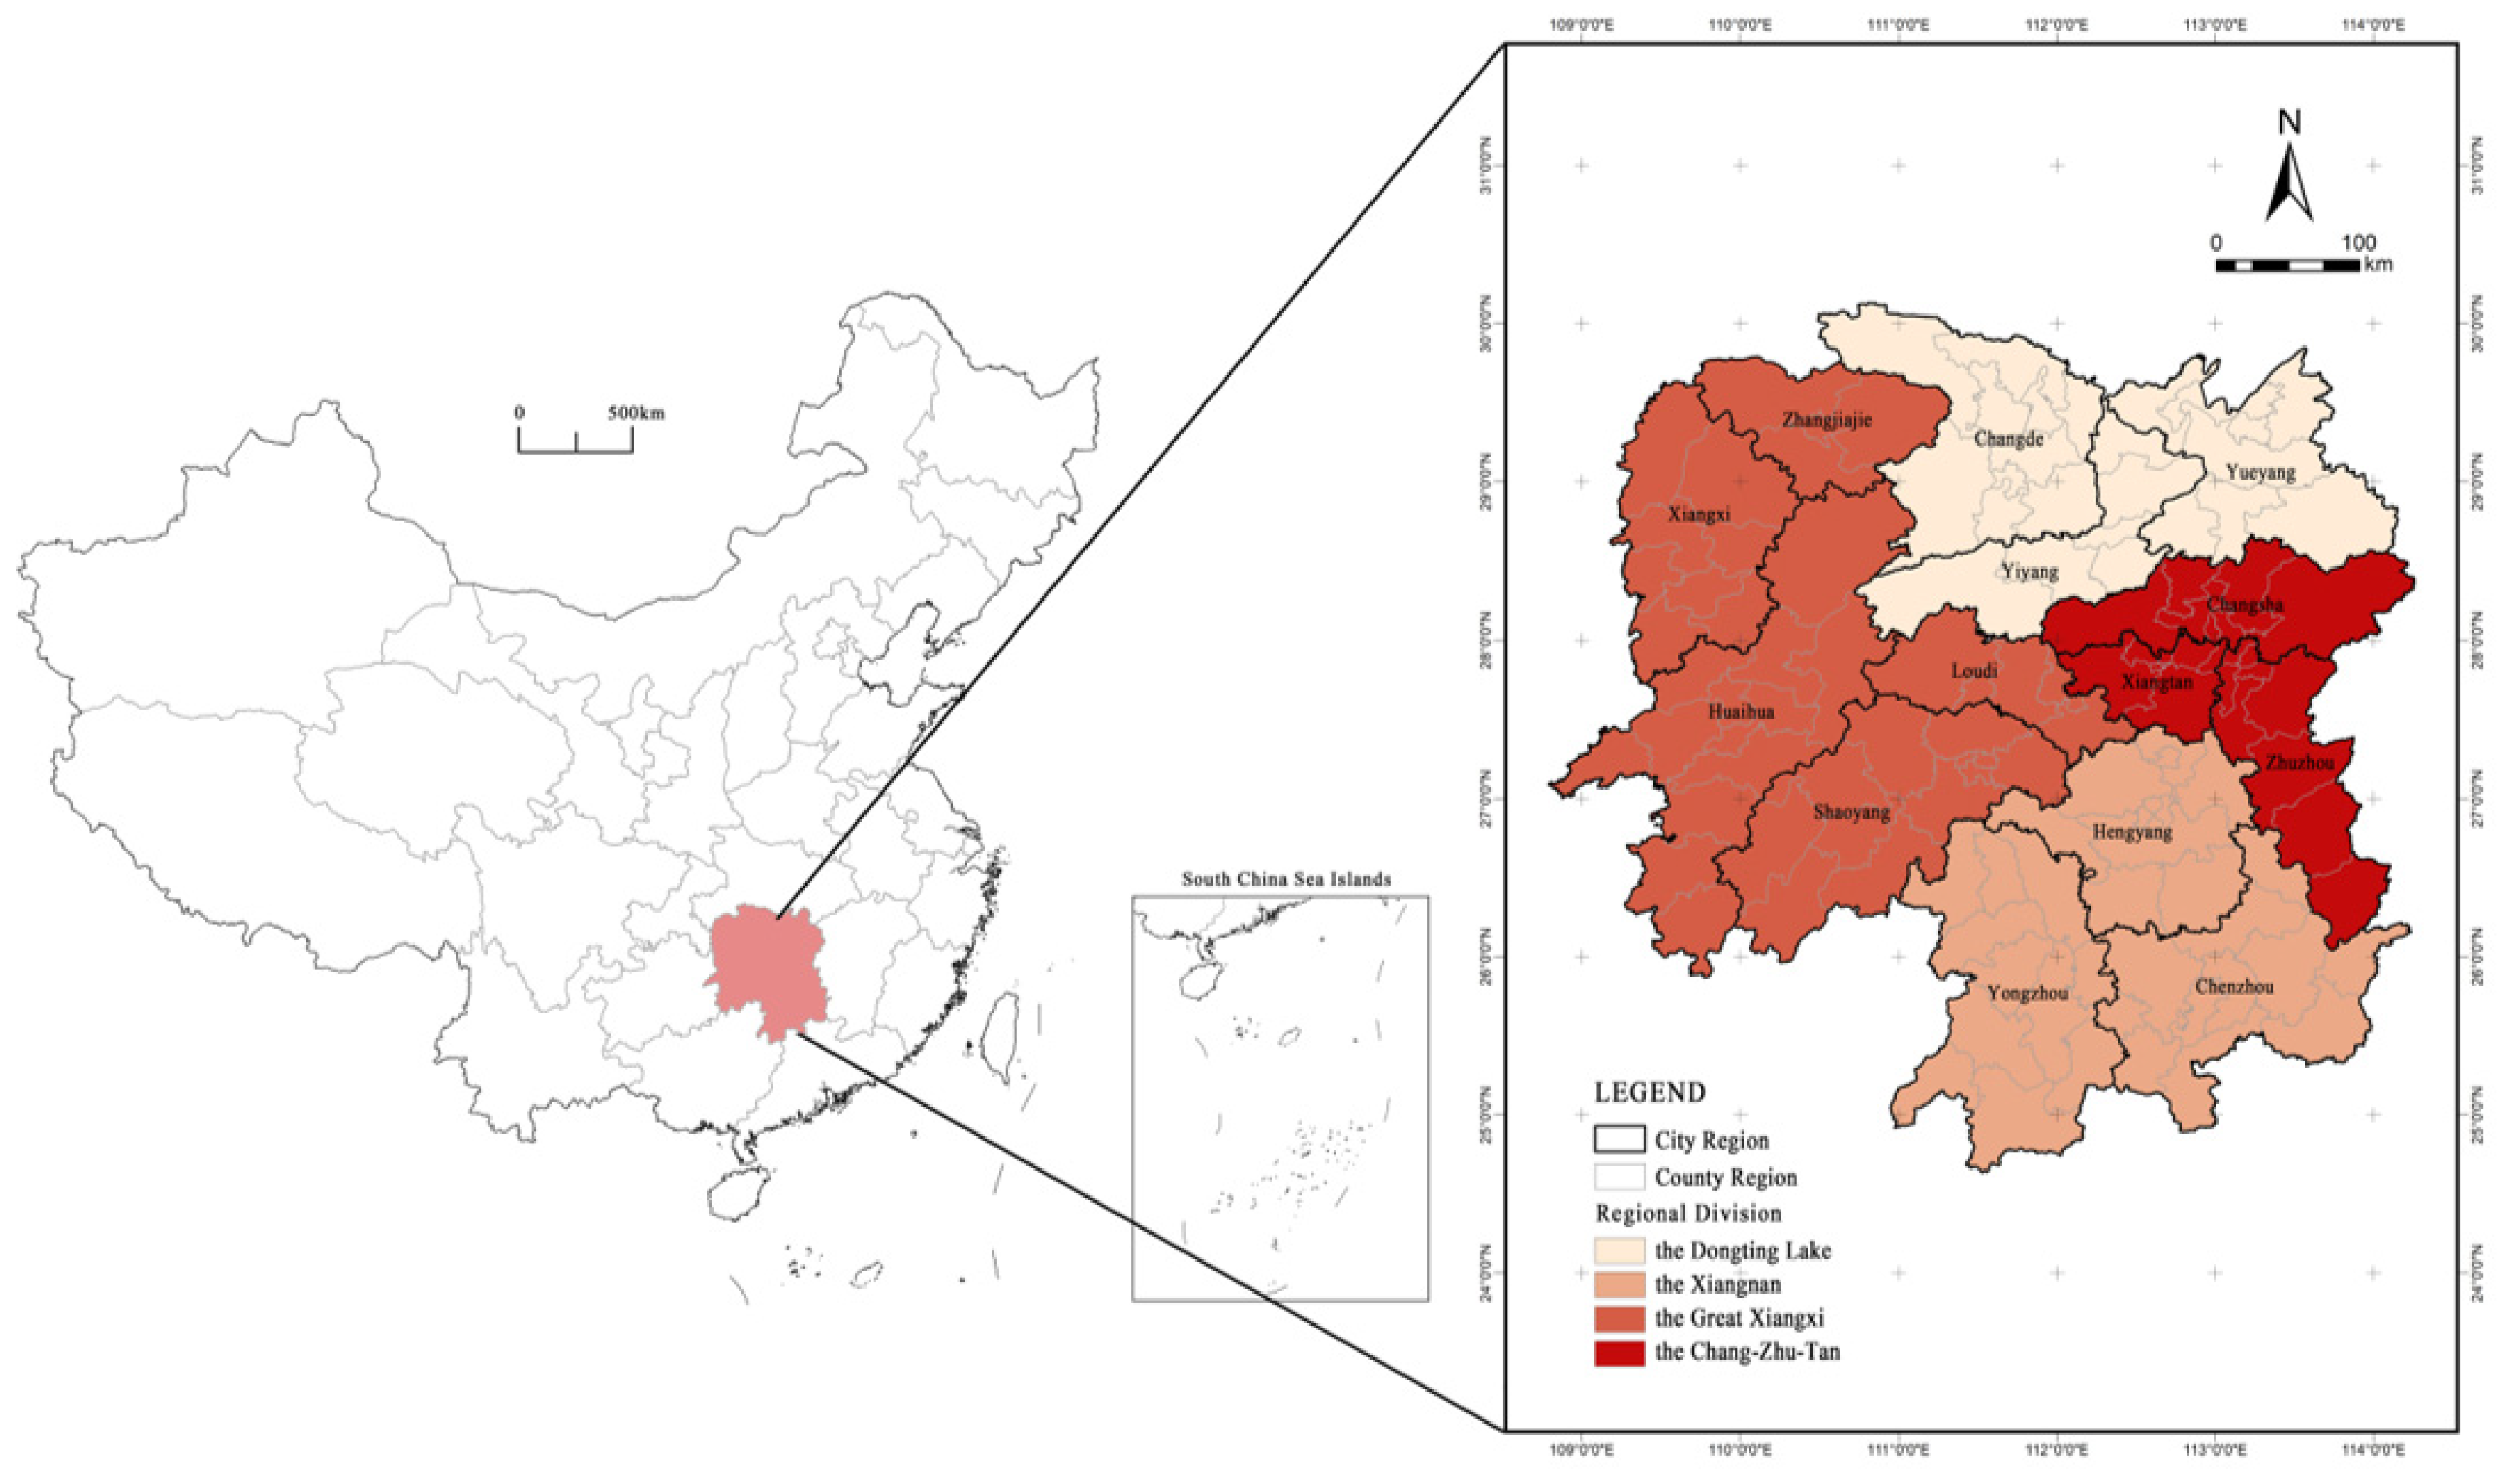
To better capture regional disparities in health resource allocation, the counties were grouped into four regions based on geographical proximity and economic linkages (Figure 1). The Changsha–Zhuzhou–Xiangtan (Chang-Zhu-Tan) Urban Agglomeration encompasses Changsha, Zhuzhou, and Xiangtan. The Dongting Lake Region includes Changde, Yueyang, and Yiyang. The Southern Hunan (Xiangnan) Region covers Hengyang, Chenzhou, and Yongzhou. The Western Hunan (Great Xiangxi) Region incorporates Xiangxi Tujia and Miao Autonomous Prefecture, Zhangjiajie, Huaihua, Loudi, and Shaoyang.

2.2. Evaluation Indicator System

Health equity requires that all individuals, regardless of their gender, socioeconomic status, geographic location, or other characteristics, should have the opportunity to fully achieve their health potential and enjoy equal opportunities for health promotion and health protection [33,34]. Health equity emphasizes not only equal access to healthcare services but also the institutional environment and resource conditions that support such access. Specifically, “equity in access” refers to the equal opportunities for different population groups to obtain healthcare services, whereas “equity in conditions” highlights the importance of infrastructure development, public policy support, and targeted interventions for vulnerable groups to create the necessary conditions for achieving health equity.
From this perspective, healthcare resource allocation does not merely reflect the absolute quantity of medical resources, but rather represents the comprehensive capacity of a region to ensure residents’ healthcare needs under specific demographic and socioeconomic conditions. In other words, from the perspective of health equity, healthcare resource allocation should not only consider the scale of resource supply but also emphasize the adaptability between resource provision and population healthcare demands. On the one hand, the number of healthcare institutions, the scale of medical beds, and the allocation of health professionals directly determine the foundation and service capacity of regional healthcare provision [35,36]. On the other hand, differences in population age structure influence healthcare demand characteristics. Children and older adults generally have greater needs for preventive care, chronic disease management, and healthcare utilization, and variations in their proportions may affect the appropriateness of regional healthcare resource allocation [37,38,39]. Therefore, population age structure is treated as a demographic pressure rather than a resource advantage. In addition, regional per capita fiscal expenditure can partly reflect the capacity of local governments to support public services and provide healthcare resources, serving as an important foundation for regional healthcare service provision [22,40]. Therefore, this study defines the healthcare resource allocation level as the comprehensive capacity of regional healthcare service provision, namely, the ability to meet residents’ healthcare needs through resource supply under given demographic and socioeconomic conditions. Based on this definition, and considering data availability, this study constructs an evaluation indicator system from three dimensions: resource supply capacity, population demand characteristics, and public service support conditions. The system includes 10 indicators (Table 1), and the entropy weight method is applied to determine the weights of each indicator.

2.3. Methods

2.3.1. Comprehensive Evaluation Index Model

To eliminate the impact of dimensional and magnitude differences across indicators, min–max normalization was adopted to standardize the raw data. The calculation formulas are as follows:
X i ′ = X i − X m i n X m a x − X m i n + 0.001 ,     Positive   indicators X m a x − X i X m a x − X m i n + 0.001 ,     Negative   indicators
where X m a x and X m i n denote the maximum and minimum values of the i-th indicator, respectively. A constant term of 0.001 is added to avoid zero values in subsequent entropy calculations.
Indicator weights were calculated using the entropy method. The specific steps are as follows:
e i = − 1 l n m ∑ i = 1 m ( x i ′ ∑ i = 1 m x i ′ l n x i ′ ∑ i = 1 m x i ′ )
W i = 1 − e j ∑ i = 1 n ( 1 − e j )
s j = ∑ i = 1 n X i ′ w i ; ∑ i = 1 n w i = 1
where e i represents the entropy value of the i-th indicator, w i denotes the weight of the corresponding indicator, and S j signifies the health resource allocation level of county j.

2.3.2. Trend Surface Analysis

Trend surface analysis constructs a mathematical surface to fit the spatial distribution characteristics of health resource allocation. The model is specified as:
Z i x i , y i = T i x i , y i + ε i
where Z i ( x i , y i ) denotes the health resource allocation level of county i at the spatial coordinate ( x i , y i ) ; T i ( x i , y i ) reflects the overall spatial trend of the allocation level; and ε i is the residual term, which captures local spatial variations via spatially autocorrelated random errors.
A second-order polynomial function was used to fit the spatial trend, with the formula:
T i x i , y i = β 0 + β 1 x + β 2 y + β 3 x 2 + β 4 y 2 + β 5 x y
where β 0 to β 5 are coefficients estimated from the data.

2.3.3. Spatial Autocorrelation Analysis

Spatial autocorrelation analysis quantifies the degree to which an attribute at one location is correlated with the same attribute at neighboring locations [41]. Global Moran’s I and local Getis-Ord Gi* statistics were employed to examine the spatial pattern of health resource allocation across counties. Moran’s I captures the overall tendency toward clustering or dispersion, while Gi* identifies the location and significance of local spatial clusters. The formulas are as follows:
Moran ’ s   I = n ∑ i = 1 n     ∑ j = 1 n     w i j ( x i − x ‾ ) ( x j − x ‾ ) ∑ i = 1 n     ∑ j = 1 n     w i j ( x i − x ‾ ) 2
G i ∗ = ∑ j = 1 n     w i j x j ∑ j = 1 n     x j
where n is the total number of county-level units; xi and xj represent the health resource allocation scores of county i and county j, respectively; x is the mean value of all scores; wij refers to the element of the spatial weight matrix between unit i and unit j.

2.3.4. Dagum Gini Coefficient

The Dagum Gini coefficient decomposes regional disparities into intra-group inequality, inter-group inequality, and transvariation density, providing deeper insights into structural differences than the traditional Gini coefficient or Theil index [42]. The formulas are as follows:
G = ∑ j = 1 k ∑ h = 1 k ∑ i = 1 n j ∑ r = 1 n h y j i − y h r 2 μ n 2
G j j = ∑ i = 1 n j ∑ r = 1 n j y j i − y h r 2 n j 2 μ j
G w = ∑ j = 1 k G j j p j s j
G n b = ∑ j = 2 k ∑ h = 1 j − 1 G j h p j s h + p h s j D j h
G t = ∑ j = 2 k ∑ h = 1 j − 1 G j h p j s h + p h s j 1 − D j h
D j h = d j h − p j h d j h + p j h
d j h = ∫ 0 ∞ d F j y ∫ 0 y y − x d F h x
p j h = ∫ 0 ∞ d F h y ∫ 0 y y − x d F j y
where y j i ( y h r ) is the health resource allocation level of any county in group y h , μ is the mean, n is the total number of counties, k is the number of groups (Chang-Zhu-Tan, Dongting Lake, Southern Hunan, and Western Hunan), n j n h is the number of counties in group j h , D j h measures relative inter-group influence, d j h is the inter-group difference, and p j h is the transvariation first-order moment.

2.3.5. Geographically and Temporally Weighted Regression (GTWR)

Compared with traditional regression and spatial econometric models, GTWR can simultaneously capture spatial non-stationarity and temporal evolution of explanatory effects [43]. An adaptive Gaussian kernel was used, and the optimal bandwidth was selected by minimizing the corrected Akaike information criterion (AICc), resulting in an adaptive bandwidth of 26 nearest neighbors. Spatiotemporal distance was measured using a three-dimensional Euclidean distance based on spatial coordinates and temporal differences, with the temporal dimension weighted by 0.5. The formula is:
Y i t = β 0 u i , v i , t i + ∑ k β k u i , v i , t i X i k + ε i t
where Y i t is the dependent variable, X denotes explanatory variables, i represents regional samples, (u, v, t) correspond to longitude, latitude, and time, β 0 u i , v i , t i is the intercept, β k ( u i , v i , t i ) are coefficients for the k-th variable, and ε i t is the error term.

3. Results

3.1. Spatiotemporal Patterns of Health Resource Allocation in Hunan Province

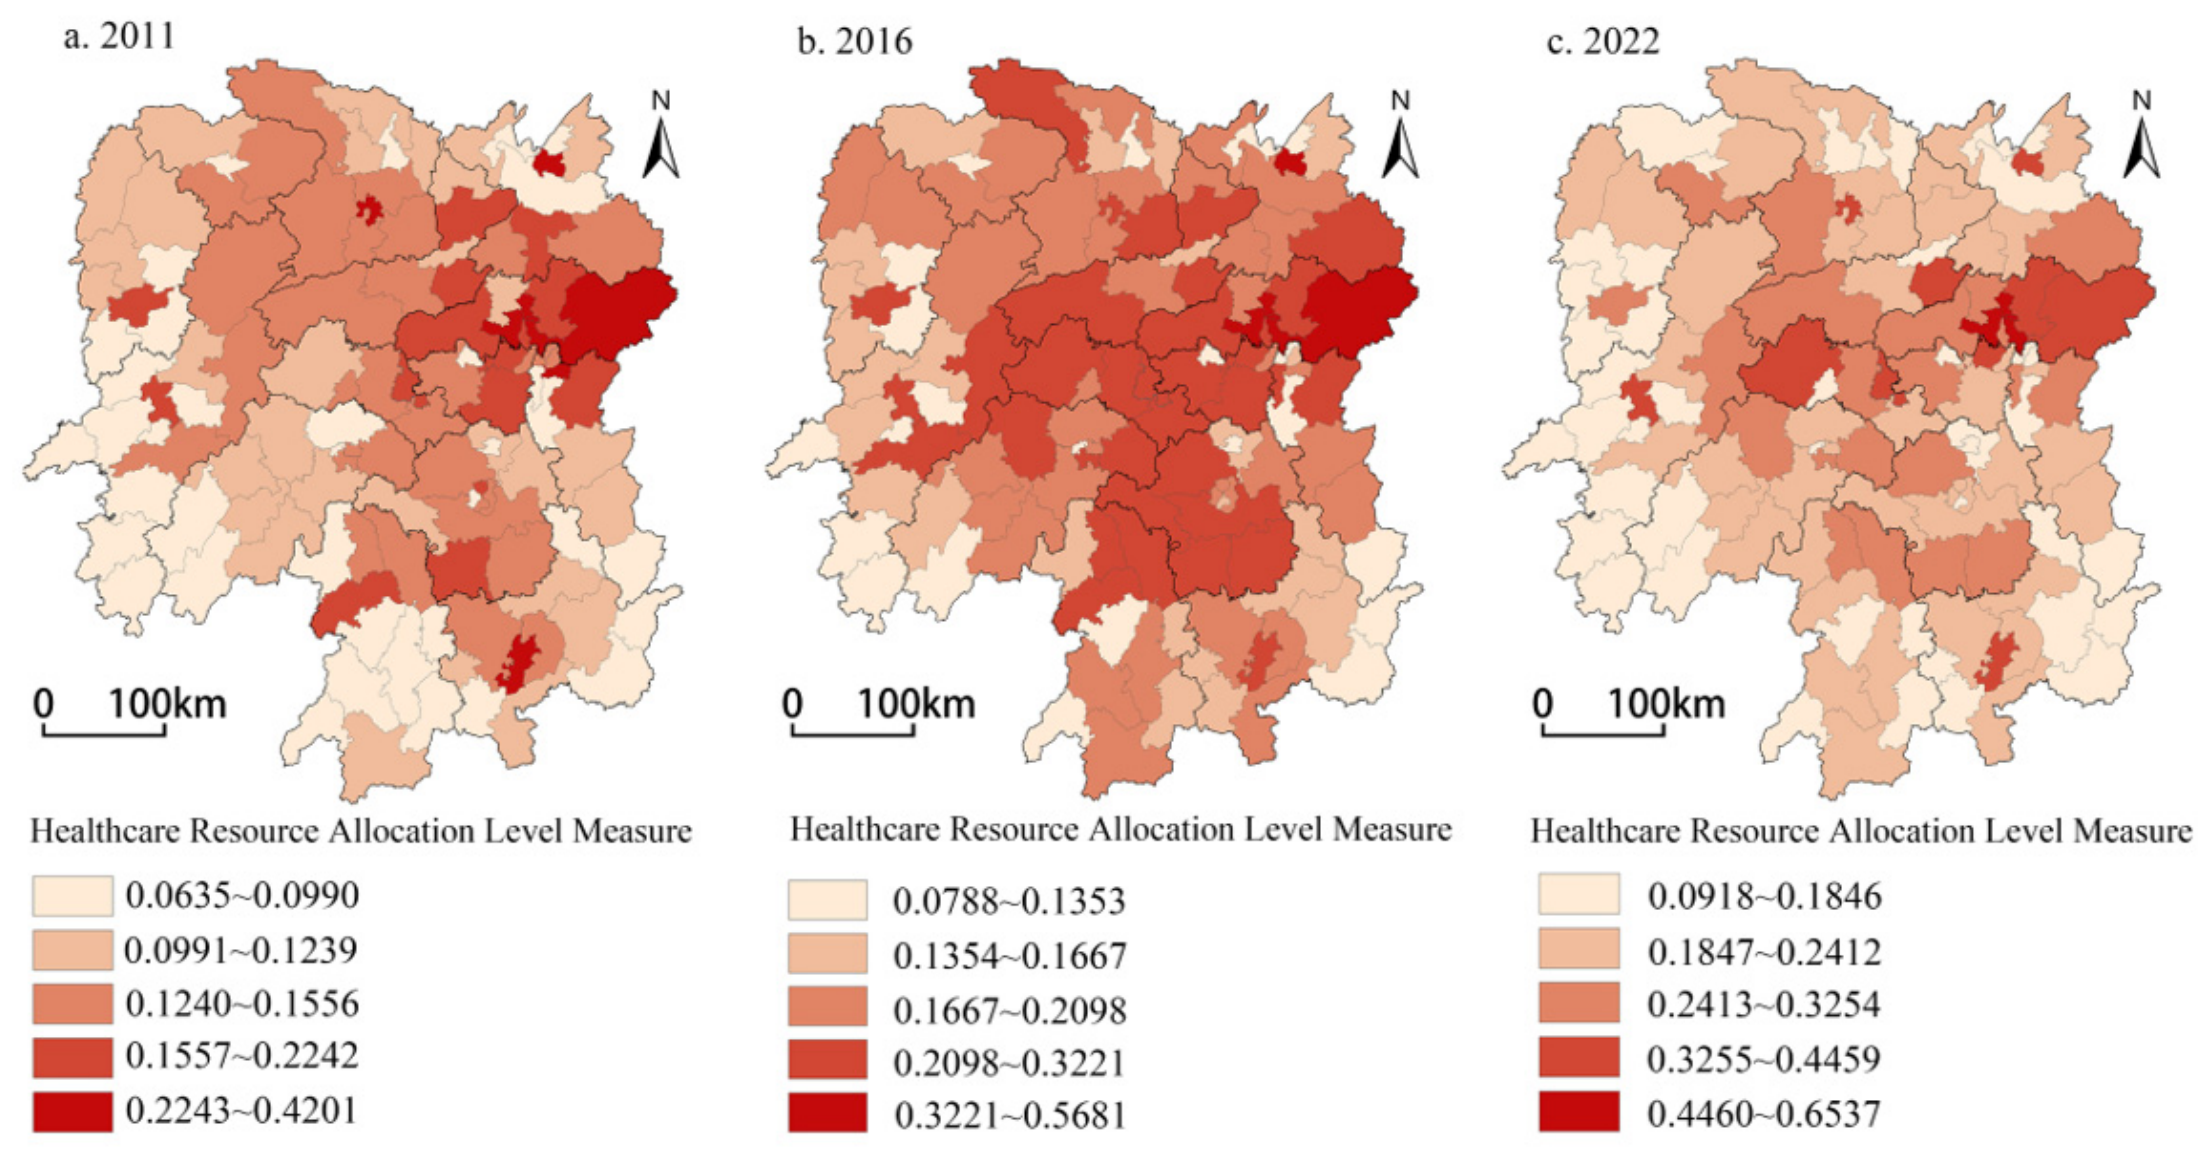
The comprehensive scores of medical and health resources for all districts and counties in Hunan Province from 2011 to 2022 were calculated. On this basis, three representative years (2011, 2016, and 2022) were selected, and the natural breaks classification method was applied in ArcGIS 10.2 to generate the spatial visualization of health resource allocation levels (Figure 2).
The spatial visualization results demonstrate that there are significant regional disparities in the health resource allocation level across districts and counties in Hunan Province, which has long exhibited a spatial pattern characterized by being higher in the east than in the west and higher in the north than in the south. In terms of average scores, the ranking of the four regions is as follows: Changsha–Zhuzhou–Xiangtan (Chang-Zhu-Tan) Region (0.2596) > Dongting Lake Region (0.2064) > Western Hunan Region (0.1836) > Southern Hunan Region (0.1833). From the perspective of temporal evolution characteristics, the health resource allocation level of Hunan Province showed a marked upward trend from 2011 to 2022, with the comprehensive score increasing from 0.1331 in 2011 to 0.2316 in 2022, representing a relative growth rate of 74%. Specifically, the score of the Chang-Zhu-Tan Region rose from 0.1859 in 2011 to 0.3029 in 2022, with a growth rate of 63%; that of the Dongting Lake Region increased from 0.1355 in 2011 to 0.2322 in 2022, corresponding to a growth rate of 71%; that of the Southern Hunan Region climbed from 0.1169 in 2011 to 0.2071 in 2022, achieving a growth rate of 77%; and that of the Western Hunan Region rose from 0.1154 in 2011 to 0.2116 in 2022, with a growth rate of 83%.
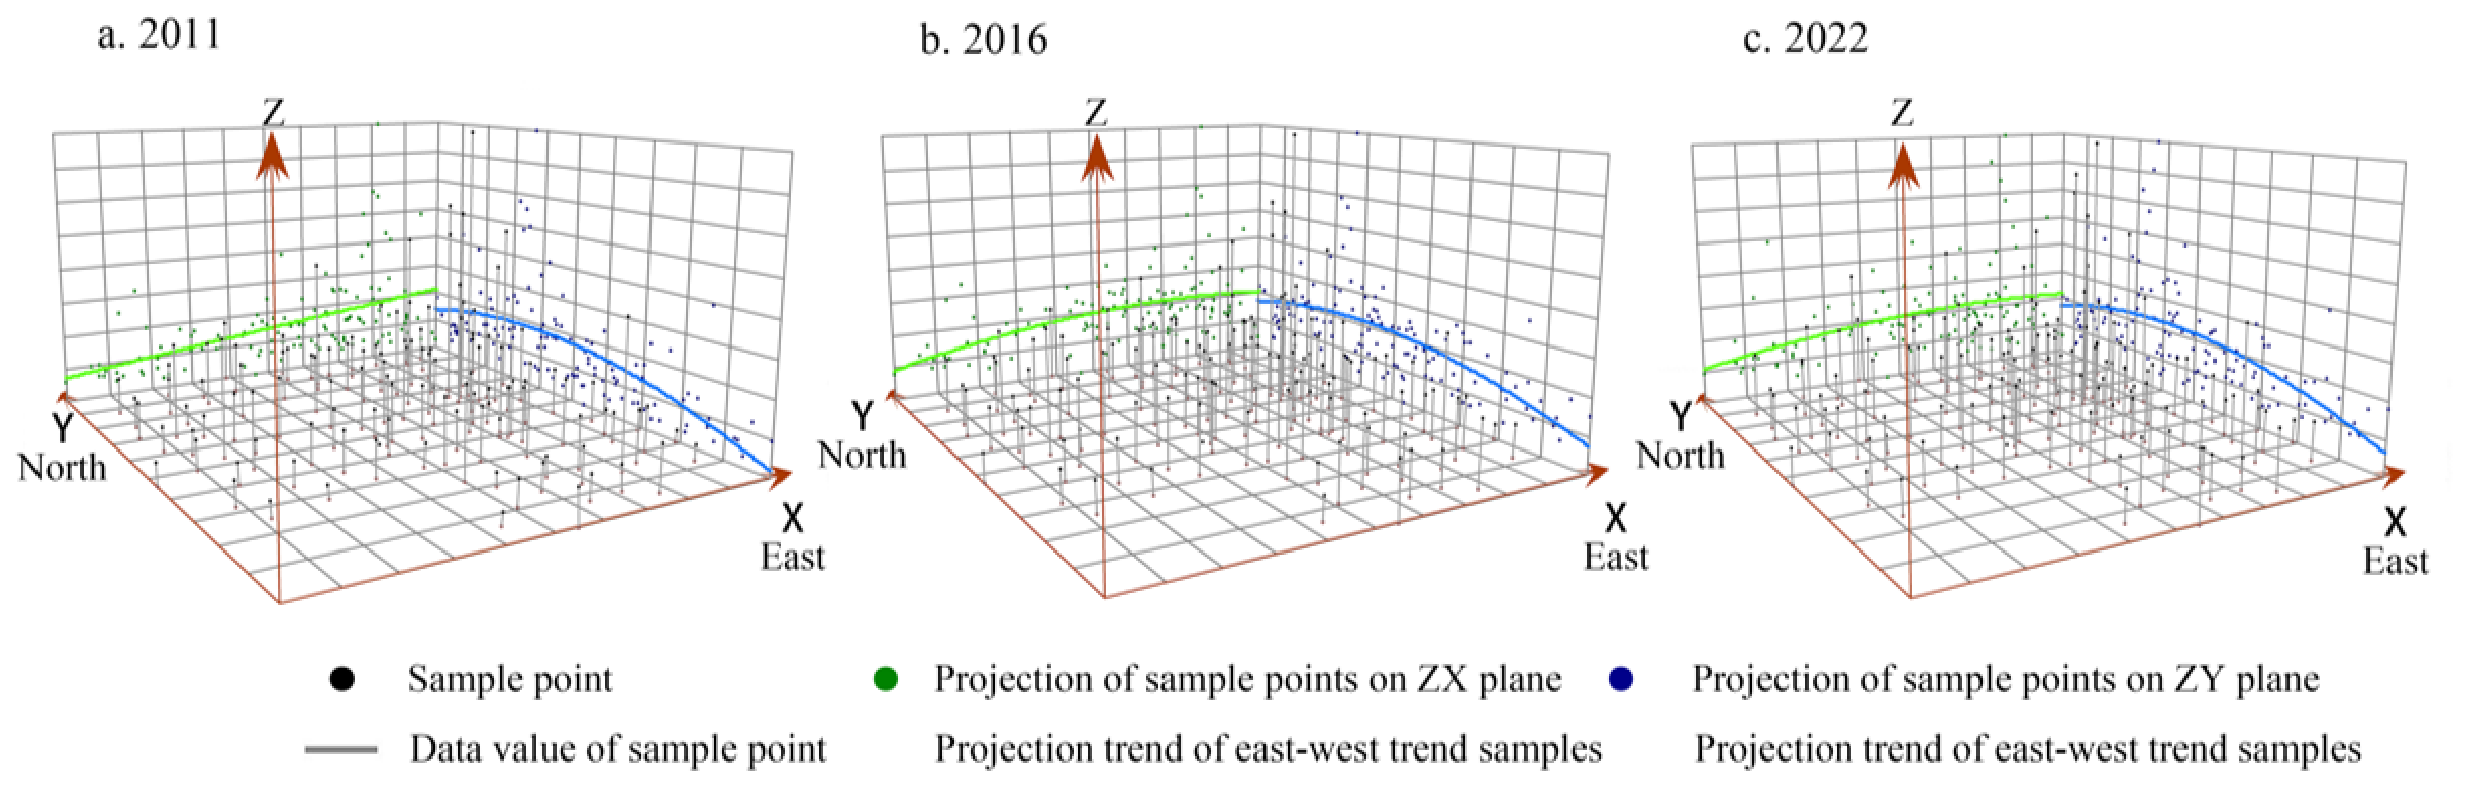
The trend surface analysis method was employed to analyze the macroscopic differentiation trends of health resource allocation levels at the county scale in Hunan Province for three years (2011, 2016, and 2022), generating spatial differentiation trend maps (Figure 3). Specifically, in the east–west direction, the overall health resource allocation level showed a gradual increasing trend from west to east; over time, the allocation level in the central region has steadily improved, and the east–west disparity has been gradually narrowing. In the north–south direction, the allocation level presented an inverted U-shaped pattern, peaking in the central area and declining toward both ends, with the northern end remaining consistently higher than the southern end.

3.2. Spatial Association of Health Resource Allocation in Hunan Province

To further reveal the spatial agglomeration characteristics of health resource allocation in Hunan Province, global Moran’s I was calculated for each year from 2011 to 2022. All values were positive with p < 0.001, ranging from 0.241 (2020) to 0.357 (2011). The index exhibited a gradual declining trend over the study period, suggesting a shift from spatial clustering toward a more dispersed pattern. Z-scores remained consistently above 4.45 throughout, confirming the robustness of the spatial autocorrelation.
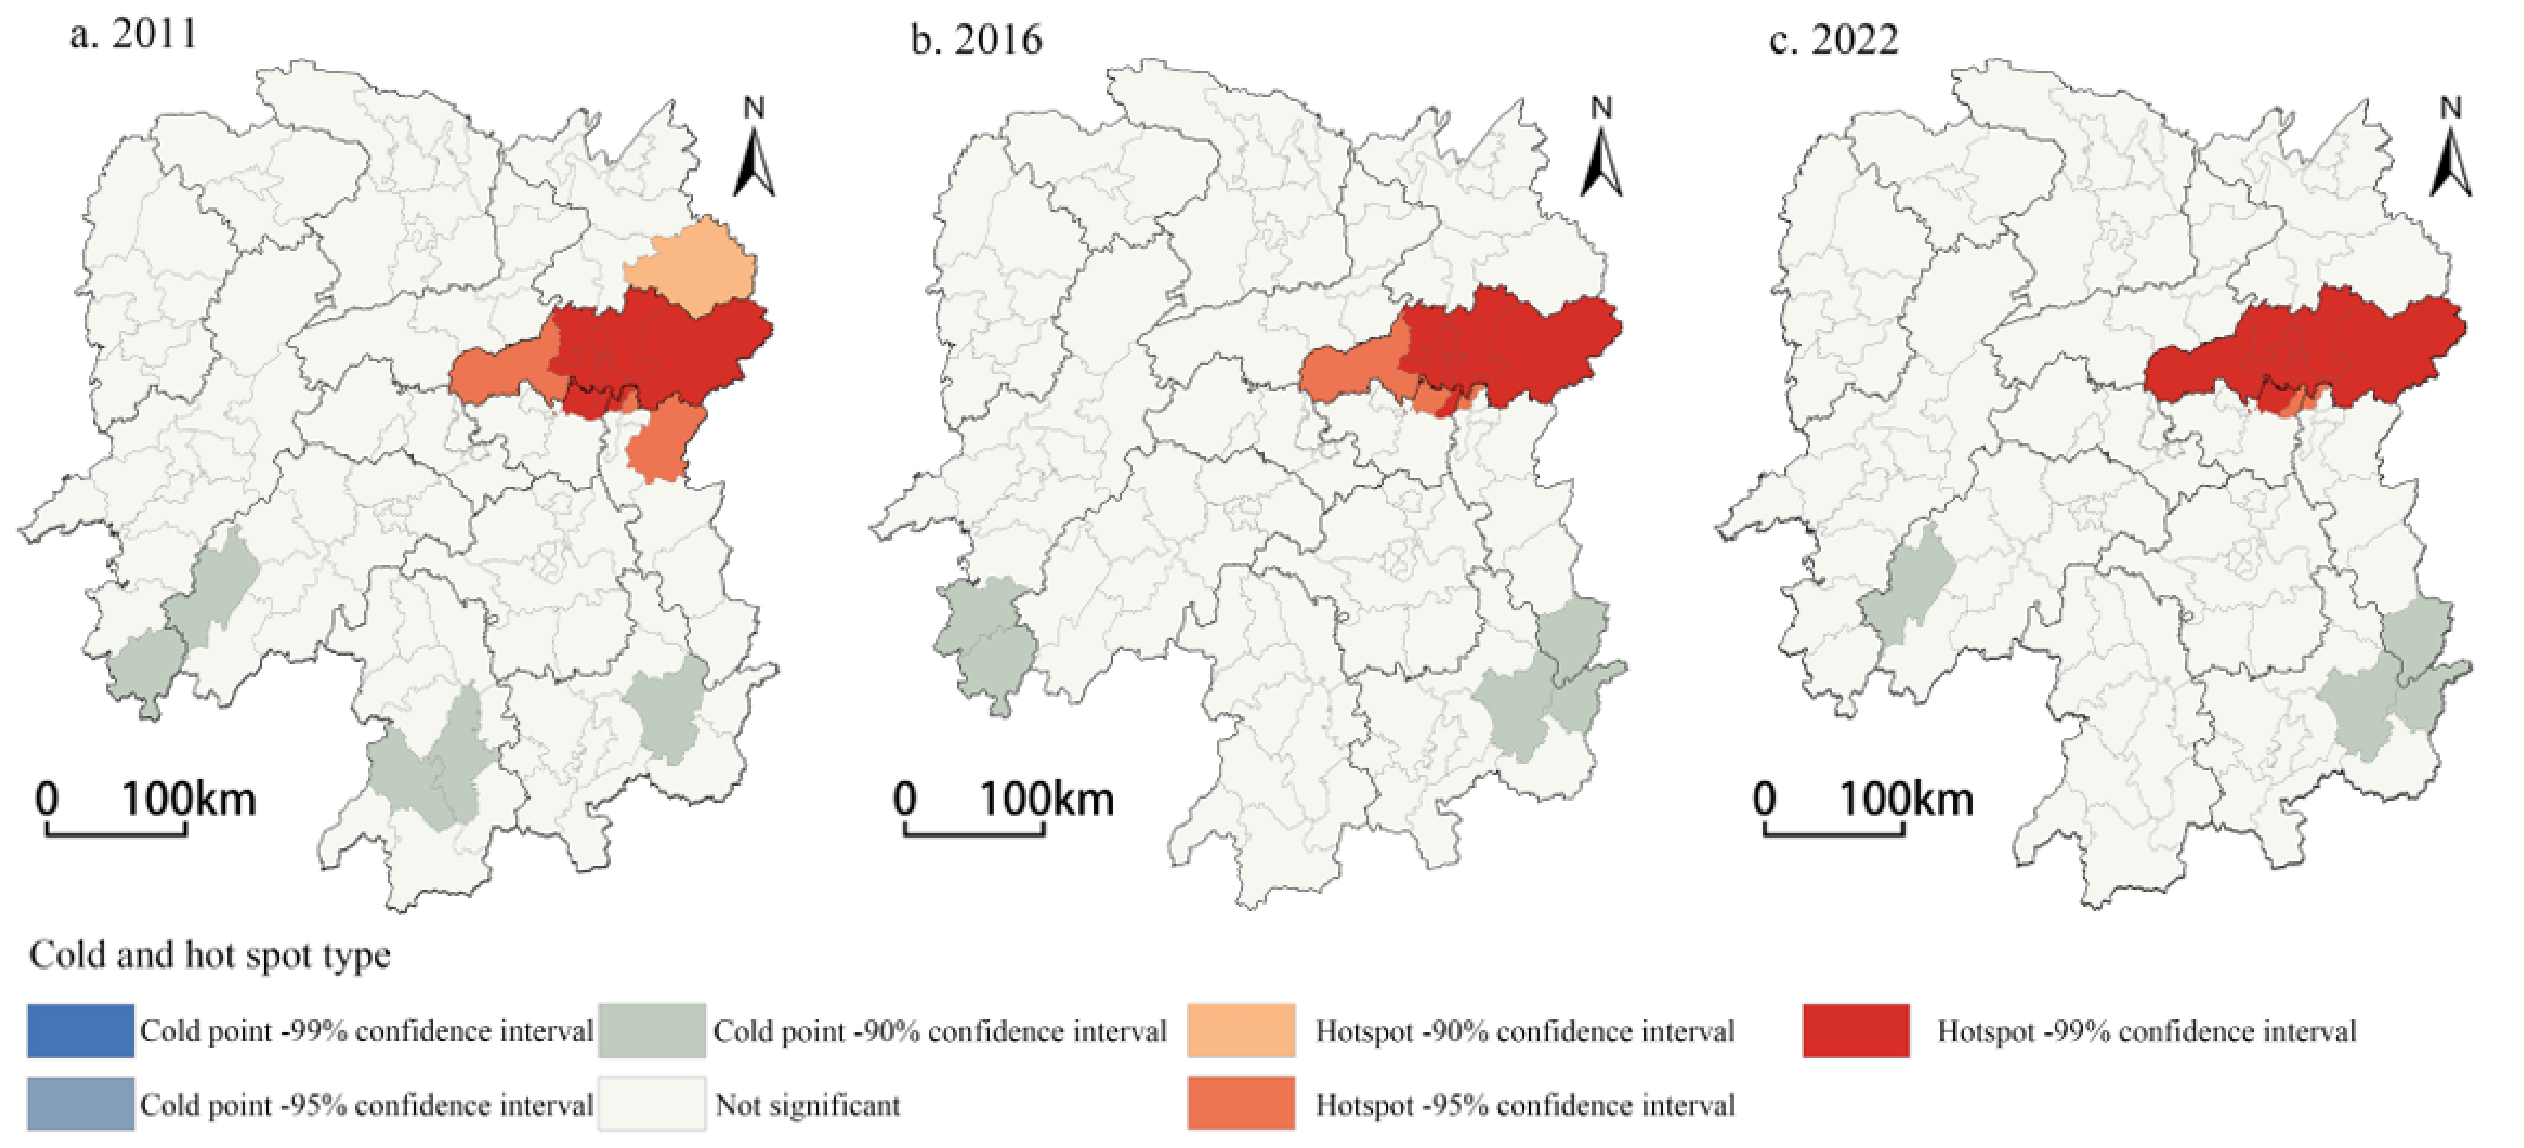
The local Getis-Ord Gi* indices of health resource allocation levels at three time points (2011, 2016, and 2022) were further calculated to identify cold and hot spot areas (Figure 4). The results indicate that the health resource allocation levels in Hunan Province exhibited significant local spatial agglomeration characteristics. For all three years, the hot spot areas were consistently concentrated in Changsha City within the Changsha–Zhuzhou–Xiangtan (Chang-Zhu-Tan) Region, while the cold spot areas were concentrated in some districts and counties of Southern Hunan and Western Hunan Regions. Overall, the spatial agglomeration areas of cold and hot spots remained relatively stable.

3.3. Equity Disparities and Sources of Health Resource Allocation in Hunan Province

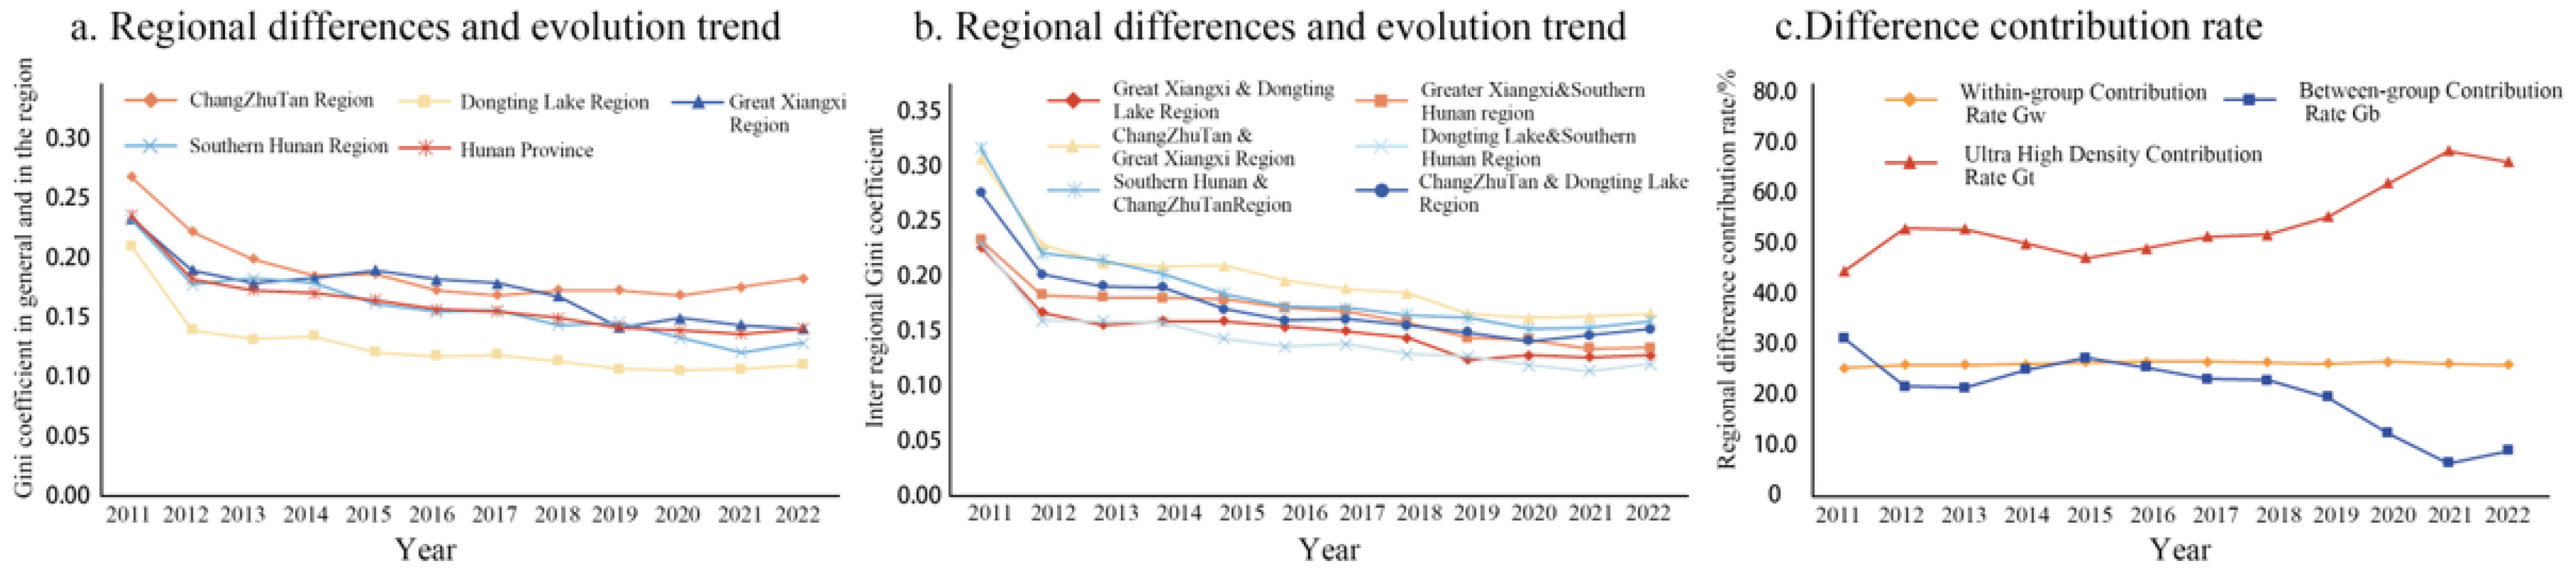
To further analyze the equity characteristics and sources of health resource allocation in Hunan Province from 2011 to 2022, the Dagum Gini coefficient method was employed for calculation and decomposition. The results reveal intra-regional disparities and their evolution, inter-regional disparities and trends, and the contribution rates of disparities (Figure 5).
From 2011 to 2022, the Gini coefficient for health resource allocation in Hunan Province showed a fluctuating downward trend, remaining below 0.3 overall. This indicates that the province has maintained a relatively equitable distribution of health resources over time, with a gradual shift toward greater fairness. Between 2011 and 2013, equity improved rapidly across Hunan Province and its subregions. This acceleration may be attributed to the initial phase of the 2009 healthcare reform, which prioritized equitable resource redistribution through policy interventions. However, progress slowed after 2013 due to diminishing marginal effects of policy implementation and resource allocation adjustments. A comparison of intra-regional disparities shows that the Chang-Zhu-Tan Region and Western Hunan exhibited higher intra-group disparities than the provincial average, while Southern Hunan aligned closely with the average. In contrast, the Dongting Lake Region displayed significantly lower intra-group disparities, reflecting higher intra-regional equity.
Inter-regional Gini coefficients followed similar trends, declining sharply from 2011 to 2013 and gradually thereafter, with values ranging between 0.115 and 0.305. The lowest disparity occurred in 2021 between the Dongting Lake Region and Southern Hunan, while the highest was observed in 2011 between Southern Hunan and Chang-Zhu-Tan. Notably, significant disparities persisted between the Chang-Zhu-Tan Region and the other three regions, highlighting its long-standing role as a hub of resource concentration relative to less-developed neighboring areas.
Regarding contribution rates, transvariation density (Gt) accounted for the largest share of disparities in health resource allocation from 2011 to 2022. Its contribution ranged from 44.10% (2011) to 67.43% (2021), averaging 53.58%, and exhibited an upward trend. Intra-group contributions (Gw) remained stable, averaging 25.99%, while inter-group contributions (Gnb) declined markedly, peaking at 30.80% in 2011 and dropping to 6.62% in 2021, with an average of 20.32%. The average contribution rates ranked as follows: transvariation density (Gt) > intra-group contributions (Gw) > inter-group contributions (Gnb).

3.4. Analysis of Driving Factors for Health Resource Allocation in Hunan Province

3.4.1. Indicator Selection and Data Testing

This study takes the health resource allocation level as the dependent variable and examines its influencing factors from four dimensions: economic development, residents’ living standards, urbanization development, and population spatial distribution (Table 2). Economic development is measured by per capita GDP, reflecting the regional economic foundation and the capacity to support healthcare infrastructure development, health workforce recruitment, and service capacity improvement. Residents’ living standards are measured by per capita disposable income, calculated as the population-weighted average of urban and rural disposable income, reflecting residents’ healthcare affordability and potential demand for healthcare services. Urbanization development is measured by the urbanization rate, reflecting changes in population spatial structure and the redistribution of healthcare demand associated with urban–rural transformation. Population spatial distribution is measured by population density, reflecting the concentration of population and the corresponding demand pressure for healthcare resource allocation. All explanatory variables were z-score standardized prior to estimation, so that the resulting coefficients are directly comparable across variables measured in different units.
The variance inflation factor (VIF) test was used to examine multicollinearity among the explanatory variables. The individual VIF values were 2.764 for per capita GDP, 2.534 for the urbanization rate, 1.647 for population density, and 2.902 for per capita disposable income, with an overall mean VIF of 2.462 (Table 3). As all values lie well below the conventional threshold of 10, no severe multicollinearity is present in the model. We recognize, however, that per capita GDP and per capita disposable income are both indicators of the local economic level and are therefore conceptually correlated, with individual VIF values of 2.764 and 2.902 falling into a moderate range. Both variables were nevertheless retained because they perform distinct roles in our conceptual framework: per capita GDP reflects the endowment and the investment capacity of the local economy, whereas per capita disposable income reflects residents’ purchasing power and their effective demand for health services.
To validate the model choice and to reveal the spatiotemporal heterogeneity of the drivers, the geographically and temporally weighted regression (GTWR) model was compared against the ordinary least squares (OLS) global baseline (Table 4). The GTWR model achieved a substantially higher R2 (0.610) and a lower corrected Akaike information criterion (AICc = −4252.68) than OLS (R2 = 0.332, AICc = −3596.80), confirming that exploiting the space–time dependence structure of the panel markedly improves the fit over a global, time-invariant specification. The estimation settings of the GTWR model, including the bandwidth selection criterion and the measurement of spatiotemporal distance, are described in Section 2.3.5.

3.4.2. Temporal Evolution and Spatial Differentiation of Drivers

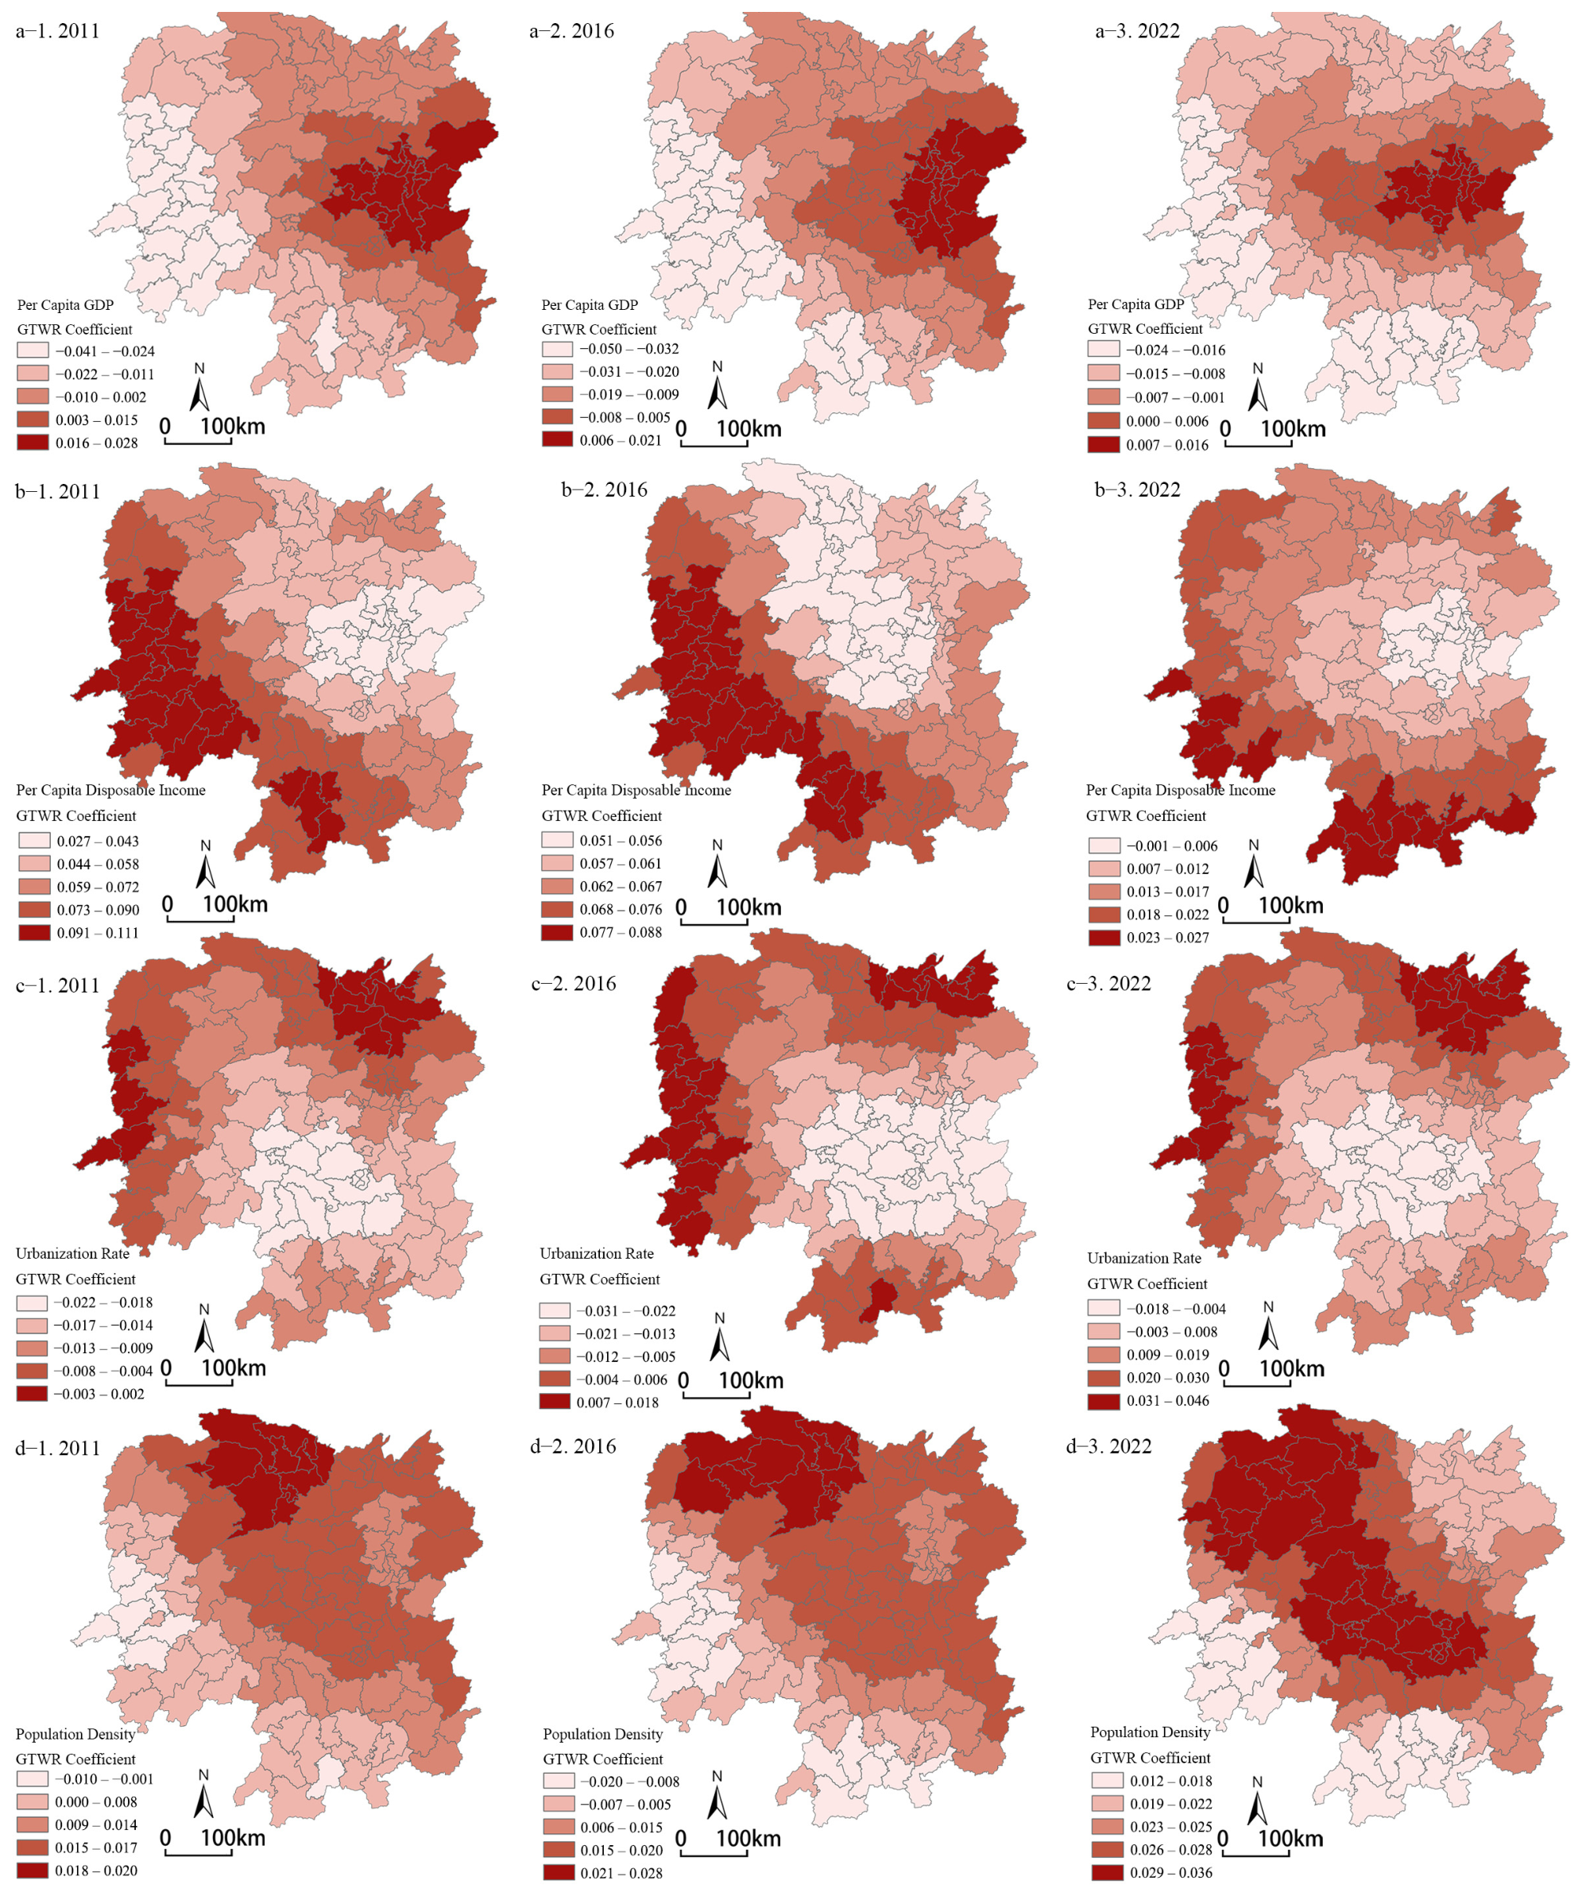
Based on panel data for 122 counties in Hunan Province from 2011 to 2022, the GTWR model was applied to analyze the spatiotemporally heterogeneous effects of the three driving factors. Coefficient maps at three time points (2011, 2016, and 2022) were used to illustrate the spatial differentiation of each factor (Figure 6).
(1)
Per capita GDP
The impact of per capita GDP on health resource allocation exhibited significant spatial heterogeneity. Positive effects were primarily concentrated in the Changsha–Zhuzhou–Xiangtan (CZT) region, indicating that the association between economic growth and improvements in health resource allocation was stronger in areas with higher levels of economic development. This may be attributed to the fact that higher economic development enhances regional resource supply capacity, providing better foundations for healthcare infrastructure construction, the recruitment of health professionals, and the improvement of healthcare service capacity.
In contrast, some counties in southern Hunan and the Greater Western Hunan region exhibited relatively weak or even negative effects. This does not imply that economic growth reduces health resource allocation; rather, it reflects a potential mismatch between economic development and improvements in healthcare services during certain stages of development. In less-developed regions, the ability of economic growth to translate into improved health resource allocation is relatively limited due to constraints related to industrial foundations, population agglomeration capacity, and the existing healthcare service system. Meanwhile, external institutional support and regional development policies may partially compensate for insufficient endogenous development capacity. For example, Xiangxi Tujia and Miao Autonomous Prefecture, as a key region for poverty alleviation, received continuous policy and financial support during the construction of its primary healthcare system. From 2010 to 2015, Xiangxi implemented 860 healthcare service system construction projects, receiving 631 million yuan in central government investment. Therefore, in some less-developed areas, improvements in health resource allocation are more likely to result from the combined effects of economic development and policy support rather than from local economic growth alone.
(2)
Per capita disposable income
Per capita disposable income generally exhibited a positive effect on health resource allocation, but the strength of this effect showed significant spatial heterogeneity. Specifically, the coefficients were relatively lower in the CZT region, while higher coefficients were observed in the Greater Western Hunan and southern Hunan regions. This indicates that income growth has a stronger promoting effect in areas with insufficient healthcare resources, whereas its marginal effect is weaker in regions where healthcare resources are relatively adequate.
In economically developed areas such as the CZT region, residents generally have higher income levels, and basic healthcare needs have been largely satisfied. Therefore, further income growth has a diminishing effect on the expansion of healthcare resource quantity, with its influence more likely reflected in improving healthcare service quality and upgrading healthcare demand structures. By contrast, residents in the Greater Western Hunan and southern Hunan regions generally have lower income levels, and some potential healthcare demands remain constrained by limited economic affordability. As residents’ incomes increase, their ability to pay for healthcare services improves, previously suppressed healthcare demands are gradually released, and the growth in demand further stimulates the expansion of healthcare facilities, health personnel, and other healthcare resources. Therefore, the positive effect of per capita disposable income on health resource allocation is more pronounced in regions with greater potential for healthcare demand growth and where basic healthcare needs remain insufficiently satisfied.
(3)
Urbanization rate
The effect of urbanization rate on health resource allocation demonstrated significant spatiotemporal heterogeneity. During the early stage of the study period, the coefficients of urbanization rate were negative in some counties. However, with the advancement of urbanization, the coefficients had become positive in most areas of Hunan Province by 2022.
From the perspective of spatial distribution, the CZT region and its surrounding counties showed relatively lower coefficients, whereas the Dongting Lake region, Greater Western Hunan, and southern parts of Hunan consistently maintained higher coefficients. The evolution of the direction of urbanization effects suggests that the relationship between urbanization and health resource allocation has strong stage-dependent characteristics. During the initial stage of urbanization, adjustments in population spatial distribution may lag behind the improvement of healthcare service systems. In some areas, population concentration in urban areas occurred faster than the adjustment of healthcare facilities, health personnel, and other service resources, resulting in weak or even negative associations between urbanization and health resource allocation. As urban systems gradually improved, the public service carrying capacity of county seats and regional central towns continued to increase. Urbanization gradually shifted from merely a process of population concentration to an important mechanism promoting the optimized allocation of public services. The increasing demand for healthcare services driven by population agglomeration further promoted healthcare infrastructure development and health workforce allocation. In the CZT region, the relatively advanced level of urbanization has already resulted in strong concentrations of population and public service resources, with a comparatively mature healthcare service system. Consequently, further urbanization has generated a diminishing marginal effect on the expansion of healthcare resources. In contrast, Greater Western Hunan, the Dongting Lake region, and southern Hunan remain in a stage of deepening urbanization. The development of county seats and central towns not only enhances population carrying capacity but also promotes the concentration of primary healthcare demand and the improvement of public service facilities. Therefore, urbanization exerts a stronger positive effect on health resource allocation in these regions.
(4)
Population density
Population density mainly exhibited a positive effect on health resource allocation, with significant spatiotemporal heterogeneity. High coefficient values were primarily concentrated in the Greater Western Hunan region and gradually expanded toward parts of eastern and southern Hunan. However, from the overall spatial pattern, Greater Western Hunan consistently maintained relatively high coefficients throughout the study period, indicating that population density played a more prominent role in influencing health resource allocation in this region.
As a type of public service aimed at meeting residents’ basic health needs, health resources should correspond to the scale of the population served. Higher population density indicates a greater concentration of healthcare demand within a given spatial unit, thereby generating stronger demand-driven support for healthcare facility distribution, health workforce allocation, and improvements in service capacity.
The relatively high coefficients of population density in Greater Western Hunan may be related to the relatively weak healthcare resource foundation in this region. In areas where healthcare supply capacity is limited, population size and its spatial distribution exert stronger constraints and incentives on health resource allocation. Consequently, population density demonstrates a more pronounced promoting effect on healthcare resource improvement in these regions.

4. Discussion

The results indicate that the overall level of healthcare resource allocation in Hunan Province steadily improved from 2011 to 2022, accompanied by a gradual reduction in inter-regional disparities, which is consistent with the development trajectory of China’s healthcare system [22]. Unlike previous studies that primarily relied on conventional measures such as the Gini coefficient or Theil index [44,45], this study further decomposed the sources of disparities using the Dagum Gini coefficient and found that transvariation density was the dominant contributor to regional disparities in healthcare resource allocation. This finding suggests that regional disparities are not primarily attributable to overall differences among the four major regions, but rather reflect substantial overlaps in county-level resource allocation patterns across different regions. Specifically, although the Chang-Zhu-Tan Region exhibited the highest overall level of healthcare resource allocation, it still contained counties with relatively lower allocation levels, such as Shaoshan, Yanling, and Lukou. Meanwhile, some regions with relatively lower average allocation levels, particularly southern and western Hunan, also included counties with comparatively higher levels of healthcare resource allocation, such as Hecheng District, Beihu District, and Louxing District. Further analysis reveals that this internal heterogeneity exhibits clear structural characteristics. Counties with relatively high levels of healthcare resource allocation are mainly concentrated in prefectural-level administrative centers and central urban districts, including Yuhua, Furong, Kaifu, and Yuelu districts in Changsha; Yueyanglou District in Yueyang; Wuling District in Changde; Heshan District in Yiyang; Beihu District in Chenzhou; Lengshuitan District in Yongzhou; Hecheng District in Huaihua; Louxing District in Loudi; and Jishou City in Xiangxi. These areas generally possess higher administrative status, stronger population agglomeration capacity, and greater economic carrying capacity, making them more likely to attract and concentrate healthcare resources. In contrast, counties with relatively low levels of healthcare resource allocation are mainly distributed in mountainous areas, border regions, and areas with relatively weak development foundations, including Yanling County, Guidong County, Shuangpai County, Jiangyong County, Zhongfang County, Guzhang County, Luxi County, Tongdao Dong Autonomous County, Jingzhou Miao and Dong Autonomous County, and Chengbu Miao Autonomous County. These areas are generally characterized by relatively remote locations, limited population agglomeration capacity, and weaker economic foundations, which constrain the improvement of healthcare resource allocation levels.
These findings carry direct policy implications. Because transvariation density dominates overall disparities, improving healthcare equity in Hunan Province requires not only reducing regional gaps but also addressing heterogeneous development conditions among counties within the same region. The GTWR results further indicate that the effects of economic development, residents’ income, urbanization, and population density on health resource allocation vary significantly across counties and over time. Therefore, policy interventions should be tailored according to county-specific development characteristics rather than adopting uniform strategies. For economically developed counties, such as those in the Changsha–Zhuzhou–Xiangtan region, where the positive effect of economic development on resource expansion has gradually weakened, policy priorities should shift from increasing resource quantity toward improving service quality and efficiency. In contrast, counties in southern Hunan and the Greater Western Hunan region, where economic development has shown weaker effects on healthcare resource improvement, should focus on strengthening the capacity to transform economic growth into healthcare service provision. Meanwhile, counties experiencing stronger effects of urbanization and population concentration should coordinate healthcare planning with population redistribution to improve the matching between healthcare supply and demand.
This study has several limitations. First, the analysis relies on statistical yearbook data, which capture the quantity of health resources but cannot reflect differences in service quality. The same number of hospital beds or physicians may represent substantially different service capacities across different tiers of medical institutions. Second, the county-level administrative unit is used as the analytical unit, yet residents routinely seek medical services across administrative boundaries. Resource allocation analysis based on administrative divisions may therefore underestimate the supply–demand mismatches arising from cross-county patient flows. Moreover, healthcare utilization is not completely constrained by administrative boundaries. Particularly in regions with relatively insufficient healthcare service capacity, residents may seek medical treatment across counties or even prefecture-level cities due to differences in medical quality, service capacity, and spatial accessibility. Existing studies have demonstrated that population mobility and spatial accessibility are important factors affecting healthcare equity, and that travel distance, transportation conditions, and time costs significantly influence residents’ actual opportunities to obtain healthcare services [46,47,48]. Therefore, analyses based solely on the spatial distribution of healthcare resources may not fully capture the relationship between resource allocation and residents’ actual healthcare accessibility. In addition, the availability of county-level data also constrains the selection of explanatory variables in the analysis of driving mechanisms. Due to limitations in data accessibility at the county scale, this study mainly considers socioeconomic and demographic factors, while some potentially important factors, such as healthcare service quality, population mobility, and residents’ healthcare-seeking behavior, could not be fully incorporated into the model.
Future research can be further improved in two directions. One is to incorporate transport accessibility and economic affordability into the analytical framework, comprehensively evaluating the accessibility of health resources by considering geographic distance, travel costs, and time costs. In particular, integrating patient flow data can help identify the actual utilization patterns of healthcare resources beyond administrative boundaries. The other is to integrate healthcare service quality indicators into the evaluation system within the context of the hierarchical diagnosis and treatment system, addressing the limitation of measuring allocation levels solely by per capita quantity.

5. Conclusions

This study measures the level of health resource allocation in Hunan Province from 2011 to 2022, analyzes the spatiotemporal pattern evolution characteristics of the allocation level and its equity, and explores the spatiotemporal heterogeneity of the effects of various influencing factors on the health resource allocation level in Hunan Province based on the Geographically and Temporally Weighted Regression (GTWR) model. The main conclusions are as follows:
(1)
Health resource allocation levels in Hunan Province showed a continuous improvement trend from 2011 to 2022, indicating an overall enhancement in county-level healthcare supply capacity. However, substantial spatial disparities persisted, with a stable pattern of higher allocation levels in eastern and northern regions than in western and southern regions. The Chang-Zhu-Tan Region remained the leading area in health resource allocation, whereas Southern Hunan and Western Hunan generally exhibited relatively lower levels. This spatial differentiation suggests that differences in regional development foundations continue to shape the uneven distribution of health resources across counties.
(2)
The disparities in the health resource allocation level in Hunan Province narrowed gradually from 2011 to 2022, with the Gini coefficient remaining below 0.3 throughout the study period, indicating a relatively low level of inequality. Inequality declined rapidly during the early stage and showed a slower decreasing trend thereafter. Dagum decomposition revealed that transvariation density was the primary contributor to overall disparities, with an average contribution of 53.58%, indicating that disparities mainly resulted from overlapping differences among counties rather than persistent gaps between regional groups. This finding suggests that spatial inequality in health resource allocation is characterized by complex cross-regional interactions rather than simple differences between high- and low-development regions.
(3)
The determinants of health resource allocation exhibited pronounced spatiotemporal heterogeneity. The effects of per capita GDP, per capita disposable income, urbanization rate, and population density varied across regions and development stages. Economic development showed stronger positive effects in developed areas, while income growth and urbanization played more prominent roles in regions with relatively insufficient healthcare resources. Population density generally exerted a positive influence, particularly in the Greater Western Hunan region. These findings indicate that the drivers of health resource allocation are context-dependent, requiring differentiated policy interventions across regions.

Author Contributions

Conceptualization, B.L. and H.T.; methodology, B.L. and J.Y.; software, J.Y.; validation, J.Y., X.H. and J.C.; formal analysis, J.Y.; investigation, B.L., X.H. and J.C.; resources, X.H.; data curation, J.Y. and J.C.; writing—original draft preparation, B.L.; writing—review and editing, H.T. and B.L.; visualization, B.L. and J.Y.; supervision, H.T.; project administration, H.T.; funding acquisition, H.T. All authors have read and agreed to the published version of the manuscript.

Funding

This research was funded by the National Social Science Fund of China (General Program), grant number 25BJL041; the Scientific Research Project of Hunan Provincial Department of Education, grant number 25A0541; and the Hunan Provincial Graduate Research Innovation Project, grant number CX20251709.

Institutional Review Board Statement

Not applicable.

Informed Consent Statement

Not applicable.

Data Availability Statement

The data presented in this study are derived from the Hunan Statistical Yearbook, Hunan Provincial County Statistical Yearbooks, and the Sixth and Seventh National Population Censuses of China. Further inquiries can be directed to the corresponding author.

Acknowledgments

The authors sincerely thank the editors and the anonymous reviewers for their constructive feedback and valuable suggestions, which have greatly contributed to the improvement of this manuscript.

Conflicts of Interest

Bin Leng is an employee of Yiyang Natural Resources Planning and Surveying Institute, and also serves as an adjunct supervisor at Hunan City University. The remaining authors declare that the research was conducted in the absence of any commercial or financial relationships that could be construed as potential conflicts of interest.

References

  1. Liao, S.M. Health (care) and human rights: A fundamental conditions approach. Theor. Med. Bioeth. 2016, 37, 259–274. [Google Scholar] [CrossRef] [Scilit] [PubMed]
  2. Amil, S.; Moulin, J.-A.; Gagnon, É. Towards a Vision of Sustainable Health: Definitions, Related Concepts and Key Dimensions. Sustainability 2026, 18, 3586. [Google Scholar] [CrossRef] [Scilit]
  3. Dai, G.; Li, R.; Ma, S. Research on the equity of health resource allocation in TCM hospitals in China based on the Gini coefficient and agglomeration degree: 2009–2018. Int. J. Equity Health 2022, 21, 145. [Google Scholar] [CrossRef] [Scilit] [PubMed]
  4. Zhu, B.; Hsieh, C.W.; Zhang, Y. Incorporating spatial statistics into examining equity in health workforce distribution: An empirical analysis in the Chinese context. Int. J. Environ. Res. Public Health 2018, 15, 1309. [Google Scholar] [CrossRef] [Scilit] [PubMed]
  5. Song, X.; Wei, Y.; Deng, W.; Zhang, S.; Zhou, P.; Liu, Y.; Wan, J. Spatio-temporal distribution, spillover effects and influences of China’s two levels of public healthcare resources. Int. J. Environ. Res. Public Health 2019, 16, 582. [Google Scholar] [CrossRef] [Scilit] [PubMed]
  6. Deng, Y.; Feng, L.; Cenci, J.; Zhang, J.; Cai, J. Analysis of Spatial and Driving Factors of National Sanitary Resources in China Using GIS. ISPRS Int. J. Geo-Inf. 2025, 14, 186. [Google Scholar] [CrossRef] [Scilit]
  7. Chang, M.; Huang, L.; Zhai, T.; Zhu, J.; Ma, Y.; Li, L.; Zhao, C. A challenge of sustainable urbanization: Mapping the equity of urban public facilities in multiple dimensions in Zhengzhou, China. Land 2023, 12, 1545. [Google Scholar] [CrossRef] [Scilit]
  8. Liu, L.; Xu, W.; Su, Y.; Zhou, X. Evaluation of health resource allocation efficiency based on data envelopment analysis 2014–2018 in two dimensions of time-region. Discret. Dyn. Nat. Soc. 2021, 2021, 8273415. [Google Scholar] [CrossRef] [Scilit]
  9. Bartley, M.; Blane, D.; Smith, G.D. Introduction: Beyond the Black Report. Sociol. Health Illn. 1998, 20, 563–577. [Google Scholar] [CrossRef]
  10. Xing, Y.; Guo, Y. Research progress on health equity. Hosp. Manag. Forum 1999, 4, 160–165. [Google Scholar]
  11. The State Council of the People’s Republic of China. The Outline of the Healthy China 2030 Plan; The State Council of the People’s Republic of China: Beijing, China, 2016. Available online: https://www.gov.cn/zhengce/2016-10/25/content_5124174.htm (accessed on 24 May 2026).
  12. Healthy China Action Promotion Committee. Healthy China Action Plan (2019–2030); Healthy China Action Promotion Committee: Beijing, China, 2019. Available online: https://www.nhc.gov.cn/guihuaxxs/c100133/201907/2a6ed52f1c264203b5351bdbbadd2da8.shtml (accessed on 24 May 2026).
  13. Gong, S.S.; Wang, W.W.; Yang, L.S.; Chai, Y.W.; Zhou, S.H.; Huang, L.; Cheng, Y.; Ge, M.; Luo, Y. The key fields and action suggestions of geography participating in the construction of Healthy China. Acta Geogr. Sin. 2022, 77, 1851–1872. [Google Scholar] [CrossRef]
  14. Dummer, T.J.B. Health geography: Supporting public health policy and planning. Can. Med. Assoc. J. 2008, 178, 1177–1180. [Google Scholar] [CrossRef] [Scilit] [PubMed]
  15. Du, T.; Li, J.; Qiao, Y. DEA-based centralized resource allocation with a balance between efficiency and equity: Evidence from healthcare services across 31 provinces in China. Health Care Manag. Sci. 2025, 28, 119–141. [Google Scholar] [CrossRef] [Scilit] [PubMed]
  16. He, Z.; Chen, L.; Ghairpour, M. The Distribution, Accessibility, and Equity of Primary Care Facilities in China—A Nationwide Analysis Based on POI and High-Resolution Population Data. Healthcare 2026, 14, 2109. [Google Scholar] [CrossRef] [Scilit] [PubMed]
  17. Zheng, J.; Hu, T.; Xu, S.; Xiao, J.; Xiong, C. Regional Disparities and Associated Factors Underlying CDC Health Professional Distribution in China. Healthcare 2026, 14, 1079. [Google Scholar] [CrossRef] [Scilit] [PubMed]
  18. Zhou, M. Equity and efficiency of public health resource allocation in China. BMC Public Health 2025, 25, 283. [Google Scholar] [CrossRef] [Scilit] [PubMed]
  19. Chen, Y.; Li, Q.; Zhang, Y.; Zhang, X.; Zheng, H. Investigating the Efficiency of Medical and Health Resources and Its Influencing Factors in the Yangtze River Delta Urban Agglomerations: Based on the Undesirable Super-Efficiency SBM-Malmquist-Tobit Model. Front. Public Health 2025, 13, 1527424. [Google Scholar] [CrossRef] [Scilit] [PubMed]
  20. Shen, Y.; Sun, Z. Estimating the Spatial Correlation and Convergence of China‘s Healthcare Resources Allocation: Evidence from the Yangtze River Delta Region. Arch. Public Health 2022, 80, 207. [Google Scholar] [CrossRef] [Scilit] [PubMed]
  21. He, Y.T.; Zhang, Y.C.; Wu, R.K.; Huang, W.; Wang, R.N.; He, L.X.; Li, B.; Zhang, Y.L. Dynamic Evolution and Spatial Difference of Public Health Service Supply in Economically Developed Provinces of China: Typical Evidence from Guangdong Province. BMC Health Serv. Res. 2024, 24, 23. [Google Scholar] [CrossRef] [Scilit] [PubMed]
  22. Yin, S.; Liu, Z.; Yu, S.; Li, Y.; An, J.; Wang, D.; Yan, H.; Xiao, Y.; Xu, F.; Tian, Y.; et al. Geographic Variations, Temporal Trends, and Equity in Healthcare Resource Allocation in China, 2010–2021. J. Glob. Health 2025, 15, 04008. [Google Scholar] [CrossRef] [Scilit] [PubMed]
  23. Ren, H.; Li, C.; Huang, Y. Spatial and Temporal Analysis of China’s Healthcare Resource Allocation Measurements Based on Provincial Data: 2010–2021. Front. Public Health 2023, 11, 1269886. [Google Scholar] [CrossRef] [Scilit] [PubMed]
  24. Li, Q.; Wei, J.; Jiang, F.; Zhou, G.; Jiang, R.; Chen, M.; Zhang, X.; Hu, W. Equity and Efficiency of Health Care Resource Allocation in Jiangsu Province, China. Int. J. Equity Health 2020, 19, 211. [Google Scholar] [CrossRef] [Scilit] [PubMed]
  25. Zhou, M. Equity and efficiency of health resource allocation in township health centers in Sichuan Province, China. PLoS ONE 2024, 19, e0299988. [Google Scholar] [CrossRef] [Scilit] [PubMed]
  26. Deng, J.; Lü, T.; Song, Q. Impact Mechanisms and Spatial Effects of New Quality Productive Forces on Healthcare Resource Allocation in China. Sci. Rep. 2026, 16, 51225. [Google Scholar] [CrossRef] [Scilit] [PubMed]
  27. Liu, T.; Li, J.; Chen, J.; Yang, S. Regional Differences and Influencing Factors of Allocation Efficiency of Rural Public Health Resources in China. Healthcare 2020, 8, 270. [Google Scholar] [CrossRef] [Scilit] [PubMed]
  28. Samani, Z.N.; Alesheikh, A.A.; Karimi, M.; Samany, N.N.; Bayat, S.; Lotfata, A.; Garau, C. Advancing Urban Healthcare Equity Analysis: Integrating Public Participation GIS with Fuzzy Best–Worst Decision-Making. Sustainability 2024, 16, 1745. [Google Scholar] [CrossRef] [Scilit]
  29. Wolbring, G.; Deloria, R. Health Equity and Health Inequity of Disabled People: A Scoping Review. Sustainability 2024, 16, 7143. [Google Scholar] [CrossRef] [Scilit]
  30. Gong, Y.; Ma, D.; Feng, W. Study on the allocation efficiency of medical and health resources in Hainan Province: Based on the super-efficiency SBM—Malmquist model. PLoS ONE 2024, 19, e0294774. [Google Scholar] [CrossRef] [Scilit] [PubMed]
  31. Zhou, M. Equity and prediction of health resource allocation of traditional Chinese medicine in China. PLoS ONE 2023, 18, e0290440. [Google Scholar] [CrossRef] [Scilit] [PubMed]
  32. Cieślak, I.; Eźlakowski, B.; Biłozor, A.; Senetra, A. Spatial Analysis of Medical Service Accessibility in the Context of Quality of Life and Sustainable Development: A Case Study of Olsztyn County, Poland. Sustainability 2025, 17, 6687. [Google Scholar] [CrossRef] [Scilit]
  33. Zhou, Q.Y.; Gao, X.; Shi, P.W.; Shen, Q.H.; Zhang, Z.Y.; Chen, Z.; Pu, C.; Xu, L.; Hu, Z.; Ma, A.; et al. The connotation of public health and public health system. Health Dev. Policy Res. 2021, 24, 662–667. [Google Scholar] [CrossRef]
  34. Ding, L.; Wang, J.P.; Hu, N.S. Equity performance evaluation for resource allocation in urban senior care organization from the perspective of health equity: A case study of Wuhan. Mod. Urban Res. 2022, 8, 1–7. [Google Scholar]
  35. Wang, W.; Chen, X.; Yang, L. Research on the allocation effect and optimization path of grassroots level medical and health resources in Medical Cluster. Chin. Hosp. 2023, 27, 38–42. [Google Scholar] [CrossRef]
  36. Yu, B.H.; He, C. Researches on the regional medical service level measurement model based on D-S evidence theory. Chin. Health Serv. Manag. 2021, 38, 888–893. [Google Scholar]
  37. Ma, Y.; Xiao, P.; Yu, L.; Ni, H.; Huang, S.; Wang, M.; Huang, Y.; Li, L.; Yang, L.; Tan, C.; et al. The allocation and fairness of health human resources in Chinese maternal and child health care institutions: A nationwide longitudinal study. BMC Health Serv. Res. 2023, 23, 151. [Google Scholar] [CrossRef] [Scilit] [PubMed]
  38. Ma, M.; Shi, L.; Xie, W.; Zhu, Q.; Luo, J.; Liao, S.; Xia, O.; Sun, G. Coupling Coordination Degree of Healthcare Resource Supply, Demand and Elderly Population Change in China. Int. J. Equity Health 2024, 23, 147. [Google Scholar] [CrossRef] [Scilit] [PubMed]
  39. Lenzen, S.; Birch, S. From Population Numbers to Population Needs: Incorporating Epidemiological Change into Health Service Planning in Australia. Soc. Sci. Med. 2023, 328, 115972. [Google Scholar] [CrossRef] [Scilit] [PubMed]
  40. Zhang, X.; Feng, T.; Wang, C.; Li, C. Local Fiscal Pressure and Public Health: Evidence from China. Int. J. Environ. Res. Public Health 2023, 20, 5126. [Google Scholar] [CrossRef] [Scilit] [PubMed]
  41. Ebrahimi, S.; Golkar, B.; Motwani, J. Toward Sustainable Land Use: Exploratory Spatial Analysis of Conservation Reserve Program Participation in the U.S. Midwest. Sustainability 2026, 18, 3567. [Google Scholar] [CrossRef] [Scilit]
  42. Deng, G.; Sun, L. Regional Disparities and Spatiotemporal Evolution of Data Element Development in China’s Eight Comprehensive Economic Regions. Sustainability 2026, 18, 3595. [Google Scholar] [CrossRef] [Scilit]
  43. Di, X.; Zhang, J. Spatiotemporal Heterogeneity of Influencing Factors for Urban Spaces Suitable for Running Workouts Based on Multi-Source Big Data. ISPRS Int. J. Geo-Inf. 2025, 14, 366. [Google Scholar] [CrossRef] [Scilit]
  44. Li, Q.; Zheng, S.; Jing, Z.; Chen, D.; Chen, K.; Li, Y. Research on the equity of health manpower resource allocation in the Yangtze River Delta region. Front. Public Health 2025, 13, 1650147. [Google Scholar] [CrossRef] [Scilit] [PubMed]
  45. Wu, F.; Chen, W.; Lin, L.; Ren, X.; Qu, Y. The Balanced Allocation of Medical and Health Resources in Urban Areas of China from the Perspective of Sustainable Development: A Case Study of Nanjing. Sustainability 2022, 14, 6707. [Google Scholar] [CrossRef] [Scilit]
  46. Xia, J.; Ye, P.; Pan, L.; Zhang, D.; Wu, Z.; Deng, Q.; Chen, X.; Li, Q.; Ratti, C.; Batty, M.; et al. Mobile phone data show spatial and socioeconomic inequalities in hospital utilization. Nat. Health 2026, 1, 760–769. [Google Scholar] [CrossRef] [Scilit]
  47. Tang, D.; Bu, T.; Liu, Y. Mobility-related inequality in healthcare utilization between floating and native populations and its influencing factors: Evidence from China. Int. Health 2022, 14, 475–484. [Google Scholar] [CrossRef] [Scilit] [PubMed]
  48. Zhao, P.; Li, J.; Zhang, M. Unequal roles of cities in the intercity healthcare system. Nat. Cities 2025, 2, 198–209. [Google Scholar] [CrossRef] [Scilit]
Figure 1. Overview of the study area.
Sustainability 18 08760 g001
Figure 2. Spatial patterns of health resource allocation levels from 2011 to 2022.
Sustainability 18 08760 g002
Figure 3. Trend surface analysis of health resource allocation in Hunan Province, 2011–2022.
Sustainability 18 08760 g003
Figure 4. Spatial distribution of hot spots and cold spots of health resource allocation in Hunan Province, 2011–2022.
Sustainability 18 08760 g004
Figure 5. Evolution of equity and disparity contributions of health resource allocation in Hunan Province.
Sustainability 18 08760 g005
Figure 6. Spatiotemporal variations in the determinants of health resource allocation in Hunan Province ((a-1) Per capita GDP, 2011; (a-2) Per capita GDP, 2016; (a-3) Per capita GDP, 2022; (b-1) Per capita disposable income, 2011; (b-2) Per capita disposable income, 2016; (b-3) Per capita disposable income, 2022; (c-1) Urbanization rate, 2011; (c-2) Urbanization rate, 2016; (c-3) Urbanization rate, 2022; (d-1) Population density, 2011; (d-2) Population density, 2016; (d-3) Population density, 2022).
Sustainability 18 08760 g006
Table 1. Evaluation indicator system for health resource allocation.
Indicator LayerElementAttributeWeight
Population Age Structure (0.1924)Proportion of population aged 0–14 (%)Negative0.0250
Proportion of population aged ≥65 (%)Negative0.0325
Facility Support Level (0.2595)Healthcare institutions per 10,000 populationPositive0.0884
Hospital beds per 10,000 populationPositive0.1040
Healthcare Workforce (0.5155)Licensed (assistant) physicians per 10,000 populationPositive0.1088
Registered nurses per 10,000 populationPositive0.1507
Pharmacists per 10,000 populationPositive0.0925
Medical technicians per 10,000 populationPositive0.1095
Other healthcare staff per 10,000 populationPositive0.2101
Public Expenditure Level (0.0325)Per capita local fiscal budget (10,000 CNY)Positive0.0784
Table 2. Variable definitions and measurements.
Variable TypeDimension and VariableDefinition and Measurement
Dependent VariableHealth Resource Allocation LevelComposite index representing regional healthcare resource allocation capacity under demographic and socioeconomic conditions
Explanatory VariablesSocio-economic Development LevelPer Capita GDPAnnual regional GDP/average population
Resident Income LevelPer Capita Disposable Income(Total income − individual income tax and social security expenditures)/total population
Urbanization LevelUrbanization RateUrban population/total population
Population agglomerationPopulation DensityPermanent resident population/area (persons per km2)
Table 3. Multicollinearity diagnostics.
VariableVIF
Per capita GDP2.764
Urbanization rate2.534
Population density1.647
Per capita disposable income2.902
Mean VIF2.462
Note: A VIF value above 10 is conventionally regarded as an indication of severe multicollinearity.
Table 4. Comparison of the OLS and GTWR models.
OLSGTWR
R20.3320.610
Adjusted R20.3300.590
AICc−3596.80−4252.68
Note: R2 and Adjusted R2 indicate goodness of fit; higher values indicate better fit. AICc refers to the corrected Akaike Information Criterion; lower values indicate a better trade-off between fit and model complexity.
Disclaimer/Publisher’s Note: The statements, opinions and data contained in all publications are solely those of the individual author(s) and contributor(s) and not of MDPI and/or the editor(s). MDPI and/or the editor(s) disclaim responsibility for any injury to people or property resulting from any ideas, methods, instructions or products referred to in the content.