Article

Coupling Coordination Evolution and Obstacle Factors Between Aboveground and Underground Public Spaces in Old Urban Districts: A Case Study of Shanghai, China


Landscape Architecture Department, Huazhong Agricultural University, Wuhan 430070, China
*
Author to whom correspondence should be addressed.
Sustainability 2026, 18(17), 8756; https://doi.org/10.3390/su18178756
Submission received: 13 July 2026 / Revised: 20 August 2026 / Accepted: 24 August 2026 / Published: 26 August 2026

Abstract

Old urban areas face severe spatial supply–demand contradictions as aboveground space nears saturation while public service demand grows. Developing underground public spaces offers a key solution, yet fragmented development limits overall benefits, necessitating coordinated aboveground–underground development to achieve urban renewal and sustainability. Taking Shanghai’s old urban areas as a case, this study constructs an evaluation system with 17 aboveground indicators across 5 dimensions and 9 underground indicators across 3 dimensions. Using the combination of AHP–entropy weight method for weighting, the coupling coordination degree model, and the obstacle degree model, this study identifies the temporal evolution trends in the development levels of the two systems, the characteristics of their coupling coordination stages, and the main constraining factors from 1995 to 2025. The results show: (1) Both systems have shown continuous growth, with underground public space accelerating its development after 2010, and by 2015, it had nearly caught up with the aboveground system in the time-series projection results; (2) The D value of coupling coordination has increased from 0.2431 to 0.9532, experiencing three stages of low coupling coordination, general coupling coordination, and high coupling coordination; (3) The obstacle factors have shown a dynamic evolution path from scale shortage to morphological complexity, and then to the synergy of the aboveground and underground morphologies. In the higher coupling coordination stage, the length of the aboveground bus lines and the landscape shape index of the underground became the dominant obstacles. This study provides a quantitative basis for coordinated planning and decision-making in the renewal of old urban areas.

1. Introduction

1.1. Research Background

Currently, the global urbanization process has generally entered the “urban renewal” era centered on improving the quality of existing urban areas. Promoting the functional reconfiguration and quality enhancement of the built environment has become the main path for achieving sustainable urban development [1,2]. Against this backdrop, as the core carrier of urban historical context, the renovation and upgrading of old urban areas are particularly important, but they also face the most complex challenges. On one hand, their profound historical and cultural value requires that the renovation process must be based on protection and inheritance, limiting the possibility of large-scale demolition and reconstruction. On the other hand, these areas generally have problems of material aging (inadequate infrastructure, damaged buildings) and functional decline (low-level business types, insufficient public spaces) [3]. The building density in old urban areas is close to the limit, and the available increment of land is almost non-existent, making it difficult to implement public service facilities and optimize the transportation system, seriously restricting their sustainable development capabilities [4].
From a national perspective, China’s urbanization process shows a clear trend of continuous concentration of population and economic activities towards megacities. The eastern region east of the Hu Huanxiong Line accommodates over 93% of the population with less than 43% of the total land area. This spatial pattern has made the land supply–demand contradiction in the eastern megacities increasingly acute. As the core city of the Yangtze River Delta urban agglomeration, Shanghai, with its old urban areas, is facing land constraints, which is a typical manifestation of this national-scale structural pressure. In this context, exploring a three-dimensional spatial development path is not only a local planning response but also an inevitable choice to address the macro-level structural challenges of urbanization [5]. This has made the contradiction between space supply and demand a core problem that must be solved in the renovation of old urban areas [6].
Under the hard constraints of land resources, seeking vertical space development has become an inevitable choice. Among them, “reclaiming space from underground” is regarded as a key strategic path to break through the spatial bottlenecks of old urban areas and achieve intensive development and functional supplementation [7]. Compared with the renewal of aboveground space, underground space development can effectively avoid the destruction of historical features, and by accommodating functions such as transportation, commerce, municipal services, and disaster prevention, it significantly improves the spatial efficiency, functional complexity, and safety resilience of the urban area [8]. Therefore, incorporating underground space into the overall framework of old urban area renewal is an inevitable requirement for achieving its organic renewal and sustainable development.
Although the strategic value of underground space is prominent, in practice, the development of underground space in old urban areas often presents a “fragmented” state, lacking systematic planning, resulting in functional disconnection between underground spaces and between underground and aboveground systems, and low collaborative benefits [9]. The root cause of this fragmented development lies in the lack of in-depth understanding of the complex interactions between the aboveground system and underground space, making it difficult to form an integrated planning concept. Therefore, how to scientifically assess the development levels of the aboveground and underground systems and reveal the collaborative evolution laws between them has become a key issue that needs to be urgently addressed.

1.2. Literature Review

1.2.1. Research Progress on Coordinated Development of Aboveground and Underground Spaces

The coordinated development of aboveground and underground spaces has become a significant topic in urban research in recent years. Early studies mainly focused on engineering technology and development models of underground spaces, concentrating on the feasibility analysis of single points or individual projects [10]. With the popularization of the theories of “three-dimensional cities” and “compact cities”, the research perspective gradually shifted to the coordinated development and integration of the two [11]. The research content has gradually progressed from the exploration of the impact of macro urban indicators on underground space development [12] to the functional coupling, spatial connection, environmental interaction, and integrated design methods at the meso-micro level [13]. At the theoretical research level, some scholars have explored the connection mechanism between underground transportation, commercial facilities, municipal facilities, and the aboveground urban functions from the perspective of functional coupling [14]. Relevant studies have shown that a reasonable configuration of aboveground and underground functions can effectively alleviate ground traffic pressure, improve land-utilization efficiency, and enhance the urban living environment [15]. At the planning practice level, many cities around the world have carried out explorations of integrated planning of aboveground and underground spaces, such as the “underground city” concept in Tokyo, Japan [16], the “underground city” network in Montreal, Canada [17], and the People’s Square underground complex in Shanghai, China [18], etc., accumulating rich practical experience.
It is worth noting that in recent international urban studies, the focus of discussions on underground space has shifted from the initial aspects of engineering feasibility and functional integration to the dimension of its relationship with the overall urban system. Relevant literature has gradually focused on the supporting mechanisms of underground space for urban resilience [19], the technical paths for intelligent underground space management [20], the morphological issues within the framework of three-dimensional urban planning [21], and the governance scale and responsibility coordination issues in underground space development [22]. These advancements indicate that the research on underground space is shifting from “how to develop” to “how to integrate into the urban system and coordinate governance”. However, the aforementioned new debate still mainly treats underground space as a single-sided object, failing to examine the co-evolution of the underground system and the aboveground system within the same coupled framework. This gap not only manifests as a deficiency in theoretical integration but also is reflected at the methodological level in the lack of quantitative measurement tools and the absence of a dynamic evolution perspective. This constitutes the starting point of the issues that this study aims to address.

1.2.2. The Application of Coupling Coordination Degree Model in Urban Research

The coupling coordination degree model originated from physics and was initially used to describe the degree of mutual influence and interaction between two or more systems. This model calculates two indicators, namely coupling degree and coupling coordination degree, which can not only reflect the strength of interaction between systems but also determine whether they are developing in a benign resonance or a malignant restrictive state. It effectively overcomes the misleading problem that may arise from the simple coupling degree [23].
In recent years, the coupling coordination degree model has been widely applied in urban research and has gradually become a classic tool for analyzing the relationships of complex systems. In the study of economic–environmental relationships, this model is used to reveal the interactive stress relationship between urbanization and ecological environment and its phased evolution characteristics [24]; in the study of urban–rural development, this model is used to measure the collaborative promotion effect of new urbanization and rural revitalization [25]; in the study of land use, this model is used to assess the coordination between urban construction land expansion and population growth [26]. These studies fully confirm the significant applicability and effectiveness of the coupling coordination degree model in analyzing the coordinated development relationship between binary and multi-systems.
Based on this, the coupling coordination degree model provides an applicable methodological tool for analyzing the coordinated development of aboveground and underground public spaces. The relationship between the aboveground system and the underground public space essentially meets the application conditions of the coupling coordination degree model. Both exist in an interdependent relationship, where the underground space carries the overflow demand of the aboveground function, and the aboveground system provides continuous demand support for the underground space; there may also be different development rhythms, especially in old urban areas, where the development level of underground public space often lags behind that of the aboveground system. The coupling coordination degree model can simultaneously depict the intensity and direction of this interaction, laying a methodological foundation for subsequent quantitative analysis of the coordinated evolution laws of aboveground and underground public spaces.

1.2.3. Theoretical Basis for the Coupling and Coordination of the Aboveground and Underground Systems

The above literature review indicates that the research on aboveground systems and underground spaces has long been in a separate state. The aboveground research focuses on urban renewal and functional optimization, while the underground research emphasizes engineering technology development and utilization patterns. However, from a systems theory perspective, aboveground and underground spaces are not two isolated domains but rather two subsystems that are interdependent and mutually restrictive within the urban three-dimensional space system. This understanding is based on the following theories:
(1)
The city as a complex adaptive system
The city is a complex system composed of multiple subsystems such as economy, society, space, and environment [27]. The aboveground and underground public spaces, as two components of the urban spatial subsystems, share the same set of demand-driven factors, such as population, transportation, and commercial activities, and are simultaneously constrained by the same set of institutional arrangements such as planning regulations and land policies. The evolution of the two is not independent of each other but is achieved through the interaction of human flow, logistics, information flow, and capital flow, achieving mutual coupling. Therefore, regarding aboveground and underground public spaces as a coupled system has ontological rationality.
(2)
Three-dimensional urbanization and vertical space production
Under the hard constraint of land resources, urban growth has shifted from horizontal expansion to vertical extension, and underground space development has become an important dimension of three-dimensional urbanization [28]. Lefebvre’s space production theory states that space is not only a container for social activities but also a product of capital and power operations [29]. The development of underground space essentially extends the production of space to the vertical dimension of the city. It involves the interaction among three forces: national-level planning and regulation, capital-level real estate development, and public usage demands at the social level. This vertical space production makes aboveground and underground no longer a simple superimposed physical relationship but an organic whole with complementary functions and value linkage.
(3)
The holistic view of urban morphology
The urban morphology theory emphasizes that urban form is the physical accumulation of historical processes and functional demands [30]. The texture features of the aboveground built environment, such as the road network pattern, plot boundaries, and building density, directly restrict the developable area and the morphological characteristics of the underground space. Conversely, the large-scale development of underground space will also feed back and reshape the functional layout and spatial structure of the aboveground area. Therefore, the coordinated evolution of the aboveground and underground forms constitutes a natural extension of urban morphology research.
Based on the above theory, this study regards the aboveground system and the underground public space system as the two core subsystems of the urban three-dimensional space system. The two mainly achieve coupling through two paths. First, the continuous growth of the aboveground system in terms of economic activities, population concentration, and transportation demands constitutes the direct driving force for the development of underground public spaces, prompting the underground public spaces to respond in terms of functional types, spatial scale, and service capabilities. Second, the spatial form characteristics of the aboveground built environment impose structural constraints on the distribution pattern and morphological complexity of underground public spaces, and the expansion and morphological evolution of underground public spaces will also have feedback effects on the functional organization and spatial structure of the aboveground area. The study adopts the coupling coordination degree model to quantitatively depict the interaction intensity between these two subsystems and the evolution laws of their coordinated development level.
In summary, the existing literature still has significant deficiencies in the following aspects. First, the research on aboveground and underground public spaces has long been separated into the fields of urban renewal and underground engineering, lacking systematic research that examines the interaction between the two from the same analytical framework. Second, existing coupling coordination degree studies mostly focus on traditional binary systems such as economy–environment and urbanization–ecology, and they rarely apply them to the vertical dimension of the urban three-dimensional space system. Third, existing studies are mostly static cross-sectional analyses or short-term comparisons, failing to reveal the dynamic evolution laws of the coordination relationship between aboveground and underground public spaces in the long-term urbanization process and the underlying driving mechanisms.
Based on this, the research does not simply apply the coupling coordination degree model to a new research object but attempts to answer the following three questions: (1) Over a period of 30 years, how has the coordination relationship between aboveground and underground public spaces in the old urban area of Shanghai undergone phased evolution? (2) When did this evolution occur structurally, and what were the key policies or event triggers behind it? (3) Which structural factors dominated the evolution path of this coordination relationship? By answering these questions, this study aims to provide an analytical framework with both temporal depth and mechanism explanation for understanding the coordinated development of urban three-dimensional space.

1.3. Research Objectives and Research Hypotheses

Based on the above theoretical framework and literature review, the core research question of this paper is: During the urban renewal process in the old urban area of Shanghai from 1995 to 2025, how has the coordination relationship between the aboveground system and the underground public space undergone phased evolution? To what extent has the improvement in coordination been driven by structural factors such as urbanization, economic growth, spatial transformation, and public intervention?
Regarding this question, this study proposes two research hypotheses:
(1)
The coupling coordination degree between the aboveground systems and the underground public spaces shows a non-linear upward trend during the urban renewal process. Moreover, important policy events (such as the 2010 Shanghai World Expo and the 2021 “Shanghai Urban Renewal Regulations”) have a temporal correspondence with the stage transitions of the coupling coordination.
(2)
The level of economic development, infrastructure construction and policy, and institutional provision may be the key factors driving the improvement of coupling coordination, while spatial form characteristics mainly play a structural constraining role.
To test these hypotheses, this study constructs a multi-dimensional evaluation index system for the aboveground system and the underground public space, uses the analytic hierarchy process–entropy weight method to determine the weights of the indicators, introduces the coupling coordination degree model to calculate the coupling degree and coupling coordination degree of the two systems at different time sections, and uses the obstacle degree model to identify the obstacle factors. An empirical analysis is conducted using the old urban area of Shanghai from 1995 to 2025 as a case, aiming to provide an analytical framework with both temporal depth and mechanism explanation for understanding the coordinated development of the urban three-dimensional space.

2. Data and Methods

2.1. Research Area and Data Sources

2.1.1. Overview of the Research Area

Compared with the newly developed urban areas that were built later, the old urban areas usually refer to the central urban areas that were developed and constructed in the early history of the city. For example, 1990 was a significant turning point in China’s urbanization process. The establishment of the paid land-use system led to the entry of urban construction and development into a new peak period of new city construction with a growth-oriented approach, and the urbanization process accelerated [31,32]. The urban built-up areas before this period often carried historical cultural memories, traditional functional layouts, and early infrastructure systems of the city, featuring distinct characteristics of old urban areas. In addition, considering the existing situation where the old city areas delineated by the government are mostly located within the urban built-up areas of 1990 (for example, the old urban areas in Beijing and Nanjing overlap significantly with the urban built-up areas of 1990), based on the above principles and characteristics, this paper uses the central area of Shanghai as the overlay of the 1990 urban built-up area and eliminates the smaller fragmented polygons to define the research area of the old urban areas for this study [33,34] (Figure 1).
The development of underground space in Shanghai began with the construction of civil defense projects in the 1960s [35]. After the 1990s, large-scale old city renovations, new district constructions, and rail transit projects led to a rapid expansion of underground space development in Shanghai. As of 28 March 2023, there are 43,168 underground projects in Shanghai, with a total area of nearly 150 million square meters [36], mainly divided into three categories: production and living service facilities, public infrastructure, and rail transit facilities. The large-scale development of underground space has made up for the shortage of urban space resources, making Shanghai one of the cities with the largest scale of underground space development in China [37].
The “Shanghai Urban Renewal Regulations” implemented on 1 September 2021, clearly state that the comprehensive coordination and integrated improvement and renovation of aboveground and underground spaces should be carried out to improve the efficiency of urban space resource utilization [38], indicating that Shanghai has entered an intensive development stage based on existing resources. Optimizing the development of underground space and assisting in Shanghai’s urban renewal construction has become an urgent issue to be addressed [39]. Due to the constraints of historical style protection of old urban areas, fragmented land use, and aging infrastructure, the development of underground public spaces presents characteristics such as supplementary service functions and shallow development, lack of connectivity between underground and surface spaces, insufficient coordination between underground and surface spaces, and single-usage functions. It cannot meet the needs of economic and life development in the new era.

2.1.2. Data Sources and Processing

(1)
Urban statistical data
These reflect the broader urban development background of the old urban areas and are all derived from authoritative data released by the government and official sources to ensure authenticity and reliability. Statistical data not specifically noted are sourced from the “Shanghai Statistical Yearbook” [40] and the “Statistical Bulletin on the Development of Shanghai’s National Economy and Society” [41], while the data on the completed area of urban renovation come from the Shanghai Water Affairs Bureau (Shanghai Ocean Bureau) [42]. Due to the constraints of the data-release conditions, the vector data of underground public spaces in this study are strictly limited to the boundaries of the designated old urban areas; however, the socio-economic statistical indicators of the aboveground system lack a long-term time series dataset that strictly matches the boundary of the study area and is at the district level. Therefore, the statistical indicators of the aboveground system adopt the publicly available municipal-level data of Shanghai as proxy variables to be substituted in the evaluation calculation. Using the municipal-level data to represent the local old urban areas will inevitably have inherent spatial scale incompatibility problems: the city-wide indicators will smooth out the internal differences in social economy between the old urban areas and other areas of Shanghai, which may cause systematic biases in the overall score U1 of the aboveground system. Due to the limitation of the public historical statistical data, it is currently difficult to obtain a long-term time series panel of district-level statistics that strictly match the study boundary; the analysis conclusion of this paper is based on the assumption that “municipal indicators can approximately represent the time series evolution trend of the aboveground system of the old urban areas”, and the conclusion focuses on the relative change trend of the time series rather than the absolute precise measurement of the development level of the study area aboveground. Due to the influence of the lag in data release, the statistics of Shanghai in 2025 have not been published yet, and the study uses time series extrapolation estimation for the aboveground system indicator data in 2025: based on the data from 1995 to 2024, four fitting forms, including linear, quadratic, cubic polynomial, and exponential smoothing, are, respectively, attempted for each indicator. The selection criteria are: (1) the highest goodness-of-fit R2; (2) the predicted values fall within the reasonable extension range of historical data; (3) the residual sequence has no obvious autocorrelation. Finally, the estimated value is obtained using the cubic polynomial.
(2)
Underground public space data
The “underground public space” in the study refers to the underground space that is open to the public and undertakes collective functions such as transportation, commerce, and public services, including subway station halls, underground passages, underground shopping malls, public underground parking lots, and underground cultural and sports facilities. Spaces such as private residential basements, internal facilities for enterprises, and dedicated equipment corridors that are not open to the public are not included in the study scope. Through the map API service of the Gaode Map Open Platform, POI data and AOI data for Shanghai were obtained, respectively. The spatial location of POI is expressed in text form as name and address attributes, and interest points of underground public spaces were obtained through batch screening using a combination of keyword queries and wild-card rules [43]. The POI data and AOI data were spatially superimposed and integrated. The AOI data provide the closed polygonal outline of buildings or facilities, enabling precise delineation of the boundaries of underground space facilities. The specific operation is: Using POI points as spatial indexes, matching the corresponding AOI face elements, and assigning attributes such as function type, name, and construction year of AOI faces to the POI elements, thereby generating a semantic attribute vector layer of underground public space. For data requirements of historical periods, the “current data backtracking method” was used for processing. For the data requirements of the historical period, the “current data backtracking method” is adopted for processing. Since the POI data only cover four time periods: 2010, 2015, 2020, and 2025, the 2010 data are used as the base map, and the historical trace of each underground public space facility is conducted one by one. The basis for the trace includes: (1) Based on the data from the official website of Shanghai Metro, the opening and operation announcements of each line of the metro have been collated and summarized to obtain the opening times of the station entrances, exits, and the supporting commercial spaces; (2) The appearance and disappearance times of visible markers such as underground facility entrances and ventilation shafts in historical remote-sensing images. The determination rule is: If the historical data or remote sensing images clearly show that a facility existed before a certain time period, then this time period is included; if the data show that the facility was built after a certain time period or has been clearly closed and demolished, then this time period is not included. After this screening and backtracking process, the final dataset included in the analysis only reflects the development level of underground public spaces, rather than the overall condition of all underground spaces. Due to the less systematic nature of early historical data compared to the POI data in later years, the data completeness in 1995 and 2000 may be lower than that of subsequent years.
(3)
Regarding the clarity of the data and the handling of missing values
Due to the limitations of statistical standards and indicator definitions, potential errors in data collection and statistics, as well as restrictions on data disclosure and availability, the data used in this study may still contain potential biases and limitations. To address these issues, the study carefully considered the representativeness, availability, and data quality of the indicators when selecting them and chose relatively mature and reliable indicators as much as possible. The original data were also subjected to necessary cleaning and preprocessing to ensure data quality. Among the 182 data points in 26 indicators across 7 time periods, there were 4 data points (accounting for 2.2%) with missing values, involving 3 indicators: completed area of urban renovation (1995, 2000), urban sewage treatment rate (1995), and per-capita housing floor area (2020). In this study, linear interpolation was employed to address some missing data. The specific operation was as follows: For each indicator with missing values, the values of the 2 known years immediately before and after the missing year were used as the endpoints for linear interpolation. To verify the rationality of the interpolation results, the interpolated results were compared with the data for the same indicator in other available years to confirm that the interpolated values fell within a reasonable range.
(4)
Explanation of the time granularity of the data
The study adopted a design with an observation period of every 5 years (1995, 2000, 2005, 2010, 2015, 2020, 2025), rather than continuous annual data. This choice was based on the following considerations: Firstly, the 5-year interval coincides with the major urban planning and policy cycles of Shanghai. Key policy events such as the Shanghai World Expo in 2010 and the “Shanghai Urban Renewal Regulations” in 2021 all functioned on a 10-year or 5-year cycle. Sampling every 5 years can effectively capture the cumulative effects of these policy interventions while avoiding the interference of short-term fluctuations. Secondly, some indicators (such as policy completeness, built-up area green coverage rate) themselves change slowly and do not undergo drastic mutations within a 5-year window. The slow-changing nature of these indicators makes them suitable for the 5-year sampling design. If they change rapidly within 5 years, 5-year sampling would instead miss important dynamics. Moreover, in the entropy weight method, indicators with smaller variations are assigned lower weights (such as the weight of policy completeness, which is only 0.0384), thereby reducing their impact on the overall results. Thirdly, for subsets of indicators with available annual data (such as GDP, population, road length, etc.), we compared and observed the 5-year sampling values with the complete annual sequences. The results showed that the change trajectory of the 5-year sampling values did not have a significant systematic deviation from the overall trend of the annual data, indicating that 5-year sampling can better reflect the overall trend of the underlying situation.

2.2. Research Methods

2.2.1. Evaluation Index System Construction

The prerequisite for conducting a “surface–ground” coupled and coordinated analysis of old urban areas is to establish an index system that can be quantitatively analyzed in order to objectively present the current status and evolution trend of the surface systems and underground public spaces in the old urban areas. When selecting the analysis factors, we followed three principles: ① Extensiveness, meaning that these factors have an impact in most cases; ② Representativeness, indicating that the selected factors cannot be easily replaced by other factors; ③ Quantifiability, meaning that these factors can be easily quantified or the data can be collected normally. Referring to “Evaluation indicators for quality of city development (GB/T 40482-2021)” [44], “China Urban Comprehensive Development Indicators” [45], “China Urban Underground Space Development Blue Book”, and existing literature studies, based on the current situation of the research area, we selected and considered the rationality and availability of the data and established the index system. Among them, the evaluation indicators of the aboveground system include economic development, social livelihood, environmental quality, spatial form, and governance efficiency, totaling five categories with 17 evaluation indicators. The evaluation indicators of the underground public space system include three categories: functional diversity, scale adaptation, and form characteristics, with nine evaluation indicators (Table 1).
However, the above indicators do not directly measure the degree of coordination between the aboveground and underground systems. Instead, they respectively depict the development levels and structural characteristics of each subsystem. As described in Section 1.2.3, the aboveground system drives the evolution of underground public spaces through two paths: demand aggregation and spatial constraints. Based on this theoretical framework, some indicators in the aboveground system play the roles of driving conditions and background constraints in the evaluation system: they reflect the functional overflow demands or spatial supply pressures of the aboveground system for underground public spaces, rather than the coordination relationship itself. Specifically, the total length of bus lines represents the scale of aboveground public transportation supply, and when the capacity of the aboveground road network in old urban areas approaches saturation, the improvement of ground public transportation capacity will force the functional completion and expansion of connecting underground public spaces (such as subway station halls, underground passages, and underground crossing systems), which is a specific manifestation of the demand aggregation path; the per-capita housing floor area reflects the per-capita occupancy level of aboveground living space. When its growth slows down, it indicates that the additional space in the aboveground area is exhausted, and the pressure of spatial demand shifting to the underground increases, thereby constituting the triggering condition for the development of underground public spaces, which is a side manifestation of the spatial constraint path; population density is the base variable of the intensity of aboveground functional aggregation, directly affecting the service radius and passenger flow density of underground public spaces, and running through both paths. These indicators, as “driving conditions and background constraints” variables are incorporated into the evaluation of the aboveground system, and their relationship with the coordination degree will be further identified in the subsequent analysis of obstacle degree.
The four indicators selected for the morphological characteristics of underground public spaces are derived from landscape ecology and include patch density (PD), aggregation index (AI), landscape shape index (LSI), and area-weighted average fractal dimension (FRAC_AM). These have been widely applied in urban spatial morphology research. PD measures the number of underground public space patches per unit area. In the context of old urban areas, a higher PD value indicates that underground public spaces are more widely distributed and have higher accessibility. AI measures the spatial aggregation degree of underground public space patches. A higher AI value indicates that underground public spaces tend to be concentrated around certain nodes, facilitating functional synergy and pedestrian connectivity networks. LSI measures the complexity of patch boundaries. In old urban areas, a higher LSI value reflects the morphological adjustments adopted by underground public spaces to adapt to the complex aboveground built environment, and irregular boundaries are not defects but an organic integration with the existing urban texture. FRAC_AM measures the complexity of the shape of large-area patches. A higher fractal dimension indicates that large underground public spaces have successfully avoided constraints such as underground pipelines, building foundations, and cultural heritage during development, demonstrating adaptability and flexibility in spatial development.

2.2.2. Method for Weight Distribution

The combined weighting method integrates subjective and objective weighting methods, enabling the weights to reflect both the subjective judgment of evaluators and the influence of objective data. This study employs the Analytic Hierarchy Process (AHP)–Entropy Weight Method combined weighting method to assign weights to the indicators. Among them, AHP calculates the subjective weights of the indicators by comparing the importance of each pair of indicators, which is a subjective weighting method that combines qualitative and quantitative approaches [61]; the entropy weight method objectively allocates weights based on data variability, which is a decision-making method that objectively reflects the weights of evaluation indicators [62]. Combining the two can effectively avoid the influence of personal factors on the weights of indicators, improving the accuracy and rationality of the weights.
(1)
Entropy Weight Method
Entropy originated from the thermodynamic concept in physics, proposed by German physicist T. Clausius, and was later adopted by information theory [63]. It has now been applied in various fields such as natural science, social science, and human science, and it is a mathematical method that calculates a comprehensive index based on the information volume of all factors [64]. The entropy weight method determines the objective weights based on the size of the entropy of the indicators. The smaller the entropy value, the greater the dispersion of the indicator, indicating that the indicator has a greater impact on the comprehensive evaluation and is more important [65].
The specific steps of the entropy weight method are as follows:
① Data standardization: Due to the different units of each evaluation indicator, it is necessary to classify them as positive or negative indicators based on their nature and then perform normalization separately. The calculation formula is:
Y i j = { X i j m i n X 1 j X n j m a x X 1 j X n j m i n X 1 j X n j ( T h e   i n d i c a t o r   i s   p o s i t i v e . ) m a x X 1 j X n j X i j m a x X 1 j X n j m i n X 1 j X n j ( T h e   i n d i c a t o r   i s   n e g a t i v e . )
In the formula, Y i j represents the standardized values, X i j is the original data points, and n represents the number of research objects.
Affected by the distribution characteristics of the indicators themselves and the extreme values at the end, the values of some samples after normalization tend to approach 1. To avoid the risk of information loss, this paper sets up a robustness test. By comparing the standardized results before and after logarithmic preprocessing, the temporal evolution pattern has not undergone significant changes, verifying the reliability of the evaluation results.
② Calculate the entropy value of the index, and the calculation formula is (Equation (2)):
e j = 1 lnm i = 1 m p ij lnp ij
In the formula, e j represents the entropy of the j-th indicator, p ij = d ij i = 1 m d ij indicates the proportion of the i-th sample value under the j-th indicator to the sum of all sample values of that indicator.
③ Calculate the indicator weights, and the calculation formula is (Equation (3)):
w j = 1 e j j = 1 n ( 1 e j )
In the formula,   w j represents the weight of the j-th indicator.
(2)
Analytic Hierarchy Process (AHP)
AHP is a multi-objective hierarchical weight decision-making analysis method proposed by American operations researcher T. L. Saaty. By decomposing the elements related to decision-making into levels such as goals, criteria, and schemes, it combines qualitative judgment and quantitative analysis and is one of the multi-criteria decision-making techniques [66]. The specific steps of AHP are as follows: ① Establish a hierarchical structure model; ② Use the 1–9 scale method to construct a judgment matrix (Table 2), with 10 experts in the field of urban planning participating; ③ Hierarchical single ranking and consistency test. When the consistency ratio (CR) is < 0.1, the judgment matrix satisfies consistency [67]; ④ Hierarchical total ranking and consistency test. The detailed process can be referred to in existing studies [68,69,70]. Ten experts in the field of urban space were invited to participate in the AHP scoring process. The experts came from five types of institutions: universities, planning and design institutes, government departments, enterprises, and research institutions (see Appendix A.1 for the basic information of the experts). Import the expert scoring data into the Yaahp 0.5.3 software. Using the geometric mean aggregation method of the judgment matrix in group decision-making, the comprehensive judgment matrix and corresponding weights were obtained. The entire scoring process of expert 01 for the aboveground and underground public space system (Appendix A.2 and Appendix A.3) and the AHP weights obtained by aggregating all experts (Appendix A.4) are presented in the appendix.
(3)
Linear Weighted Combination Method
The subjective and objective weighting methods are integrated using the linear weighting method [71], and the calculation formula is (Equation (4)):
w j = α w sj + β w oj
In the formula, wj is the final combined weight of the j-th indicator, while α and β are the combination coefficients of the subjective weights of AHP w sj and the objective weights of the entropy method w oj . In this study, it is considered that both the subjective and objective aspects are equally important, taking into account the advantages of expert experience and data-driven methods. Therefore, α = β = 0.5 is set [72].

2.2.3. Coupling Coordination Degree Model

The coupling coordination degree model quantifies the interaction between two or more systems through coupling degree and calculates the coupling coordination degree by combining the comprehensive development levels of each system to evaluate the degree of coupling and coordination among the systems. The coupling coordination degree model consists of three indicators: coupling degree C, coupling coordination degree D, and comprehensive development index T. The calculation method is as follows (Equation (5)):
C = 2 U 1 U 2 U 1 + U 2
Among them, C represents the coupling degree, with a range of [0, 1] (Table 3). U 1   a n d   U 2 , respectively, represent the development levels of the aboveground space system and the underground public space system. In the study, U1 and U2 are the comprehensive evaluation indices obtained through multi-index weighting. After sample internal standardization processing, their value range is [0–1], and they are only used for relative comparison between time series samples. They do not have the meaning of a ratio scale and cannot be directly interpreted as multiples or ratios of real physical quantities. Moreover, the coupling degree C only measures the numerical matching degree of the scores of U1 and U2. A high C value is merely a mathematical output and cannot be directly equated to the existence of strong interaction or spatial linkage between the two systems in the real scenario. The judgment of the actual collaborative state requires a comprehensive assessment combining the coupling coordination degree D.
T = α U 1 + β U 2
Among them, T represents the comprehensive development index, while α and β are the weight coefficients of the system. The study holds that the aboveground and underground components are equally important, with α = β = 0.5.
D = C × T
Among them, D represents the coupling coordination degree of the evaluated object. Based on previous studies [65,66], the classification criteria for the coupling coordination degree levels are detailed in Table 4.

2.2.4. Obstacle Degree Model

The obstacle degree model consists of three indicators: factor contribution degree, indicator deviation degree, and obstacle degree. The factor contribution degree reflects the weight contribution of each individual indicator to the overall goal; the indicator deviation degree represents the gap between the actual value and the ideal value of each indicator; and the obstacle degree comprehensively measures the degree of obstruction that each indicator poses to the improvement of the coordination level [73].
F i k = w i k × W i
O i k = F i k ( 1 x i k ) i = 1 p k = 1 n F i k ( 1 x i k ) × 100 %
V i = k O i k
In the formula: F i k represents the contribution degree of the k-th indicator of subsystem i ; O i k represents the obstacle degree of the k-th indicator of subsystem i , and p is the total number of subsystems; V i represents the obstacle degree of the target layer.

3. Result Analysis

3.1. Analysis of the Development Levels of Public Spaces on Land and Underground

3.1.1. Evolution of the Development Level of the Aboveground System U1

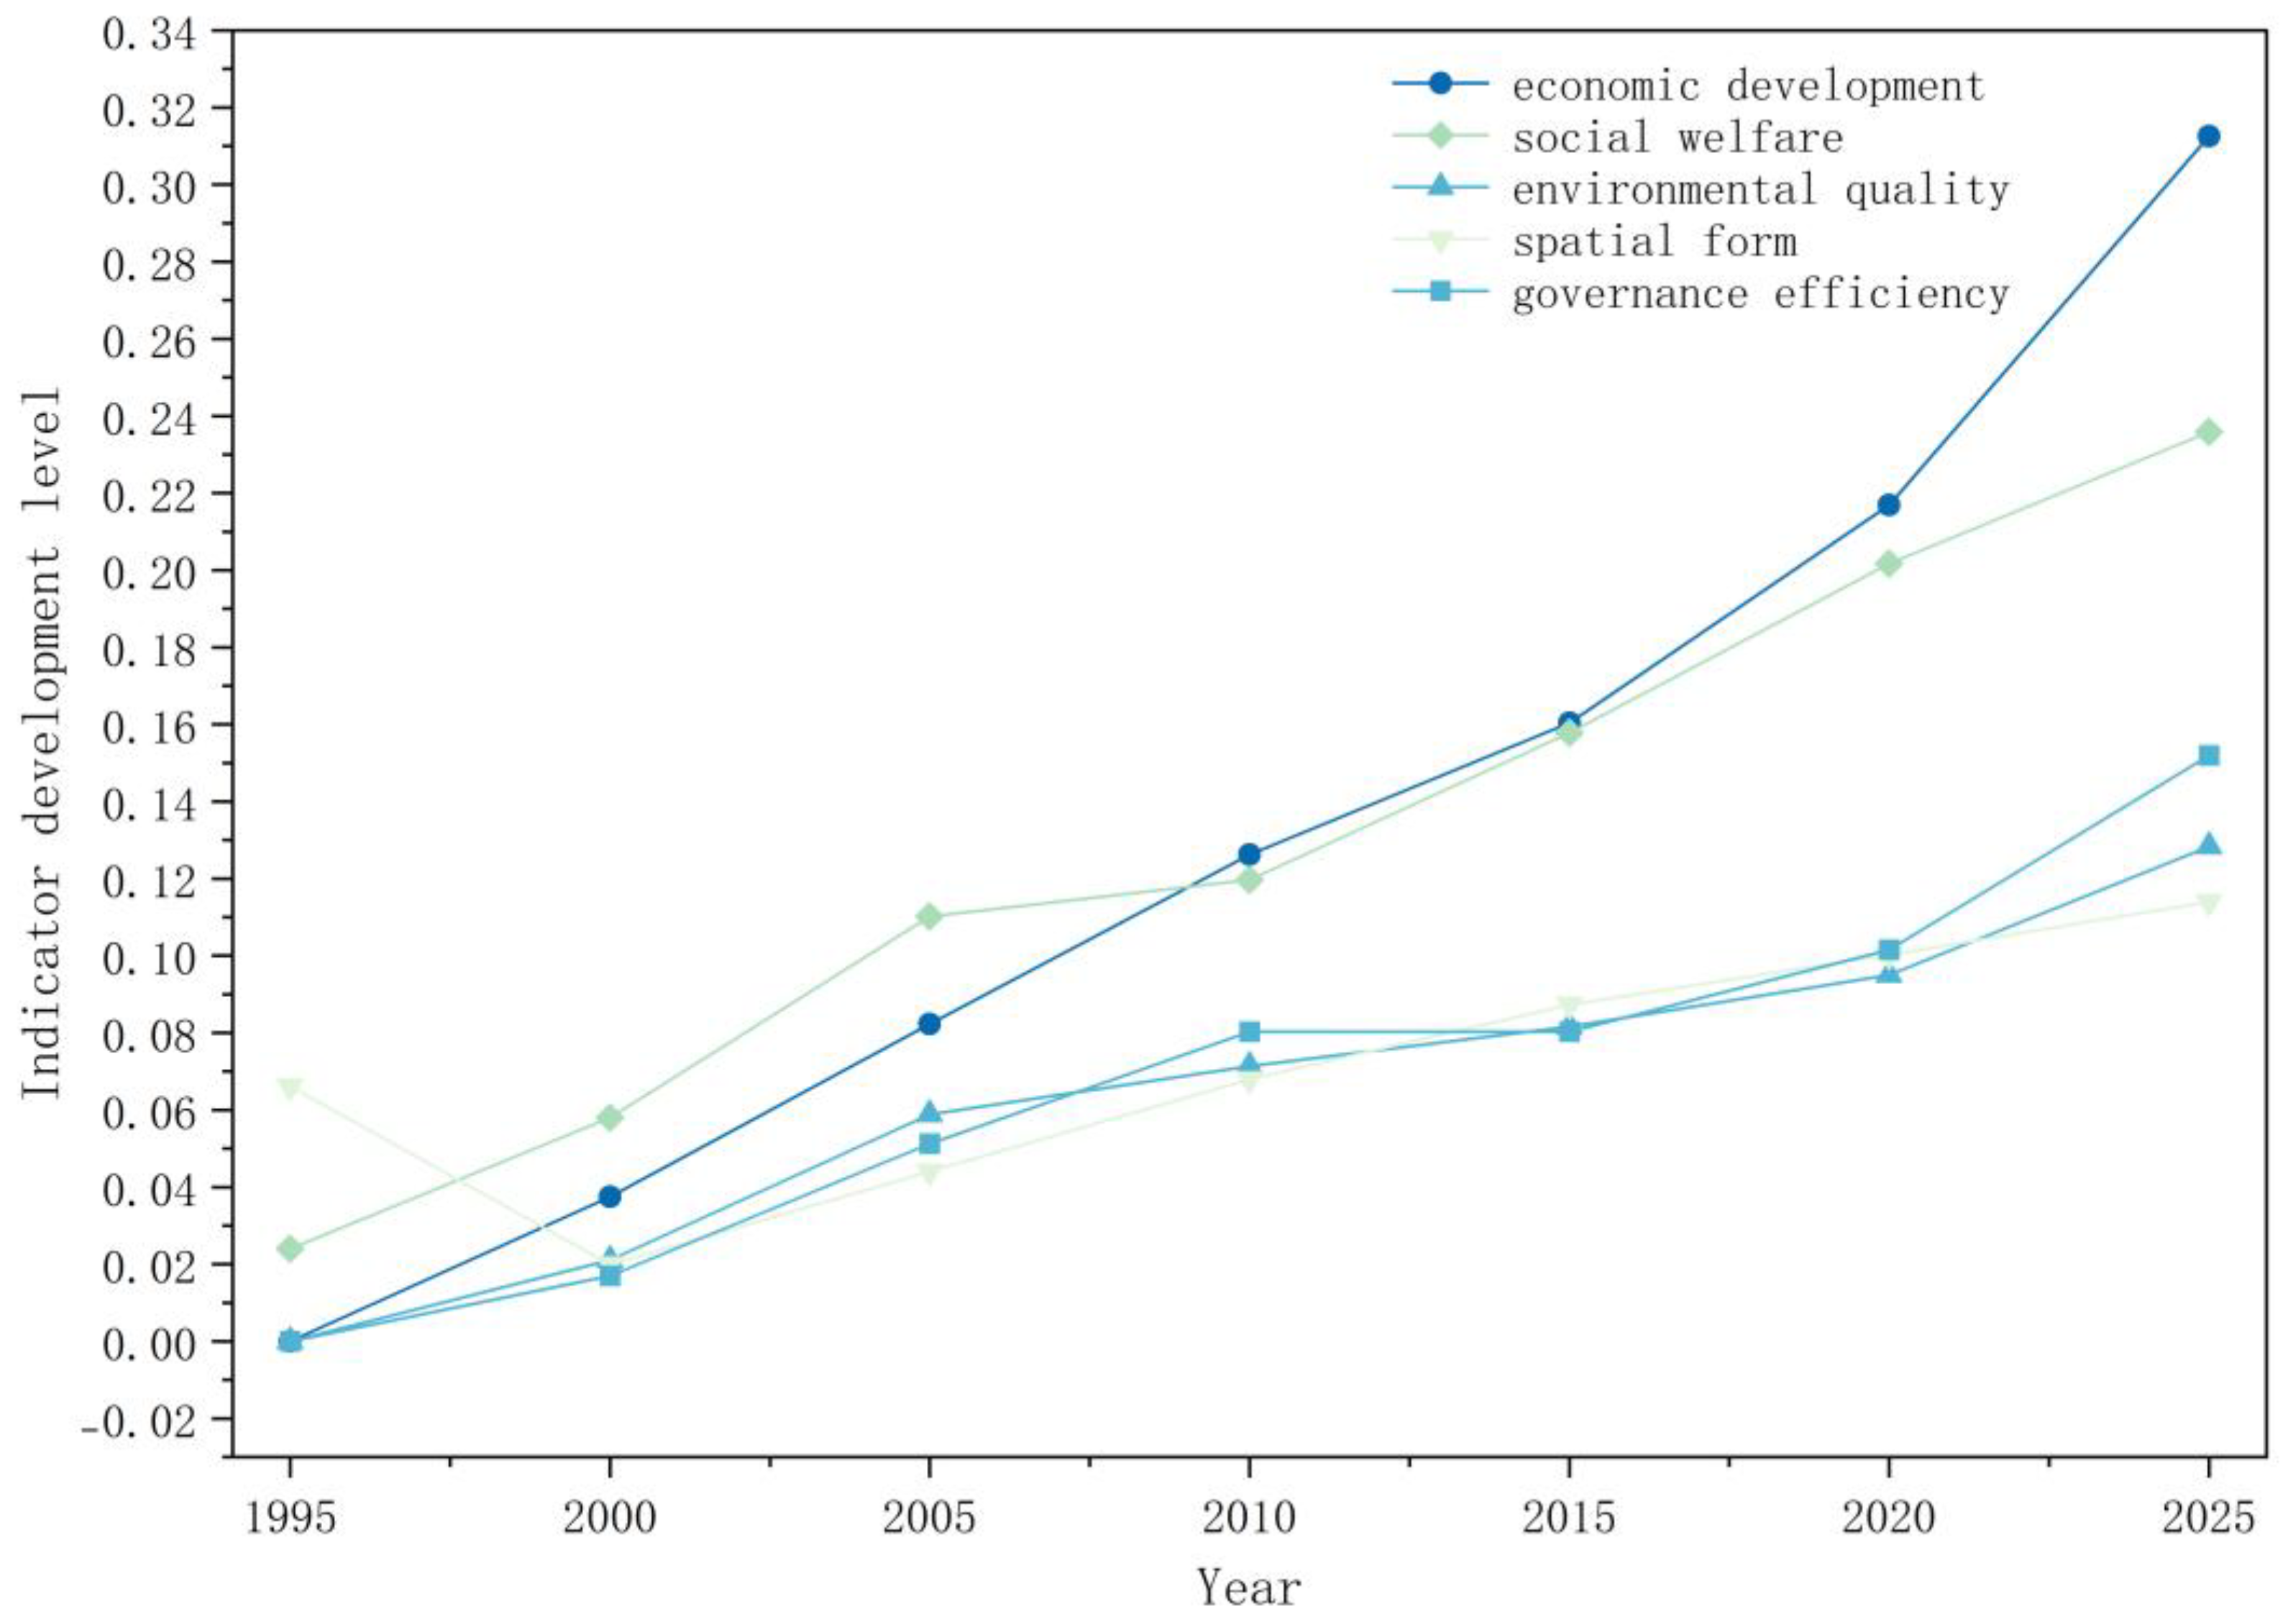
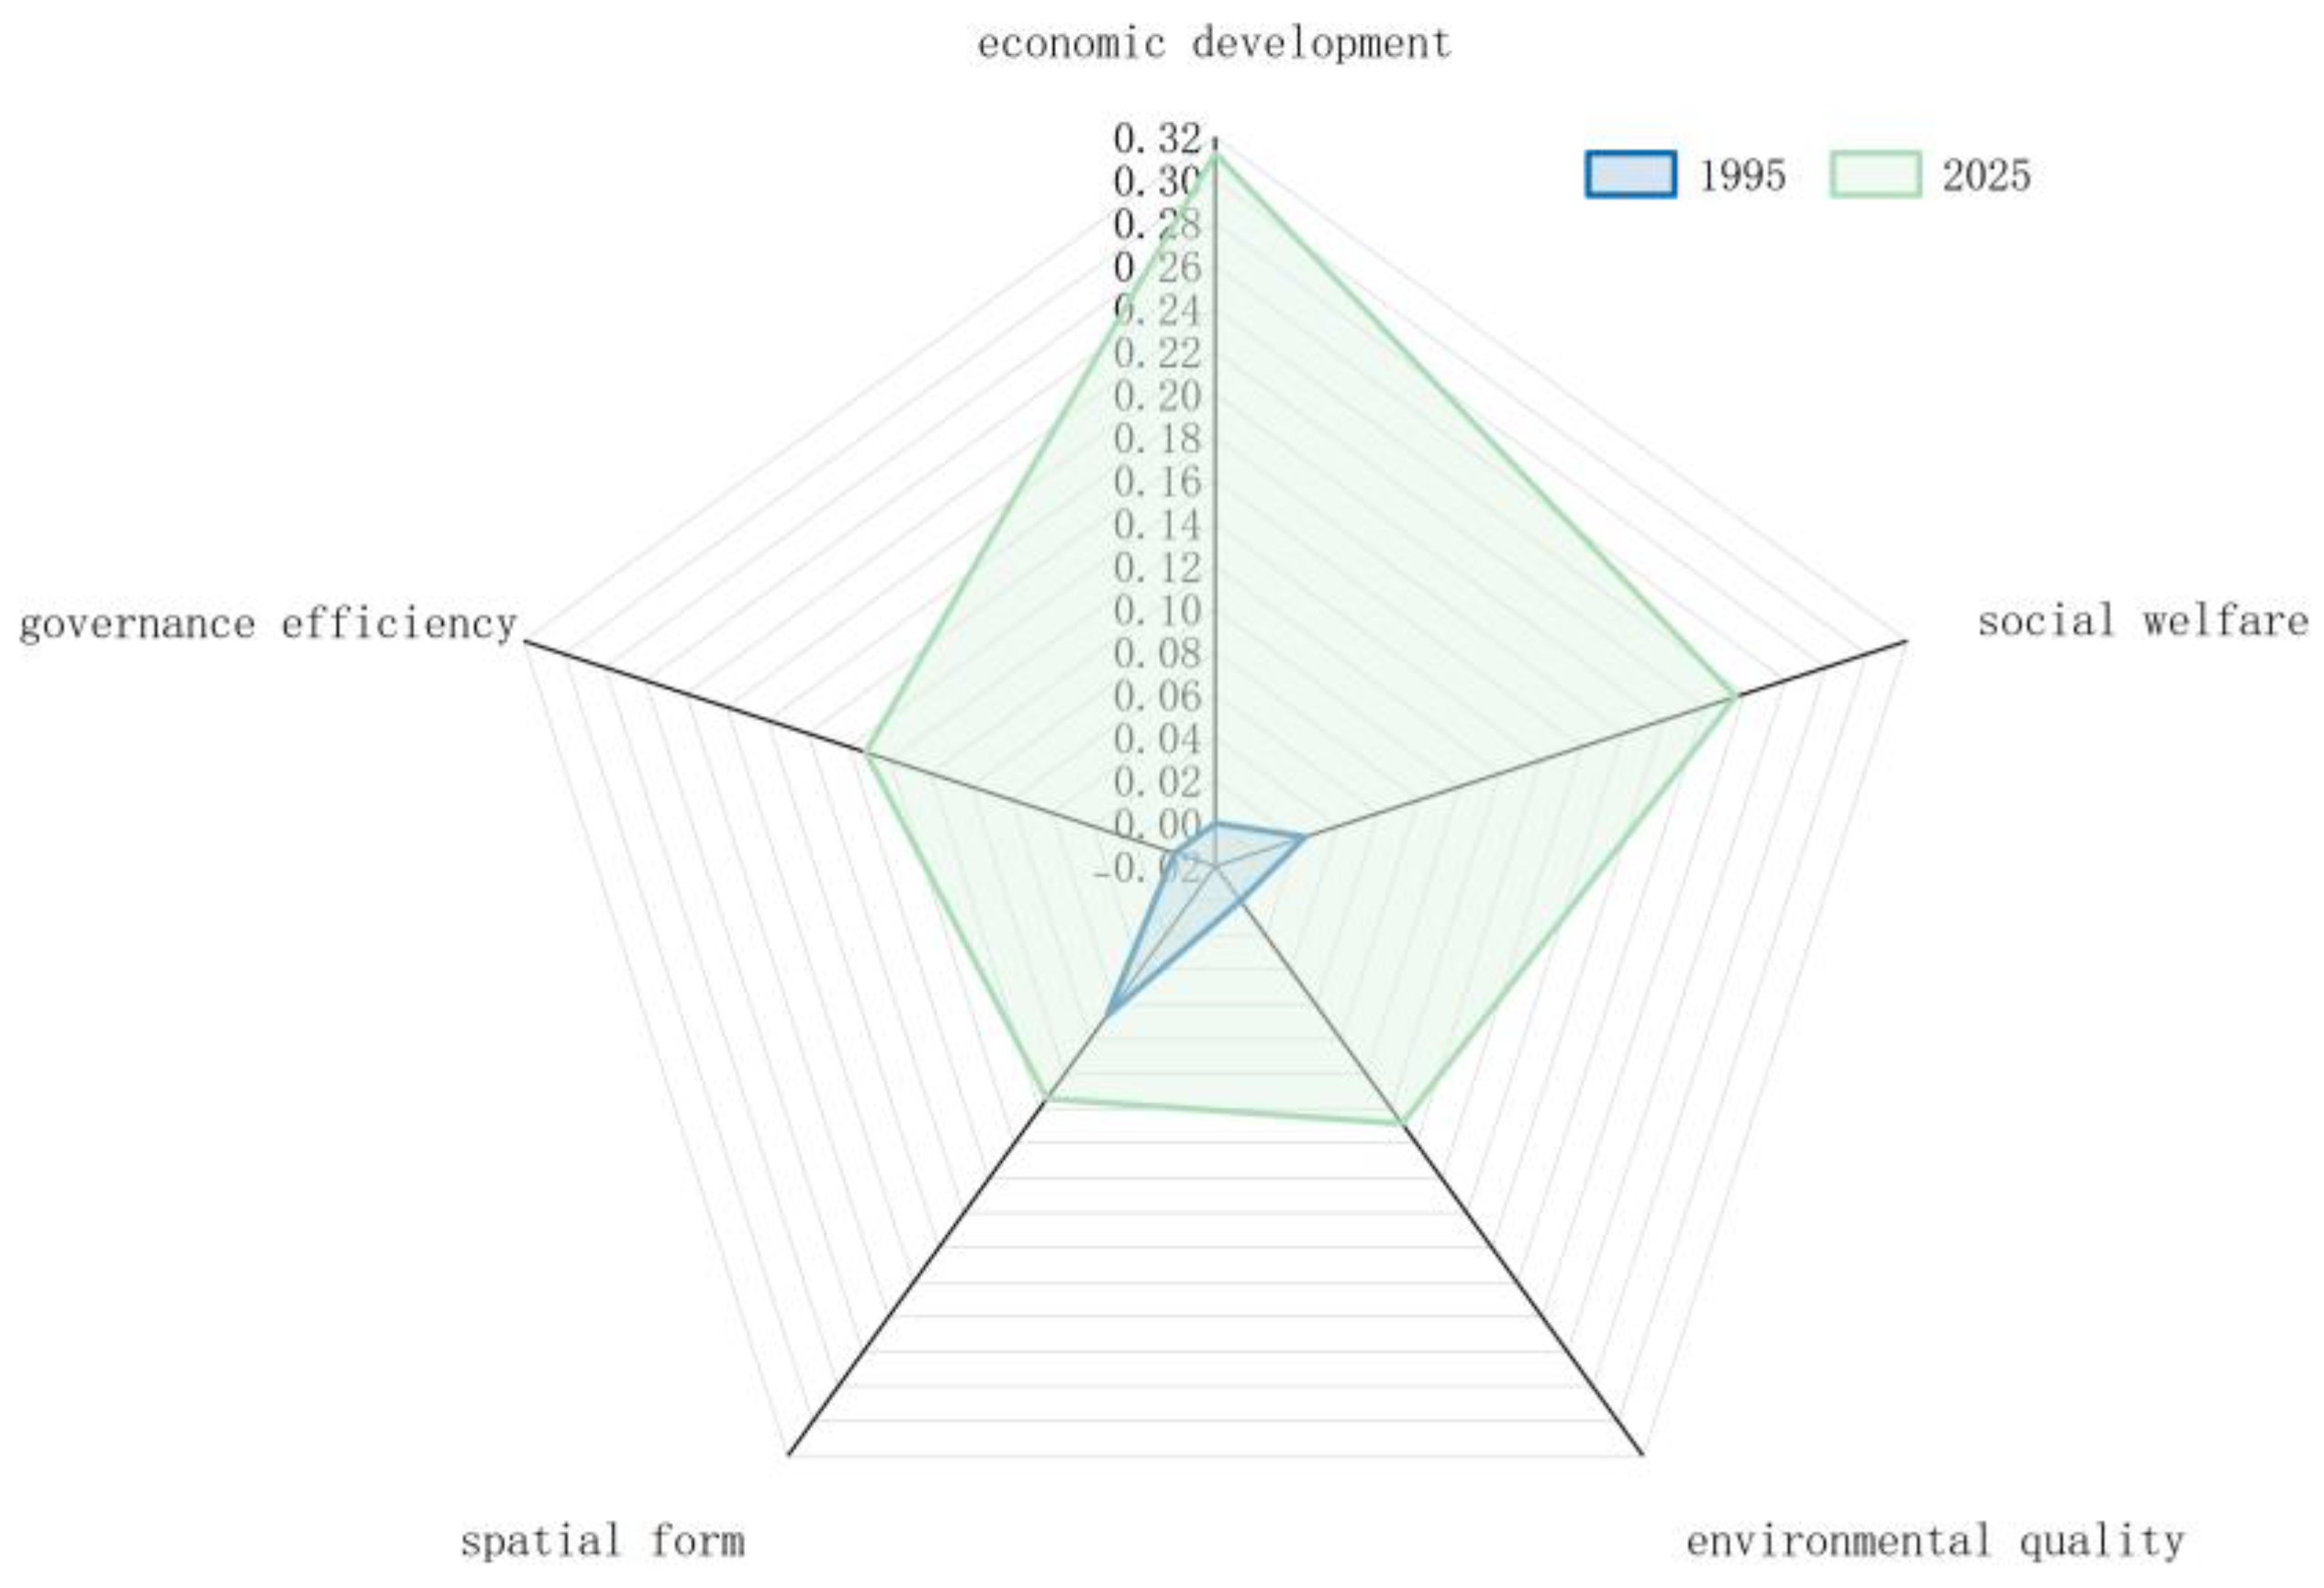
Since the aboveground system uses the municipal statistical proxy data of Shanghai, while the underground public space represents the internal spatial data of the study area, there is a mismatch in spatial scale between the two. The following analysis will focus more on the temporal evolution trends, stage characteristics, and relative ranking of the obstacle factors of the two systems. The absolute score values of U1 and U2 need to be interpreted with caution. The aboveground system is composed of five dimensions: economic development, social livelihood, environmental quality, spatial form, and governance efficiency. During the period from 1995 to 2025, the development levels of all dimensions showed a continuous growth trend (Figure 2 and Figure 3). Among them, the growth rate of the governance efficiency dimension was the most significant. It rose from nearly zero in 1995 to 0.152 in 2025, achieving a leapfrog development from the initial stage to a rapid advancement. This reflects the gradual improvement of the urban renewal policy system and the continuous enhancement of its implementation effectiveness. The economic development dimension had the largest growth rate, rising from nearly zero in 1995 to 0.313 in 2025, demonstrating the steady recovery of economic vitality in the old urban area and the continuous optimization of the industrial structure. The social and livelihood dimension increased from 0.024 to 0.236, indicating that investment in public service provision and improvement of living conditions has been continuously increased, and the quality of residents’ lives has steadily improved. The environmental quality dimension rose from nearly zero to 0.128, reflecting the outstanding achievements in ecological civilization construction and the effective implementation of green development concepts. The spatial form dimension increased from 0.066 to 0.114, with a relatively slow growth rate. This indicates that the old urban area is constrained by the rigidity of the historical built environment, and the adjustment of spatial form is relatively limited. Overall, all dimensions advanced in coordination, jointly promoting the high-quality development of the aboveground subsystems.

3.1.2. Evolution of the Development Level of Underground Public Space Systems U2

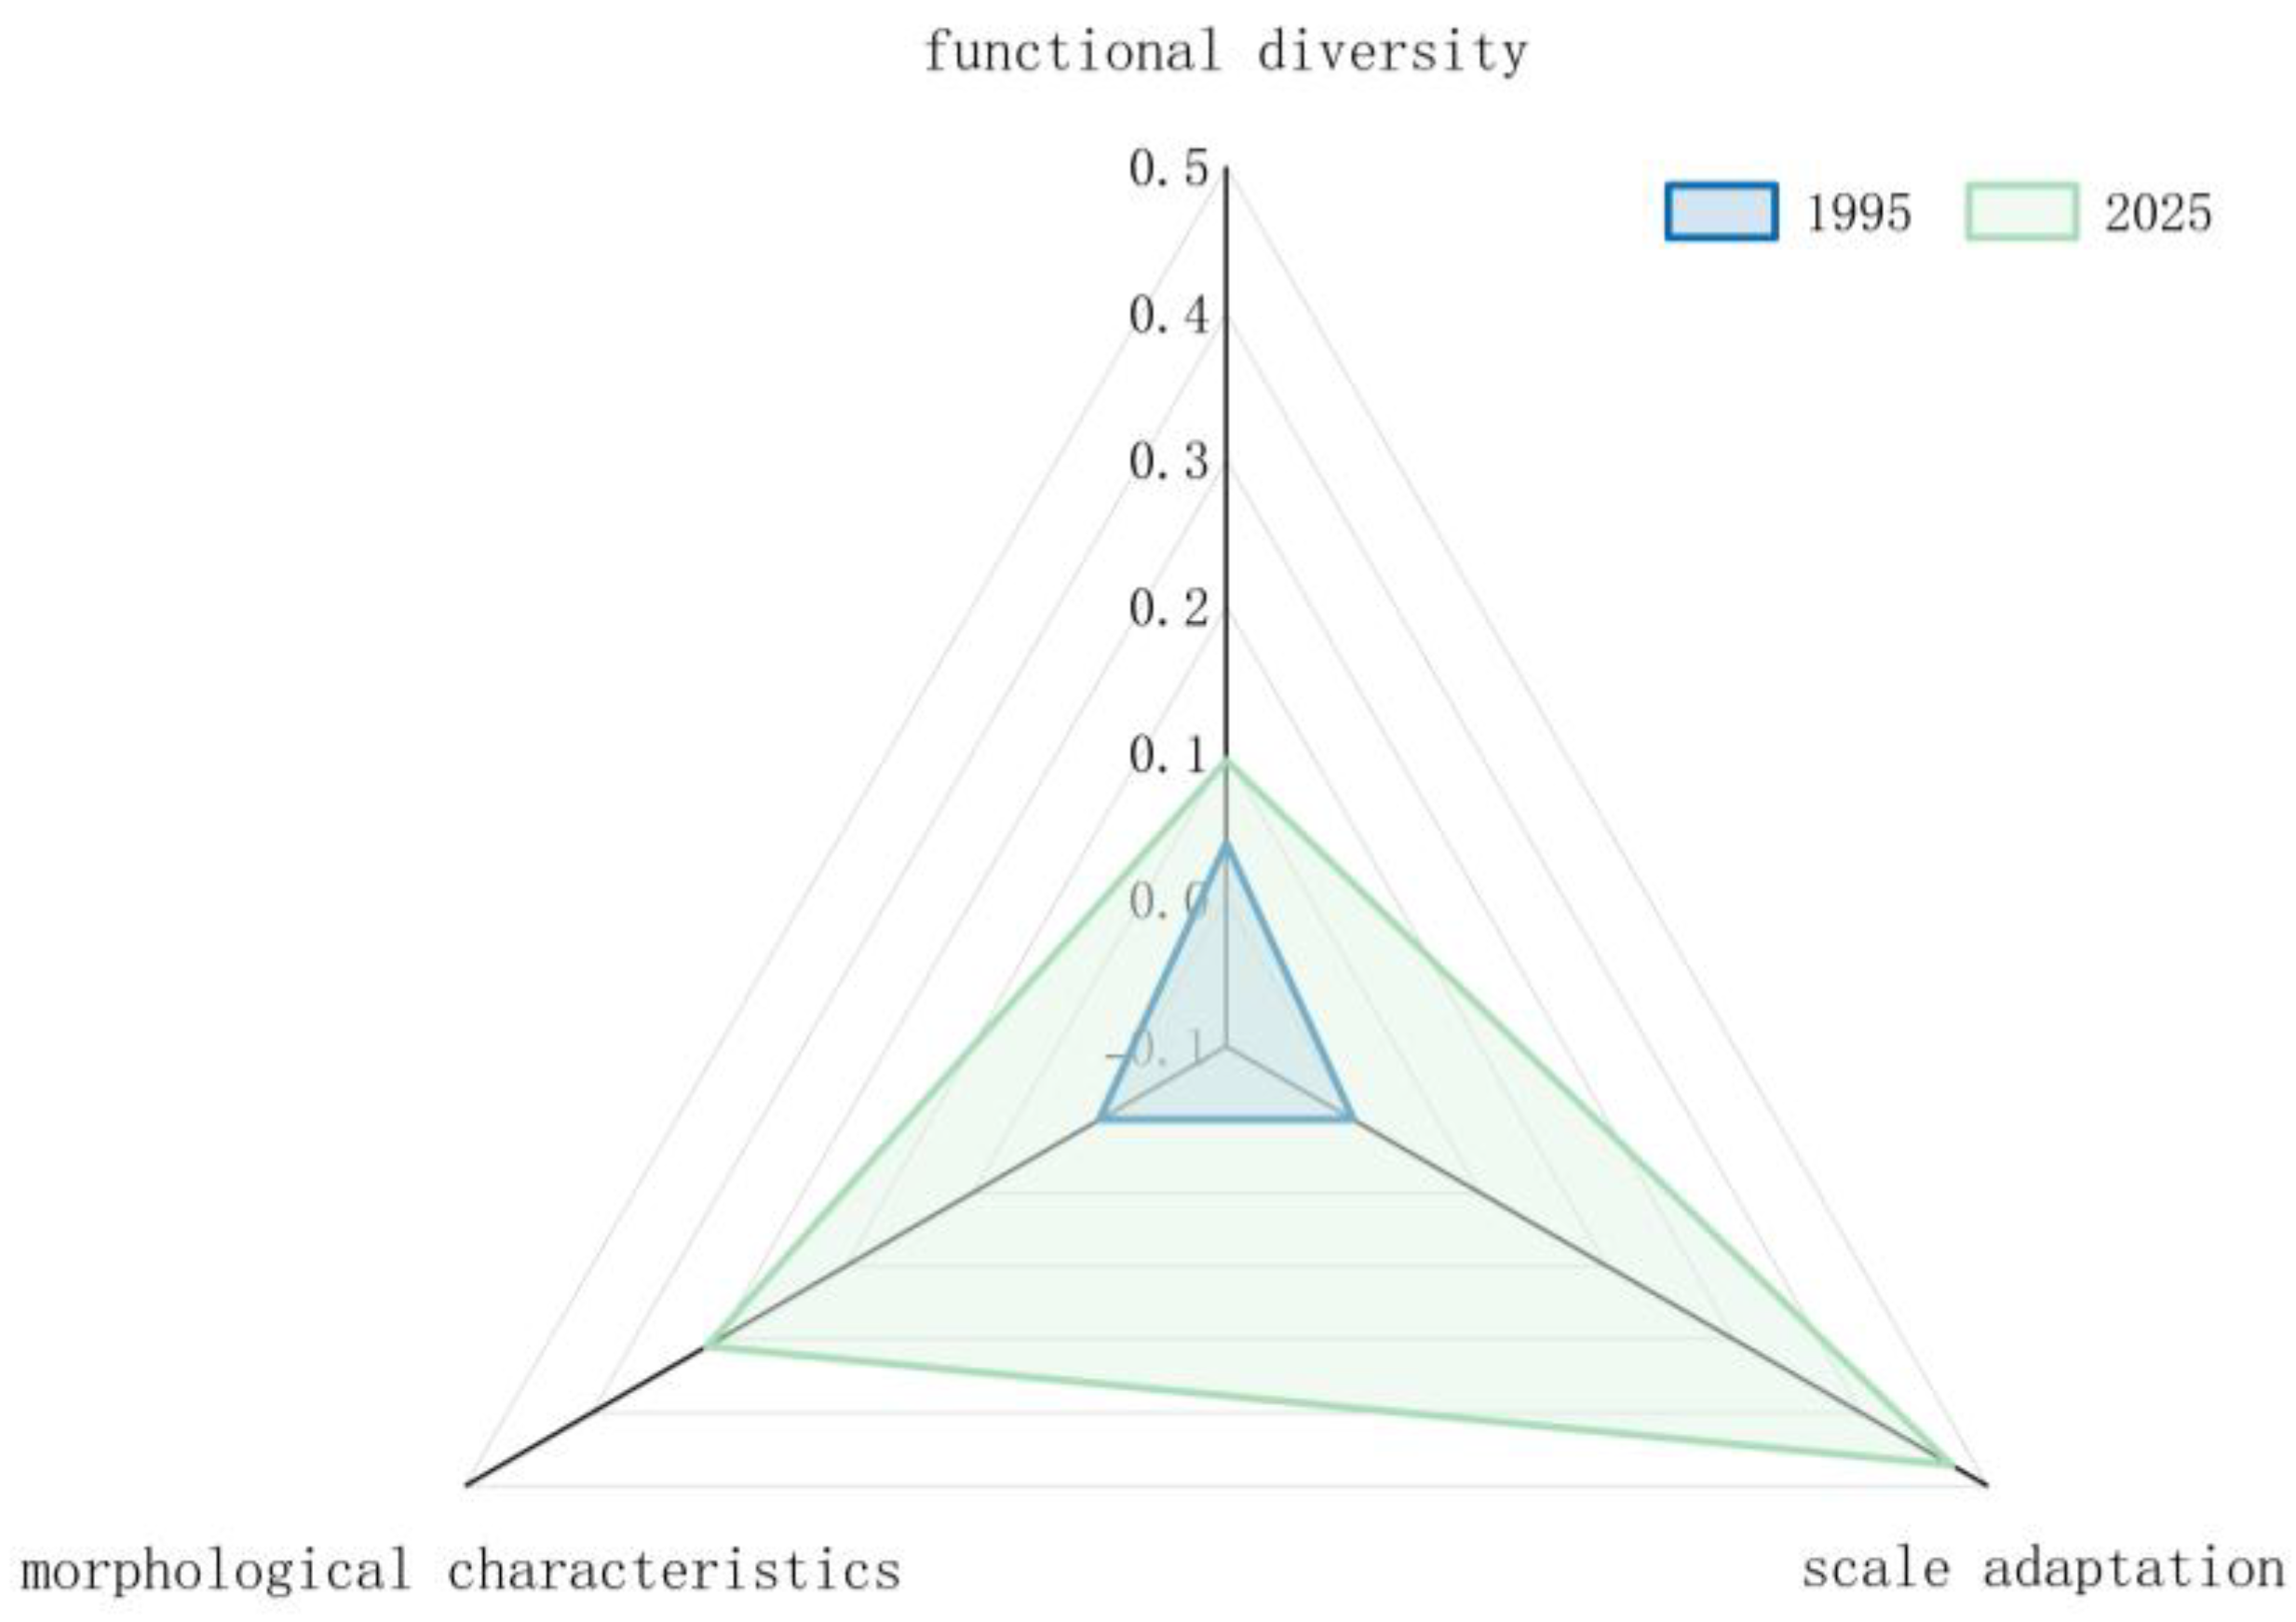
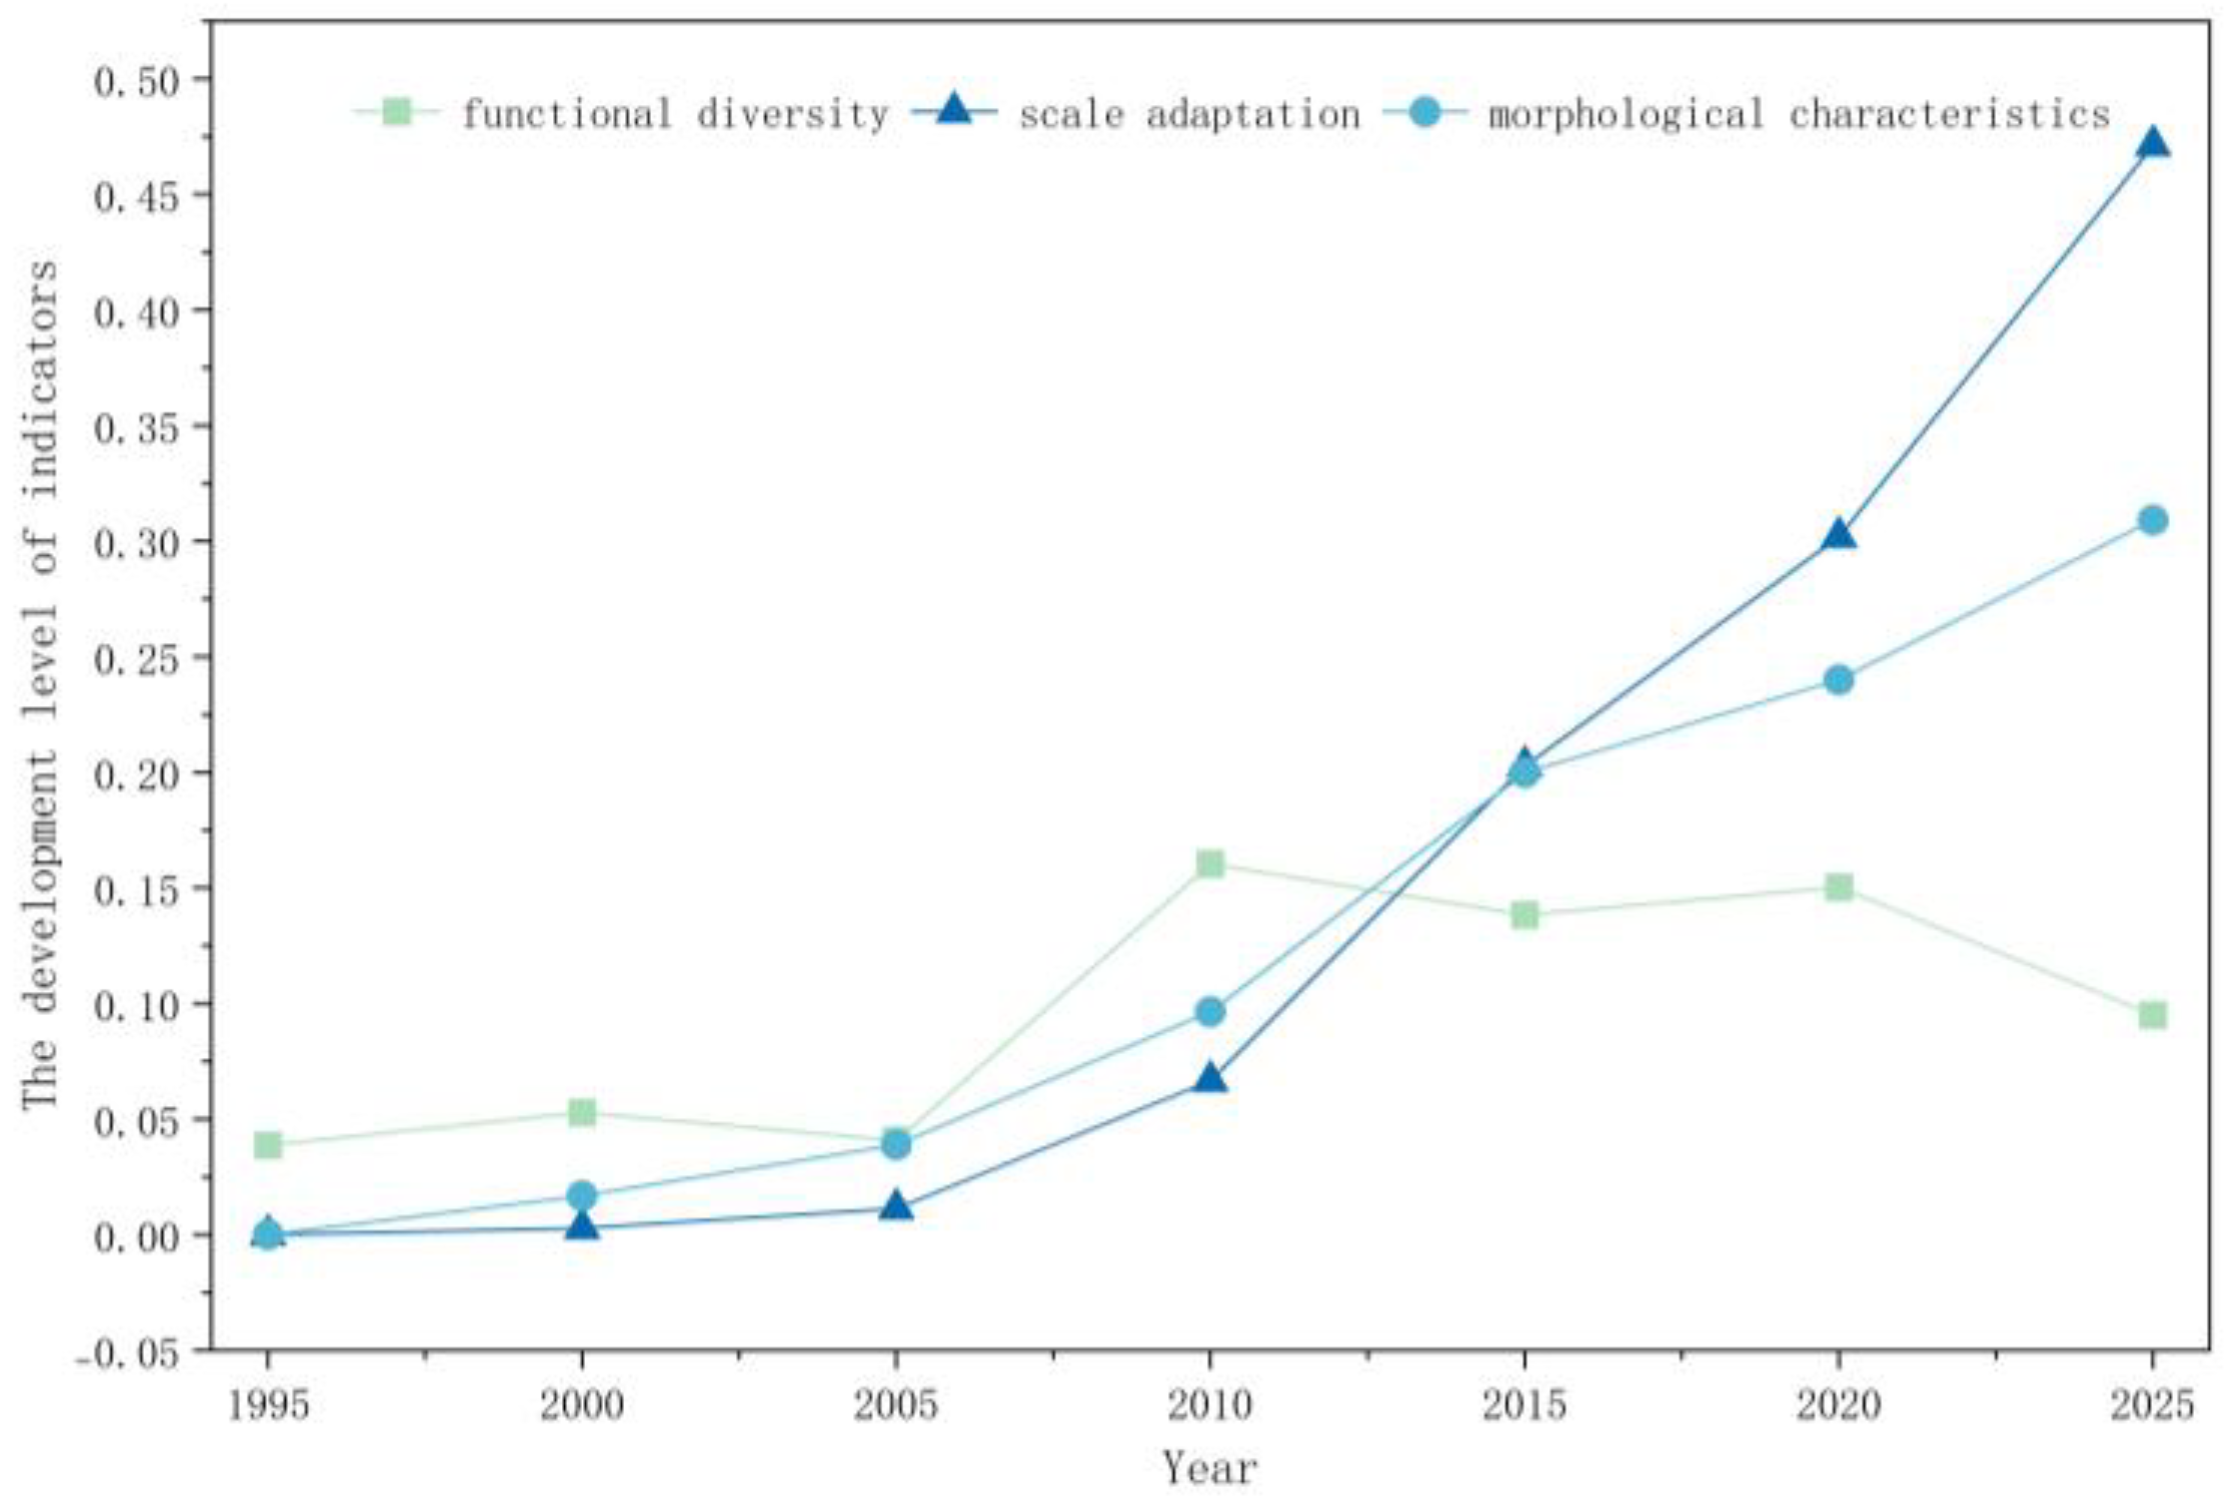
The underground public space system is composed of three dimensions: diverse functions, scale adaptation, and morphological characteristics. During the period from 1995 to 2025, the development trajectories of these three dimensions exhibited significant heterogeneity (Figure 4 and Figure 5). Among them, the scale adaptation dimension showed the most rapid growth, rising from nearly zero in 1995 to 0.471 in 2025. Especially since 2010, it has entered an accelerated rising stage, reflecting the breakthrough progress of underground public spaces in terms of construction volume, service coverage, and per-capita resource allocation. The morphological characteristics dimension showed a continuous and steady upward trend, growing from nearly zero in 1995 to 0.309 in 2025. During the period from 2005 to 2010, the growth rate was significantly accelerated, indicating systematic achievements in spatial form integration, layout structure optimization, and utilization efficiency improvement during this stage. The diverse functions dimension presented an inverted U-shaped evolution path, rising from 0.039 in 1995 to a peak of 0.160 in 2010, and then gradually declining to 0.095 in 2025, suggesting the phased characteristics of rapid functional expansion in the early stage and functional integration and intensification in the later stage. In summary, the underground public space system has achieved remarkable results in scale expansion and morphological structure optimization. How to maintain and enhance functional diversity during urban renewal will become a key issue for achieving sustainable and high-quality renewal.

3.1.3. Comparison of Development Levels of the Two Systems

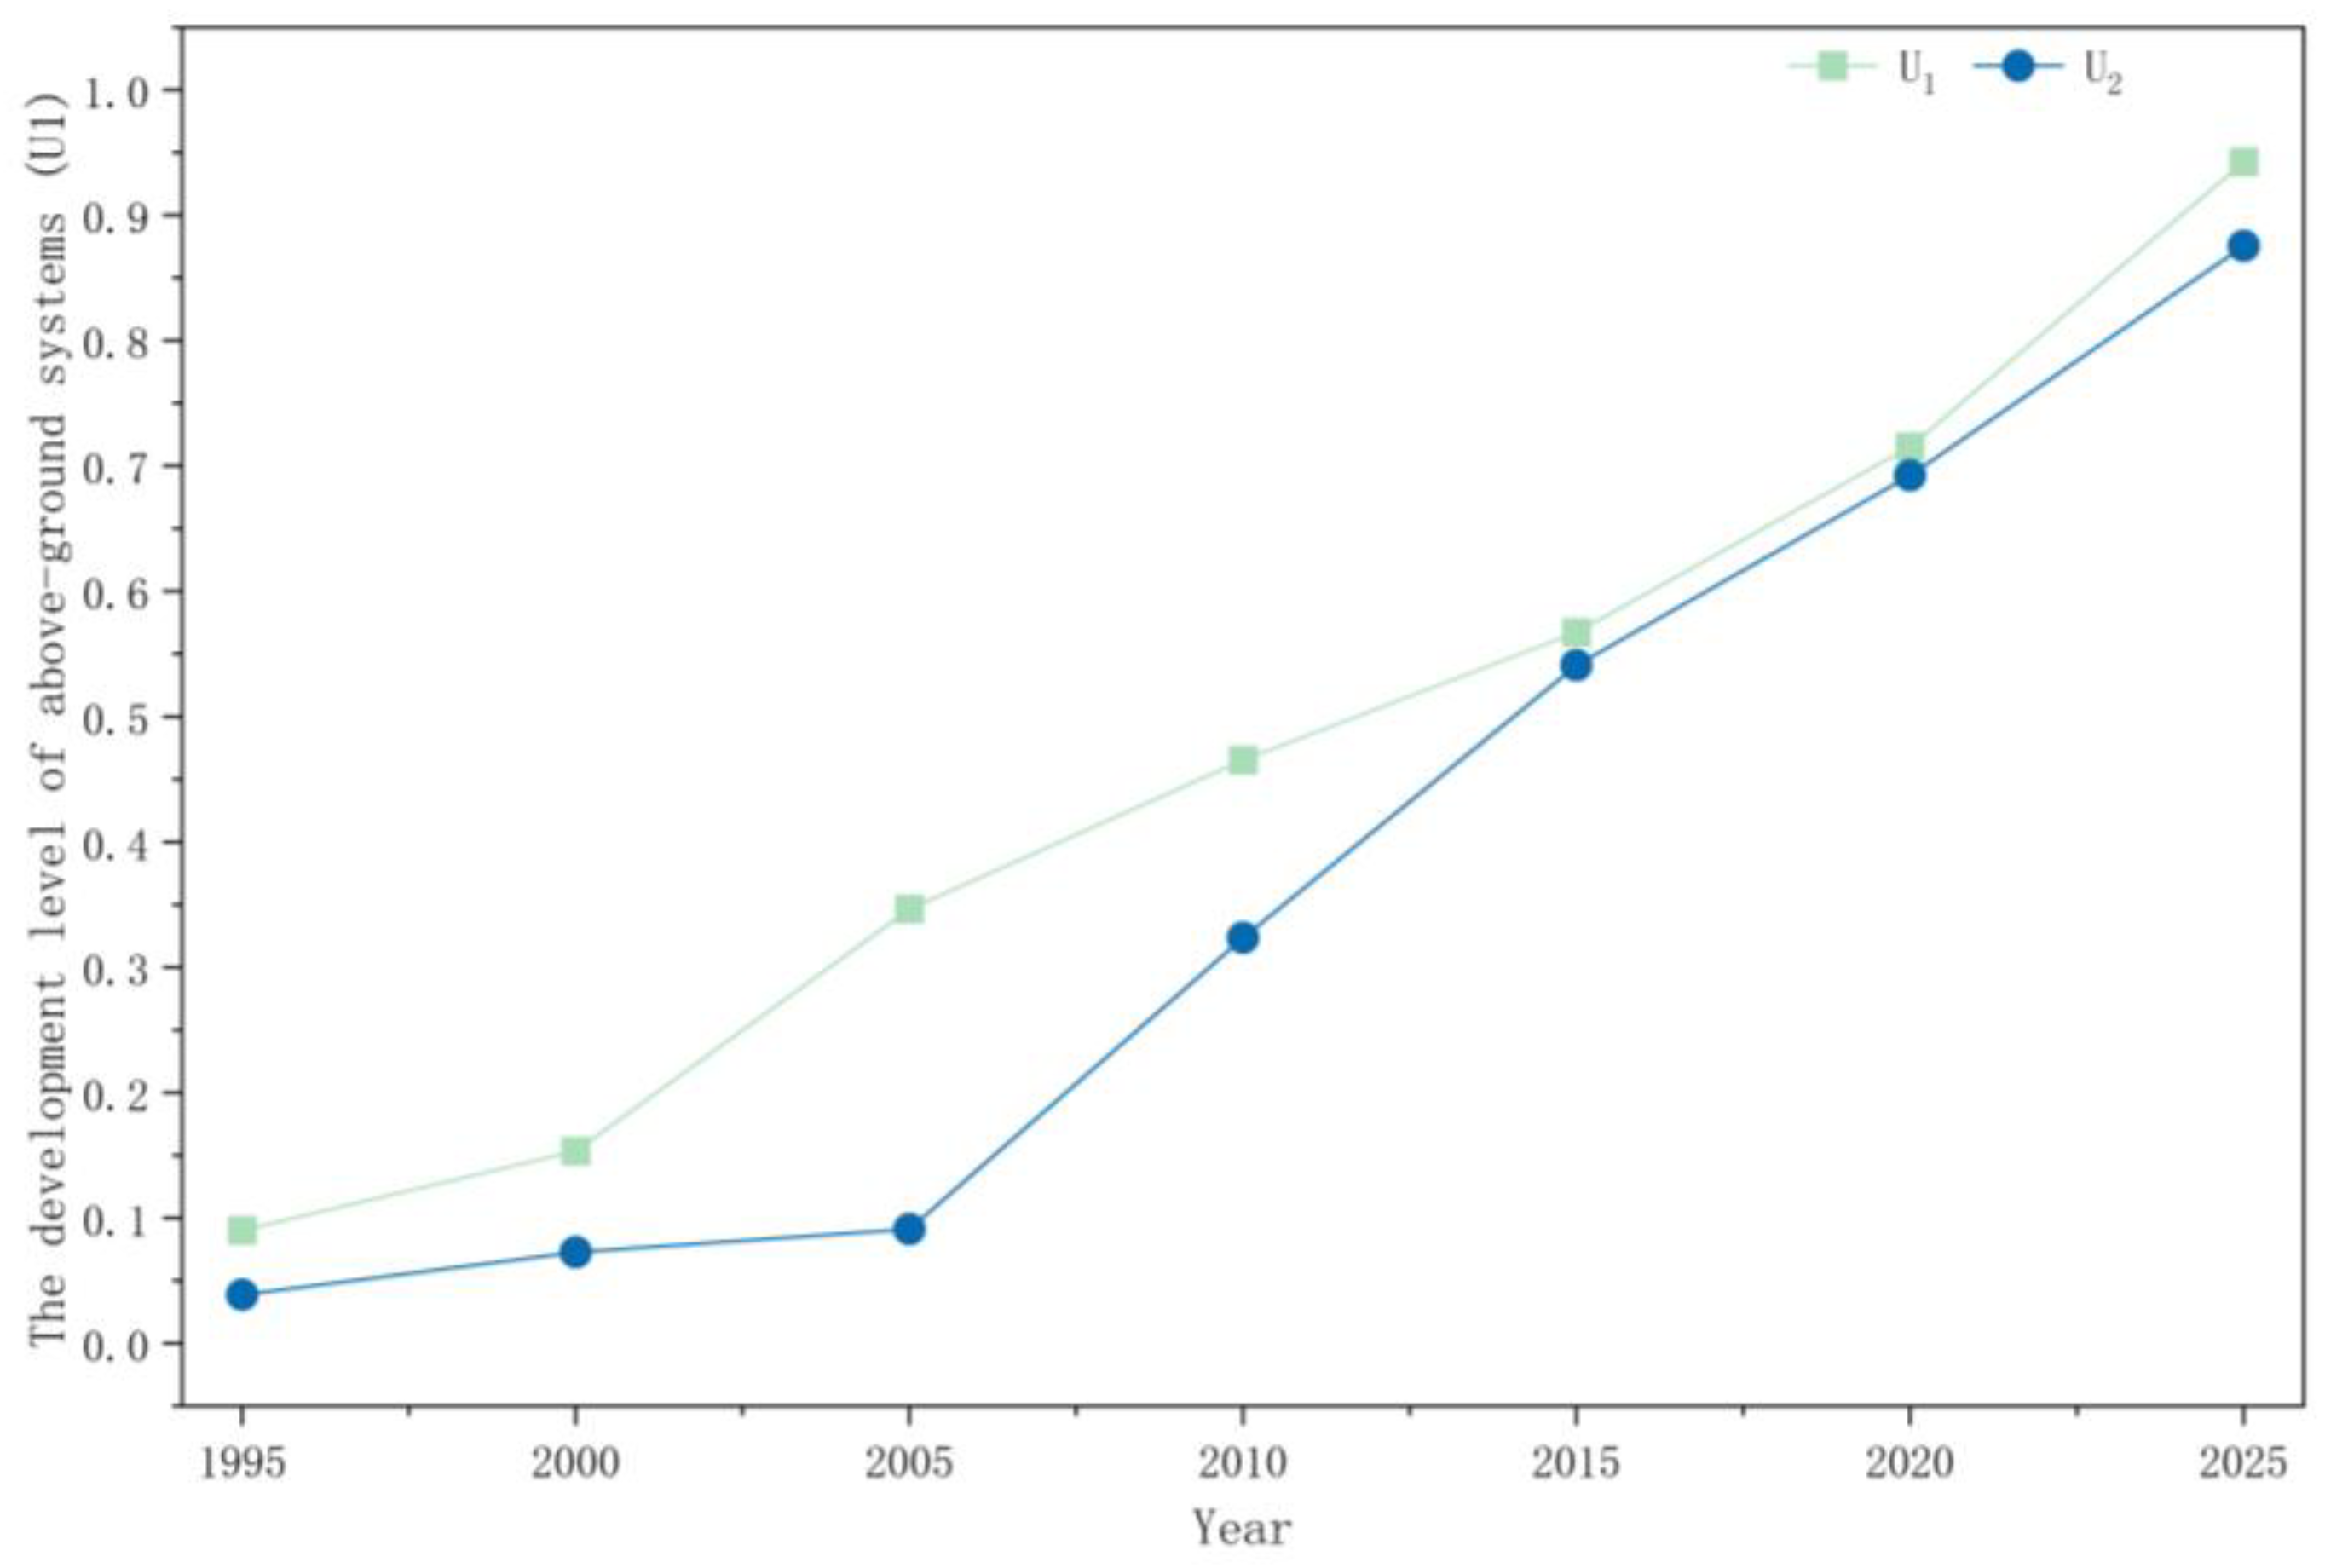
The aboveground subsystem and underground public space subsystems in the old urban areas of Shanghai have shown a coordinated upward trend as a whole (Figure 6), but there are differences in their development pace and driving factors. Among them, the aboveground subsystem has generally maintained a steady upward trend, increasing from 0.090 in 1995 to 0.943 in 2025, with a relatively stable growth rate, reflecting the continuity of aboveground space development and the effect of resource accumulation. While the underground public space subsystem developed relatively slowly from 1995 to 2005, it entered an accelerated rising stage starting in 2010, increasing from 0.324 in 2010 to 0.876 in 2025. This acceleration period coincides in time with the period when the Shanghai World Expo was held, and a series of underground space policies were introduced [74,75]. The development level of underground public space has accelerated its catch-up after 2010, continuously narrowing the gap with the aboveground system, and it basically reached parity by 2020 (aboveground 0.715, underground 0.693) before further approaching it in 2025, reflecting the strategic value of underground space as a means to expand urban space resources. This profoundly indicates that seeking space, functions, and resilience underground has become a key breakthrough to solve the problems of urban renewal in old areas and optimize the allocation of spatial resources. This profoundly indicates that seeking space, functions, and resilience underground has become a key breakthrough to solve the problems of urban renewal in old areas and optimize the allocation of spatial resources.

3.2. Coupling Coordination Degree Analysis

3.2.1. Temporal Changes in Coupling Coordination Degree

Based on the development levels of the aboveground system U1 and the underground public space U2 calculated from the previous text, the coupling coordination degree model was introduced to calculate the coupling degree C, comprehensive development index T, and coupling coordination degree D of the aboveground system and underground public space in the old urban areas of Shanghai from 1995 to 2025 (Table 5, Figure 7).
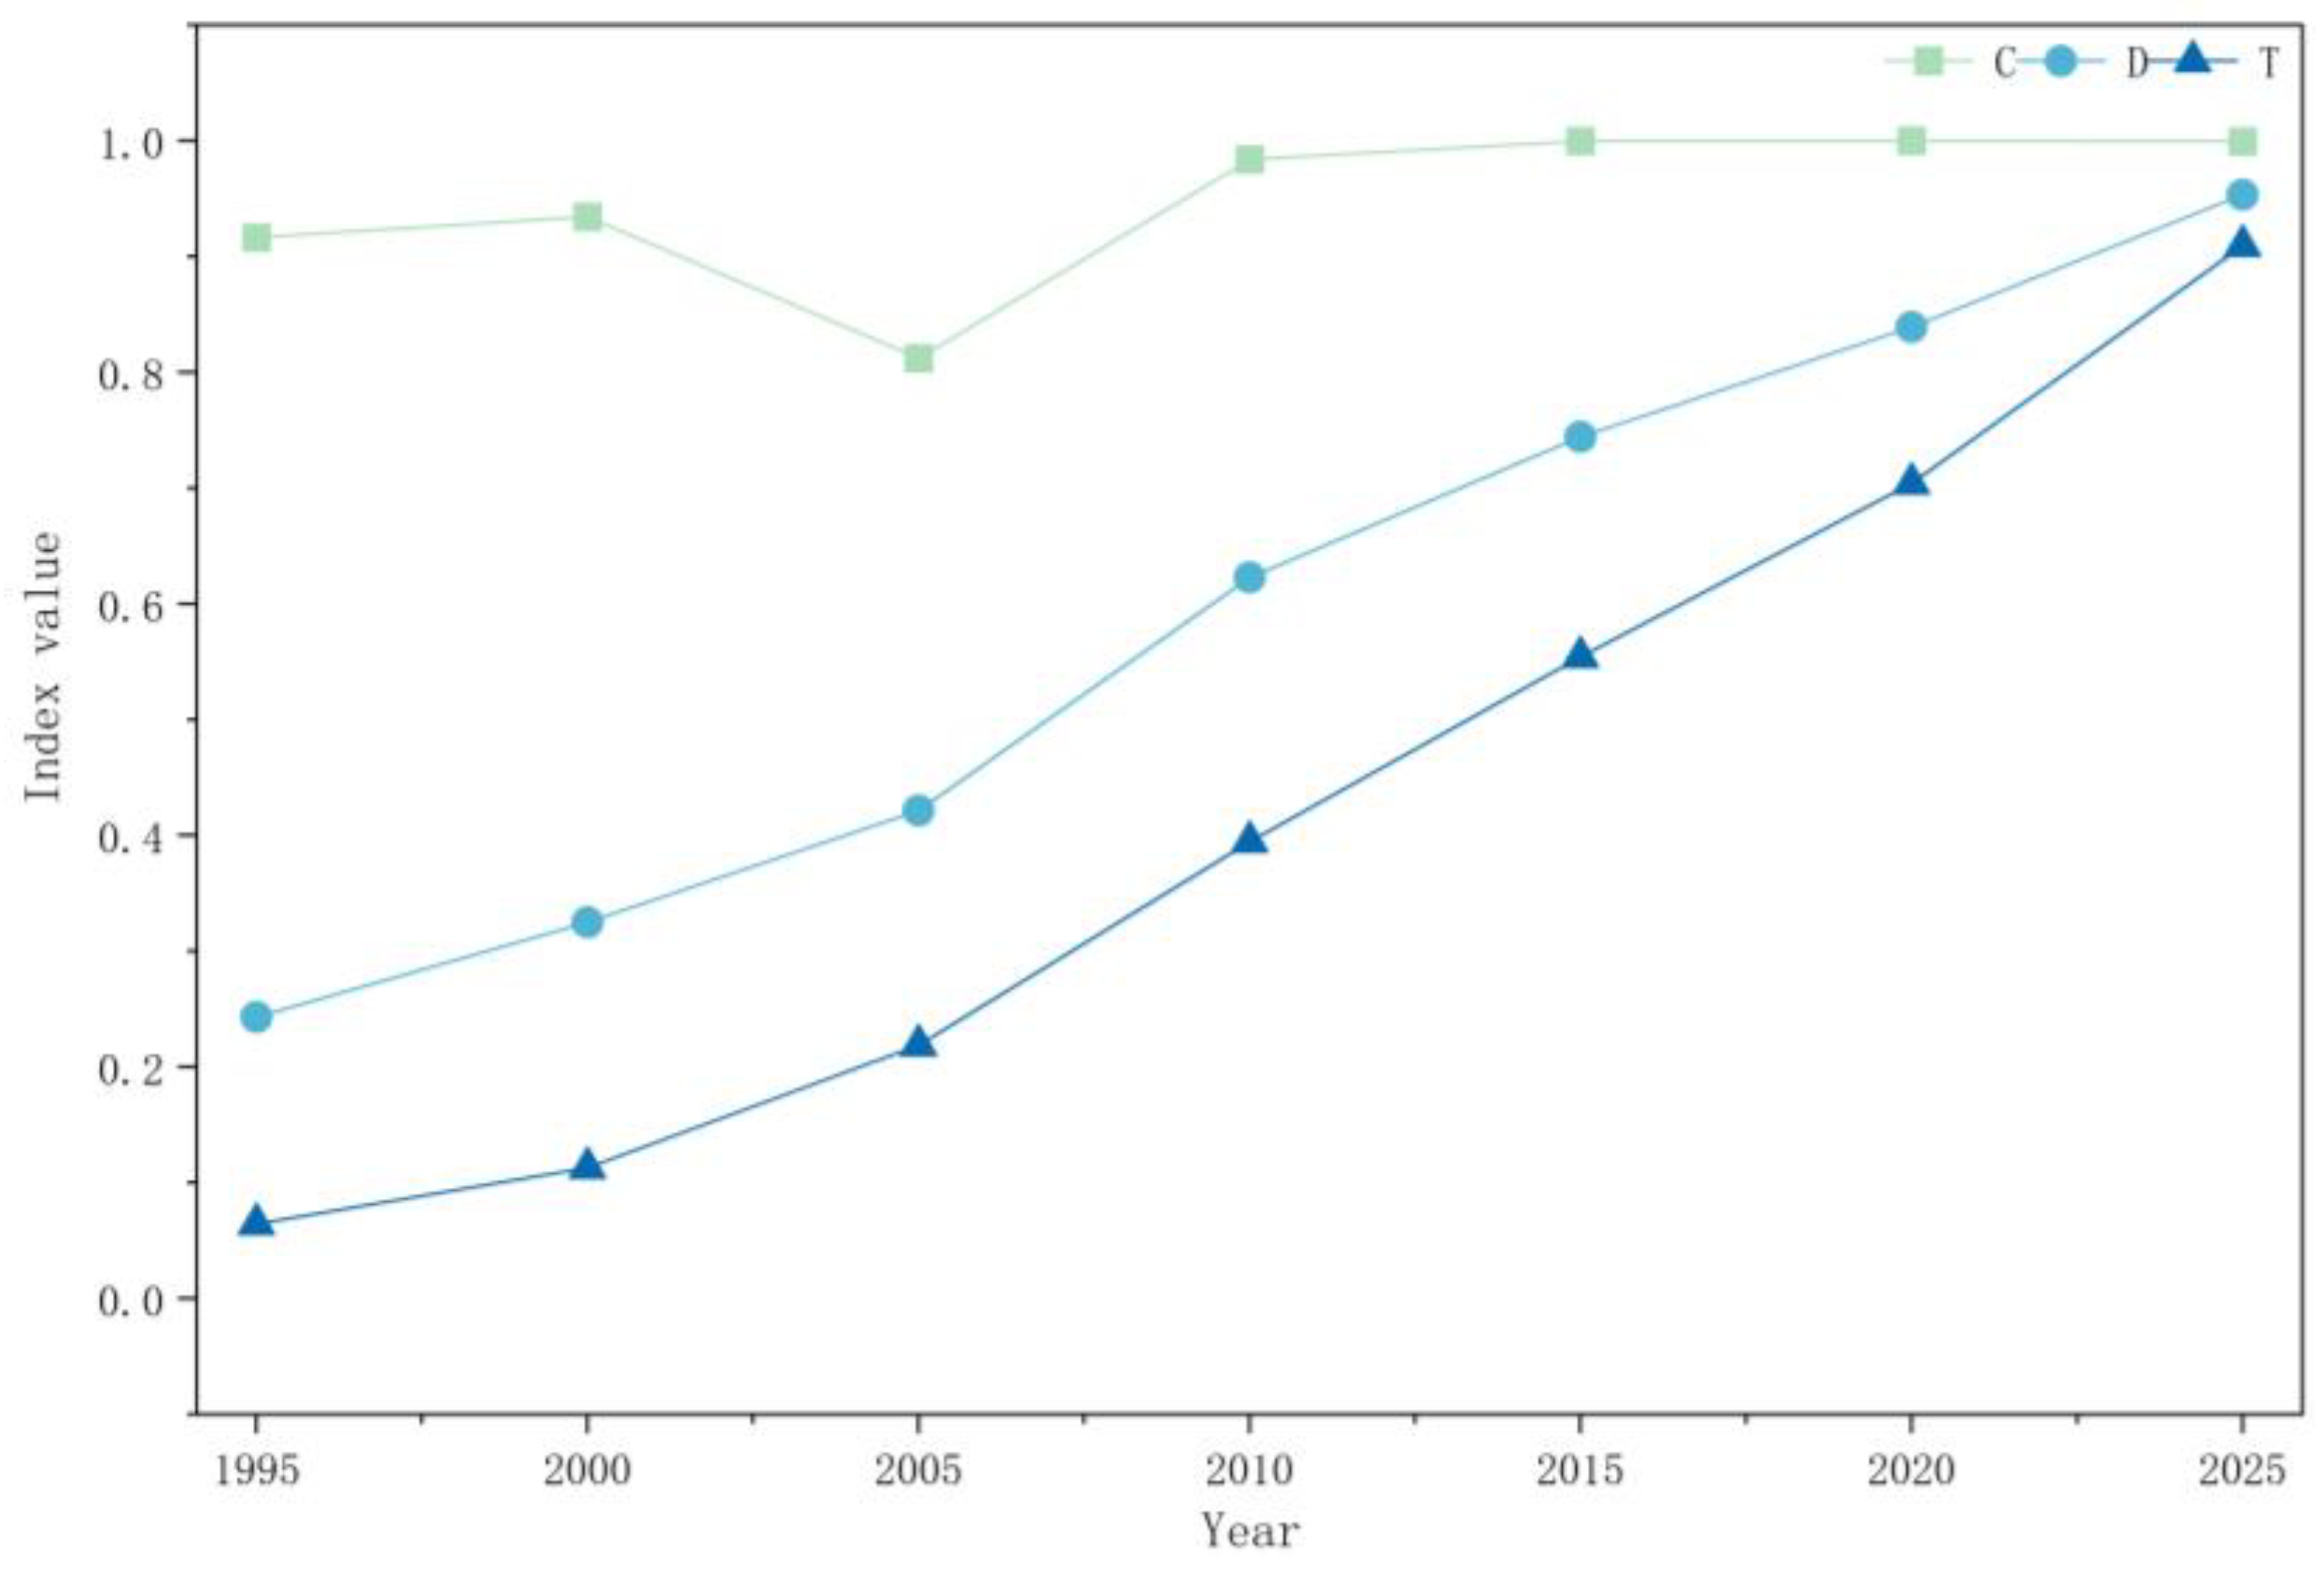
From the perspective of coupling degree C, the coupling degree between the aboveground system and the underground public space in Shanghai remained above 0.80 throughout the period from 1995 to 2025, indicating that the comprehensive evaluation scores of the two subsystems were relatively close in numerical level. The coupling degree C showed a trend of rising first and then stabilizing within the study period: from 1995 to 2000, the C value slightly increased from 0.9166 to 0.9343; in 2005, it briefly dropped to a low point of 0.8121, and then rapidly recovered and stabilized at 0.9837 in 2010, and remained above 0.999 after 2015, indicating that the scores of U1 and U2 are tending towards balance. It should be noted that a high coupling degree merely represents the numerical matching of the scores and does not directly equate to the actual realization of close linkage in the real space. The brief decline in 2005 corresponded to a relatively low overall score for underground public spaces in the calculation results; subsequently, as the overall score for underground public spaces continued to increase rapidly, C returned to the balanced range and remained close to 1.
In contrast, the evolution trajectory of coupling coordination degree D presents more complex phased characteristics. The D value steadily increased from 0.2431 in 1995 to 0.9532 in 2025, indicating a qualitative leap in the coordinated development level between the two systems. It is notable that the trends of the D value and C value are significantly different: the C value remained at a high level throughout the study period, while the D value experienced a gradual increase from low to high. This difference confirms the theoretical advantages of the coupling coordination degree model: coupling degree C only reflects the degree of numerical matching of the comprehensive scores of the two subsystems. It cannot directly characterize the interaction intensity of the real system and cannot distinguish whether this numerical matching is generated at a low-level equilibrium or a high-level equilibrium, whereas the coupling coordination degree D, by introducing the comprehensive development index T, can more realistically depict the coordinated development degree of the two systems in a benign resonance state.
From the perspective of the comprehensive development index T, its value increased from 0.0645 in 1995 to 0.9092 in 2025, reflecting the continuous improvement of the overall development level of the two systems. The growth trajectory of the T value is highly consistent with that of the D value, indicating that the improvement of coupling coordination degree is mainly attributed to the improvement of the development levels of the two systems themselves, rather than solely relying on the increase in coupling strength.

3.2.2. Coupling Coordination Stage Division and Characteristics

Based on the calculation results of the D value and the classification standards, the evolution of the coupling coordination degree of the aboveground system and the underground public space in Shanghai’s old urban areas from 1995 to 2025 can be divided into the following three stages:
(1)
Low Coupling Coordination Stage (1995–2005)
The aboveground system developed slowly, while the underground public space was in its infancy. The D value increased from 0.2431 to 0.4216, corresponding to a transition from moderate imbalance (in 1995) to near-imbalance (in 2005). The core feature of this period was that the development level of the aboveground system, U1, was significantly higher than that of the underground public space, U2. Take 1995 as an example. The overall score of the aboveground system was significantly higher than that of the underground public space. The underground public space was still in its infancy. Although the coupling degree C remained above 0.81, indicating that the numerical matching of the scores of U1 and U2 was acceptable, the overall scores of both systems were still at a low level. Especially, the underground public space lagged significantly, with the comprehensive development index T ranging from 0.0645 to 0.2189, and the coupling coordination degree D was also at a low level. In 2005, the D value reached 0.4216, entering the range of near-imbalance, laying the critical foundation for the accelerated development in the next stage.
This is the basis for 2005 as the end point of the first stage: Firstly, the D value exceeded 0.4 for the first time in this year, moving from “moderate imbalance” to “near-imbalance”, marking the first critical point of the coupling coordination grade transition. Secondly, around 2005, it was the beginning of the “11th 5-Year Plan” in China, and the focus of urban construction began to shift from simple aboveground expansion to a coordinated approach of aboveground and underground. More importantly, the underground space planning for the Shanghai World Expo venues was initiated around this time, and the preliminary planning and design work for projects such as the World Expo Axis Underground Complex were carried out during this period [74]. This event coincided in time with the subsequent large-scale development of underground spaces. Therefore, 2005 was both a data-driven turning point and a policy-driven starting point.
This stage indicates that in the early stage of upgrading old urban areas, the improvement of the aboveground systems did not lead to the simultaneous development of the underground public spaces; although the comprehensive score ratios calculated by the model were relatively close, no substantive synergy effect has been formed at the practical level.
(2)
General Coupling Coordination Stage (2005–2015)
The underground public space accelerated its rise, and the gap between the two systems narrowed rapidly.
The D value increased from 0.4216 to 0.7444, corresponding to a transition from near-imbalance (in 2005) to intermediate coordination (in 2015), marking a qualitative change in the coupling coordination grade. The most significant change during this period was the rapid improvement of the development level in the underground public space. In 2005, U2 was only 0.091, and it rapidly increased to 0.324 in 2010 and further reached 0.541 in 2015. From 2005 to 2015, the relative gap in the comprehensive scores of the aboveground and underground systems narrowed sharply, and by 2015, the development levels of the two systems were approaching each other. At the same time, the coupling degree C reached 0.9837 in 2010 and continued to rise to 0.9997, indicating that the comprehensive scores of the aboveground and underground subsystems tended to be highly balanced numerically. The comprehensive development index T also increased from 0.2189 to 0.5543, providing a solid foundation for the leap in coupling coordination degree.
This is the basis for 2015 as the end point of the second stage: Firstly, the D value exceeded 0.7 for the first time in this year, entering the “intermediate coordination” range, marking the transition of the two systems from “barely coordinated” to a substantive coordinated stage. Secondly, 2015 was a crucial turning point when the subsequent effects of the Shanghai World Expo were fully unleashed. The underground space within the Expo site was completed and put into use around 2010. Its exemplary effect, after 5 years of transmission and diffusion, transformed into a nationwide underground space development boom around 2015. Additionally, the “Regulations on the Planning and Construction of Underground Spaces in Shanghai” were released and implemented at the end of 2013 and entered the implementation stage in 2014–2015. The introduction of this regulation coincided with the stage of standardization and regulation of underground spaces. Finally, in 2015, U1 (0.557) and U2 (0.514) were basically equal for the first time, indicating a structural change in the relative relationship of the comprehensive scores of the two subsystems in the calculation results. The comprehensive score of underground public spaces ended its long-term lag behind the aboveground system and gradually approached the score of the aboveground system within the model evaluation system. However, this result is only the output of the index calculation and does not equate to the actual functional synergy that both systems have achieved in reality.
The data from this stage indicate that the development of underground public spaces has outpaced that of the aboveground systems, and the gap in their scores has rapidly narrowed. In terms of time sequence, there is a trend towards synergy in their evolution trajectory.
(3)
Higher coupling coordination stage (2015–2025)
The two systems deepened their collaboration and moved towards high-quality coordination.
The D value increased from 0.7444 to 0.9532, corresponding to the level crossing from intermediate coordination (2015) to high-quality coordination (2025). The prominent feature of this period was that both systems had reached a relatively high level of development. The development level of the underground public space U2 (0.878 in 2025) was slightly lower than that of the aboveground system U1 (0.945 in 2025), but the relative gap in the comprehensive scores of the two systems had significantly narrowed, presenting a highly balanced development pattern. The coupling degree C remained above 0.999 at the end of the study period, indicating a high degree of balance in the scores of U1 and U2. This result is only a mathematical calculation outcome and does not represent the actual functional-level close linkage between the aboveground and underground spaces in reality. The comprehensive development index T exceeded 0.90, reaching 0.9092, providing sufficient impetus for the coupling coordination degree to enter the high-quality coordination range. The growth rate of the D value slowed down after 2015, with an average annual increase of approximately 5.1%, lower than the average annual growth rate (about 5.8%) of the general coupling coordination stage (2005–2015). This change was not a stagnation in coupling coordination development but reflected the base effect of the coordination level. When the D value approaches 1, the growth rate naturally slows down. At the same time, this might also mean that the coordinated development of the two systems is transitioning from scale expansion-driven to content improvement-driven, and future coordination upgrades will rely more on the improvement of factors such as functional complementarity, spatial connection, and environmental integration.
The endpoint for the research is 2025: 2025 is the end-of-period year, with the D value reaching 0.9532, entering the “high-quality coordination” range (≥0.9), marking a clear endpoint coordinate for the entire research period. The opening of this stage was highly consistent with the policy orientation of Shanghai’s urban renewal entering the “quality improvement of existing assets” stage and the shift of underground space development from scale expansion to refined utilization. According to the relevant deployments of the “Shanghai Urban Renewal Regulations” (2021) and the “Special Plan for Underground Spaces in Shanghai”, the development focus of the underground space in old urban areas has shifted from “building more” to “using well”, which is consistent with the judgment of the slowdown in D value growth and the transformation of coordination mode.
It should be noted that the coupling degree C is a function of the U1 and U2 ratios, and its numerical value mainly reflects the relative relationship of the development levels of the two systems. After 2010, as the development levels of the two systems approached equilibrium, the C value remained consistently above 0.98. At this time, the coupling coordination degree D ≈; that is, D approximated to be a monotonic transformation of the comprehensive development index T. This means that in the later stage, the coupling degree C no longer provides additional information beyond the T value, and the change in coupling coordination degree is mainly driven by the improvement of the average development level of the two systems. This characteristic does not affect the core findings of this study: The coupling degree C dropped from 0.9166 to 0.8121 in the early stage (1995–2005), indicating an expansion in the gap between the comprehensive scores of the two systems. This signal suggests the possibility of an imbalance in the matching between the aboveground and underground aspects in reality, and this information cannot be captured solely by the comprehensive development index T; while the stage division and trend judgment of the coupling coordination degree D are based on the joint evidence of D values and T values, and the subsequent obstacle analysis further explains the driving mechanism of the coordinated evolution from the factor level.
Overall, the coupling coordination degree of the aboveground system and the underground public space in the old urban areas of Shanghai have undergone a gradual improvement from a low level to a higher level. This evolution reflects the differentiated growth of the comprehensive evaluation index for public spaces above and below ground and reveals the profound transformation of the urban renewal concept from prioritizing aboveground areas to a coordinated approach that accounts for both aboveground and underground areas. Currently, the two systems have entered a high-quality coordinated stage. Future work should shift the focus from scale expansion to content improvement and strive to solve the development bottlenecks of the aboveground system, promoting the two systems to achieve a higher-level deep integration.

3.3. Analysis of Obstacle Factors

3.3.1. Analysis of Obstacle Degree at the Target Layer

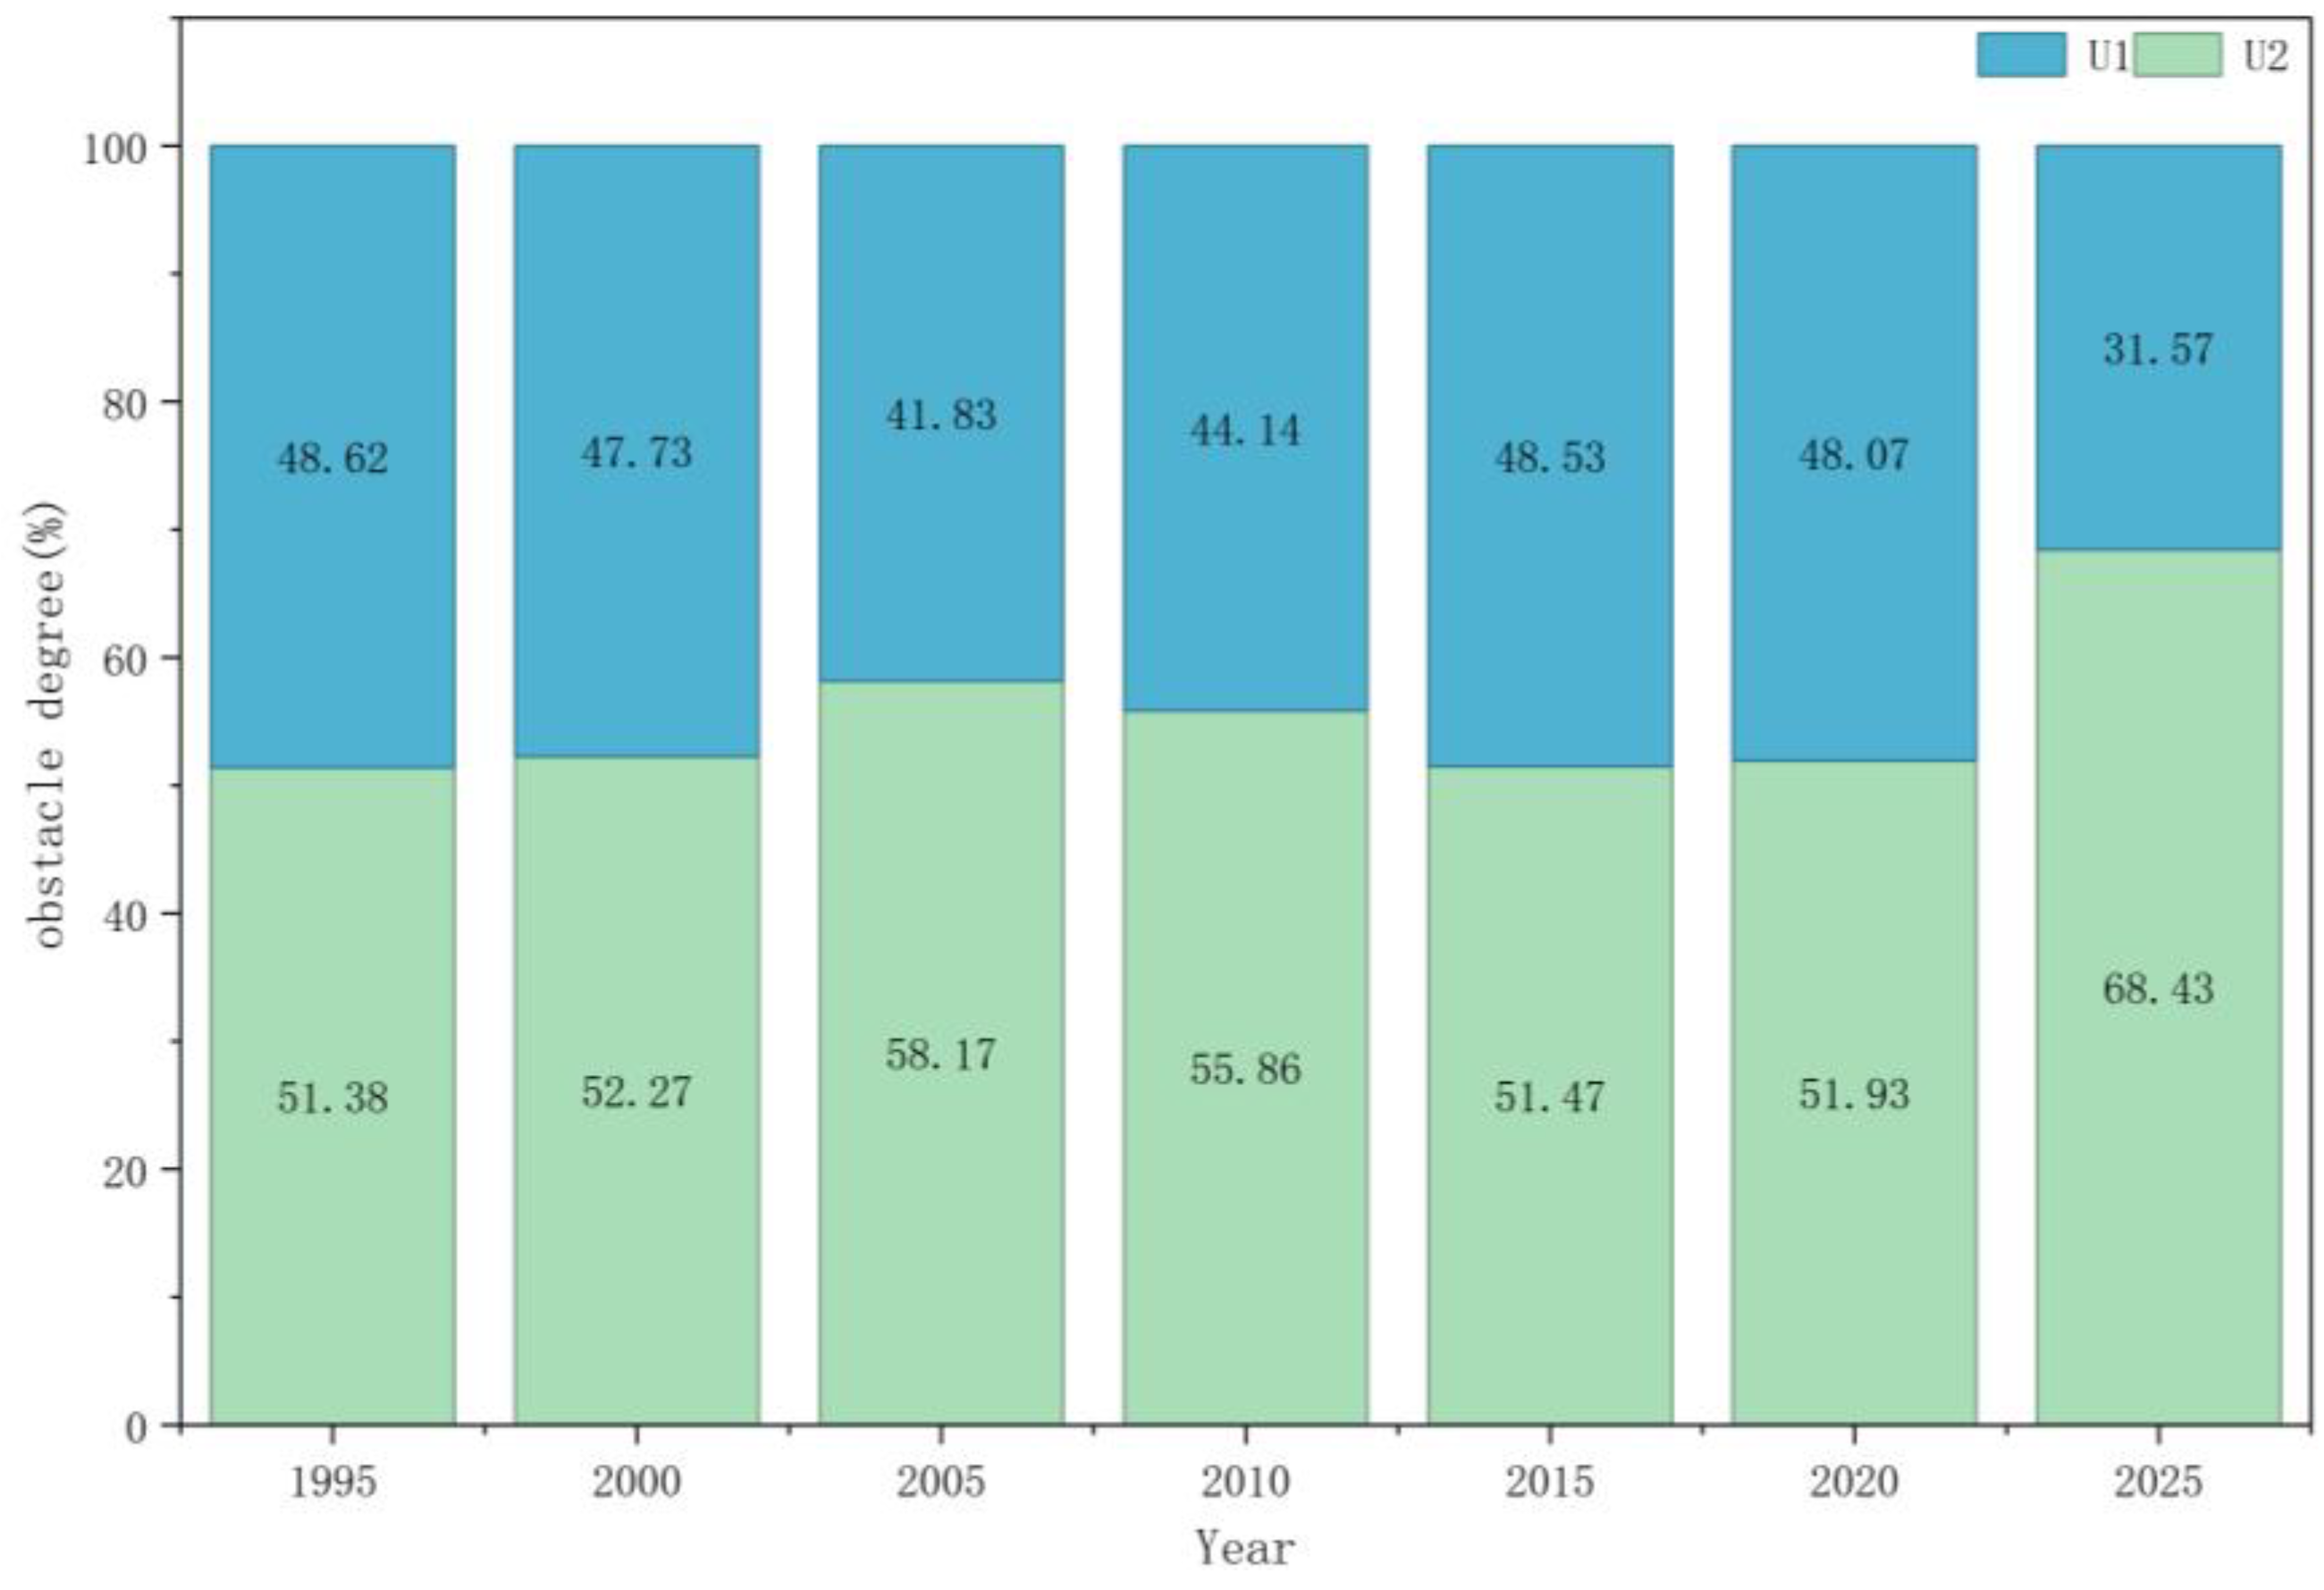
The calculation results of the obstacle degree at the subsystem layer (Figure 8) show that the obstruction contributions of the aboveground subsystem (U1) and the underground subsystem (U2) to the coupling coordination degree D exhibit a consistent evolution pattern with the coupling coordination stage throughout the study period.
Low coupling coordination stage (1995–2005): The obstacle degree of the underground subsystem continued to rise, becoming the dominant factor restricting the development of coordination. In 1995, the obstacle degree of the underground subsystem was 51.38%, slightly higher than that of the aboveground subsystem; by 2005, the obstacle degree of the underground subsystem had climbed to 58.17%, reaching the first peak within the study period. This change was highly consistent with the trend of coupling degree C decreasing from 0.9166 to 0.8121 during the same period. The severe lag in the development level of underground public spaces is in perfect alignment with the low value of the comprehensive development index T, the decline in coupling degree C, and the low level of coupling coordination degree D in terms of time sequence.
General coupling coordination stage (2005–2015): The obstacle degrees of the two subsystems tended to be balanced. With the accelerated advancement of underground public space construction, the obstacle degree of the underground subsystem gradually decreased from 58.17% in 2005 to 51.47% in 2015, and the obstruction contributions of the aboveground and underground subsystems to D tended to be balanced. During this stage, the gap in the development levels of the two systems rapidly narrowed, and the coupling degree C rose above 0.98, eliminating the risk of coupling imbalance and creating conditions for the coupling coordination degree D to rise from the verge of imbalance (D = 0.4216 in 2005) to intermediate coordination (D = 0.7444 in 2015).
High coupling coordination stage (2015–2025): The obstacle degree of the underground subsystem rose again, highlighting structural issues. In 2025, the obstacle degree of the underground subsystem jumped to 68.43%, reaching the highest level within the study period. However, unlike the low coupling coordination stage, this increase in the obstacle degree of the underground subsystem was not due to insufficient scale but was caused by structural factors such as functional configuration and complexity. This transformation indicates that the main contradiction restricting the coordination of the two systems has shifted from “lack of quantity” to “quality bottleneck”, which is consistent with the judgment that the coupling coordination degree D has slowed down its growth rate and urgently needs to enhance its connotation after entering the high-quality coordination range.

3.3.2. Analysis of Obstacle Degree at the Indicator Level

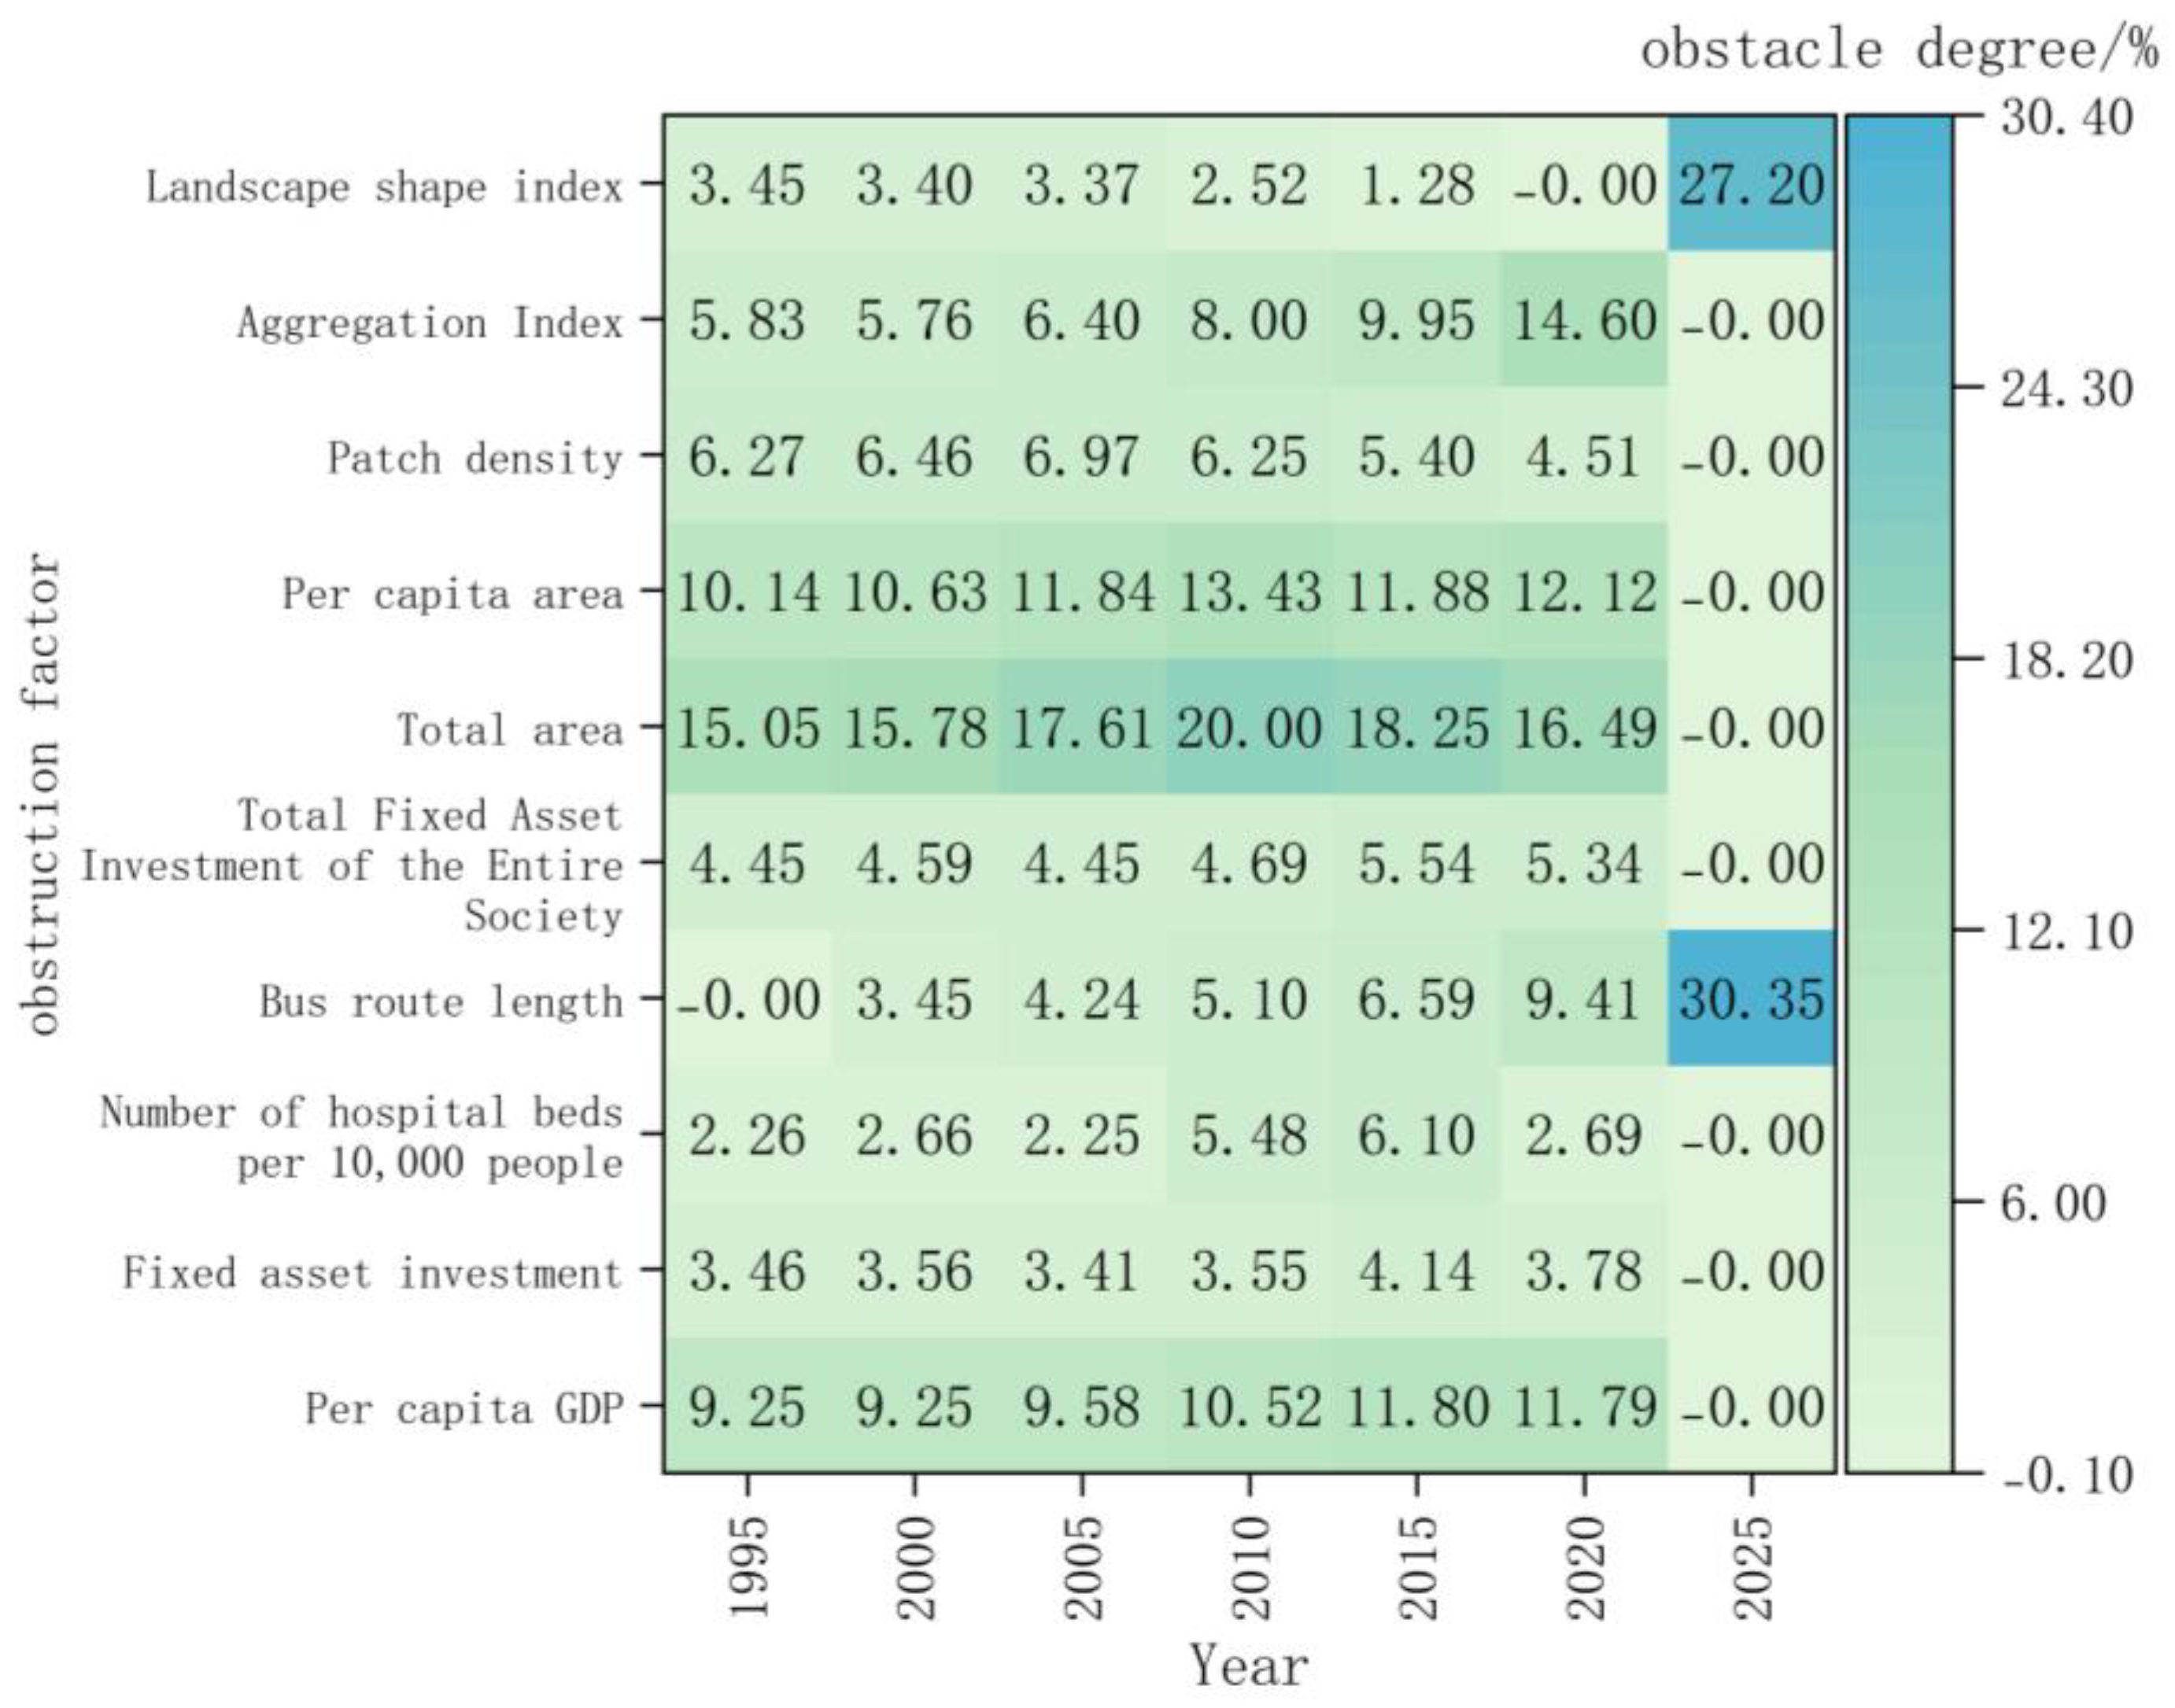
To avoid obstacle degree analysis at the target level from masking the individual differences of indicators, the obstacle factors at the indicator level were further identified, and a heat map was drawn (Figure 9). The top five obstacle factors in terms of average obstacle degree were selected for analysis (Table 6). The average obstacle degree of the main obstacle factors is shown in Table 5.
Low-coupling coordination stage (1995–2005): The indicators of the underground public space scale category occupied an absolute dominant position. During this stage, the obstacle degree of the total area remained the highest, with 15.05% in 1995 and rising to 17.61% in 2005; the per-capita area and patch density ranked second and third, respectively, and the combined obstacle degree of these three factors exceeded 30%, forming the core obstacle group that constrained the improvement of the coupling coordination degree D. In the aboveground system, the obstacle degree of per-capita GDP was relatively high, 9.25% in 1995 and 9.58% in 2005, showing a slight fluctuation. In addition, the obstacle degree of total social fixed asset investment entered the top five in 1995 and 2000. This result may be related to the fact that municipal data failed to fully reflect the relatively low investment levels in old urban areas. However, it still indicates that insufficient early investment has imposed a constraint on coordinated development.
General coupling coordination stage (2005–2015): The indicators of the underground public space scale category remained in the leading position, and the complexity of the form indicators began to emerge. The obstacle degree of the total area and per-capita area reached their peak in 2010 (20.00% and 13.43%) and then began to decline but remained in the top two until 2015. It is worth noting that the obstacle degree of the concentration index increased from 6.40% in 2005 to 9.95% in 2015, becoming the fifth-largest obstacle factor, indicating that the aggregation and fragmentation problems of the underground public space form began to emerge. At the same time, the obstacle degree of per-capita GDP in the on-ground system continued to rise, reaching 11.80% in 2015. Considering that the municipal data might overestimate the economic development level of old urban areas, the actual value of this obstacle degree might be even higher. This further highlights that the economic development level remained an important constraint factor for the on-ground system during this period. Additionally, the number of medical institution beds per 10,000 people ranked among the top five in 2010 (5.48%). Given that high-quality medical resources are relatively concentrated in old urban areas, the municipal data might have underestimated the actual obstacle degree of this indicator.
High-coupling coordination stage (2015–2025): The indicators of the aboveground and underground space form category rose to become the new dominant obstacles. In 2025, the obstacle degree of the bus line length in the aboveground space form indicators jumped to 30.35%, and the obstacle degree of the landscape shape index in the underground space form indicators rose to 27.20%, accounting for 57.55% of the total obstacle degree. At the same time, the obstacle degree of the scale adaptation indicators of the underground began to drop sharply to nearly zero. This significant structural reversal indicates that after 3 decades of rapid development, the scale shortcoming of the underground public space has been basically filled, while the accessibility of ground public transportation and the optimization of the form of underground public space have become new and the most urgent constraints. It should be noted that the length of the bus routes is based on municipal data. The old urban areas, which are densely populated with bus routes, may have a higher actual route density than the average for the entire city. Therefore, the obstacle index may have been underestimated in this regard. Moreover, the obstacle degree of the concentration index reached 14.60% in 2020 and then dropped to zero in 2025, indicating that the aggregation problem of underground space form has been effectively alleviated in the recent period, further confirming that the development focus of underground space is shifting from “scale expansion” to “form optimization”.

4. Discussion and Conclusions

4.1. Discussion

4.1.1. The Theory of Spatial Production Provides a Theoretical Explanation for the Three-Stage Evolution of Coupling and Coordination Between Aboveground and Underground Public Spaces

During the low coupling and coordination phase from 1995 to 2005, aboveground space was dominated by land development and housing construction, forming what Lefebvre termed “dominant spatial practices” [29]. Meanwhile, underground public space remained outside the discourse of urban planning, becoming an overlooked spatial representation. The coupling degree C decreased from 0.9166 to 0.8121, indicating that the gap in the scores of the integrated development of the aboveground and underground aspects widened during this period. This suggests a decline in the degree of matching between the numerical values of the two aspects. The calculation results of this model can be used as a reference for the phenomenon of the absence of planning and governance for underground public spaces in reality, but they cannot prove a direct causal relationship between the two. During this stage, the underground public space was neither included in the formal planning and governance framework nor received the institutional recognition commensurate with its functional potential. While barrier factors represented by per-capita GDP and total fixed asset investment in society persisted in the aboveground system, the core constraint on improving coordination stemmed from the scale deficiency of underground space: the combined barrier degrees of total area, per-capita area, and patch density exceeded 30%, indicating that the physical absence of underground space constituted the fundamental cause of low-level equilibrium.
During the general coupling and coordination stage from 2005 to 2015, local authorities issued various institutional documents related to underground space, such as the “Regulations on the Planning and Construction of Underground Space in Shanghai”. The timing of the policy introduction coincided with the rapid expansion of underground public spaces. The study explains this phenomenon using Harvey’s “space repair” theory: when the inherent contradictions within the existing spatial structure reach a certain level, there is a potential motivation for capital and power to create new space production fields to alleviate the contradictions. The rapid development of underground public spaces observed in the research is in line with the logical framework of this theory [76]. Barrier analysis shows that the barrier degrees for total underground area and per-capita area peaked in 2010 before declining, while the barrier degree for aggregation index rose from 6.40% to 9.95%. This indicates that while spatial repair addressed old contradictions, it simultaneously generated new ones; scale deficiencies were being remedied, but risks of fragmented morphology had already been embedded.
In the high coupling and coordination phase from 2015 to 2025, the physical scale of underground public space has largely met requirements, with barrier degrees for scale-related indicators sharply dropping close to zero. However, new contradictions have taken their place. The barrier degree for aboveground bus route length surged to 30.35%, while that for underground landscape shape index rose to 27.20%, together accounting for 57.55% of total barriers. This structural reversal indicates that the dominant factor constraining further coordination has shifted from “the presence or absence of underground space” to “the quality of morphological interplay between aboveground and underground spaces.” The aggregation index reached 14.60% in 2020 and then dropped to zero in 2025. This change coincided with the strengthening of underground space planning control measures during the same period, suggesting that the aggregation problem may have been alleviated, but the compatibility issue between the aboveground transportation corridors and the underground public spaces has not yet been resolved. This aligns with the core argument of the three-dimensional urbanization theory: underground public space development should not be seen as a simple extension of aboveground space but rather understood as a vertical urban process with its own distinct spatial logic, whose integration with surface systems ultimately depends on bidirectional compatibility at the morphological level rather than mere scale expansion [28].
Viewed over a longer timescale, the evolution path of the obstructive factors can help us understand the transformation process of high-density urban areas, which moves from extensive scale growth to intensive development, and then to quality improvement. The regenerative urbanism approach, which advocates shifting from damage reduction to proactive restoration of ecological and social systems [77], provides a valuable reference point for understanding this transition. When the benefits of scale expansion are exhausted, the connectivity of space, functional diversity, and environmental quality will become the key factors determining the quality of three-dimensional space development. Based on the time series identification results of the obstruction degree in the old urban areas of Shanghai, we can draw the following insights: Different stages of urban renewal require identifying the corresponding dominant obstacles and carrying out planning and institutional design based on local conditions; however, this study cannot confirm the causal effect between institutional intervention and the improvement of coordination levels, and the relevant judgments need to be further verified by subsequent research.

4.1.2. The Comparison Between Shanghai and Tokyo, Montreal Reveals the Diverse Paths of Three-Dimensional Urbanization

To further test the theoretical universality of the research findings, the coupled coordinated evolution of the aboveground and underground spaces in Shanghai was compared with that of Tokyo and Montreal. The underground space development in Tokyo began in the 1930s, and by the end of the 20th century, a highly mature aboveground and underground integrated system had been formed. Similar to Shanghai, Tokyo also underwent an evolution from traffic-oriented to commercial-oriented and then to comprehensive functional-oriented, and it faced the dilemma of fragmented underground space forms, leading to decreased space utilization efficiency. Subsequently, through institutional innovations such as the “Special Measures Law for the Public Use of Deep Underground Spaces” [78], the form integration and functional reorganization were promoted. The Tokyo case demonstrates that institutional innovation can be an alternative tool for addressing the constraints of underground space forms. Its actual effectiveness highly depends on the compatibility between institutional design and local spatial demands. However, this cross-national comparison merely provides an empirical reference and cannot prove that the institution was the direct driving factor for the evolution in the Shanghai stage. The underground city in Montreal is one of the largest underground pedestrian networks in the world. Its success lies in the deep integration of underground space with the subway system, ground buildings, and public squares [79]. Compared with Montreal, Shanghai still has a significant gap in the connection efficiency between ground transportation and underground space, with a 30.35% obstacle degree in the length of bus routes in 2025, while the seamless connection of aboveground and underground transportation transfer has always been its core competitiveness. The case of Montreal demonstrates that the forward-looking nature of planning design, the effective application of the public–private partnership model, and the successful operation of underground space are highly correlated in terms of time sequence. This observation offers potential insights for Shanghai: the coordinated advancement of aboveground and underground forms may require the joint efforts of planning control and a governance mechanism involving multiple stakeholders.
Overall comparison shows that Shanghai’s experience combines uniqueness and commonality. Its uniqueness lies in the strong government system that grants the ability for rapid institutional response, while its commonality is reflected in the general evolutionary path of underground public space development in high-density urban areas from scale expansion to form optimization and then to the synergy of aboveground and underground forms. Shanghai is currently at a critical node of transitioning from system integration to strategic planning, and the core bottleneck it faces has shifted from the initial shortage of scale to the optimization of the synergy between aboveground transportation corridors and underground public space forms.

4.1.3. The Research Findings Have the Potential for Cross-City Migration and Offer Insights for Sustainable Urbanization

The coupled coordination framework and obstacle diagnosis method of this study can be transferred to other cities with rapid expansion of underground space. Cities such as Shenzhen, Chengdu, and Wuhan also face a structural imbalance of “rapid aboveground development and slow underground development” in the early stage. The indicator system and obstacle evolution path of the study can be used as standardized tools for their forward-looking identification of bottlenecks.
Based on the overlapping characteristics in time sequence, a testable planning hypothesis can be proposed: The improvement of the institutional framework and the simultaneous advancement of spatial development may help enhance the level of coupling coordination, and the actual effectiveness of this approach needs to be verified through subsequent quantitative research.
From the perspective of urban resilience, underground public space has an irreplaceable role in enhancing adaptability capacity, redundancy, and functional continuity [8]. In Shanghai, the lag in the development of underground public spaces during the low-coupling coordination stage coincides highly with the insufficiency of urban resilience in terms of time sequence. This observation holds significance for high-density cities that are currently formulating resilience planning: Underground public space should not be excluded from the core agenda of urban resilience construction. The jump in the 2025 bus route length and landscape shape index as the dominant obstacle further indicates that the most urgent issue is the synergy between the accessibility of aboveground transportation and the complexity of underground public space morphology, rather than further expansion of scale.
For the medium and long term, the planning of aboveground and underground public spaces should go beyond the single goals of functional integration and land-use efficiency, and it should incorporate nature-based solutions and the concept of regenerative urbanism. Through blue–green infrastructure, such as underground rainwater storage, ground-source heat pumps, and underground greening, the ecological performance and climate adaptability of the underground public space should be enhanced, promoting the transformation of the underground public space from a resource-consuming type to an ecological gain type. This direction is in line with the international research frontiers on the support of underground public space for urban resilience and provides a transferable theoretical anchor for the sustainable development of similar high-density urban areas.

4.2. Conclusions

Based on the old urban areas of Shanghai as a case study, a comprehensive evaluation system covering 17 indicators of the aboveground system and 9 indicators of the underground public space was constructed. The weights were determined using the combination of the Analytic Hierarchy Process–Entropy Weight Method, the Coupling Coordination Degree Model, and the Obstacle Degree Model. The evolution laws and obstacle factors of the coupling coordination between the aboveground and underground public spaces in the old urban areas were systematically revealed, leading to the following main conclusions:
First, the development levels of both the aboveground system and the underground public space in Shanghai have been continuously rising, but there are significant differences in the development rhythms. The development level of the aboveground system U1 has steadily increased from 0.0902 in 1995 to 0.9427 in 2025, with a significant increase; the development level of the underground public space U2 has jumped from 0.0387 to 0.8758, with a more significant increase. After 2010, the underground public space entered a stage of rapid development. By 2015, its overall development level had approached that of the aboveground system. Since then, the two systems have maintained a synchronized upward trend, and the gap has gradually narrowed. Second, the coupling coordination degree of the two systems has undergone a gradual evolution from imbalance to coordination. The D value has increased from 0.2431 in 1995 to 0.9532 in 2025, which can be divided into three stages: the low-coupling coordination stage (1995–2005, D < 0.5), where the aboveground system dominated and the underground lagged, with a coupling degree C ranging from 0.9166 to 0.8121. Although the coupling degree values of the two systems were relatively high, their overall development levels were at a low level, belonging to a high-intensity interaction under low-level conditions and in a low-level equilibrium state; the general coupling coordination stage (2005–2015, D = 0.4216–0.7444), where the underground space accelerated its catch-up, and the gap between the development levels of the two systems narrowed sharply, with the coupling degree C rising to above 0.98, entering a substantive collaborative track; during the higher coupling coordination stage (2015–2025, D = 0.7444–0.9532), where the aboveground system continued to lead and the underground public space followed closely, the two systems entered a high-quality coordination pattern, but the growth rate slowed down. Third, the obstacle factors have evolved dynamically from scale shortage to complex morphology, and then to the coordination of the aboveground and underground morphologies. In the low-coupling coordination stage, the scale indicators of the underground public space occupied an absolute dominant position, and the total area, per-capita area, and patch density of the three indicators accounted for more than 30% of the total obstacle degree, forming the core obstacle group that restricted the improvement of the coupling coordination degree, while the per-capita GDP and total social fixed assets investment of the aboveground system also constituted secondary constraints. In the general coupling coordination stage, the scale indicators of the underground still ranked at the forefront, but the morphology complexity indicators began to emerge, with the obstacle degree of the aggregation index rising from 6.40% to 9.95%, indicating that the aggregation and fragmentation problems of the underground public space morphology began to emerge; during the same period, the obstacle degree of per-capita GDP of the aboveground system continued to rise, and the lag of public service facilities also posed certain constraints on coordinated development. In the higher coupling coordination stage, the length of aboveground bus lines and the landscape shape index of the underground rose as the new dominant obstacles, accounting for 57.55% of the total obstacle degree, while the obstacle degree of the scale indicators of the underground dropped sharply to nearly zero, indicating that the constraint bottleneck has shifted from “quantity shortage” to “quality bottleneck”, and the development focus of the underground public space is shifting from “scale expansion” to “morphology optimization”.
The theoretical contribution of the study lies in extending the coupling coordination degree model to the field of coordinated research on aboveground and underground spaces, constructing an evaluation index system specific to old urban areas, and compensating for the shortcomings of existing studies in dynamic quantitative analysis. The practical value lies in providing an operational quantitative analysis tool and decision-making reference for the renewal practices of old urban areas in Shanghai and other cities.
However, the research also has certain limitations. Firstly, the research subjects are limited to underground public spaces and do not cover other types of underground spaces, such as underground transportation facilities and underground municipal pipelines. Secondly, there is a problem of incompatible spatial scales: the underground public space data is strictly limited to the research boundary of the old urban areas, while the socio-economic indicators of the aboveground system lack long-term statistical data for the long-term period areas that match this boundary. Therefore, only Shanghai’s municipal statistical data can be used as a proxy variable. The municipal proxy variable may mask the internal differences between the old urban areas and other regions of Shanghai and may introduce systematic biases into the comprehensive index of the aboveground system. Therefore, in this study, we prioritize the interpretation of the temporal evolution trend, stage division, and the relative ranking of the obstructive factors. The interpretation of the sum of the absolute values of the comprehensive index and the obstructive degree of each indicator within the system should be carried out with caution. Again, the research is designed for a single case, and the external validity of the conclusion is limited. Finally, the study conducts analysis based on the long-term evolution and obstacle degree model, which can identify the temporal evolution characteristics and the main obstacle factors. However, due to the limitations of the research method, it is difficult to strictly identify the causal effect between policy events and the coordinated evolution of system coupling. The relevant causal inference needs to be further tested by subsequent panel econometric research.
Future research can expand in the following directions: Firstly, extend the research subjects to all types of underground spaces and establish a measurement system for the functional connectivity between aboveground and underground public spaces; Secondly, increase the number of time sections or use annual panel data, and construct a multi-city panel model to test the external validity of the research findings; Thirdly, introduce spatial multi-criteria analysis methods to integrate multi-dimensional benefit assessment; Fourthly, develop three-dimensional accessibility indicators to more accurately depict the connectivity efficiency of aboveground and underground spaces, providing more refined analytical tools for spatial planning in the context of three-dimensional urbanization.

Author Contributions

Conceptualization, Y.Z.; methodology, Y.Z. and R.L.; software, Y.Z.; validation, Y.Z.; formal analysis, Y.Z.; investigation, Y.Z.; resources, Y.Z.; data curation, Y.Z.; writing—original draft preparation, Y.Z.; writing—review and editing, Y.Z., R.L. and K.L.; visualization, Y.Z.; supervision, R.L. and K.L.; project administration, Y.Z.; funding acquisition, Y.Z. All authors have read and agreed to the published version of the manuscript.

Funding

This research received no external funding.

Institutional Review Board Statement

Not applicable.

Informed Consent Statement

Not applicable.

Data Availability Statement

The datasets used and analyzed during the current study are available from the corresponding author upon reasonable request.

Conflicts of Interest

The authors declare no conflicts of interest.

Appendix A. AHP Expert Basic Information and Expert Scoring Process

Appendix A.1. Expert Basic Information

Table A1. Expert Basic Information.
Expert NumberType of Affiliated InstitutionResearch Direction
01university Urban underground space planning, urban renewal
02university Urban morphology, three-dimensional urban planning
03university Urban design, integration of aboveground and underground spaces
04Planning and Design InstituteUrban overall planning, special planning for underground space
05Planning and Design InstituteMunicipal engineering, underground transportation hub design
06Government planning and management departmentUrban renewal policy formulation, land intensive utilization
07Government housing and construction departmentResidential area renovation, city health check and assessment
08Underground space development enterprisesDevelopment and operation of underground commercial complexes
09Underground space development enterprisesUnderground engineering construction, BIM application
10scientific research institutionsUrban complex system, coupling and coordination model

Appendix A.2. The Scoring Process of the Aboveground Space System Experts

Due to space constraints, only the complete scoring process of Expert 1 is presented here.
Table A2. The judgment matrix formed after the aggregation of the aboveground space system.
Aboveground SpaceEconomic
Development
Environmental QualitySpatial FormSocial WelfareGovernance
Efficiency
Wi
Economic Development1.00004.47215.64872.16893.36590.4316
Environmental Quality0.22361.00002.65640.26230.44270.0891
Spatial Form0.17700.37641.00000.21000.33730.0521
Social Welfare0.46113.81204.76231.00002.76630.2850
Governance Efficiency0.29712.25872.96490.36151.00000.1423
Consistency ratio of the judgment matrix: 0.0347.
Table A3. The judgment matrix after aggregation—Economic Development.
Economic DevelopmentPer-Capita GDP Ratio of Secondary and
Tertiary Industries
Fixed Asset InvestmentWi
Per capita GDP1.0000 2.8471 4.2321 0.6157
Ratio of secondary and tertiary industries 0.3512 1.0000 2.7663 0.2660
Fixed asset investment0.2363 0.3615 1.0000 0.1183
Consistency ratio of the judgment matrix: 0.0414.
Table A4. The judgment matrix after aggregation—Social Welfare.
Social WelfareNumber of Hospital Beds per 10,000
People
Per-Capita
Housing Floor Area
Urban Residents’
Engel’s Coefficient
Population Density Wi
Number of hospital beds per 10,000 people1.0000 2.5508 0.3615 4.3453 0.2788
Per capita housing floor area0.3920 1.0000 0.3114 2.0965 0.1402
Urban residents’ Engel’s coefficient2.7663 3.2113 1.0000 4.8384 0.5046
Population density 0.2301 0.4770 0.2067 1.0000 0.0765
Consistency ratio of the judgment matrix: 0.0378.
Table A5. The judgment matrix after aggregation—Environmental Quality.
Environmental Quality Environmental
Protection Investment
Greenery Coverage of Urban AreaCity Sewage Treatment RateWi
Environmental Protection Investment1.00000.24220.42510.1267
Greenery coverage of urban area4.12891.00002.96490.6230
City sewage treatment rate2.35220.33731.00000.2503
Consistency ratio of the judgment matrix: 0.0294.
Table A6. The judgment matrix after aggregation—Spatial Form.
Spatial FormArea of Buildings Above the 8th Floor Road LengthRoad AreaBus Route LengthWi
Area of buildings above the 8th floor1.00000.20000.33330.48010.0809
Road length5.00001.00002.76634.67620.5425
Road area3.00000.36151.00003.08760.2588
Bus route length2.08280.21380.32391.00000.1179
Consistency ratio of the judgment matrix: 0.0389.
Table A7. The judgment matrix after aggregation—Governance Efficiency.
Governance EfficiencyPolicy
Completeness
Total Fixed Asset Investment of the Entire Society Completed Renovation Area Wi
Policy completeness1.00002.31250.34710.2574
Total Fixed Asset Investment of the Entire Society 0.43241.00000.27420.1360
Completed renovation area2.88083.64741.00000.6066
Consistency ratio of the judgment matrix: 0.0389.

Appendix A.3. The Aggregated Judgment Matrix of the Underground Public Space System

Table A8. The aggregated judgment matrix of the underground public space system.
Underground Public Space SystemFunctional DiversityScale AdaptationMorphological
Characteristics
Wi
Functional Diversity1.00000.21520.37640.1125
Scale Adaptation4.64621.00003.28380.6451
Morphological Characteristics2.65640.30451.00000.2424
Consistency ratio of the judgment matrix: 0.0426.
Table A9. The judgment matrix after aggregation—Functional Diversity.
Functional DiversityNumber of Function
Categories
Functionality Mix DegreeFunctional Entropy
Index
Wi
Number of function categories1.00004.31742.31250.5882
Functionality Mix Degree0.23161.00000.34710.1179
Functional entropy index0.43242.88081.00000.2939
Consistency ratio of the judgment matrix: 0.0201.
Table A10. The judgment matrix after aggregation—Scale Adaptation.
Scale AdaptationTotal AreaPer Capita AreaWi
Total area1.00001.78260.6406
Per capita area0.56101.00000.3594
Consistency ratio of the judgment matrix: 0.0000.
Table A11. The judgment matrix after aggregation—Morphological Characteristics.
Morphological
Characteristics
Patch
Density
Aggregation
Index
Landscape Shape IndexArea-Weighted Average Fractal DimensionWi
Patch density1.00002.55083.64574.92740.5073
Aggregation Index0.39201.00003.08763.72790.2842
Landscape shape index0.27430.32391.00002.44950.1332
Area-weighted average fractal dimension0.20290.26820.40821.00000.0753
Consistency ratio of the judgment matrix: 0.0444.

Appendix A.4. The Final AHP Weight Results Aggregated by All Experts

Table A12. The final AHP weight results aggregated by all experts.
Target LayerCriterion LayerIndicator LayerWeight
Aboveground Spaceeconomic developmentPer-capita GDP 0.2676
Ratio of secondary and tertiary industries0.1156
Fixed asset investment0.0514
social welfarePopulation density0.0219
Urban residents’ Engel’s coefficient0.1445
Number of hospital beds per 10,000 people 0.0798
Per capita housing floor area0.0401
environmental qualityEnvironmental Protection Investment 0.0114
Greenery coverage of urban area0.0559
City sewage treatment rate0.0225
spatial formArea of buildings above the 8th floor 0.0043
Road length0.0285
Road area0.0136
Bus route length0.0062
governance efficiencyPolicy completeness0.0352
Total Fixed Asset Investment of the Entire Society 0.0186
Completed renovation area 0.083
Underground Public Spacesfunctional diversityNumber of function categories0.0662
Functionality Mix Degree0.0133
Functional entropy index0.0331
Scale adaptationTotal area0.4133
Per-capita area0.2318
morphological characteristicsPatch density0.123
Aggregation Index0.0689
Landscape shape index0.0323
Area-weighted average fractal dimension0.018

References

  1. Liu, Y.; Shen, L.-Y.; Ren, Y.-T. Regeneration towards suitability: A decision-making framework for determining urban regeneration mode and strategies. Habitat Int. 2023, 138, 102870. [Google Scholar] [CrossRef] [Scilit]
  2. Lydon, M.; Garcia, A. Tactical Urbanism: Short-Term Action for Long-Term Change; Island Press: Washington, DC, USA, 2015. [Google Scholar]
  3. Cui, J.; Broere, W.; Lin, D.-G. Underground space utilisation for urban renewal. Tunn. Undergr. Space Technol. 2021, 108, 103726. [Google Scholar] [CrossRef] [Scilit]
  4. Li, K.; Shao, J.; Lin, R.; Zhang, X. The research on the evaluation framework and application of urban three-dimensional (aboveground and underground) regeneration sensitivity—Taking Kunshan Old City in China as an example. Tunn. Undergr. Space Technol. 2025, 159, 106428. [Google Scholar] [CrossRef] [Scilit]
  5. Morán Uriel, J.; Camerin, F.; Córdoba Hernández, R. Urban horizons in China: Challenges and opportunities for community intervention in a country marked by the Heihe–Tengchong line. In Diversity as Catalyst: Economic Growth and Urban Resilience in Global Cityscapes; Siew, G., Allam, Z., Cheshmehzangi, A., Eds.; Springer: Singapore, 2024; Volume 6, pp. 103–125. [Google Scholar] [CrossRef] [Scilit]
  6. Liang, Y.; Qian, Q.K.; Li, B.; Zhao, M. A critical assessment on China’s old neighborhood renovation: Barriers analysis, solutions and future research prospects. Energy Build. 2025, 332, 115407. [Google Scholar] [CrossRef] [Scilit]
  7. Bobylev, N. Mainstreaming sustainable development into a city’s master plan: A case of urban underground space use. Land Use Policy 2009, 26, 1128–1137. [Google Scholar] [CrossRef] [Scilit]
  8. Admiraal, H.; Cornaro, A. Future cities, resilient cities—The role of underground space in achieving urban resilience. Undergr. Space 2020, 5, 223–228. [Google Scholar] [CrossRef] [Scilit]
  9. Yuan, H.; He, Y.; Wu, Y. A comparative study on urban underground space planning system between China and Japan. Sustain. Cities Soc. 2019, 48, 101541. [Google Scholar] [CrossRef] [Scilit]
  10. Zhu, H.; Huang, X.; Li, X.; Zhang, L.; Liu, X. Evaluation of Urban Underground Space Resources Using Digitalization Technologies. Undergr. Space 2016, 1, 124–136. [Google Scholar] [CrossRef] [Scilit]
  11. Lai, Y.; Wang, Y.; Cheng, J.; Chen, X.; Liu, Q. Review of constraints and critical success factors of developing urban underground space. Undergr. Space 2023, 12, 137–155. [Google Scholar] [CrossRef] [Scilit]
  12. He, L.; Song, Y.; Dai, S.; Durbak, K. Quantitative research on the capacity of urban underground space—The case of Shanghai, China. Tunn. Undergr. Space Technol. 2012, 32, 168–179. [Google Scholar] [CrossRef] [Scilit]
  13. Wen, Y.; Zhang, P.; Wei, J.; Yu, F.; Huang, C. Sustainable urban designs integrating aboveground microclimates and underground heat islands: A systematic review and design strategies. Renew. Sustain. Energy Rev. 2025, 212, 115445. [Google Scholar] [CrossRef] [Scilit]
  14. Loretta, V.D.T.; Sterling, R.; Zhou, Y.; Metje, N. Systems approaches to urban underground space planning and management—A review. Undergr. Space 2019, 5, 144–166. [Google Scholar] [CrossRef] [Scilit]
  15. Yi, R.; Yan, H.; Qi, M.; Zhang, Z.; Dong, Z.; Wang, Y.; Jiang, Y.; Zeng, J.; Jia, K. Suitability Evaluation of Urban Underground Space Development Based on Urban Planning. Geol. Explor. 2024, 60, 339–347. [Google Scholar]
  16. Wang, J. Underground City—Tokyo Underground Space Research. Des. Community 2022, 2, 52–67. [Google Scholar]
  17. Shi, H.; Wang, X.; Tian, J. Construction Experience of Underground City in Montreal, Canada. Tunn. Rail Transit 2005, 4, 54–57+62. [Google Scholar] [CrossRef]
  18. Xu, Y.; Chen, X. Quantitative analysis of spatial vitality and spatial characteristics of urban underground space (UUS) in metro area. Tunn. Undergr. Space Technol. 2021, 111, 103875. [Google Scholar] [CrossRef] [Scilit]
  19. Liu, S.C.; Peng, F.L.; Qiao, Y.K.; Dong, Y.-H. Quantitative evaluation of the contribution of underground space to urban resilience: A case study in China. Undergr. Space 2024, 17, 1–24. [Google Scholar] [CrossRef] [Scilit]
  20. Stanković, O.; Grbić, M.; Lalović, K. Underground space planning in Belgrade through deep city and smart city lenses: Barriers, benchmarks, and pathways. Tunn. Undergr. Space Technol. 2026, 176, 107880. [Google Scholar] [CrossRef] [Scilit]
  21. Hou, L.; Xu, Y.; Lei, J.; Zhao, J.; Zhao, J.; Chong, H.-Y.; Chen, Y. Sustainable urban space planning of underground logistics system using multi-source data fusion: A 3D space suitability evaluation framework. Sustain. Cities Soc. 2026, 136, 107111. [Google Scholar] [CrossRef] [Scilit]
  22. Hámor, T.; Rogers, C.D.F.; Kovács, J.; Hámor-Vidó, M. A good governance framework for strengthening the enhanced, more sustainable use of underground resources in Europe. Tunn. Undergr. Space Technol. 2026, 176, 107850. [Google Scholar] [CrossRef] [Scilit]
  23. Liu, Y.; Li, R.; Song, X. Analysis of the coupling degree of urbanization and ecological environment in China. J. Nat. Resour. 2005, 20, 105–112. [Google Scholar] [CrossRef]
  24. Wang, F.; Qian, Y.; Yan, X. Spatiotemporal Co-evolution and Scenario Assessment of Eco-environmental Quality Improvement and High-quality Economic Development in the Beijing-Tianjin-Hebei Urban Agglomeration. Environ. Sci. 2026, 1–17. [Google Scholar] [CrossRef]
  25. Zhao, K.; Peng, K. Spatial-Temporal Patterns and Driving Factors of Coordinated Development Between New Urbanization and Comprehensive Rural Revitalization. Econ. Probl. 2026, 3, 120–129. [Google Scholar] [CrossRef]
  26. Jin, X.; Sun, B.; Du, H. County-level assessment of coordinated relationship between land and population in urban China. Ecol. Indic. 2026, 186, 114907. [Google Scholar] [CrossRef] [Scilit]
  27. Miftah, A.Z.; Drianda, R.P.; Widianingsih, I.; Abdillah; Putri, S.S.U.; Adikancana, Q.M. Exploring a complex adaptive system in urban systems: Implications and future agenda. Urban Gov. 2026, 6, 280–292. [Google Scholar] [CrossRef] [Scilit]
  28. Connor, A.; McNeill, D. Geographies of the urban underground. Geogr. Compass 2022, 16, e12601. [Google Scholar] [CrossRef] [Scilit]
  29. Lefebvre, H. The Production of Space; Blackwell: Oxford, UK, 1991; pp. 25–46. [Google Scholar]
  30. Zhang, P.; Ghosh, D.; Park, S. Spatial measures and methods in sustainable urban morphology: A systematic review. Landsc. Urban Plan. 2023, 237, 104776. [Google Scholar] [CrossRef] [Scilit]
  31. Editorial Office of Urban Planning Forum. From spatial expansion to intensive development: Reflections on urban planning. Urban Plan. Forum 2016, 2, 1–9. [Google Scholar]
  32. Zhou, C.; Jing, W. Measurement and analysis on the coordination degree of new and old city areas: Taking Shanghai, Guangzhou, Xi’an and Tianjin as examples. Mod. Urban Res. 2018, 4, 82–89. [Google Scholar]
  33. Li, X.; Gong, P.; Zhou, Y.; Wang, J.; Bai, Y.; Chen, B.; Hu, T.; Xiao, Y.; Xu, B.; Yang, J.; et al. Mapping global urban boundaries from the global artificial impervious area (GAIA) data. Environ. Res. Lett. 2020, 15, 094044. [Google Scholar] [CrossRef] [Scilit]
  34. Pan, J.; Dai, W. Spatial-temporal characteristics in urban morphology of major cities in China during 1990–2010. Econ. Geogr. 2015, 35, 9–17. [Google Scholar] [CrossRef]
  35. Qian, H.; He, Y. The current situation, problems and countermeasures of underground space development and utilization in Shanghai. Chin. J. Undergr. Space Eng. 2024, 20, 25–32. [Google Scholar] [CrossRef]
  36. Wang, J. The “city growing downward”: Perspectives on underground space planning and development in megacity Shanghai. Resour. Guide 2023, 8, 56–57. [Google Scholar]
  37. Shanghai Municipal Bureau of Planning and Natural Resources. How to Plan and Develop Urban Underground Space: The Shanghai Experience. Available online: https://ghzyj.sh.gov.cn/hyxw/20230710/db1f814a075a4eb8b1ff7f401a2d5ba3.html (accessed on 27 October 2025).
  38. Shanghai Municipal People’s Congress Standing Committee. Shanghai Urban Renewal Regulation(Shanghai Municipal People’s Congress Standing Committee Announcement No. 77); Shanghai Municipal People’s Congress Standing Committee: Shanghai, China, 2021. [Google Scholar]
  39. Accelerating the Release of a Special Plan for Underground Space Development. Available online: https://www.shszx.gov.cn/shzx/wyxl/content/7fe4e41c-0c61-45df-aeb0-85ad8d84e7be.html (accessed on 27 October 2025).
  40. Shanghai Statistical Yearbook. 2024. Available online: https://tjj.sh.gov.cn/tjnj/index.html (accessed on 27 October 2025).
  41. Shanghai Statistical Communiqués and Yearbooks. Available online: https://tjj.sh.gov.cn/tjgb/index.html (accessed on 27 October 2025).
  42. Shanghai Water Authority (Shanghai Municipal Oceanic Bureau) Official Website. Available online: https://swj.sh.gov.cn/ (accessed on 27 October 2025).
  43. Dong, Y.H.; Peng, F.L.; Du, Y.; Men, Y.Q. Automatic identification and feature recognition of the metro-led underground space in China based on point of interest data. Undergr. Space 2023, 9, 186–199. [Google Scholar] [CrossRef] [Scilit]
  44. GB/T 40482-2021; Evaluation Indicators for Quality of City Development. State Administration for Market Regulation. National Standardization Administration Committee: Beijing, China, 2021.
  45. China Integrated City Index: Introduction to the Indicator System. Available online: https://cici-index.com/cn/about/ (accessed on 11 July 2026).
  46. Lin, Y.; Zhang, X.; Lu, Y.; Wang, Q. Research on classification and identification of land intensive use in plain city: Evaluation of 21 cities and counties in Jianghan Plain based on entropy weight method. J. Hum. Settl. West China 2024, 39, 122–128. [Google Scholar]
  47. Shi, C.; He, X.; Yan, Y. Spatiotemporal adaptation of urban recreationalization and human settlement quality and influencing factors: Taking the Yangtze River Delta region as an example. Prog. Geogr. 2025, 44, 958–974. [Google Scholar] [CrossRef] [Scilit]
  48. Yang, J.; Yang, Z. Adjustment and optimization of the carrying capacity of the ancient city of Suzhou for social sustainability. Urban Plan. Forum 2024, 3, 65–73. [Google Scholar] [CrossRef]
  49. Jiang, Y.; Yang, Y.; Tian, W. Research on level measurement, spatio-temporal differentiation of carbon ecological security in resource-based cities of the Yellow River Basin. Yellow River 2026, 48, 21–27. [Google Scholar]
  50. Li, H.; Meng, P.; Gong, Z.; Zhao, L. Comprehensive evaluation and driving factors of urban resilience in the Yellow River Basin. J. Desert Res. 2026, 46, 34–47. [Google Scholar]
  51. Qiu, L.; Chen, L.; Zhang, W. Renovation and relocation intentions among residents of old urban residential communities in the context of urban renewal: Taking the central urban area of Chongqing as an example. Prog. Geogr. 2025, 44, 2263–2279. [Google Scholar]
  52. Yi, C.; Wang, Y.; Yuan, J.; Liu, H. A study on the sustainability of urban renewal projects involving original demolition and reconstruction based on the PSR model. Urban Dev. Stud. 2026, 33, 92–99. [Google Scholar]
  53. Yang, Y.; Jiang, Y.; Tian, W.; Sun, L. Coupling coordination, spatio-temporal evolution and spatial agglomeration between urban resilience and carbon emission in resource-based cities of Yellow River Basin. Bull. Soil Water Conserv. 2025, 45, 259–268. [Google Scholar]
  54. Ke, X.; Li, J.; Li, C.; Chen, M. Spatial-temporal variation characteristics and influencing factors of urban renewal performance in Guangdong Province. China Land Sci. 2022, 36, 44–55. [Google Scholar]
  55. Xiao, J.; Tian, Y.; Feng, M.; Zhao, R. Investigation and evaluation of public spaces in old communities in severe cold regions. Archit. Cult. 2026, 2, 162–164. [Google Scholar]
  56. Yuan, T.; Wang, H. Logic and research progress on the publicization of urban historic districts in China. S. Archit. 2026, 105–114. [Google Scholar]
  57. Zhao, J.; Li, H.; Sun, Y. Evaluation of spatial integration in metro station areas from perspective of urban renewal: A case study of Shinan District, Qingdao, China. Tunn. Constr. 2026, 46, 46–59. [Google Scholar]
  58. Bobylev, N. Underground space as an urban indicator: Measuring use of the subsurface. Tunn. Undergr. Space Technol. 2016, 55, 40–51. [Google Scholar] [CrossRef] [Scilit]
  59. Peng, J.; Wang, Y.; Zhang, Y.; Wu, J.; Li, W.; Li, Y. Evaluating the effectiveness of landscape metrics in quantifying spatial patterns. Ecol. Indic. 2010, 10, 217–223. [Google Scholar] [CrossRef] [Scilit]
  60. Li, B.; Zhu, Y.; Yang, H. Mangrove wetland ecosystem health assessment in Beibu Gulf of Guangxi, China. Acta Sci. Circumst. 2026, 46, 439–455. [Google Scholar]
  61. Shekar, P.R.; Mathew, A. Integrated assessment of groundwater potential zones and artificial recharge sites using GIS and fuzzy-AHP: A case study in Peddavagu watershed, India. Environ. Monit. Assess. 2023, 195, 906. [Google Scholar] [CrossRef] [Scilit]
  62. Gong, J.; Jin, T.; Cao, E.; Wang, S.; Yan, L. Is ecological vulnerability assessment based on the VSD model and AHP–entropy method useful for loessial forest landscape protection and adaptive management? A case study of Ziwuling Mountain Region, China. Ecol. Indic. 2022, 143, 109379. [Google Scholar] [CrossRef] [Scilit]
  63. Tian, W.; Xu, Y.; Huang, Y. Comparative analysis of AHP and entropy weight method in urban street landscape evaluation. J. Southwest China Norm. Univ. Nat. Sci. 2020, 45, 147–153. [Google Scholar]
  64. Jia, Y.; Zhao, J.; Nan, Z.; Li, F. Ecological safety assessment of grassland based on the entropy-weight method: A case study of Gansu pastoral area. Chin. J. Ecol. 2006, 25, 1003–1008. [Google Scholar]
  65. Luo, H.; Liu, J.; Xu, J.; Wang, Y. Evaluation on rural community climate resilience in Qinling mountain area based on entropy method. J. Nat. Disasters 2022, 31, 111–118. [Google Scholar]
  66. Saaty, T.L. How to make a decision: The analytic hierarchy process. Eur. J. Oper. Res. 1990, 48, 9–26. [Google Scholar] [CrossRef] [Scilit]
  67. Saaty, T.L.; Tran, L.T. On the invalidity of fuzzifying numerical judgments in the analytic hierarchy process. Math. Comput. Model. 2007, 46, 962–975. [Google Scholar] [CrossRef] [Scilit]
  68. Deng, X.; Li, J.; Zeng, H.; Chen, W. Research on computation of AHP weight vector and its applications. Math. Pract. Theory 2012, 42, 93–100. [Google Scholar]
  69. He, J.; Zhou, D.; Dai, L. Study on evaluation system of urban elderly living related facilities based on demand theories. Archit. J. 2020, 2, 37–44. [Google Scholar]
  70. Peng, J.; Liu, K.; Zheng, F.; Xu, H. Evaluation for the suitability of underground space exploitation and utilization based on AHP. Chin. J. Undergr. Space Eng. 2010, 6, 688–694. [Google Scholar]
  71. Zhang, M.; Zhuang, H.; Li, B.; Wang, Q. Assessment on groundwater vulnerability in Pinggu District based on improved DRASTIC model. Acta Sci. Circumst. 2025, 45, 497–506. [Google Scholar]
  72. Zhang, X.; Shao, J. Evaluation of the suitability of street vending planning in urban public space in the post-COVID-19 era. Land 2024, 13, 489. [Google Scholar] [CrossRef] [Scilit]
  73. Lv, J.; Liu, H.; Liu, M.; Liu, S.; Lin, L. Research on the coupling synergy of carbon reduction, pollution control, green expansion, and economic growth in representative cities of the Yangtze River Delta. Environ. Pollut. Control 2026, 48, 1–9. [Google Scholar] [CrossRef]
  74. Miao, Y.; Yu, M. Ecotypic Underground City of Expo—Study on the Underground Space’ Planning of Expo 2010 Shanghai China. Planner 2006, 7, 57–59. [Google Scholar]
  75. Shanghai Urban Planning and Natural Resources Bureau. Shanghai Underground Space Planning and Construction Regulations [EB/OL]. (27 December 2013). Available online: https://ghzyj.sh.gov.cn/nw2508/20231011/7eab5c39f6c942ecaa824e8ae1def083.html (accessed on 27 October 2025).
  76. Harvey, D. Globalization and the “Spatial Fix”. Geogr. Rev. 2001, 2, 23–30. [Google Scholar]
  77. Adamu, S.; Yong, H.; Alhaji, M.; Kura, A.T.; Gano, D.Z.; Ibrahim, M.A. Regeneration beyond growth: Reimagining urban futures through justice and climate resilience. Habitat Int. 2026, 172, 103810. [Google Scholar] [CrossRef] [Scilit]
  78. Ministry of Land, Infrastructure, Transport. Special Measures Law for the Public Use of Deep Underground Spaces. Available online: https://www.mlit.go.jp/toshi/daisei/crd_daisei_tk_000008.html (accessed on 6 August 2026).
  79. Tang, Y.; Zhu, M. Inspiration to Shanghai from the Case of Montreal’s Underground Space Expansion. Chin. J. Undergr. Space Eng. 2010, 6, 904–907. [Google Scholar]
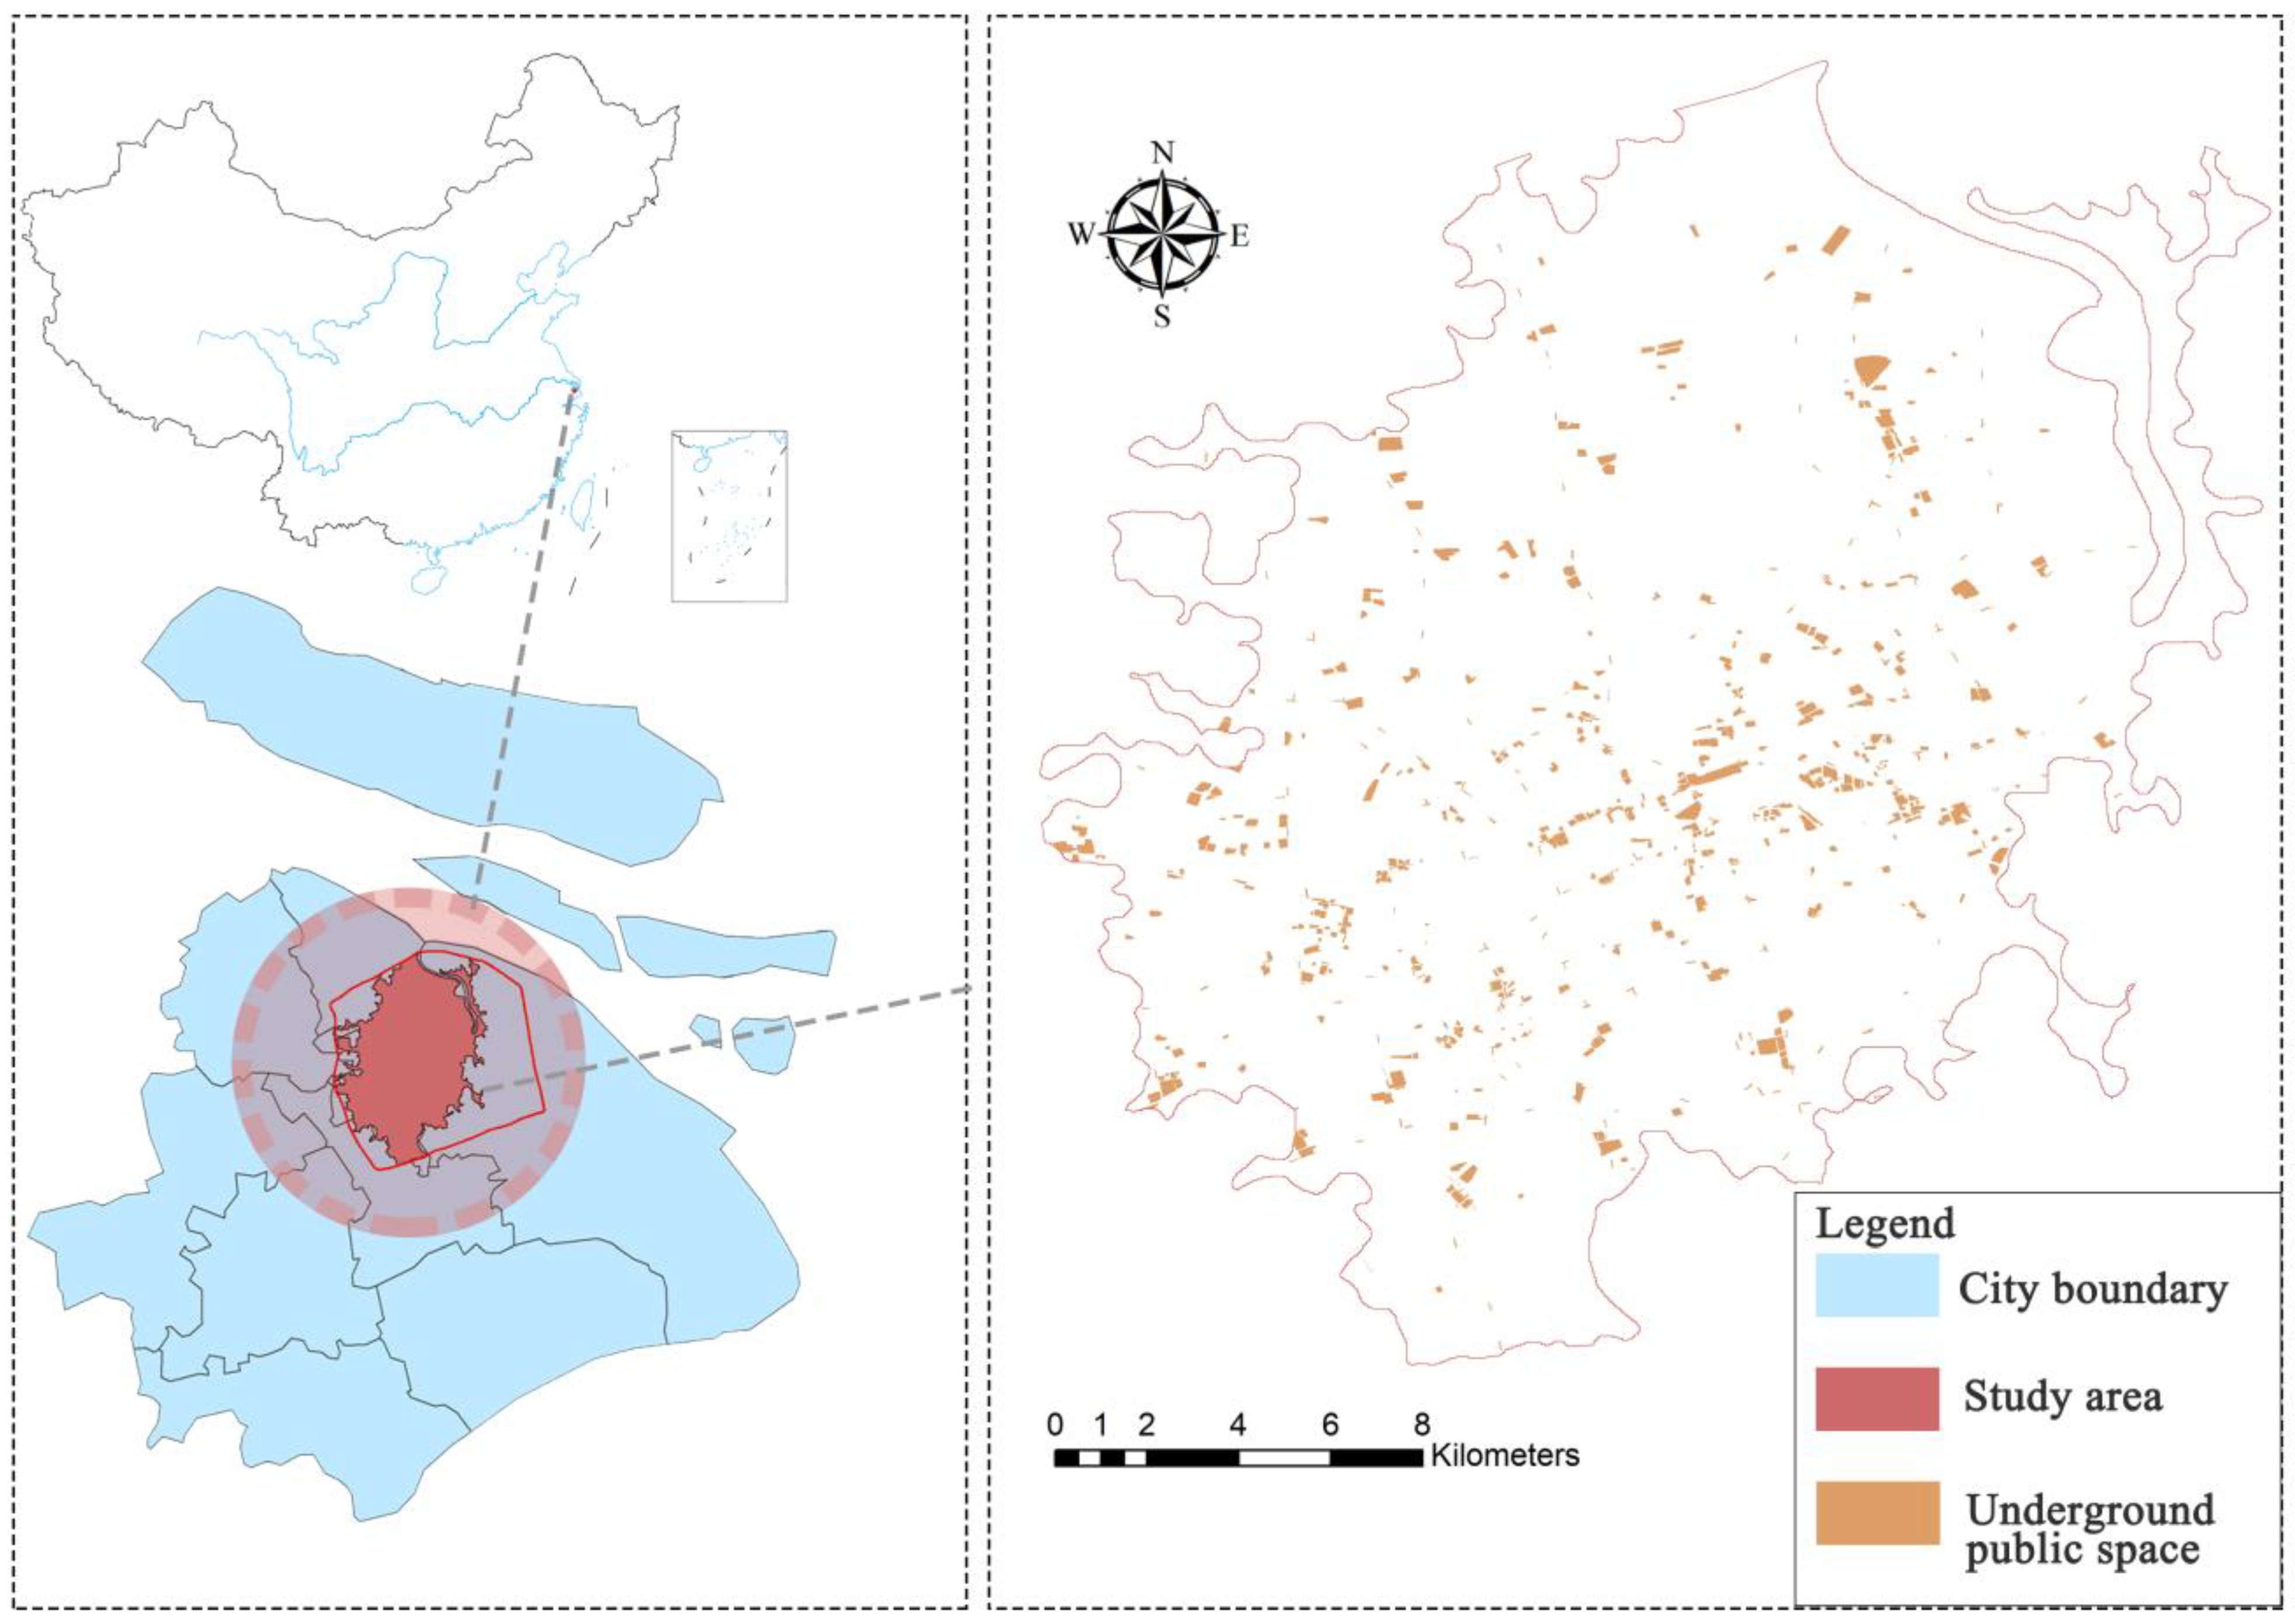
Figure 1. Current Status of Underground Public Spaces in the Urban Area and Old Districts of Shanghai (Based on the standard map drawn according to the review number GS(2016)1569 on the standard map service website of the Ministry of Natural Resources, the boundary of the base map has not been modified; Spatial data source: Drawn by the author himself).
Sustainability 18 08756 g001
Figure 2. The changes in the development levels of each dimension of the aboveground system.
Sustainability 18 08756 g002
Figure 3. The characteristics of changes in the aboveground system’s criterion layer.
Sustainability 18 08756 g003
Figure 4. The changes in the development levels of various dimensions of the underground public space system.
Sustainability 18 08756 g004
Figure 5. The variation characteristics of the criterion layer of the underground public space system.
Sustainability 18 08756 g005
Figure 6. The changes in the development levels of the aboveground system and the underground public space system.
Sustainability 18 08756 g006
Figure 7. Evolution of the coupling coordination degree of aboveground and underground public spaces in old urban areas of Shanghai from 1995 to 2025.
Sustainability 18 08756 g007
Figure 8. Target layer obstruction degree.
Sustainability 18 08756 g008
Figure 9. Main Obstacle Factors Obstacle Degree Heat Map. (Note: Some cells show −0.00 due to floating-point error in the normalization of the indicators (absolute obstacle degree < 1 × 10⁻⁶), which has been handled as 0 and does not affect the indicator ranking and stage conclusion.)
Sustainability 18 08756 g009
Table 1. Evaluation Index System for the Development Level of Aboveground Space and Underground Public Spaces.
Target LayerCriterion LayerIndicator LayerReferencesWeight
Aboveground Spaceeconomic developmentPer-capita GDP (CNY 10,000)[12,19]0.1731
Ratio of secondary and tertiary industries (%)[19]0.0748
Fixed asset investment (CNY 100 million)[46]0.0647
social welfarePopulation density (people/square kilometer)[12]0.0344
Urban residents’ Engel’s coefficient (%)[47]0.0916
Number of hospital beds per 10,000 people (beds per 10,000 people)[19]0.0664
Per-capita housing floor area (square meters)[48]0.0435
environmental qualityEnvironmental Protection Investment (CNY 100 million)[49]0.0504
Greenery coverage of urban area (%)[19]0.0473
City sewage treatment rate (%)[46,50]0.0307
spatial formArea of buildings above the eighth floor (10,000 square meters)[51]0.0394
Road length (kilometers)[19]0.0347
Road area (10,000 square meters)[19]0.0288
Bus route length (kilometers)[19]0.0662
governance efficiencyPolicy completeness (points)[52]0.0384
Total Fixed Asset Investment of the Entire Society (CNY 100 million)[53]0.0324
Completed renovation area (10,000 square meters per year)[54]0.0833
Underground Public Spacesfunctional diversityNumber of function categories (units)[55]0.0951
Functionality Mix Degree[56]0.0385
Functional entropy index[57]0.0363
Scale adaptationTotal area (square meters)[12]0.2816
Per-capita area (square meters per 10,000 people)[58]0.1897
morphological characteristicsPatch density[59]0.1173
Aggregation Index[59]0.1091
Landscape shape index[59,60]0.0645
Area-weighted average fractal dimension[59]0.0677
Table 2. Definition of scale for judgment matrix.
ScaleMean
1Indicating that the two factors are of equal importance compared to each other.
3Indicates that one factor is slightly more important compared to the other.
5Indicating that one factor is significantly more important than the other.
7Indicating that one factor is more significant and important compared to the other.
9Indicating that one factor is much more crucial than the other.
2, 4, 6, 8The intermediate value representing the above-mentioned adjacent judgment
derivativeIf the ratio of the importance of factor i to factor j is a i j , then the ratio of the importance of factor j to factor i is a i j = 1 / a i j
Table 3. Coupling stage classification criteria.
Coupling Degree ( C )Coupling Level
C = 0 Uncoordinated Development
0 < C 0.3 Low-Level Coupling
0.3 < C 0.5 Antagonistic Stage
0.5 < C 0.8 Break-In Period
0.8 < C < 1.0 High-Level Coupling
C = 1 Benign Resonance Coupling
Table 4. Classification of coupling coordination levels.
RangeClassificationRangeClassification
[0, 0.1)Extreme Imbalance (I)[0.5, 0.6)Barely Coordinated (VI)
[0.1, 0.2)Severe Imbalance (II)[0.6, 0.7)Primary Coordination (VII)
[0.2, 0.3)Moderate Imbalance (III)[0.7, 0.8)Intermediate Coordination (VII)
[0.3, 0.4)Mild Imbalance (IV)[0.8, 0.9)Good Coordination (IX)
[0.4, 0.5)Near Imbalance (V)[0.9, 1]Premium Coordination (X)
Table 5. The calculation results of the coupling coordination degree of aboveground and underground public spaces in old urban areas of Shanghai from 1995 to 2025.
YearU1U2CDT
19950.09020.03870.91660.24310.0645
20000.15350.07280.93430.32510.1131
20050.34660.09120.81210.42160.2189
20100.46560.32360.98370.62300.3946
20150.56740.54110.99970.74440.5543
20200.71540.69260.99990.83900.7040
20250.94270.87580.99930.95320.9092
Table 6. Main Obstacle Factors and Average Obstacle Degree.
IndicatorAverage Obstruction Degree (%)
Bus route length16.07
Landscape shape index11.03
Total area10.41
Per-capita area7.37
Aggregation Index7.27
Per capita GDP6.89
Patch density3.21
Total Fixed Asset Investment of the Entire Society3.16
Fixed asset investment2.30
Number of hospital beds per 10,000 people1.92
Disclaimer/Publisher’s Note: The statements, opinions and data contained in all publications are solely those of the individual author(s) and contributor(s) and not of MDPI and/or the editor(s). MDPI and/or the editor(s) disclaim responsibility for any injury to people or property resulting from any ideas, methods, instructions or products referred to in the content.