1. Introduction
Land artificialisation is widely recognised as an important source of long-term environmental pressure [
1]. However, its significance extends beyond the immediate environmental impacts associated with urban expansion and land sealing. From a theoretical perspective, artificial land can be interpreted as a form of accumulated environmental legacy associated with historical land conversion processes, reflecting the consequences of past development decisions that progressively reduce the availability of natural and agricultural land resources. Once land is sealed or permanently built upon, it is rarely returned to previous uses within relevant policy timeframes. For this reason, artificial land should not be interpreted merely as an outcome of recent development choices, but as a condition that accumulates over time and shapes what regions can realistically do in the future [
2,
3].
The environmental costs associated with land conversion are not confined to the period in which they occur; rather, they persist across generations, constraining future development options and increasing the difficulty of achieving sustainability objectives. Recent studies in ecologically sensitive regions, such as the Himalayan watershed, have shown how anthropogenic pressures and infrastructural expansion drive persistent land-use changes, highlighting the importance of spatiotemporal predictive modelling to understand long-term landscape transformations [
4].
Regions, therefore, enter sustainability transitions with different territorial starting points. Some operate in contexts where land resources are already heavily constrained, while others still retain a certain degree of spatial flexibility. These differences exist independently of current environmental performance.
Despite their relevance, physically grounded territorial indicators remain only partially available at the NUTS-2 level in standard statistical repositories. Regional sustainability comparisons, therefore, tend to rely on flow-based environmental indicators or socio-economic proxies. This limitation is not merely empirical, but also conceptual. Flow indicators are well-suited to capture short-run dynamics and policy-responsive outcomes, whereas stock-like territorial conditions shape long-term path dependency and structural constraints. Ignoring this distinction risks conflating inherited territorial structure with current performance, potentially leading to misleading benchmarking exercises and oversimplified, one-size-fits-all policy prescriptions. This data limitation has been noted in adjacent strands of the literature. Studies addressing the harmonisation of sub-national environmental statistics across EU member states have repeatedly pointed to uneven coverage below the national level, with physically grounded indicators lagging socio-economic ones in both availability and update frequency.
Taken together, these contributions suggest that the absence of a parsimonious, stock-based territorial indicator at the NUTS-2 level is not an isolated data gap, but part of a broader and still unresolved methodological tension in regional sustainability assessment.
The present study addresses this tension directly by operationalising a spatially explicit indicator of land artificialisation at the NUTS-2 level for Italy (ENV_ARTIFICIAL_LAND), constructed from CORINE Land Cover 2018 data and official NUTS boundaries. The indicator is explicitly interpreted as a structural territorial constraint rather than as a performance metric. It should be noted from the outset that ENV_ARTIFICIAL_LAND, built from an aggregated CORINE Level-1 “artificial surfaces” class, represents one parsimonious and reproducible operationalisation of this construct among several plausible alternatives (e.g., Copernicus High Resolution Layer imperviousness density, artificial land per capita, or disaggregated CORINE subclasses). Establishing convergent validity relative to these alternative operationalisations is left for future research and is discussed as a limitation.
Building on this premise, we adopt a deliberately parsimonious, non-aggregative analytical framework that pairs ENV_ARTIFICIAL_LAND with three widely used socio-economic dimensions: economic capacity, social vulnerability, and human capital prospects. The empirical evaluation is conducted across Italian NUTS-2 regions to examine distributional patterns and structural trade-offs at the regional scale. Similar integrative approaches have been employed in agricultural land suitability assessments, where spatial data and multi-criteria techniques like the Analytical Hierarchy Process help identify optimal land use and inform sustainable development strategies [
5]. Alternative strategies, such as composite index construction or clustering-based typologies, were deliberately excluded, as they would have shifted the focus from structural interpretation to algorithm-driven classification. In heterogeneous agricultural-forest landscapes, these approaches facilitate the identification of underlying factors contributing to land degradation and enable projections of future land-cover transitions through machine learning and spatiotemporal analyses [
6].
The objective of the paper is not to construct a comprehensive composite index nor to rank regions according to an aggregate sustainability score. Rather, it seeks to identify configurations in which inherited territorial constraints coexist with socio-economic strengths or fragilities. These configurations are of direct relevance for place-based policy design, as they highlight contexts in which similar socio-economic outcomes are achieved under markedly different territorial conditions, or where spatial flexibility is constrained by limited economic or social capacity.
The remainder of the paper is structured as follows.
Section 2 outlines the conceptual framing of land artificialisation as a stock-like territorial constraint.
Section 3 introduces the units of analysis, data sources, indicator rationale, and statistical strategy.
Section 4 presents the analytical workflow, including the quadrant-based trade-off framework and sensitivity design.
Section 5 details the empirical results, including distributional patterns, spatial representation, and trade-off configurations.
Section 6 discusses the analytical and policy implications alongside methodological limitations. Finally,
Section 7 concludes with key takeaways and directions for future research.
3. Data, Indicators, and Statistical Strategy
3.1. Units of Analysis and Data Sources
The analytical framework is grounded in the official Eurostat NUTS-2 (2021 classification version), which splits the 20 Italian regions into 21 statistical regional units. This nomenclature distinguishes between the 19 administrative regions and the two Autonomous Provinces of Bolzano (ITH1) and Trento (ITH2), which together form the Trentino-Alto Adige region. This level of aggregation is commonly used in regional studies because it offers a reasonable balance between spatial detail, data availability, and policy relevance. Furthermore, NUTS-2 regions also represent the main territorial scale at which European cohesion and regional development policies are designed and implemented, which makes the results directly interpretable from a policy perspective.
All data used in the analysis are drawn from official European sources. To ensure robust temporal consistency and cross-indicator alignment, socio-economic indicators were extracted from the most recent Eurostat releases available at the time of analysis. GDP per capita (PPS) refers to 2024, while AROPE and Early Leavers from Education and Training refer to 2025. ENV_ARTIFICIAL_LAND was derived from CORINE Land Cover 2018 and represents a relatively stable territorial stock.
The indicator of land artificialisation refers to the year 2018, corresponding to the most recent consolidated CLC status layer available at the time the analysis was conducted. CLC status layers are produced on an approximately six-year cycle. CLC 2018 therefore represents the most recent consolidated and fully validated dataset that could be used to ensure consistent coverage across all Italian NUTS-2 regions. Socio-economic indicators refer to the closest years reported by Eurostat. Minor temporal differences between datasets are acknowledged but deemed acceptable given the adopted analytical perspective: land artificialisation is interpreted as a slowly evolving territorial stock rather than an annually fluctuating flow. Therefore, a multi-year lag between the land-cover reference year and the socio-economic reference years does not materially compromise the structural interpretation proposed here.
Future updates based on the consolidated CLC 2024 release will provide a natural extension of the present framework and will allow verification of the temporal stability of the reported patterns.
3.2. Indicator Selection and Analytical Rationale
The selection of indicators follows a deliberately parsimonious approach. Rather than aiming to cover a wide range of dimensions, the analysis focuses on a small number of indicators that capture distinct aspects of regional sustainability. This choice reflects recurring critiques in the sustainability assessment literature, which have highlighted how large indicator sets often lead to redundancy and reduced interpretability, especially in the context of composite indices.
Four main considerations guided the selection process. First, indicators had to be consistently available at the NUTS-2 level to ensure full regional coverage. Second, preference was given to indicators that reflect long-term structural conditions rather than short-term fluctuations. Third, indicators had to be interpretable from a policy-oriented and place-based perspective. Finally, the selected variables needed to allow the identification of meaningful trade-offs when analysed jointly.
Within this framework, land artificialisation is considered a proxy for the central structural territorial constraint. The socio-economic indicators are included to provide context and to explore how this constraint interacts with regional economic capacity, social vulnerability, and future development prospects. The aim is not to rank regions according to a single sustainability score, but rather to identify structural configurations where inherited territorial conditions coexist with different socio-economic outcomes.
The selected socio-economic indicators—GDP per capita (PPS), AROPE, and early leavers from education and training—were chosen because they capture three complementary, widely accepted dimensions of regional development: economic capacity, social vulnerability, and future human capital.
While additional variables (e.g., population density, urbanisation rates, demographic ageing, or institutional capacity) also influence regional sustainability, constructing a multidimensional index is explicitly outside the scope of this study. Expanding the variable set would increase dimensional complexity and obscure the core stock-versus-flow dynamics. Consequently, the analysis prioritises analytical tractability, transparency, and conceptual clarity over exhaustive indicator coverage.
3.3. Indicator Definition and Analytical Orientation
The analysis relies on four core indicators. Each indicator is defined in terms of its substantive meaning, data source, and analytical orientation, distinguishing between variables that represent favourable conditions and those that capture constraints or unfavourable outcomes. This distinction is introduced to support a consistent interpretation of results across indicators measured on different scales.
Rather than treating all variables symmetrically, indicators are classified according to whether higher values reflect more favourable or less favourable sustainability conditions. This analytical orientation does not imply a normative ranking of regions but provides a common reference for comparing indicators that capture different aspects of territorial and socio-economic conditions. Detailed definitions and sources are reported in
Table 1.
Indicator selection was intentionally limited to four dimensions to preserve conceptual clarity and analytical transparency. Environmental indicators based on short-term flows (e.g., emissions, air quality) were excluded to maintain coherence with the stock-based nature of land artificialisation.
ENV_ARTIFICIAL_LAND measures the share of artificial surfaces over total regional area, expressed as a percentage. The indicator is constructed through a spatial overlay between artificial land classes from CLC 2018 and official NUTS-2 regional boundaries. In analytical terms, it is interpreted as a cumulative territorial condition. Because artificial land is only marginally reversible in the medium term, higher values are associated with more rigid spatial structures and a reduced scope for long-term adaptation. For this reason, ENV_ARTIFICIAL_LAND is treated as a cost-type indicator.
GDP per capita in purchasing power standards (PPS) is used to describe regional economic capacity. It provides an approximate indication of the financial and productive resources available within a region, which may support investment, infrastructure provision, and policy implementation. GDP per capita can be interpreted as an indicator of economic capacity rather than a direct measure of welfare, making it suitable for structural analysis [
39].
Social vulnerability is captured through the population at risk of poverty or social exclusion (AROPE). This indicator combines information on income poverty, material deprivation, and low work intensity. High AROPE values indicate more fragile social conditions and can constrain both the feasibility and the social acceptance of sustainability-related policies. Accordingly, AROPE is treated as a cost-type indicator.
A forward-looking dimension is provided by the share of early leavers from education and training among the population aged 18–24. Early school leaving has long-term implications for productivity, innovation capacity, and regional adaptability [
43,
44]. Higher values, therefore, signal less favourable long-term development prospects and are treated as a cost-type indicator.
Distinguishing explicitly between cost-type and benefit-type indicators supports a consistent reading of results in the subsequent analysis. This distinction does not imply a normative ranking of regions but helps to avoid ambiguous interpretations when indicators with different meanings and scales are examined jointly.
Although physical and socio-economic variables interact, the parsimonious framework deliberately avoids aggregating them to prevent compensatory effects. Instead, they are treated as distinct, intersecting axes.
3.4. Descriptive Statistics and Distributional Analysis
Given the limited number of observations (n = 21 NUTS-2 regions) and the structural nature of the variables considered, the empirical analysis starts with a simple examination of their distributional properties. For each indicator, a set of standard descriptive statistics is reported, including measures of central tendency and dispersion. In addition to mean and standard deviation, median and interquartile range are used to reduce sensitivity to extreme values, which are expected in variables reflecting long-term territorial conditions (
Table 2).
The use of both mean-based and median-based statistics allows a first assessment of asymmetry and dispersion across regions. This is particularly relevant for ENV_ARTIFICIAL_LAND, whose values reflect cumulative spatial processes rather than short-term variability. Differences between mean and median values, together with the width of the interquartile range, suggest the presence of uneven regional patterns and a small number of structurally extreme cases.
More advanced distributional techniques were not applied, given the exploratory nature of the analysis and the limited sample size. The aim at this stage is not to model distributions formally, but to identify broad patterns that can inform subsequent comparisons. To complement the numerical evidence, distributional features are also examined through graphical inspection.
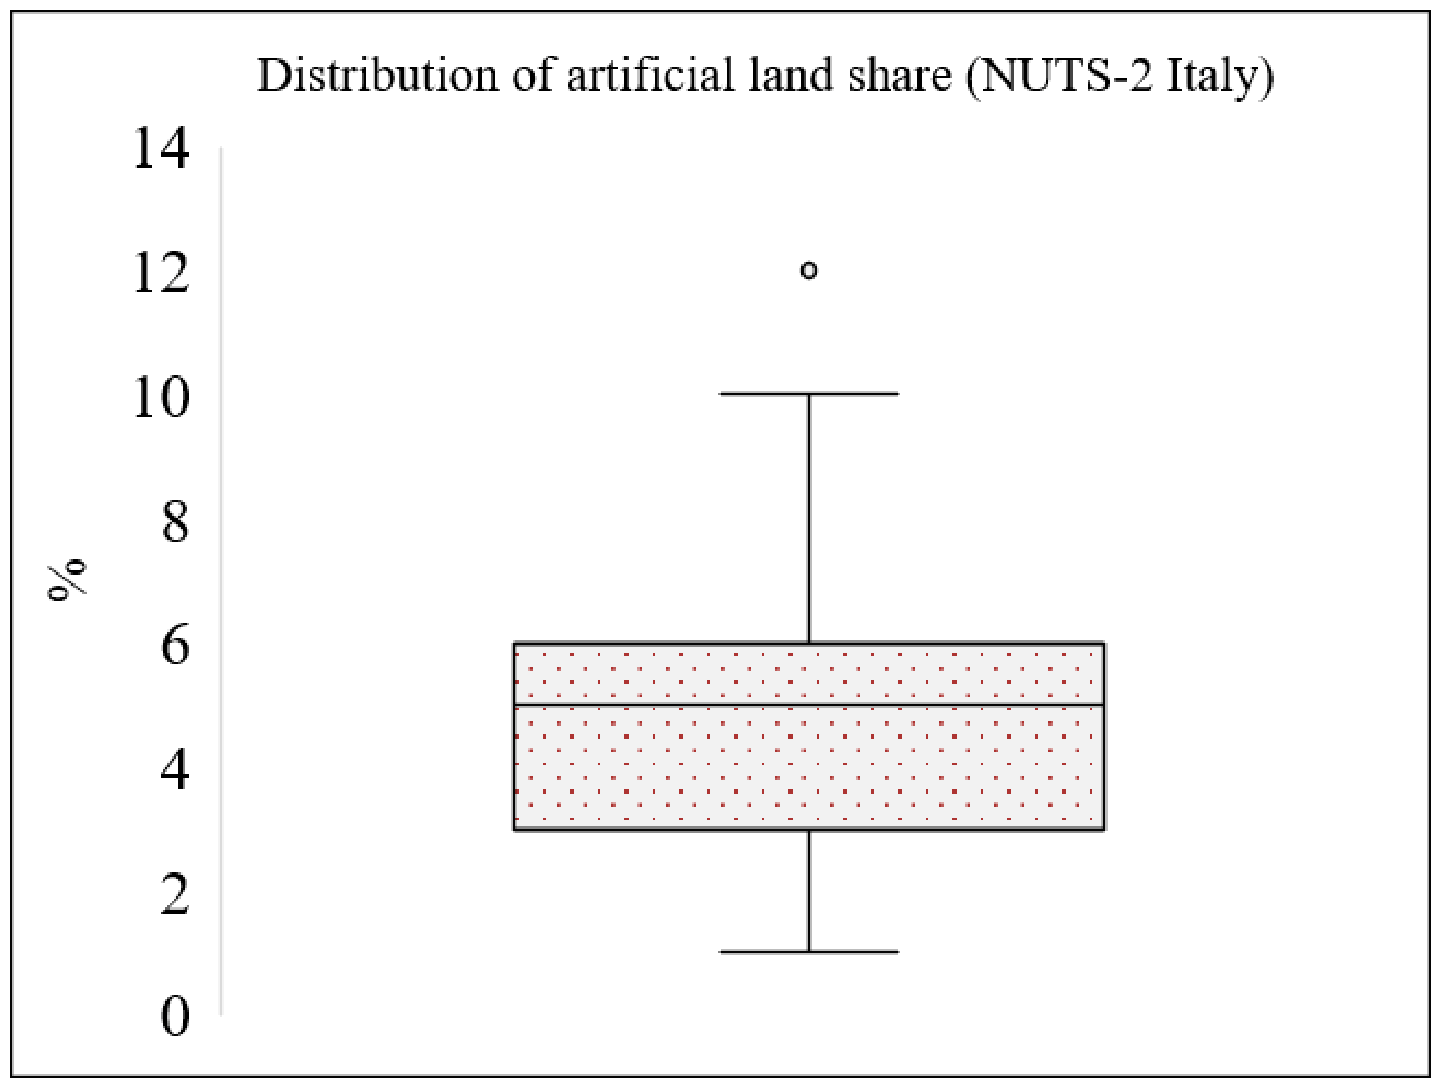
The boxplot in
Figure 1 provides a visual summary of the distribution of artificial land share across Italian NUTS-2 regions. It highlights the asymmetric nature of the indicator and the presence of regions with markedly higher levels of land artificialisation. These features support the use of robust descriptive statistics and motivate the analytical choices adopted in the following sections.
3.5. Normalisation and Comparability
To allow comparisons across indicators measured on different scales, all variables are transformed onto a common [0–1] range using min–max normalisation. This choice provides a simple and transparent way to align indicators without altering their relative ordering across regions. For indicators interpreted as costs, the normalised values are inverted so that higher scores consistently correspond to more favourable conditions.
Alternative standardisation methods were considered during the analysis. Specifically, z-score standardisation was tested but not adopted because it reduced the intuitive interpretability of regional differences. Given the small number of observations and the exploratory nature of the analysis, preserving a clear link between normalised values and original indicator levels was prioritised. While min–max normalisation can be sensitive to extreme values in small datasets, a robustness check based on winsorised min–max normalisation, using the 5th and 95th percentiles as bounds, was performed.
All the bivariate correlation analyses, scatter plots and threshold evaluations presented in
Section 5 are performed directly on the raw indicator values, to preserve their original units and practical interpretability. Since min–max normalisation is a linear transformation, the Pearson and Spearman correlation coefficients remain strictly invariant to this rescaling.
3.6. Bivariate Relationships and Trade-Off Analysis
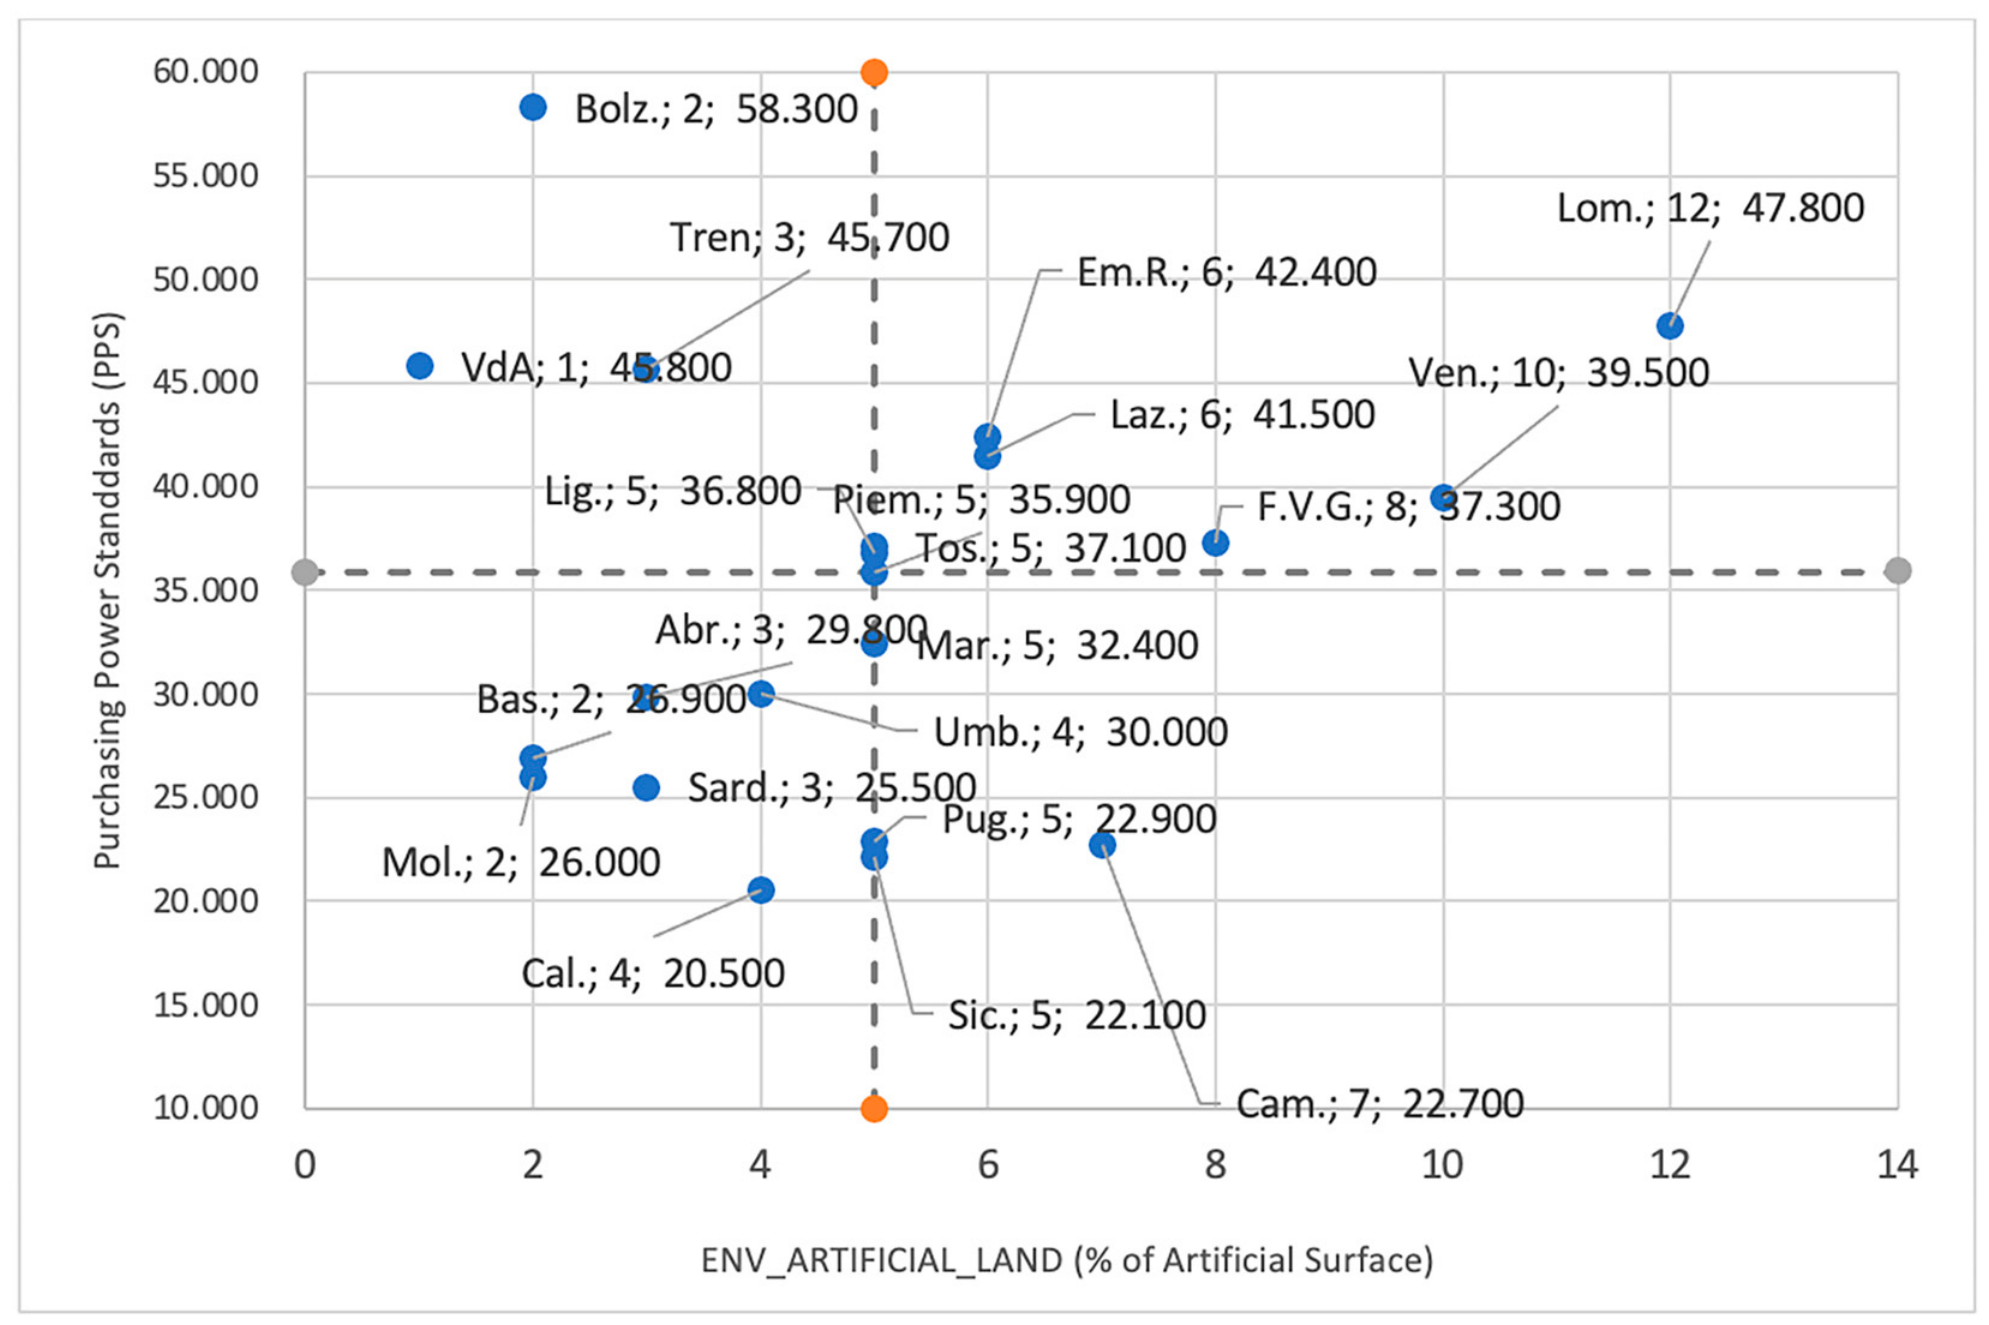
In addition to univariate descriptive statistics, the analysis examines bivariate relationships between ENV_ARTIFICIAL_LAND and each of the selected socio-economic indicators (
Figure 2). Pearson and Spearman correlation coefficients are computed in parallel. Pearson correlation is used to capture linear associations, while Spearman correlation is included to assess rank-based relationships and to reduce sensitivity to non-normality and extreme values. Because correlation coefficients alone are insufficient to derive policy insights, the analysis adopts a quadrant-based trade-off framework. Median values of the indicators are used as reference thresholds to divide regions into four configurations, reflecting different combinations of territorial constraints and socio-economic conditions.
The median was chosen as a threshold because it is robust to the skewed distributions documented in
Table 2 and does not require distributional assumptions.
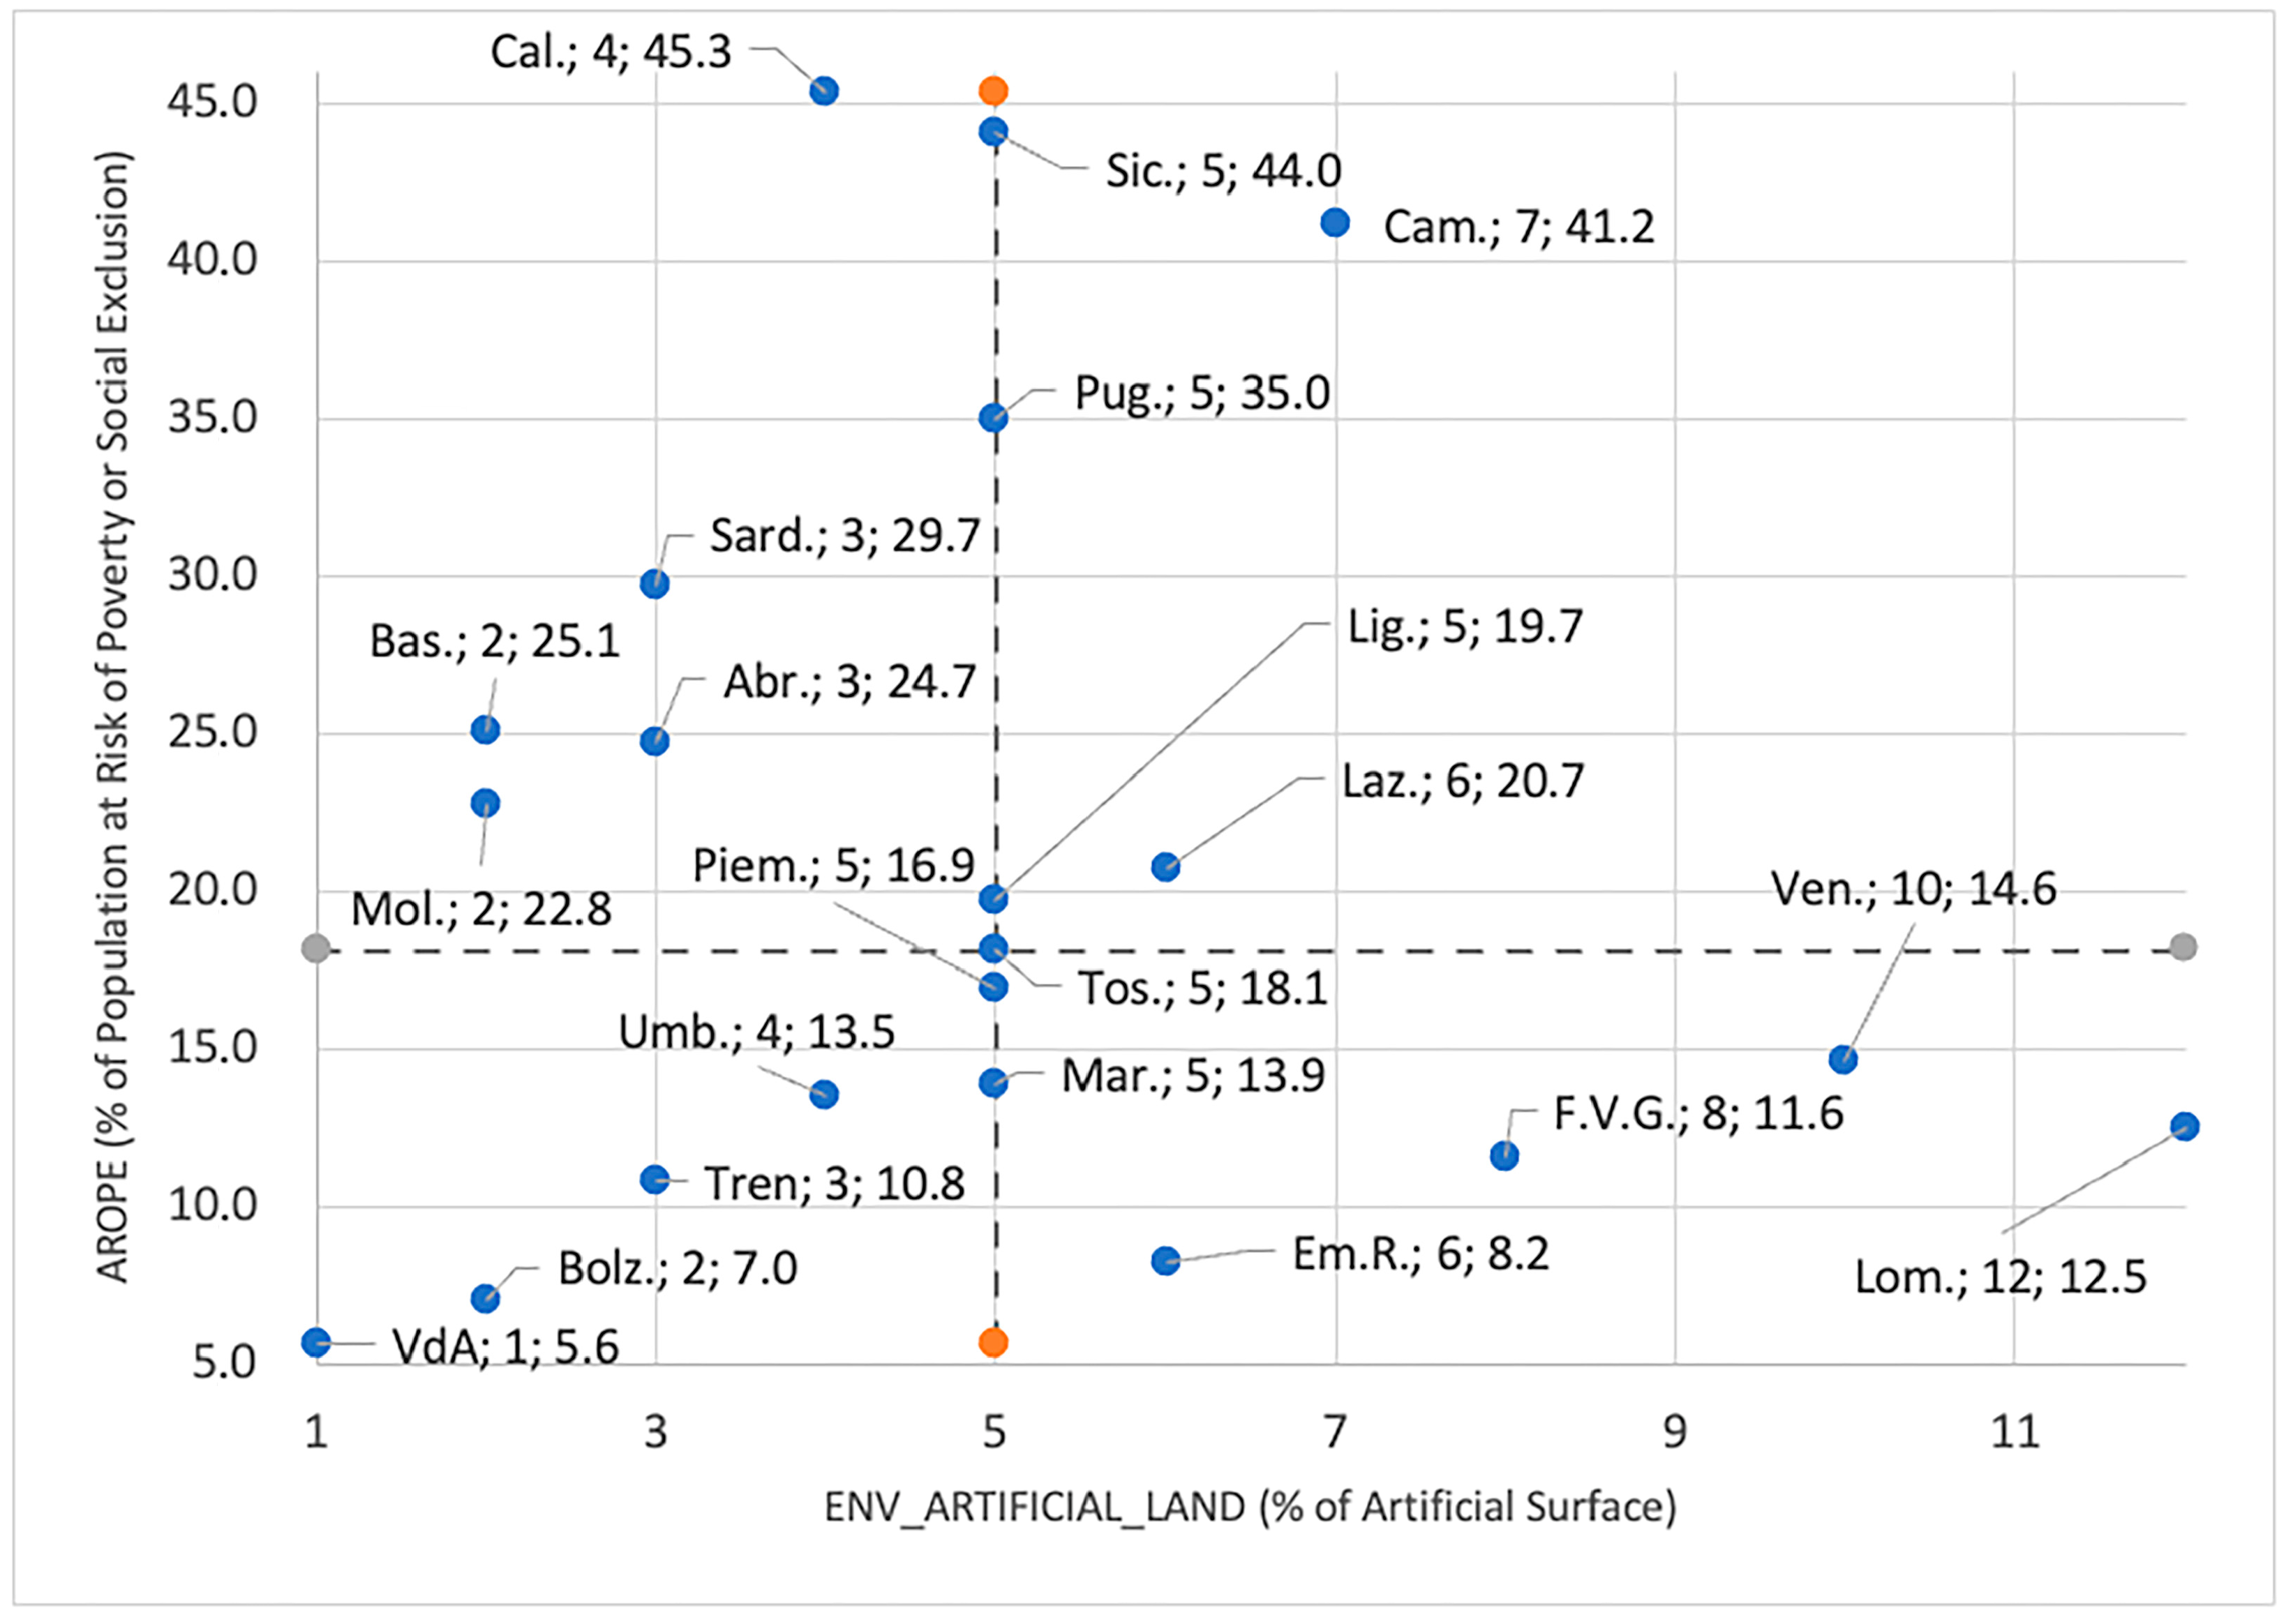
A similar approach is applied to social vulnerability and human capital indicators (
Figure 3). The quadrant-based representation highlights heterogeneous regional patterns that are not immediately apparent from univariate statistics or composite scores. It reveals configurations in which unfavourable territorial conditions coexist with relatively strong socio-economic performance, as well as cases where low artificialisation is associated with persistent social or educational weaknesses. Overall, this configurational perspective supports an interpretation of regional sustainability that goes beyond simple rankings and emphasises the interaction between long-term territorial conditions and socio-economic characteristics.
3.7. Spatial Representation
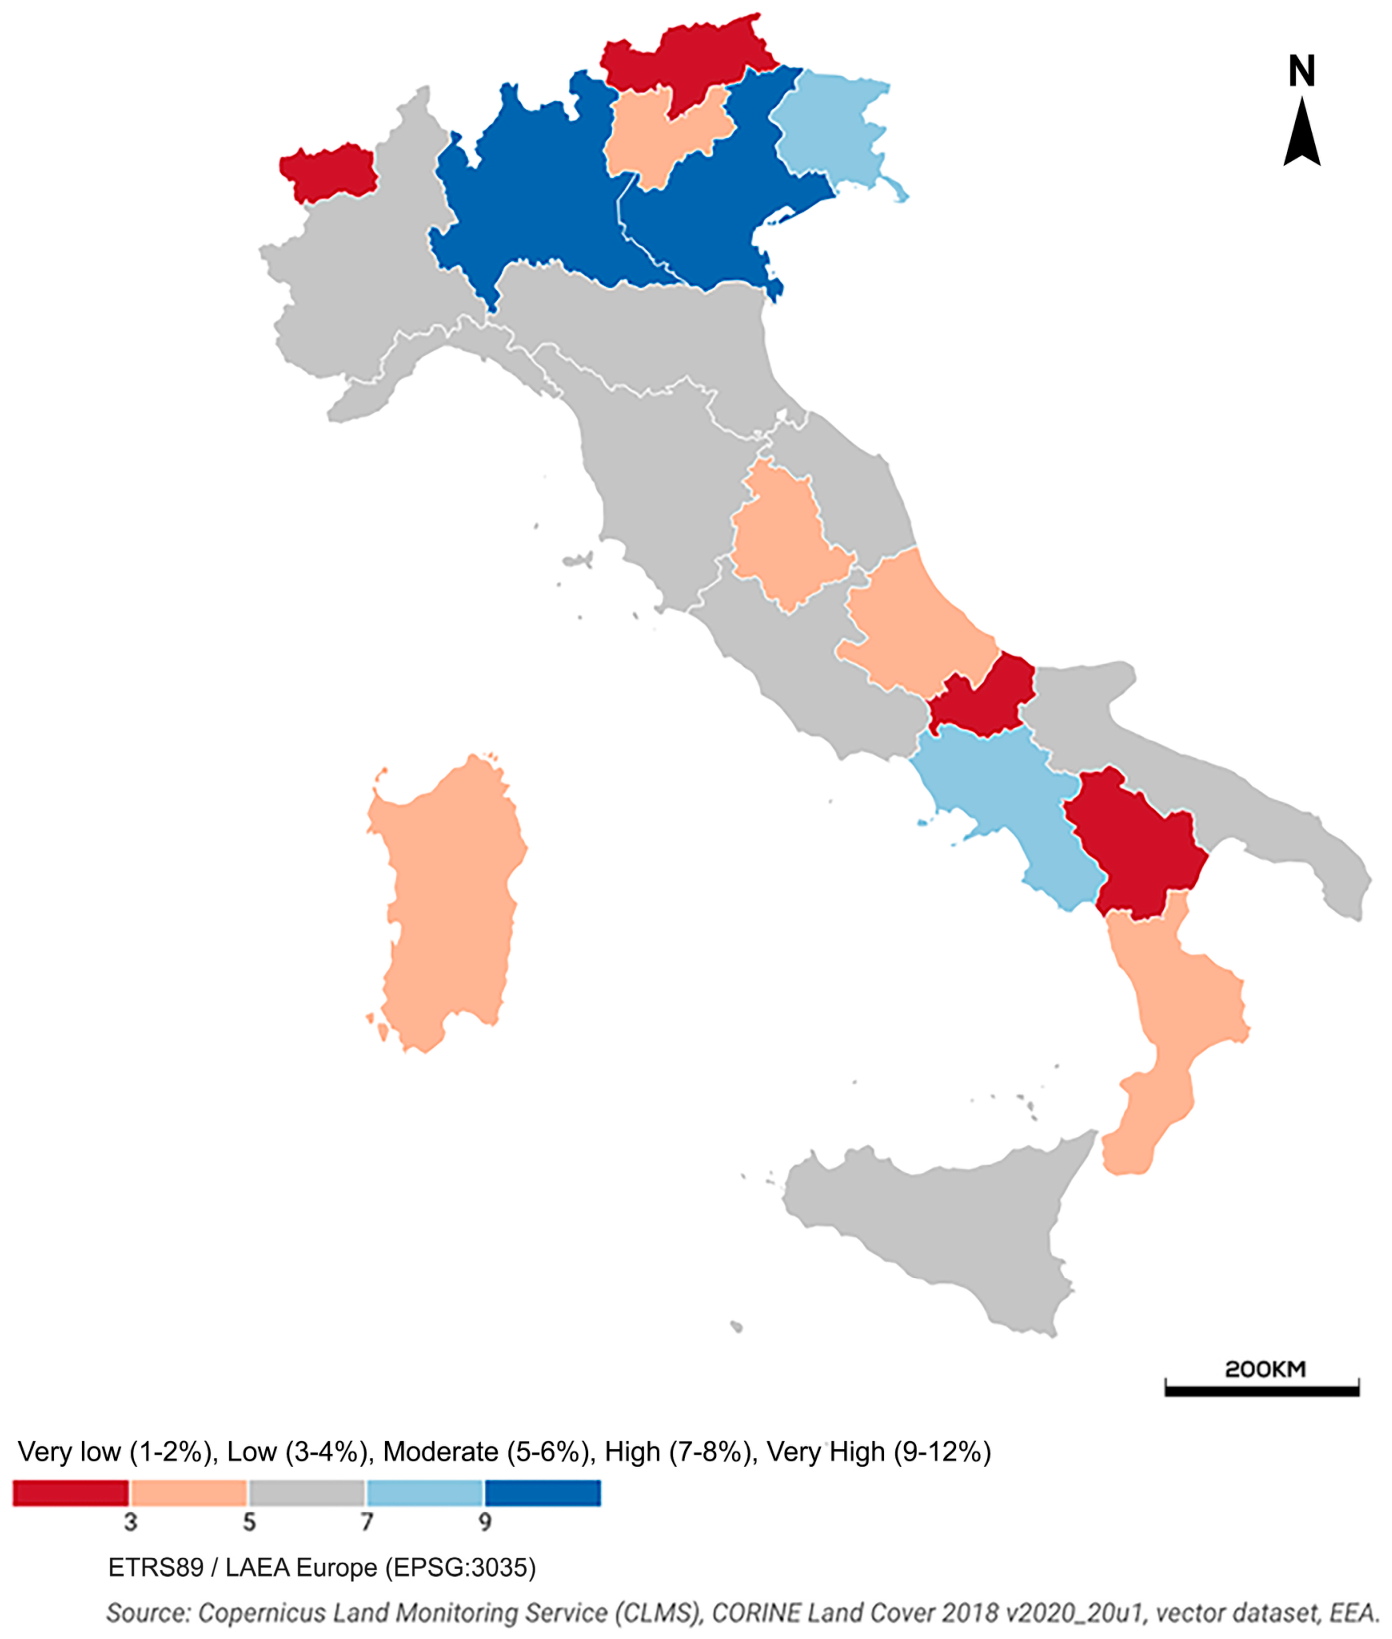
The spatial dimension of ENV_ARTIFICIAL_LAND is explored through a choropleth map at the NUTS-2 level. As illustrated in
Figure 4, a five-class sequential colour scheme is applied to represent differences in the share of artificial land across regions.
Rather than serving as a purely descriptive visual tool, the spatial representation directly supports the interpretation of the statistical results. The map reveals spatial concentration patterns and regional contrasts that remain hidden within numerical indicators alone.
It helps to contextualise distributional and trade-off analyses by situating regional values within their geographic setting and by highlighting potential path-dependent spatial dynamics in land artificialisation.
3.8. Summary of Statistical Strategy
Overall, the statistical strategy combines a limited number of complementary steps, including descriptive statistics, inspection of distributional patterns, scale harmonisation with robustness checks, bivariate trade-off analysis and spatial representation. These elements are used jointly to support the interpretation of regional sustainability conditions, rather than to produce a single benchmarking exercise.
The aim of this approach is to link numerical patterns to underlying territorial and socio-economic structures. By combining statistical summaries with configurational and spatial perspectives, the analysis seeks to highlight structural differences across regions that would remain less visible if indicators were examined in isolation.
4. Methods
4.1. Construction of the ENV_ARTIFICIAL_LAND Indicator
ENV_ARTIFICIAL_LAND is constructed to describe land artificialisation as a structural territorial condition. Unlike environmental indicators based on annual flows or short-term pressures, land artificialisation reflects a cumulative process that unfolds over long time horizons. Once land is converted to artificial uses, the change is only marginally reversible in the medium term. For this reason, the indicator is interpreted as a stock reflecting past development trajectories and land-use decisions rather than as a measure of current policy performance.
The indicator is derived through a spatial overlay procedure combining land-cover information from the CORINE Land Cover (CLC) 2018 dataset with official NUTS-2 regional boundaries. Artificial land is identified by selecting all CLC classes belonging to the Level 1 category “Artificial surfaces” (code starting with “1”), which includes continuous and discontinuous urban fabric, industrial and commercial areas, transport infrastructures, and other heavily modified or sealed land uses. The selected polygons are intersected with regional boundaries, and the artificial surface area is aggregated for each NUTS-2 unit.
Although higher-resolution Copernicus products, such as the High Resolution Layer (HRL) impervious density dataset, provide a more detailed representation of sealed surfaces, CLC remains widely adopted in regional-scale territorial assessments due to its harmonised classification scheme, consistent European coverage, and suitability for analyses conducted at the NUTS-2 level. Given the objective of characterising broad territorial structures rather than fine-scale urban patterns, the spatial resolution of CLC is considered adequate for the purposes of this study.
However, this study does not empirically test the convergence between ENV_ARTIFICIAL_LAND and higher-resolution alternatives; results should thus be understood as specific to this aggregated CLC-based metric, rather than to land artificialisation in a fully measure-invariant sense. All spatial operations are carried out using a single projected coordinate reference system (EPSG:3035), to ensure area-preserving calculations across regions.
ENV_ARTIFICIAL_LAND is not designed to measure soil sealing intensity, ecological quality or environmental impact directly. Instead, it is used as a parsimonious proxy for cumulative territorial transformation at a regional level. The rationale is that artificial surfaces represent the long-term outcome of historical land conversion processes that progressively modify the available territorial structure for future development and planning decisions. Although individual artificial land classes represent different ecological and socio-economic functions, their aggregation provides a transparent and reproducible measure of the extent to which a regional territory has been transformed from natural or agricultural use to artificial surfaces, acting as a clear proxy for territorial structural constraints on future regional planning.
For each region, ENV_ARTIFICIAL_LAND is calculated as the ratio between the total area classified as artificial and the total regional area, expressed as a percentage:
where
denotes the area classified as artificial land in region r, and
denotes the total area of region r. This construction yields a physically grounded indicator that is directly comparable across regions. By expressing artificial land as a share of total area, the indicator is independent of population size or economic intensity and captures differences in territorial structure rather than differences in scale.
4.2. Analytical Orientation and Interpretation
ENV_ARTIFICIAL_LAND is treated as a cost-type indicator, meaning higher values correspond to less favourable territorial conditions. This orientation reflects the asymmetric role played by land artificialisation in sustainability processes. Unlike many socio-economic indicators, which can change over relatively short periods, artificial land accumulates gradually and remains embedded in regional spatial structures.
As land is converted to built environment, future land-use options become more limited, restricting the scope for ecosystem restoration, spatial reorganization, and climate adaptation. Consequently, the indicator does not describe short-term environmental performance, urban efficiency, or recent policy outcomes; rather, it captures the degree of structural saturation and spatial lock-in inherited from historical development paths.
This saturation influences the feasibility, costs and effectiveness of sustainability-oriented policies, including climate adaptation measures, green infrastructure development and land-use regeneration initiatives.
4.3. Treatment of Socio-Economic Indicators
The socio-economic variables are used to contextualise the territorial constraint captured by ENV_ARTIFICIAL_LAND, rather than to define sustainability performance on their own. Each variable reflects a different dimension interacting with territorial rigidity:
GDP per capita PPS (benefit-type indicator): proxy for regional economic capacity, reflecting the financial and productive resources available to support investments, infrastructure provision, and policy implementation related to sustainability transitions. For this reason, it is treated as a benefit-type indicator.
AROPE (cost-type indicator) proxy for structural social vulnerability: high values of this indicator are associated with constraints on policy feasibility and social acceptability, as regions characterised by widespread vulnerability may face greater difficulties in supporting or absorbing environmental and territorial transformations.
Early leavers (cost-type indicator): forward-looking proxy for human capital accumulation. High early school leaving rates signal persistent deficits in skill formation, undermining long-term regional adaptability and innovation capacity.
Rather than aggregating these dimensions into a synthetic composite index, the analysis examines them jointly with ENV_ARTIFICIAL_LAND. This approach allows the identification of structural configurations and trade-offs between inherited territorial conditions and socio-economic characteristics, without imposing compensatory assumptions or normative weighting schemes.
4.4. Normalisation and Robustness Checks
To allow direct comparison between indicators expressed in different units and ranges, all variables are transformed onto a common [0–1] scale using min–max normalisation. This choice preserves the relative regional distance while ensuring comparability across dimensions. For cost-type indicators, normalised values are inverted so that higher scores uniformly correspond to more favourable conditions.
To account for potential sensitivity to extreme values in small sample sizes, an additional robustness check is performed using a winsorised min–max transformation bounded at the 5th and 95th percentiles. This procedure reduces outlier leverage while preserving rank order across most observations.
While standard min-max normalisation remains the baseline specification, this winsorised variant is used to verify that the identified trade-off configurations remain structurally stable when extreme cases are downweighted.
4.5. Statistical Analysis and Trade-Off Framework
The empirical analysis is structured around a limited set of complementary statistical steps, designed to explore both the distribution of individual indicators and their joint behaviour. First, descriptive statistics and simple distributional diagnostics are used to assess variability and regional asymmetries, with particular attention to cumulative spatial indicators.
Second, pairwise relationships between ENV_ARTIFICIAL_LAND and each socio-economic indicator are examined using both Pearson and Spearman correlation coefficients. Pearson correlation is used to capture linear associations, while Spearman correlation provides a rank-based measure that is less sensitive to distributional irregularities and extreme observations. The joint use of the two coefficients allows a more cautious interpretation of association patterns in a small regional sample.
Finally, to complement correlation measures with policy-oriented insights, regional configurations are explored through a quadrant-based trade-off framework. Median values are adopted as reference thresholds to divide the indicator space into four quadrants, avoiding the use of algorithmic clustering techniques which are not suited to small sample sizes, and which could obscure interpretation. Instead, the quadrant approach provides a transparent and policy-oriented classification, highlighting structurally relevant configurations such as regions combining high levels of land artificialisation with strong economic capacity, or regions characterised by limited territorial constraints but pronounced social vulnerability. Because quadrant assignments near threshold boundaries are naturally sensitive to the choice of cut-off points, the structural stability of this classification is explicitly evaluated through sensitivity analysis.
4.6. Sensitivity Analysis of the Quadrant Framework
As the proposed trade-off framework is based on threshold-driven classifications, an additional sensitivity analysis was conducted to evaluate the stability of regional assignments under alternative threshold definitions. The baseline classification was based on sample medians because they are robust to skewed distributions and less sensitive to extreme observations than arithmetic means. They are also particularly appropriate for small regional samples. However, threshold-based classifications may be affected by the specific cut-off values adopted. To assess the robustness of the framework, regional classifications were recalculated using three alternative threshold rules: the sample mean, the 40th percentile and the 60th percentile. These classifications were compared against the baseline median-based solution to determine the extent to which regional configurations remained stable under alternative assumptions.
4.7. Scope and Limitations of the Methodological Approach
The methodological choices adopted in this study are intentionally conservative. The analysis favours clarity and interpretability over analytical sophistication, and it is explicitly designed to support structural interpretation rather than optimisation or prediction. For this reason, the framework avoids composite aggregation and weighting schemes and does not aim to synthesise regional sustainability into a single score or ranking. The focus is placed on the interaction between a small set of clearly interpretable dimensions, highlighting configurations and tensions that would be obscured by more complex modelling strategies.
This choice inevitably entails some limitations. First, the analysis is static and captures territorial and socio-economic conditions at a specific point in time. While consistent with interpreting land artificialisation as a slowly evolving stock, it does not allow the direct observation of dynamic adjustment processes or short-term policy effects. Second, relying on a single land-cover reference year (CLC 2018) means the indicator cannot capture intra-period changes or recent acceleration or deceleration in land-use dynamics. Although CLC 2018 represents the most recent officially validated release widely used in comparative regional studies, future updates, such as the forthcoming CLC 2024 dataset, will enable empirical testing of the temporal stability of these patterns.
Finally, the framework does not incorporate explicit indicators of land-use change, land recycling, or impervious dynamics, which may provide additional insight into ongoing transformation processes. These aspects are not treated as shortcomings of the present analysis, but as natural extensions. Future research may integrate multi-temporal land-cover data, Copernicus-derived imperviousness layers, or dynamic indicators to explore how structural territorial constraints evolve and interact with socio-economic trajectories over time.
5. Results
5.1. Descriptive Patterns and Distributional Properties
The descriptive statistics reported in
Table 2 offer a first empirical picture of the diversity of territorial and socio-economic conditions across Italian NUTS-2 regions. All indicators display a non-negligible degree of dispersion, confirming that regional sustainability-relevant conditions are far from homogeneous. In several cases, differences between mean and median values are sizeable, and interquartile ranges are relatively wide, pointing to asymmetric distributions and to the presence of regions occupying structurally extreme positions.
This aspect emerges most clearly for ENV_ARTIFICIAL_LAND. As illustrated in
Figure 1, the distribution of artificial land share is markedly skewed. A small group of regions concentrates very high levels of artificialisation, while most regions are clustered at substantially lower values. This configuration reflects the cumulative character of land artificialisation, which tends to amplify historical development patterns rather than converge over time. The observed distribution is therefore consistent with the interpretation of ENV_ARTIFICIAL_LAND as a territorial stock shaped by long-term spatial trajectories rather than by recent policy or economic fluctuations.
Socio-economic indicators show heterogeneous patterns as well. GDP per capita (PPS) spans a wide interval, ranging from PPS 20,500.00 to PPS 58,300.00 (
Table 2), signalling persistent differences in regional economic capacity. AROPE ranges from 5.60% to 45.30%, and the share of early leavers from education and training ranges from 4.90% to 13.70%, both indicating substantial variability across regions. Taken together, these patterns suggest that economic performance, social fragility, and future development prospects are unevenly distributed and do not align along a single spatial gradient.
5.2. Bivariate Relationships Between Territorial and Socio-Economic Dimensions
The bivariate analysis highlights a set of relationships that are weak and far from uniform, pointing to differentiated interactions between territorial structure and socio-economic conditions (
Table 3). The association between ENV_ARTIFICIAL_LAND and GDP per capita displays a weak positive association (r = 0.13, ρ = 0.12). While regions with higher levels of land artificialisation tend, on average, to display higher economic capacity, the dispersion around this tendency is substantial, indicating that economic performance cannot be directly inferred from territorial artificialisation alone.
The relationship between ENV_ARTIFICIAL_LAND and indicators of social vulnerability is weaker and less regular. There is essentially no correlation with AROPE (r = −0.04, ρ = −0.02), while the relationship with early leavers from education and training is only weakly negative (r = −0.14, ρ = −0.10). These near-zero and weak values suggest that higher territorial rigidity does not systematically correspond to higher levels of social fragility or weaker human capital outcomes. This result supports the view that socio-economic conditions interact with inherited land-use structures in complex ways, influenced by institutional, demographic, and policy factors.
Permutation tests were conducted for all three bivariate relationships (
Table 4). The resulting
p-values were 0.562 for GDP per capita, 0.855 for AROPE, and 0.571 for EARLY_LEAVERS. These results indicate that none of the observed correlations can be distinguished from patterns expected under random association, supporting the descriptive interpretation adopted throughout the analysis.
Additional insight is provided by the quadrant-based trade-off analysis.
Figure 2 illustrates the joint distribution of ENV_ARTIFICIAL_LAND and GDP per capita, revealing the coexistence of distinct structural configurations. Some regions combine strong economic capacity with high levels of territorial artificialisation, suggesting that economic strength may develop alongside increasing spatial rigidity. Other regions display relatively low artificialisation but limited economic resources, pointing to contexts where territorial flexibility does not automatically translate into economic advantage.
Similar heterogeneity emerges when ENV_ARTIFICIAL_LAND is examined alongside social indicators. As shown in
Figure 3, regions populate all four quadrants in both the ENV_ART–AROPE and ENV_ART–EARLY LEAVERS spaces. There are cases of regions with low artificial land share but high social vulnerability, as well as regions characterised by high artificialisation and comparatively favourable social outcomes. These configurations confirm the absence of a simple monotonic relationship and underline the importance of interpreting territorial constraints and socio-economic conditions jointly rather than in isolation.
5.3. Structural Configurations and Territorial Heterogeneity
Taken as a whole, the results point to structurally differentiated regional configurations that cannot be meaningfully summarised through unidimensional indicators or synthetic rankings. The joint consideration of territorial artificialisation and socio-economic dimensions reveals sustainability profiles shaped by the interaction between inherited spatial structures and contemporary development conditions, rather than by a single dominant factor.
The spatial distribution of ENV_ARTIFICIAL_LAND, reported in
Figure 4, provides an additional layer of interpretation. Visual inspection of the choropleth map suggests the presence of geographic concentration patterns in land artificialisation levels.
This geographic concentration pattern may be consistent with the notion of territorial path dependency, whereby historical settlement patterns, infrastructure development, and planning regimes have contributed to shaping land-use structures that extend beyond individual administrative boundaries. However, no formal spatial autocorrelation analysis was performed, and this interpretation should therefore be regarded as descriptive rather than inferential.
At the same time, mapped patterns of land artificialisation do not overlap neatly with socio-economic gradients. Regions exhibiting similar degrees of territorial rigidity may display markedly different economic capacities or social conditions. This decoupling reinforces the idea that territorial constraints and socio-economic performance represent analytically distinct, though interacting, dimensions of regional sustainability.
These structural configurations underline the limitations of benchmarking exercises based solely on outcome indicators. Regions facing comparable levels of artificialisation may require very different policy responses depending on their socio-economic context, while regions with favourable economic or social indicators may still confront long-term constraints rooted in spatial saturation. From this perspective, the spatial analysis supports a configurational reading of regional sustainability that is directly relevant for place-based policy design.
5.4. Robustness of the Quadrant Classification
To evaluate the sensitivity of the proposed framework to threshold selection, the quadrant classification was recalculated for all three indicator spaces using alternative threshold definitions based on the sample mean, the 40th percentile, and the 60th percentile. As reported in
Table 5, the results indicate a high degree of stability. Across all specifications, between 90% and 95% of regions retained their original quadrant assignment relative to the baseline median-based classification. These findings suggest that the principal configurational patterns identified by the framework are not strongly dependent on the specific threshold rule adopted and remain broadly stable across alternative classification assumptions.
5.5. Summary of Key Empirical Findings
Overall, the empirical evidence points to a set of recurring patterns that clarify the role of territorial structure in regional sustainability. Land artificialisation emerges as a highly asymmetric phenomenon, characterised by the concentration of elevated values in a limited number of regions and by persistent territorial heterogeneity. This behaviour is consistent with its interpretation as a cumulative territorial stock shaped by long-term development trajectories.
Economic capacity displays only a weak positive association with land artificialisation (Pearson r = 0.13; Spearman ρ = 0.12), indicating that higher levels of territorial transformation are not systematically accompanied by proportionally greater economic capacity. Social vulnerability, measured through AROPE, exhibits a negligible relationship with ENV_ARTIFICIAL_LAND (Pearson r = −0.04; Spearman ρ = −0.02). A similarly weak pattern emerges for EARLY_LEAVERS (Pearson r = −0.14; Spearman ρ = −0.10), suggesting no meaningful association between educational vulnerability and territorial artificialisation.
The quadrant-based trade-off analysis further reinforces this picture by revealing multiple structural configurations. Regions occupy all combinations of territorial constraint and socio-economic condition, highlighting the coexistence of trade-offs and mismatches that remain hidden in unidimensional rankings.
Taken together, these results provide empirical grounding for the discussion, which examines the analytical and policy implications of incorporating structural territorial constraints into regional sustainability assessment and place-based governance.
6. Discussion
6.1. Reinterpreting Regional Sustainability Through Structural Territorial Constraints
The results of this study suggest that introducing explicit structural territorial constraints into regional sustainability assessment leads to a different reading of regional performance. When land artificialisation is treated as a cumulative and largely irreversible territorial stock, sustainability patterns appear less as the outcome of recent policy choices and more as the result of long-term spatial trajectories. This shift in perspective challenges interpretations based exclusively on current socio-economic outcomes.
The pronounced asymmetry and geographic concentration observed for ENV_ARTIFICIAL_LAND are consistent with its interpretation as a path-dependent variable. Under this theoretical lens, regions with high levels of artificialisation would be expected to reflect development pathways shaped by decades of settlement expansion, infrastructure investment, and land-use regulation, and such territorial configurations would be expected to be difficult to modify in the short term. Because the present analysis relies on a single cross-sectional observation, these temporal dynamics cannot be directly observed here and should be read as a plausible theoretical interpretation rather than an empirically demonstrated causal mechanism. With this caveat, ENV_ARTIFICIAL_LAND captures a dimension of sustainability that differs in nature from socio-economic indicators, which are typically more sensitive to institutional change and economic dynamics.
Recognising this distinction has crucial conceptual implications. Interpreting land artificialisation as a candidate indicator of structural territorial constraint, rather than as a standard environmental performance indicator, helps avoid misleading comparisons in which regions are implicitly evaluated without reference to their inherited territorial conditions. The results therefore lend empirical support to critiques of outcome-based sustainability assessments, reinforcing the need for analytical frameworks that explicitly distinguish between structural territorial stocks and policy-responsive socio-economic outcomes.
6.2. Trade-Offs and Mismatches Between Territorial and Socio-Economic Dimensions
The joint reading of ENV_ARTIFICIAL_LAND and socio-economic indicators brings to light a set of trade-offs and mismatches that are not captured by unidimensional rankings or synthetic indices. The observed association between land artificialisation and economic capacity points to a tendency for economically stronger regions to exhibit higher levels of artificial land use, reflecting long-term development patterns. At the same time, the substantial dispersion around this trend indicates that economic growth has not followed a uniform spatial trajectory. Regions with comparable economic performance differ markedly in terms of territorial rigidity, while regions with limited economic resources may display very different degrees of land artificialisation.
A similar lack of alignment characterises the relationship between territorial artificialisation and social indicators. Both AROPE and EARLY_LEAVERS display only negligible associations with ENV_ARTIFICIAL_LAND. The correlation observed for AROPE is close to zero (r = −0.04), while EARLY_LEAVERS exhibits a weak and slightly negative association (r = −0.14). These findings suggest that territorial artificialisation is not systematically associated with higher levels of social vulnerability or educational disadvantage.
Rather than revealing a stable relationship between territorial rigidity and socio-economic fragility, the results highlight the coexistence of multiple regional configurations. Some highly artificialised regions exhibit comparatively favourable social outcomes, whereas several less artificialised regions continue to experience persistent social and educational vulnerabilities. This heterogeneity reinforces the importance of interpreting territorial and socio-economic dimensions jointly rather than through simplified linear relationships.
From an analytical standpoint, the quadrant-based trade-off framework proves useful precisely because it preserves this heterogeneity. By avoiding composite aggregation, it allows regional sustainability to be interpreted as a configuration of interacting dimensions rather than as a single ordered scale. This configurational perspective is particularly relevant for policy analysis, as it highlights contexts in which similar socio-economic outcomes are achieved under very different territorial conditions, as well as situations in which comparable territorial constraints are associated with divergent social and economic trajectories.
6.3. Implications for Place-Based Policy Design
The empirical patterns identified in this study carry clear implications for place-based policy design. Regions characterised by high levels of territorial rigidity face a fundamentally different policy context compared to regions where spatial constraints are less pronounced. In highly artificialised regions, sustainability strategies are necessarily shaped by limited land availability and by the legacy of past development choices. Policy efforts in these contexts are more likely to focus on regeneration, densification, adaptive reuse of existing built environments, and the integration of nature-based solutions within already saturated spatial systems [
46].
By contrast, regions with lower levels of land artificialisation may retain greater flexibility in land-use planning and spatial reorganisation, but this potential does not automatically translate into effective sustainability outcomes. Limited economic capacity, social vulnerability, or weak human capital may restrict the ability of these regions to mobilise available spatial margins. As a result, similar policy instruments may produce very different outcomes depending on the underlying territorial and socio-economic configuration. These findings also raise concerns with benchmarking practices based exclusively on socio-economic performance indicators. Evaluations that neglect structural territorial constraints risk penalising regions operating under severe spatial rigidity, while simultaneously overlooking latent vulnerabilities in regions that appear favourable in performance terms but face long-term spatial saturation. The inclusion of structural territorial indicators such as ENV_ARTIFICIAL_LAND enables more balanced and context-sensitive policy assessments.
Importantly, the framework proposed here does not imply a normative classification of regions as inherently “more” or “less” sustainable. Instead, it emphasises that sustainability policies operate within territorially differentiated opportunity spaces. Explicitly accounting for these proxies of structural territorial constraints enables a more realistic evaluation of regional sustainability strategies, supporting genuinely place-based policy design rather than implicit uniformity.
6.4. Limitations of the Study
To provide a transparent evaluation of the framework, the limitations of this study are explicitly delineated across four distinct operational and analytical dimensions.
First, regarding the validity of operationalisation of structural territorial constraint, ENV_ARTIFICIAL_LAND relies on an aggregated CORINE Level-1 “artificial surfaces” measure to preserve transparency and NUTS-2 reproducibility. Alternative operationalisations, such as Copernicus High Resolution Layer (HRL) impervious density, per capita artificial land, or disaggregated CORINE subclasses, were not evaluated, and convergent validity across these measures has not been established. Findings strictly pertain to this aggregated metric.
Second, regarding statistical robustness, given the small sample size and the fact that the Italian NUTS-2 regions represent the complete population of relevant units rather than a probabilistic sample drawn from a larger population, the analysis is strictly descriptive.
Non-parametric permutation testing was implemented to evaluate statistical noise and spatial dependence without relying on parametric assumptions. The non-significant permutation p-values underline that observed bivariate correlations cannot be distinguished from random association, underscoring that reported relationships must be interpreted strictly as descriptive summaries rather than structural causal dependencies.
Third, concerning the quadrant-based trade-off framework, regional classification into four configurations relies on median-based thresholds, chosen for their robustness to the skewed distributions documented in
Table 2 and for their transparency. Robustness checks using the mean, 40th, and 60th percentiles are consistent with high stability, with 90% to 95% of regions maintaining their baseline quadrant assignment (
Table 5). Thus, the framework serves as a stable descriptive device rather than as a fully validated regional typology.
Fourth, regarding the cross-sectional interpretation, the static design precludes direct empirical demonstration of path dependency, lock-in mechanisms, environmental debt, or causal accumulation processes. These concepts serve as theoretical interpretative lenses drawn from the literature on territorial development and land-use change, not as mechanisms empirically tested or demonstrated by the present data. The observed regional patterns should therefore be understood as being consistent with, rather than proving, such mechanisms. A longitudinal, multi-temporal extension of the framework, for example, using successive CLC releases as they become available, would be required to test these dynamic interpretations directly.
Beyond these four points, relying on a single reference year also prevents the direct observation of temporal trends, while ENV_ARTIFICIAL_LAND captures the overall extent of built-up areas without differentiating between internal land-use types, intensities, or functional urban qualities. Additionally, focusing on a single national case limits cross-country comparison, although the data sources and analytical steps are fully replicable across European NUTS-2 units. Taken together, these limitations do not weaken the internal coherence of the results but rather delineate the scope within which the findings should be interpreted. They also point to natural extensions of the analysis, including the integration of multi-temporal land-cover data, more detailed spatial indicators derived from Copernicus products such as the HRL imperviousness density dataset, and broader comparative applications at the European scale.
6.5. Methodological Contributions and Positioning Within the Sustainability Debate
From a methodological perspective, this study illustrates how a parsimonious and non-aggregative approach can support clearer interpretation in regional sustainability analysis. Rather than increasing analytical complexity through weighting or aggregation procedures, the framework relies on a small set of indicators with distinct conceptual roles. The explicit separation between structural territorial stocks and socio-economic conditions avoids implicit compensability and enhances analytical transparency. Furthermore, the conceptual distinction between territorial stocks and socio-economic conditions provides a promising, useful basis for territorialised Life Cycle Assessment (LCA) frameworks [
47]. Indicators reported in this study could be integrated into territorialised LCA frameworks to account for the cumulative effects of land-use change and land occupation, thereby supporting a more spatially explicit assessment of environmental burdens and sustainability trade-offs across regions [
48].
Placed within the broader debate on regional sustainability assessment, this study supports approaches that emphasise geographical context, path dependency, and structural constraints alongside observed socio-economic outcomes. By bringing territorial structure to the foreground, the analysis aligns with literature questioning the adequacy of purely performance-based comparisons among regions operating under markedly different inherited spatial conditions.
Rather than proposing a new index or ranking, the framework developed provides a complementary perspective. ENV_ARTIFICIAL_LAND is not intended to replace existing environmental or socio-economic indicators, but to add an explicitly spatial and structural dimension to their interpretation, bridging environmental science, spatial planning, and regional economics.
Integrating stock-based territorial indicators into regional assessment frameworks does not resolve normative questions about sustainability, but it can improve the realism and interpretability of comparative analyses. Making spatial constraints explicit, such indicators help clarify why similar policy objectives may face very different feasibility conditions across regions. Future methodological developments could enrich this structure by incorporating impact-based characterisation factors, such as biodiversity loss, soil functionality, ecosystem service disruption, and carbon sequestration loss.
This would enable the shift from a representative stock-based measure of artificialisation of land to a more impact-based measure, whilst maintaining the current territorial accounting structure. Such frameworks could contribute to better understanding of the ecological effects of artificial land use from a policy-relevant perspective, by connecting physical parameters of the land to known environmental impact pathways.
7. Conclusions
This paper addresses a persistent gap in regional sustainability assessment by explicitly incorporating a proxy of structural territorial constraints into the analytical framework. While most comparative approaches rely on indicators capturing current socio-economic or environmental outcomes, the analysis shows that inherited land-use structures play a critical role in shaping long-term sustainability trajectories and in delimiting the space of feasible policy action. This perspective is consistent with longstanding research on land-use path dependency and the cumulative nature of urbanisation processes [
49,
50].
By operationalising land artificialisation as a stock-based indicator, ENV_ARTIFICIAL_LAND, and examining its interaction with socio-economic dimensions across Italian NUTS-2 regions, the study provides three primary empirical insights. Firstly, artificial land use exhibits pronounced spatial asymmetry and an apparent geographic concentration pattern (observed visually, though not formally tested for spatial autocorrelation), consistent with the cumulative, quasi-irreversible development trajectories described in the literature [
51,
52]. Secondly, the results indicate a descriptive pattern and mismatches between territorial rigidity and socio-economic outcomes. These complex spatial configurations remain largely invisible in traditional unidimensional rankings or compensatory composite indices. Thirdly, from a methodological standpoint, the analysis demonstrates the value of a parsimonious, non-aggregative approach that preserves data interpretability and supports place-based diagnoses without sacrificing critical empirical granularity.
From a policy perspective, these findings emphasise the need for differentiated strategies. Regions with high levels of spatial rigidity require urban planning centered on regeneration, densification, and adaptive reuse. Conversely, regions with lower levels of artificialisation but weaker socio-economic capacity require targeted investments and institutional support. Benchmarking exercises that ignore these inherent structural asymmetries risk producing misleading evaluations and poorly calibrated policy responses.
While this study provides a descriptive diagnostic baseline, the current analysis remains static and relies on a single land-cover reference year. Robustness assessments based on alternative threshold specifications (mean, 40th percentile, and 60th percentile) indicated a high degree of stability of the reported patterns, with between 90% and 95% of regions retaining their original quadrant assignment. Nevertheless, the findings should continue to be interpreted as descriptive rather than inferential, and future research could extend the analysis through bootstrap confidence intervals and formal spatial autocorrelation measures.
Future research should expand the temporal scope of the framework using multiple CORINE Land Cover (CLC) releases and extend the empirical scope to other European regions [
53,
54]. A particularly promising development would be to integrate these high-resolution spatial metrics with territorial Life Cycle Assessments and construction sector inventories. Linking Copernicus spatial layers with infrastructure database metrics would allow researchers to model metabolic material and energy flows within regional building stocks. This interoperability would transform the framework into a predictive platform capable of simulating the long-term environmental impacts of regional building and renovation policies prior to implementation.
Ultimately, meaningful context-aware regional sustainability assessments cannot be achieved without the explicit integration of stock-based territorial structures.