1. Introduction
Against the backdrop of escalating environmental and climate risks and growing concerns over energy security [
1,
2], new energy policies have become an important policy instrument for governments worldwide to optimize energy structures, facilitate the green and low-carbon transition, and promote sustainable development [
3,
4]. However, the effectiveness of these policies depends not only on their ability to drive energy substitution and industrial restructuring at the macro level, but also, more importantly, on whether they can be effectively transmitted to the firm level, thereby encouraging firms to adjust production practices, optimize resource allocation, enhance technological innovation, and improve corporate governance. As the primary agents of energy consumption, technological innovation, and value creation, firms play a pivotal role in determining whether the objectives of new energy policies can be translated into tangible environmental, social, and governance outcomes. Therefore, understanding whether and how new energy policies affect corporate sustainability is important for evaluating their firm-level consequences.
As sustainable development has gained increasing prominence, environmental, social, and governance (ESG) has become a widely used framework for evaluating corporate sustainability. ESG performance provides a multidimensional measure of firms’ environmental, social, and governance outcomes [
5]. According to institutional theory, corporate behavior is shaped not only by economic incentives and efficiency considerations but also by regulatory requirements, policy expectations, and legitimacy pressures arising from the external institutional environment [
6]. As a place-based policy package integrating regulatory coordination, resource support, and infrastructure development, new energy policies may generate competing enabling and constraining effects on corporate ESG performance. On the enabling side, environmental targets and monitoring requirements increase firms’ incentives to reduce pollutant emissions [
7], while fiscal and financial support, technology promotion, and renewable-energy infrastructure can lower the costs of green transformation and encourage green technological innovation [
8]. Related evidence also suggests that decentralized energy transition policies can facilitate the sustainable green transformation of high-energy-consuming firms [
9]. On the constraining side, the compliance and adjustment costs associated with energy transition may intensify firms’ financial pressures, especially among firms with limited access to external finance, thereby crowding out long-term ESG investment [
10]. The net effect of new energy policy on corporate ESG performance is therefore theoretically ambiguous and requires systematic firm-level empirical examination.
China’s New Energy Demonstration City Pilot Policy provides a useful institutional setting for examining this research question. As one of the world’s largest energy consumers, China has long relied heavily on fossil fuels, resulting in substantial environmental pressures and resource constraints [
11]. In response, the Chinese government has elevated new energy development to a national strategic priority and progressively expanded its policy framework for promoting the energy transition [
12]. Within this broader framework, the New Energy Demonstration City (NEDC) Pilot Policy, with pilot cities formally designated in 2014, constitutes a major place-based policy package aimed at accelerating renewable-energy development and transforming urban energy systems. The policy designated 81 prefecture-level and above cities and combined target setting, administrative coordination, financial support, technology promotion, renewable-energy infrastructure development, and implementation monitoring. Its clearly defined formal designation date and geographic coverage provide transparent temporal and spatial boundaries for a difference-in-differences design. Because pilot designation was not random, however, the empirical analysis explicitly considers pre-existing differences between pilot and non-pilot cities through a series of identification and sensitivity analyses.
Existing research relevant to this study can be broadly divided into two streams. The first examines the consequences of new-energy policies, with prior studies focusing mainly on regional and city-level outcomes. These studies show that such policies improve carbon emission efficiency [
13], reduce carbon emissions [
14] and air pollution [
15], promote industrial restructuring [
16], improve energy efficiency [
17] and urban green economic performance [
18], and generate broader but potentially heterogeneous effects on regional sustainable development [
19]. At the firm level, recent research has examined outcomes such as green innovation, energy consumption intensity, and green mergers and acquisitions [
20,
21,
22]. The second stream investigates the determinants of corporate ESG performance, including executive characteristics, ownership structures, board attributes, environmental regulation, green finance, social trust, and public environmental concern [
23,
24,
25,
26,
27,
28,
29,
30]. Although these studies identify a wide range of firm-level and institutional drivers of ESG performance, direct evidence on how a place-based new energy policy package affects firms’ overall ESG performance remains relatively limited.
Recent studies have begun to directly examine the relationship between energy transition policies and corporate ESG performance, but findings are mixed. Tu et al. [
10] report that energy transition policies may reduce corporate ESG performance by increasing bankruptcy risk and tightening financing constraints. By contrast, Zheng et al. [
31] find that the NEDC Pilot Policy improves the ESG performance of energy-intensive firms. These differences may reflect variation in policy measurement, sample composition, industry coverage, and sample period, as well as the relative importance of transition costs and policy support. Importantly, whether the positive ESG response to the NEDC Pilot Policy documented among energy-intensive firms extends to a broader multi-industry sample remains unclear. Further evidence is needed on the potential roles of green technological innovation and external financing conditions in linking the policy to corporate ESG performance, as well as on whether the external information environment moderates this relationship.
Motivated by these gaps, this study examines whether the NEDC Pilot Policy is associated with improvements in corporate ESG performance, explores green technological innovation and external financing conditions as potential firm-response channels and the moderating role of the external information environment, and investigates how the estimated relationship varies across ESG dimensions, firm characteristics, regional contexts, and geographic proximity to pilot cities. Specifically, this study uses panel data on Chinese A-share non-financial listed firms from 2009 to 2023 and a difference-in-differences framework to examine the firm-level ESG consequences of China’s New Energy Demonstration City Pilot Policy. It further investigates green technological innovation and external financing conditions, proxied by financing constraints, as potential firm-response channels, and examines analyst coverage as an external information and monitoring condition. We also examine differences across ESG dimensions, firm characteristics, and regional contexts, as well as the geographic reach of potential policy spillovers.
A central contribution of this study is the development of a policy-specific analytical framework for understanding how a place-based energy-transition policy may translate into firm-level sustainability outcomes. Rather than treating the NEDC program as a single regulatory intervention, the framework distinguishes direct regulatory and administrative coordination instruments from incentive and resource-support instruments, and separates policy instruments, firm-response channels, and external conditions. Linking this policy mix to firms’ transition motivation and transition capacity clarifies the distinct roles of green technological innovation as a behavioral response, external financing conditions as a resource condition, and analyst coverage as an external information and monitoring condition that may shape policy transmission.
A second contribution lies in extending the literature on the corporate ESG consequences of energy-transition policies, where existing evidence remains limited and mixed. Whereas prior research on the relationship between NEDC and ESG has largely focused on energy-intensive firms, this study uses a multi-industry sample to examine whether the estimated relationship extends to a broader range of listed firms. Dimension-specific analyses further show that the estimated response is concentrated in environmental and governance performance rather than being uniform across ESG components.
Finally, this study contributes to the literature on the heterogeneous and spatial consequences of place-based energy-transition policies by moving beyond the average policy estimate. The analysis identifies important boundary conditions associated with ownership structure, industry technology intensity, and regional institutional environments, and further examines localized spillovers to nearby non-pilot firms. Although the NEDC program is embedded in China’s institutional setting, the findings offer qualified insights for other emerging economies considering similar place-based energy-transition policies, subject to differences in governance capacity, financial systems, and regulatory institutions.
The remainder of this paper is organized as follows.
Section 2 introduces the institutional background of the NEDC Pilot Policy, develops the theoretical framework, and presents the research hypotheses.
Section 3 describes the research design, including model specification, variable construction, and data sources.
Section 4 presents the baseline results and robustness tests.
Section 5 conducts the channel analyses and examines the moderating role of analyst coverage.
Section 6 presents further analyses, including the effects of the NEDC Pilot Policy across different ESG dimensions, heterogeneity in the policy effects, and the spatial spillover effects and their geographic reach.
Section 7 summarizes the main findings and discusses the policy implications, research limitations, and directions for future research.
2. Policy Background and Hypothesis Development
2.1. Policy Background
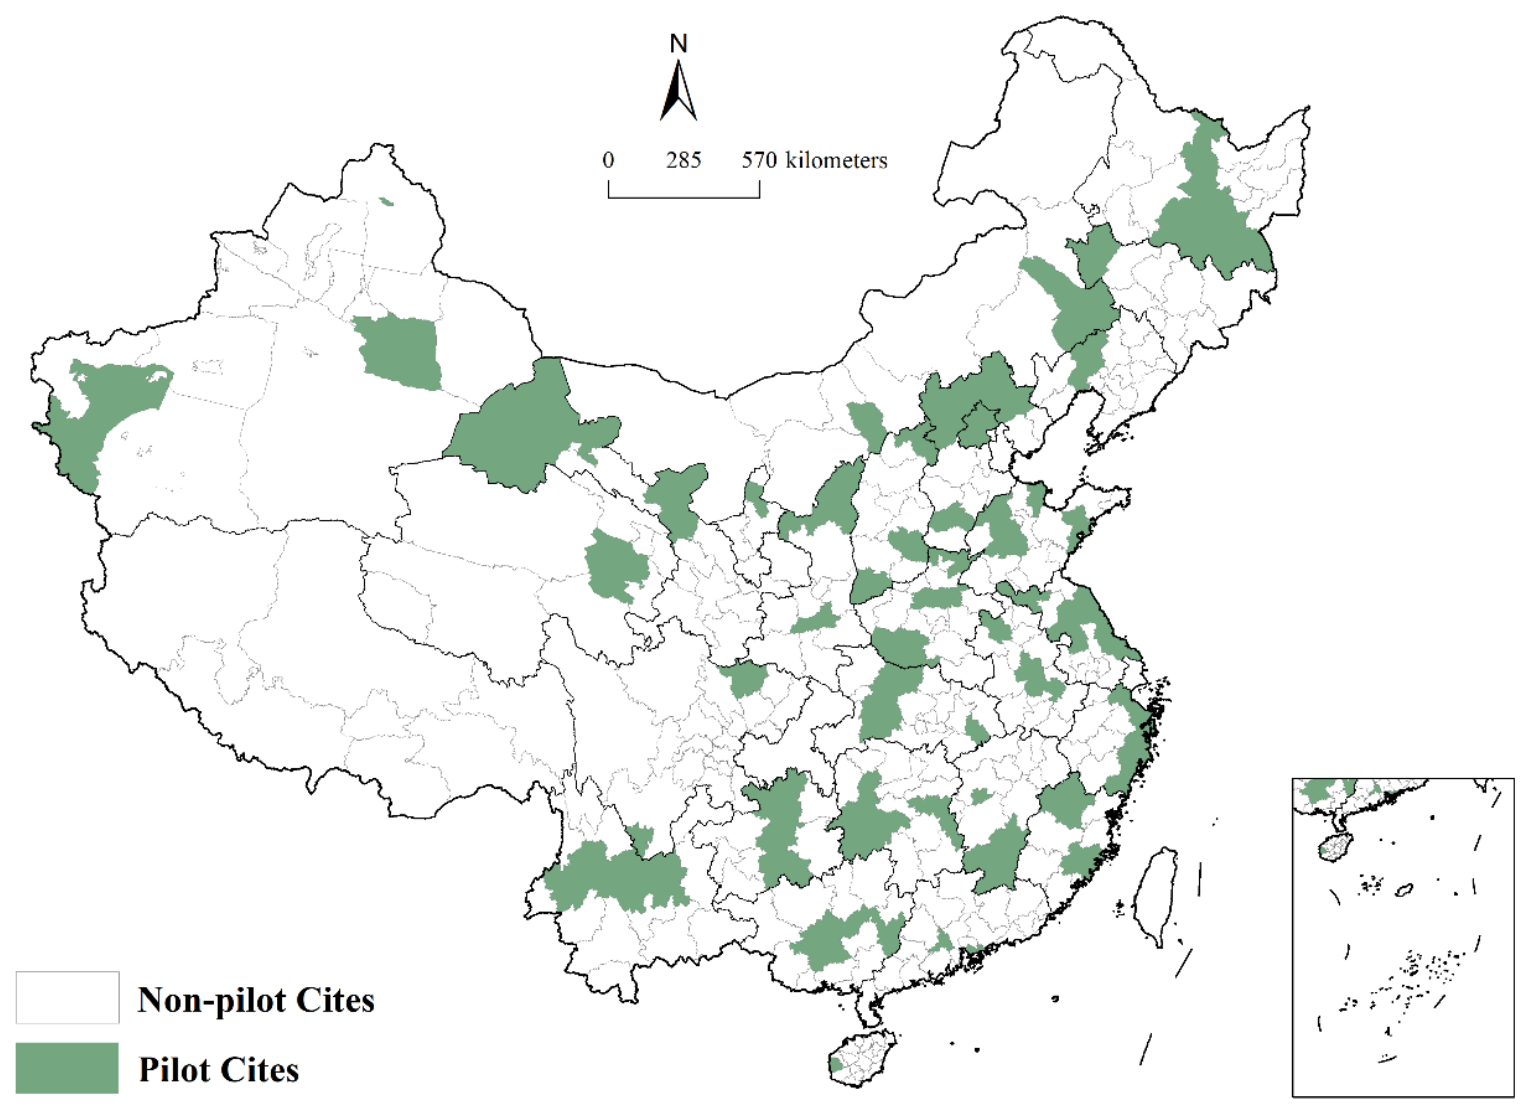
The New Energy Demonstration City (NEDC) Pilot Policy is a place-based policy initiative through which China promotes the large-scale development and utilization of new energy and the transformation of urban energy systems. In January 2014, the National Energy Administration officially announced the first batch of NEDC pilot cities, designating 81 cities as pilot areas. Following the official announcement, the selected cities began implementing the NEDC program under a common national framework for policy planning, progress reporting, monitoring, and evaluation. We therefore use 2014 as the policy treatment year and classify cities included in the official NEDC list as treated cities. Their geographic distribution is presented in
Figure 1. The common formal policy announcement and clearly defined geographic coverage provide transparent temporal and spatial boundaries for examining changes in corporate ESG performance in pilot and non-pilot cities before and after the formal designation of pilot cities.
Before the official pilot list was finalized, cities were selected through a process involving local applications, review by provincial energy authorities, and comprehensive evaluation by the National Energy Administration. Applicant cities were required to prepare NEDC development plans specifying new-energy development objectives, major projects, implementation arrangements, and supporting measures. The evaluation focused primarily on cities’ existing foundations in energy conservation and new-energy utilization, conditions for new-energy development and utilization, development planning and implementation capacity, local policy support, and supporting infrastructure. Final pilot status was determined through national-level administrative evaluation and formal designation. For empirical purposes, firm-level treatment status is therefore defined according to whether the city in which a firm was registered was included in the official pilot list. The NEDC program thus generated a clearly defined change in the local policy environment faced by firms in designated cities, with a formal designation date and geographic boundary, providing an institutional basis for comparing firms located in pilot cities with those located in non-pilot cities before and after formal designation.
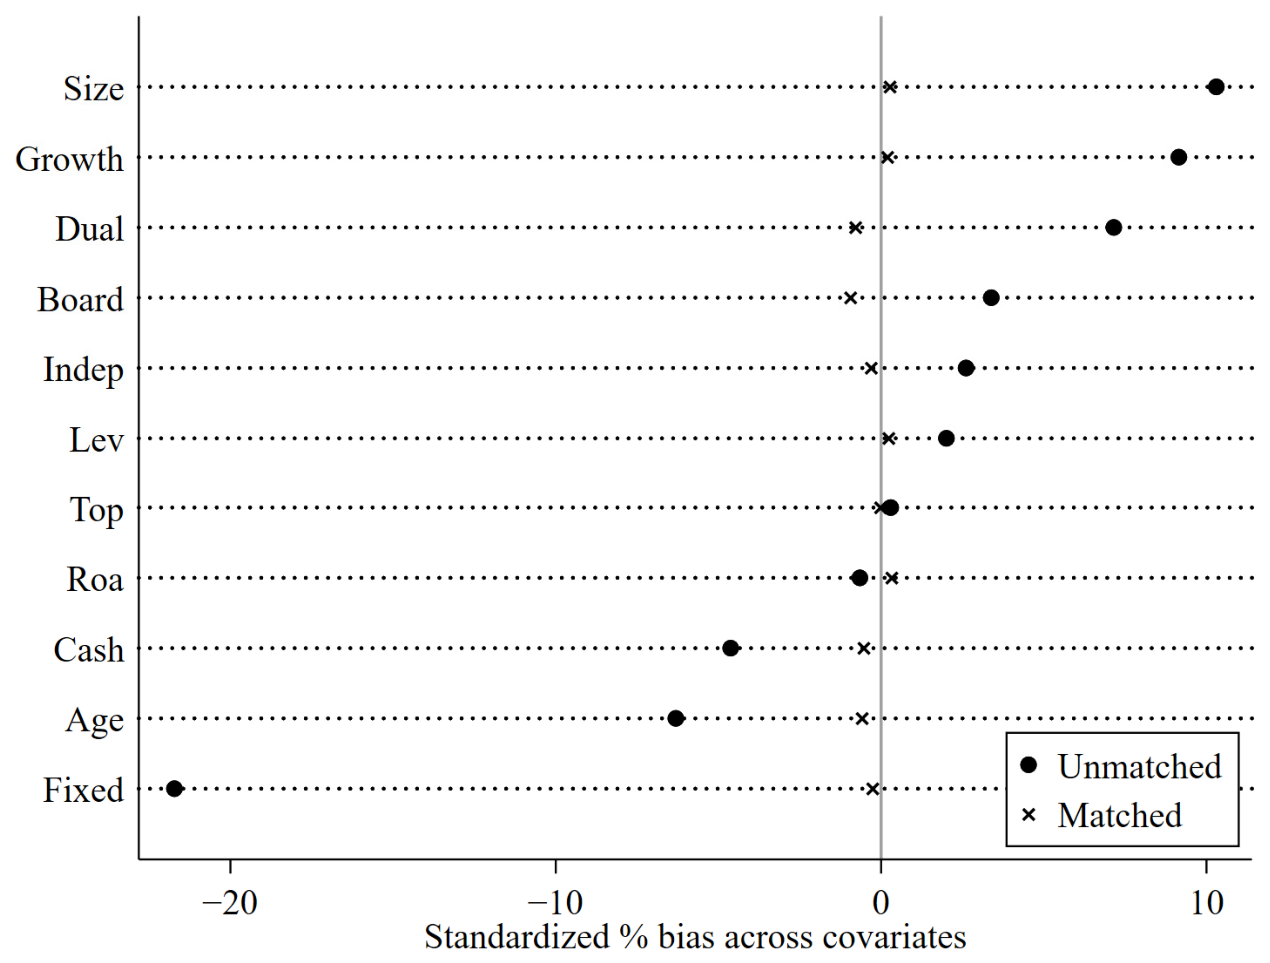
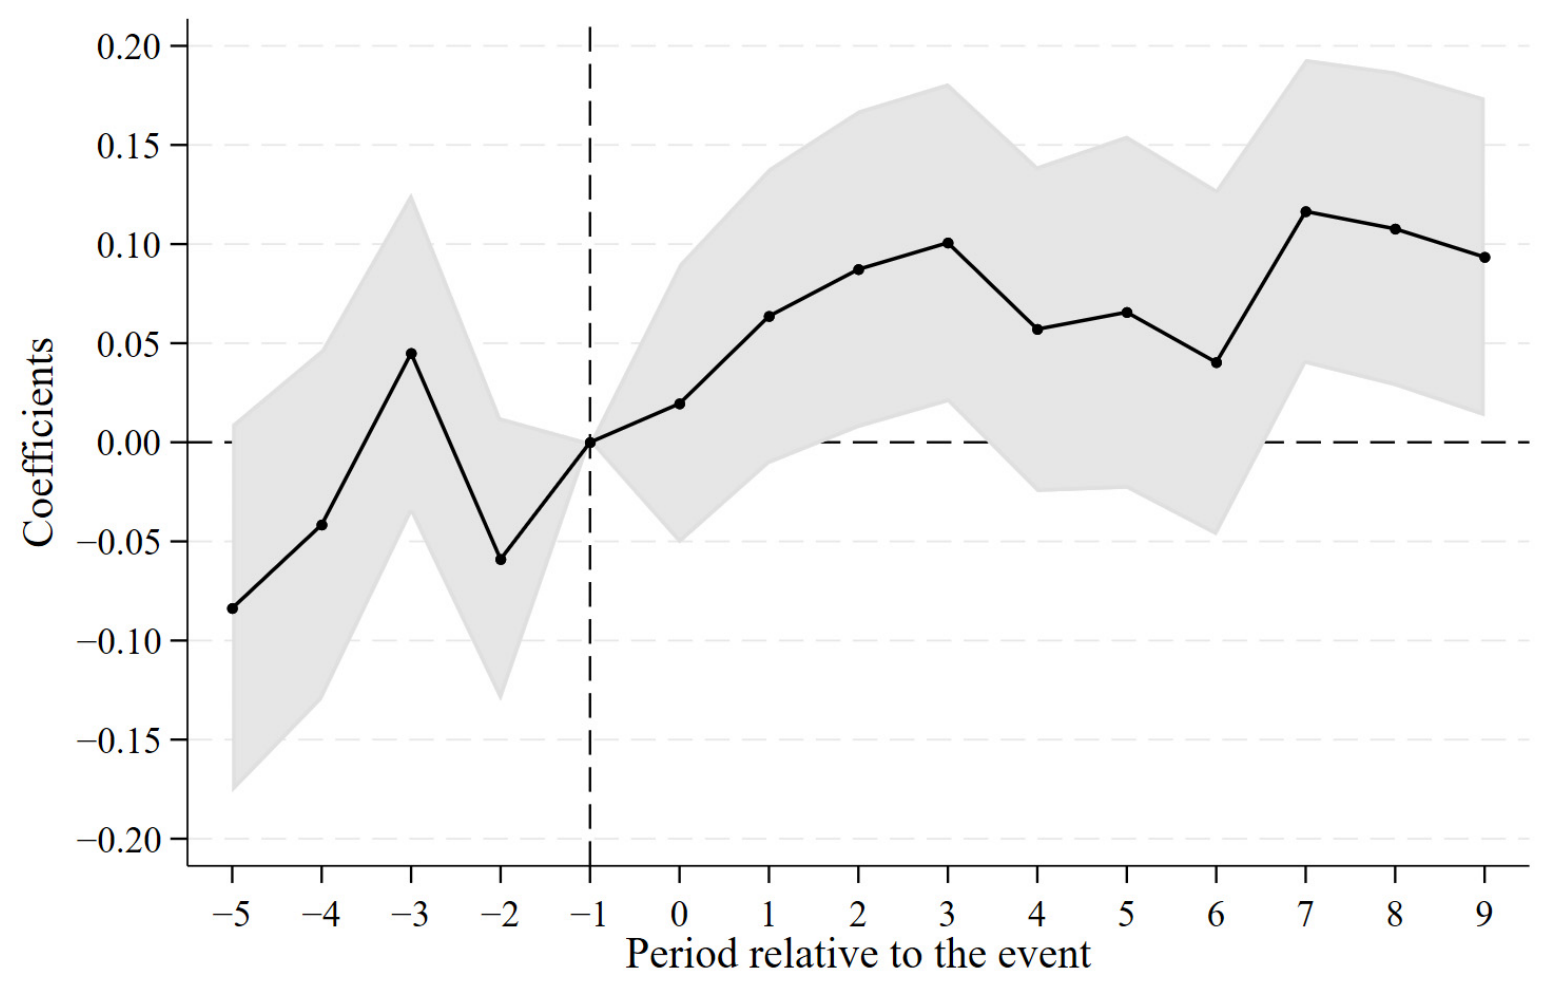
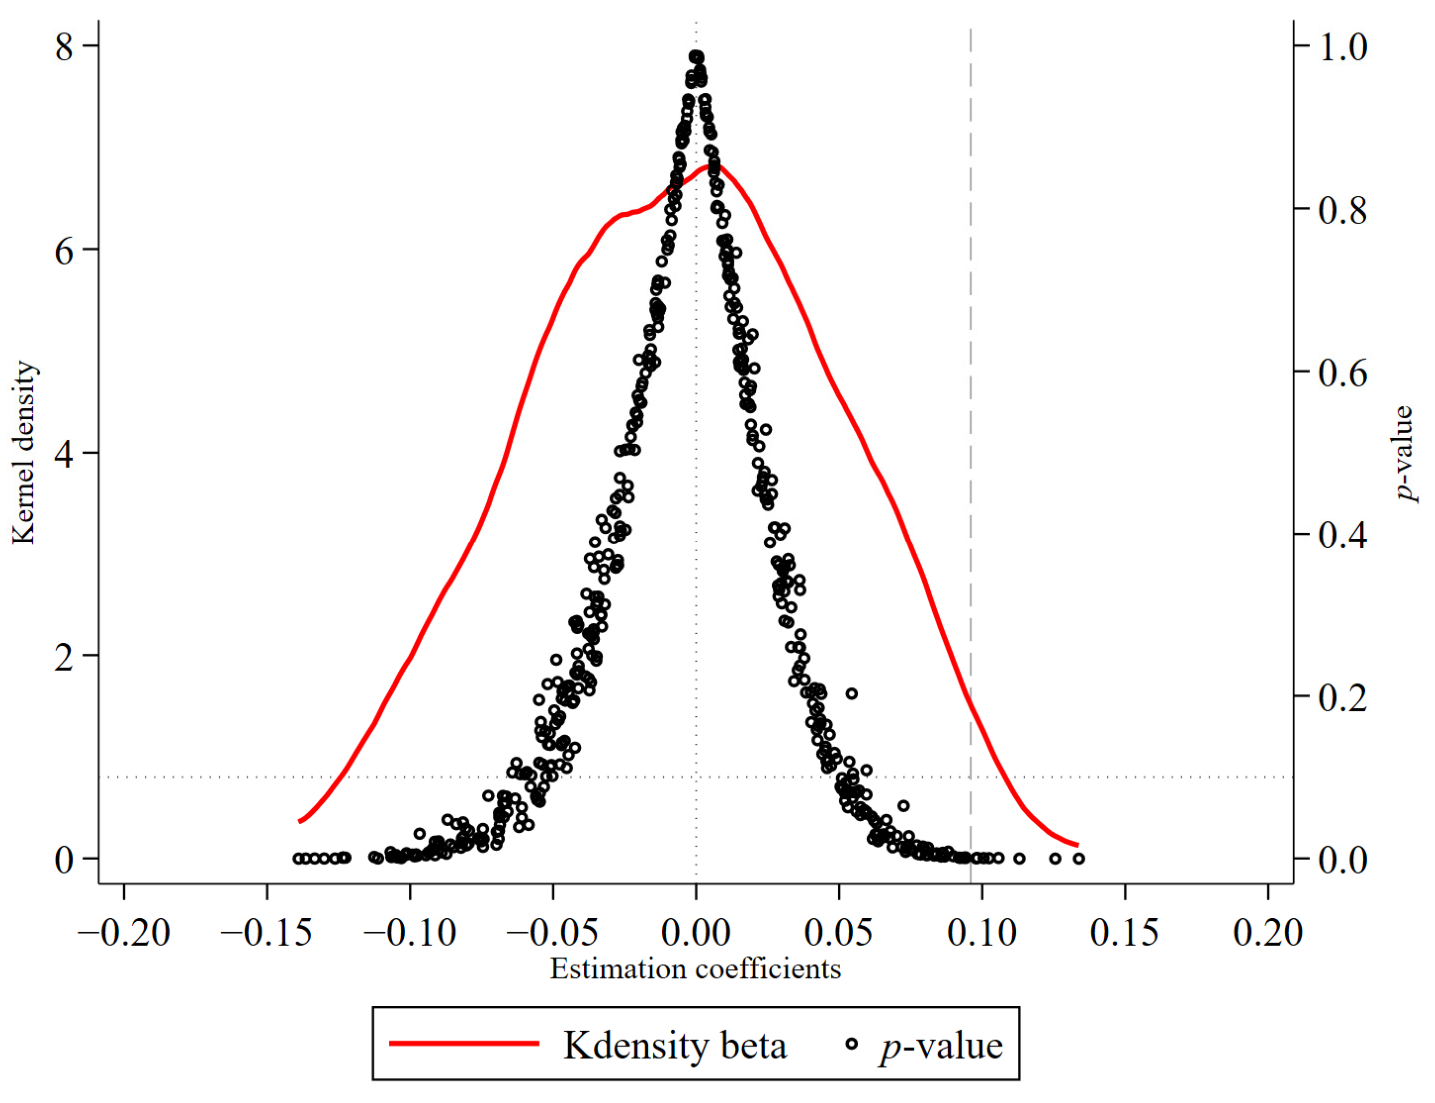
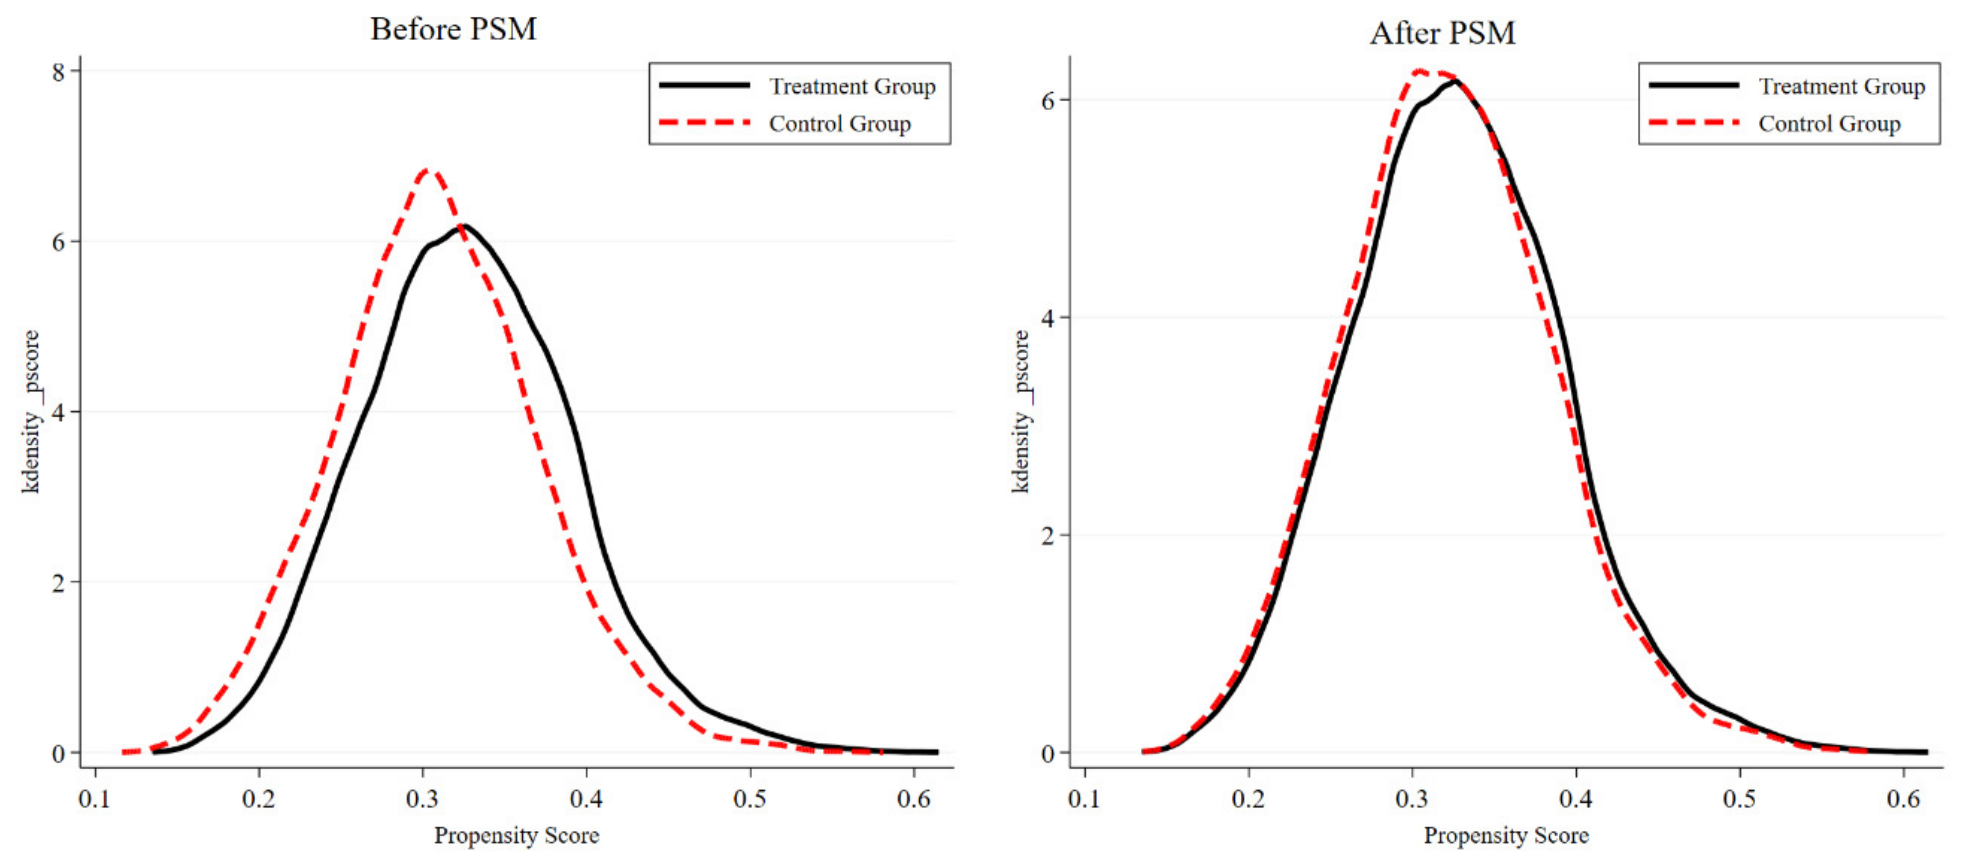
At the same time, the selection process indicates that pilot status was not randomly assigned across cities. Designation was related to pre-existing conditions such as the local foundation for new-energy development, energy conservation and environmental performance, planning and implementation capacity, and supporting policy arrangements. Pilot and non-pilot cities may therefore have differed systematically before formal pilot designation. The common policy announcement and clearly defined pilot areas provide transparent temporal and geographic boundaries for constructing the difference-in-differences design, but these features do not eliminate concerns arising from non-random policy assignment. To address these concerns, this study explicitly considers pre-existing characteristics and differential development patterns between pilot and non-pilot cities and conducts a series of robustness and sensitivity analyses to address potential selection-related bias.
The institutional selection process also helps clarify the scope of potential reverse-causality concerns. NEDC evaluation and designation were based primarily on city-level conditions for new-energy development, energy utilization, planning, and policy implementation, whereas corporate ESG performance was not a formal criterion for pilot selection. This reduces concerns that pilot status was assigned directly in response to firm-level ESG performance. It does not, however, rule out the possibility that pilot selection was correlated with pre-existing city characteristics that also affected subsequent corporate ESG trajectories. Overall, the NEDC program represents a city-level policy intervention that altered the local policy environment faced by firms, while its non-random geographic assignment requires careful empirical treatment. In terms of policy content, the NEDC program does not rely on a single environmental regulatory instrument. Rather, it represents a comprehensive policy arrangement centered on the transformation of urban energy systems and combines multiple instruments, including new-energy development targets, local planning and administrative coordination, information monitoring and policy evaluation, fiscal and financial support, technology promotion and demonstration applications, and new-energy infrastructure development. Based on their mode of intervention and principal functions, these instruments can be grouped into two broad categories.
The first category consists of direct regulatory and administrative coordination instruments, including binding new-energy development targets, integration of demonstration-city objectives into local development plans and annual plans, implementation responsibilities, information monitoring and statistical reporting, project supervision, and performance assessment. By incorporating new-energy development objectives into local economic and social development plans and annual implementation plans, establishing binding development targets, and supporting their implementation through monitoring, reporting, supervision, and assessment mechanisms, these instruments strengthen institutional requirements, policy expectations, and administrative coordination for the energy transition. The second category consists of indirect incentive and resource-support instruments, including fiscal and financial support, technical services and technology promotion, application demonstrations, new-energy infrastructure development, and related public services. These instruments are designed to improve the financial, technological, market, and infrastructural conditions required for new-energy deployment and to alleviate resource constraints and implementation costs associated with green transformation.
Although the two categories differ in their immediate functions, both are intended to support the transformation of urban energy systems.
2.2. Theoretical Framework and Hypothesis Development
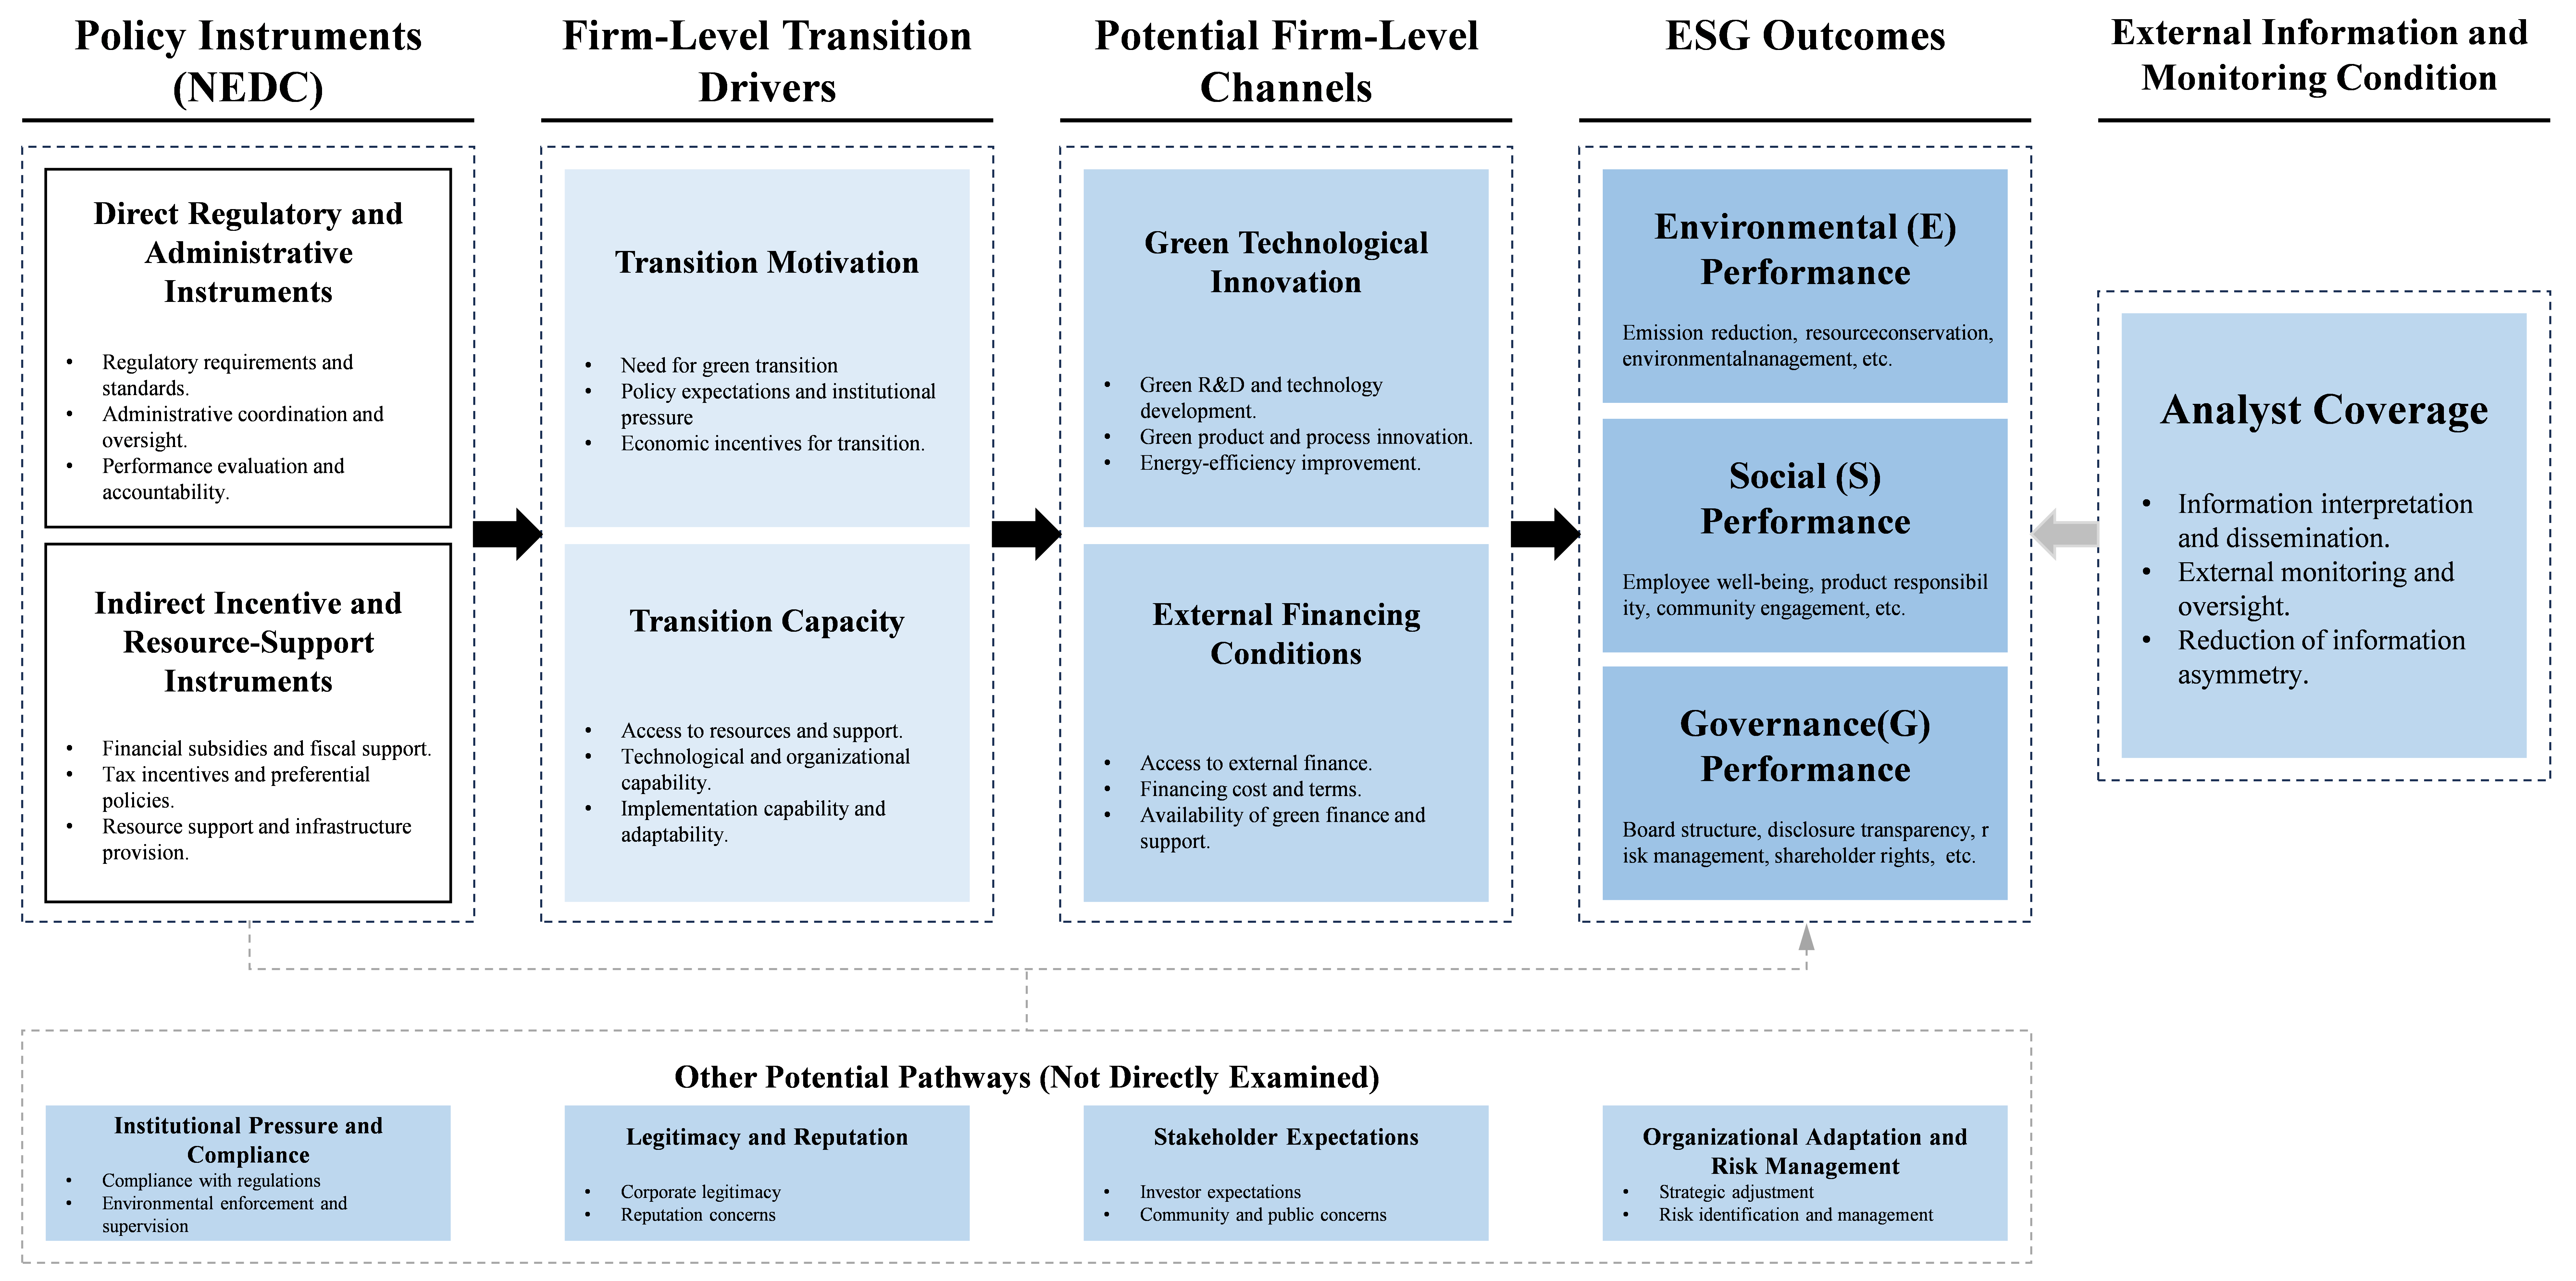
Figure 2 presents the theoretical framework linking the NEDC Pilot Policy to corporate ESG performance. The framework conceptualizes policy transmission as a sequence from policy instruments to firm-level transition drivers, potential firm-level channels, and ESG outcomes, while treating the external information environment as a condition that may shape the strength of policy transmission. Specifically, the NEDC program combines direct regulatory and administrative coordination instruments with indirect incentive and resource-support instruments. These instruments may jointly strengthen firms’ transition motivation and transition capacity by increasing institutional and economic incentives for energy transition and improving the resources and implementation conditions available for adjustment. Transition motivation and transition capacity, in turn, provide the conceptual basis for examining green technological innovation and external financing conditions as two potential firm-level channels associated with the NEDC–ESG relationship. Analyst coverage is conceptually distinct from these channels and is treated as an external information and monitoring condition that may strengthen firms’ responsiveness to policy signals. The framework also recognizes other theoretically relevant pathways that are not directly examined in the empirical analysis. Transition motivation and transition capacity are therefore used as organizing concepts rather than as separately identified empirical mediators.
The theoretical logic underlying this framework follows the same sequence. From a policy-mix perspective, the NEDC program combines regulatory and administrative requirements with incentive and resource support, allowing different policy instruments to generate complementary effects [
32]. Related research on the coordination of ecological and economic resilience further emphasizes that sustainable development depends on complementarities among ecological protection, economic development, infrastructure, and governance conditions [
33]. This broader perspective is consistent with viewing the NEDC program as a coordinated policy mix whose implications may extend beyond environmental outcomes alone. Institutional theory further suggests that stronger policy requirements, expectations, and signals can increase firms’ motivation to align their activities with local energy-transition objectives [
6]. The Porter Hypothesis and induced-innovation theory provide a basis for understanding why changes in regulatory and incentive conditions may encourage technological adjustment and green innovation [
34,
35]. At the same time, resource dependence theory highlights the importance of access to external resources in shaping firms’ capacity to undertake sustainability-related investment and adjustment [
36]. These technological and resource-related changes may be reflected in broader ESG outcomes as firms respond to environmental requirements and stakeholder expectations, consistent with stakeholder theory [
37]. Taken together, these perspectives explain how the NEDC policy mix may reshape firms’ motivation and capacity to adjust and provide the theoretical basis for the firm-level relationships examined below.
2.2.1. NEDC Pilot Policy and Corporate ESG Performance
Corporate ESG performance encompasses environmental, social, and governance dimensions, which may respond differently to a place-based energy-transition policy. From an institutional perspective, the NEDC program may alter the policy requirements, expectations, and resource conditions surrounding local energy transition. By combining direct regulatory and administrative coordination instruments with indirect incentive and resource-support instruments, the policy may influence firms’ sustainability-related decisions and practices. Because the objectives and instruments of the NEDC program are more directly connected with some ESG dimensions than with others, its potential effects are likely to differ across environmental, social, and governance dimensions.
From the environmental perspective, the relationship between the NEDC Pilot Policy and corporate environmental performance is relatively more direct. New-energy development targets, energy-structure adjustment objectives, local planning, monitoring, and evaluation strengthen policy signals and adjustment pressures associated with continued reliance on conventional energy. During pilot implementation, stronger local policy attention to energy transition may encourage firms to improve energy efficiency, increase clean-energy use, and adopt cleaner production practices [
7,
38]. At the same time, fiscal and financial support, technical services, demonstration applications, and new-energy infrastructure may reduce the financial, technological, and implementation barriers associated with adopting clean energy, energy-saving equipment, and green production technologies [
39]. The combination of stronger transition incentives and improved implementation conditions may therefore promote energy substitution, energy conservation, emissions reduction, and greener production, thereby contributing to improved corporate environmental performance.
From the social perspective, the link is less direct because the NEDC program does not explicitly target employee welfare, consumer rights, supply-chain responsibility, or community engagement. Potential social effects may arise indirectly as cleaner production improves environmental conditions for employees and surrounding communities, while the adoption of new technologies may increase demand for employee training and skills upgrading. More broadly, firms may also face stronger stakeholder expectations regarding the social implications of their transition activities [
30,
40]. However, these outcomes depend on how firms translate energy-transition activities into broader employment, stakeholder, and community practices, many of which require sustained organizational adjustment. The social-performance response is therefore theoretically less direct than the environmental response.
From the governance perspective, the effect is also indirect. The monitoring, statistical reporting, and policy-evaluation arrangements associated with the NEDC program increase the demand for and visibility of energy-related information. Firms whose operations and investment decisions are increasingly affected by the energy transition may therefore have stronger incentives to improve energy-data collection, internal information systems, and related management processes. In addition, the long investment horizons, substantial capital requirements, and technological uncertainty associated with energy-transition investments [
41] may encourage firms to strengthen strategic planning, capital budgeting, internal controls, and long-term risk management to better manage transition-related opportunities and risks. Where firms undertake policy-supported or green investment projects, requirements concerning fund use, project performance, and implementation may further strengthen incentives for managerial oversight and accountability. Thus, although the NEDC Pilot Policy does not directly prescribe firms’ governance structures or impose uniform ESG disclosure requirements, it may indirectly contribute to governance performance by increasing the organizational importance of information management, risk control, project oversight, and accountability.
Overall, the NEDC Pilot Policy may affect the three ESG dimensions through different pathways. Its connection with environmental performance is the most direct, while its implications for governance and social performance may arise through broader organizational and stakeholder-related responses. By strengthening firms’ incentives to engage in the energy transition and providing resources and implementation support, the policy may encourage improvements in overall corporate sustainability, although the strength of the response may vary across ESG dimensions. We therefore propose:
Hypothesis 1.
The NEDC Pilot Policy improves corporate ESG performance.
2.2.2. Green Technological Innovation as a Potential Channel
Green technological innovation represents an important way in which firms may respond to the NEDC policy. Consistent with the Porter Hypothesis and induced-innovation theory, changes in regulatory pressures, relative technology costs, and expected returns may redirect firms’ technological choices and R&D investment toward cleaner technologies [
34,
35]. Within the NEDC framework, regulatory and administrative coordination may strengthen firms’ incentives for technological upgrading, while incentive and resource-support measures may improve the conditions under which green innovation can be undertaken.
More specifically, regulatory and administrative coordination under the NEDC program establishes new-energy development targets, incorporates these objectives into local planning, and introduces monitoring and evaluation arrangements. Clearer and more persistent policy signals may increase the expected costs of delaying technological upgrading, particularly for firms that rely more heavily on conventional energy or emission-intensive production processes. At the same time, clearer policy priorities may strengthen expectations of future demand for new-energy equipment, energy-saving technologies, and cleaner-production solutions, thereby increasing the expected returns to green R&D. Existing studies suggest that the NEDC program and related energy-transition policies can promote green innovation at the firm and regional levels [
20,
42].
In addition to strengthening incentives for green innovation, the NEDC program may provide resources that facilitate such investment. Green R&D typically requires substantial upfront investment, involves long development cycles, and entails considerable technological uncertainty [
41]. Fiscal and financial support, technical services, demonstration applications, and new-energy infrastructure may reduce some of the financial and implementation barriers to green R&D and technology adoption. Demonstration activities and supporting services may also facilitate technology application, knowledge exchange, and diffusion [
43,
44]. These measures may therefore improve the conditions under which firms develop and adopt green technologies.
Greater green technological innovation may, in turn, be associated with better corporate ESG performance. Cleaner technologies can reduce energy consumption and pollutant emissions and improve resource-use efficiency [
45]. Green innovation may also strengthen firms’ sustainability capabilities and signal their commitment to the green transition to investors and other stakeholders [
46]. Consistent with these arguments, prior studies document a positive relationship between corporate green innovation and ESG performance [
47]. Overall, the NEDC policy may encourage green technological innovation by strengthening firms’ incentives to innovate and improving the resources and conditions available to support innovation. Green technological innovation may, in turn, contribute to improved corporate ESG performance. We therefore propose:
Hypothesis 2.
Green technological innovation is a potential channel through which the NEDC Pilot Policy is associated with improved corporate ESG performance.
2.2.3. External Financing Conditions as a Potential Channel
External financing conditions constitute an important resource basis for firms’ green transformation. From a resource-dependence perspective, firms’ ability to undertake and sustain sustainability-related investments depends partly on their access to external financial resources [
36]. Many transition- and sustainability-related investments require substantial upfront expenditure, while their returns are often long-term and uncertain. Firms facing tighter financing constraints may therefore prioritize short-term operating and liquidity needs, leaving fewer resources available for green investment and other sustainability-related activities [
48].
The NEDC policy may improve firms’ external financing conditions through both categories of policy instruments. Direct regulatory and administrative coordination instruments clarify development objectives, strengthen planning coordination, and reinforce implementation monitoring, thereby increasing the stability and predictability of the local policy environment regarding new-energy development. These arrangements may reduce uncertainty surrounding transition-related projects and investment opportunities and facilitate financial institutions’ assessment of relevant firms and projects [
49,
50]. At the same time, incentive and resource-support measures, including fiscal and financial support, infrastructure development, technical services, and support for demonstration projects, may reduce the costs and risks associated with transition-related investment [
51,
52]. These measures may therefore improve firms’ access to external financial resources and ease financing constraints associated with long-term sustainability investment.
Improved financing conditions may, in turn, strengthen firms’ capacity to pursue ESG-related activities. Greater access to external resources may allow firms to sustain long-term investment in clean-energy adoption, green R&D, environmental management, and other sustainability-related activities whose returns may take time to materialize. Consistent with this argument, existing studies suggest that tighter financing constraints are associated with weaker ESG performance, whereas greater access to financial resources supports firms’ sustainability investment [
53,
54,
55]. In this study, the external financing conditions considered refer to firms’ overall ability to access external financial resources rather than to any particular source of green finance. The relevant theoretical question is therefore whether access to external financing supports firms’ transition capacity, rather than whether the financing originates from green credit, conventional bank lending, bonds, or other specific sources.
Overall, the NEDC policy may improve firms’ external financing conditions by reducing policy uncertainty, lowering transition-related costs and risks, and providing resource support. More favorable financing conditions may, in turn, enable firms to sustain longer-term sustainability investments and improve ESG performance. We therefore propose:
Hypothesis 3.
Improved external financing conditions are a potential channel through which the NEDC Pilot Policy is associated with improved corporate ESG performance.
2.2.4. The Moderating Role of Analyst Coverage
Analyst coverage represents the external information and monitoring condition in the theoretical framework and may shape the strength of the NEDC–ESG relationship. Analysts can facilitate policy transmission by improving the information available to capital-market participants. As important information intermediaries, analysts collect, process, and interpret firm- and policy-related information, helping investors assess firms’ responses to changing energy-transition priorities [
56,
57]. Greater analyst coverage may reduce information asymmetry and make firms’ green investments and sustainability-related activities more visible to the market. When investors are better able to evaluate the long-term value and risks of these activities, firms may have stronger incentives to undertake substantive sustainability investments in response to NEDC-related policy signals.
Analyst coverage may also strengthen external monitoring. Greater analyst scrutiny increases the visibility of corporate decisions and disclosures and makes inconsistencies between firms’ stated sustainability commitments and actual practices more likely to be detected [
58]. This scrutiny may raise the reputational costs of symbolic compliance or selective disclosure and strengthen managerial incentives to respond substantively to policy pressures and opportunities [
59]. Firms receiving greater analyst coverage may therefore be more likely to translate the incentives and support associated with the NEDC program into sustainability-related actions.
Through its information-intermediation and external-monitoring functions, analyst coverage may strengthen firms’ responsiveness to NEDC-related policy signals and thereby amplify the positive NEDC–ESG relationship. We therefore propose:
Hypothesis 4.
The positive relationship between the NEDC Pilot Policy and corporate ESG performance is stronger among firms with greater analyst coverage.
5. Potential Channels and Moderation Analysis
5.1. Evidence on Potential Channels
Building on the theoretical framework, we examine green technological innovation and external financing conditions as two potential channels that may link the NEDC policy to ESG performance in this subsection. We first assess whether the NEDC Pilot Policy is associated with changes in the proposed channel variables and then examine their relationship with corporate ESG performance after controlling for NEDC, firm characteristics, and firm and year fixed effects. The results are reported in
Table 9.
Columns (1) and (3) of
Table 9 examine the green technological innovation channel by using green patent applications (
GTI1) and green patents granted (
GTI2), respectively, as the dependent variables. The estimated coefficients on NEDC are 0.0995 and 0.1020, and both are positive and statistically significant at the 1% level. These estimates indicate that treated firms experienced larger post-policy implementation increases in both green patent applications and granted green patents relative to control firms.
Columns (2) and (4) further examine the relationship between green technological innovation and corporate ESG performance. The estimated coefficients on GTI1 and GTI2 are 0.0539 and 0.0495, respectively, and both are positive and statistically significant at the 1% level. Thus, after controlling for NEDC, firm characteristics, and firm and year fixed effects, higher levels of green technological innovation are associated with better ESG performance. These results provide evidence consistent with Hypothesis 2, suggesting that green technological innovation may serve as a potential channel underlying the NEDC–ESG relationship.
We next examine the external financing conditions channel. Because FC is an inverse proxy for external financing conditions, a higher value indicates more severe financing constraints and less favorable financing conditions. In Column (5), the estimated coefficient on NEDC is −0.0117 and is statistically significant at the 5% level, indicating that treated firms experienced a relative reduction in financing constraints following formal pilot designation. In Column (6), the estimated coefficient on FC is −0.9260 and is statistically significant at the 1% level, indicating that more severe financing constraints are associated with weaker ESG performance, or equivalently, that more favorable external financing conditions are associated with better ESG performance. These findings provide evidence consistent with Hypothesis 3 that external financing conditions are a potential resource-related channel associated with the NEDC–ESG relationship.
To further quantify the coefficient products associated with these channels, we construct bootstrap 95% confidence intervals. The product-of-coefficients estimates for green patent applications and green patents granted are 0.0054 and 0.0050, with bootstrap 95% confidence intervals of [0.003, 0.008] and [0.003, 0.007], respectively. The corresponding estimate for the financing-constraint channel is 0.0108, with a 95% confidence interval of [0.007, 0.015]. All three confidence intervals exclude zero, indicating that the corresponding coefficient products are statistically significant. These results provide further evidence that the empirical relationships involving green technological innovation and financing conditions are consistent with the channels proposed in the theoretical framework.
Moreover, we assess whether the channel results are robust to alternative timing and measurement choices.
Table 10 reports the results. In Columns (1)–(3), we lag the channel variables by one year. The coefficients on
GTI1 and
GTI2 are 0.0446 and 0.0422, respectively, while the coefficient on
FC is −0.6125; all three are statistically significant at the 1% level. These findings are consistent with the baseline channel results and suggest that the associations between the proposed channels and ESG performance persist when the channel variables are measured one year earlier.
We also address potential concerns arising from the construction of the SA index, which is based on firm size and age. Specifically, we re-estimate the financing-constraint regressions after excluding Size and Age from the control set. The coefficient on NEDC in the FC regression is −0.0104, while the coefficient on FC in the ESG regression is −0.8802; both remain statistically significant at the 5% level. These results suggest that the financing-channel evidence is robust to excluding the variables used to construct the SA index. Overall, the NEDC Pilot Policy is associated with greater green technological innovation and lower financing constraints, both of which are, in turn, associated with better ESG performance. The results remain consistent across bootstrap coefficient-product estimates, lagged channel variables, and alternative specifications of the financing-constraint measure. Thus, the evidence supports green technological innovation and external financing conditions as two potential channels underlying the positive NEDC–ESG relationship.
5.2. The Moderating Role of Analyst Coverage
In this subsection, we examine whether the positive relationship between the NEDC Pilot Policy and corporate ESG performance varies with the level of analyst coverage. We estimate Equation (5) using two proxies for analyst coverage: the number of financial analysts following the firm
(Analyst) and the number of analyst research reports issued during the year (
Report). Each measure is interacted with NEDC, and the results are reported in
Table 11.
Column (1) measures analyst coverage by the number of analysts following the firm. The estimated coefficient on NEDC × Analyst is 0.0062 and is positive and statistically significant at the 1% level, indicating that the positive NEDC–ESG relationship is stronger at higher levels of analyst coverage. This pattern is consistent with the proposed role of analyst coverage as an external information and monitoring condition.
Column (2) uses the number of analyst research reports as an alternative measure of analyst coverage. The estimated coefficient on NEDC × Report is 0.0020 and is also positive and statistically significant at the 1% level, indicating a stronger positive NEDC–ESG relationship among firms receiving greater analyst research coverage. The consistent signs and statistical significance across the two proxies provide evidence of a positive moderating pattern associated with analyst coverage.
We further reconstruct the interaction terms using one-period-lagged analyst coverage to examine whether the moderating pattern remains evident when the information environment is measured prior to current ESG performance. Columns (3) and (4) show that the estimated coefficients on NEDC × L_Analyst and NEDC × L_Report are 0.0035 and 0.0010, respectively. Both coefficients remain positive and are statistically significant at the 10% level. Although the statistical significance is weaker than in the contemporaneous specifications, the direction of the interaction effects remains unchanged, indicating that the positive moderating relationship persists when analyst coverage is measured one year earlier.
Overall, the interaction estimates indicate that the positive relationship between the NEDC Pilot Policy and corporate ESG performance is stronger among firms with greater analyst coverage. These findings are consistent with the proposed role of analyst coverage as an external information and monitoring condition and provide evidence consistent with Hypothesis 4.
6. Additional Analyses
6.1. Effects Across ESG Dimensions
The aggregate ESG score may conceal differences in the estimated policy relationship across the environmental, social, and governance dimensions. To examine which dimensions of ESG performance are associated with the NEDC Pilot Policy, we re-estimate the baseline specification using the environmental (E), social (S), and governance (G) scores from the Huazheng ESG Ratings as separate dependent variables. The results are reported in
Table 12. This analysis represents a decomposition of the ESG outcome rather than a subgroup heterogeneity analysis: all three specifications use the same firm-year sample, controls, and fixed effects, with only the dependent variable changing across models.
Specifically, the estimated coefficient on NEDC is 0.0857 for the environmental dimension (Column (1)) and 0.1116 for the governance dimension (Column (3)), both positive and statistically significant at the 1% level. By contrast, the coefficient for the social dimension is −0.0159 and is not statistically significant. These results suggest that the positive NEDC–ESG relationship is more evident in the environmental and governance dimensions, whereas the evidence for the social dimension is limited.
This pattern is closely aligned with the institutional content of the NEDC Pilot Policy. First, the NEDC program directly targets energy substitution, energy conservation, emissions reduction, green technology application, and related investment. These policy objectives are closely connected to firms’ energy use, pollution control, and green investment, providing a straightforward explanation for the positive environmental estimate. Second, implementation of the NEDC program involves planning, project coordination, information monitoring, performance assessment, and longer-term implementation responsibilities. These requirements may increase the organizational importance of information management, project oversight, risk control, and strategic coordination. Such organizational adjustments provide a plausible explanation for the positive governance estimate, although the present analysis does not separately identify these specific governance mechanisms. In contrast, social outcomes such as employee welfare, workplace practices, and community engagement are less directly connected to an energy-transition policy and depend more heavily on firms’ broader organizational and stakeholder decisions.
Overall, the dimension-level results show that the effects of the NEDC Pilot Policy are not uniform across the components of corporate sustainability performance. The positive estimates are concentrated in environmental and governance outcomes, a pattern consistent with the policy’s dual emphasis on green transition and organizational implementation. These findings provide a more precise interpretation of the aggregate ESG effect.
6.2. Heterogeneous Effects of the NEDC Pilot Policy
The estimated relationship between the NEDC Pilot Policy and corporate ESG performance may vary across firms and local contexts because firms differ in their ability to respond to policy incentives and resource support, while implementation environments also vary across regions. We therefore examine heterogeneity along four dimensions: corporate ownership, industry technology intensity, geographic region, and pre-designation local environmental regulation intensity. All subgroup regressions retain the same controls and fixed effects used in the baseline specification. Differences in the estimated NEDC coefficients across subgroups are formally evaluated using coefficient-equality tests.
6.2.1. Heterogeneity by Firm Ownership
To examine whether the effect of the NEDC Pilot Policy varies with corporate ownership, we divide the sample into state-owned enterprises (SOEs) and non-state-owned enterprises (non-SOEs) and re-estimate the baseline specification for each subsample. Columns (1) and (2) of
Table 13 report the corresponding results. For SOEs, the estimated coefficient on NEDC is 0.0694 but is not statistically significant at conventional levels. For non-SOEs, the coefficient is 0.0894 and is positive and statistically significant at the 5% level. We further conduct a coefficient-equality test using 500 bootstrap replications. The resulting
p-value is 0.075, indicating a statistically significant difference between the two groups and showing that the positive effect of the NEDC Pilot Policy on corporate ESG performance is significantly stronger among non-SOEs.
This difference may reflect variation in firms’ pre-existing policy responsibilities, organizational responsiveness, and resource conditions. SOEs generally operate under more sustained government oversight and policy obligations and may have incorporated environmental responsibilities and long-term development objectives into their business decisions earlier or more extensively before the implementation of the NEDC Pilot Policy. The scope for additional policy-induced improvement may therefore be relatively limited. At the same time, the more hierarchical governance structures and relatively complex internal approval and coordination processes of SOEs may lengthen the process through which external policy signals are translated into investment decisions, operational adjustments, and observable ESG outcomes, causing policy effects to materialize more gradually. In addition, SOEs typically enjoy more stable access to financing and policy resources, which may reduce the marginal improvement in financing conditions and resource availability generated by the NEDC Pilot Policy. By contrast, non-SOEs generally face tighter financing constraints and stronger market pressures and are therefore more responsive to policy support, project opportunities, and external market signals. They may consequently have stronger incentives to translate additional policy resources into green investment, operational adjustment, and ESG improvements. This interpretation is consistent with the evidence on the external financing conditions channel reported in
Section 5.1.
Overall, corporate ownership significantly conditions the strength of the NEDC policy effect, with non-SOEs exhibiting a stronger improvement in ESG performance. The results indicate that the incremental gains from the policy are particularly pronounced among firms with relatively limited pre-existing access to policy resources, stronger market constraints, and greater sensitivity to additional policy support.
6.2.2. Heterogeneity by Industry Technology Intensity
Following Zhao et al. [
57], we classify firms into high-tech and non-high-tech industries based on industry classification codes. Columns (3) and (4) of
Table 13 show that the estimated coefficient on NEDC is 0.1577 for firms in high-tech industries and is positive and statistically significant at the 1% level, whereas the corresponding coefficient for firms in non-high-tech industries is 0.0431 and is not statistically significant. The bootstrap coefficient-equality test yields a
p-value of 0.004, confirming that the policy effect is significantly stronger among firms in high-tech industries.
This pattern highlights the importance of firms’ technological capabilities in converting policy support into corporate outcomes. Firms in high-tech industries generally possess stronger R&D capabilities, greater absorptive capacity, and more extensive innovation resources, enabling them to translate technological support, market opportunities, and resource advantages associated with the NEDC Pilot Policy into green innovation and stronger ESG performance. The finding is consistent with the green technological innovation channel discussed in
Section 5.1 and suggests that pre-existing innovative capacity amplifies the firm-level benefits of new energy policy.
These results suggest that the positive NEDC–ESG relationship is more pronounced among firms with stronger technological capabilities, consistent with the view that existing innovation capacity may facilitate firms’ responses to the policy.
6.2.3. Heterogeneity Across Regions
We next divide the sample into firms located in western, eastern, and central China. As reported in Columns (1) through (3) of
Table 14, the estimated coefficient on NEDC is 0.0088 for the western region and is not statistically significant. The corresponding coefficients are 0.0875 for the eastern region and 0.1659 for the central region, both positive and statistically significant at the 5% level. Further pairwise bootstrap coefficient-equality tests yield
p-values of 0.026 for western versus eastern China, 0.080 for eastern versus central China, and 0.016 for central versus western China, indicating statistically significant coefficient differences across all three regional comparisons at the 10% level or better. Overall, the estimates suggest some regional variation in the NEDC–ESG relationship, with a larger estimated effect in central China, followed by eastern and western China.
One possible explanation for this regional variation lies in differences in market development, industrial structure, and supporting resources. In eastern China, more developed market institutions, financial systems, and information infrastructure may facilitate firms’ responses to the policy. In central China, greater pressures for industrial upgrading, energy restructuring, and green transition, combined with sufficient supporting capacity, may create greater scope for policy-induced improvements in ESG performance. In contrast, relatively limited industrial and institutional resources in western China may constrain firms’ ability to respond to the policy.
These findings suggest that the NEDC–ESG relationship may depend not only on the level of regional economic development but also on the interaction between local supporting capacity and green-transition needs. This may help explain why the estimated effect is particularly pronounced in central China.
6.2.4. Heterogeneity by Local Environmental Regulation Intensity
Finally, we examine whether the local policy environment conditions the effectiveness of the NEDC Pilot Policy. Local governments play a central role in coordinating implementation, enforcing policy requirements, and allocating supporting resources. Existing environmental governance conditions may therefore influence how firms respond to national policy initiatives. We measure local environmental regulation intensity using the frequency of environment-related terms in local government work reports and classify observations into high- and low-regulation groups according to the median value of the index in 2013, one year before the implementation of the NEDC Pilot Policy.
Columns (4) and (5) of
Table 14 show that the estimated coefficient on NEDC is 0.1260 for the high-environmental-regulation group and is positive and statistically significant at the 1% level. For the low-environmental-regulation group, the coefficient is 0.0666 and is not statistically significant. The bootstrap coefficient-equality test yields a
p-value of 0.060, indicating a statistically significant difference between the two groups at the 10% level. The policy therefore generates a stronger ESG response in regions with more intensive pre-policy environmental regulation.
This result suggests that the local institutional environment may shape the effectiveness of the NEDC Pilot Policy. The larger estimate for the high-regulation group is consistent with potential complementarity between pre-existing environmental policy attention and the NEDC program, as greater emphasis on environmental issues may facilitate policy coordination, monitoring, and alignment with energy-transition objectives. Overall, the evidence suggests that local institutional conditions may contribute to heterogeneity in the NEDC–ESG relationship.
Overall, the heterogeneity results suggest that the NEDC–ESG relationship varies across firm and regional characteristics. The estimated effect is more pronounced among non-SOEs, firms in high-tech industries, firms located in eastern and central China, and firms in regions with stronger pre-existing environmental regulation. These patterns are consistent with the view that firms’ technological capabilities, resource availability, and the local institutional environment may influence their responses to the NEDC Pilot Policy. In particular, stronger pre-existing environmental governance may provide a more supportive environment for policy implementation and firm-level adjustment. The findings thus highlight the importance of considering both firm characteristics and local institutional conditions when evaluating the effectiveness of the NEDC Pilot Policy.
6.3. Spatial Spillover Effects and Geographic Reach
Although the NEDC Pilot Policy is implemented in designated cities, its influence may extend beyond the administrative boundaries of pilot areas. Changes in renewable-energy infrastructure, green technology adoption, financial support, and environmental governance within pilot cities may affect firms in surrounding areas through technology and information diffusion, supply-chain linkages, market competition, and policy demonstration. Previous research also suggests that the NEDC Pilot Policy may generate cross-regional spatial spillover effects [
13]. We therefore further examine whether the policy affects neighboring non-pilot firms and whether such effects vary with geographic distance.
Building on the baseline specification, we introduce a set of spatial neighborhood variables as follows:
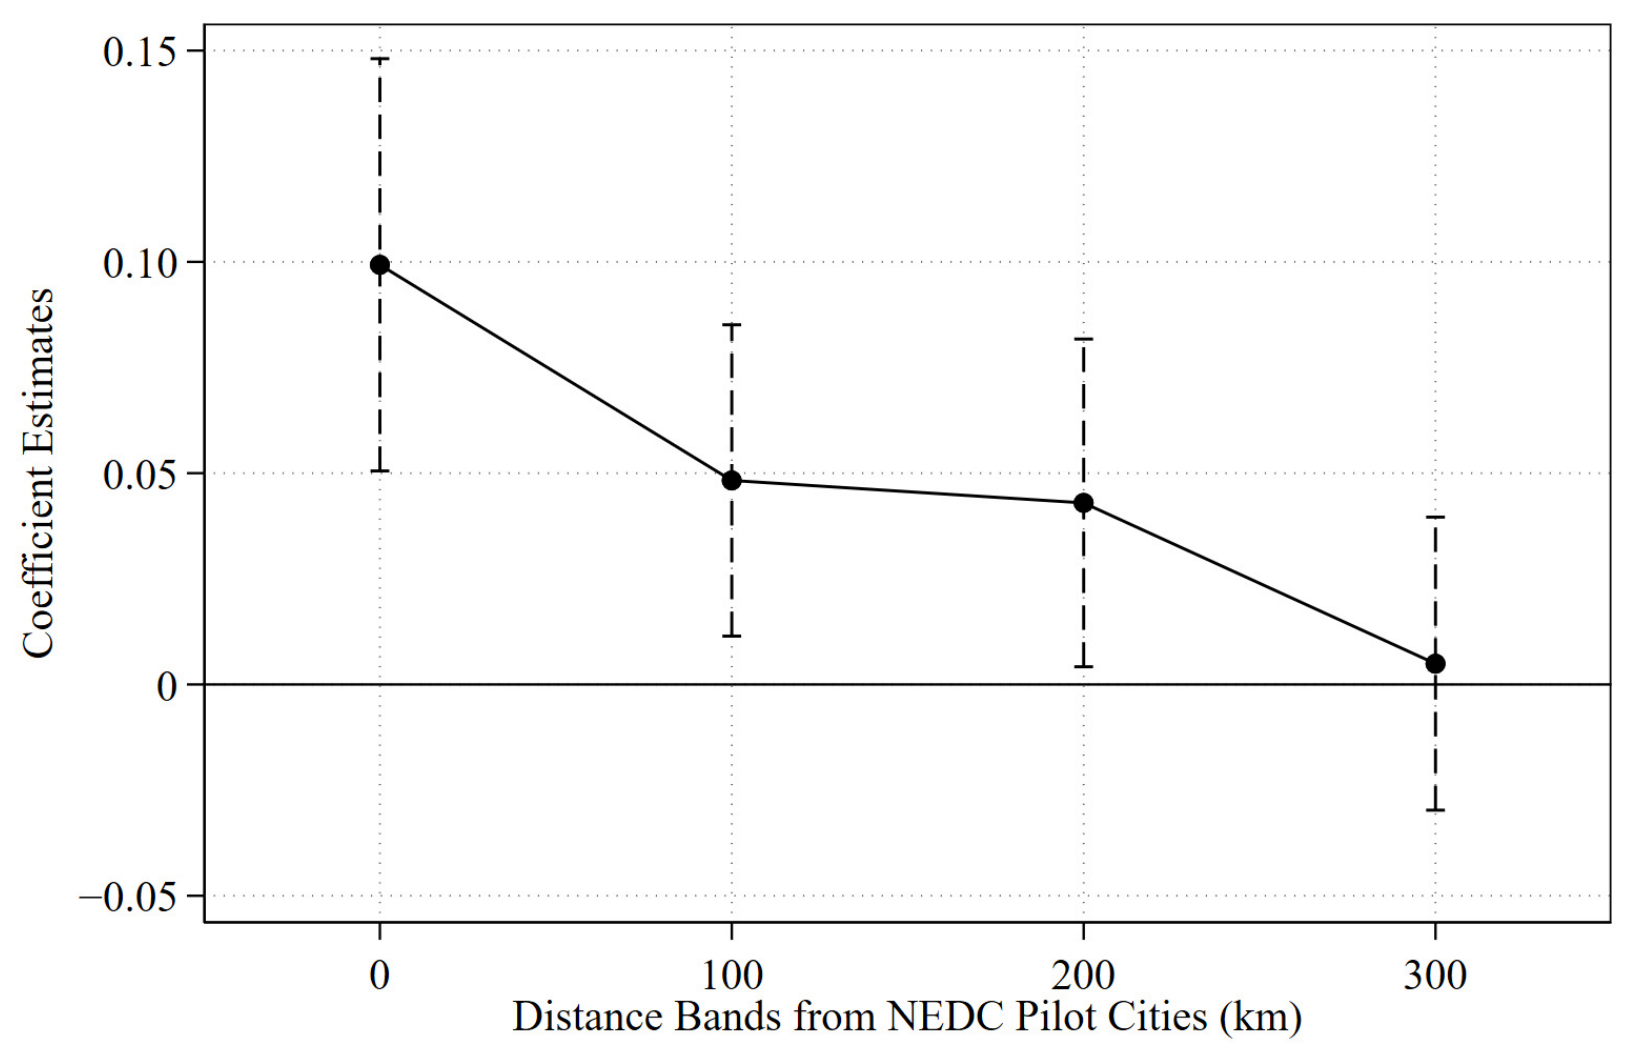
We identify firms’ geographic locations using the latitude and longitude of their registered addresses and calculate the great-circle distance between firms and NEDC pilot cities. Here, denotes geographic distance in kilometers, and indicates whether an NEDC pilot city is located within the corresponding distance range around firm in year . Specifically, equals one if an NEDC pilot city is located within the km range around firm , and zero otherwise. For example, indicates whether an NEDC pilot city is located within 0–100 km of firm in year . Thus, the coefficient captures the spatial spillover effect of the NEDC Pilot Policy on the ESG performance of firms located within the corresponding distance range. The remaining variables are defined as in the baseline specification. We focus on the policy effects within 300 km and report estimates for three distance bands at 100 km intervals: 0–100 km, 100–200 km, and 200–300 km. By comparing the magnitude and statistical significance of across these distance bands, we further characterize the geographic reach of the spatial effects of the NEDC Pilot Policy and how they vary with distance.
Figure 7 reports the estimated spatial spillover effects. The coefficients for the 0–100 km and 100–200 km distance bands are positive and statistically significant, indicating that the influence of the NEDC Pilot Policy is not confined to firms within pilot cities but also generates positive spatial spillovers to geographically proximate firms. In contrast, the coefficient for the 200–300 km band is no longer statistically significant. Overall, the results suggest evidence of localized spatial spillovers, with the estimated positive association more pronounced in areas closer to pilot cities and diminishing as geographic distance increases.
One possible explanation for this pattern is the geographic diffusion of technology, information, and policy practices through industrial linkages and demonstration effects. Firms located closer to pilot cities may have stronger information exchanges, supply-chain connections, and factor flows, facilitating the diffusion of green technologies, managerial practices, and policy information. Competitive and demonstration effects may also encourage nearby firms to adjust their environmental and sustainability practices. As distance increases, these interactions are likely to weaken, which may help explain the observed decline in the estimated spillover effect.
The spatial analysis also has implications for the interpretation of the baseline DID estimates. To the extent that firms in nearby non-pilot areas are indirectly exposed to the policy, the treatment–control contrast may be attenuated, potentially leading to a more conservative estimate of the policy effect. Importantly, the spatial results remain consistent with the main finding of a positive association between the NEDC Pilot Policy and corporate ESG performance.
7. Conclusions and Discussion
7.1. Conclusions
Using panel data on Chinese A-share listed firms from 2009 to 2023, this study examines the relationship between the NEDC Pilot Policy and corporate ESG performance within a difference-in-differences framework. The results show that firms registered in pilot cities experienced greater improvements in ESG performance following formal pilot designation than firms in non-pilot cities. This finding remains robust across a range of identification and sensitivity tests.
The channel analyses provide evidence consistent with green technological innovation and external financing conditions as two potential channels associated with the NEDC–ESG relationship. The moderation analysis further shows that the positive estimated relationship between the policy and ESG performance is stronger among firms receiving greater analyst coverage.
Additional analyses show that the positive NEDC–ESG relationship is evident in the environmental and governance dimensions, but not in the social dimension. The estimated relationship is also more pronounced among non-state-owned enterprises and firms in high-tech industries, as well as among firms located in eastern and central China and in regions with stronger pre-policy environmental regulation. Finally, the distance-band analysis provides evidence consistent with localized spatial spillovers to nearby non-pilot firms.
Overall, the findings suggest that the NEDC Pilot Policy is associated with improved corporate ESG performance, with the strength of this relationship varying across firms and regional contexts. The study provides new evidence on the firm-level sustainability implications of city-level energy-transition policies and highlights the importance of firm characteristics and local institutional conditions in shaping policy outcomes.
7.2. Discussion and International Relevance
The findings extend the literature on place-based green-transition policies and corporate sustainability. Previous studies show that low-carbon city initiatives and digital infrastructure programs can affect corporate ESG performance [
72,
73], while research on new-energy policies and the NEDC program has largely focused on specific firm-level outcomes, such as green technological innovation, energy consumption intensity, and green mergers and acquisitions [
20,
21,
22]. This study complements this literature by examining the NEDC–ESG relationship in a broader multi-industry setting and by documenting variation across ESG dimensions, firm characteristics, regional conditions, and geographic proximity to pilot cities. The positive relationship is evident in the environmental and governance dimensions but not in the social dimension, while the estimated relationship also varies across ownership structures, industry technology intensity, and regional institutional environments. The spatial analysis further provides evidence consistent with localized spillovers to nearby non-pilot firms. Taken together, these findings suggest that the corporate sustainability consequences of place-based energy-transition policies cannot be fully characterized by an average ESG estimate, but may depend on both firm characteristics and the institutional and geographic environments in which such policies operate.
The results also provide a possible interpretation of the mixed evidence on energy-transition policies and corporate ESG performance. Tu et al. [
10] find that energy-transition policies may weaken corporate ESG performance by increasing adjustment costs, bankruptcy risk, and financing pressures, whereas Zheng et al. [
31] document a positive effect of the NEDC program among energy-intensive firms. Our findings are more consistent with the latter, but the divergent results need not be viewed as contradictory. The theoretical framework developed in this study suggests that energy-transition policies may simultaneously impose transition costs and provide policy support. Compliance requirements, technological replacement, and additional capital needs can increase firms’ adjustment costs, whereas more stable policy expectations, technological and infrastructural support, and favorable financing and resource conditions may facilitate green transformation. The resulting ESG response may therefore depend on the relative strength of these forces and firms’ capacity to respond to the policy. The evidence on green technological innovation, external financing conditions, and heterogeneous policy responses is broadly consistent with this interpretation.
From an international perspective, the relevance of the Chinese experience lies less in the specific NEDC model or the magnitude of the estimated relationship than in the conditions under which place-based energy-transition policies may influence corporate sustainability. The NEDC program combines regulatory and administrative coordination with incentive and resource-support instruments in an institutional setting characterized by relatively strong local planning and implementation capacity. Our findings suggest that the effectiveness of such policies may depend on the alignment between policy instruments, firms’ technological capabilities and access to external financial resources, and local institutional conditions. The moderating evidence on analyst coverage further points to a potential role for the external information and monitoring environment in shaping firms’ responsiveness to policy signals. These conditions may differ substantially across countries, particularly where local implementation capacity, access to external financial resources, or firm-level technological capabilities are more limited. Accordingly, similar policy arrangements need not generate comparable firm-level sustainability outcomes across institutional settings. The spatial results add another dimension to this international relevance. Evidence consistent with localized spillovers suggests that the influence of place-based energy-transition policies may extend beyond formal administrative boundaries through cross-city economic and industrial linkages. This possibility may be particularly relevant for emerging economies characterized by urban agglomerations and geographically concentrated industrial networks, where policies implemented in one jurisdiction may also affect firms in neighboring areas. Cross-jurisdictional coordination may therefore warrant attention in the design of place-based energy-transition policies. More broadly, the international relevance of the NEDC experience lies not in replicating a particular policy model, but in recognizing the importance of aligning policy design with firm-level transition capacity, local institutional conditions, and cross-regional economic linkages.
7.3. Policy Implications
The findings offer several policy implications. At the policy-design level, place-based energy-transition policies may benefit from stable policy objectives, coordinated policy instruments, and implementation strategies that account for local conditions. The heterogeneity results suggest that firms’ responses vary with technological capabilities and regional institutional environments, highlighting the potential importance of complementary technical, institutional, and infrastructural support where such conditions are less developed. The evidence consistent with localized spatial spillovers also suggests that coordination across neighboring jurisdictions, particularly in infrastructure development and policy implementation, may warrant greater attention in the design of place-based energy-transition policies.
From the perspective of firm-level adjustment, the channel evidence is consistent with the potential importance of green technological innovation and external financing conditions in supporting firms’ sustainability responses. Policies that facilitate green innovation, including R&D support, technical assistance, and project-based incentives, may help firms undertake the technological investments required for the green transition. At the same time, reducing financing barriers to long-term sustainability investment may strengthen firms’ capacity to respond to energy-transition policies. Because our measure captures firms’ overall financing constraints rather than access to green credit specifically, these implications apply more broadly to external financing conditions and should not be interpreted as supporting any particular form of green finance.
The external information environment also warrants attention. The stronger NEDC–ESG relationship among firms with greater analyst coverage suggests that information intermediaries may play a role in shaping firms’ responsiveness to energy-transition policies. Measures that improve the reliability, comparability, and transparency of corporate sustainability information may help analysts, investors, and other market participants evaluate firms’ sustainability responses more effectively. A more transparent information environment may therefore facilitate the transmission of policy signals to firm-level sustainability responses.
7.4. Limitations and Future Research
This study has several limitations that also provide directions for future research. A primary limitation concerns policy assignment and causal identification. NEDC pilot cities were not randomly selected but emerged through local applications, provincial review, and national evaluation. Although the empirical analysis accounts for observable firm- and city-level characteristics and employs matching, reweighting, alternative fixed effects, trend controls, and sensitivity analyses, these approaches cannot fully rule out unobserved time-varying factors that may be correlated with both pilot selection and corporate ESG performance. The interpretation of the estimates therefore remains conditional on the identifying assumptions underlying the difference-in-differences design. Future research could use detailed application records, pilot evaluation scores, and measures of local implementation intensity to examine the policy assignment process and variation in policy implementation more directly.
A related limitation concerns the measurement of ESG performance and policy exposure. The Huazheng ESG ratings provide broad coverage of Chinese listed firms but necessarily reflect provider-specific methodologies and indicator weights. Although the results are robust to alternative ESG measures, future studies could combine multiple rating systems with corporate disclosures, emissions data, and other objective measures of environmental performance. In our empirical design, treatment status is defined according to whether a firm’s registered city was included in the NEDC program, which serves to characterize the firm’s policy exposure. Future research could further incorporate information on firms’ production facilities, subsidiaries, cross-regional operations, and supply-chain relationships to construct more granular measures of policy exposure.
The channel and moderation analyses are also subject to identification limitations. The results are consistent with green technological innovation and external financing conditions as potential channels associated with the NEDC–ESG relationship, but they should not be interpreted as establishing causal mediation. In addition, the SA-based measure captures firms’ overall financing constraints rather than access to green credit specifically. Future research using bank–firm lending relationships, green credit disclosures, and detailed information on financing costs and maturities could more directly distinguish general external financing conditions from access to green financing. Similarly, more granular information on analysts and other information intermediaries could help clarify how external information and monitoring conditions shape firms’ responsiveness to energy-transition policy signals.
Finally, the external validity and spatial interpretation of the findings warrant further consideration. The analysis focuses on Chinese A-share listed firms operating within the institutional setting of the NEDC program, and the findings may not generalize directly to non-listed firms, other countries, or other forms of energy-transition policy. Moreover, while the distance-band analysis provides evidence consistent with localized spatial spillovers, it does not identify the specific transmission mechanisms involved. Future research combining geographic information with interfirm networks, supply-chain relationships, and cross-city policy linkages could help distinguish among potential pathways such as technology diffusion, industrial linkages, market competition, and policy demonstration.