Article

Country ESG Sustainability Index as a Management and Regulatory Feedback Tool

by
Venera Zarubina
1,
Mikhail Zarubin
2,*,
Zhauhar Yessenkulova
3,
Zhanar Dyussembekova
4,
Olga Valentinovna Andreeva
5 and
Artur Zarubin
6
1
Department of Social and Economic Disciplines, Kostanay Engineering and Economic University Named After M. Dulatov, Kostanay 110000, Kazakhstan
2
Department of Information Technology and Automation, Kostanay Engineering and Economics University named After M. Dulatov, Kostanay 111000, Kazakhstan
3
School of Arts and Social Sciences, Narxoz University, Almaty 050035, Kazakhstan
4
School of Economics and Management, Narxoz University, Almaty 050035, Kazakhstan
5
Faculty of Accounting and Economics, Center for Strategic Research of Socio-Economic Development of Southern Russia, Rostov State University of Economics, 344002 Rostov-on-Don, Russia
6
Faculty of Law, National Research University “Higher School of Economics”, 101000 Moscow, Russia
*
Author to whom correspondence should be addressed.
Sustainability 2026, 18(14), 7145; https://doi.org/10.3390/su18147145 (registering DOI)
Submission received: 1 June 2026 / Revised: 5 July 2026 / Accepted: 8 July 2026 / Published: 13 July 2026
(This article belongs to the Special Issue Public Policy and Economic Analysis in Sustainability Transitions)

Abstract

Contemporary ESG (Environmental, Social, and Governance) regulation creates costs and risks for businesses, which are associated with the stringency of requirements. This article demonstrates that the key source of these problems is the fragmentation of legal regulation, the inconsistency of reporting standards, and the methodological heterogeneity of ESG indices. Based on a comparative legal analysis of eight jurisdictions (the US, EU, China, India, Brazil, Russia, South Africa, and Kazakhstan), three models of ESG regulation are identified: prescriptive, market-oriented, and state-centralized. It is shown that extraterritorial pressure (CBAM, CSDDD) and internal regulatory conflicts (e.g., in the US) are associated with increased compliance costs, especially for emerging economies. An empirical analysis revealed significant divergence in the assessments and dynamics of ESG ratings from various agencies. The results obtained are consistent with the findings of other researchers who document discrepancies in ESG assessments reaching approximately 50–60%. This makes global indices of limited applicability for regulatory purposes. In response to the identified issues, a country-specific ESG index integrated into a closed-loop feedback management system was proposed. A two-stage methodology was developed: calculating a company index (taking into account regulatory burden, extraterritorial pressure, and adaptability) and aggregating it into a country index based on macrostatistics, with the ability to transition to big data aggregation. The results can be used by national regulators to improve the comparability of ESG data and differentiate government support measures.

1. Introduction

In recent years, ESG (Environmental, Social, and Governance) regulation has become a key factor determining the strategic development of businesses. Growing requirements for non-financial disclosure, a tightening climate agenda, and pressure from investors and financial markets are all creating a new reality for corporations. However, as practice shows, the implementation of ESG principles is associated not only with the expected benefits (reduced cost of capital, improved risk management, and enhanced reputation), but also with significant costs. These costs are particularly exacerbated in the context of global regulatory fragmentation, when companies are forced to simultaneously comply with incompatible requirements from various jurisdictions, adapt reporting to multiple standards, and interpret conflicting signals from ESG ratings.
The problem with this study is that modern national ESG regulation itself is becoming a source of regulatory and compliance risks for businesses. Inconsistent legal regimes, a multitude of reporting standards, and the methodological heterogeneity of ESG indices create conditions of increased regulatory uncertainty for companies. At the national level, this problem manifests itself in an imbalance in existing entrepreneurship support programs (for example, an analysis of Kazakhstan’s “Business Roadmap 2025” revealed that it completely lacks environmental indicators), which discourages businesses from taking ESG factors into account and creates additional barriers to entry into markets with stringent requirements [1].

1.1. Research Status and Identification of Gaps

The theoretical basis for analyzing ESG regulation is institutional economic theory [2] and the concept of transaction costs [3,4]. These studies demonstrate that the inconsistency of formal institutions across jurisdictions generates costs for information search, adaptation, and monitoring. In the ESG context, empirical studies confirm that companies operating in global markets face exponentially increasing compliance costs due to regulatory fragmentation [5,6]. However, most of these studies focus on large public corporations in developed countries, overlooking the specifics of developing economies, where national systems have not yet been established and extraterritorial mechanisms (CBAM, CSDDD) are already exerting pressure.
A separate line of research is devoted to the methodological heterogeneity of ESG ratings. Studies [7,8] have shown that the correlation between MSCI, Sustainalytics, and S&P Global ratings does not exceed 0.6, while discrepancies for individual companies reach 50–60%. The reasons lie in differences in indicator sets, weights, materiality interpretations, and data sources. The study in [9] has expanded this picture by demonstrating that rating divergence can complicate the interpretation of investment signals and be considered a source of additional informational noise in financial markets. However, these studies are focused on investors, not regulators, and do not offer tools for reducing uncertainty at the public policy level.
A systems perspective on ESG regulation is offered by studies in the fields of system dynamics and control theory [10,11,12]. They emphasize the nonlinearity of business responses, the multiplicity of feedback loops, and high sensitivity to external disturbances. However, these studies remain at the conceptual level and do not offer operationalizable feedback mechanisms suitable for everyday use by regulators.
The impact of extraterritorial pressure on national economies is examined in [13] in the context of carbon leakage and competitiveness. It is shown that strict climate policies can lead to the relocation of production to jurisdictions with more lenient regimes, but methodologies are still lacking that allow exporting countries to quantitatively assess the degree of harmonization of their regulations with the requirements of their main trading partners.
Thus, three key gaps can be identified in the existing literature:
  • The absence of an integrated analytical framework that would link legal fragmentation, methodological heterogeneity of indices, and business behavioral responses in a single model;
  • The absence of an index tool designed specifically for government regulation purposes that would take into account not only progress in sustainability but also the risks of overregulation and would also be applicable to small- and medium-sized enterprises (SMEs);
  • A lack of methods for aggregating ESG data adapted to developing economies that would allow for the asymmetry in the coverage of companies by ratings and extraterritorial pressure from several trading partners to be taken into account.
Taken together, the identified gaps indicate that the current ESG literature does not yet offer a unified analytical framework capable of simultaneously explaining the relationship between regulatory fragmentation, methodological heterogeneity in ESG assessments, and business adaptive behavior. As a result, government agencies have a limited set of tools for assessing the adverse effects of ESG policies and timely adjusting regulatory decisions. This study aims to overcome this limitation by combining comparative legal analysis, an institutional approach, and principles of control theory within a single conceptual model, as well as by developing a national ESG index focused on the objectives of government regulation.

1.2. Objective, Tasks, and Scientific Novelty

The purpose of this study is to identify the key challenges that modern ESG regulation creates for business, analyze the legal and institutional factors that give rise to them, and assess the potential of ESG indices as feedback mechanisms capable of reducing the resulting regulatory uncertainty.
To achieve this goal, the following objectives are addressed in this paper:
  • Conduct a comparative legal analysis of ESG legislation in eight jurisdictions (USA, EU, China, India, Brazil, Russia, South Africa, and Kazakhstan) and identify regulatory models;
  • Assess the impact of legal mechanisms (binding, materiality, sanctions, and extraterritoriality) on business compliance costs;
  • Study the methodological discrepancies between leading ESG ratings and their implications for investment and management decisions;
  • Develop a conceptual framework for constructing a country-specific ESG index integrated into a closed-loop feedback control system;
  • Propose a two-tier algorithm for calculating the index (at the company and macro-levels) with the ability to use big data.
The scientific novelty lies in the following:
  • This study develops an integrated analytical framework that combines legal, institutional, and systemic-management perspectives on ESG regulation. This approach expands on existing research by examining regulatory fragmentation not simply as a contextual feature of the ESG environment, but as an independent source of business risks and compliance costs that cannot be reduced solely to regulatory stringency.
  • Building on the findings of [7,8], which document the problem of ESG rating divergence, this study goes beyond diagnostics and proposes a practical regulatory tool–a national ESG index with a transparent methodology. Unlike traditional ESG ratings, which are designed primarily for investment selection, the proposed index is intended for public administration purposes and includes measures of regulatory burden, extraterritorial pressure, and adaptability.
  • While Ref. [5] focuses on the causes of ESG assessment discrepancies at the firm level, the present study extends the analysis to the macro-level by examining how regulatory fragmentation affects national economies and by proposing an aggregation mechanism that transforms firm-level information into a country-level analytical indicator.
  • The proposed index introduces an extraterritorial harmonization component that, to the best of our knowledge, has not been incorporated into existing national ESG assessment frameworks. In contrast to studies such as [13], which primarily examine the relationship between environmental regulation and competitiveness, the proposed approach allows assessment of the consistency between national regulatory systems and the ESG requirements of major trading partners, particularly the European Union and China.
  • Although systems theory and system dynamics have previously been discussed conceptually in ESG research [10,11], this study operationalizes the systems approach through a specific index-construction algorithm based on verifiable indicators derived from publicly available and administrative data, thereby improving its practical applicability for regulatory decision-making.
  • Furthermore, the study proposes the application of automatic control theory to ESG regulation as a socioeconomic system. This enables a transition from disturbance-based to deviation-based management and provides a theoretical basis for developing a country-specific ESG index as a feedback mechanism between business adaptation processes and government regulation.
The practical significance of this work lies in the potential use of the developed index by government agencies for monitoring sustainable development, differentiating business support measures, and improving the comparability of ESG data. For companies, the research results are useful in adapting to diverse international requirements, managing compliance costs, and limiting the potential for greenwashing practices. For investors and financial institutions, the proposed approaches enable a more critical assessment of the reliability of ESG ratings and comparison of the resilience of companies and national economies. Furthermore, the study’s materials can be used in the development of national non-financial reporting standards and digital ESG monitoring platforms. This paper makes four key contributions to the theory and practice of ESG regulation:
  • A typology of ESG regulation models—based on a comparative legal analysis of eight jurisdictions, we distinguish between directive, market-oriented, and state-centralized models.
  • An empirical substantiation of fragmentation as an independent source of risk–we demonstrate that compliance costs and strategic uncertainty can be associated not only with the stringency of requirements, but also with their inconsistency and extraterritorial pressure.
  • Development of a country-specific ESG index—we propose a two-tier calculation algorithm (for companies at the micro level and for governments at the macroeconomic level), including the blocks of regulatory burden, extraterritorial pressure, and adaptability.
  • Application of automatic control theory to ESG regulation—this substantiates the transition from the existing state open-loop control system based on disturbance compensation to a closed system with negative feedback, where the country index performs the function of an integral deviation sensor.
The article is structured as follows: Section 2 presents the theoretical framework of the study, including an overview of institutional and systemic approaches, the rationale for the hypotheses, and the formulation of the research questions. Section 3 describes the materials and methods. Section 4 presents the results of the comparative analysis of legislation, the assessment of rating discrepancies, and the development of the index algorithm. Section 5 contains a discussion of the obtained results in the context of the existing literature, as well as the limitations of the study. Section 6 formulates the main conclusions and practical recommendations.

2. Theoretical Basis and Development of Hypotheses

2.1. Institutional Aspects of ESG Regulation: Fragmentation as a Source of Transaction Costs

According to institutional economic theory [2], formal institutions–laws, standards, and regulatory requirements–establish the “rules of the game” within which economic agents operate. When these rules are not harmonized across jurisdictions or within a single country, high transaction costs arise associated with information search, adaptation, monitoring, and verification [3,4]. In the ESG context, such costs manifest themselves in the need to simultaneously comply with incompatible requirements, maintain multiple reporting systems, and interpret conflicting signals from rating agencies.
Empirical studies confirm that companies operating in global markets face exponentially increasing compliance costs due to regulatory fragmentation [5,6]. This problem is particularly acute for developing economies, where national systems have not yet been established, but exterritorial mechanisms (such as CBAM or CSDDD) already exert pressure on exporters. This necessitates systematizing ESG regulation models and identifying which specific legal elements (mandatory nature, materiality, sanctions, extraterritoriality, and internal consistency) create the greatest barriers to business.
Therefore, the theoretical framework for the comparative analysis in this article is based on identifying three ideal types of regulation:
  • The directive (prescriptive) model is typical of the EU, where requirements are detailed in legislation, mandatory, and backed by sanctions;
  • The market-oriented model is typical of the United States, where regulatory pressure is generated through the interaction of multiple actors (the SEC, states, courts, and exchanges) and is often characterized by internal inconsistencies;
  • The state-centralized model is typical of China, where the ESG agenda is integrated into the state’s strategic goals and implemented from the top down.
Many countries demonstrate hybrid forms (India, Brazil, Russia, South Africa, Kazakhstan).
A comparative analysis of these models allows us to answer the question of how legislative specifics impact compliance costs and strategic risks for companies.

2.2. Methodological Heterogeneity of ESG Indices and Its Consequences

ESG ratings and indices are widely used by investors, regulators, and companies themselves to assess sustainability. However, numerous studies have documented systematic discrepancies in ratings of the same issuer by different agencies. For example, in [7], researchers documented significant divergence in ESG ratings: pairwise correlations between six leading agencies (MSCI, Sustainalytics, S&P Global, etc.) range from 0.38 to 0.71, with an average value of 0.54. The main source of discrepancies (56%) was differences in the measurement of the same attributes, which leads to significant dispersion of ratings for individual companies and makes global ratings of limited applicability for regulatory purposes. Researchers in [8] showed that the average pairwise correlation between ESG ratings from seven leading agencies is only 0.45, while for credit ratings, it exceeds 0.99. This low consistency can increase uncertainty for investors: companies with high rating discrepancies demonstrate higher future returns, which is interpreted as a risk premium associated with conflicting signals. This significantly complicates investment and management decisions based on ESG assessments.
For government regulation purposes, such discrepancies are critical, as they undermine trust in ratings and make them unsuitable for objectively assessing the implementation of national sustainable development goals. Moreover, most global ratings are focused on large public companies and are practically inapplicable to small- and medium-sized enterprises (SMEs), which form the backbone of developing countries’ economies. This creates an asymmetry: large exporters are forced to comply with international standards, while local SMEs remain outside the scope of ESG assessment, although they are also subject to indirect pressure through their supply chains.
Therefore, there is a need to develop a country-specific index that:
  • Takes into account the institutional environment of a specific country;
  • Is proportionate to the capabilities of companies of different sizes;
  • Ensures comparability of data within the country and with key trading partners;
  • Serves as a feedback mechanism between businesses and regulators.

2.3. A Systems Approach to ESG Regulation: From Open-Loop to Closed-Loop Control

Control theory [14] and system dynamics [10,15] offer a fruitful analogy for analyzing socioeconomic systems. Systems such as ESG regulation involve nonlinear responses, multiple feedback loops, time lags, and high sensitivity to external disturbances [11].
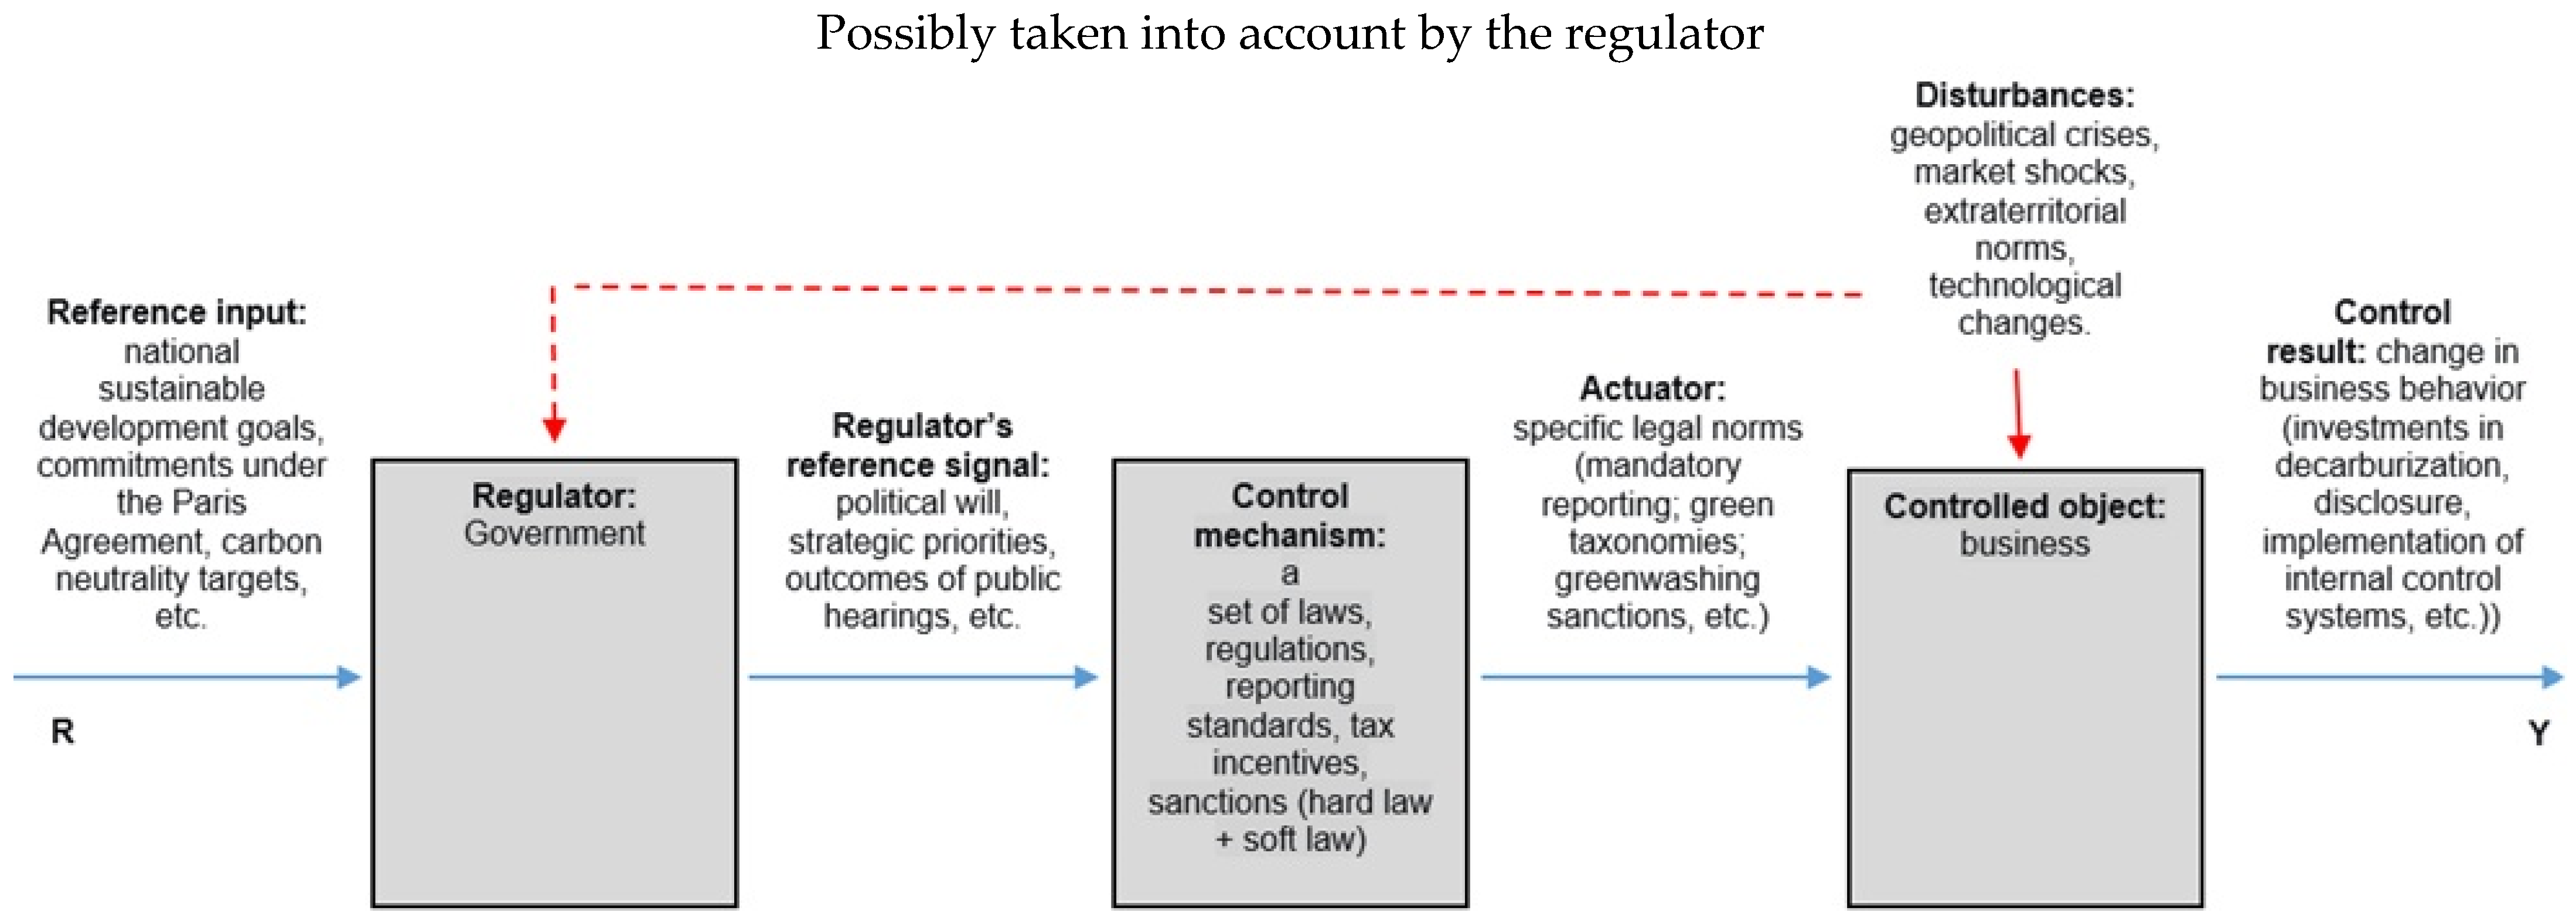
In the current architecture, ESG regulation functions primarily as an open-loop, disturbance-based control system. The regulator (government, supranational bodies) responds to external signals (disturbing the system)–international obligations, public pressure, and environmental disasters—by adopting new laws and standards. Businesses adapt, often following the logic of minimizing compliance risks and formal compliance. However, such a system lacks operational measurement of the resulting deviation: the regulator does not receive a standardized signal about the extent to which the actual business state (output Y) corresponds to the target stability parameters (target R). Policy adjustments occur episodically, with a large time lag, and are based on qualitative assessments. This can generate information asymmetries, increase transaction costs, and encourage symbolic compliance strategies (greenwashing).
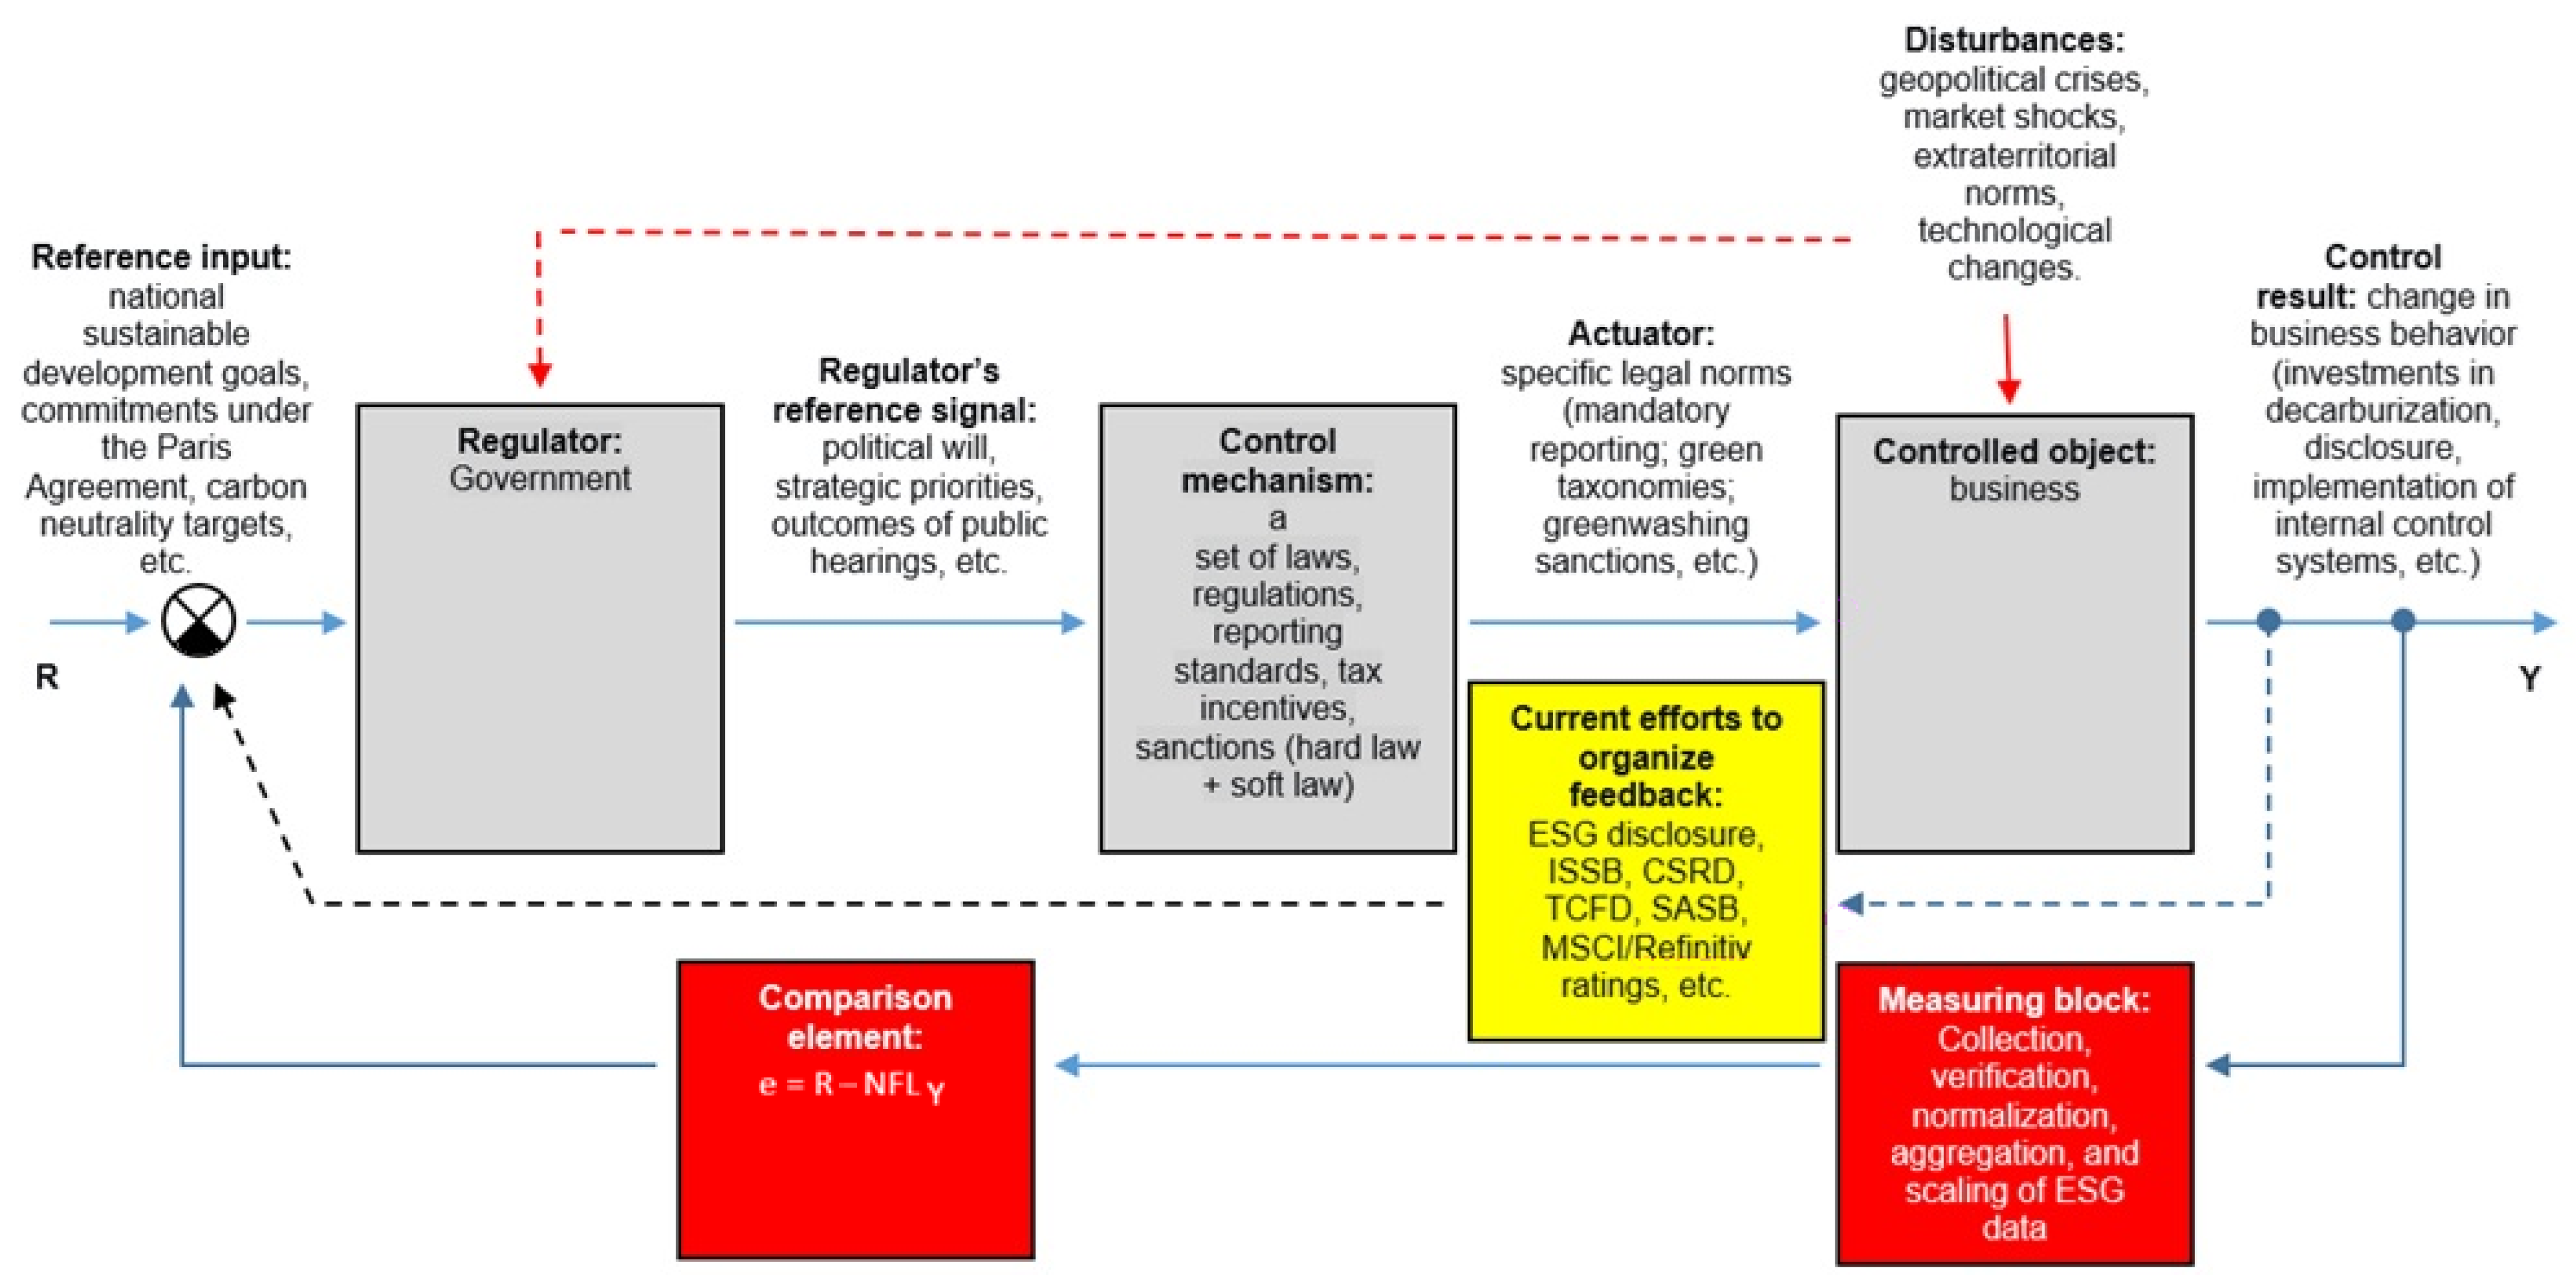
In contrast, a closed-loop control system with negative feedback has fundamental advantages: robustness (resilience to parametric deviations), adaptability (automatic adjustment to changes in the external environment), and the ability to compensate for disturbances without their precise measurement. In the ESG context, this means that the regulator, upon receiving a reliable signal of deviation e = R − NFLY, can promptly soften or tighten requirements, preventing both underregulation (environmental and social risks) and overregulation (loss of competitiveness and carbon leakage).
The key missing element of a closed-loop system is a measurement module in the negative feedback loop (NFL)—a tool that aggregates multidimensional data on business performance into an integrated NFLY indicator suitable for comparison and interpretation. A country-specific ESG index is built on the principles of:
  • Detectability—the ability to capture significant changes (emissions, investments, costs);
  • Robustness—resistance to methodological distortions and noise;
  • Comparability—the ability to conduct cross-country and cross-industry comparisons;
  • Timeliness—minimal time lag between actual processes and their reflection in the index;
  • Symmetry—accounting for both under- and overshoot;
  • Interpretability—understandability for decision-makers.

2.4. Research Questions and Hypotheses

Based on the presented theoretical framework, we formulate the main hypothesis of the study:
H1. 
The key challenges in implementing ESG principles for businesses arise not so much from the strictness or scope of requirements, but from the fragmentation of legal regulation, inconsistency in reporting standards, and the methodological heterogeneity of ESG indices. This presumably leads to increased compliance costs, decreased data comparability, and increased risks of formal compliance (greenwashing).
This hypothesis is decomposed into two sub-hypotheses, each of which is tested empirically:
H1a (regulatory sub-hypothesis).
Fragmented ESG legislation forces companies operating in multiple jurisdictions to adapt their reporting to incompatible requirements, potentially increasing administrative and financial costs and creating strategic uncertainty. H1b (index subhypothesis). ESG indices and ratings used as tools for assessing business sustainability do not always reflect the true quality of companies’ ESG practices due to differences in methodologies, indicator weights, regulatory assumptions, and data sources, which limits their applicability for public administration purposes.
To test the hypotheses, the following research questions (RQs) were formulated:
RQ1. 
How do the specifics of ESG legislation in various jurisdictions (US, EU, China, India, Brazil, Russia, South Africa, Kazakhstan) shape the main challenges for businesses in implementing ESG principles?
RQ2. 
Which elements of legal regulation (mandatory nature, detail, control mechanisms, sanctions) have the greatest impact on companies’ compliance costs?
RQ3. 
How does the inconsistency of non-financial reporting standards (GRI, SASB, ISSB, ESRS) reduce data comparability and complicate investment and management decisions?
RQ4. 
To what extent can existing ESG indices and ratings be considered feedback tools between regulators, investors, and businesses, and what are the limitations of their practical application?
RQ5. 
How can a country-specific ESG index be developed that adapts the best elements of international systems to national specifics to minimize regulatory and compliance risks for businesses when adopting international standards?

2.5. Conceptual Research Model

Based on a systems approach, we propose a conceptual model (Figure 1 in the article) that illustrates the transition from an open-loop to a closed-loop governance system. In the new model, the regulator sets sustainability targets (R). Business (the controlled entity), influenced by regulatory measures (U), shapes the actual state of the economy (Y). The country ESG index serves as a measuring device, converting multidimensional data (reports, statistics, ratings) into a normalized signal NFLY. The comparison unit calculates the deviation e = R − NFLY and transmits it to the regulator. Based on the dynamics of change in e, the regulator adjusts policy–changing requirements, redistributing incentives, introducing deferrals, or, conversely, tightening controls.
This model allows us to:
  • Reduce information asymmetry between business and the government;
  • Increase the adaptability of regulation to changing conditions;
  • Prevent both dangerous lags and excessive pressure on businesses;
  • Take into account extraterritorial impacts (CBAM, CSDDD) by incorporating harmonization and adaptability blocks.
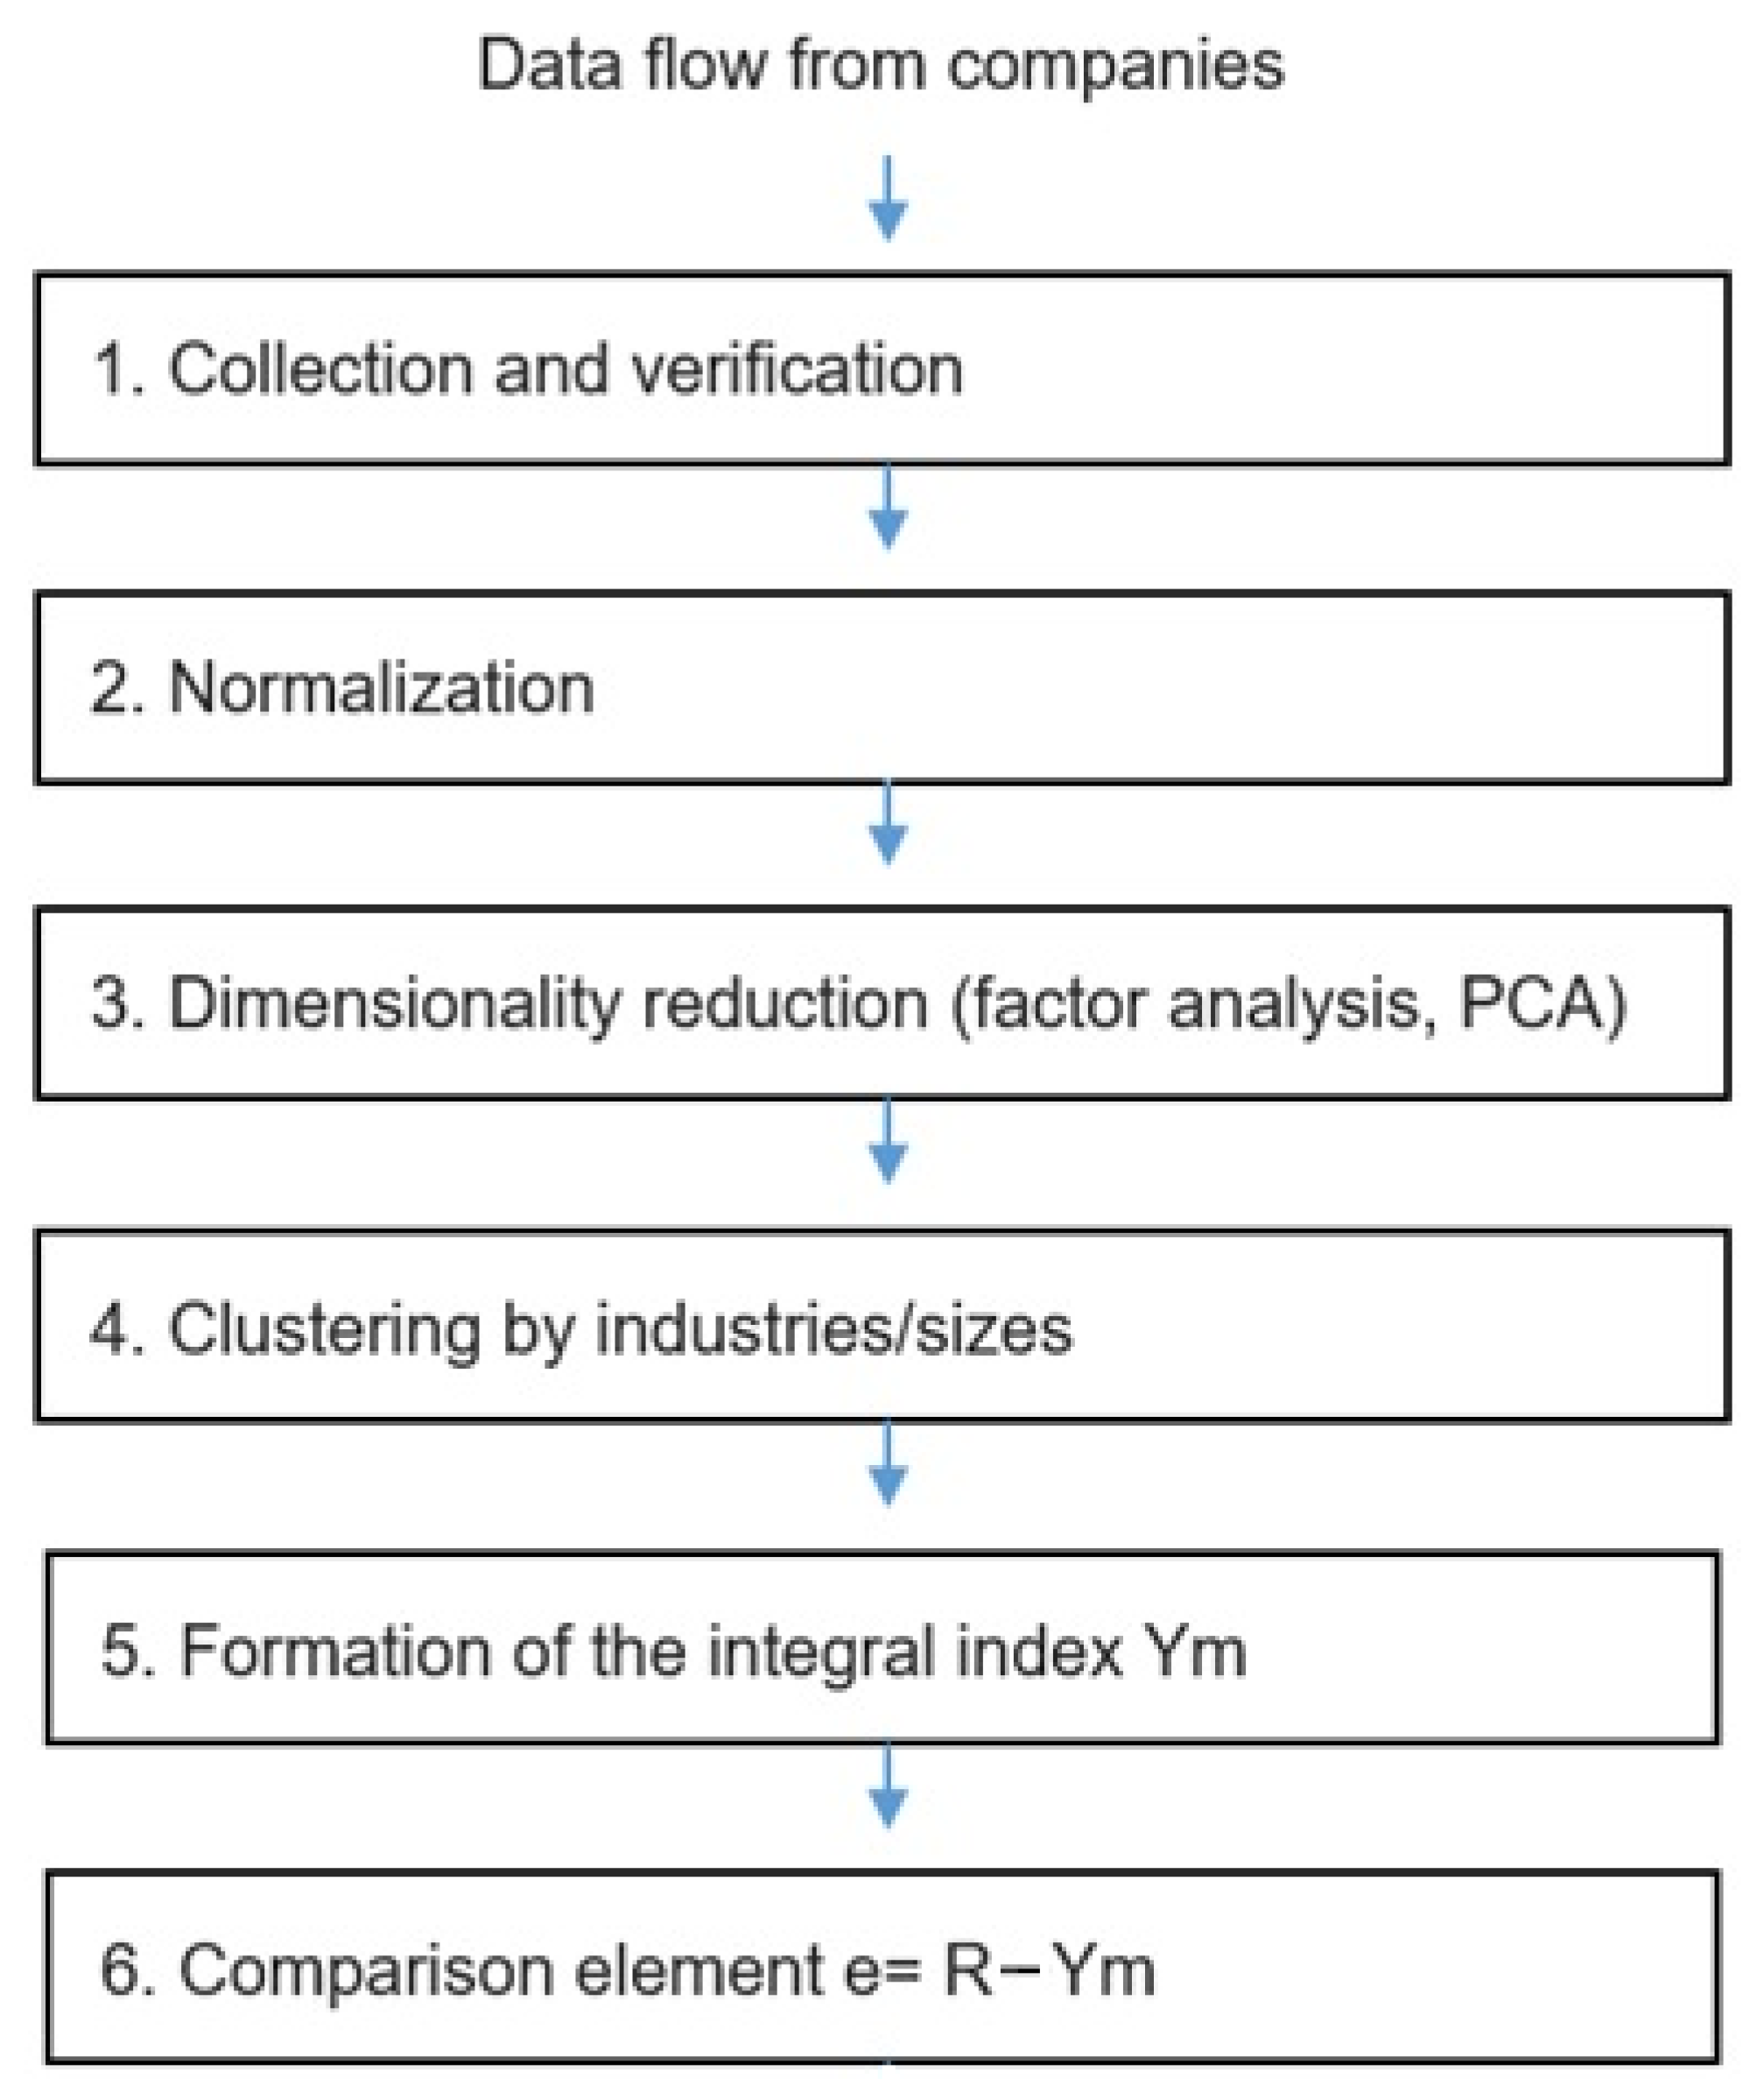
Further (Section 4), we operationalize this model as a two-level index calculation algorithm–at the company level and at the macro-level–with a justification for the selection of indicators based on ranking criteria of relevance, frequency of use in international standards, and impact on risks.

3. Materials and Methods

3.1. Methodological Approach

This interdisciplinary study integrates approaches from economics, law, and management to analyze the fragmentation of ESG regulation and its implications for business. To achieve the study’s objectives and test the hypotheses, a combination of complementary methods was used.
  • Comparative legal analysis forms the core of the study, addressing research questions RQ1 and RQ2. This method allowed us to systematize and compare ESG legislation in eight jurisdictions: the US, EU, China, India, Brazil, Russia, South Africa, and Kazakhstan. The choice of jurisdictions was based on their combined economic weight (over 80% of global GDP), which allowed us to identify regulatory decisions that determine global compliance costs. The inclusion of BRICS countries ensured representativeness of emerging economies. The analysis focused on parameters such as mandatory requirements, the materiality principle, and sanctions mechanisms. The results of this analysis formed the basis for a typology of ESG regulation models and conclusions regarding the fragmentation of the legal framework [5,6]. Kazakhstan is used as the primary illustrative case study in this paper. This choice is driven by a combination of factors: the country’s highly export-oriented economy, significant dependence on external markets, the impact of extraterritorial regulatory mechanisms, and the ongoing development of a national ESG infrastructure. These characteristics make Kazakhstan a prime example of a whole class of emerging economies facing both the need to adapt to international requirements and the limitations of domestic institutional mechanisms for ESG governance.
  • Institutional analysis was used to interpret business behavior in the context of emerging ESG institutions. Drawing on neo-institutional economic theory, we consider regulatory requirements and reporting standards as formal institutions that create the “rules of the game” [2]. It was found that the fragmentation of these institutions potentially generates high transaction costs associated with ESG compliance [3,4]. This approach was applied to explain business behavior (sub-hypothesis 3).
  • Content Analysis & Benchmarking was used to address RQ3 and RQ4. The method included a detailed structured comparison of key ESG disclosure standards (GRI, SASB/ISSB, TCFD, ESRS) and the methodologies of leading ESG ratings (MSCI, Sustainalytics, S&P Global CSA) [7,8,9]. For the comparative analysis, the original scales of the rating agencies were used without converting them to a single metric. This approach was chosen deliberately, since the purpose of the study was to identify methodological differences between the ratings and assess their impact on the comparability of the results, rather than to construct an aggregate ESG rating. This approach made it possible to objectively demonstrate the incomparability of data at the level of the original requirements and identify methodological gaps leading to discrepancies in the assessments of the same company by different agencies.
  • To answer RQ5, we propose an analytical calculation of a country-specific ESG index integrated into a closed-loop feedback control system. A two-tier methodology was developed: calculating a company index and aggregating it into a country index based on macrostatistics. This qualitative method enabled an in-depth study of the ESG agenda formation process in the context of catch-up development and the strong influence of external standards [16]. The analysis was based on the results of the previous fieldwork stage of the study, which included a survey of 99 SMEs [17], as well as a structural analysis of indicators of government entrepreneurship support programs [11]. This allowed us to identify the institutional unpreparedness of the national system for external pressure and justify the need to develop a national ESG index.
  • Descriptive Analysis was used to systematize and visually present secondary data, including companies’ financial indicators, their ESG ratings, and data on their export structure. While establishing strict cause-and-effect relationships is not the goal of this study, identifying and visualizing key trends and divergences (for example, the asymmetry in ESG rating coverage) allowed us to build an evidence base for discussion.
The use of this pool of methods ensured methodological triangulation, allowing us to compare legal norms, reporting standards, market-based valuation tools, and actual corporate practices to enhance the validity and reliability of the study’s findings.

3.2. Data Sources and Regulatory Framework

The empirical and normative basis of the study consists of four interrelated sets of sources, selected to ensure the relevance, reliability, and comprehensiveness of the analysis for each of the jurisdictions under consideration.
1. Legal framework and regulatory documents.
Key legal acts and regulatory documents for the analyzed jurisdictions are systematized in Table 1. The selection was based on the following criteria: (a) legal significance (law, regulation, directive), (b) direct impact on ESG information disclosure or ESG risk management, and (c) applicability to public companies and/or financial institutions. This set of sources was used for comparative legal analysis and typology of ESG regulation models.
An analysis of these regulations allows us to assess the degree of mandatory regulation, the level of disclosure detail, the presence of sanctions mechanisms, and the level of harmonization of requirements. A comparison of these parameters serves as the empirical basis for testing Sub-Hypothesis 1 on regulatory fragmentation.
2. International and National Reporting Standards.
The second set of sources, presented in Table 2, includes framework standards for ESG information disclosure. Their analysis is necessary to answer RQ3, related to data comparability.
A comparative analysis of the standards was conducted based on the following criteria: coverage of thematic blocks (E, S, G), level of metric detail, verification requirements, and the concept of materiality. The identified differences confirm the methodological heterogeneity of reporting and explain the discrepancies in ESG ratings.
3. ESG ratings, indices, and corporate reporting.
The third set of sources (Table 3) provides an empirical test of subhypothesis 2 on the methodological divergence of ratings. The analysis includes data from MSCI ESG Ratings, Sustainalytics ESG Risk Ratings, and S&P Global CSA.
4. Academic and industry literature, statistical data.
The fourth block (Table 4) was used to form a theoretical and empirical basis for interpreting the identified institutional contradictions. It includes publications in journals indexed in Scopus and Web of Science, analytical reports from international organizations (UNEP FI, OECD, World Bank), data from the Bureau of National Statistics of the Republic of Kazakhstan and the results of primary surveys published in [1].
Using such a pool of sources allowed for data triangulation, increasing the reliability of conclusions. For example, the company’s stated ESG practices (reporting) were compared with the independent assessment of a rating agency and the regulatory requirements of its country of incorporation, as well as its main product markets.

4. Results

4.1. ESG Legislation as a Source of Business Risks

The legislation of the selected jurisdictions (USA, EU, China, India, Brazil, Russia, South Africa, and Kazakhstan) was analyzed using six key criteria reflecting the nature of regulatory pressure on business:
  • Mandatory requirements (from voluntary recommendations to mandatory regulations with sanctions);
  • Materiality principle (financial, dual, or strategic materiality);
  • Sanctions mechanism (administrative fines, litigation risks, market consequences);
  • Extraterritoriality (extension of regulations to foreign companies and supply chains);
  • Internal fragmentation (the presence of conflicting requirements within the country);
  • Convergence with international standards.
This structured approach allows us not only to classify country-specific ESG regulation models (directive, market-oriented, and state-centralized), but also to empirically identify which specific legislative elements generate the greatest compliance costs and regulatory risks for businesses. Ultimately, this comparative analysis allows us to quantify the degree of fragmentation in the global ESG landscape, identify asymmetries of pressure on companies in developing economies (including Kazakhstan), and justify the need for feedback tools such as the proposed ESG index.
USA.
A key feature of ESG regulation in the US is the lack of a unified federal ESG law: regulatory pressure is generated through the interaction of multiple actors–the SEC, EPA, the judiciary, states, and market institutions–creating an “unprecedented compliance paradox” for businesses [18,19]. Experts estimate that “the current trajectory of state and national policy suggests protracted fragmentation and confusion, leaving companies to operate in an increasingly complex patchwork of state-level regulations” [18].
At the federal level, in March 2024, the SEC narrowly adopted rules to standardize the disclosure of climate risks and greenhouse gas emissions by public companies [20]. However, the rules were immediately challenged by a coalition of ten states, and on 15 March 2024, the Fifth Circuit Court of Appeals imposed an administrative stay. On 4 April 2024, the SEC voluntarily suspended the rules pending litigation, preventing the rules from ever taking effect [21]. On 27 March 2025, the SEC voted to drop its defense of the rules in court, and in July 2025, it filed a report declining to say whether it would enforce the rules if upheld by the court, citing the need for future commission deliberations [22,23]. The Eighth Circuit, which consolidated the lawsuits, stayed the case in April 2025, leaving the fate of federal regulation in the United States uncertain [21]. Therefore, at the time of this study, the SEC’s federal climate disclosure rules do not create effective obligations for companies and remain the subject of ongoing litigation.
At the subnational level, California passed SB 253 (mandatory disclosure of Scope 1–3 emissions for companies with revenues > $1 billion) and SB 261 (disclosure of climate-related financial risks for companies with revenues > $500 million) in October 2023. Unlike SEC rules, these laws apply to both public and private companies [24]. On 18 November 2025, the Ninth Circuit Court of Appeals temporarily stayed enforcement of SB 261 but refused to stay SB 253 [25]. The appeal hearing took place on 9 January 2026, and SB 261 remains on hold, while SB 253 remains in effect [26]. Thus, at the time of this study, the mandatory emissions disclosure requirements under SB 253 remain in effect, while the implementation of SB 261 remains the subject of ongoing litigation. The California Air Resources Board (CARB) proposed an initial reporting deadline for SB 253 of 10 August 2026 [27].
In parallel, a number of states (Texas, Florida) have passed anti-ESG laws. Texas’s SB 13 (2021) required state pension funds and contractors to exclude companies that “boycott” fossil fuels. On 5 February 2026, a federal court found SB 13 unconstitutional under the First and Fourteenth Amendments, ruling that the law violated free speech and was unconstitutionally vague [28]. At the time of this review, this decision, although subject to further appellate review, already reflects a trend of increasing judicial review of state anti-ESG legislation. This decision marked the second time a federal court has struck down a state anti-ESG law [29].
Environmental regulation and extraterritorial pressure share a similar picture. The Environmental Protection Agency (EPA) administers the Greenhouse Gas Reporting Program (GHGRP, 40 CFR Part 98). However, in September 2025, it was already proposing to repeal the program for most source categories, which is estimated to jeopardize $77.5 billion in CCUS investments and $30 billion in tax revenues [30,31]. Although some senators have called on the EPA to withdraw the proposal, its fate remains uncertain [31]. It should be noted that this EPA initiative is, at the time of the study, a regulatory proposal and is not an effective regulatory change. Furthermore, businesses face extraterritorial pressure: the EU CSRD and CBAM mechanisms extend European standards to US companies operating in the EU. At the same time, US federal authorities are exerting counter-pressure, including through legislative initiatives (e.g., the PROTECTUSA Act of 2025) aimed at protecting US companies from extraterritorial demands [23]. These initiatives reflect a political response to foreign ESG regulation, but do not eliminate the need to comply with the requirements of foreign jurisdictions when conducting business in the relevant markets.
ESG enforcement. The SEC consistently holds companies accountable for greenwashing and unfair ESG practices. In November 2022, Goldman Sachs Asset Management paid a $4 million fine; in September 2023, DWS Investment Management Americas, Inc.–$19 million; in October 2024, Wisdom Tree Asset Management, Inc.–$4 million; and in November 2024, Invesco Advisors, Inc.–$17.5 million for overstating the share of ESG-integrated assets under management [32]. In August 2025, the SEC indicted the co-founder of Aspiration Partners for defrauding environmental services revenues totaling over $300 million [33]. These measures create additional compliance risks for businesses related to the accuracy of disclosed information.
Thus, it can be argued that the American market-oriented model is characterized not only by a multiplicity of requirements, but also by their increasing inconsistency and potential conflict. This confirms subhypothesis 1 on fragmentation as a key source of compliance risks. At the same time, a significant portion of the most discussed changes for 2024–2026 are currently under judicial review or regulatory review, which further increases the uncertainty of the regulatory environment for business.
European Union.
The analysis shows that the European Union’s ESG regulation is a directive (or rather, a directive-centralized) model, which in 2025–2026 underwent a significant transformation towards simplification and a reduction in the administrative burden. In response to criticism of excessive regulatory complexity, the European Commission unveiled the Omnibus I package on 26 February 2025, aimed at reducing administrative costs by a target of 25% for all companies and 35% for SMEs [34,35]. The expected annual savings from the CSRD reform are estimated at €4.4 billion, with total savings across all omnibus initiatives amounting to approximately €11.9 billion per year [34,36].
In the context of corporate reporting, the CSRD (2022/2464) requires mandatory disclosure of non-financial information on a dual materiality basis. The proposed amendments to Omnibus I (Amending Directive (EU) 2026/470, published on 26 February 2026) propose to significantly reduce the scope of the CSRD [37]. If adopted, mandatory reporting would only be required for companies with more than 1000 employees and an annual turnover exceeding €450 million, thereby exempting approximately 80% of previously covered companies from the scope of the directive [30,32]. It is also proposed to completely exclude listed SMEs from the scope of the CSRD. CSRD reporting will apply for financial years beginning on 1 January 2027, and the deadline for transposition for Member States is set for 19 March 2027 [38]. Large public interest companies remaining within the scope of the directive are required to report for the 2025 and 2026 financial years [39].
The European Sustainability Reporting Standards (ESRS) were completely revised in 2025; the version of ESRS 2.0 submitted for consideration, although not yet finalized, proposes changes to reduce mandatory indicators by approximately 60–70%, eliminate voluntary disclosures, and simplify the reporting process. The implementation of the updated ESRS 2.0 standards for companies falling under the CSRD is scheduled for 1 January 2027, with the possibility of early application from 1 January 2026. EFRAG is developing a voluntary reporting standard for companies with fewer than 1000 employees, which will also serve as a protective mechanism (“shield”) limiting information requests from SMEs in supply chains [34,35].
Financial regulation is subject to the SFDR 2019/2088, which is undergoing reform. On 20 November 2025, the European Commission published the legislative proposal “SFDR 2.0” (COM/2025/841 final) [34]. At the time of the study, these changes have the status of a legislative proposal and have not yet entered into force. Key changes include the abandonment of the “Article 8” and “Article 9” categories in favor of three mandatory financial product categories: “Transition,” “ESG Basics,” and “Sustainable,” each with an investment threshold of 70% [36,40]. The proposal aims to simplify the regime, eliminate market confusion, and reduce the risks of greenwashing.
The Taxonomy Regulation 2020/852 establishes criteria for environmentally sustainable economic activity. From 1 January 2022, the requirements applied to large companies with more than 500 employees, and from 2025, to all companies falling under the CSRD [41]. Delegated Regulation (EU) 2026/73 of 4 July 2025 simplifies the reporting of information within the taxonomy [42]. Companies are exempt from disclosing activity-based data if they account for less than 10% of revenue, investments, or operating expenses. Taxonomy obligations remain limited to the largest companies (over 1000 employees and €450 million in turnover), but other companies may report voluntarily [34].
The Due Diligence Directive (CSDDD) (2024/1760) entered into force on 25 July 2024. However, the Omnibus I package contains proposals for its substantial revision [32]. According to the published proposals, the application thresholds have been raised from 1000 employees and €450 million in turnover to 5000 employees and €1.5 billion in turnover, and the due diligence obligation has now been made risk-based [37]. It is proposed to completely remove from the directive the obligation to develop climate change mitigation transition plans and a harmonised civil liability regime at the EU level [37,38]. The deadline for transposition for Member States is set for 26 July 2028, and companies will have to comply with the rules from July 2029 [38].
The cross-border carbon regulation mechanism entered the compliance phase on 1 January 2026, covering imports of cement, fertilizers, aluminum, hydrogen, iron, and steel [43]. Importers importing 50 or more tons of goods per year are required to declare their embedded emissions and submit the corresponding number of CBAM certificates. The certificate price is linked to the price of EUETS allowances (~€70–100 per ton of CO2). The first declaration and certificate submission must be made by 30 September 2027 for emissions during 2026 [44].
Thus, the European ESG regulation model, while retaining its directive nature and dual materiality principle, has been significantly simplified. For businesses, the key risk remains not so much internal EU requirements as extraterritorial pressure: large companies are required to comply with the CSRD and CSDDD, as well as bear the costs associated with CBAM. Moreover, some of the most significant changes for 2025–2026 are currently undergoing legislative revision or implementation, which demonstrates not only the centralized nature of the system but also the high regulatory volatility of the European ESG agenda.
China.
In 2025, China’s ESG regulatory system made a qualitative transition from conceptual framework development to practical implementation, making sustainable development an element of mandatory corporate compliance. Unlike the market-oriented US model, the Chinese model represents a state-centralized model in which the ESG agenda is integrated into achieving the goals of carbon neutrality by 2060 and an “ecological civilization” [45].
A key event in the field of information disclosure in 2024–25 was the formation of a unified national system of sustainability disclosure standards (CSDS). In November 2024, the Ministry of Finance of the People’s Republic of China, together with eight departments, issued the Core Corporate Sustainability Reporting Standards (Trial Version), which laid the foundation for the unification of ESG reporting requirements [46,47]. In September 2025, the Implementation Guide for these standards was issued, establishing specific requirements for value chain boundaries, data preparation, and internal control. Finally, on 25 December 2025, Disclosure Standard No. 1–Climate was published, covering governance, strategy, risk and opportunity management, as well as metrics and targets (including Scope 1–3 emissions) [48]. Thus, at the time of the study, the national CSDS system is in the stage of phased formation, and its individual elements continue to function in pilot (trial) mode. The national standards are developed based on the ISSB framework, but represent an independent Chinese system, implying a phased implementation: from voluntary to mandatory, from qualitative to quantitative requirements, and from large public companies to SMEs [46,48]. According to official program documents, the formation of a unified national system of sustainable information disclosure standards is expected to be completed by 2030 [47].
In parallel, the Shanghai, Shenzhen, and Beijing stock exchanges, under the leadership of the CSRC, have introduced mandatory reporting requirements. The year 2025 marked the first real reporting period, with companies preparing reports by the deadline of 30 April 2026 [49]. By 2025, the number of companies publishing sustainability reports reached 1869, accounting for approximately 70% of the total market capitalization [50]. In March 2025, the CSRC adopted revised Disclosure Management Measures for Listed Companies, which took effect on 1 July 2025, and explicitly require the publication of sustainability reports [51,52].
An important feature of the Chinese approach is the implementation of the double materiality principle, which requires companies to disclose both the impact of ESG factors on their financial position (financial materiality) and the company’s impact on the environment and society (impact materiality) [47]. Unlike the European CSRD, where compliance with one criterion is sufficient, the Chinese approach is closer to requiring both types of materiality simultaneously. Moreover, China, unlike the ISSB, which focuses exclusively on financial materiality, has opted for a broader approach. National exchanges also require listed companies to use the dual materiality principle when identifying and disclosing sustainable themes [53].
On 21 March 2025, the Ministry of Ecology and Environment expanded the national emissions trading system (ETS) to the steel, cement, and aluminum industries, incorporating approximately 1500 new enterprises and bringing its coverage to approximately 60% of the country’s total greenhouse gas emissions [49]. Mandatory monthly reporting and data verification were introduced for new participants. Furthermore, in April 2025, the Standing Committee of the National People’s Congress of China introduced a draft Environmental Code, which consolidates all environmental legislation into a single structured system, including mandatory ESG clauses in contracts and penalties of up to five times the damage [54]. At the time of the study, the Environmental Code was at the legislative review stage and had not yet entered into force. On 1 January 2026, continuous digital emissions monitoring regulations came into effect, introducing legal liability for falsifying environmental data.
Chinese exporters face growing extraterritorial pressure. The EU’s CBAM mechanism (since 2026) requires Chinese suppliers of steel, cement, and aluminum to disclose their carbon footprints. Simultaneously, the Uyghur Forced Labor Prevention Act (UFLPA) in the US resulted in the inclusion of 144 Chinese companies on the restriction list as of early 2026. China responded by ratifying two ILO conventions on forced labor in 2025. Domestic sanctions for environmental violations include administrative fines of up to five times the damages, daily penalties, suspension of operations, and criminal liability for executives [54]. The CSRC also set a maximum fine for disclosure violations of 100,000 yuan [51].
Thus, the Chinese ESG regulation model, while maintaining its state-centralized nature and strategic focus on carbon neutrality, has transitioned to mandatory compliance. The key risk for businesses is the need to simultaneously comply with rapidly tightening domestic requirements (CSDS, expanded ETS, Environmental Code–although it should be noted that some of these are still in the phased implementation or legislative process) and extraterritorial pressure from the EU (CBAM) and the US (UFLPA). This confirms subhypothesis 1 on fragmentation: even with formal centralization of regulations within the country, businesses face conflicting requirements from different global regulators.
India.
The analysis shows that ESG regulation in India is a hybrid of a state-centralized and directive model, in which the Securities and Exchange Board of India (SEBI) plays a key role, consistently expanding mandatory requirements for non-financial information disclosure. The basic reporting format–Business Responsibility and Sustainability Reporting (BRSR)–is based on nine National Guidelines for Responsible Business Conduct (NGRBC) and is mandatory for the top 1000 listed companies (by market capitalization) from 2022 [55]. BRSR includes approximately 140 indicators (mandatory Essential indicators and voluntary Leadership indicators) and is integrated into the company’s annual report.
In 2023, SEBI implemented BRSR Core, a standardized set of nine key performance indicators (KPIs) designed to improve the validity, comparability, and reliability of ESG data [56]. Under SEBI Circular No. SEBI/HO/CFD/CFD-PoD-1/P/CIR/2025/42 dated 28 March 2025, companies were given the option to choose between “assessment” (as per Industry Standards Forum) and “assurance” for BRSR Core and supply chain disclosures. The assurance implementation schedule remains phased: in 2026, for the top 500 listed companies, and by 2027, for all top 1000 listed companies [56].
For supply chain disclosures, SEBI has set a materiality threshold for supply chain partners of 2% or more of a company’s purchases or sales, with the option to limit disclosures to 75% of total transaction volume [57]. Mandatory supply chain disclosures have been deferred by one year during the transition period: voluntary reporting for the top 250 companies from 2026, and voluntary assessment/assurance from 2027 [58]. For 2026, reporting for the previous year remains optional, while reporting for the current year is voluntary [59]. Thus, at the time of the study, individual supply chain disclosure requirements remain in the phased implementation stage.
SEBI is actively working to update the BRSR standards to harmonize and align with global ESG norms. In February 2025, SEBI formed a study group with the Shakti Sustainable Energy Foundation and auctusESG to identify gaps in the current framework and propose necessary changes to comply with IFRS S1 and S2. This follows the endorsement of IFRS by the International Organization of Securities Commissions (IOSCO), which called on its 130 member jurisdictions to adopt IFRS S1 and S2 [60]. At the time of the study, work on revising the BRSR is ongoing, and the relevant changes are still being prepared and discussed. It is expected that the updated version of the BRSR may include detailed disclosures on sustainability risks, climate impacts, and Scope 3 emissions, which are currently missing. A key recommendation is to adopt ISSB (IFRS S1/S2) as the baseline standard for financial materiality and GRI for impact materiality, which will allow the BRSR to achieve “deemed compliance”—a status by which international standards are recognized as fulfilling internal requirements [61].
SEBI has consistently held companies accountable for disclosure violations. In March 2026, SEBI imposed a fine of ₹3.8 million (approximately $45,600) on CoffeeDayEnterprises and related parties for financial misrepresentations and disclosure violations [62]. In January 2026, SEBI fined eight entities ₹8 crore (approximately $960,000) for failing to disclose information to exchanges on a timely basis. In March 2026, SEBI imposed its largest-ever fine of ₹85 crore (approximately $10.2 million) on DLF and related parties for fraud and unfair trading practices in an initial public offering [63]. While these sanctions do not yet relate directly to ESG reporting, they demonstrate SEBI’s growing ability to impose significant financial penalties. As experts note, ESG distortions are already triggering shareholder lawsuits, SEBI enforcement actions, and promoter liability in India.
Thus, the Indian ESG regulation model, unlike the EU and somewhat similar to China, demonstrates a consistent strengthening of mandatory disclosure and data verification requirements while maintaining flexibility during the transition period (in particular, the choice between assessment and assurance). The key risk for companies is the need to comply with increasingly stringent domestic BRSR Core and supply chain requirements while simultaneously adapting to global harmonization with ISSB standards. Moreover, some of the most significant changes are related to the ongoing process of revision and international harmonization of BRSR standards. This indicates less fragmentation than an ongoing process of regulatory convergence, which creates additional transition and compliance costs for businesses.
Brazil.
Brazil’s ESG regulatory system is a hybrid model with a high degree of coordination between the Securities and Exchange Commission (CVM) and the Central Bank (BACEN), ensuring a low level of internal fragmentation. A key distinguishing feature is the phased implementation of mandatory sustainability financial disclosure requirements based on the ISSB standards while simultaneously developing a national green taxonomy and a carbon market.
ESG disclosure and ISSB adoption have undergone significant changes since 2021. In December 2021, the CVM adopted Resolution No. 59, which entered into force in January 2023 and included disclosure of ESG practices, greenhouse gas emissions, and materiality assessment methods in the mandatory Information Form while maintaining the “practice or explain” principle [64]. In October 2023, the CVM issued Resolution No. 193, making Brazil the first country in the world to formalize in national law the voluntary application of IFRS S1 and S2 standards developed by the International Sustainability Standards Board (ISSB), starting in fiscal year 2024. Following the completion of the translation and adaptation of the ISSB standards by the Brazilian Committee on Sustainability Standards (CBPS), in October 2024, the CVM adopted Resolutions No. 217, 218 and 219, which made the application of CBPS Technical Provisions No. 01 (IFRS S1) and No. 02 (IFRS S2) mandatory for all public companies, investment funds and securitization companies for fiscal years beginning on or after 1 January 2026. Companies could voluntarily apply the new standards starting as early as fiscal year 2025 [65]. For the first years of mandatory application, the possibility of providing reports with a reasonable level of confidence (reasonable assurance) according to ISSB standards was established. The CVM also introduced additional requirements: from 1 January 2025, public companies are obliged to apply the Technical Guide OCPC 10 (Opticial Técnico OCPC 10—Créditos de Carbono) for accounting of carbon credits [65].
In September 2021, the National Monetary Council adopted Resolution No. 4.943 and amended the risk management rules for financial institutions, adding social, environmental, and climate risks to their governance structure and stress testing procedures [65]. The main requirements were to be implemented on 1 December 2022. Law No. 15.042 of 11 December 2024 established the Brazilian Greenhouse Gas Emissions Trading System (SBCE), which established requirements for the monitoring, reporting, and verification of Scope 1–3 emissions and laid the foundation for a regulated carbon market in the country [66]. At the same time, the law created the regulatory basis for the system, while individual mechanisms for the functioning of the carbon units market are subject to further phased implementation through secondary regulation.
As part of the green taxonomy and the fight against greenwashing, the Interministerial Committee of the Brazilian Sustainable Taxonomy (CITSB), chaired by the Ministry of Finance, was created in March 2024 by Decree No. 11.961. On 25 August 2025, the CITSB approved the final technical reports of the Brazilian Sustainability Taxonomy (TSB), covering eight economic sectors (including agriculture, extractive and manufacturing industries, energy, construction, and transportation). On 31 October 2025, in the lead-up to COP30, the federal government issued Decree No. 12.705, which formally established the TSB as an instrument of the federal executive power and a reference point for the direction of credit lines, guarantees, and investment monitoring [67]. At the time of the study, the taxonomy is used primarily as a tool for public policy and financial resource allocation, rather than as an independent source of universal disclosure obligations for all companies. The taxonomy is based on a three-tier system that verifies the contribution of an activity to environmental/social objectives, the absence of significant harm to other objectives, and compliance with minimum social and environmental safeguards. Regarding greenwashing, in December 2022, the CVM adopted Resolution No. 175, which established requirements for the nomenclature of investment funds using terms related to ESG, “green,” “sustainable,” and similar terms, requiring full compliance with methodological criteria and the disclosure of reports on ESG results [68]. ANBIMA also established additional rules for funds with the suffix “Sustainable Investment” [69].
In terms of enforcement, the CVM and BACEN have powers to supervise compliance with ESG requirements. Violations may be subject to administrative fines, as well as lawsuits for false disclosure. In August 2025, the CVM updated its supervisory rules to introduce sanctions, including fines and other enforcement measures, and to assess the risks of misleading investors.
Thus, the Brazilian model demonstrates a systematic transition from soft principles of “comply or explain” to mandatory information disclosure based on ISSB from 2026. It is also distinguished by the early inclusion of ESG risks in the regulation of the financial sector and the world’s first official approval of a taxonomy of sustainable development at the level of a federal decree. The main compliance risk for businesses relates to the need to adapt to rapidly changing requirements for verifiable reporting and the need to prepare to comply with an increasingly wide range of sustainability obligations. At the same time, some of the most significant innovations related to the mandatory use of ISSB and the functioning of the carbon units market are at the initial stage of practical implementation. This generally confirms the hypothesis about the emergence of fragmentation costs, both within the country and at the global level.
Russia.
The Russian ESG regulation system is a state-centralized model, where the key drivers are national economic policy goals and industrial modernization. Unlike the market-oriented US model, the impetus for the development of the ESG agenda in Russia is driven by state institutions, and regulation is hybrid—a combination of directive strategic documents and voluntary non-financial reporting standards.
The fundamental act for climate regulation and carbon reporting is Federal Law No. 296-FZ “On Limiting Greenhouse Gas Emissions” (which entered into force in 2022), which establishes the obligation for regulated organizations to submit annual greenhouse gas emissions reports. Starting in 2025, the range of regulated organizations has been expanded: reporting is required not only for large enterprises with emissions exceeding 150,000 tons of CO2 equivalent per year, but also for medium-sized enterprises with volumes of 50,000 tons or more. Emissions reports for 2025 must be submitted from 1 January to 1 July 2026 [70]. Amendments allowing for the creation of an expert council under the authorized federal body will come into force on 1 September 2026.
In December 2025, the Bank of Russia published a draft regulation that requires issuers on the first and second quotation lists to disclose approximately 30 basic non-financial indicators in their annual reports, including greenhouse gas emissions, water, and energy consumption [71]. Data must be provided in machine-readable XBRL format. At the time of the study, this document retains the status of a draft normative act. According to the published version of the draft, its entry into force is envisaged on 1 October 2026 [72]. In August 2025, the Bank of Russia also approved the Code of Responsible Investment, which is advisory in nature regarding the disclosure of ESG reporting by investors and is based on the principle of voluntary participation of market participants [73].
In June 2025, Rosstandart approved the national standard GOST R72157-2025 “Sustainable Development of Organizations. Guidelines for Diagnostics of Organizations’ Activities in Achieving Sustainable Development Goals” (Order No. 585-st of 19 June 2025), with an effective date of 1 July 2025 [74]. At the same time, the EPS rating (Ecology–Personnel–State) continues to develop; in 2025, it received the status of a national standard and was enshrined in regional legislation in 38 regions, covering 47 assessment criteria. At the same time, participation in the ECG rating system is not a universal federal obligation for all economic entities and is implemented primarily through mechanisms of voluntary participation and regional regulation. Also in December 2025, the government approved the Business Public Capital Standard (BPS)–Resolution No. 2230 of 30 December 2025, defining voluntary principles and indicators for business contribution to national projects. According to preliminary data, more than 1000 companies have submitted applications for BPS compliance assessment [75].
As part of the green taxonomy and financing, Government Resolution No. 1587 approves criteria for sustainable development projects (including “green”). In October 2025, the government updated the taxonomy, expanding and detailing the project classification and adding new areas. In 2025, the sustainable development financing market grew by 27%.
Russian exporters face the extraterritorial pressure mechanism of the CBAM (EU), which, starting in 2026, requires disclosure of the carbon footprint of steel, aluminum, cement, and fertilizer supplies. In May 2025, Russia formally requested consultations with the EU at the WTO regarding the CBAM. Meanwhile, most large Russian companies continue to use international GRI standards (88% of 1005 companies), SASB, and TCFD, along with national recommendations.
Thus, the Russian model also demonstrates a transition from voluntary principles to more stringent and structured regulation while maintaining a hybrid nature. The main compliance risk for businesses is associated with the need to simultaneously comply with domestic requirements (some of which are already mandatory, while others are in the regulatory drafting stage or are voluntary) and adapt to extraterritorial pressure from the EU (CBAM), which confirms the hypothesis of additional costs of fragmentation.
South Africa.
The ESG regulatory system in South Africa is a hybrid model, combining government regulation with the strong influence of market institutions, primarily the Johannesburg Stock Exchange (JSE) and corporate governance standards. A key distinguishing feature is the institutionalization of sustainability principles through the King Code of Corporate Governance and the JSE listing requirements, complemented by mandatory climate legislation.
The new King V Code of Corporate Governance in South Africa, published on 31 October 2025, replaces King IV and applies to financial years beginning on 1 January 2026. King V retains the “apply-and-explain” principle but introduces a more standardized approach to disclosure using the mandatory Disclosure Framework [76]. The Code enshrines the principle of double materiality, requiring companies to disclose both the impact of ESG factors on their business and their impact on the environment and society [77]. Although King V is formally advisory in nature, its principles are embedded in the JSE listing rules, making them binding on listed companies.
In January 2025, the JSE updated its Sustainability Disclosure Guidance to align with IFRS S1 and S2 developed by the International Sustainability Standards Board (ISSB) [78]. The new guidance simplifies the reporting process, introduces a requirement to disclose financial materiality (financial risks and opportunities related to sustainability), and sets out a phased implementation schedule. From 2026, listed companies are required to disclose compliance with the ISSB standards or provide a full explanation for deviations. Thus, a “comply or explain” mechanism is applied rather than an unconditional obligation to fully comply with ISSB standards. Regional asset managers are already considering this requirement as a key factor in investment screening.
The President of South Africa signed the Climate Change Act No. 22 of 2024 on 23 July 2024. The Act came into force on 17 March 2025, although a number of provisions (sections 12–30) will be implemented later as secondary legislation is developed [79]. Consequently, at the time of the study, individual mechanisms for implementing the law continue to be introduced in stages through sub-legislative regulation. The Act establishes South Africa’s first legally binding greenhouse gas emissions reduction regime, introducing a national emissions pathway, sectoral targets, carbon budgets for large emitters and mitigation plans. The established sanctions include criminal liability (a fine of up to 5 million ZAR or imprisonment for up to 5 years for a first conviction, up to 10 million ZAR or up to 10 years for a second conviction), as well as personal liability of directors for failure to take reasonable steps to prevent violations [80]. The law maintains the existing environmental regulations (National Environmental Management Act–NEMA, Greenhouse Gas Emissions Reporting Regulations) and supplements them with new enforcement mechanisms, including inspector orders and personal liability of officials.
South African exporters face extraterritorial pressure through the EU Cross-Border Carbon Management (CBAM), which from 2026 requires disclosure of the carbon footprint of steel, aluminum, cement, and fertiliser supplies [81].
Thus, the South African ESG regulation model combines voluntary corporate governance principles (King V) with mandatory JSE requirements (ISSB-compliant reporting) and strict climate legislation (Climate Change Act). However, some of the climate mechanisms provided by the Climate Change Act are in the process of phased regulatory implementation. The main compliance risk for businesses is associated with the need to simultaneously comply with internal regulations (including carbon reporting and due diligence) and adapt to extraterritorial pressures (CBAM). This confirms the hypothesis of fragmentation as a key source of costs.
Kazakhstan.
While the models of the US, EU, and China discussed above reflect various versions of established ESG regulatory systems, Kazakhstan is interesting as an example of an economy in the process of institutional adaptation. Unlike the leading centers for the development of ESG standards, Kazakhstan primarily acts as a recipient and is forced to simultaneously consider the requirements of several external regulatory systems. This makes the country a convenient platform for analyzing the challenges of harmonizing requirements and developing national feedback instruments.
A historical analysis suggests that Kazakhstan’s ESG regulation system is a hybrid model in its infancy, combining elements of a state-centralized model with market initiatives from the financial sector. A key feature is the centralized nature of regulation, the absence of uniform mandatory non-financial reporting standards for the non-financial sector, and the low level of engagement of small- and medium-sized businesses in the ESG agenda [82,83].
The state’s strategy for achieving carbon neutrality by 2060 and the 2013 Concept for the Transition to a “Green Economy” provide long-term guidelines for sustainable development [84]. The 2021 Environmental Code of the Republic of Kazakhstan established requirements for environmental monitoring, emissions reporting, and the implementation of best available technologies, strengthening the environmental component of ESG regulation [85]. The Code incorporates the “polluter pays and corrects” principle and allows for mandatory environmental reporting for Category I and II enterprises.
The Agency for Regulation and Development of the Financial Market (ARFMR) of Kazakhstan has developed three key documents: a Roadmap for the Implementation of ESG Principles, a Roadmap for Raising Awareness, and a Guide to Disclosing ESG Information for Banks and Other Financial Institutions [86]. On 1 January 2025, ESG information disclosure became mandatory for all financial institutions in Kazakhstan–second-tier banks, insurance companies, investment funds, and organizations engaged in certain types of banking operations. Financial institutions are required to develop a sustainable development policy, an environmental and social risk management policy, a procedure for disclosing information on sustainable development, and other internal documentation. ARFMR is also implementing requirements for the integration of ESG principles and reporting for the banking sector. For companies in the non-financial sector, the requirements remain primarily advisory, although methodological recommendations have been developed by the Ministry of Ecology and Natural Resources and the Atameken National Chamber of Entrepreneurs.
The AIFC, which operates under a separate legal framework, plays a key role in developing the sustainable finance market. The AIFC Green Finance Centre developed a green taxonomy in 2021, defining criteria for classifying environmentally sustainable projects. The taxonomy sets requirements for projects eligible for green financing and serves as the basis for issuing green bonds and other sustainable financial instruments. By 2025, the volume of green bonds issued and placed with the support of the AIFC exceeded $650 million [87]. Approximately 70% of all green bonds and loans issued in Kazakhstan were supported by the Green Finance Centre.
Kazakhstan is actively integrating into international ESG initiatives. In 2023, the Export Credit Agency of Kazakhstan became an affiliate member of the Zero Emissions Export Credit Alliance (NZECA), confirming its commitment to supporting carbon neutrality by 2050, with interim targets for 2030 [88]. The country also participates in the OECD Working Group on Export Credits, which facilitates the implementation of international best practices. Kazakhstan declares a course towards harmonizing approaches to information disclosure with IFRS S1 and S2 standards; however, at the time of the study, the process of adapting these standards continues to develop and has not yet been accompanied by the introduction of universal mandatory requirements for the entire corporate sector. With the support of the UNDP and the OECD, workshops are being held for Kazakh companies on the implementation of international standards for sustainable disclosure.
The European Union remains Kazakhstan’s largest trading partner, accounting for 37% of the country’s total exports in 2024. The aluminum, fertilizer, and iron industries are most sensitive to CBAM. At the same time, China has become the second largest export partner of Kazakhstan, with a share of 18.9% in 2024 [89]. Thus, Kazakhstani exporters face a dual system of external pressure: the European direction requires formalized carbon reporting and decarbonization, while the Chinese direction is strengthening its focus on supply security and price efficiency. To manage these challenges, Kazakhstan is consulting with the EU and preparing national systems for monitoring and verifying its carbon footprint. A structural analysis of the indicators of the “Business Roadmap 2025” and the “Concept for the Development of SMEs in the Republic of Kazakhstan until 2030” shows that they completely lack environmental indicators [1]. This configuration does not encourage businesses to take ESG factors into account, creating the risk of unpreparedness for foreign counterparties’ requirements to disclose their carbon footprint. A survey of entrepreneurs revealed a negative correlation between willingness to invest in sustainable development and willingness to invest in business (r = −0.225), indicating that ESG factors are perceived as an additional burden rather than a stimulating one [17]. Thus, with formal centralization of regulation, businesses face fragmentation of signals between government expectations and global markets, confirming subhypothesis 1 regarding regulatory fragmentation as a key source of costs. At the same time, a significant portion of the harmonization processes with international ESG standards is at the stage of institutional development and the formation of application practices, which further increases the level of regulatory uncertainty for businesses.
A summary of the ESG regulation models based on the criteria of the analytical framework is presented in Table 5.
Each of the US, EU, and Chinese models examined develops its own approach to ESG: the US model through market mechanisms, the European model through directive legislation, and the Chinese model through state-centralized planning and national strategic priorities. However, for businesses operating in the global economy, these models are not alternatives: companies are forced to comply with all three (or a combination of them) simultaneously, entering a zone of conflicting obligations and incompatible requirements. It is this contradiction, revealed through a comparative legal analysis, that becomes a key source of regulatory, compliance, and strategic risks.

4.2. Key Types of ESG Risks for Business in the Context of Global Regulatory Fragmentation

Thus, the global fragmentation of ESG regulation generates four interrelated categories of risks for business. Regulatory risks arise from the divergence of requirements between jurisdictions. Companies are forced to monitor and adapt to the conflicting regulations of the EU, the US, and China. Exterritorial mechanisms–CBAM (from 2026), CSDDD (after Omnibus I–for companies with >5000 employees and €1.5 billion in turnover, transposition until 2028), and California’s SB 253/SB 261 laws (although partially suspended by the courts)–create asymmetric pressure on third-country suppliers. Furthermore, 57% of surveyed companies cited compliance complexity as a key challenge, and 83% expect further cost increases [90].
Compliance risks are associated with the multiplicity of reporting standards. Today, there are over 600 ESG data disclosure mechanisms in place worldwide [90]. Kazakhstani companies simultaneously use GRI, TCFD, and voluntary national standards, leading to multi-tasking and an increase in errors. The research in [91] introduces the concept of “penalty zones”: a place where market value declines even though companies’ actual sustainability performance continues to improve. The penalty zone arises from inaccuracies in market signals and serves as a significant barrier for companies wishing to advance their sustainability agenda by implementing additional ISS standards.
Reputational risks are exacerbated by methodological divergence in ESG ratings. Discrepancies between MSCI, Sustainalytics, and S&P Global reach 50–60%, even for the largest issuers [7]. The inconsistency of assessments itself is becoming a source of mistrust: investors suspect data manipulation. At the same time, regulators are intensifying the fight against greenwashing. The risk of greenwashing is particularly high in countries without national verification standards.
Investment risks manifest themselves in the increased cost of capital for companies with inconsistent ESG ratings. Over 60% of institutional investors recognize the divergence of standards as a significant risk to corporate governance. Research confirms that differences in ESG ratings significantly impact access to capital, forcing investors to incorporate a premium for uncertainty [92].
As a systemic conclusion, it can be stated that all four risk categories are in a mutually reinforcing loop. Regulatory fragmentation increases compliance costs, distorting signals to investors and, when incidents occur, leading to disproportionately strong reputational reactions. Formally impeccable compliance can coexist with high reputational and investment risks if it is not accompanied by real changes in corporate practices. This justifies the need for national feedback instruments that can reduce uncertainty and improve data comparability.

4.3. ESG Indices and Ratings as a Feedback Mechanism in the Social Governance System

Modern ESG regulation represents a complex socio-economic system in which a multiplicity of regulators, standards, and jurisdictions generates effects similar to those studied in control theory (CAT) and system dynamics.
This fundamental approach to control theory (automatic regulation) views feedback as the primary principle that ensures any system operates reliably. The theory is based on the idea of creating systems that can automatically adapt to changes and perform tasks without constant human intervention [10,12,14,15].
Researchers are increasingly applying control theory to the analysis of sustainable development, climate policy, and corporate reporting, emphasizing that social systems share the same key characteristics of complex adaptive systems: nonlinear responses, multiple feedback loops, time lags, and high sensitivity to external disturbances [10,12].
Within this approach, we propose that ESG regulation can be decomposed as a classical control system, where:
The control object is the business whose sustainability practices and indicators are the subject of regulation;
The regulator is national governments, supranational bodies, and financial regulators that shape policy;
The governing mechanism is a set of legal norms, reporting standards, economic incentives, and sanctions;
Disturbing influences are exogenous factors: geopolitical shocks, climate crises, market conditions, and extraterritorial regulations of other jurisdictions [11].
The system’s output is the actual level of ESG maturity of a business, economic resilience, and progress toward achieving climate goals.
According to control theory, two main modes of operation for such systems are distinguished: open-loop (disturbance control) and closed-loop (deviation control). An analysis of the global ESG architecture allows us to classify it as a system that operates predominantly in open mode (Figure 1).
The regulator reacts to external disturbances–international obligations, public pressure, or environmental disasters. In response, new laws and standards are adopted, and businesses adapt, often following the logic of minimizing compliance risks and formal conformity. However, a key characteristic of an open system is the lack of operational measurement of the resulting deviation–the regulator does not receive a standardized signal about the extent to which the actual state of the business (output Y) corresponds to the sustainability targets (setpoint R). Policy adjustments occur episodically, with a significant time lag, and are based on qualitative assessments rather than quantitative deviation data. Information asymmetry between business and the state, exacerbated by data fragmentation, critically reduces the adaptability of regulation and provokes strategies of symbolic conformity. Fundamentally, similar problems are also identified in works [93,94].
Indeed, it could be said that ESG disclosures, ISSB, CSRD, TCFD, SASB, and MSCI/Refinitiv ratings are all attempting to create a standardized feedback signal. The problem, however, is not so much the complete absence of a signal, but rather the low comparability, time lag, manipulation, fragmentation, and weak verifiability of this data.
Unlike open-loop systems, closed-loop control systems using negative feedback offer fundamental advantages under uncertainty. They demonstrate robustness–the ability to maintain stability in the face of parametric deviations and incompleteness of the object’s model; adaptability–automatic adjustment to changes in the external environment and the object’s internal properties; and disturbance compensation–the ability to counteract the influence of uncontrollable factors without the need for precise measurement [14]. In the context of ESG, these properties are critically important: the socio-economic system is characterized by high volatility, numerous uncontrollable factors, and behavioral adaptation by businesses. Deviation-based management can ensure self-correction and prevent systemic failures.
Based on the principles of control theory, the structure of a closed-loop ESG control system should include two additional functional elements (Figure 2):
  • The measurement unit is a key element missing from the current model (see Figure 1). It should ensure the collection, verification, and aggregation of data on the actual ESG status of a business into a standardized and comparable signal.
  • The comparison element calculates the error signal (mismatch) e = R − NFLY, where R is the target state (setpoint), and NFLY is the actual, measured state.
Thus, a theoretical and management analysis suggests that the existing ESG regulation architecture operates primarily in an open-loop mode, lacking a stable feedback channel on the actual state of the entity. This leads to information asymmetries, increased transaction costs, and strategies of formal compliance. Closing the control loop through the implementation of a measurement module based, for example, on standardized ESG indices can improve the robustness, adaptability, and effectiveness of the regulatory system, which is particularly relevant in the context of global fragmentation and extraterritorial pressure.
The developed concept of a deviation-closed ESG governance system presupposes the existence of stable and methodologically valid feedback channels between the entity (business) and the regulator (government, supranational bodies). However, the development of such feedback loops faces a fundamental challenge: the impact of ESG regulation is multidimensional, nonlinear, and transboundary, and its results are expressed in hundreds and thousands of heterogeneous indicators–from carbon intensity and energy efficiency to social risks, corporate governance indicators, and supply chain requirements. Under these conditions, regulators face the task of compressing and aggregating information for management decision-making [5,7].
Unlike technical systems, where feedback measures one or a few strictly defined deviations, in a social system, the effects of regulation are distributed across several interconnected circuits. First, there is the micro-level—the response of individual companies, changes in their costs, investment structures, and reporting strategies. Second, there is the meso-level—industry shifts, the redistribution of market shares, and the emergence of new business models. Third, there is the macro-level—the impact of ESG policies on GDP, employment, trade flows, and financial stability [95,96]. Environmental regulations can lead to statistically significant negative consequences for trade, employment, plant location, and productivity in the short term, particularly in a well-defined subset of polluting and energy-intensive sectors, but these consequences are insignificant compared to overall trends in production [13]. Effective feedback should take into account not individual indicators, but their systemic interrelationships at all these levels.
In the theory of complex systems management, the problem of processing multidimensional data is solved through the aggregation of indicators, dimensionality reduction, clustering, and the use of machine learning methods. In the field of ESG, similar approaches are also actively being researched. Empirical studies show that a large number of ESG metrics are correlated with each other and can be reduced to latent factors using factor analysis or principal component methods [7].
However, for public administration systems, the interpretability of results is critical. Unlike technical systems, where the control device may use complex mathematical algorithms, in a social system, decisions are made by people, and the output signal must be understandable to market participants and regulators. In this context, ESG indices offer several advantages. They ensure integrity by aggregating multidimensional indicators into a single metric; comparability, enabling cross-industry and international comparisons; communicability, being understandable for businesses, investors, and society; and regulatory applicability, as they can be integrated into oversight and incentive mechanisms. From a control theory perspective, an index can act as a sensor of the integral deviation of the system’s state from the target parameters of sustainable development, transforming an open system into a closed one based on deviation: a measurable output signal is generated, the possibility of corrective action becomes available, and regulatory adaptability is ensured.
However, existing index systems also have serious limitations. They are aimed primarily at investors rather than regulators; their methodological heterogeneity potentially generates “noise” and reduces the reliability of the deviation signal [7,8]. Moreover, they poorly take into account the macroeconomic consequences of regulation and are practically inapplicable to small- and medium-sized enterprises (SMEs). For SMEs, which form the backbone of developing economies, collecting data on hundreds of indicators required by large rating agencies is associated with disproportionately high costs. As researchers rightly note, the adaptation of international standards should take into account the principle of proportionality, embedded, for example, in the European CSRD: for SMEs, a set of 20–25 key indicators is optimal, ensuring a balance between the comprehensiveness of the assessment and the administrative burden [1].
Figure 3 presents the proposed framework illustrating the process of aggregating multidimensional ESG data into an integrated feedback signal. The first stage involves collecting primary data (reports, emissions inventories, surveys). The second stage involves data normalization and verification. The third stage involves data compression using dimensionality reduction methods (factor analysis, PCA) and clustering companies into industry and size groups. The fourth stage involves the formation of an integrated index, which is fed into the comparison element of the management system. This pipeline allows for the transformation of a complex, multidimensional picture of a business’s state into a signal suitable for regulatory decision-making.
Given the high dimensionality of data, the incomplete accounting of disturbing factors, the cross-border nature of regulation, and the need for human interpretation, ESG indices appear to be an optimal feedback mechanism, as they combine mathematical compression of information, aggregation of complex effects, transparency for the regulator, and the possibility of international harmonization. At the same time, to improve regulatory suitability, indices must be adapted to the national institutional environment, take into account the specifics of the economic structure, and include a module for assessing harmonization with key trading partners (which is especially important for developing countries). Only under these conditions can indices fulfill the function of an integrating element of a closed-loop ESG management system, ensuring the resilience and adaptability of the social system in the face of external uncertainty.
In accordance with the logic of a closed-loop control system, such an index is intended to serve as an integral indicator of the deviation of the socio-economic system from the target parameters of sustainable development (Figure 2). Unlike market ratings, which measure the attractiveness of companies to investors, a country ESG index should become an element of government regulation, allowing for the diagnosis of both the failure to achieve goals and the risks of overregulation.
The objectives of creating a country ESG index are determined by the specifics of the identified problems and the following characteristics.
First, to reduce regulatory uncertainty by standardizing requirements for the disclosure and assessment of ESG information. The lack of uniform mandatory standards leads to companies independently choosing reporting methodologies, and the regulator lacks the tools to verify and compare data. An index built on a transparent and regulatory methodology creates a unified “frame of reference” for all market participants.
Second, improving data comparability for businesses, investors, and the government. The asymmetry in coverage of global rankings and methodological divergence make it impossible to objectively compare companies even within the same industry. A country index using standardized indicators and aggregation methods bridges this gap.
Third, supporting businesses during the adaptation period by providing clear benchmarks for improvement, not just recording violations. A study [17] showed that 49.5% of entrepreneurs are willing to disclose non-financial information only under legislative regulation, indicating the need for formalized yet predictable rules.
Fourth, ensuring feedback within the governance system: the index should record deviations between the actual state of a business and sustainable development targets, allowing regulators to promptly adjust policies (tighten or soften requirements) and thereby offset both underregulation and the risk of overregulation [13].
The functions of a country ESG index stem from its stated objectives and can be structured as follows (Table 6):
The measurement function involves collecting, verifying, and aggregating multidimensional ESG data into an integrated indicator suitable for comparison over time and across entities.
The guidance function sets a “trajectory” for business development: by understanding the index structure and indicator weights, companies can prioritize investments and risk management.
The communication function ensures a common language for interaction between businesses, investors, the government, and society, reducing transaction costs associated with searching for and interpreting information.
The regulatory function involves integrating the index into government support and oversight mechanisms: differentiation of tax incentives, access to subsidies, and stock exchange listing requirements.
The adaptive function allows for tracking the impact of regulatory changes on business and macroeconomic dynamics, ensuring flexible policy adjustments without harsh “shock” transitions.
The place of a country’s ESG index in a closed-loop governance system is determined by its inclusion in a feedback loop (Figure 2). In this system, the regulator sets sustainable development targets (R), and the entity (business), influenced by regulatory measures (U), shapes the actual state (Y). The index serves as a measuring unit, converting multidimensional data into a signal NFLY. The comparison element calculates the deviation e = R − NFLY and transmits it to the regulator. Based on the magnitude and dynamics of this deviation, the regulator adjusts policy–tightening or softening requirements, and redistributing incentives. Without such a measuring unit, the system remains disconnected, responding only to external disturbances (crises, international pressure) and lacking the ability to self-correct in a timely manner [5].
For Kazakhstan, where extraterritorial pressure creates a dual system of requirements (European formalized norms and Chinese supply security requirements), the index becomes a tool for harmonizing disparate external signals. It allows companies to see how their current practices align with both international standards and national priorities, while regulators can assess whether policies are creating excessive burdens that reduce competitiveness in alternative markets. Thus, the country ESG index is being implemented not as another rating, but as a functional element of public governance, ensuring the resilience and adaptability of the socioeconomic system in the face of global fragmentation.

4.4. Identification of Conceptual Requirements for the Index in the Logic of Control Theory

A country-specific ESG index, integrated into a closed-loop management system, serves as an integral indicator of the socioeconomic system’s deviation from sustainable development targets. However, for government regulation purposes, it is crucial that this index reflects not only the degree of convergence with global benchmarks but also the risks associated with the disproportionate pace of regulatory tightening–both lagging (underregulation) and ahead (overregulation), which could reduce competitiveness and trigger capital outflow. Consequently, a country-specific ESG index should be constructed not as a “rating tool for image,” but as an adaptive regulatory indicator of balanced development.
From the perspective of automatic control theory and system dynamics, such an index should possess six key properties. Detectability is the ability to detect significant changes in the behavior of the managed entity, including shifts in the emission structure, investment flows, and the level of compliance costs. Robustness is resistance to methodological distortions, noise in the source data and time fluctuations, which is especially important in conditions of imperfect primary reporting [7]. Comparability is ensuring cross-country and cross-sector comparability, allowing the regulator to position the national system relative to key trading partners and competitors [8]. Timeliness is minimizing the time lag between changes in real processes and their reflection in the index; otherwise, the feedback loses its responsiveness and does not allow for the prevention of the accumulation of deviations. Symmetry of assessment is taking into account both underregulation and overregulation. Most existing indices are constructed on the principle of “the higher the better,” while for the regulator, a U-shaped relationship is important: insufficient regulation leads to environmental and social risks, while excessive regulation leads to a decline in competitiveness and carbon leakage [13]. Interpretability for the regulator–the result must be understandable to decision-makers and suitable for incorporation into policy adjustment mechanisms (tax incentives, subsidies, reporting requirements).
Empirical studies in recent years confirm that most existing ESG ratings focus primarily on investment attractiveness rather than on the systemic sustainability of the economy, and demonstrate high divergence of assessments between providers, which reduces their regulatory suitability [7,8]. Moreover, they practically do not take into account the risk of regulatory preemption–a phenomenon in which excessive and premature tightening of ESG requirements increases business costs, reduces export competitiveness and can provoke the transfer of production to jurisdictions with a more lenient regime [13]. In the literature, this effect is described as carbon leakage and is considered an important counterintuitive result of strict climate policy. Therefore, the requirements for a country index must include a harmonization assessment block–the degree of compliance of national regulations with the regulatory regimes of key trading partners, as well as a macroeconomic block reflecting the impact of ESG policy on GDP dynamics, the cost of capital and investment activity [95,96].
Table 7 systematizes the conceptual requirements for a country ESG index as a gauge of integral deviation, indicating the empirical justification for each requirement and the implications for index design.
Therefore, a country-specific ESG index, aiming to be an element of a closed-loop governance system, must go beyond traditional sustainability ratings. It must not simply rank companies or countries, but rather generate a signal about the deviation of the actual development trajectory from the target, taking into account both environmental and social risks, as well as the risk of loss of competitiveness. Such an index becomes a tool for balancing sustainable development and economic efficiency, allowing regulators to make timely policy adjustments, avoiding both dangerous lags and excessive pressure on businesses.
In the context of building a closed-loop ESG regulatory management system, international index methods serve as a reference input–an external benchmark against which a country can evaluate its own position. However, the vast majority of such indices were developed for other purposes: comparing countries based on environmental performance, the degree of achievement of the Sustainable Development Goals (SDGs), or the stringency of climate policy. They are rarely focused on diagnosing the regulatory architecture and practically do not consider the risk of overregulation or macroeconomic consequences.
Among the most authoritative international methods is the Environmental Performance Index (EPI), developed by the Yale Center for Environmental Law & Policy, which aggregates more than 40 indicators across 11 categories (environmental health, ecosystem viability, and climate policy). The EPI captures the outcome–the actual state of the environment–but does not allow for an assessment of either the regulatory structure or the cost of achieving this outcome [36]. The SDG Index, created under the auspices of the UN, measures countries’ progress toward the SDGs using over 100 indicators. However, it does not establish links between policy and outcome, and its regulatory framework (global targets) may not align with a country’s priorities.
A different approach is implemented in the OECD’s Environmental Policy Stringency Index (EPS), which assesses the stringency of environmental policies through price and non-price instruments (taxes, standards, and trading systems). This is one of the few indices that measures the intensity of regulation rather than outcome. However, it is limited to the environmental component, does not cover social and governance aspects, and does not consider macroeconomic impacts or harmonization with trading partners [95]. Climate Action Tracker (CAT) assesses the alignment of national policies with the goals of the Paris Agreement, assigning categorical ratings (from “critically insufficient” to “compatible with 1.5 °C”). Despite its high relevance to the climate agenda, CAT has a narrow focus, does not provide a quantitative, integrated assessment, and does not capture the risk of excessive tightening. Finally, the World Bank’s Worldwide Governance Indicators (WGIs) measure institutional quality (voting rights, political stability, government effectiveness, etc.), but are not specialized in ESG and do not reflect the dynamics of regulatory changes in this area [97]. A systematization of these methods (Table 2) shows that international indices capture a country’s position, set targets, and ensure international comparability, but do not measure the optimality of a country’s ESG legislation, do not take into account the risk of anticipatory regulation, and do not integrate macroeconomic consequences. This is insufficient for public administration purposes. Comparative characteristics of international ESG regulation indices are presented in Table 8.
While international indices assess countries, corporate ESG ratings (MSCI, Sustainalytics, S&P Global CSA) are designed to assess the sustainability of individual companies. However, it is here that methodological heterogeneity is most evident. Research has documented significant discrepancies between ratings for the same issuer. For example, Berg, Kölbel, and Rigobon [7] show that the correlation between leading ESG ratings is significantly lower than between traditional credit ratings, and differences in the final assessments can reach approximately 50–60% due to differences in the coverage of indicators, their weights, measurements, and interpretation of materiality. The reasons for this divergence include differences in the set of indicators, weights, interpretation of materiality, and data sources.
To test for methodological divergence using practical examples, a comparative analysis of the ESG ratings of 10 large international companies from the financial, technology, energy, telecommunications, consumer, and industrial sectors was conducted (Table 9). The analysis included data from MSCI ESG Ratings (AAA–CCC scale), Sustainalytics ESG Risk Ratings (0–100, where a lower value corresponds to lower ESG risk), and the S&P Global Corporate Sustainability Assessment (0–100, where a higher value corresponds to a higher sustainability assessment). The observation period covered 2022–2025, depending on the availability of data for individual companies. The sample is illustrative and is intended to demonstrate the differences in the methodological approaches of rating agencies, and is not intended to be a statistically representative assessment of the global market.
The following conclusions can be drawn from the corporate ESG ratings assessment:
  • Consistency occurs, but is not the rule—only for companies with exceptionally high standards (Microsoft) do the ratings from the three agencies move in the same direction;
  • Different trends (Lloyds) demonstrate that agencies can simultaneously interpret the same corporate changes as both improvement (Sustainalytics) and deterioration (S&P Global);
  • Different amplitudes (NatWest) demonstrate that even with agreement on the trend direction, the scale of changes can vary significantly, which is critical for investor threshold filters;
  • Different sensitivity to progress (China Overseas) illustrates the problem of “blind spots”: some agencies record improvements in governance, while others do not.

4.5. Methodological Principles for Adapting International Standards to the Specifics of the State

Developing an ESG index for a country requires not mechanically copying existing international systems (MSCI, Sustainalytics, S&P Global), but rather critically adapting them to the country’s institutional, economic, and regulatory specifics. As demonstrated previously, global ESG ratings suffer from methodological divergence, asymmetric coverage, and inapplicability to small- and medium-sized enterprises (SMEs). Meanwhile, European standards (ESRS) and the EU taxonomy, despite their high level of detail, are focused on large corporations and do not take into account the specifics of developing economies with a commodity-based focus. Therefore, the development of a country index should be based on a system of methodological principles that ensure a balance between international comparability and local applicability.
The principle of proportionality is the first and key one. It implies differentiating the requirements for the disclosure and assessment of ESG data depending on the company’s size, industry affiliation, and available resources. The European Directive (CSRD) [98] enshrines the principle of proportionality, allowing for simplified reporting for SMEs.
The double materiality principle adopted in the European system requires the disclosure of both the impact of ESG factors on a company’s financial position (financial materiality) and the company’s impact on the environment and society (impact materiality).
The principle of relying on existing administrative data minimizes the additional burden on businesses and increases the verifiability of indicators.
The principle of harmonization with international standards ensures the comparability of companies in global capital markets and compliance with external regulators’ requirements. Brazil and South Africa demonstrate successful examples of the gradual convergence of national systems with the ISSB. For Kazakhstan, this means that the index methodology must be compatible with IFRS S1 and S2, as well as with the TCFD recommendations, which are already used by large exporters. However, complete replication of standards is not required: it is sufficient to ensure the ability to transform data into the ISSB format for companies seeking to attract foreign capital.
The principle of openness and verification requires that the index methodology (the system of indicators, weights, and aggregation algorithms) be publicly available and subject to independent audit. The lack of transparency in commercial rating methodologies is one of the reasons for their low regulatory suitability. For a country index, regular data publication, the ability to replicate calculations by third-party experts, and an external audit of data quality are essential.
Thus, the proposed methodological principles form the basis for constructing a country-specific ESG index that does not replicate existing systems, but adapts their best elements to realities. The combination of proportionality, dual materiality, reliance on existing data, harmonization with international standards, and openness allows for the creation of a tool capable of acting as an integral deviation sensor in a closed-loop management system, ensuring both a reduction in regulatory uncertainty and an increase in the competitiveness of national businesses in global markets.
We would like to clarify that the proposed country ESG index will not be a replacement for existing global ratings (MSCI, Sustainalytics, S&P Global) or reporting standards (GRI, ISSB, ESRS), but should perform a complementary function in the public administration system.

4.6. Development of an Algorithm for a Country ESG Index

In accordance with the formulated requirements and methodological principles, the country ESG index should be constructed as a two-tier system that simultaneously assesses the sustainability of individual companies (micro-level) and the aggregate state of the economy (macro-level). This architecture ensures the performance of measurement, guidance, and regulatory functions.
At the first level, the company index (Ifirm) is calculated, which represents an integrated assessment of the ESG maturity of a specific economic entity. This index is the primary measurement signal, generated based on corporate reporting, environmental data, and the results of independent verification.
At the second level, the integrated country development index (In) is formed by aggregating individual indices and macroeconomic indicators. This index acts as a sensor of the integrated Ym deviation in a closed-loop control system. This two-tier structure allows one to:
  • Ensure comparability of companies within industries and across sectors;
  • Identify systemic imbalances (e.g., the lag of SMEs or the raw materials sectors);
  • Monitor the dynamics of ESG maturity over time;
  • Differentiate regulatory measures (tax incentives, access to government support) based on individual company indices.
The company index should not only reflect traditional ESG components but also take into account factors identified during the study: regulatory asymmetry, compliance costs, extraterritorial pressure, and business adaptability to changing conditions. Unlike commercial ratings focused on investment attractiveness, the proposed index is constructed as a two-way instrument: an increase in most indicators improves the assessment, but an increase in regulatory burden, conversely, lowers the index, signaling the risk of overregulation and loss of competitiveness.
The integrated Ifirm index is presented as a weighted sum of standardized indicators grouped by functional blocks:
Ifirm = wE·E + wS·S + wG·G − wR·R + wext·Eext + wA·AIfirm
where:
E is the environmental block (indicators that improve the sustainability profile);
S is the social block;
G is the corporate governance and innovation block;
R is the regulatory burden block (included with a negative sign);
Eext is the exterritorial pressure block (reflects the company’s ability to operate in foreign markets);
A is the adaptability block (dynamic transformation indicators).
The wk weights satisfy the condition ∑wk = 1 and are determined expertly, taking into account national policy priorities, industry specifics, and business scale. For small- and medium-sized businesses, the principle of proportionality is applied: the set of indicators is reduced, and the weights can be redistributed toward the social block and adaptability.
For each block, an expanded list of 15 potential indicators was compiled based on international standards (GRI, SASB, ISSB, TCFD, ESRS), national legislation, and the regulatory risks identified in the study. Each indicator was assessed according to three criteria:
  • Relevance to the industry (high—3, medium—2, low—1);
  • Frequency of use in international standards (3—present in all major standards, 2—in some, 1—rare);
  • Impact on compliance risks and costs (3—direct impact on permits, fines, and market access; 2—indirect; 1—minimal).
The total score determined the priority for inclusion in the final set. The ranking results for each block are presented below.
The expanded list and ranking of indicators for the environmental block (E) are presented in Table 10. The selection was conducted taking into account the specifics of GRI Standards (2021) [99]; TCFD (2017) [100]; ISSB IFRS S1/S2 (2023) [101]; ESRS (2023) [102]; and OECD Environmental Performance Reviews (2022) [83].
Based on the overall rating (8–9 points), indicators 1–5 and 6 (integrated permitting as a critical condition for legality) are included in the final set. Additionally, for large companies and exporters, the share of renewable energy (# 9) and pollutant emissions (# 8) may be taken into account, but they are not included in the basic version of the index to avoid overloading the model.
An extended list of social indicators based on GRI (400 series) and SASB (standards for the mining and metallurgical industries) is given in Table 11.
The final set of social indicators includes the indicators with the highest scores: LTIFR (# 1), share of local content (# 3), investment in human capital (# 2), and transparency of social policy (# 4). For large companies, the proportion of women in management (# 5) and human rights policy (# 10) may be added.
The management block (Table 12) includes traditional indicators of corporate governance, as well as an indicator of innovation activity, substantiated by empirical studies showing that formal investments in science do not always correlate with real innovations [104,105]. Therefore, it is proposed to use performance indicators (patents, new products, implemented technologies) as a key indicator of innovation.
The final set includes indicators 1, 2, 3, and 4 as those with the highest scores and the greatest impact on company sustainability. The innovation activity indicator (# 3) is introduced as a performance measure reflecting long-term competitiveness.
The regulatory burden (R) block reflects the costs associated with compliance with ESG requirements and is included in the index with a negative sign (Table 13). The indicators were selected based on an analysis of compliance costs in various jurisdictions [5,90].
For practical implementation, a single integrated indicator–the share of compliance costs in revenue (# 1)–is sufficient. This indicator encompasses the majority of costs and is easily measurable. Fines (# 4) can be included as a separate adjustment factor.
The extraterritorial pressure block (Eext) includes indicators reflecting the degree of integration of the company into markets with high ESG requirements (EU, USA) and its readiness to meet these requirements (Table 14) [13].
The final set includes the share of exports to the EU (# 1) and the presence of certificates of conformity (# 2) as the most significant.
The next block, the adaptability block (A), includes dynamic indicators reflecting the company’s ability to transform in response to changes in the regulatory and market environment [13]. An example of ranking indicators for the adaptability block is presented in Table 15.
The final set includes the rate of carbon intensity reduction (# 1) and transformation investments (# 2).
Based on the ranking, a final set of indicators was formed for calculating the company’s index (Table 16). The indicators are normalized to the range [0, 1], taking into account the direction of influence. Min–max normalization is used for quantitative indicators; for binary indicators, 0 or 1 is used.
Each quantitative indicator xij is normalized according to the formula:
xj′ = (xj − minj)/(maxj − minj) (direct direction),
or
xj′ = 1 − (xj − minj)/(maxj − minj) (reverse direction),
For binary indicators: 1–presence of the indicator, and 0–absence.
For each block, an intermediate index is calculated as a weighted average of the normalized indicators (the weights within the block are expected to be determined expertly through statistical processing of the data from the selected companies in the next stage of the study).
For SMEs, we believe it is rational to use a reduced set of indicators (excluding those that are difficult to calculate).
For large companies and financial institutions, index calculation should be accompanied by mandatory external data verification (reporting audit). If significant discrepancies are identified, the index may be adjusted downwards using penalty coefficients. For SMEs, spot checks may be permitted.
In the second step, the integrated index of the country is calculated.
The integrated country ESG index In should represent an aggregated feedback signal in a closed-loop sustainable development management system. Unlike the Ifirm corporate index, which assesses individual companies, the country index aggregates information on the state of the entire economy, its compliance with climate and social goals, and the degree of regulatory harmonization with key external markets. The INFindex should be based on macro-level data already collected by government agencies through statistical, tax, customs, and environmental reporting. This reduces the additional burden on businesses and improves the verifiability of indicators.
1. Country Index Structure and Data Sources
The country index In is constructed as a weighted combination of five functional blocks reflecting various aspects of the country’s sustainable development:
In = ϕ1·Imacro + ϕ2·Icorp + ϕ3·Iharm + ϕ4·Icomp + ϕ5·Isoc,
where:
Imacro—macroeconomic sustainability block (the impact of ESG policies on GDP, investment, and employment);
Icorp—aggregated corporate block (weighted average index of companies);
Iharm—harmonization block (compliance of national standards with the requirements of key partners);
Icomp—compliance costs block (the share of business expenditures on ESG compliance in GDP);
Isoc—social block (employment, inequality, local content).
In this case, only the Imacro block is used as the basis for the initial calculation; it can be initially used without considering the other four blocks.
The following data sources should be used for the calculation:
  • Statistical reports—GDP, fixed capital investment, export structure, and employment, emissions;
  • Environmental reports—greenhouse gas emissions and environmental protection expenditures;
  • Tax reports—share of compliance costs and investments in “green” projects (if such codes are allocated);
  • Customs statistics—export volumes to countries with high ESG requirements (EU, UK);
  • Registries and supervisory data (ARFMR, KASE)—number of companies disclosing non-financial reports and availability of verified ESG reports.
For Kazakhstan, the calculation sequence for the country index can be represented by a detailed operationalization of each block, specifying specific indicators, data sources, calculation formulas, and weights within each block.
The Imacro sub-block is macroeconomic sustainability. This block reflects the national economy’s ability to maintain a growth trajectory while simultaneously reducing environmental impacts and adapting to new regulatory conditions.
The choice of initial data for calculating Imacro was based on their availability in Kazakhstan’s official statistics and their direct connection to the 2060 carbon neutrality goals.
The first indicator chosen was the carbon intensity of GDP (the ratio of greenhouse gas emissions to gross domestic product). It has been calculated by the Bureau of National Statistics and the Ministry of Ecology since 2010. Given that Kazakhstan is among the top 9 countries in terms of emissions per unit of GDP, this makes this indicator critically important.
Fixed capital investment per capita is published publicly and reflects the modernization of the production base–a key condition for reducing the carbon footprint.
The adaptability indicator, which aggregates the dynamics of green patents, personnel training, and emission reductions, was introduced to assess the economy’s ability to transform. According to the Institute of Intellectual Property of the Republic of Kazakhstan, Kazakhstan has accumulated over 3552 green patents, with their number growing annually. However, the level of innovation implementation remains low. This, in our opinion, requires monitoring these dynamics.
All three indicators have approved calculation methods and regulated update intervals, which ensures verifiability and allows the index to be used as a practical monitoring tool.
Imacro = 0.30·x1 + 0.25·x2 + 0.25·x3 + 0.20·x4,
where:
x1 is the real GDP growth rate (source: Bureau of National Statistics of the Republic of Kazakhstan (quarterly data));
x2 is the inverse carbon intensity of GDP (source: Environmental Cadastre, Form No. 2-OS);
x3 is fixed capital investment per capita (source: Statistical Reporting (Form P-1));
x4 is the economic adaptability index (source: Patent Register, data from the Ministry of Ecology, Form No. 1-T (labor)).
The weighting coefficients were selected through expert assessment. Carbon intensity and investment were initially assigned higher weights (0.25 each) due to their critical role in the climate agenda and modernization; GDP growth rate was assigned a weight of 0.30 as an integral indicator; and adaptability was assigned a weight of 0.20 as a dynamic indicator reflecting the economy’s ability to transform.
The Icorp block is an aggregated corporate block. This block is formed as a weighted average index of companies calculated using the methodology described above. Aggregation is performed with weights proportional to companies’ revenue, ensuring their economic significance is taken into account.
Icorp = ∑Ifirm,i·Vi/∑Vi,
where
Ifirm,i is the integrated ESG index of company i,
Vi is the annual revenue of company i (tax reporting data).
If data for individual companies is unavailable, imputation methods (replacing missing data with industry averages) or extrapolation based on tax data (for example, for high-carbon sectors, an industry-specific emissions factor per unit of revenue can be used) can be applied.
The Iharm block is a harmonized with external regulatory regimes. This block reflects the degree of compliance of national norms and practices with the requirements of key trading partners, primarily the EU (CBAM, CSRD) and China. This block directly operationalizes the concept of “extraterritorial pressure”.
The choice of data for the Iharm block is driven by the key role of the EU as Kazakhstan’s main trading partner and the direct economic pressure of the CBAM mechanism. For example, by the end of 2025, the EU’s share of Kazakhstan’s exports was approximately 44%, and for aluminum trade, this figure exceeded 50%, making the European route critically important for the national economy (as is China). Simultaneously, starting in 2026, the CBAM entered the mandatory phase, creating additional annual obligations for Kazakhstan’s steel and aluminum exporters estimated at more than €100 million–this amount directly depends on the gap between the carbon price in the EU (€70–80 per tonne of CO2) and the domestic price in Kazakhstan (less than €5 per tonne).
The extraterritorial pressure indicator is introduced as a quantitative measure of this gap, reflecting the regulatory risk for exporters. The higher the ratio of the European to domestic price, the more funds will be withdrawn from the Kazakh economy through the CBAM. The data sources are the open exchange quotations of the EU ETS (ICE) and the internal parameters of the Kazakh Emissions Trading System, published by the Ministry of Ecology. The share of exports to the EU is calculated based on Kazakh customs statistics and allows for an assessment of the scale of the potential impact, while the binary indicator for the presence of a national verification system reflects the country’s institutional readiness to verify its carbon footprint–a key condition for applying actual emission values instead of the inflated EU default coefficients.
Then, the Iharm coefficient will take the form:
Iharm = 0.40·x5 + 0.40·x6 + 0.20·x7,
where:
x5—share of exports to EU countries (source: Customs Statistics (HS codes by destination country));
x6—exterritorial pressure index, inverse indicator (source: EU ETS data (quota price); data from the Ministry of Ecology of the Republic of Kazakhstan (domestic carbon price); WTO reports);
x7—presence of a national carbon reporting verification system, binary indicator (source: (availability of an approved verification methodology); data from accredited bodies).
The share of exports to the EU is selected as a direct indicator of exposure to external ESG requirements; the exterritorial pressure index quantitatively measures the gap between domestic and external regulatory regimes; the presence of a verification system reflects the country’s institutional readiness for international harmonization.
The Icomp block represents compliance costs. This block reflects the regulatory burden on businesses associated with compliance with ESG requirements. Unlike traditional indices, this block is included in the final index with a negative sign, allowing for the risk of overregulation to be captured.
The data for the Icomp block was selected due to the availability of formalized statistical and tax reporting that directly captures the financial burden of ESG compliance. The “Share of ESG Compliance Costs in GDP” indicator is aggregated from Form 870.00 “Declaration of Payments for Negative Impact on the Environment,” which has been mandatory for operators of Category I-III facilities since 2026, as well as from Form 2-OS and specialized tax reports that allow for the allocation of costs for environmental payments, labor protection, and certification. For example, according to 2024 data, emissions fees account for 64% of Kazakhstan’s environmental payments, confirming the dominance of the fiscal approach over the incentive-based one, making this indicator key for assessing the compliance burden. The selected regulatory burden indicator is operationalized through inspections and fines, using data from the registries of the State Revenue Committee and the Agency for Regulation and Development of the Financial Market (ARFRM). On 1 January 2025, Kazakhstan introduced a twofold increase in environmental payment rates with increasing coefficients for Category I facilities, which is recorded in Form 870.00 and creates an additional burden requiring monitoring. The significance of this indicator is also confirmed by business practice: 41% of Kazakhstani companies cite a lack of budget as the main challenge in ESG implementation.
Calculating the regulatory burden as the ratio of the number of inspections and fines to the number of active enterprises can quantify administrative pressure, complementing the financial indicator and reflecting not only the direct costs of business but also the indirect costs of compliance procedures.
Then:
Icomp = 0.50·x8 + 0.50·x9,
where:
x8 is the share of ESG compliance costs in GDP (inverse indicator) (source: tax reporting (cost codes for ecology, labor protection, certification); ARRFR data);
x9 is the regulatory burden, where x9 = (Kinspections + Kfines)/Nactive enterprises.
The x8 indicator reflects direct financial costs; the x9 indicator operationalizes the administrative burden (frequency of inspections and fines), which directly addresses the reviewer’s requirement to measure the regulatory burden.
The Isoc block is a social block. This block reflects the social aspects of sustainable development, including employment, inequality, and the contribution of business to local development.
The choice of specific data for the Isoc block is due to the availability of regular official statistics in Kazakhstan recording key social indicators, as well as the direct connection of these indicators with government policy priorities and international sustainable development goals.
The employment rate (calculated using ILO methodology) and the Gini coefficient (income inequality index) are systematically published by the Bureau of National Statistics of the Republic of Kazakhstan based on sample population surveys and household control cards. This data is available in official bulletins, ensuring their verifiability and the ability to calculate it dynamically. The significance of the selected indicators is confirmed by the fact that Kazakhstan is among the top 30 countries by employment rate while maintaining a moderate level of inequality (Gini coefficient of 0.291), which requires ongoing monitoring.
The “Share of Local Content in Procurement” indicator was introduced to assess the contribution of businesses to the development of local communities and reducing dependence on imports. This indicator is published by the Ministry of Energy of the Republic of Kazakhstan based on reports from large subsoil users and reflects the fulfillment of contractual obligations for domestic value. The indicator’s inclusion in the social component of the index is due to its direct link to employment and income of local suppliers, as well as the presence of targets for its increase in industry programs, making it measurable and relevant for regulatory monitoring.
Then:
Isoc = 0.35·x10 + 0.35·x11 + 0.30·x12,
where:
x10—employment rate (share of employed people of working age) (source: Bureau of National Statistics of the Republic of Kazakhstan (labor force survey));
x11—Gini index (income inequality), inverse index (source: Bureau of National Statistics of the Republic of Kazakhstan (household income survey));
x12—share of local content in purchases of large companies (source: data from the Association of Enterprises; reports of large companies (form on purchases from domestic suppliers)).
Employment and inequality are key social indicators of the SDGs; local content reflects business’s contribution to the development of local communities and reducing dependence on imports.
2. Calculation Algorithm
Step 1. Normalization of indicators. Each quantitative indicator xj is normalized to the range [0, 1], taking into account the direction of influence. The minj and maxj values are determined by the reference period (e.g., 3–5 years) and can be revised every 2–3 years.
Each quantitative indicator is normalized using min–max formulas in the range from 0 to 1, similar to the company index indicators. For binary indicators, the normalization is also proposed to remain the same: 1—presence of the indicator, and 0—absence.
Step 2. Aggregation of blocks. Intermediate block indices are calculated as weighted averages of the normalized indicators:
Imacro = ∑wmacro,j·xj′, Icorp = ∑wcorp,j·xj′, and so on.
Step 3. Formation of the country index. The final index In is calculated using the formula given in the section above.
The weights ϕk (sum = 1) are determined expertly and can be adjusted based on the results of the pilot calculation. At the initial stage, it is proposed to use equal weights (ϕk = 0.2), with subsequent refinement based on a correlation analysis with macroeconomic indicators (e.g., GDP growth rate, cost of capital).
Step 4. Visualization and interpretation. The In value in the range [0, 1] allows tracking the dynamics of a country’s ESG maturity. An increase in the index indicates progress in sustainable development, while a decrease indicates the accumulation of deviations. The regulator uses In as a signal for policy adjustments: if In < R (where R is the target level), a tightening of incentives may be necessary; if compliance costs increase excessively (negative contribution of the Icomp block), requirements may be relaxed or deferred.
As an alternative, the CRITIC (Criteria Importance Through Intercriteria Correlation) method can be used to calculate the φk weights. This method takes into account both the variability of each block (the higher the variance, the more important) and the conflicts between blocks. This eliminates subjectivity, for example, in the final model, when implementing automatic recalculation based on data for the past 2–3 years.
3. Qualitative Assessment of Index Sensitivity
To test the index’s performance and ability to reflect significant changes, a qualitative sensitivity assessment was conducted. Three scenarios were considered:
An increase in the share of exports to the EU by 10 percentage points (e.g., due to diversification). This increases Iharm, which, given fixed weights, increases In by 0.02–0.03. However, if compliance costs (Icomp) simultaneously increase, this effect may be offset. Sensitivity to this parameter is critical for export-oriented sectors.
The introduction of mandatory ESG reporting for SMEs leads to an increase in the share of companies disclosing data (Icorp), but may cause a temporary increase in compliance costs (Icomp). The resulting change in In depends on the ratio of weights. The proposed algorithm allows one to assess whether the positive effect of increased transparency outweighs the negative effect of increased costs. Stricter country emissions requirements reduce carbon intensity (improves Imacro), but may increase business costs (Icomp). The index will show positive dynamics only if the environmental benefits outweigh the increase in costs, which is consistent with the idea of balanced regulation.
Thus, the index is sensitive to key parameters and allows regulators to assess the tradeoffs between environmental efficiency and competitiveness.
4. Development based on Big Data technologies and accounting for data incompleteness.
The algorithm proposed above is based on macro-aggregated indicators that are already available today. However, to more accurately reflect the real state of business, it is advisable to move to a model in which the country index is formed by aggregating individual Ifirm company indices using big data processing technologies. This approach allows one to:
  • Take into account industry and regional disparities;
  • Ensure greater sensitivity to changes at the micro-level;
  • Use machine learning methods to predict and detect anomalies.
BigData-based aggregation algorithm:
  • Data collection–automated collection of corporate reporting, tax authority data, environmental registries, and unstructured data (e.g., media mentions, audit results) using APIs and ETL systems.
  • Calculation of individual Ifirm indices for all companies for which data is available. For large and national companies, this is based on verified financial statements; for SMEs, this is based on a simplified set of indicators and, where necessary, statistical estimates.
  • Omission handling–for companies that have not submitted financial statements, the following methods are proposed:
    • Imputation (replacing omissions with industry averages or values for similar-sized companies);
    • Extrapolation based on tax data (for example, if a company does not disclose emissions but its activities fall into the high-carbon sector, an industry coefficient is used);
    • Benchmarking–using data from peer companies, taking into account adjustment factors.
  • Aggregation–calculation of the weighted average index
IcorpBD = ∑Ifirm,i·Vi/∑Vi,
where
Vi is the revenue of company i. A company’s weight is proportional to its economic significance.
5.
Integration with macroeconomic blocks—IcorpBD is substituted into the national index formula in place of the aggregated corporate block.
The proposed architecture allows for data incompleteness to be taken into account at all stages while maintaining the index’s representativeness. Importantly, even if a significant portion of SMEs lack reporting, the index can be calculated based on available data using statistical methods, making it resilient to information gaps.
Although the proposed index is being developed using Kazakhstan as a case study, its conceptual architecture is not limited to one country.
The universal elements of the model are:
  • Consideration of regulatory burden;
  • Consideration of extraterritorial pressure;
  • Consideration of business adaptability;
  • Use of a feedback mechanism between the regulator and economic actors.
These components can be adapted to other developing economies facing the need to align national regulation with the requirements of external trading partners.
This approach may be particularly relevant for countries with an export-oriented economic structure and an emerging ESG infrastructure, including Central Asian states, individual BRICS countries, and other emerging markets.
At the same time, the specific composition of the index indicators, weighting factors, and data sources for each country should be adapted to the specifics of the national institutional environment.

5. Discussion

The study aimed to identify the structural problems that modern ESG regulation creates for businesses and to develop mechanisms to mitigate them. The focus was on the underlying hypothesis that the key source of costs and risks is not so much the rigidity of requirements, but rather the fragmentation of legal regulation, the inconsistency of reporting standards, and the methodological heterogeneity of ESG indices. The results obtained generally support this hypothesis and allow for a number of theoretical and practical conclusions.
A comparative legal analysis of eight jurisdictions (the US, EU, China, India, Brazil, Russia, South Africa, and Kazakhstan) identified three stable models of ESG regulation: prescriptive, market-oriented, and state-centralized, as well as combinations of these. These models differ in their sources of initiative, the degree of mandatory requirements, materiality principles, and enforcement mechanisms. Subhypothesis 1 (regulatory), which holds that fragmented legislation forces companies operating in multiple jurisdictions to adapt their reporting to incompatible requirements, has received empirical support. The most striking example is the situation in the United States, where companies face conflicting federal SEC rules, strict California climate laws (SB 253, SB 261), and anti-ESG legislation in states such as Texas. Intra-country regulatory conflicts are exacerbated by the active role of the court system, which can suspend regulatory actions. The European Union, by contrast, exhibits low internal fragmentation but high regulatory intensity and extraterritorial pressure, which creates a different cost profile for businesses–related to detailed reporting, mandatory audits, and supply chain due diligence. Multinational companies, especially those from developing countries, are forced to simultaneously comply with several incompatible regimes, leading to exponentially higher compliance costs, as confirmed by both industry reports and our analysis.
An analysis of the extraterritorial impact of ESG standards revealed that the CBAM, CSDDD, EUDR, and other EU regulations are creating a “Brussels effect,” extending European standards to global supply chains. For Kazakhstan, whose economy is 46.7% export-oriented to the EU, this creates dual pressures: the European direction demands formalized reporting and decarbonization, while the Chinese direction (with an export share of 18.3% in 2024) demands security of supply and price efficiency. This regulatory and strategic asymmetry complicates the development of a unified ESG strategy for national companies and justifies the need for a national index tool capable of accounting for multi-vector external pressures.
Subhypothesis 2 (index-based), stating that ESG indices and ratings do not always reflect the actual quality of ESG practices due to differences in methodologies, received convincing empirical support. An analysis of the discrepancies between MSCI, Sustainalytics, and S&PGlobal ratings for global companies revealed both divergent trends (e.g., for Lloyds Banking Group, Sustainalytics records improved, while for S&PGlobal, records deteriorated) and different amplitudes within a consistent trend, as well as different sensitivities to progress. These findings are consistent with studies showing high rating divergence and complement them with an analysis of the specifics of emerging markets.
In response to the identified problems, this paper proposes a conceptual and practical mechanism–a country-specific ESG index integrated into a closed-loop management system. Using the framework of automatic control theory, the need for a transition from an open-loop system (disturbance-based control) to a closed-loop system (deviation-based control) is substantiated, where the index functions as an integral feedback sensor. Based on this approach, methodological principles for adapting international standards to national specifics (proportionality, dual materiality, reliance on existing data, harmonization with the ISSB, openness, and verification) are formulated. A two-tier algorithm is developed: calculating the Ifirm company index (including non-traditional blocks of regulatory burden, extraterritorial pressure, and adaptability) and aggregating it into the national In index based on macrostatistical data, with the possibility of subsequently transitioning to BigData aggregation. Qualitative sensitivity scenarios and a step-by-step implementation roadmap are proposed.
The theoretical contribution of the study lies in the synthesis of legal, institutional, and systemic-management analysis of ESG regulation. Unlike most studies, which focus either on comparing standards or on the financial consequences of ESG, this study demonstrates that fragmentation is an independent source of risk, not reducible to the stringency or scope of requirements. The typology of three regulatory models and the identification of mechanisms of extraterritorial pressure complement the theory of transaction costs and institutional economics as applied to sustainable development. Applying principles of control theory to the social system of ESG regulation opens a new avenue for interdisciplinary research.
The practical significance lies in the fact that the proposed country ESG index methodology can be used by government agencies to develop sustainable development monitoring systems, improve the comparability of ESG data, and enhance government business support mechanisms. For companies, the study’s results are of practical value in adapting to diverse international ESG reporting requirements, managing compliance costs, and mitigating greenwashing risks. For investors and financial institutions, the developed approaches can be used to assess the reliability of ESG ratings and comparatively analyze the sustainability of companies and national economies. Furthermore, the study’s results can be used in the development of national non-financial reporting standards and digital ESG monitoring platforms.
Although this study offers a comprehensive analytical framework and a new methodological tool for addressing the fragmentation of ESG regulation, several limitations must be considered when interpreting our results. These limitations not only refine our findings but also open up promising avenues for further research.
First, the empirical basis of our analysis is limited by the quality, timeliness, and comparability of ESG data, particularly in emerging economies. As documented in previous studies, the prevalence of qualitative and difficult-to-verify information in corporate reporting, coupled with significant time lags in the publication of non-financial reports in countries like Kazakhstan, creates “noise” that complicates the accurate identification of regulatory effects. Consequently, our assessment of compliance costs may underestimate the actual burden on businesses, as the available data primarily reflects formally disclosed practices rather than the full range of companies’ adaptation efforts. To overcome this limitation, future research could focus on developing digital operational reporting platforms and integrating alternative data sources–such as satellite emissions monitoring or supply chain transaction data–to complement traditional corporate disclosures.
Second, although our comparative analysis establishes robust correlations and logical links between regulatory fragmentation and compliance costs, it does not allow us to empirically isolate the causal effect of fragmentation from the overall trend of increasing ESG requirements [3]. This means that some of the cost increases we attribute to fragmentation may partly reflect broader shifts in regulatory stringency, rather than fragmentation per se. Furthermore, our proposed country ESG index, although based on a systematic review of international best practices and institutional analysis, inevitably incorporates normative judgments in the selection and weighting of indicators. The robustness and sensitivity of the index should be tested empirically in future work through extensive sensitivity analysis and stakeholder consultations.
Third, the selection of eight jurisdictions (the United States, the European Union, China, India, Brazil, Russia, South Africa, and Kazakhstan) is representative of the main global regulatory models and covers over 80% of global GDP. However, it does not exhaust the full range of ESG regulatory regimes–most notably, the economies of Southeast Asia (such as Singapore, Malaysia, and Indonesia), as well as the Gulf Cooperation Council (GCC) states, were excluded from the analysis. This limits the generalizability of our three-model typology to regions with different institutional histories, levels of economic integration, and cultural contexts. Comparative studies extending the analysis to ASEAN or the Middle East would help determine whether the proposed typology is universal or requires further refinement to account for hybrid or emerging models.
Fourth, the ESG regulatory landscape is evolving at an unprecedented rate. New directives, court decisions, and national standards continue to emerge, with significant changes occurring even as this manuscript is being prepared. While our study deliberately focuses on structural issues–fragmentation, inconsistency, and methodological heterogeneity–which are expected to persist in the medium term, some of the specific legal examples provided (e.g., the status of SEC rules in the US or the CSRD implementation schedule) may require updating shortly after publication. This dynamic environment highlights the need for ongoing monitoring, periodic revision of the proposed index methodology, and the development of flexible institutional arrangements capable of adapting to regulatory changes without imposing excessive transaction costs on businesses.
Finally, our emphasis on the risks and costs of regulatory fragmentation, although grounded in empirical evidence, does not fully explore the potential long-term benefits of harmonization–such as lower cost of capital, improved risk management, and increased investor confidence. A more balanced assessment of the trade-offs between the costs of fragmentation and the benefits of harmonization would require longitudinal studies tracking the evolution of regulatory regimes and their economic consequences over long time horizons.
The findings are also consistent with broader findings from contemporary ESG research. The identified fragmentation of regulatory requirements and disclosure standards is consistent with issues discussed in academic research regarding the comparability of ESG data, the divergence of ESG ratings, and the ambiguity in interpreting the materiality principle. In this context, the observed divergence of approaches between different jurisdictions can be viewed not only as a regulatory challenge but also as an informational challenge for market participants. The findings are also consistent with research indicating the need to improve coordination mechanisms between regulators, businesses, and investors to enhance the transparency and quality of sustainability disclosure. From this perspective, the proposed country ESG index can be considered one possible tool for institutional coordination in the context of the persistent fragmentation of the global ESG environment.

6. Conclusions

The study confirms that fragmentation of ESG regulation is a systemic problem requiring institutional solutions. The proposed country-specific ESG index and closed-loop governance system create a methodological basis for reducing regulatory uncertainty and balancing environmental goals with economic efficiency. The results can serve as a basis for pilot implementation in Kazakhstan and subsequent scaling to other developing economies. The following conclusions can be drawn from the study:
  • Regulatory fragmentation creates an exponential increase in compliance costs. Companies are forced to simultaneously comply with three incompatible regimes: prescriptive (the EU—dual materiality, mandatory audits), market-oriented (the US—conflict between federal and state laws), and state-centralized (China—rapidly tightening requirements). For Kazakhstan, an additional factor is dual pressure: the EU demands decarbonization (46.7% of exports), and China demands security of supply (18.3% of exports).
  • Global ESG ratings are methodologically heterogeneous and unsuitable for government regulation purposes. Discrepancies between MSCI, Sustainalytics, and S&P Global reach 50–60%, and rating dynamics can be multidirectional. This makes global ratings of limited applicability for regulatory purposes: they do not take into account the national institutional environment, do not cover SMEs, and do not capture the risk of overregulation.
  • The current ESG regulation architecture functions as an open-loop, disturbance-based control system. The regulator reacts to external signals without real-time measurement of deviations between the actual business performance and target indicators. This encourages greenwashing and increases transaction costs. The transition to a closed-loop, disturbance-based control system requires a country-specific ESG index as an integral feedback sensor.
  • The proposed two-tier algorithm for the country ESG index enables the aggregation of multidimensional data into a signal suitable for regulatory decisions. The index includes components of regulatory burden (marked with a “-”), extraterritorial pressure, and adaptability, which distinguishes it from commercial ratings. The algorithm envisages a phased implementation: from macro-aggregated indicators to Big Data aggregation.
  • Using the proposed firm index will enable corporate managers to internally monitor the organization’s ESG maturity and identify weak areas. Integrating the index into government support mechanisms will allow for differentiated tax incentives, access to subsidies, and government guarantees depending on the company’s index value. For investors and financial institutions, using the averaged score of several ratings will allow them to take into account rating dispersion as an indicator of uncertainty in investment decisions.
  • For government agencies, the country index can be used as a tool for monitoring the effectiveness of ESG policies, including assessing the results of support programs, tax incentives, and regulatory initiatives. For businesses, the index does not require additional reporting, as it is based primarily on already disclosed indicators and aggregates existing data into a unified system for assessing the institutional environment. Thus, the index can be used as a feedback tool between the government, businesses, and financial market participants in the formation and adjustment of sustainable development policies. Future research areas include: a quantitative assessment of compliance costs for Kazakhstani companies by sector; econometric testing of the relationship between regulatory fragmentation and investment activity; the development of a digital platform for the automated collection and aggregation of ESG data based on the proposed algorithm; and a comparative analysis of the effectiveness of national ESG indices in countries with similar institutional structures. The results obtained and the proposed index can serve as a basis for a pilot implementation in Kazakhstan and subsequent scaling to other developing economies.
The developed country ESG index can be considered not only as a tool for Kazakhstan but also as a conceptual model that can be adapted for other developing economies impacted by external ESG requirements and facing challenges of institutional fragmentation.

Author Contributions

Conceptualization, M.Z. and V.Z.; methodology, M.Z. and V.Z., formal analysis, Z.Y., Z.D. and O.V.A.; investigation, Z.Y., O.V.A. and A.Z.; resources, Z.Y., O.V.A. and A.Z.; data curation, Z.D. and A.Z.; writing–original draft preparation, M.Z.; writing–review and editing, V.Z.; visualization, M.Z.; supervision, V.Z.; project administration, M.Z.; funding acquisition, V.Z. All authors have read and agreed to the published version of the manuscript.

Funding

This research has been funded by the Science Committee of the Ministry of Science and Higher Education of the Republic of Kazakhstan (Grant No AP26198391 «Sustainable development of small business in Kazakhstan»).

Institutional Review Board Statement

Not applicable.

Informed Consent Statement

Not applicable.

Data Availability Statement

No new datasets were created for this study. The analysis was based on publicly available regulatory documents, ESG ratings and indices, official statistics, reports of international organizations, and published academic literature. All data sources used in the study are cited in the manuscript and are available from the respective public sources.

Conflicts of Interest

The authors declare no conflicts of interest.

Abbreviations

The following abbreviations are used in this manuscript:
ESGEnvironmental, Social, and Governance
CBAMCarbon Border Adjustment Mechanism
CSDDDCorporate Sustainability Due Diligence Directive
CSRDCorporate Sustainability Reporting Directive
ESRSEuropean Sustainability Reporting Standards
SFDRSustainable Finance Disclosure Regulation
ISSBInternational Sustainability Standards Board
IFRSInternational Financial Reporting Standards
GRIGlobal Reporting Initiative
SASBSustainability Accounting Standards Board
TCFDTask Force on Climate-related Financial Disclosures
CDPCarbon Disclosure Project
MSCIMorgan Stanley Capital International
CSACorporate Sustainability Assessment
SECU.S. Securities and Exchange Commission
EPAEnvironmental Protection Agency
GHGRPGreenhouse Gas Reporting Program
DOLU.S. Department of Labor
CARBCalifornia Air Resources Board
CSRCChina Securities Regulatory Commission
CSDSChinese Sustainability Disclosure Standards
ETSEmissions Trading System
UFLPAUyghur Forced Labor Prevention Act
SEBISecurities and Exchange Board of India
BRSRBusiness Responsibility and Sustainability Reporting
NGRBCNational Guidelines on Responsible Business Conduct
KPIKey Performance Indicator
IOSCOInternational Organization of Securities Commissions
CVMComissão de Valores Mobiliários (Brazilian Securities Commission)
BACENCentral Bank of Brazil
CBPSBrazilian Committee on Sustainability Standards
SBCEBrazilian Emissions Trading System
CITSBInterministerial Committee of the Brazilian Sustainable Taxonomy
TSBBrazilian Sustainability Taxonomy
OECDOrganisation for Economic Co-operation and Development
UNEP FIUnited Nations Environment Programme Finance Initiative
UN PRIUnited Nations Principles for Responsible Investment
JSEJohannesburg Stock Exchange
NEMANational Environmental Management Act
ARDFMAgency for Regulation and Development of the Financial Market (Kazakhstan)
AIFCAstana International Financial Centre
KASEKazakhstan Stock Exchange
NZECANet-Zero Export Credit Agencies Alliance
SMEsSmall- and Medium-Sized Enterprises
GDPGross Domestic Product
NFLNegative feedback
SaaSSoftware as a Service
XBRLeXtensible Business Reporting Language
GHGGreenhouse Gas
CO2Carbon Dioxide
WTOWorld Trade Organization

References

  1. Zarubina, V.R.; Bermukhametova, Z.Z.; Zarubin, M.Y. Development and Justification of a System of ESG Indicators for Sustainable Development of Kazakhstani SMEs Based on Harmonization with European Standards. Vestn. Turan Univ. 2026, 1, 347–364. [Google Scholar] [CrossRef]
  2. North, D.C. Institutions, Institutional Change and Economic Performance; Cambridge University Press: Cambridge, UK, 1990. [Google Scholar]
  3. Bromley, P.; Powell, W.W. From Smoke and Mirrors to Walking the Talk: Decoupling in the Contemporary World. Acad. Manag. Ann. 2012, 6, 483–530. [Google Scholar] [CrossRef]
  4. DiMaggio, P.J.; Powell, W.W. The Iron Cage Revisited: Institutional Isomorphism and Collective Rationality in Organizational Fields. Am. Sociol. Rev. 1983, 48, 147–160. [Google Scholar] [CrossRef]
  5. Christensen, D.M.; Serafeim, G.; Sikochi, A. Why Is Corporate Virtue in the Eye of the Beholder? The Case of ESG Ratings. Account. Rev. 2021, 97, 147–175. [Google Scholar] [CrossRef]
  6. Gillan, S.L.; Koch, A.; Starks, L.T. Firms and Social Responsibility: A Review of ESG and CSR Research in Corporate Finance. J. Corp. Financ. 2021, 66, 101889. [Google Scholar] [CrossRef]
  7. Berg, F.; Kölbel, J.F.; Rigobon, R. Aggregate Confusion: The Divergence of ESG Ratings. Rev. Financ. 2022, 26, 1315–1344. [Google Scholar] [CrossRef]
  8. Gibson Brandon, R.; Krueger, P.; Steffen Schmidt, P. ESG Rating Disagreement and Stock Returns. Financ. Anal. J. 2021, 77, 104–127. [Google Scholar] [CrossRef]
  9. Dimson, E.; Marsh, P.; Staunton, M. Divergent ESG Ratings. J. Portf. Manag. 2020, 47, 75–87. [Google Scholar] [CrossRef]
  10. Forliano, M.; Canio, C.; De Bernardi, P.; Rozsa, Z.; Bertello, A. Systems Dynamics Research in Management and Organization Studies: Overview and Research Agenda. J. Innov. Knowl. 2024, 9, 100512. [Google Scholar] [CrossRef]
  11. Grewatsch, S.; Kennedy, S.; Bansal, P. Tackling Wicked Problems in Strategic Management with Systems Thinking. Strateg. Organ. 2021, 21, 14761270211038635. [Google Scholar] [CrossRef]
  12. Moallemi, E.A.; de Haan, F.J.; Hadjikakou, M.; Khatami, S.; Malekpour, S.; Smajgl, A.; Smith, M.S.; Voinov, A.; Bandari, R.; Lamichhane, P.; et al. Evaluating Participatory Modeling Methods for Co-Creating Pathways to Sustainability. Earths Future 2021, 9, e2020EF001843. [Google Scholar] [CrossRef]
  13. Dechezleprêtre, A.; Sato, M. The Impacts of Environmental Regulations on Competitiveness. Rev. Environ. Econ. Policy 2017, 11, 183–206. [Google Scholar] [CrossRef]
  14. Åström, K.J.; Murray, R.M. Feedback Systems: An Introduction for Scientists and Engineers; Princeton University Press: Princeton, NJ, USA, 2008. [Google Scholar]
  15. Meadows, D.H. Thinking in Systems: A Primer; Chelsea Green Publishing: London, UK, 2008. [Google Scholar]
  16. Lijphart, A. Comparative Politics and the Comparative Method. Am. Polit. Sci. Rev. 1971, 65, 682–693. [Google Scholar] [CrossRef]
  17. Zarubina, V.; Zarubin, M.; Yessenkulova, Z.; Gumarova, T.; Daulbayeva, A.; Meimankulova, Z.; Kurmangalieva, A. Sustainable Development of Small Business in Kazakhstan. Economies 2024, 12, 247. [Google Scholar] [CrossRef]
  18. American Bar Association. Risks and Pitfalls from Increasing Balkanization of State-Level ESG Regulation. Class Actions and Derivative Suits Newsletter. 2026. Available online: https://www.americanbar.org (accessed on 10 May 2026).
  19. Revlin, K.; Cooper, F. U.S. ESG Trends: Fragmentation, Backlash and Energy Security. Sustainability Outlook 2026. A&O Shearman. 2026. Available online: https://www.aoshearman.com/en/insights/sustainability-outlook-2026/esg-trends-in-the-us-navigating-fragmentation-backlash-and-energy-security (accessed on 11 May 2026).
  20. SEC. The Enhancement and Standardization of Climate-Related Disclosures for Investors (Release Nos. 33-11275; 34-99678). 2024. Available online: https://www.sec.gov/files/rules/final/2024/33-11275.pdf (accessed on 11 May 2026).
  21. Herbert Smith Freehills Kramer. The SEC Abandons Climate Disclosure Litigation–What Next? 2025. Available online: https://www.hsfkramer.com/pt_BR/insights/2025-06/the-sec-abandons-climate-disclosure-litigation-what-next (accessed on 11 May 2026).
  22. Pinedo, A.; Walsh, L.; Juarez, C. Regulatory Climate Shift: Updates on the SEC Climate-Related Disclosure Rules. Harvard Law School Forum on Corporate Governance. 2025. Available online: https://corpgov.law.harvard.edu/2025/09/30/regulatory-climate-shift-updates-on-the-sec-climate-related-disclosure-rules/ (accessed on 11 May 2026).
  23. Sidley Austin LLP. SEC Ends Defense of Climate-Related Disclosure Rules. 2025. Available online: https://www.sidley.com/en/insights/newsupdates/2025/04/sec-ends-defense-of-climate-related-disclosure-rules (accessed on 11 May 2026).
  24. Hunton Andrews Kurth LLP. Update on U.S. Climate Disclosure Requirements. 2025. Available online: https://hunton.com/insights/update-on-us-climate-disclosure-requirements (accessed on 11 May 2026).
  25. Jones Day. Ninth Circuit Enjoins SB 261’s Climate-Related Risk Reporting Requirements, Declines to Enjoin SB 253. 2025. Available online: https://www.jonesday.com/en/insights/2025/11/ninth-circuit-enjoins-sb-261s-climaterelated-risk-reporting-requirements-declines-to-enjoin-sb-253 (accessed on 11 May 2026).
  26. Cooley LLP. California’s SB 253 and SB 261: Developments and Litigation. 2026. Available online: https://governancebeat.cooley.com/californias-sb-253-and-sb-261-developments-and-litigation/ (accessed on 11 May 2026).
  27. K&L Gates. California Climate Disclosure Regulations Update: CARB Provides Additional Clarifications on Implementation and Ninth Circuit Stay of SB 261 Enforcement. 2025. Available online: https://www.klgates.com/California-Climate-Disclosure-Regulations-Update-CARB-Provides-Additional-Clarifications-on-Implementation-and-Ninth-Circuit-Stay-of-SB-261-Enforcement-12-8-2025 (accessed on 11 May 2026).
  28. The National Law Review. Federal Court Strikes Down Texas Anti-ESG Investment Law. 2026. Available online: https://www.natlawreview.com/article/federal-court-strikes-down-texas-anti-esg-investment-law (accessed on 11 May 2026).
  29. Simpson Thacher & Bartlett LLP. Texas District Court Strikes Down Anti-ESG Law. 2026. Available online: https://www.stblaw.com/about-us/publications/view/2026/02/09/texas-district-court-strikes-down-anti-esg-law (accessed on 11 May 2026).
  30. Beveridge & Diamond. With Federal Greenhouse Gas Reporting in Limbo, States Expand GHG Reporting. 2026. Available online: https://www.bdlaw.com/publications/with-federal-greenhouse-gas-reporting-in-limbo-states-expand-ghg-reporting/ (accessed on 11 May 2026).
  31. U.S. Senate Committee on Environment and Public Works. Whitehouse, Cramer Urge EPA to Withdraw Proposed Cancelation of Greenhouse Gas Reporting Program. 2025. Available online: https://www.epw.senate.gov/public/index.cfm/press-releases-democratic?ID=366EBA6A-7AA7-4B92-9BDF-3D1170D8868A (accessed on 11 May 2026).
  32. Herbert Smith Freehills Kramer. Advisory Firm Pays $17.5M Civil Penalty to Settle SEC Charges for Making Misrepresentations Regarding ESG Considerations in Investment Decisions. 2024. Available online: https://www.hsfkramer.com/insights/2024-11/advisory-firm-pays-dollar175m-civil-penalty-to-settle-sec-charges-for-making-misrepresentations-regarding-esg-considerations-in-investment-decisions (accessed on 11 May 2026).
  33. SEC. SEC Charges Co-Founder of Environmental Sustainability Company with Fake Revenue Scheme (Litigation Release No. 26382). 21 August 2025. Available online: https://www.sec.gov/enforcement-litigation/litigation-releases/lr-26382 (accessed on 11 May 2026).
  34. European Commission. Proposal for a Regulation Amending Regulation (EU) 2019/2088 on Sustainability-Related Disclosures in the Financial Services Sector (SFDR), Regulation (EU) No 1286/2014 on Key Information Documents for Packaged Retail and Insurance-Based Investment Products (PRIIPs) and Repealing Commission Delegated Regulation (EU) 2022/1288. COM (2025) 841 Final. 2025. Available online: https://eur-lex.europa.eu/legal-content/EN/TXT/?uri=CELEX:52025PC0841 (accessed on 12 May 2026).
  35. AccountancyEurope. Omnibus Explained: Key Changes to the CSRD and CSDDD. 2026. Available online: https://accountancyeurope.eu/publications/omnibus-explained-key-changes-to-the-csrd-and-csddd/ (accessed on 12 May 2026).
  36. Paul Hastings LLP. The EU Omnibus I–But Where Has It Stopped? 2026. Available online: https://www.paulhastings.com/en-GB/insights/client-alerts/the-eu-omnibus-i-but-where-has-it-stopped (accessed on 12 May 2026).
  37. Noerr. CSDDD–Amending Directive Published in the Official Journal of the European Union. 2026. Available online: https://www.noerr.com/en/insights/csddd-amending-directive-published-in-the-official-journal-of-the-european-union (accessed on 12 May 2026).
  38. NatLawReview. Corporate Reporting and Due Diligence Entering a New Era in the EU. 2026. Available online: https://natlawreview.com/article/corporate-reporting-and-due-diligence-entering-new-era-eu (accessed on 12 May 2026).
  39. Stibbe. EU ESG Wrap-Up: Concluding 2025 and Stepping into 2026. 2026. Available online: https://www.stibbe.com/publications-and-insights/eu-esg-wrap-up-concluding-2025-and-stepping-into-2026 (accessed on 12 May 2026).
  40. Chambers and Partners. European Commission Proposes Major Overhaul to Simplify Sustainable Finance Disclosures. 2025. Available online: https://chambers.com/articles/european-commission-proposes-major-overhaul-to-simplify-sustainable-finance-disclosures (accessed on 12 May 2026).
  41. KPMG Law. First Omnibus Package Relaxes Obligations of the CSDDD and CSRD. 2025. Available online: https://kpmg-law.de/en/first-omnibus-regulation-to-relax-the-obligations-of-the-csddd-csrd-and-eu-taxonomy/ (accessed on 12 May 2026).
  42. EU Law Live. Commission Delegated Regulation Simplifying Presentation of Information Under the Taxonomy Framework, Published in OJ. 2026. Available online: https://eulawlive.com/commission-delegated-regulation-simplifying-presentation-of-information-under-the-taxonomy-framework-published-in-oj/# (accessed on 12 May 2026).
  43. ECOPOLITIC. EU Publishes Final Default Values for CBAM. 2026. Available online: https://ecopolitic.com.ua/news/v-es-obnarodovali-okonchatelnye-bazovye-znacheniya-po-cbam/ (accessed on 12 May 2026).
  44. ICAP. EU CBAM Enters Compliance Phase and Outlines Path Ahead. 2026. Available online: https://icapcarbonaction.com/en/news/eu-cbam-enters-compliance-phase-and-outlines-path-ahead (accessed on 12 May 2026).
  45. State Council Information Office. Carbon Peaking and Carbon Neutrality: China’s Plans and Solutions. 8 November 2025. Available online: https://english.www.gov.cn/archive/whitepaper/202511/08/content_WS1234567cd.html (accessed on 12 May 2026).
  46. Ministry of Finance (MOF). Corporate Sustainability Disclosure Standards–Basic Standards (Trial). 2024. Available online: http://kjs.mof.gov.cn/zhengcefabu/202412/P020241216565879245839.pdf (accessed on 12 May 2026).
  47. Baker Tilly. China’s New CSDS Standards: Far-Reaching Requirements in Sustainability Reporting. 10 February 2025. Available online: https://www.bakertilly.de/en/post/chinas-new-csds-standards-far-reaching-requirements-in-sustainability-reporting (accessed on 12 May 2026).
  48. HKGFA. PRC Launches New National Standard for Corporate Climate Disclosure. 8 January 2026. Available online: https://www.hkgreenfinance.org/prc-launches-new-national-standard-for-corporate-climate-disclosure/ (accessed on 12 May 2026).
  49. Infragreen. Китaй пepeхoдит к oбязaтeльнoмy ESG-кoмплaeнcy: итoги 2025 и плaны нa 2026 гoд [China Transitions to Mandatory ESG Compliance: 2025 Results and 2026 Plans]. 8 January 2026. Available online: https://infragreen.ru/publications/kitaj-perekhodit-k-obyazatelnomu-esg-komplaensu-itogi-2025-i-plany-na-2026-god/ (accessed on 12 May 2026).
  50. China Daily. China Updates Sustainability Disclosure Rules to Support High-Quality, ESG-Aligned Growth. 30 January 2026. Available online: https://govt.chinadaily.com.cn/s/202602/02/WS69805c3d498e36855033a524/china-updates-sustainability-disclosure-rules-to-support-high-quality-esg-aligned-growth.html (accessed on 12 May 2026).
  51. Grandway Law Offices. CSRC Revises Information Disclosure Rules for Listed Companies. 31 March 2025. Available online: https://www.grandwaylaw.com/en/Legalupdate/4456.html (accessed on 12 May 2026).
  52. Administrative Measures for Information Disclosure by Listed Companies. China Securities Regulatory Commission (Order No. 226). 28 March 2025. Available online: https://www.lexiscn.com/law/law-english-1-5750902-T.html?eng=0 (accessed on 12 May 2026).
  53. CCXGF (China Chengxin Green Finance). Comparison of Sustainability Report Disclosure Rules of the Shanghai-Shenzhen-Beijing and Hong Kong Stock Exchanges (Chinese-English). 11 September 2025. Available online: http://www.ccxgf.com.cn/article/472.html (accessed on 24 June 2026).
  54. Leaf Legal. Draft Environmental Code in China: What Legal Teams Need to Prepare for. Sustainability. 4 June 2025. Available online: https://www.leaf-legal.com (accessed on 31 May 2026).
  55. Zevero Earth. BRSR Reporting in India: What It Means for Listed Companies. Sustainability 2026. Available online: https://www.zevero.earth/blog/brsr-reporting-india (accessed on 31 May 2026).
  56. KPMG. Emerging Trends in BRSR Reporting by Listed Companies. Accounting and Auditing Update 2026. Available online: https://assets.kpmg.com/content/dam/kpmgsites/in/pdf/2026/02/chapter-1-emerging-trends-in-brsr-reporting-by-listed-companies.pdf.coredownload.pdf (accessed on 31 May 2026).
  57. Illuminem. Latest ESG Reporting Rules Redefine Key Suppliers and Customers of Listed Companies. Sustainability 2025. Available online: https://illuminem.com/illuminemvoices/latest-esg-reporting-rules-redefine-key-suppliers-and-customers-of-listed-companies (accessed on 31 May 2026).
  58. SEBI. Measures to Facilitate Ease of Doing Business with Respect to Framework for Assurance or Assessment, ESG Disclosures for Value Chain, and Introduction of Voluntary Disclosure on Green Credits (Circular No. SEBI/HO/CFD/CFD-PoD-1/P/CIR/2025/42). Sustainability 2025. Available online: https://www.sebi.gov.in/legal/circulars/mar-2025/measures-to-facilitate-ease-of-doing-business-with-respect-to-framework-for-assurance-or-assessment-esg-disclosures-for-value-chain-and-introduction-of-voluntary-disclosure-on-green-credits_93102.html?trk=public_post_comment-text (accessed on 31 May 2026).
  59. Corporate Professionals. SEBI Amends ESG Disclosure Norms: Green Credits, Value Chain Reporting & Assurance Updates: Circular March 28, 2025. Sustainability 2025. Available online: https://www.corporateprofessionals.com/regulatoryupdate/sebi-amends-esg-disclosure-norms-green-credits-value-chain-reporting-assurance-updates-circular-march-28-2025/ (accessed on 31 May 2026).
  60. CMIE. SEBI to Update ESG REPORTING Standards for India Inc. Economic Intelligence Service 2025. Available online: https://www.cmie.com/kommon/bin/sr.php?kall=warticle&dt=20250210152404&msec=736 (accessed on 31 May 2026).
  61. ESG News. BRSR Interoperability: India’s Path to Global Credibility. Sustainability 2026. Available online: https://www.esgnews.earth/latest-news/brsr-interoperability-indias-path-to-global-credibility (accessed on 31 May 2026).
  62. ET Now News. SEBI Slaps Rs 38 Lakh Penalty on Coffee Day Enterprises over Financial Mis-Statements. Sustainability 2026. Available online: https://www.etnownews.com/companies/sebi-slaps-rs-38-lakh-penalty-on-coffee-day-enterprises-over-financial-mis-statements-details-article-153735176 (accessed on 31 May 2026).
  63. VCCircle. SEBI Slaps $14M Penalty on DLF and Related Parties in IPO Disclosure Lapse Case. Sustainability 2026. Available online: https://www.vccircle.com/sebi-slaps-14m-penalty-dlf-and-related-parties-ipo-disclosure-lapse-case (accessed on 31 May 2026).
  64. CVM (Comissão de Valores Mobiliários). Resolution No. 59, of December 22, 2021. Amends CVM Instruction No. 480 of December 7, 2009, and CVM Instruction No. 481 of December 17, 2009. Republished in the DOU of May 13, 2022. 2021. Available online: https://conteudo.cvm.gov.br/legislacao/resolucoes/resol059.html (accessed on 14 May 2026).
  65. Meneses, V. Companies Adopt ESG Standards in Financial Reports. Valor International. 26 June 2025. Available online: https://valorinternational.globo.com/business/news/2025/06/26/companies-adopt-esg-standards-in-financial-reports.ghtml (accessed on 14 May 2026).
  66. Demarest Advogados. Updated Notice of Deadlines of New Sustainability Regulations of the Central Bank of Brazil. 2022. Available online: https://www.demarest.com.br/updated-notice-of-deadlines-of-new-sustainability-regulations-of-the-central-bank-of-brazil/ (accessed on 14 May 2026).
  67. Bingemer, C.F.L.; Mavignier, M. New Corporate Regulations for Climate Risk Management. BMA Advogados, 14 October 2025. Available online: https://www.bmalaw.com.br/en-US/conteudo/corporate-and-ma/new-corporate-regulations-for-climate-risk-management (accessed on 14 May 2026).
  68. Bezerra, L.G.; Gomes, G. Brazilian Sustainable Taxonomy Is Approved. Mayer Brown, 15 September 2025. Available online: https://www.mayerbrown.com/en/insights/publications/2025/09/brazilian-sustainable-taxonomy-is-approved (accessed on 14 May 2026).
  69. Chambers and Partners. BRAZIL: An Introduction to Environmental, Social & Governance (ESG) Law. 2026. Available online: https://chambers.com (accessed on 15 May 2026).
  70. Journal.Ecostandard.ru. “Bcтyпил в cилy зaкoн «Oб oгpaничeнии выбpocoв пapникoвых гaзoв».”. 18 August 2025. Available online: https://journal.ecostandard.ru (accessed on 15 May 2026).
  71. Кoммepcaнтъ. ЦБ ввeдeт oбязaтeльнoe pacкpытиe ESG-пoкaзaтeлeй для кpyпных эмитeнтoв. 23 December 2025. Available online: https://www.kommersant.ru/doc/8314893 (accessed on 15 May 2026).
  72. AKM. Non-Financial Reporting Will Become Mandatory in Russia. 19 January 2026. Available online: https://www.akm.ru/eng/news/non-financial-reporting-will-become-mandatory-in-russia/ (accessed on 15 May 2026).
  73. CGCI. The Bank of Russia Approved the Code of Responsible Investment. 27 August 2025. Available online: https://cgci-ru.ru/cgi_russia_news/bank_rossii_utverdil_kodeks_otvetstvennogo_investirovaniya_investory_obyazany_stat_aktivnymi_akcionerami/ (accessed on 15 May 2026).
  74. GOST R 72157-2025; Sustainable Development of Organizations. Guidelines for Diagnosing the Performance of Organizations in the Achievement of Sustainable Development Goals. The Excellence Model Approach. Standartinform: Moscow, Russia, 2025. Available online: https://files.stroyinf.ru/Data/851/85140.pdf (accessed on 15 May 2026).
  75. Government of the Russian Federation. “Resolution No. 2230 of 30 December 2025, ‘On the Standard of Public Capital of Business.’” Consultant Plus. 2025. Available online: https://www.consultant.ru/document/cons_doc_LAW_526133/ (accessed on 16 May 2026).
  76. ENS. King V: Governance Updates for South African Organisations. Mondaq. 12 November 2025. Available online: https://www.mondaq.com/ (accessed on 16 May 2026).
  77. Bowmans. South Africa: King V–What Companies Need to Know. Bowmans Law. 30 October 2025. Available online: https://bowmanslaw.com/insights/south-africa-king-v-what-companies-need-to-know/ (accessed on 16 May 2026).
  78. CGISA. From Talk to Action: How SA Companies Should Make Sustainability a Board-Level Strategy. Chartered Governance Institute of Southern Africa. January 2025. Available online: https://www.chartgov.co.za/ (accessed on 16 May 2026).
  79. DFFE. Minister George Announces Proclamation and Implementation of the Climate Change Act, 2024 (Act No. 22 of 2024). Department of Forestry, Fisheries and the Environment. 17 March 2025. Available online: https://www.dffe.gov.za/ (accessed on 16 May 2026).
  80. ENS Africa. South Africa’s Climate Change Framework: A New Operating Reality for Mining. 10 February 2026. Available online: https://www.ensafrica.com/ (accessed on 16 May 2026).
  81. Moore South Africa. Sustainability Reporting in South Africa: What Changed in 2025 and What Still Trips Companies Up. 2025. Available online: https://www.moore-southafrica.com/ (accessed on 16 May 2026).
  82. Kuanova, L.A.; Sagiyeva, R.K.; Zaitenova, N.K. Analytical Review of Experience in the Development of Sustainable Finance and Prospects for Implementation in Kazakhstan. Econ. Strategy Pract. 2024, 12, 90–108. [Google Scholar] [CrossRef]
  83. OECD. OECD Environmental Performance Reviews: Kazakhstan 2021; OECD Publishing: Paris, France, 2021. [Google Scholar]
  84. President of the Republic of Kazakhstan. Decree No. 121 of February 2, 2023 “On Approval of the Strategy for Achieving Carbon Neutrality of the Republic of Kazakhstan Until 2060”. Available online: https://adilet.zan.kz/rus/docs/U2300000121 (accessed on 16 May 2026).
  85. Environmental Code of the Republic of Kazakhstan. Code of the Republic of Kazakhstan No. 400-VI ZRK of January 2, 2021. Available online: https://adilet.zan.kz/rus/docs/K2100000400 (accessed on 16 May 2026).
  86. ARDFM. Methodological Guidelines on Environmental and Social Risk Management for Banks and Other Financial Organizations; Agency of the Republic of Kazakhstan for Regulation and Development of Financial Market: Nur-Sultan, Kazakhstan, 2024. Available online: https://www.adilet.zan.kz/rus/docs/D24YA000228 (accessed on 16 May 2026).
  87. AIFC Green Finance Centre. Legal Framework for Sustainable Finance and Green Taxonomy of Kazakhstan; Astana International Financial Centre: Nur-Sultan, Kazakhstan, 2021; Available online: https://aifc.kz/ru/legal-framework/ (accessed on 16 May 2026).
  88. The Astana Times. Export Credit Agency of Kazakhstan Earns ESG Rating from Sustainable Fitch. The Astana Times, 4 June 2025. Available online: https://astanatimes.com/2025/06/export-credit-agency-of-kazakhstan-earns-esg-rating-from-sustainable-fitch/ (accessed on 16 May 2026).
  89. Bureau of National Statistics of the Republic of Kazakhstan. Foreign Trade Turnover of the Republic of Kazakhstan (January–September 2025); Agency for Strategic Planning and Reforms of the Republic of Kazakhstan: Astana, Kazakhstan, 2025. Available online: https://stat.gov.kz/en/industries/economy/foreign-market/publications/462872/ (accessed on 16 May 2026).
  90. Business at OECD. Navigating Complexity: Business Priorities for Effective and Cost-Efficient Sustainability Reporting; Business at OECD (BIAC): Paris, France, 2025; Available online: https://www.businessatoecd.org/ (accessed on 16 May 2026).
  91. Darnall, N.; Iatridis, K.; Kesidou, E.; Snelson-Powell, A. Penalty Zones in International Sustainability Standards: Where Improved Sustainability Doesn’t Pay. Organ. Environ. 2023, 36, 215–245. [Google Scholar] [CrossRef]
  92. Lou, Z.; Li, S.; Tong, J.; Zhao, J. ESG Rating Disagreement and the Cost of Equity Capital. Glob. Financ. J. 2025, 66, 101123. [Google Scholar] [CrossRef]
  93. Bilyay-Erdogan, S.; Danisman, G.; Demir, E. ESG Performance and Investment Efficiency: The Impact of Information Asymmetry. J. Int. Financ. Mark. Inst. Money 2023, 91, 101919. [Google Scholar] [CrossRef]
  94. Busch, T.; Bruce-Clark, P.; Derwall, J.; Eccles, R.; Hebb, T.; Hoepner, A.; Klein, C.; Krueger, P.; Paetzold, F.; Scholtens, B. Impact Investments: A Call for (Re)orientation. SN Bus. Econ. 2021, 1, 33. [Google Scholar] [CrossRef]
  95. Krueger, P.; Sautner, Z.; Tang, D.Y.; Zhong, R. The Effects of Mandatory ESG Disclosure Around the World. J. Account. Res. Forthcom. 2024, 62, 1795–1847. [Google Scholar] [CrossRef]
  96. Zhang, Y.; Chen, Y. How Does Digital Finance Affect the City Economy? An Empirical Examination in China. Technol. Forecast. Soc. Change 2022, 158, 120224. [Google Scholar] [CrossRef]
  97. Kaufmann, D.; Kraay, A.; Mastruzzi, M. The Worldwide Governance Indicators: Methodology and Analytical Issues. World Bank Policy Research Working Paper No. 5430. 2010. Available online: https://openknowledge.worldbank.org/entities/publication/4e535db9-672d-5897-a6cd-feb4df55208f (accessed on 31 May 2026).
  98. European Parliament and Council of the European Union. Directive (EU) 2022/2464 of the European Parliament and of the Council of 14 December 2022 amending Regulation (EU) No 537/2014, Directive 2004/109/EC, Directive 2006/43/EC and Directive 2013/34/EU, as regards corporate sustainability reporting. Off. J. Eur. Union 2022, L 322, 15–80. Available online: https://eur-lex.europa.eu/eli/dir/2022/2464/oj/eng (accessed on 24 June 2026).
  99. Global Reporting Initiative (GRI). GRI 1: Foundation 2021; GRI 2: General Disclosures 2021; GRI 3: Material Topics 2021. GRI Standards. Available online: https://www.globalreporting.org/standards (accessed on 24 June 2026).
  100. Task Force on Climate-related Financial Disclosures (TCFD). Final Recommendations of the Task Force on Climate-related Financial Disclosures. June 2017. Available online: https://www.fsb-tcfd.org/recommendations/ (accessed on 24 June 2026).
  101. International Sustainability Standards Board (ISSB). IFRS S1 General Requirements for Disclosure of Sustainability-Related Financial Information; IFRS S2 Climate-Related Disclosures. June 2023. Available online: https://www.ifrs.org/issued-standards/ (accessed on 24 June 2026).
  102. European Commission. Commission Delegated Regulation (EU) 2023/2772 of 31 July 2023 supplementing Directive 2013/34/EU of the European Parliament and of the Council as regards sustainability reporting standards (European Sustainability Reporting Standards — ESRS). Official Journal of the European Union. Available online: https://eur-lex.europa.eu/legal-content/EN/TXT/?uri=CELEX:32023R2772 (accessed on 24 June 2026).
  103. ISO 14001:2015; Environmental Management Systems — Requirements with Guidance for Use. International Organization for Standardization: Geneva, Switzerland, 2015. Available online: https://www.iso.org/standard/60857.html (accessed on 24 June 2026).
  104. Barge-Gil, A. Open, Semi-Open and Closed Innovators: Towards an Explanation of Degree of Openness. Ind. Innov. 2010, 17, 577–607. [Google Scholar] [CrossRef]
  105. Hall, B.; Helmers, C.; Rogers, M.; Sena, V. The Choice between Formal and Informal Intellectual Property: A Review. J. Econ. Lit. 2014, 52, 375–423. [Google Scholar] [CrossRef]
Figure 1. State ESG regulation system as an open-loop adaptive control system. The red solid line represents disturbances acting on the system; The red dotted line represents disturbances possibly measured and taken into account by the controller.
Sustainability 18 07145 g001
Figure 2. Closed-loop ESG control system with deviation feedback. The red solid line represents disturbances acting on the system; The red dotted line represents disturbances possibly measured and taken into account by the controller; The yellow block and dotted black line in the feedback loop represent current attempts by the system to operate based on deviations; The red blocks and solid line in the feedback loop represent proposed index-based feedback tools.
Sustainability 18 07145 g002
Figure 3. Schematic diagram of aggregation of multidimensional ESG data into an integral feedback signal.
Sustainability 18 07145 g003
Table 1. Key regulatory sources of ESG regulation.
CountryLegislative and Regulatory Documents
USAThe U.S. Securities and Exchange Commission’s Climate Disclosure Rule (SEC Climate Disclosure Rule, drafted 2022–2024); the Names Rule; the Department of Labor’s ESG regulation (DOL, 2022, revised 2025); California’s SB 253 (GHG Disclosure) and SB 261 (Climate Risk Disclosure); the Environmental Protection Agency’s GHGRP (methane rule); and initiatives by the NASDAQ and NYSE.
European UnionCorporate Sustainability Reporting Directive (CSRD); EU Taxonomy Regulation; Sustainable Finance Disclosure Regulation (SFDR); European Financial Reporting Standards (ESRS); EU Green Bonds Regulation (2023/2631).
ChinaESG Disclosure Guidelines for Financial Institutions; State Council Green Finance Directives of the People’s Republic of China; Non-financial Disclosure Requirements of the China Securities Regulatory Commission (CSRC); National Green Taxonomy.
IndiaCompanies Act 2013 (CSR obligations); Securities and Exchange Board of India (SEBI) requirements–Business Responsibility and Sustainability Report (BRSR); Bombay Stock Exchange (BSE) initiatives.
BrazilResolutions of the Commission for Valorous Mobility (CVM), including Resolution 59 (2021/2023); B3 exchange requirements; Central Bank regulations on environmental and social risk management.
RussiaNational development goals up to 2030; Taxonomy of “green” and adaptation projects (RF Government Resolution No. 1587); Bank of Russia recommendations on disclosure of non-financial information; methodological recommendations of the Ministry of Economic Development on ESG reporting.
South AfricaJohannesburg Stock Exchange (JSE) integrated reporting requirements; King IV Code of Corporate Governance application practices; official recognition of ISSB standards.
KazakhstanThe concept of transition to a “green economy”; the Environmental Code of the Republic of Kazakhstan; draft national “green” taxonomy; requirements of the Agency for Regulation and Development of the Financial Market for the disclosure of ESG information by financial institutions; KASE initiatives on sustainable bonds.
Table 2. Use of International ESG Reporting Standards.
StandardStatus and Application by Jurisdiction
Global Reporting Initiative (GRI Standards)Integrated into the EU regulatory framework through the ESRS; in Russia and Kazakhstan, these are advisory guidelines; for the USA, India, Brazil, and South Africa, this is a market standard; for China, it is used in parallel with national standards.
International Sustainability Standards Board (ISSB–IFRS S1/S2)Official recognition or implementation (South Africa, Brazil); strategic rapprochement (EU, USA); observation position (China, India); limited influence (Russia, Kazakhstan).
Task Force on Climate-related Financial Disclosures (TCFD)Used as a basic climate framework in the US, EU, Brazil, and Japan; recommended by regulators in Russia and Kazakhstan; integrated into ISSB standards.
Carbon Disclosure Project(CDP)Used by global corporations to disclose climate and water risks; used by investors as an additional source of data verification.
Table 3. Main sources of rating and index data.
CategorySources
Rating agenciesMoscow Exchange Sustainable Development Index (MSCI) ESG Research; Sustainalytics; S&P Global (CSA); FTSE Russell; Refinitiv ESG Scores.
International indicesDow Jones Sustainability Index; MSCI ESG Leaders Indexes; FTSE4Good.
National indicesMESI; Kazakhstan Stock Exchange (KASE) “Responsibility and Sustainability”; Índice de Sustentabilidade Empresarial (B3 ISE).
Table 4. Academic and industry literature, statistical data.
Type of SourceMethodological Role in the Study
Academic articles (Scopus/WoS)Analysis of the impact of ESG on company value, institutional features of regulation, and the risks of stranded assets
Kazakhstani and Russian national studiesEvaluation of national regulatory models and business adaptation strategies
International regulatory reportsOтчeты United Nations Environment Programme Finance Initiative (UNEP FI), Reports from the United Nations Environment Programme Finance Initiative (UNEP FI) reports, Principles for Responsible Investment (UN PRI), the Organization for Economic Cooperation and Development (OECD), and the World Bank were used to verify/confirm institutional changes and formalize disclosure requirements
Industry analytical reviewsStatistical data on the prevalence of ESG ratings, industry distributions, and rating dynamics
Official statisticsData from national statistical services, central banks, and stock market regulators on the volume of green bonds, investment structure, etc.
Table 5. Summary characteristics of ESG regulation models according to the criteria of the analytical framework.
CriterionUSAEUChinaIndiaBrazilRussiaSouth AfricaKazakhstan
Regulatory modelMarket-orientedDirectiveState-centralizedHybrid
(state-directive)
Hybrid
(state-market)
State-centralizedHybrid
(state-market)
Hybrid
(state-market)
Mandatory nature of requirementsMandatory for public companies (federal) + state lawsMandatory for large companies (>1000 employees, >€450 million turnover) and the financial sectorMandatory environmental reporting; ESG reporting–gradually (CSDS from 2025–2026)Mandatory for top 1000 listed companies (BRSRCore)Mandatory for public companies and the financial sectorCarbon reporting is mandatory; ESG reporting is voluntary (except for issuers from 2026)Mandatory for listed companies (apply-or-explain)Environmental reporting is mandatory; ESG reporting is mandatory for the financial sector from 2025
The principle of materialityFinancial materialityDual materiality (financial + impact)Dual Materiality (by CSDS)Mixed (financial + impact)Dual MaterialityStrategic (compliance with state policy)Dual MaterialityStrategic (compliance with state policy)
SanctionsSEC fines, lawsuits, regulatory suspensionsFines up to 5% of global turnover (CSDDD), administrative sanctionsFines up to 5 times the damage, criminal liability for managementSEBI fines, listing suspension, RoC sanctionsAdministrative fines of the CVM and BCBEnvironmental fines; no penalties for ESG reporting (except for issuers)Penalties for NEMA violations, risk of delistingEnvironmental fines (up to 500 MCI); sanctions for ESG reporting are formed
ExtraterritorialityHigh (CSDDD, CBAM, UFLPA)–indirect pressure through supply chainsBroad (CBAM, CSDDD, CARD, EUDR)–direct action on foreign companiesLimited direct; indirect pressure through exporter demandsLimited direct; indirect through supply chainsLimited (requirements for foreign subsidiaries)Limited; indirect pressure via CBAMLimited; indirect pressure via CBAMLimited; indirect pressure via CBAM
Internal fragmentationCritically high (conflict of federal regulations, state laws, court decisions)Low (centralized system with harmonization through directives)Low/moderate (coordination through the State Council, but departmental gaps)Moderate (SEBI dominance but lack of coordination with RBI/MCA)Low (coordination of CVM and BCB, unified taxonomy)Moderate (three competing standards: SOKB, ECG, XBRL)Low (centralized through the JSE and National Treasury)Low (unitary state, centralized initiatives)
Convergence with ISSBPartial (voluntary use, no official adoption)High (ESRS is compatible with ISSB, but with dual materiality)Partial (CSDS based on ISSB, but with dual materiality)Partial (BRSR is ISSB compatible, formal adoption is in progress)Full (first jurisdiction to officially adopt the ISSB since 2026)Partial (use of GRI/TCFD, official adoption by ISSB is not planned)Partial (JSE-Guidance is USB-compatible, gradual adaptation)Partial (harmonization through AIFC and recommendations of the ARRFR)
The main compliance risk for businessIntra-country normative war (federation vs. states)High costs of detailed reporting and due diligenceRapid changes in government policy, dual reporting for exportsGradual expansion of requirements without full harmonizationIntegrating ESG risks into financial managementDual reporting (domestic vs. international), isolationCompliance with global standards for capital raisingLack of readiness for CBAM/CSDDD, zero environmental indicators in state programs
Table 6. Objectives and functions of the country ESG index.
TargetFunctionInstrumental EmbodimentTarget
Reducing regulatory uncertaintyMeasuringUnified methodology, normatively enshrinedReducing regulatory uncertainty
Improving data comparabilityMeasuring, communicativeUnified indicators, standardized aggregationImproving data comparability
Business support during the adaptation periodOrientingPublishing the index structure, open dataBusiness support during the adaptation period
Providing feedback in managementRegulatory, adaptiveIntegration into government support mechanisms, monitoring of deviationsProviding feedback in management
Table 7. Conceptual requirements for the country ESG index as a gauge of integral deviation.
RequirementContentEmpirical Justification/SourceImplications for Index Design
DetectabilityRecording significant changes in emissions, investments, and compliance costsBerg et al., 2022 [7]Using dynamic weights, taking into account threshold values
RobustnessRobustness to methodological biases and data noiseBerg et al., 2022 [7]; Gibson Brandon et al., 2021 [8]Application of dimensionality reduction methods (PCA), clustering
ComparabilityCross-country and cross-industry comparabilityGibson Brandon et al., 2021 [8]Harmonization with ISSB, use of common metrics (e.g., carbon intensity)
TimelinessMinimum time lag between process changes and their reflectionChristensen et al., 2021 [5]Implementation of digital reporting, use of high-frequency data
Symmetry of assessmentAccounting for both underregulation and overregulationDechezleprêtre et al., 2017 [13]Introduction of the U-shaped scale, the regulatory load index
InterpretabilityClarity for decision makersNorth, 1990 [2];
Zarubina et al., 2024 [17]
Simple structure, open methodology, visualization
Accounting for harmonizationAlignment with key trading partners’ standardsDechezleprêtre et al., 2017 [13]Comparison block with regulatory regimes of the EU, USA, China
Macroeconomic integrationReflection of the impact of ESG policies on GDP, cost of capital, and investmentGillan et al., 2021 [6]; Zhang et al., 2022 [96]Inclusion of macro-indicators (capital expenditure, export dynamics)
Table 8. Comparative characteristics of international ESG regulation indices.
IndexMeasurement TypeDirection of MeasurementAccounting for Regulatory IntensityTaking Macro-Effects into AccountAccounting for Harmonization
EPIResultativeEcological stateNoNoNo
SDG IndexResultativeAchieving the Sustainable Development GoalsPartiallyPartiallyNo
OECD EPSPoliticalThe severity of environmental policyYesPartiallyNo
Climate Action TrackerTrajectoryCompliance with the Paris AgreementYesNoYes (climate)
WGIInstitutionalQuality of managementIndirectlyNoNo
Table 9. Divergence of corporate ESG ratings: dynamics and types of discrepancies.
CompanySectorMSCI ESG (AAA–CCC)Sustainalytics ESG Risk (0–100)S&P Global CSA (0–100)Nature of the Discrepancy/Key Observation
MicrosoftTechnologiesAAA (stable)2023: 14.6 (low)
2024: 13.9
2025: 13.2
2023: 82
2024: 84
2025: 85
Consistently high ratings; improvement across all three agencies
Lloyds Banking GroupFinance2023: AA
2024: AA
2025: AA
2023: 24.9 (high)
2024: 19.0 (average)
2025: 12.4 (low)
2023: 55
2024: 59
2025: 51
Mixed dynamics: Sustainalytics records a sharp improvement, S&P Global–a deterioration, MSCI is stable
NatWest GroupFinance2022: AA
2023: AA
2024: AA
2025: AA
2022: 17.4
2023: 19.8 (worsening)
2024: 17.7
2025: 14.6
(improvement)
2022: 61
2023: 51 (decline)
2024: 57
2025: 63 (height)
Consistency of trends, different amplitude: both agencies show deterioration in 2023 and improvement by 2025, but the scale of fluctuations is higher for S&P
China Overseas Land & InvestmentReal estate2021–22: BB
2022–23: BBB
2024–25: A
2021–22: 16.0
2022–23: 16.1
2024: 13.7
2025: 13.9
S&P Global data appeared in 2024: inclusion in the Sustainability YearbookDifferent sensitivity to progress: MSCI records a gradual improvement (BB → A), Sustainalytics consistently rates the company as low risk, S&P “noticed” the company only at a late stage
BPEnergy2022: BBB
2023: BBB
2024: BB
2025: BB
2022: 28.3
(average)
2023: 29.1
2024: 30.5 (high)
2025: 31.2
2022: 65
2023: 63
2024: 60
2025: 58
Consensus trend (worsening), but varying levels: All three agencies show deterioration due to carbon loading, but absolute values and risk categories differ
Table 10. Ranking of indicators of the environmental block (E).
#IndicatorRelevanceFrequency in StandardsImpact on RisksSum
1Carbon intensity (Scope 1 + 2)3339
2Energy intensity of products3339
3Dynamics of greenhouse gas emissions3328
4Volume of discharged polluted water/treatment efficiency3238
5Number of environmental violations/fines3238
6Availability of an integrated environmental permit3137
7Water use (volume of water withdrawal per unit of production)3227
8Emissions of pollutants (SO2, NOx, dust) per unit of production3227
9The share of renewable energy in the energy balance2226
10Investments in environmental protection (% of revenue)2226
11Area of reclaimed land (for mining companies)3126
12Waste generation (volume per unit of output)3227
13Share of recycled waste/recycling rate2215
14Costs of eliminating accumulated environmental damage2125
15Availability of an environmental management system (ISO 14001 [103])2327
Table 11. Ranking of social block indicators (S).
#IndicatorRelevanceFrequency in StandardsImpact on RisksSum
1Lost Injury Frequency Rate (LTIFR)3339
2Investments in personnel training and development (% of payroll)3227
3Share of local content in procurement3238
4Transparency of social policy (presence of policies, reporting)2327
5The proportion of women on the board of directors and in top management2327
6Investments in social infrastructure (education, healthcare)3126
7Average salary relative to industry level2226
8Share of employees covered by collective agreements2215
9Staff turnover (%)3227
10Having a human rights and due diligence policy in place in the supply chain2327
11Percentage of employees who have completed occupational safety training3227
12Gender Equality Index2215
13Number of social conflicts/strikes2136
14The share of vacancies filled by local residents (regional aspect)3126
15Availability of programs to support indigenous peoples and local communities3126
Table 12. Ranking of management block indicators (G).
#IndicatorRelevanceFrequency in StandardsImpact on RisksSum
1Proportion of independent directors on the board3339
2Level of information disclosure (availability of ESG report, verification)3339
3Innovative activity (patents, R&D results, new technologies)3238
4The presence of an anti-corruption and compliance control policy3339
5Separation of the roles of the chairman of the board and the CEO2226
6The proportion of women on the board of directors2215
7The presence of a code of corporate ethics2327
8Supply Chain Disclosure (Scope 3)2327
9The presence of a sustainable development committee under the council2226
10Frequency of board meetings1214
11Availability of internal audit and risk management2327
12Transparency of the management remuneration system2226
13Having an anti-money laundering (AML) policy2226
14Implementation of digital ESG data management systems2125
15Participation in international ESG initiatives (UNGC, TCFD)2226
Table 13. Ranking of regulatory burden indicators (R).
#IndicatorRelevanceFrequency in StandardsImpact on RisksSum
1Share of ESG compliance costs in revenue3238
2Number of mandatory reporting requirements (number of regulators)3126
3Costs for external audit and verification of ESG data2226
4Fines and penalties for violation of ESG requirements (annual)3137
5Time spent on preparing reports (man-hours)2114
6Number of requests from regulators2114
Table 14. Ranking of indicators of extraterritorial pressure (EextEext).
#IndicatorRelevanceFrequency in StandardsImpact on RisksSum
1Share of exports to the EU/CBAM countries3238
2Availability of ISSB/CSRD certificates of conformity2338
3Share of exports to China 3126
4Participation in cross-border supply chains 2226
5Availability of a due diligence system for suppliers2226
Table 15. Ranking of adaptability indicators (A).
#IndicatorRelevanceFrequency in StandardsImpact on RisksSum
1Rate of decline of carbon intensity (annual rate)3238
2Investments in transformation (% of capital expenditures on modernization)3227
3ESG Rating Dynamics (Year-on-Year)2226
4The rate of implementation of new reporting standards2125
5The share of employees who have undergone retraining in ESG competencies2125
Table 16. Final indicators for calculating the company index.
BlockIndicatorTypeDirectionData Source
ECarbon intensity (Scope 1 + 2)QuantitativereverseEnvironmental reporting, emissions register
EEnergy intensity of productsQuantitativereverseCorporate reporting, statistics
EDynamics of GHG emissions (year-on-year)QuantitativestraightEnvironmental reporting
EVolume of discharged polluted water/treatment efficiencyQuantitativereverseEnvironmental reporting
ENumber of environmental violations/finesQuantitativereverseReports, regulator data
EAvailability of an integrated environmental permitBinarystraightEnvironmental Code
SLost Injury Frequency Rate (LTIFR)QuantitativereverseOccupational safety reporting
SShare of local content in procurementQuantitativestraightCorporate reporting
SInvestments in personnel training and development (% of payroll)QuantitativestraightCorporate reporting
STransparency of social policy (presence of policies, reporting)BinarystraightOpen data
GProportion of independent directors on the boardQuantitativestraightAnnual reporting
GLevel of disclosure (ESG report, verification)BinarystraightOpen data
GInnovative activity (patents, R&D results, new technologies)QuantitativestraightCorporate reporting
GThe presence of an anti-corruption and compliance control policyBinarystraightCorporate reporting
RShare of ESG compliance costs in revenueQuantitativereverse (enters with the–sign)Management reporting
EextShare of exports to the EU/CBAM countriesQuantitativestraightCustoms statistics
EextAvailability of ISSB/CSRD certificates of conformityBinarystraightCorporate reporting
ARate of decline of carbon intensity (annual rate)QuantitativestraightEnvironmental reporting
AInvestments in transformation (% of capital expenditures on modernization)QuantitativestraightCorporate reporting
Disclaimer/Publisher’s Note: The statements, opinions and data contained in all publications are solely those of the individual author(s) and contributor(s) and not of MDPI and/or the editor(s). MDPI and/or the editor(s) disclaim responsibility for any injury to people or property resulting from any ideas, methods, instructions or products referred to in the content.