Article

Spatial and Statistical Analysis of the Route Network of Public Transport in Almaty and Suburban Areas

by
Kuanysh Kosherbay
and
Aizhan Mussagaliyeva
*
Department of Geography, Land Management and Cadastre, Farabi University, 71, Al-Farabi Ave., Almaty 050040, Kazakhstan
*
Author to whom correspondence should be addressed.
Sustainability 2026, 18(16), 8504; https://doi.org/10.3390/su18168504
Submission received: 24 July 2026 / Revised: 17 August 2026 / Accepted: 17 August 2026 / Published: 19 August 2026

Abstract

This study presents a comprehensive spatial analysis of the public transport network across the Almaty agglomeration, encompassing 211 routes within eight urban districts and seven adjacent administrative divisions. Drawing on digitized geodata from 3634 unique bus stops, the research methodology integrates quantitative and qualitative spatial metrics, including distribution density, average stop spacing, elevation gradients, and topological connectivity. The analysis highlights significant territorial imbalances: while 70.53% of all unique stops are concentrated within Almaty’s city limits, the surrounding regional network is highly fragmented, with an average stop spacing of 2579.53 m. Furthermore, topographic assessments confirm substantial operational challenges for north–south routing due to steep elevation changes, reaching 984.48 m within the city and 1243.23 m regionally. A critical evaluation of topological connectivity reveals that 44.63% of suburban bus stops lack transfer intersections, underscoring severe deficits in peripheral public transport provision. By assessing 56 distinct connection types, the study categorizes administrative districts based on their route integration levels. Ultimately, the derived spatial parameters offer a robust evaluation of the current transport framework. These insights establish a crucial scientific and empirical foundation for optimizing route geometries, bridging infrastructural gaps, and guiding sustainable transit planning in alignment with Almaty’s transition toward a polycentric urban model. Furthermore, the developed 3D spatial-topological framework provides a scalable, data-driven blueprint for municipal authorities to prioritize infrastructure investments, deploy multimodal hubs and enhance transit equity in other rapidly growing and topographically complex agglomerations worldwide.

1. Introduction

Almaty is located in the southern part of the Republic of Kazakhstan and covers an area of 683.5 km2. Almaty is a city of national significance and has the largest population in the country (over 10%), with 2.35 million residents as of the beginning of 2026. Almaty’s population growth has changed structurally over the past 10 years. While natural growth and net migration accounted for a 1:1 increase 10 years ago, net migration currently accounts for 65% of the total population growth, driven by accelerated urbanization. In the context of the Almaty agglomeration, the population for 2024 is: Konaev city administration has 65.8 thousand residents; Enbekshikazakh district, 284.8 thousand residents; Zhambyl district, 170.1 thousand residents; Karasay district, 354.3 thousand residents; Talgar district, 255.1 thousand residents and Ili district has 234 thousand residents. In early January 2024, the city of Alatau was formed, located within the Ili and Talgar districts of the Almaty region. At the beginning of 2026, the population of the Alatau city administration was 51.9 thousand residents. Based on CCTV camera data, more than 170 thousand unique vehicles enter Almaty daily due to commuting, while mobile operator data estimates the additional commuting load on the city at 500 thousand people [1]. At the beginning of 2026, the city of Almaty is served by 211 routes within 8 districts: Alatau, Almaly, Auezov, Bostandyk, Zhetysu, Medeu, Nauryzbay and Turksib [2] The route network is not limited to the administrative borders of the city of Almaty and covers a number of administrative units of the Almaty region within the Almaty agglomeration and beyond. The list of administrative divisions of the Almaty region includes the city administrations of Konaev and Alatau, as well as Ili district in the northern direction from Almaty; Enbekshikazakh and Talgar districts in the eastern and northeastern directions from the city; Karasay and Zhambyl districts in the western direction from Almaty. Of the 211 routes, 202 (95.7%) are bus routes, and 9 (4.3%) are trolleybus routes. The trolleybus network, originally established during the Soviet era, has seen limited modern development and is currently significantly outpaced by the bus network. The advantage of trolleybuses over buses is a higher level of predictability during movement, since there is dependence on engineering networks, which in turn reduces the potential level of accidents. A previous study conducted in 2022 on the state of public transport in Almaty established that the network at the time comprised 154 routes with a total length of 6805 km [3]. Developing a comprehensive transport framework is fundamental to long-term emission reduction strategies, since the atmospheric basin of Almaty is under daily load of traffic flows, which is confirmed by the presence in the city of 2018 of 1/7 of all registered vehicles in the republic [4]. One of the reasons for environmental threats may be the lack of the necessary level of connectivity, which is confirmed in a survey from 2022, where 45.1% of respondents named transfers from route to route as one of the main reasons to abandon the use of public transport [5]. The reason may also be that the average mileage and age of cars are increasing every year. For example, in 2016, 12,314 public transport units operated in networks in Kazakhstan, and the number of buses exceeding 10 years of operation was about a third of the total (31%) [6]. All of the above aspects have an impact on the level of network service to one degree or another, which will be noted in the section on the research base.
However, it is essential to acknowledge that the actual usage of public transport is a multifaceted phenomenon. While spatial accessibility and the structural topology of the route network are foundational to urban mobility, passenger mode choice is simultaneously driven by a complex set of sociodemographic factors. Previous research has extensively characterized this dynamic; for instance, the application of logit models has demonstrated that variables such as age, employment status, and vehicle ownership critically influence the choice of public transport for daily commuting, as evidenced by case studies in large urban agglomerations like the Górnośląska-Zagłębiowska Metropolis in Poland [7].
The assessment of spatial accessibility and connectivity of the route network of the Almaty agglomeration is inextricably linked with key strategic documents defining the vector of development of the city of Almaty. The fundamental course for the transformation of urban mobility is laid down in the document of the Annex to the decision of the Maslikhat of Almaty dated 13 December, 2019 No. 415 “Strategy for the development of Almaty until 2050” and detailed in the document of the Annex to the decision of the Maslikhat of Almaty dated 2025 “Program for the development of Almaty for 2026–2030” [8,9]. According to the Almaty City Development Strategy until 2050, the share of trips by public transport is planned to increase from 31% in 2020 to 60% in 2050. One of the measures outlined is the expansion of the suburban transport network within the Almaty metro region. As part of the Almaty city development plan for 2026–2030, the BRT line length is planned to increase to 296 km by 2030, with a daily passenger flow of 400 thousand passengers. The city also plans to build hubs in the east with 5 urban and 7 suburban routes and in the west with 17 urban and 12 suburban routes. These hubs serve as points of intersection with alternative modes of public transportation planned for the aforementioned strategy, namely, LRT, metro and Sky Train. By 2040, 2 LRT lines, totaling 32.5 km, are planned, delivering a daily passenger flow of 95 thousand passengers. An extension of the existing metro line to the western hub will increase passenger flow to 220 thousand passengers per day. A second metro line extension to the airport will increase passenger traffic to 320 thousand passengers per day, while a third extension to the transport hub in the north near the city of Alatau could increase passenger traffic to 500 thousand passengers per day. The most important focus of these documents is the integration of the city with the adjacent agglomeration, which is also reflected in the Decree of the Government of the Republic of Kazakhstan dated 28 February 2020 No. 88 “On approval of the Interregional Action Plan for the development of the Almaty Agglomeration until 2030” [10]. The Almaty agglomeration development project through 2030 includes plans to expand the public transportation network to the special economic zone where the industrial cluster is located. A strategy for organizing a public transportation network in the special urban development regulation zone within a 10–15 km radius of Almaty in the Talgar, Ili, and Karasay districts is also planned. This plan also includes developing rail transportation within the agglomeration, specifically connecting the city of Alatau and the village of Kazybek-Bek in the Zhambyl district of Almaty region, west of Almaty, as well as developing the Almaty-Konaev and Almaty-Uzynagash commuter routes. A special place in strategic planning is occupied by the Decree of the Government of the Republic of Kazakhstan dated No. 349 “On the Master Plan of Almaty City” and “The Program for the development of Almaty until 2025 and medium-term prospects until 2030” with the transition from a monocentric model to a polycentric one [11,12]. According to the Master Plan of Almaty, by 2040 it is planned to increase the length of public transport lines from 1013.3 km in 2020 to 1456.6 km in 2040, where bus routes are planned to increase from 746 km in 2020 to 911.6 km in 2040, and trolleybus routes are planned to increase from 172.6 km in 2020 to 218 km in 2040. As part of the Almaty city development program through 2025 and medium-term prospects through 2030, it was noted that 11% of inquiries to the city mayor’s office were related to the quality of public transport service. Buses and trolleybuses account for 95% of the city’s passenger traffic. The average speed on dedicated lanes is fixed at 25 km/h, while in general traffic, it drops to 15–17 km/h. The program also notes the unjustified nature of long routes and the lack of high-quality connections between the city and the suburbs. 76% of routes are longer than 15 km and account for 8% of passenger traffic–about 110 thousand trips. Routes shorter than 10 km, which constitute less than 9%, account for 60% of passenger traffic–about 830 thousand trips. The city is forced to subsidize inefficient routes, where the longer the trip, the lower the economic return, and insufficient capacity means lower revenue. Drivers are also under pressure, as they are forced to travel for approximately 2–2.5 h without a break on long routes. The allocation of five new polycenters (“Eastern Gate”, “Western”, “Northern”, “Southwestern” and “Historical Center”) requires a complete revision of the topology of the route network. The study found that current transport links mainly transit through the historical core (Almaly and Medeu districts of Almaty), creating an excessive load on the central part of the city. The polycenter strategy involves the creation of transfer hubs aimed at decentralizing traffic. For example, the transport provision of the new polycenters “Western Gates” and “Eastern Gates”, as well as the construction of new arterial connections along Raiymbek Avenue, directly correlate with the need to increase the coefficient of inter-district intersections on the periphery, which is confirmed by our topological connectivity metrics. The practical implementation of spatial alignment is laid down in the document “Master plan of the transport framework of Almaty until 2030” [13]. The Almaty 2030 transportation master plan challenges include the share of trips by private vehicle, which stands at 68%. The complex geometry of public transportation routes is also noted. The percentage of the population living less than 500 m from a stop is 39%. These factors are compounded by the high concentration of jobs in the city center, which is 60%, while the share of people living outside the center is 55%. Another important factor is the high share of external traffic, which accounts for 30–40% of trips in the city. As it was revealed in the altitude metrics, the gradient drop of over 900 m from north to south critically complicates the operation of traditional buses. Electrified rail transport has a higher level of predictability in areas with complex topography. In addition, the greening of rolling stock included in the master plan echoes the pressing issues of urban ecology. The transfer of citizens to integrated public transport is considered as a key tool for reducing emissions into the atmospheric basin of Almaty, along with the modernization of thermal power plants and the management of emissions from stationary sources.
In the context of rapid urbanization and the expansion of urban agglomerations, the creation of a sustainable and balanced public transport system is a key factor in the spatial development of cities [14]. Effective provision of population mobility not only reduces the burden on road transport infrastructure, but also is the foundation for economic growth and improving the quality of life of citizens [15]. In recent decades, the paradigm of transport planning has shifted from purely engineering approaches (increasing road capacity) to concepts of mobility and spatial accessibility, which requires the use of structural information methods for assessing route networks [16].
International practice shows that deep spatial analysis is increasingly being used to assess the quality of public transport [17]. Advanced research is based on processing arrays of vector spatial data, such as GTFS (General Transit Feed Specification) formats, which makes it possible to accurately determine coverage areas, identify “blind spots” and analyze the topology of the route network [18]. At the same time, the key quantitative metrics are the density of stops, the average distances between them, as well as the number of route intersection points that determine the level of transit integration and the convenience of seamless transfers [19,20].
The concept of spatial justice of public transport occupies a special place in modern scientific articles. As emphasized in international practice, spatial accessibility of transport infrastructure directly affects social inclusion and public access to jobs [21,22,23]. International cases show that the distribution of routes is often uneven. For example, a spatial analysis of the bus route network in Latin American megacities (Belo Horizonte, Brazil) revealed a strong imbalance: a high concentration of routes and intersections in commercial centers with a critical lack of coverage on the periphery, which leads to social exclusion of residents of remote areas [24]. Similar problems of network fragmentation and spatial inequality were identified in the analysis of BRT high-speed bus lines in Jakarta (Indonesia) and public transport systems in Accra (Ghana) and Mexicali (Mexico), where inadequate transport infrastructure cannot cope with passenger traffic due to the lack of inter-district connectivity [25,26,27].
Research in the United States, covering large agglomerations at the regional and municipal levels, proves that regional averaging of metrics often hides local infrastructure gaps, and therefore spatial analysis must be carried out at the micro level, taking into account each individual stop and its topological connections [28]. The use of cluster analysis makes it possible to identify anomalies in the distribution of transfer nodes and optimize transit geometry [29]. A similar approach using a composite spatial index of social needs was used to evaluate the route network of Jeddah (Saudi Arabia) and Bogor (Indonesia), proving the effectiveness of using GIS to identify areas with high demand but low supply of transport services [30,31].
An important but insufficiently studied aspect of spatial modeling of route networks in world practice is the influence of physical geography, in particular complex terrain and topography (elevation differences). Studies examining routing in tourist or mountainous regions emphasize that the presence of significant slopes and elevation gradients (Z coordinate) directly affects the spatial accessibility of pedestrian approaches to stops, energy consumption (especially for trolleybus and electric networks), and schedule predictability [32,33].
The city of Almaty, located in the foothills of the Ili-Alatau, is a unique object for spatial analysis. On the one hand, the city is undergoing a stage of active polycentric development and the formation of an extensive agglomeration, which brings it closer to the fast-growing megacities of developing countries. On the other hand, the pronounced elevation gradient (the height difference from north to south) creates additional challenges for the organization of a unified and predictable transport framework. The existing route network, which includes 211 routes (bus and trolleybus) and covers both urban areas and adjacent territories of the Almaty region, requires a comprehensive assessment of spatial gaps and topological connectivity.
Despite the extensive body of literature on urban mobility, a critical research gap remains in the spatial modeling of transit networks within rapidly expanding, topographically complex agglomerations. Existing transport analyses predominantly rely on two-dimensional routing paradigms and isolated intra-city evaluations. They frequently employ regional averaging techniques that obscure severe micro-level infrastructural deficits in suburban zones. Furthermore, traditional transit planning models consistently overlook the impact of extreme physical geography, such as significant vertical elevation gradients, on public transit operational feasibility, spatial equity, and topological connectivity.
To bridge this gap, this study introduces a scientifically novel approach by transitioning from conventional linear engineering models to a multidimensional, micro-level spatial analysis. Unlike existing transport analyses that evaluate urban cores in isolation, this study provides the first comprehensive, cross-border spatial evaluation of the Almaty agglomeration, a major Central Asian city. By analyzing 211 routes and 3634 unique, verified stops across 8 city districts and 7 adjacent regional divisions, this research uniquely quantifies topological connectivity and route integration at the critical interface between the city and its suburbanizing periphery.
The core innovation of this research lies in the integration of three-dimensional geodata (X, Y, and Z coordinates) to mathematically model the influence of pronounced foothill terrain on the predictive management of the transport framework. By evaluating an elevation drop exceeding 1200 m, this study quantifies topographic constraints that have previously been ignored. This three-dimensional topological analysis establishes a highly innovative methodology for evaluating transit seamlessness and explicitly mapping suburban “transport deserts” where transfer intersections are entirely absent.
Ultimately, the objective of this study is to move beyond theoretical urban planning and provide a robust, data-driven empirical foundation. The derived spatial parameters are designed to operationalize Almaty’s transition to a polycentric development model, eliminate localized infrastructure gaps, and serve as a scalable analytical blueprint for other global agglomerations facing similar topographic and structural challenges.

2. Methods

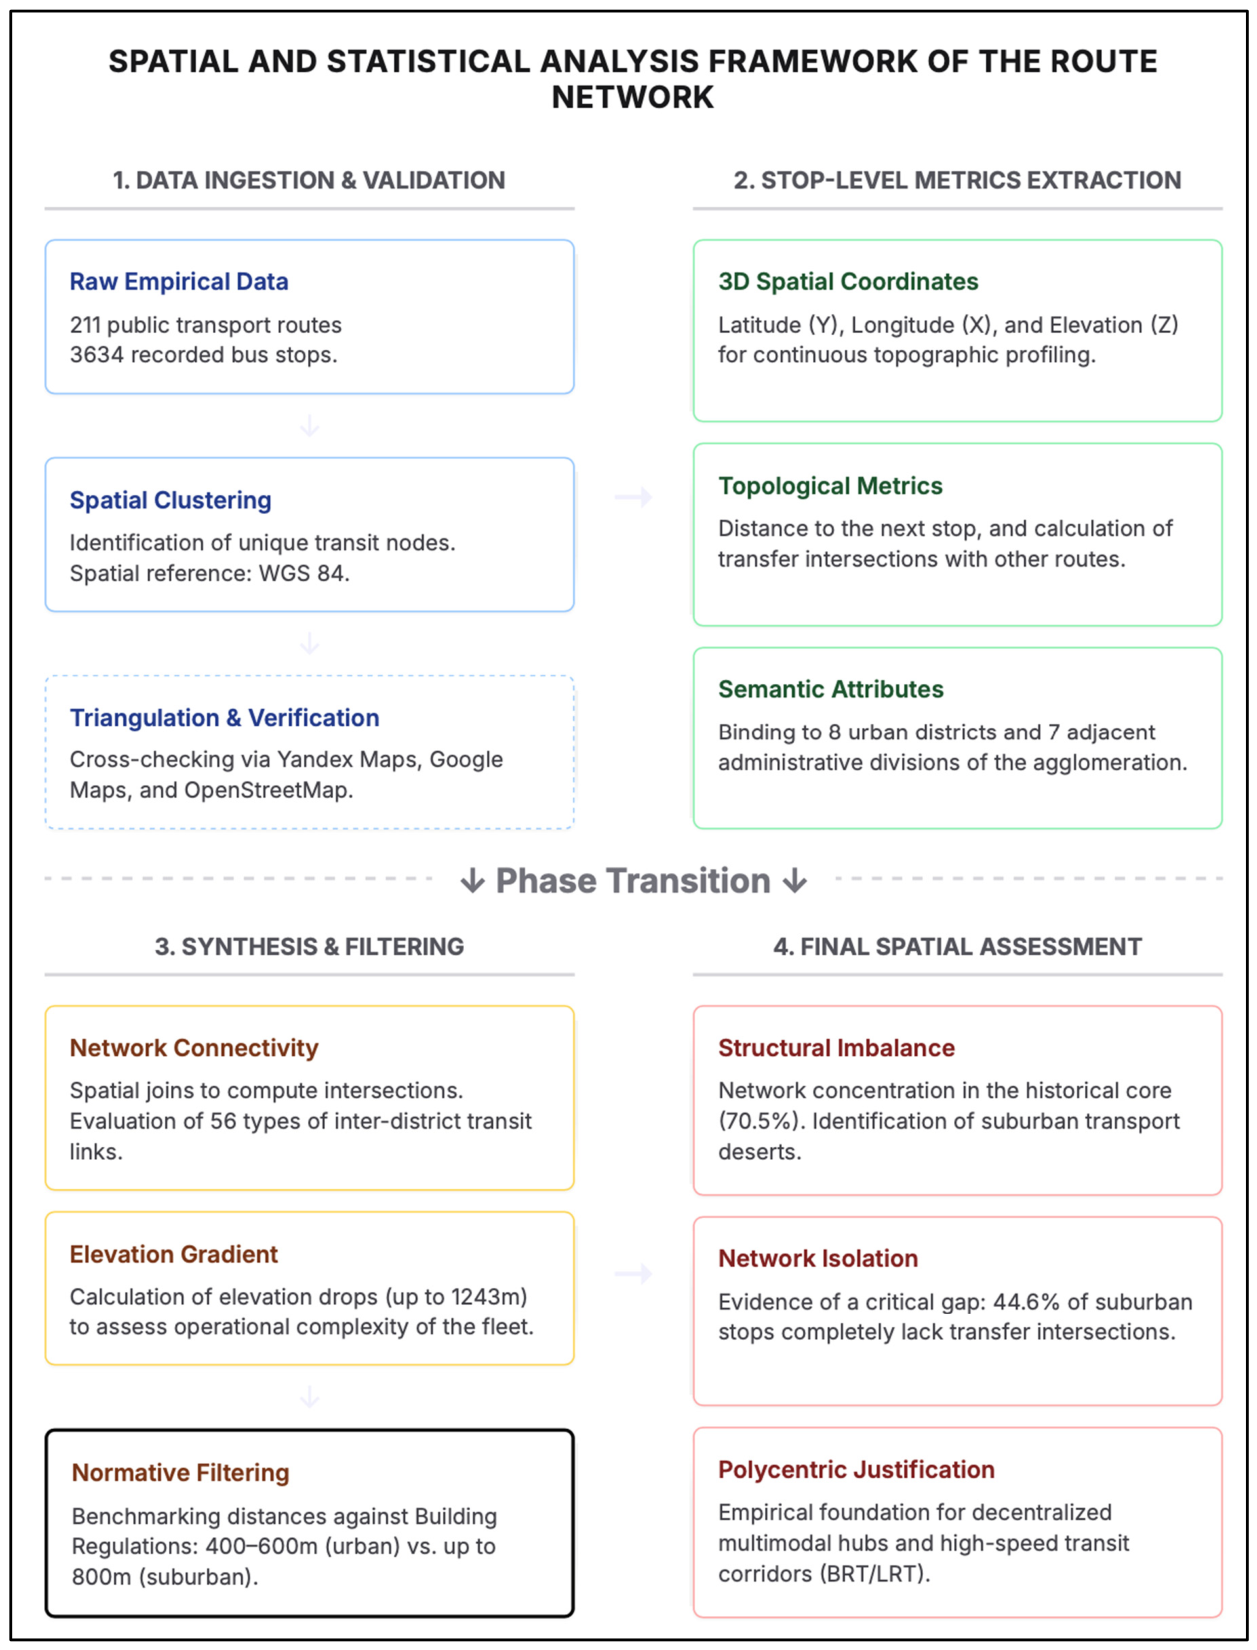
The spatial analysis methodology is based on quantitative metrics for 211 routes, which were used to derive qualitative metrics that assess differences in indicators that potentially affect the quality of public transport service. The main quantitative metrics and descriptive characteristics for routes include data on stopping points: name, X and Y coordinates (longitude and latitude), height (Z coordinate), administrative area, distance to the next stopping point and the number of intersections with other routes (Figure 1).

2.1. Analytical Framework and Methodological Contribution

The methodological contribution of this research lies in the development of a comprehensive 3D Spatial-Topological Framework for transit network evaluation. Unlike conventional transport studies that rely on descriptive line-segment mapping, this study proposes a multidimensional node-edge analytical method. The core innovation of this model is the integration of predictive regional development analytics, which transforms raw transit coordinates into structured spatial indices. This analytical framework generates a robust, data-driven foundation capable of feeding directly into interactive monitoring modules for municipal executives, ensuring that polycentric development policies are guided by empirical infrastructure metrics rather than theoretical assumptions. Additional sources for data verification were data from the Yandex Maps (JavaScript API v3.0), Google Maps (Maps JavaScript API v3) and OpenStreetMap platforms (Overpass API v0.6) [34,35,36].

2.2. Data Ingestion and the Principle of Spatial Clustering

The empirical foundation of this study comprises data from 211 public transport routes, encompassing a gross dataset of 16,862 route occurrences. To transition from raw route trajectories to a functional topological model, a rigorous spatial clustering procedure was implemented. Because multiple routes often utilize the same physical infrastructure, a spatial clustering algorithm with a predefined tolerance buffer was applied to the coordinate arrays. Specifically, geocoded stopping points located within a strict spatial proximity threshold (reflecting the physical dimensions of a standard transit platform) were geometrically aggregated and isolated as single, unique transit nodes. All coordinates were standardized in the WGS 84 spatial reference system. This clustering principle resulted in the identification of 3634 unique stopping points, eliminating data redundancy and ensuring high geometric accuracy for subsequent topological modeling.
According to subparagraph 11.19 “Public passenger transport and pedestrian traffic network” of paragraph 11 “Transport and road network” of the Building Regulations of the Republic of Kazakhstan, the distances between stops on public passenger transport lines within the territory of settlements should be 400–600 m for buses, trolleybuses and trams [37]. According to the note of subparagraph 11.18 “Public passenger transport and pedestrian traffic network” of paragraph 11 “Transport and road network” of the Building Regulations of the Republic of Kazakhstan, in areas of individual estate development, the range of pedestrian approaches to the nearest public transport stop can be increased in large, large and major cities to 600 m, and small and medium-sized cities-up to 800 m [37]. This norm in the framework of the city of Almaty takes values in the range of 400–600 m, and in the case of administrative units of the Almaty region-up to 800 m.

2.3. Spatial Metrics and Index Modeling

To justify the scientific novelty of the model, the analytical structure is built upon three primary spatial indices derived from quantitative route metrics. First, the Spatial Accessibility Index (walkability) is calculated via the average distance to the next stopping point. This metric is benchmarked against the Building Regulations of the Republic of Kazakhstan, which mandate distances of 400–600 m for urban areas and up to 800 m for suburban zones, effectively exposing network fragmentation and identifying peripheral “transport deserts”. Second, the Topographic Resistance Index utilizes extracted Z-coordinates (elevation) to construct a continuous topographic profile for calculating elevation gradients. By assessing elevation drops across the network, this index mathematically models the operational complexity, energy constraints, and schedule predictability of the fleet across the agglomeration’s pronounced foothill terrain. Finally, the Topological Connectivity Index is determined by spatial join functions that compute the number of route intersections at each unique transit node. This qualitative metric assesses the level of inter-district transit links by evaluating 56 types of connections, ultimately quantifying the seamlessness of passenger transfer opportunities.
To structure the descriptive statistical analysis, the administrative units were grouped into 3 ordinal categories (Category I—highest, Category II—medium and Category III—lowest) based on natural gaps in the data. The specific numerical boundaries applied for the topological metrics are as follows: for the number of connected districts, the boundaries are 9–11 (Category I), 6–8 (Category II) and 1–5 (Category III); for the volume of connected routes, the boundaries are 34–68 (Category I), 17–22 (Category II), and 1–7 (Category III). This logical grouping based on observed data distribution gaps was utilized to categorize the network’s structural performance rather than employing automated statistical clustering algorithms.

2.4. System of Statistical Testing

To validate the identified infrastructural imbalances, a system of statistical testing is integrated into the analytical method. First, non-parametric variance analysis (such as the Kruskal–Wallis H-test) is proposed to evaluate the statistical significance of disparities in transit node density and stop spacing across the 8 urban districts and 7 adjacent administrative divisions. Second, spatial autocorrelation analysis (Global Moran’s I) is utilized to statistically test the clustering of isolated transit nodes (e.g., the 44.63% of suburban stops lacking intersections). This statistical rigor ensures that the observed spatial asymmetry between the historical core and the suburban periphery is empirically validated rather than purely observational. To pinpoint specific inter-district differences following a significant Kruskal–Wallis test, Dunn’s post hoc test with a Bonferroni correction was applied for pairwise comparisons among the 15 administrative units and the detailed results for key core-periphery pairs are presented in the Results Section. For the spatial autocorrelation analysis (Global Moran’s I), the spatial weights matrix was operationalized using an inverse distance relationship (1/dij), encompassing all transit nodes without a fixed distance threshold, to reflect the continuously diminishing influence of nodes as pedestrian walking distance increases. The spatial weights were row-standardized to account for the uneven distribution and unequal density of stops across the network.

2.5. Spatial Decision-Support Procedure for Network Planning

Building upon the derived indices, the study proposes a spatial decision-support procedure designed to identify and rectify topological inefficiencies. Rather than a formal mathematical optimization model, this analytical framework functions as a planning protocol. It is conceptually driven by two primary objectives: prioritizing the reduction in variance in stop spacing to align with normative walking distances and enhancing the Topological Connectivity Index at strategic peripheral nodes. By mapping transit nodes with high intersection volumes against areas with zero intersections, the spatial overlay procedure mathematically exposes systemic bottlenecks. GenAI was utilized to create statistical visualizations (e.g., graphs, pie charts, etc.) and to bring it to a unified stylistic structure based on creating pipeline with details of transition process from raw data to the final research outcome within the study.

3. Results

3.1. Analysis Based on Unique Stops

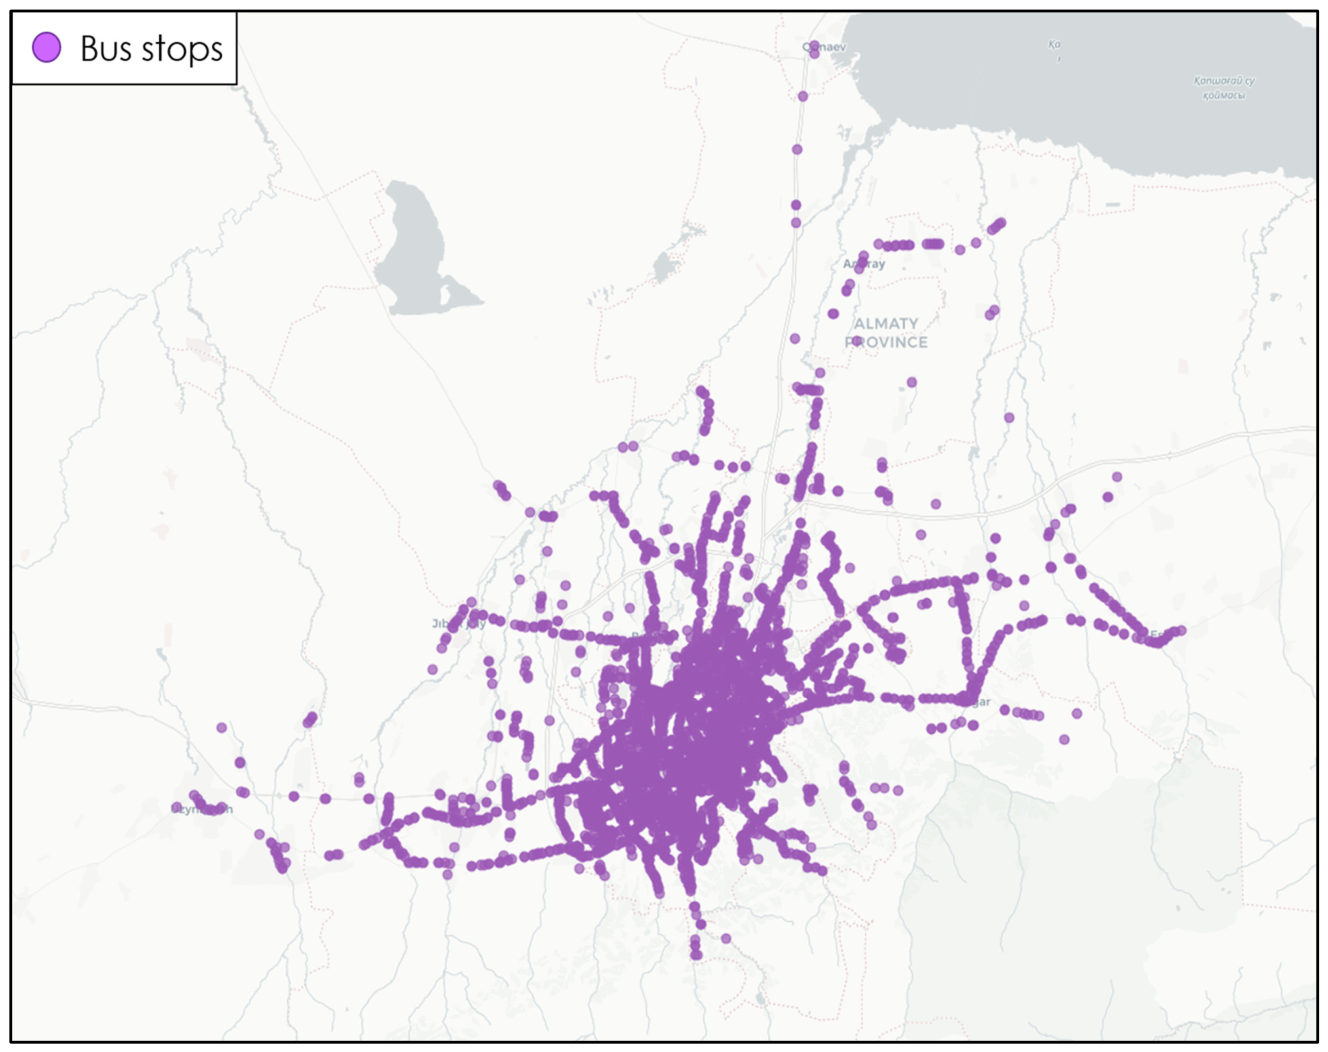
3634 unique stops have been digitized along 211 routes using Google Earth Pro software (Figure 2) [38].
Within the administrative districts of the agglomeration, their distribution out of the 3634 stopping points is as follows in Table 1.
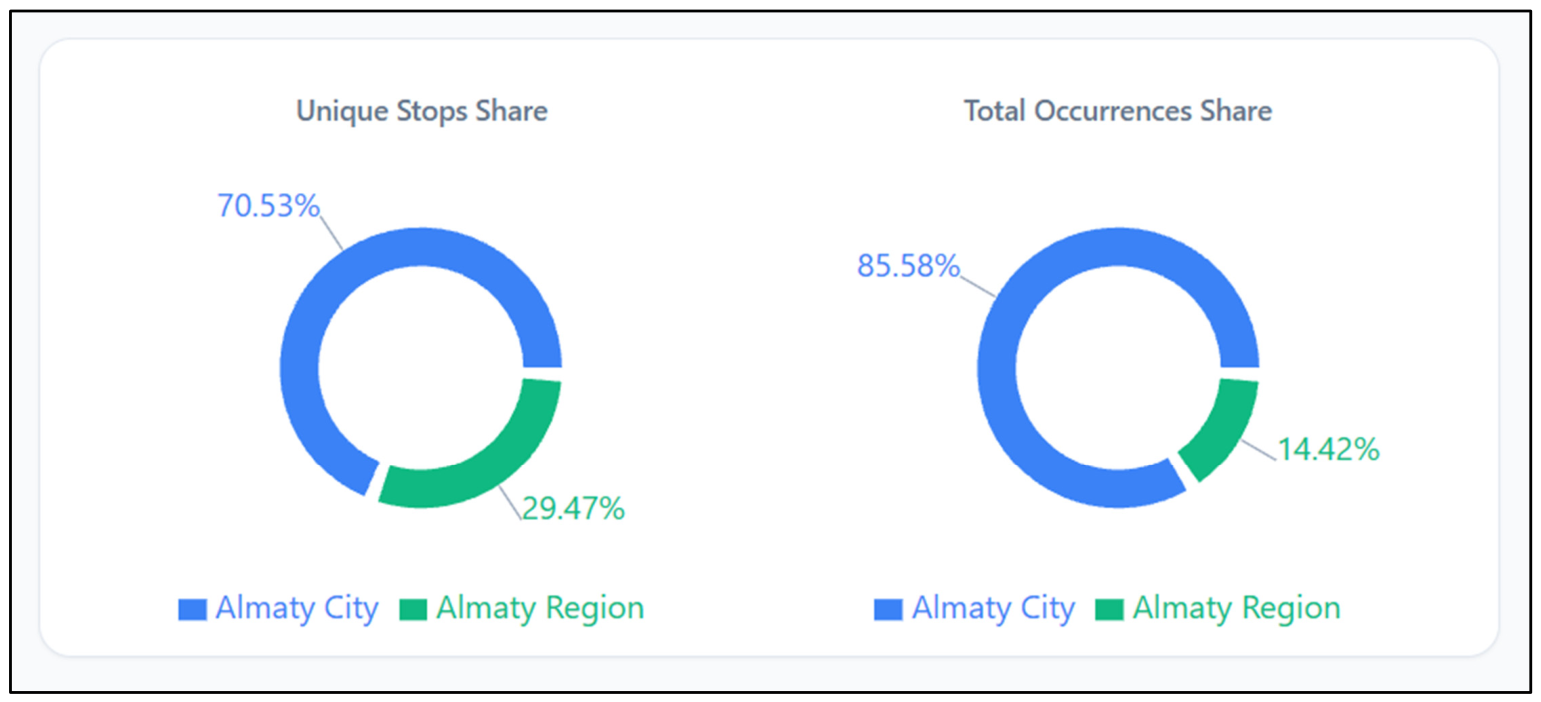
As part of the quality categorization based on the number of unique points, the first category, featuring the highest number of unique stopping points, includes Alatau, Bostandyk, Medeu, and Turksib districts of Almaty city, as well as Talgar district of the Almaty region. The second category, with an average number of unique stopping points, includes Almaly, Auezov, Zhetysu, and Nauryzbay districts of Almaty city, along with Ili and Karasay districts of the Almaty region. The third category, which has the lowest number of unique stopping points, consists of Konaev and Alatau city administrations, as well as Enbekshikazakh and Zhambyl districts of the Almaty region. In percentage terms, the distribution between city and regional administrative units is 70.53% to 29.47%.
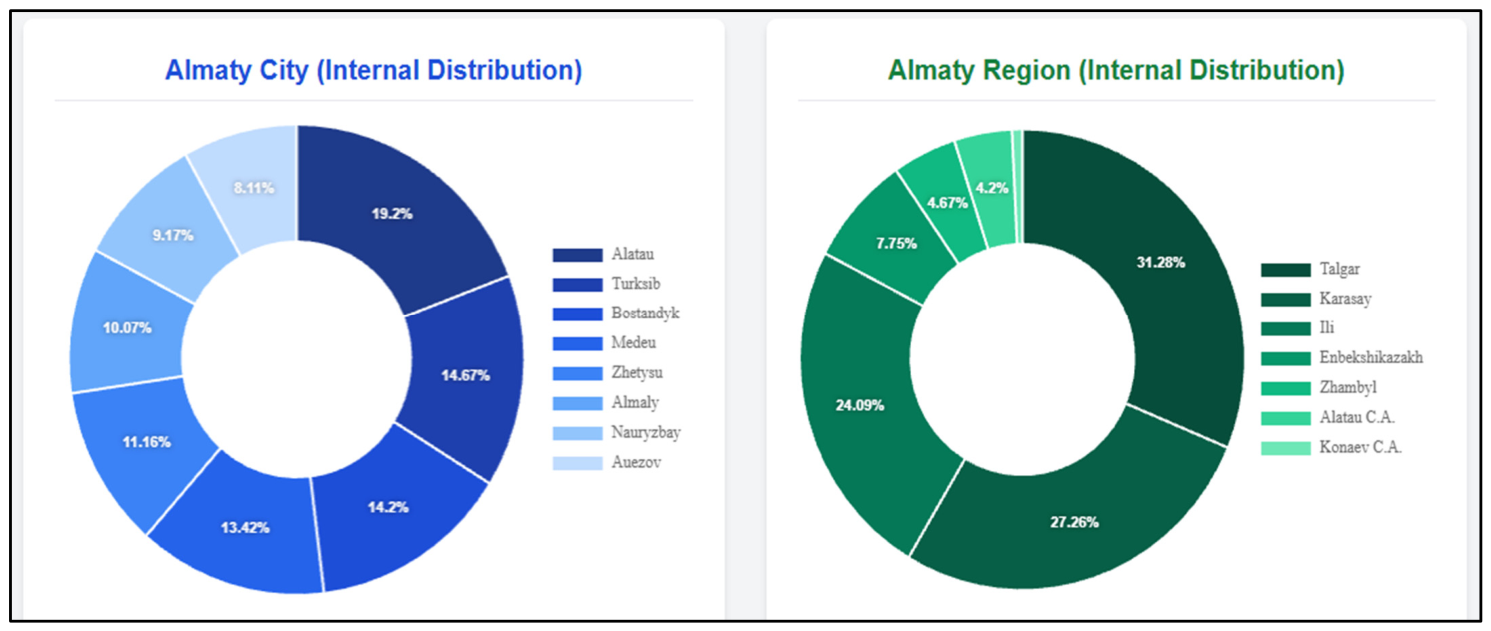
The separate distribution of unique stopping points is demonstrated in Figure 3. When categorizing the city districts, the first category, with the highest number of unique stopping points, includes Alatau district; the second includes Bostandyk, Medeu, and Turksib districts; and the third comprises Almaly, Auezov, Zhetysu, and Nauryzbay districts. According to the categorization of the Almaty region based on the number of unique stopping points, the first category includes Talgar, Ili, and Karasay districts; the second includes Alatau city administration as well as the Enbekshikazakh and Zhambyl districts; and the third, with the lowest number of unique stopping points, consists of Konaev city administration.
The 3634 unique transit stops occur 16,862 times during service by units of the route network. Within the administrative districts of the agglomeration, their distribution out of the 16,862 recurrences is as follows in Table 2.
In the context of categorization based on the number of recurring stopping points, the first category includes Alatau, Zhetysu, Medeu, and Turksib districts of Almaty city; the second category includes Almaly, Auezov, Bostandyk, and Nauryzbay districts of Almaty city; and the third category comprises 2 city administrations and 5 districts of the Almaty region. In percentage terms, the distribution between city and regional administrative units is 85.58% to 14.42%. Compared to unique stopping points, when evaluating the frequency of recurrence, the percentage ratio between Almaty city and the Almaty region changes. When comparing unique stopping points to the total number of recorded instances, the percentage of city stopping points increases from 70.53% to 85.58%, while the share of the Almaty region decreases from 29.47% to 14.42% (Figure 4).
When considering the distribution separately by administrative units (Almaty city and the Almaty region), the percentage breakdown in the city is as follows:
  • Alatau—18.12%;
  • Turksib—15.01%;
  • Medeu—14.19%;
  • Zhetysu—13.3%;
  • Bostandyk—11.29%;
  • Auezov—11.15%;
  • Almaly—9.34%;
  • Nauryzbay—7.6%.
The categorization of Almaty city districts by the number of recurrence entails assigning Alatau district to the first category; Auezov, Bostandyk, Zhetysu, Medeu, and Turksib districts to the second category; and Almaly and Nauryzbay districts to the third category. In the Almaty region, the situation in percentage terms is as follows:
  • Talgar—34.38%;
  • Ili—32.15%;
  • Karasay—22.94%;
  • Enbekshikazakh—5.14%;
  • Alatau city administration—2.88%;
  • Zhambyl—2.14%;
  • Konaev city administration—0.37%.
According to the categorization of the administrative units of the Almaty region based on the number of recurring stopping points, the first category includes Talgar and Ili districts, the second includes Karasay district, and the third comprises Enbekshikazakh and Zhambyl districts, as well as Konaev and Alatau city administrations.
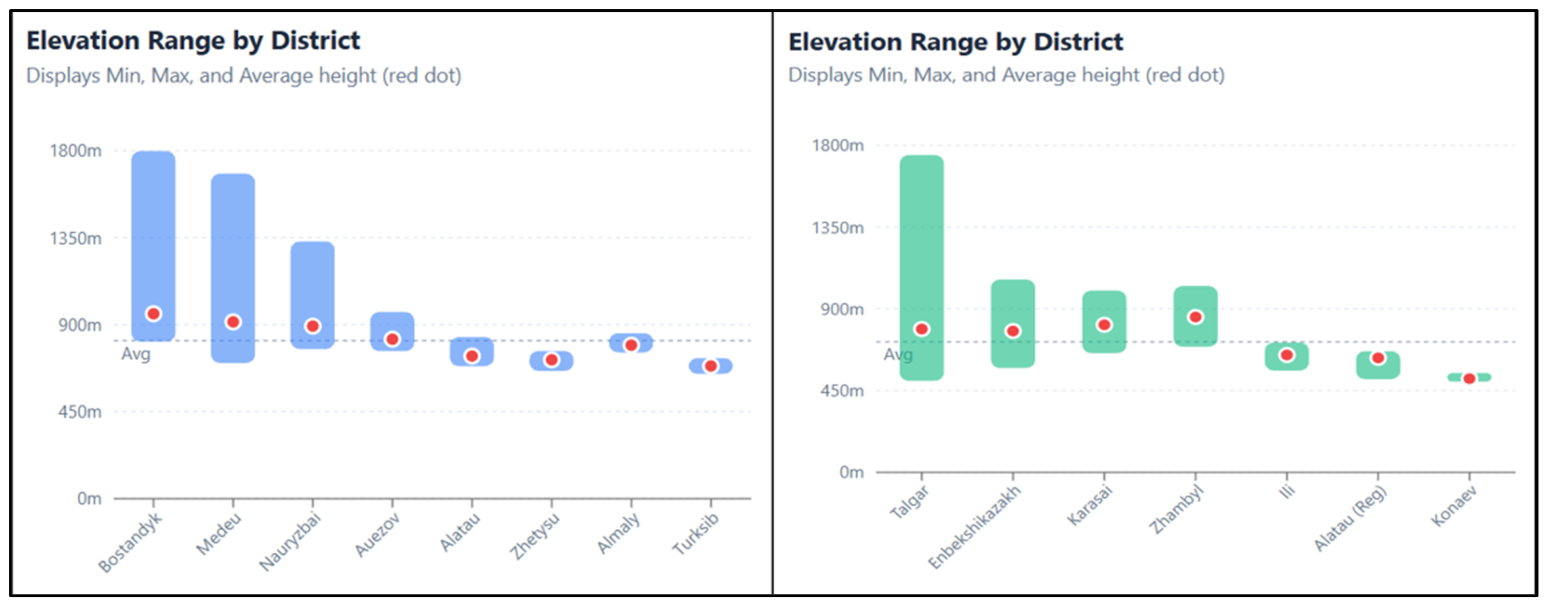
The next parameter for the spatial assessment of stopping points by administrative units was designated as the service terrain (Figure 5), which includes the average, maximum, and minimum elevation, as well as the level of elevation difference between the maximum and minimum service elevation. A higher level of elevation difference may indicate an increased level of difficulty in providing public transport services, as the city’s terrain entails an increase in elevation from north to south. The average elevation of stopping points across the city is 818.62 m. Above this value are Auezov (825.45 m), Bostandyk (956.98 m), Medeu (915.13 m), and Nauryzbay (892.99 m) districts. Below the average value of 818.62 m are Alatau (738.22 m), Almaly (794.61 m), Zhetysu (719.04 m), and Turksib (686.71 m) districts. In terms of elevation difference, the greatest variance is observed in the southern part of the city: Bostandyk (maximum elevation—1797.99 m; minimum—813.51 m; elevation difference—984.48 m), Medeu (maximum elevation—1681.45 m; minimum—702.24 m; elevation difference—979.21 m), and Nauryzbay (maximum elevation—1330.93 m; minimum—774.43 m; elevation difference—556.5 m) districts. For the other 5 districts of the city, the elevation differences do not reach high values: Alatau (maximum elevation—836.75 m; minimum—686.29 m; elevation difference—150.46 m), Almaly (maximum elevation—856.46 m; minimum—757.59 m; elevation difference—98.87 m), Auezov (maximum elevation—965.81 m; minimum—764.06 m; elevation difference—201.75 m), Zhetysu (maximum elevation—764.53 m; minimum—661.14 m; elevation difference—103.39 m), and Turksib (maximum elevation—726.67 m; minimum—646.6 m; elevation difference—80.07 m) districts.
For the Almaty region, the average elevation of stopping points is 718.81 m. Above the average value are Enbekshikazakh (778.71 m) and Talgar (789.69 m) districts to the east and north-east of the city, and Karasay (813.07 m) and Zhambyl (856.04 m) districts to the west of Almaty. Below the average value are Ili district (646.9 m) and Konaev (516.45 m) and Alatau (630.78 m) city administrations. In terms of elevation differences, the highest values are recorded in Talgar (maximum elevation—1747.84 m; minimum—504.61 m; elevation difference—1243.23 m), Enbekshikazakh (maximum elevation—1062.4 m; minimum—574.89 m; elevation difference—487.51 m), Karasay (maximum elevation—1001.39 m; minimum—657.26 m; elevation difference—344.13 m), and Zhambyl (maximum elevation—1026.21 m; minimum—692.17 m; elevation difference—334.04 m) districts, while the minimum values are in the Ili district (maximum elevation—715.31 m; minimum—561.11 m; elevation difference—154.2 m) and Konaev (maximum elevation—547.08 m; minimum—500.53 m; elevation difference—46.55 m) and Alatau (maximum elevation—667.39 m; minimum—513.89 m; elevation difference—153.5 m) city administrations. These values confirm, as in the case of the city districts, a higher level of difficulty when servicing the city from north to south compared to the west–east and east–west directions.
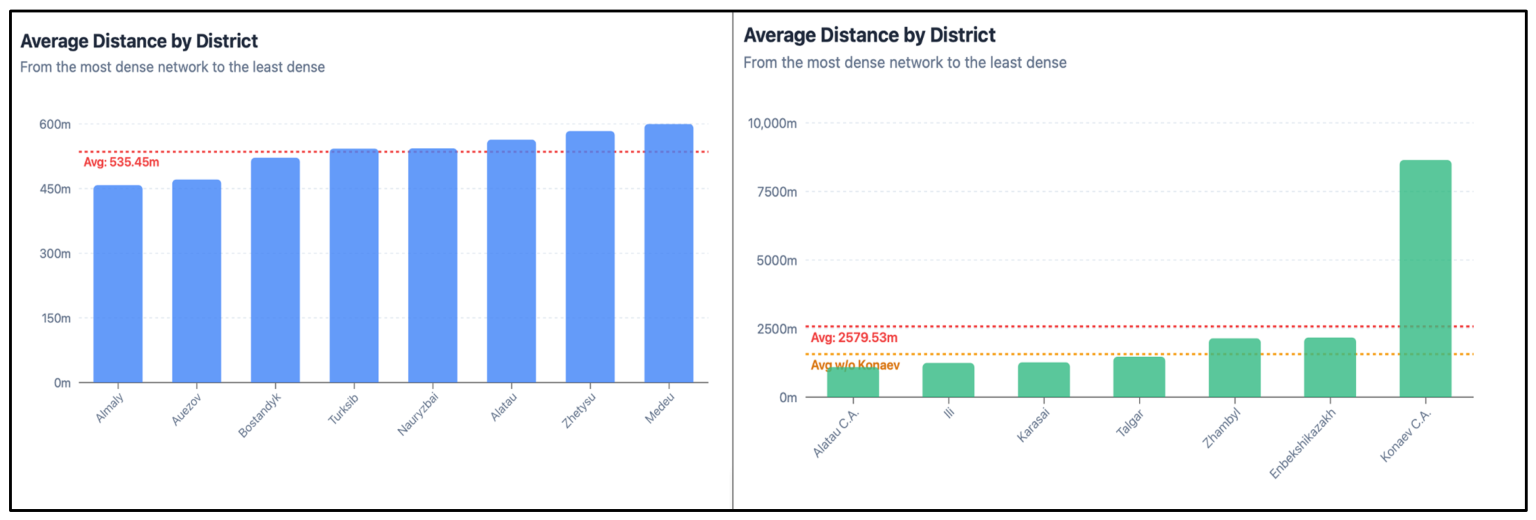
The next parameter for the spatial assessment of stopping points is the average distance to the next stopping point (Figure 6). The average value for Almaty city is 535.45 m. Below this value are Almaly (458.1 m), Auezov (471.14 m), and Bostandyk (521.61 m) districts, while above it are Alatau (563.39 m), Zhetysu (583.47 m), Medeu (599.81 m), Nauryzbay (543.35 m), and Turksib (542.74 m) districts. When evaluating the average distance, both high and low values are found across all administrative districts of Almaty, which indicates periodic gaps within the operation of the public transport network. The maximum values across the city range from 1268.06 m (Almaly district) to 9610.56 m (Alatau district), and the minimum values range from 31 m (Turksib district) to 175.09 m (Auezov district).
Within the Almaty region, the average distance to the next stopping point is 2579.53 m, which indicates a high level of gaps between stopping points. Below this value are Alatau city administration (1097.51 m) and Enbekshikazakh (2175.52 m), Talgar (1476.23 m), Ili (1246.44 m), Karasay (1270.16 m), and Zhambyl (2143.86 m) districts, while above this value is Konaev city administration (8646.96 m). The presence of the Konaev city administration in the list decreases the average distance value, and within the overall network, it has no direct connection to Almaty city, as it is served by only one route, No. 307, connecting the city of Konaev with the village of Tuganbay in the Talgar district of the Almaty region. When the Konaev city administration is excluded, the average distance between stopping points decreases from 2579.53 m to 1568.29 m. Also, across the administrative units of the Almaty region, there are stopping points with both high and low indicators for the average distance between stops. The maximum values range from 9518.3 m (Karasay district) to 20,970 m (Konaev city administration), and the minimum values range from 60.3 m (Enbekshikazakh district) to 840.66 m (Konaev city administration).
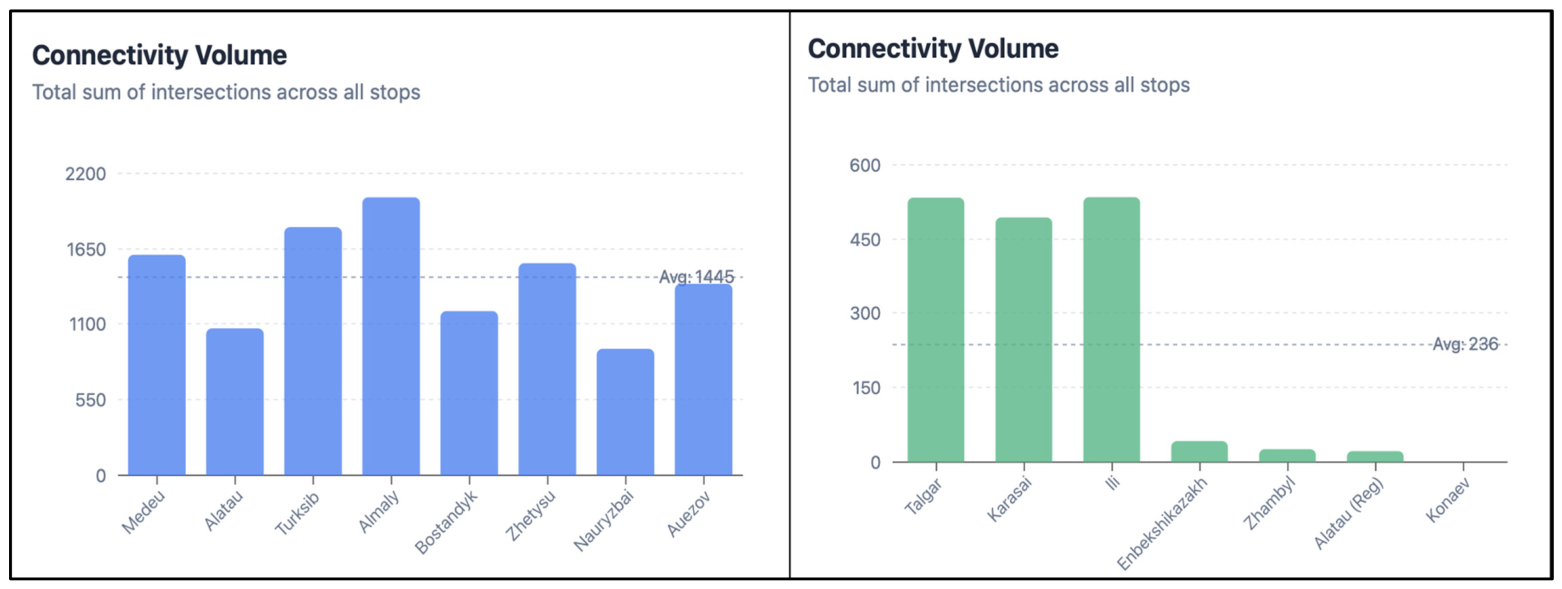
The final parameter for the assessment of stopping points by administrative units is intersections (the sum of intersections, as well as the average, maximum, and minimum intersection values) at the stopping points (Figure 7). For Almaty city, the average value of the total number of intersections at stopping points is 1445 intersections. Above this value are Almaly (2026), Turksib (1809), Medeu (1608), and Zhetysu (1547) districts, while below it are Auezov (1397), Bostandyk (1191), Alatau (1066), and Nauryzbay (918) districts. The higher the values of the total number of intersections at stopping points, the higher the level of connectivity of the public transport route network. This parameter is important when evaluating the current network, as it will allow for the review of existing routes and will be useful when designing new route network units. The values for the average number of intersections range from 3.27 (Bostandyk district) to 6.72 (Auezov district) per stopping point. The maximum values for the number of intersections range from 16 (Bostandyk district) to 41 (Medeu district). Maximum intersection values are not always a positive aspect, as they may indicate the overloading of a specific stopping point and serve as a guideline for reconsidering alternatives for routing the route network units. As for the minimum number of intersections at a stopping point, stopping points with no connectivity to other units of the public transport network are found in all administrative units of the city. Across the city districts, their total number is 467 (18.22% of the total number of unique stopping points in the city). The distribution by Almaty districts is as follows: Alatau—75 (16.06%), Almaly—62 (13.27%), Auezov—6 (1.29%), Bostandyk—58 (12.42%), Zhetysu—55 (11.78%), Medeu—90 (19.27%), Nauryzbay—51 (10.92%), and Turksib—70 (14.99%).
For the Almaty region, the average number of total intersections is 236 intersections at stopping points. Above this value are Talgar (534), Ili (535), and Karasay (494) districts, while below it are Konaev city administration (0), Alatau city administration (22), and Enbekshikazakh (42) and Zhambyl (26) districts. The average number of intersections per unique stopping point is 0.98, and the values range from 0 (Konaev city administration) to 2.07 (Ili district). The average of the maximum number of intersections per unique stopping point is 7 intersections, and the values range from 0 (Konaev city administration) to 16 (Karasay district). In all administrative districts of the Almaty region, there are transit stops completely lacking transfer connections to other public transport routes, and the total number is 478 (44.63% of the total number of stopping points in the Almaty region). The distribution by administrative units is as follows: Konaev city administration—8 (1.67%), Alatau city administration—24 (5.02%), Enbekshikazakh—59 (12.34%), Talgar—153 (32.1%), Ili—87 (18.21%), Karasay—123 (25.73%), and Zhambyl—24 (5.02%). The indicator of 44.63% of stopping points without intersections out of the total number of unique stopping points indicates a low level of public transport service within the borders of the Almaty region, which can serve as a basis when reviewing the service structure.
To mathematically validate the observed spatial disparities, a Kruskal–Wallis H-test was conducted to evaluate the differences in stop spacing across the 15 administrative groups (8 urban districts and 7 regional divisions). The test revealed a statistically significant difference in transit accessibility among the administrative units (H = 484.323, df = 14, p < 0.001). Subsequent Dunn’s post hoc pairwise comparisons with Bonferroni correction confirmed that the stop spacing in peripheral regional districts is significantly higher compared to the central urban core.
Subsequent Dunn’s post hoc pairwise comparisons with Bonferroni correction confirmed that the stop spacing in peripheral regional districts is significantly higher compared to the central urban core. The most pronounced, statistically significant differences between urban districts and regional divisions are detailed in Table 3.
Furthermore, the spatial isolation of 44.63% of suburban stops lacking alternative route intersections was subjected to spatial autocorrelation analysis. The Global Moran’s I test indicated a highly significant clustered spatial pattern (Moran’s I = 0.2360, Expected I = −0.0009, z-score = 20.4855, p < 0.001). This clustering statistically validates the core-periphery divide, causally explaining the forced reliance on private vehicles in localized peripheral transport deserts.

3.2. Analysis Based on Routes

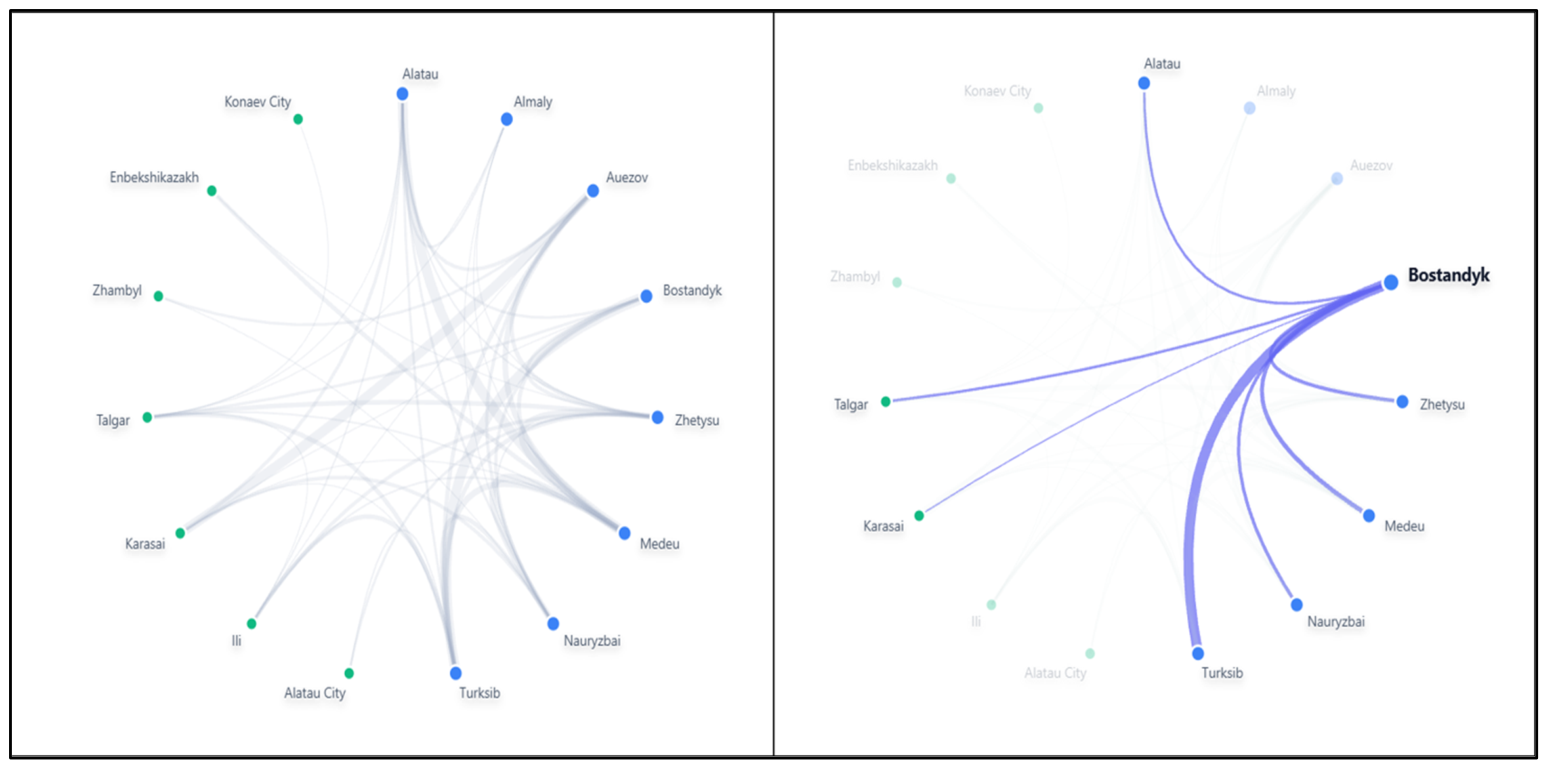
The next step within the spatial analysis of Almaty city’s public transport consists of evaluating the quantitative characteristics of 211 routes (Figure 8). The first parameter is length, where the average one-way route length is 24,862.36 m, and the two-way (round-trip) length is 49,724.73 m. The minimum average value of the one-way length is 5077.86 m (route No. 5B, serving the Medeu district), and the maximum value is 61,248.06 m (route No. 223, connecting the Talgar district of the Almaty region and the Turksib district of Almaty city). The minimum average value of the two-way length is 10,155.71 m (route No. 5B), and the maximum value is 122,496.12 m (route No. 223). This is followed by the parameter for the number of stopping points in both directions, which averages 80 stopping points per route. The maximum value is 166 stops (route No. 120, which is a circular route covering 6 of the 8 city districts), and the minimum is 13 (route No. 110, running from the Kalkaman-3 microdistrict (Nauryzbay district) to the bus station in the Auezov district and back, passing through the private residential sector in both cases).
The average distance between stopping points based on the network routes is 728.42 m, while the minimum and maximum values are 386.17 m (route No. 35, connecting the Alatau and Zhetysu districts of the city) and 8392.21 m (route No. 307, providing service outside Almaty city-between the Talgar district and the Konaev city administration), respectively. The average number of intersections with other routes based on two-way routes is 689 units. The maximum value is 2048 (route No. 85, connecting the Auezov district (Mamyr microdistrict) with the Turksib district (Zhuldyz microdistrict)), and the minimum is 5 (the aforementioned route No. 307). The average number of intersections per stopping point is ~8 routes, while the maximum value is ~17 routes (route No. 71, running between the “Almaty-1”railway station (Turksib district) and the “Green Bazaar” area (Medeu district)). The highest number of intersections at a single stopping point is at the “Raiymbek” stopping point near the “Raiymbek Batyr” metro station (Medeu district), where 41 public transport network routes intersect. The area of this stopping point is known as the “Sayakhat” area, where transfers from regional to city routes have historically taken place. Stopping points with no intersections with other routes are found on 149 of the 211 routes (70.62%).
Next, we move on to evaluating the terrain of the public transport network routes. The average elevation of stopping points on the routes is 788.6 m. The maximum value of the average elevation is 1209.11 m (route No. 5B, running within the Medeu district to provide shuttle service from the Royal Tulip hotel area to the area called Berezovaya grove), while the minimum value is 514.13 m (route No. 307 with the direction “Village of Tuganbay (Talgar district)-Konaev city administration”). The next parameter is the elevation difference between the stopping points with the maximum and minimum elevations, which directly affects the traversal difficulty. The average value of the elevation difference among the routes is 194.27 m. The maximum elevation difference value is 1007.21 m (route No. 209, connecting the Sports Palace area (Bostandyk district) with the “Pioneer” mountain resort (Talgar district) through the settlements of the Talgar district -the villages of Besagash, Akbulak, Kotyrbulak, and Beskaynar), and the minimum is 23.56 m (route No. 36, running within the Turksib district and connecting the “Almaty-1” railway station and the “Mayak” microdistrict).
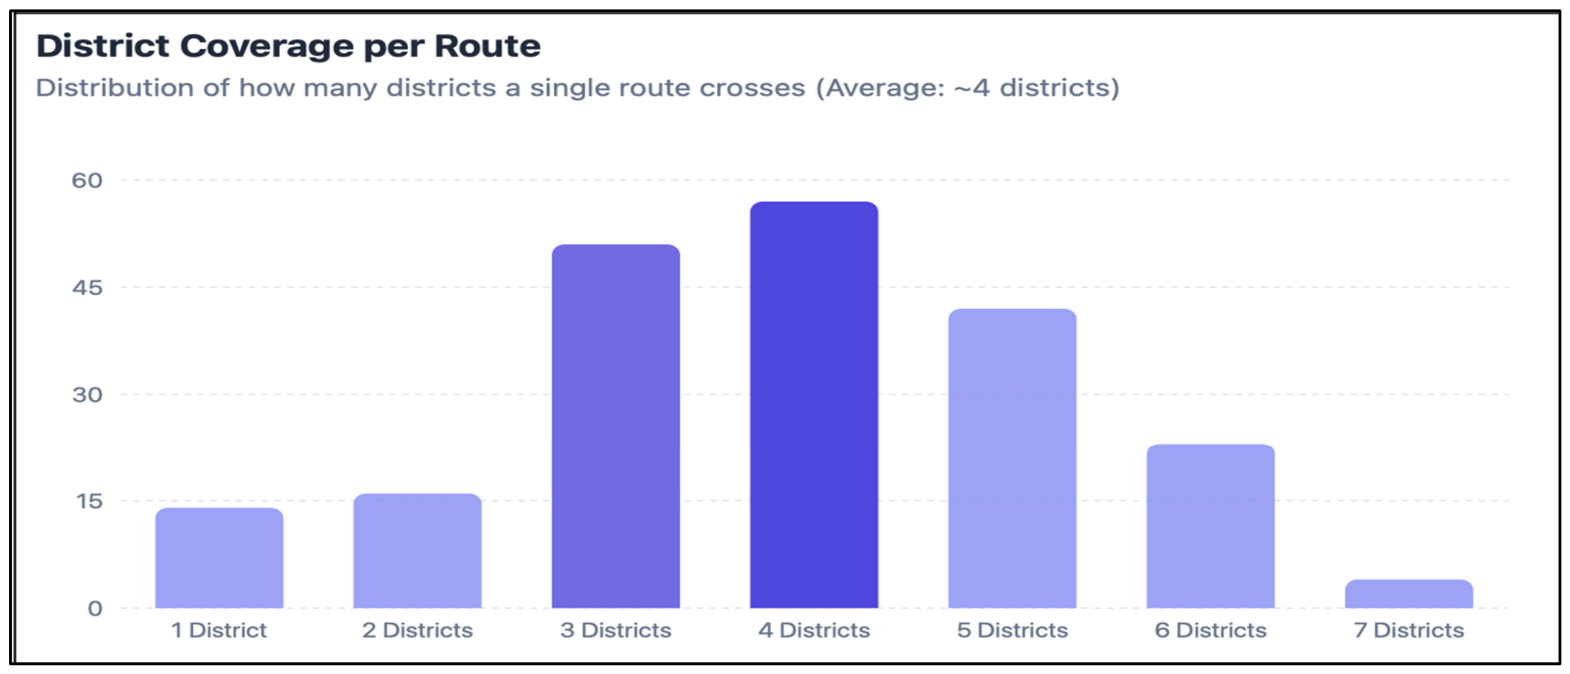
The next parameter is the number of covered districts. In total, across the service network, city and regional districts appear 815 times, with an average of ~4 districts covered per route. The minimum value is 1, when a route operates solely within the boundaries of a single district, and the maximum is 7, when a single route encompasses either 7 city districts or a combination of city and regional districts. There are 14 routes that cover only single district. The highest number of such routes is observed in the Medeu district-9 routes (Routes No. 5, 5A, 5B, 5V, 29R, 43, 60, 107, and 114). Such routes are also present in the Bostandyk district (Routes No. 28, 64, and 68) and the Turksib district (Route No. 1 and the aforementioned Route No. 36). The distribution of routes crossing multiple districts is as follows: 16 routes cross two districts, 51 cross three, 57 cross four, 42 cross five, 23 cross six, and 4 routes cross seven districts.
The final quality assessment indicator is the number of connections between the administrative districts of Almaty city and the Almaty region. The total is 56 connections across 211 routes. Out of these 56, based on the start and end points of the routes, 6 connections occur within the boundaries of a single district across 23 routes (21 routes within city districts and 2 routes within the Ili district of the Almaty region), which are distributed as follows: Alatau district-2 routes (No. 24 and 115), Bostandyk district-4 (No. 28, 64, 68, and 211), Ili district-2 routes (No. 305 and 306), Medeu district-11 routes (No. 5, 5A, 5B, 5V, 29R, 43, 60, 107, 114, 117, and 131), Nauryzbay district-2 (No. 26 and 139), and Turksib district-2 routes (No. 1 and 36).
Five circular routes operating within the city limits warrant special attention: Routes No. 10, 38, 63, 84, and 120. Routes No. 38 (~78 km), 63 (~61 km), and 120 (~87 km) each cover 6 districts along their itineraries (Route No. 10 (~83 km) covers 7 districts), thereby increasing the public transport coverage for the population. The circular Route No. 84 (~27 km) covers 3 districts and is primarily designed to serve the new “Western” polycenter. It exemplifies the spatial organization of a route that encompasses a rapidly growing area and provides connectivity to Raiymbek Avenue within the framework of Almaty’s polycentric development. Connection No. 1 links the city of Alatau (Almaty Region) and the Zhetysu district (Almaty city), facilitated by three inter-administrative routes: No. 89, 208, and 220. Connection No. 2 links the city of Alatau (Almaty Region) and the Turksib district (Almaty city), which are connected by Routes No. 214 and 215. These two connections indicate that the city of Alatau in the Almaty Region is linked to Almaty via 5 routes (2.4% of the total route network) through the Zhetysu and Turksib districts, located in the northern part of the city. For residents of Alatau, access to other districts of Almaty is possible via transfers at the terminus stops within these aforementioned districts.
Connection No. 3 links the Alatau and Almaly districts of Almaty city, between which routes No. 25, 58, and 132 operate. Connection No. 4 connects the Alatau and Auezov districts of Almaty city, served by routes No. 105, 109, 122, and 142. Connection No. 5 is between the Alatau and Bostandyk districts of Almaty city, where routes No. 19, 101, and 116 function. Connection No. 6 links the Alatau and Zhetysu districts of Almaty city, serviced by routes No. 35 and 97. Connection No. 7 connects the Alatau district of Almaty city and the Ili district of the Almaty region, with service provided by routes No. 219 and 301. Connection No. 8 links the Alatau district of Almaty city and the Karasay district of the Almaty region, operated by routes No. 52, 213, 237, and 254. Connection No. 9 is between the Alatau and Medeu districts of Almaty city, with 12 routes operating between them (No. 7, 16, trolleybus No. 19, 45, 48, 57, 75, 88, 99, 129, 133, and 201). Connection No. 10 links the Alatau and Nauryzbay districts of Almaty city, functioning with routes No. 14, 103, and 137. Connection No. 11 connects the Alatau district of Almaty city and the Talgar district of the Almaty region via route No. 100. Connection No. 12 links the Alatau and Turksib districts of Almaty city, serviced by routes No. 33, 69, and 96. The aforementioned connections (No. 3 through 12) demonstrate that the Alatau district maintains 10 connections with other districts within the public transport service framework. This includes connections between the Alatau district and all other districts of Almaty city based on 32 public transport routes, as well as connections with 3 districts in the Almaty region (Ili, Karasay, and Talgar) utilizing 7 routes. This amounts to a total of 39 routes (including 2 internal routes), which constitutes 18.5% of the total number of routes in the network.
Connection No. 13 links the Almaly and Zhetysu districts of Almaty city, connected by Route No. 80. Connection No. 14 is between the Almaly and Medeu districts of Almaty city, where Route No. 20 operates. Connection No. 15 links the Almaly and Nauryzbay districts of Almaty city, serviced by Route No. 44. Connection No. 16 connects the Almaly district of Almaty city and the Talgar district of the Almaty region, where Route No. 54 provides the service. The aforementioned connections indicate that the Almaly district is linked within the city limits to the Alatau, Zhetysu, Medeu, and Nauryzbay districts via 6 routes, as well as to the Talgar district via Route No. 54 (3.3% of the total number of routes). The Almaly district serves as the historical core (and a corresponding polycenter) of Almaty city, meaning that a significant portion of routes facilitating other connections transit directly through this district.
Connection No. 17 links the Auezov district of Almaty city and the Zhambyl district of the Almaty region, where routes No. 236, 245, and 247 operate. Connection No. 18 is between the Auezov and Zhetysu districts of Almaty city, serviced by trolleybus routes No. 5 and 6, as well as bus routes No. 104, 125, and 136. Connection No. 19 links the Auezov district of Almaty city and the Ili district of the Almaty region, serviced by route No. 218. Connection No. 20 connects the Auezov district of Almaty city and the Karasay district of the Almaty region, functioning through routes No. 53, 78, 202, 212, 226, 230, 238, 239, 244, 250, and 256. Connection No. 21 links the Auezov and Medeu districts of Almaty city, where trolleybus routes No. 11, 19, and 25, along with bus routes No. 37, 65, 66, and 206, operate on the line. Connection No. 22 is between the Auezov and Nauryzbay districts of Almaty city, where the network is serviced by routes No. 49, 55, 61, and 110. Connection No. 23 links the Auezov and Turksib districts of Almaty city, between which routes No. 72, 79, 85, 92, and 106 operate. The aforementioned indicates that, within the framework of public transport service, the Auezov district is connected within the city to the Alatau, Zhetysu, Medeu, Nauryzbay, and Turksib districts based on 25 routes, and within the Almaty region to the Zhambyl, Ili, and Karasay districts via 15 routes. This results in a total of 40 routes, which constitutes 18.9% of the total number of routes in the network.
Connection No. 24 links the Bostandyk and Zhetysu districts of the city, where operations are conducted by routes No. 18, 56, 98, and 123. Connection No. 25 connects the Bostandyk district of Almaty city and the Karasay district of the Almaty region, where route No. 81 operates. Connection No. 26 is between the Bostandyk and Medeu districts of Almaty city, serviced by 5 routes (trolleybus routes No. 1 and 9, as well as bus routes No. 21, 62, and 127). Connection No. 27 links the Bostandyk and Nauryzbay districts of Almaty city, where routes No. 15, 31, 39, and 67 function. Connection No. 28 connects the Bostandyk district of Almaty city and the Talgar district of the Almaty region, with service provided by routes No. 209, 210, and 224. Connection No. 29 links the Bostandyk and Turksib districts of Almaty city, operated by 12 routes (trolleybus route No. 7 and bus routes No. 3, 30, 32, 34, 59, 77, 86, 113, 121, 135, and 205). Based on the foregoing, it follows that the Bostandyk district is connected to 5 city districts (Alatau, Zhetysu, Medeu, Nauryzbay, and Turksib) utilizing 28 routes, and to 2 districts in the Almaty region (Karasay and Talgar) utilizing 4 routes. Including 4 internal routes, the overall share constitutes 17.1% of the total number of public transport routes in the network.
Connection No. 30 links the Enbekshikazakh district of the Almaty region and the Zhetysu district of Almaty city, where operations are conducted on route No. 252. Connection No. 31 is between the Enbekshikazakh district of the Almaty region and the Medeu district of Almaty city, where service is provided by 5 routes (No. 225, 241, 242, 243, and 249). These two connections indicate that the public transport network service of the Enbekshikazakh district is facilitated through connections with the Zhetysu and Medeu districts of Almaty city (resulting in a total of 6 routes, or 2.8% of the total number of routes in the public transport network). The primary points of interconnection for the Enbekshikazakh district are the routes operating through the adjacent Talgar district of the Almaty region and the Turksib district of Almaty city via the Kuldja and Talgar tracts.
Connection No. 32 links the Zhambyl district of the Almaty region and the Nauryzbay district of Almaty city, where route No. 248 operates. Previously, among the connections, an interconnection was also noted between the Auezov district of Almaty city and the Zhambyl district of the Almaty region, facilitated by routes No. 236, 245, and 247. Consequently, the public transport service of the Zhambyl district in the Almaty region primarily connects the district with the Nauryzbay and Auezov districts of Almaty city, while the main transit service operates through the Karasay district, which geographically serves as a separator between these administrative units (resulting in a total of 4 routes, or 1.9% of the overall number of routes).
Connection No. 33 links the Zhetysu district of Almaty city and the Ili district of the Almaty region, serviced by routes No. 231, 233, 240, and 251. Connection No. 34 is between the Zhetysu and Medeu districts of Almaty city, where routes No. 12, 17, 40, 70, 111, 141, and 232 operate. Connection No. 35 connects the Zhetysu and Nauryzbay districts of Almaty city, where operations are conducted on routes No. 76 and 119. Connection No. 36 links the Zhetysu district of Almaty city and the Talgar district of the Almaty region, connected by routes No. 41, 203, 207, 221, and 222. Connection No. 37 is between the Zhetysu and Turksib districts of Almaty city, where routes No. 9, 46, 91, 93, and 138 are in operation. Based on the provided information, it follows that the Zhetysu district is connected to all city districts via 26 routes and to 4 administrative units of the Almaty region (the city of Alatau, as well as the Ili, Talgar, and Enbekshikazakh districts) via 13 routes (resulting in a total of 39 routes, or 18.5% of the total number of routes).
Connection No. 38 links the Ili district of the Almaty region and the Medeu district of Almaty city, connected by routes No. 42 and 124. Connection No. 39 is between the Ili and Talgar districts of the Almaty region, where route No. 302 operates across the network. Connection No. 40 connects the Ili district of the Almaty region and the Turksib district of Almaty city, where routes No. 217, 227, 229, 255, and 303 provide service between these administrative units. The foregoing indicates that within the framework of the public transport network, the Ili district is connected to 5 city districts (Alatau, Auezov, Zhetysu, Medeu, and Turksib) utilizing 14 routes, and to the Talgar district of the Almaty region via route No. 302 (ultimately, factoring in 2 internal routes, this constitutes 8.1% of the total number of routes in the network).
Connection No. 41 links the Karasay district of the Almaty region and the Medeu district of Almaty city, where route No. 11 is operated by affiliated transport enterprises. Connection No. 42 is between the Karasay district of the Almaty region and the Nauryzbay district of Almaty city, serviced by 4 routes (No. 23, 83, 246, and 257). Connection No. 43 connects the Karasay district of the Almaty region and the Turksib district of Almaty city, where route No. 235 is in operation. Based on the aforementioned, it follows that within the framework of public transport service, the Karasay district is connected to 6 districts of Almaty city (Alatau, Auezov, Bostandyk, Medeu, Nauryzbay, and Turksib), but lacks direct connections with other administrative units of the Almaty region (accounting for 10.4% of the total number of routes in the network). Connection No. 44 links the city of Konaev and the Talgar district, where route No. 307 operates (less than 1% of the total number of routes in the network). Consequently, the city of Konaev has no direct public transport connections with Almaty city, and within the Almaty region, it is connected only to a village in the Talgar district.
Connection No. 45 links the Medeu and Nauryzbay districts of Almaty city, connected by 8 routes (No. 4, 22, 90, 95, 112, 118, 128, and 130). Connection No. 46 connects the Medeu district of Almaty city and the Talgar district of the Almaty region, with routes No. 204 and 228 listed in the registry. Connection No. 47 is between the Medeu and Turksib districts of Almaty city, where routes No. 2, 13, 29, 51, 71, 73, and 74 are recorded. The list of connections indicates that the Medeu district is linked to all districts of Almaty city via 47 routes, and to 4 districts of the Almaty region (Karasay, Talgar, Enbekshikazakh, and Ili) via 10 routes. Including 11 internal routes, this accounts for 32.2% of the total number of routes in the registry.
Connection No. 48 links the Nauryzbay and Turksib districts of Almaty city, where routes No. 27, 47, 50, 102, and 126 are listed. According to the list, the Nauryzbay district is connected to all districts of the city via 27 routes, and to two districts of the Almaty region (Zhambyl and Karasay) via 5 routes. Including 2 internal routes, this accounts for 16.1% of the total number of routes.
Connection No. 49 links the Talgar district of the Almaty region and the Turksib district of Almaty city, serviced by routes No. 8, 216, 223, 234, and 258. Based on the identified connections, it follows that the Talgar district is linked to 6 districts of Almaty city (Turksib, Alatau, Bostandyk, Zhetysu, Medeu, and Almaly) via 17 routes, as well as to two administrative units of the Almaty region (the Ili district and the city of Konaev) via 2 routes (accounting for 9% of the total number of routes). From the 56 enumerated connections, it can be deduced that the Turksib district maintains connectivity with all districts of Almaty city via 42 routes. Regarding its connections with the Almaty region, it has three primary points of contact (the city of Alatau, as well as the Ili and Karasay districts) facilitated by 8 routes. Including 2 internal routes, this constitutes 24.6% of the total number of routes.
Based on the 56 identified connection types, two forms of categorization can be applied to the administrative units of Almaty city and the Almaty region: one based on the number of connections with other districts, and the other based on the number of connecting routes. The first type of categorization yields three distinct categories. The first category (9 to 11 connected districts) comprises the following districts: Medeu (11 district connections), Alatau (10 districts), Zhetysu (10 districts), Turksib (10 districts), and Nauryzbay (9 districts). The second category (6 to 8 connected districts) includes the following administrative units: Auezov (8 districts), Talgar (8 districts), Bostandyk (7 districts), Ili (7 districts), and Karasay (6 districts). The third category (1 to 5 connected districts) encompasses the following administrative units: Almaly district (5 districts), the city of Alatau (2 districts), Enbekshikazakh district (2 districts), Zhambyl district (2 districts), and the city of Konaev (1 district). According to this categorization framework, a higher number of connected districts corresponds to a greater degree of spatial connectivity for the administrative unit itself within the public transport service network (Figure 9).
For the second type of categorization, based on the number of connected routes, it is also appropriate to define three categories. The first category (ranging from 34 to 68 connected routes) includes the following districts: Medeu (68 connected routes based on connections with the aforementioned 11 districts), Turksib (52 routes across 10 districts), Auezov (40 routes across 8 districts), Alatau (39 routes across 10 districts), Zhetysu (39 routes across 10 districts), Bostandyk (36 routes across 7 districts), and Nauryzbay (34 routes across 9 districts). The second category (from 17 to 22 connected routes) comprises the Karasay (22 routes across 6 districts), Talgar (19 routes across 8 districts), and Ili (17 routes across 7 districts) districts. The third category (from 1 to 7 routes) encompasses the following administrative units: the Almaly district (7 routes across 5 districts), the Enbekshikazakh district (6 routes across 2 districts), the city of Alatau (5 routes across 2 districts), the Zhambyl district (4 routes across 2 districts), and the city of Konaev (1 route across 1 district).
From a network performance perspective, the derived topological metrics (including the 56 identified connection types and route intersection volumes) serve as direct indicators of system robustness and transit throughput. The dense concentration of interconnected routes within the historical core creates an artificial transit bottleneck, while the scarcity of inter-district linkages on the periphery severely diminishes the overall operational efficiency of the transport framework. Analytically, a high network performance cannot be achieved when regional transit vectors lack cross-integration. These extracted spatial parameters are not merely descriptive; they form a quantifiable baseline for continuous predictive regional development analytics. By translating these geometric transit data points into actionable key performance indicators (KPIs), the spatial indices can seamlessly integrate into analytical dashboard modules for municipal executives. This analytical structure empowers city leadership with data-driven governance models, ensuring that decisions regarding fleet deployment, the placement of multimodal hubs, and future infrastructure investments are precisely targeted to alleviate statistically verified network bottlenecks.


4. Discussion

4.1. Link Between Spatial Metrics and Service Quality

The spatial analysis of the 211 public transport routes reveals profound structural imbalances that directly dictate the overall quality of transit services across the Almaty agglomeration. Moving beyond a purely descriptive geometric layout, the derived spatial metrics must be interpreted as direct proxies for the passenger experience and network performance. For instance, the average stop spacing acts as the primary determinant of pedestrian walkability, with excessive distances critically degrading the baseline accessibility of the transit system. Similarly, topological connectivity (the frequency of route intersections) determines the “transfer penalty” imposed on passengers. The isolated nature of peripheral routes dramatically reduces the seamlessness of multi-leg journeys, directly causing localized degradations in public transport network performance. Furthermore, topographic resistance, driven by extreme elevation gradients, fundamentally impacts schedule reliability and vehicle energy expenditure, ultimately reducing the operational efficiency of the fleet.

4.2. Summary of Territorial Transport Imbalances

To systematically synthesize the severe spatial asymmetry between the historical core and the suburban periphery without unnecessary textual repetition, the core infrastructural disparities are consolidated in Table 4.

4.3. Passenger Demand and Network Throughput

While this study is primarily grounded in the spatial supply-side metrics of the transport framework, a comprehensive evaluation of network performance necessitates the consideration of passenger demand. A superficial reading of the network might suggest that low route density in the periphery merely reflects low population density. However, from an analytical perspective, severe spatial deficits, including the 44.63% of suburban stops lacking transfer connectivity, actively suppress latent passenger demand. Network throughput is severely bottlenecked because peripheral residents cannot seamlessly integrate into high-capacity urban corridors, forcing a reliance on private motorization. The infrastructural gaps identified in this spatial model highlight zones where unfulfilled transit demand is highest. Future integration of this geometric baseline with dynamic automated fare collection data (electronic ticketing systems) will enable a complete socio-spatial evaluation, mapping actual ridership flows against the verified infrastructural capacity.

4.4. International Context and Universal Analytical Framework

When contextualized within international literature, the spatial asymmetry observed in the Almaty agglomeration closely mirrors the transit fragmentation documented in rapidly urbanizing Global South metropolises, such as Belo Horizonte and Jakarta, where periphery isolation drives social exclusion. However, this study advances significantly beyond these comparative baselines. The proposed multi-dimensional node-edge model, which uniquely integrates three-dimensional topographic constraints (Z-coordinates) into the topological connectivity matrix, serves as a highly scalable and universal analytical framework. This methodology provides a replicable blueprint for other topographically constrained, fast-growing agglomerations globally, offering a mathematically rigorous approach to operationalizing polycentric urban development.

4.5. Data Reliability and Temporal Network Dynamics

Finally, addressing the methodological robustness of the spatial data, it is imperative to acknowledge that public transport networks are inherently dynamic systems subject to continuous municipal adjustments and route reconfigurations. Consequently, the digitized array of 211 routes and 3634 unique transit stops represents a rigorously verified temporal snapshot of the network’s state. This cross-sectional reliability is fundamentally essential. It establishes a “frozen” empirical baseline of the transport framework. The high validity of this snapshot ensures that the efficacy of future infrastructural interventions, such as the deployment of new BRT/LRT corridors, the optimization of geometries, and the construction of polycentric transfer hubs can be accurately measured and continuously evaluated against this verified baseline over time.

5. Conclusions

5.1. Synthesis of Findings and Generalized Implications

The transition of rapidly urbanizing agglomerations from monocentric to polycentric models inherently exposes critical vulnerabilities in peripheral transport infrastructure. This study empirically validated these structural imbalances within the Almaty agglomeration, highlighting the severe fragmentation of suburban transit, the isolation of 44.63% of peripheral stops, and the complicating factor of extreme foothill topography. However, the implications of this research extend significantly beyond the local context. The multidimensional, node-edge spatial methodology developed in this study provides a universal, scalable analytical blueprint applicable to other topographically constrained megacities globally. By mathematically quantifying spatial equity and topological connectivity, this framework empowers municipal executives and urban planners to shift from reactive network adjustments to predictive, data-driven governance. Ultimately, achieving sustainable urban mobility requires the recognition that peripheral transit deficits do not merely reflect low population density, but act as physical barriers that actively suppress socio-economic inclusion.
Specifically, the spatial evaluation yielded several critical quantitative outcomes that define the network’s current state. The analysis exposed a severe territorial concentration, with 70.53% of all unique stops located within the city limits, where the average stop spacing is 535.45 m. In stark contrast, the regional periphery exhibits critical infrastructural fragmentation, evidenced by an average stop spacing of 2579.53 m. Topographically, the study quantified massive elevation gradients reaching up to 984.48 m within the city and 1243.23 m in the surrounding region, which physically constrain north–south transit efficiency and increase operational energy demands. Furthermore, the topological assessment of 56 inter-district connection types revealed a hyper-centralized routing geometry, where central districts maintain up to 68 connected routes, while peripheral administrative units frequently rely on a single route connection. These precise spatial and topological metrics empirically prove the misalignment between the current transit framework and the needs of a growing polycentric agglomeration.
To operationalize these spatial findings, several practical strategies are recommended for municipal transport managers and urban development authorities:
(1)
Targeted hub deployment to prioritize the construction of multimodal transfer hubs in the identified peripheral “transport deserts” (e.g., along the Talgar and Karasay districts) to seamlessly connect the 44.63% of isolated suburban stops to high-capacity urban corridors.
(2)
Topography-optimized fleet allocation with routing electric buses and modern trolleybuses specifically along the north–south transit lines. Electric traction systems offer superior energy recovery and operational stability on steep gradients exceeding 900 m, thereby mitigating the topographical resistance identified in this study.
(3)
Data-driven route subsidization with restructuring municipal transit subsidies by shifting financial support from highly inefficient, long-haul regional routes to localized, short-distance feeder lines under 10 km that connect peripheral residents directly to primary BRT/LRT nodes.
(4)
Integration into analytics dashboards with incorporating the developed 3D topological indices into dynamic municipal data monitoring systems. This allows city administrations to transition from reactive planning to proactive, data-driven governance, continuously adjusting fleet deployment in alignment with spatial equity metrics.

5.2. Study Limitations and Uncertainties

Despite the methodological robustness of the spatial analysis, several limitations and uncertainties must be explicitly acknowledged. First, the current model is fundamentally grounded in supply-side spatial geometries and infrastructural capacity. It does not integrate real-time dynamic variables such as traffic congestion delays, varying operational headways, or automated passenger fare collection data. Consequently, the actual utilization rates and latent demand within the identified “transport deserts” carry a degree of uncertainty. Second, while the topographic resistance index successfully quantifies elevation gradients, the model currently excludes seasonal climatic factors. In a high-altitude environment, winter weather conditions can exponentially exacerbate the operational friction on steep north–south inclines, representing an additional variable of uncertainty in predicting fleet schedule reliability.

5.3. Data Reliability and Future Research Directions

Furthermore, addressing the dynamic nature of urban transit systems, it is critical to account for temporal volatility. Public transport networks are subjected to continuous municipal reconfigurations, route optimizations, and infrastructural upgrades. Consequently, the digitized dataset of 211 routes and 3634 unique stops represents a rigorously verified temporal snapshot of the network’s geometry during the specific analysis period. Establishing this high-fidelity, cross-sectional baseline is methodologically essential to guarantee data reliability. It functions as an immutable “digital twin” of the existing transport framework, providing a highly accurate benchmark against which the efficacy of future strategic interventions, such as the integration of high-speed corridors serving new polycenters, can be objectively measured. Future research will focus on merging this verified spatial baseline with dynamic ridership data to generate advanced predictive regional development analytics, fully optimizing the transit ecosystem for both spatial equity and operational throughput.

Author Contributions

Conceptualization, K.K. and A.M.; methodology, K.K.; software, K.K.; validation, K.K. and A.M.; formal analysis, K.K.; investigation, K.K.; resources, K.K.; data curation, K.K.; writing—original draft preparation, K.K.; writing—review and editing, A.M.; visualization, K.K.; supervision, A.M.; project administration, A.M.; funding acquisition, K.K. All authors have read and agreed to the published version of the manuscript.

Funding

This research has been funded by Committee of Science of the Ministry of Science and Higher Education of the Republic of Kazakhstan (Grant No. AP25794929, Visualizing PT service quality scenarios based on spatial GIS statistics using the example of Almaty in the context of SDG).

Institutional Review Board Statement

Not applicable.

Informed Consent Statement

Not applicable.

Data Availability Statement

The original contributions presented in this study are included in the article. Further inquiries can be directed to the corresponding author.

Conflicts of Interest

The authors declare no conflicts of interest.

References

  1. Bureau of National Statistics of the Agency for Strategic Planning and Reforms of the Republic of Kazakhstan. Statistics of the Regions of the Republic of Kazakhstan. Available online: https://stat.gov.kz/en/region/ (accessed on 1 July 2026).
  2. Almaty City Transport Holding LLP. Available online: https://citybus.tha.kz/ (accessed on 1 August 2025).
  3. Kosherbay, K.; Mussagaliyeva, A.; Nyussupova, G.; Strobl, J. Analysis of the state of public transport in Almaty. Geoj. Tour. Geosites 2022, 45, 1534–1542. [Google Scholar] [CrossRef] [Scilit]
  4. Kerimova, Z.; Akhapov, Y.; Moshkal, M. People-Oriented Mobility and Urban Air Quality: The Case of Almaty’s Transport Reforms Towards an Eco-City Model. Sustainability 2026, 18, 2187. [Google Scholar] [CrossRef] [Scilit]
  5. Kenespayeva, L.B.; Rafikov, T.K.; Mussagaliyeva, A. Analysis of the transport infrastructure of Almaty city using GIS-technologies. Kazn. Bull. Geogr. Ser. 2023, 70, 34–44. [Google Scholar] [CrossRef] [Scilit]
  6. OECD. Promoting Clean Urban Public Transportation in Kazakhstan, Kyrgyzstan and Moldova: Summary Report of Project Implementation 2016–2019. In Green Finance and Investment; OECD Publishing: Paris, France, 2019. [Google Scholar] [CrossRef] [Scilit]
  7. Macioszek, E.; Świerk, P.; Grana, A.; Sobota, A. Application of a logit model to identify sociodemographic factors influencing the choice of public transport for daily trips—A case study based on the example of the Górnośląska-Zagłębiowska metropolis (Poland). Transp. Probl. 2023, 19, 183–192. [Google Scholar] [CrossRef] [Scilit]
  8. Appendix to the Decision of the Maslikhat of Almaty Dated December 13, 2019 No. 415 “Development Strategy of Almaty Until 2050”. Available online: https://www.almatydc.kz/uploads/reports/36/file/415-sheshm-yarus-prilozhenie-rus-1.pdf?cache=1649764629 (accessed on 25 August 2025).
  9. Appendix to the Decision of the Maslikhat of Almaty Dated 2025 “Almaty City Development Plan for 2026–2030”. Available online: https://open-almaty.kz/novosti/v-almaty-prinyat-plan-razvitiya-goroda-na-2026-2030-gody (accessed on 20 December 2025).
  10. Resolution of the Government of the Republic of Kazakhstan Dated February 28, 2020 No. 88 “On Approval of the Interregional Action Plan for the Development of the Almaty Agglomeration Until 2030”. Available online: https://adilet.zan.kz/rus/docs/P2000000088 (accessed on 10 September 2025).
  11. Resolution of the Government of the Republic of Kazakhstan Dated May 3, 2023 No. 349 “On the Master Plan of the City of Almaty”. Available online: https://prg.kz/document/?doc_id=1035318 (accessed on 15 August 2025).
  12. Appendix to the Decision of the Maslikhat of Almaty Dated 2022 “The City Development Program Until 2025 and Medium-term Prospects Until 2030”. Available online: https://almatydc.kz/uploads/reports/38/file/programma-razvitiya-almaty-2025_rus_12-09.pdf?cache=1662974782 (accessed on 20 August 2025).
  13. Appendix to the Decision of the Maslikhat of Almaty Dated December 2023 “Master Plan of the Transport Framework of Almaty Until 2030”. Available online: https://yestate.kz/library/laws/master-plan-transportnogo-karkasa-goroda-almaty-do-2030-goda-179553 (accessed on 15 September 2025).
  14. Geurs, K.T.; Van Wee, B. Accessibility evaluation of land-use and transport strategies: Review and research directions. J. Transp. Geogr. 2004, 12, 127–140. [Google Scholar] [CrossRef] [Scilit]
  15. Litman, T. Evaluating Transportation Equity: Guidance for Incorporating Distributional Impacts in Transportation Planning; Victoria Transport Policy Institute: Victoria, BC, Canada, 2017. [Google Scholar]
  16. Truden, C.; Kollingbaum, M.J.; Reiter, C.; Schasché, S.E. A GIS-based analysis of reachability aspects in rural public transportation. Case Stud. Transp. Policy 2022, 10, 1827–1840. [Google Scholar] [CrossRef] [Scilit]
  17. Żochowska, R.; Kłos, M.J.; Soczówka, P.; Pilch, M. Assessment of Accessibility of Public Transport by Using Temporal and Spatial Analysis. Sustainability 2022, 14, 16127. [Google Scholar] [CrossRef] [Scilit]
  18. Alamri, S.; Adhinugraha, K.; Allheeib, N.; Taniar, D. GIS Analysis of Adequate Accessibility to Public Transportation in Metropolitan Areas. ISPRS Int. J. Geo-Inf. 2023, 12, 180. [Google Scholar] [CrossRef] [Scilit]
  19. Gonçalves, J.; da Silva, F.N.; Marques, R.d.A. From BRT to Multimodality: A Cost-Efficiency Comparison of Public Transport Systems in Curitiba and Lisbon. Future Transp. 2026, 6, 102. [Google Scholar] [CrossRef] [Scilit]
  20. Duri, B. Invisible Journeys: Understanding the Transport Mobility Challenges of Urban Domestic Workers. Soc. Sci. 2025, 14, 224. [Google Scholar] [CrossRef] [Scilit]
  21. Hu, Y.; Downs, J. Measuring and visualizing place-based space-time job accessibility. J. Transp. Geogr. 2019, 74, 278–288. [Google Scholar] [CrossRef] [Scilit]
  22. Shoemaker, D.A.; BenDor, T.K.; Meentemeyer, R.K. Anticipating trade-offs between urban patterns and ecosystem service production: Scenario analyses of sprawl alternatives for a rapidly urbanizing region. Comput. Environ. Urban Syst. 2018, 74, 2012–2110. [Google Scholar] [CrossRef] [Scilit]
  23. Saphores, J.-D.; Xu, L. E-shopping changes and the state of E-grocery shopping in the US—Evidence from national travel and time use surveys. Res. Transp. Econ. 2021, 87, 100864. [Google Scholar] [CrossRef] [Scilit]
  24. Rudke, A.P.; Martins, J.A.; dos Santos, A.M.; Silva, W.P.; Caldana, N.F.d.S.; Souza, V.A.; Alves, R.A.; Albuquerque, T.T.d.A. Spatial and socio-economic analysis of public transport systems in large cities: A case study for Belo Horizonte, Brazil. J. Transp. Geogr. 2021, 91, 102975. [Google Scholar] [CrossRef] [Scilit]
  25. Hardi, A.Z.; Murad, A.A. Spatial Analysis of Accessibility for Public Transportation, A Case Study in Jakarta, Bus Rapid Transit System (Transjakarta), Indonesia. J. Comput. Sci. 2023, 19, 1190–1202. [Google Scholar] [CrossRef] [Scilit]
  26. Kyere-Gyeabour, E.; Agyei-Mensah, S.; Sivakumar, A. Transit and Fairness: Exploring Spatial Equity in Accra’s Public Transport System. Afr. Transp. Stud. 2024, 2, 100012. [Google Scholar] [CrossRef] [Scilit] [PubMed]
  27. Sanchez-Atondo, A.; García, L.; Gutiérrez, M.; Mungaray-Moctezuma, A.; Montoya-Alcaraz, M.; Calderón-Ramírez, J. Reorganization of public transport systems in Global South cities and its relation with quality of life: A case study of Mexicali, Mexico. Transp. Res. Interdiscip. Perspect. 2026, 36, 101859. [Google Scholar] [CrossRef] [Scilit]
  28. Griffin, G.; Sener, I.N. Public Transit Equity Analysis at Metropolitan and Local Scales: A Focus on Nine Large Cities in the US. J. Public Transp. 2016, 19, 126–143. [Google Scholar] [CrossRef] [Scilit] [PubMed]
  29. Leaven, L.; Ebakivie, O.; Everett, J. Inclusive and Accessible Transportation for All: Strategies for Integrating Equity in Transportation Research. Logistics 2025, 9, 72. [Google Scholar] [CrossRef] [Scilit]
  30. Aljoufie, M. Development of a GIS Based Public Transport Composite Social Need Index in Jeddah. J. Geogr. Inf. Syst. 2016, 8, 470–479. [Google Scholar] [CrossRef]
  31. Nugroho, A.G.; Herwangi, Y.; Ogawa, K. Public Transit Network Analysis Using Spatial Approach Case: Bogor Municipality-Indonesia. In Proceedings of the 6th International Conference on Indonesian Architecture and Planning (ICIAP 2022); Springer: Singapore, 2022; pp. 347–368. [Google Scholar] [CrossRef] [Scilit]
  32. Domenech, A.; Gutierrez, A. A GIS-Based Evaluation of the Effectiveness and Spatial Coverage of Public Transport Networks in Tourist Destinations. ISPRS Int. J. Geo-Inf. 2017, 6, 83. [Google Scholar] [CrossRef] [Scilit]
  33. Ricci, M.; Parkhurst, G.P.; Jain, J. Transport Policy and Social Inclusion. Soc. Incl. 2016, 4, 1–6. [Google Scholar] [CrossRef] [Scilit]
  34. Yandex LLC. Yandex Maps; Yandex LLC: Moscow, Russia, 2025; Available online: https://yandex.kz/maps (accessed on 10 October 2025).
  35. Google LLC. Google Maps; Google LLC: Mountain View, CA, USA, 2025; Available online: https://www.google.com/maps (accessed on 10 October 2025).
  36. OpenStreetMap Foundation. OpenStreetMap; OpenStreetMap Foundation: Cambridge, UK, 2025; Available online: https://www.openstreetmap.org/#map (accessed on 20 November 2025).
  37. Building Regulations of the Republic of Kazakhstan No. 3.01-01-2208 “Urban Planning. Planning and Development of Urban and Rural Settlements”. Available online: https://prg.kz/document/?doc_id=30503178 (accessed on 15 December 2025).
  38. DoubleGIS LLC. GIS; DoubleGIS LLC: Novosibirsk, Russia, 2025; Available online: https://2gis.kz/almaty?immersive=on (accessed on 10 October 2025).
Figure 1. Transition process from raw data to the final research outcome.
Sustainability 18 08504 g001
Figure 2. Distribution of bus stops in the city of Almaty and the Almaty region.
Sustainability 18 08504 g002
Figure 3. Distribution of bus stops by administrative divisions of agglomeration.
Sustainability 18 08504 g003
Figure 4. Percentage difference between the number of unique and recurring stops.
Sustainability 18 08504 g004
Figure 5. Parameters of the height indicators of bus stops in the administrative divisions.
Sustainability 18 08504 g005
Figure 6. Average distance between stops by city and regional administrative divisions.
Sustainability 18 08504 g006
Figure 7. Total number of intersections by administrative divisions of agglomeration.
Sustainability 18 08504 g007
Figure 8. Infographic of spatial indicators based on routes in the public transport network.
Sustainability 18 08504 g008
Figure 9. Diagram of links between administrative units.
Sustainability 18 08504 g009
Table 1. Number of unique stops by administrative units.
UnitUnique Stops%
Alatau 149213.55
Turksib 137610.35
Bostandyk 136410.02
Medeu 13449.47
Talgar 23359.22
Karasay 22928.04
Zhetysu 12867.87
Almaly 12587.09
Ili 22587.09
Nauryzbay 12356.46
Auezov 12085.72
Enbekshikazakh 2832.28
Zhambyl 2501.38
Alatau c.a. 2451.24
Konaev c.a. 280.22
1 Almaty city 2 Almaty region.
Table 2. Number of recurrences by administrative units.
UnitMentions%
Alatau 1261515.51
Turksib 1216612.85
Medeu 1204712.14
Zhetysu 1191911.38
Bostandyk 116299.66
Auezov 116099.54
Almaly 113487.99
Nauryzbay 110976.51
Talgar 28364.96
Ili 27824.64
Karasay 25583.31
Enbekshikazakh 21250.74
Alatau c.a. 2700.42
Zhambyl 2520.3
Konaev c.a. 290.05
1 Almaty city 2 Almaty region.
Table 3. Selected Dunn’s Post Hoc Pairwise Comparisons (Urban vs. Regional).
Pairwise Comparison (District 1 vs. District 2)Z-ScoreAdjusted p-Value
Almaly (City) vs. Ili (Region)10.713<0.0001
Almaly (City) vs. Karasay (Region)10.431<0.0001
Almaly (City) vs. Talgar (Region)10.375<0.0001
Bostandyk (City) vs. Ili (Region)10.149<0.0001
Bostandyk (City) vs. Talgar (Region)9.801<0.0001
Auezov (City) vs. Ili (Region)9.816<0.0001
Auezov (City) vs. Karasay (Region)9.508<0.0001
Turksib (City) vs. Ili (Region)9.267<0.0001
Turksib (City) vs. Karasay (Region)8.937<0.0001
Medeu (City) vs. Ili (Region)8.342<0.0001
Table 4. Summary of Spatial and Topological Imbalances in Agglomeration.
Analytical ParameterAlmaty CityAlmaty RegionImpact on Network Performance
Distribution of Unique Stops70.53%29.47%Over-concentration in the center creates transit bottlenecks. Periphery suffers from “transport deserts”.
Average Stop Spacing535.45 m2579.53 mSharp decline in pedestrian walkability and spatial equity in regional zones.
Topological Isolation18.22%44.63%High transfer penalties and broken seamlessness in suburban commuting.
Maximum Elevation GradientUp to 984.48 mUp to 1243.23 mReduced schedule predictability and increased energy expenditure for rolling stock.
Disclaimer/Publisher’s Note: The statements, opinions and data contained in all publications are solely those of the individual author(s) and contributor(s) and not of MDPI and/or the editor(s). MDPI and/or the editor(s) disclaim responsibility for any injury to people or property resulting from any ideas, methods, instructions or products referred to in the content.