1. Introduction
Digital transformation is one of the key structural changes shaping the modern economy, reshaping the way companies generate, distribute, and capture value both within and beyond their sectors and geographical locations. The spread of platforms, cloud infrastructures, analytics, and programmable interfaces reduced entry barriers and reshaped a competitive logic which was once based on scale and physical assets, giving entrepreneurial ventures access to far-flung markets and challenging incumbent players [
1,
2]. In this context, digital capability is seen not as an investment in technology, but as a strategic capability that is essential for competitiveness, innovation and sustainable business growth [
3,
4]. But it is not an automatic nor a uniform relationship: the importance of sensing opportunities, mobilizing digital assets, and reconfiguring the business model as conditions change is what distinguishes basic digitalization from higher order digital capabilities, and thus, whether firms achieve sustainable (as opposed to rapid) growth [
5,
6]. In this study, sustainable business growth refers to the long-term economic and continuity of an organization reflected in their stability of revenue, profitability, scalability, and organizational resilience rather than environmental and social stability.
This promise is particularly relevant, and particularly challenged, in emerging markets, where digital tools are touted to leapfrog institutional voids and financial constraints, but where institutional weakness (often combined with a lack of infrastructure) can also make it difficult for firms to turn capabilities into lasting performance [
7,
8]. The impact of firm-level capability is therefore likely to depend on how digital ecosystems are developed, and how platforms, institutions, and inter-firm networks are configured in which firms are situated [
9,
10]. The MENA region is an informative setting for this contingency: it is a region that is rapidly evolving in connectivity and digital maturity [
11] but is still characterized by heterogeneity in terms of infrastructure and institutional quality [
12]. Lebanon, Iraq and Egypt are theoretically relevant, and under-explored, within this canvas. These countries were selected in this study due to their representation of distinct stages of digital ecosystem while sharing a common regional context. Egypt has a relatively mature digital infrastructure and expanding technology sector that are supported by ongoing national digital transformation initiatives, including the Digital Egypt strategies sponsored and led by the government and continued investments in information and communication technologies [
13,
14]. Lebanon is characterized by strong entrepreneurial capabilities in the face of continued institutional and economic instability that has constrained economic development, whereas Iraq is still at an earlier stage in the development of a digital ecosystem and has lower levels of digital maturity [
15,
16]. Examining these countries together enables the study to isolate how differences in ecosystem maturity influence the relationship between firm-level digital capabilities and sustainable business growth while controlling for broader regional characteristics.
Despite the growing body of literature, key gaps remain. Although previous studies have established that digital capabilities improve organizational performance [
3,
4], much empirical evidence comes from developed economies, which limits the application of findings in institutionally volatile emerging markets [
7]. Existing studies within the MENA region remain predominantly single-country investigations that prevent an assessment of how conditions at the ecosystem level influence the outcomes at firm level across different national contexts. Moreover, prior research many times conceptualizes digitalization as a homogeneous construct, overlooking the distinction between a basic adoption of digital technology and higher-order digital capabilities that are related to analytics, integration, and innovation [
17]. Finally, although digital ecosystem maturity has been acknowledged conceptually, its moderating role in shaping the relationship between digital capabilities and sustainable business growth has received limited empirical attention. Consequently, it remains unclear whether there is consistent pattern of sustainable business outcomes and performance that result from the advanced use of digital capabilities across emerging digital ecosystems.
To fill these gaps, this study integrates four complementary lenses—the Resource-Based View, Dynamic Capabilities Theory, Digital Ecosystem Theory, and the Sustainability Perspective. Together, these perspectives explain how firm-level digital capabilities create competitive advantage, how firms adapt to changing environments, and how ecosystem maturity conditions the translation of these capabilities into sustainable business growth.
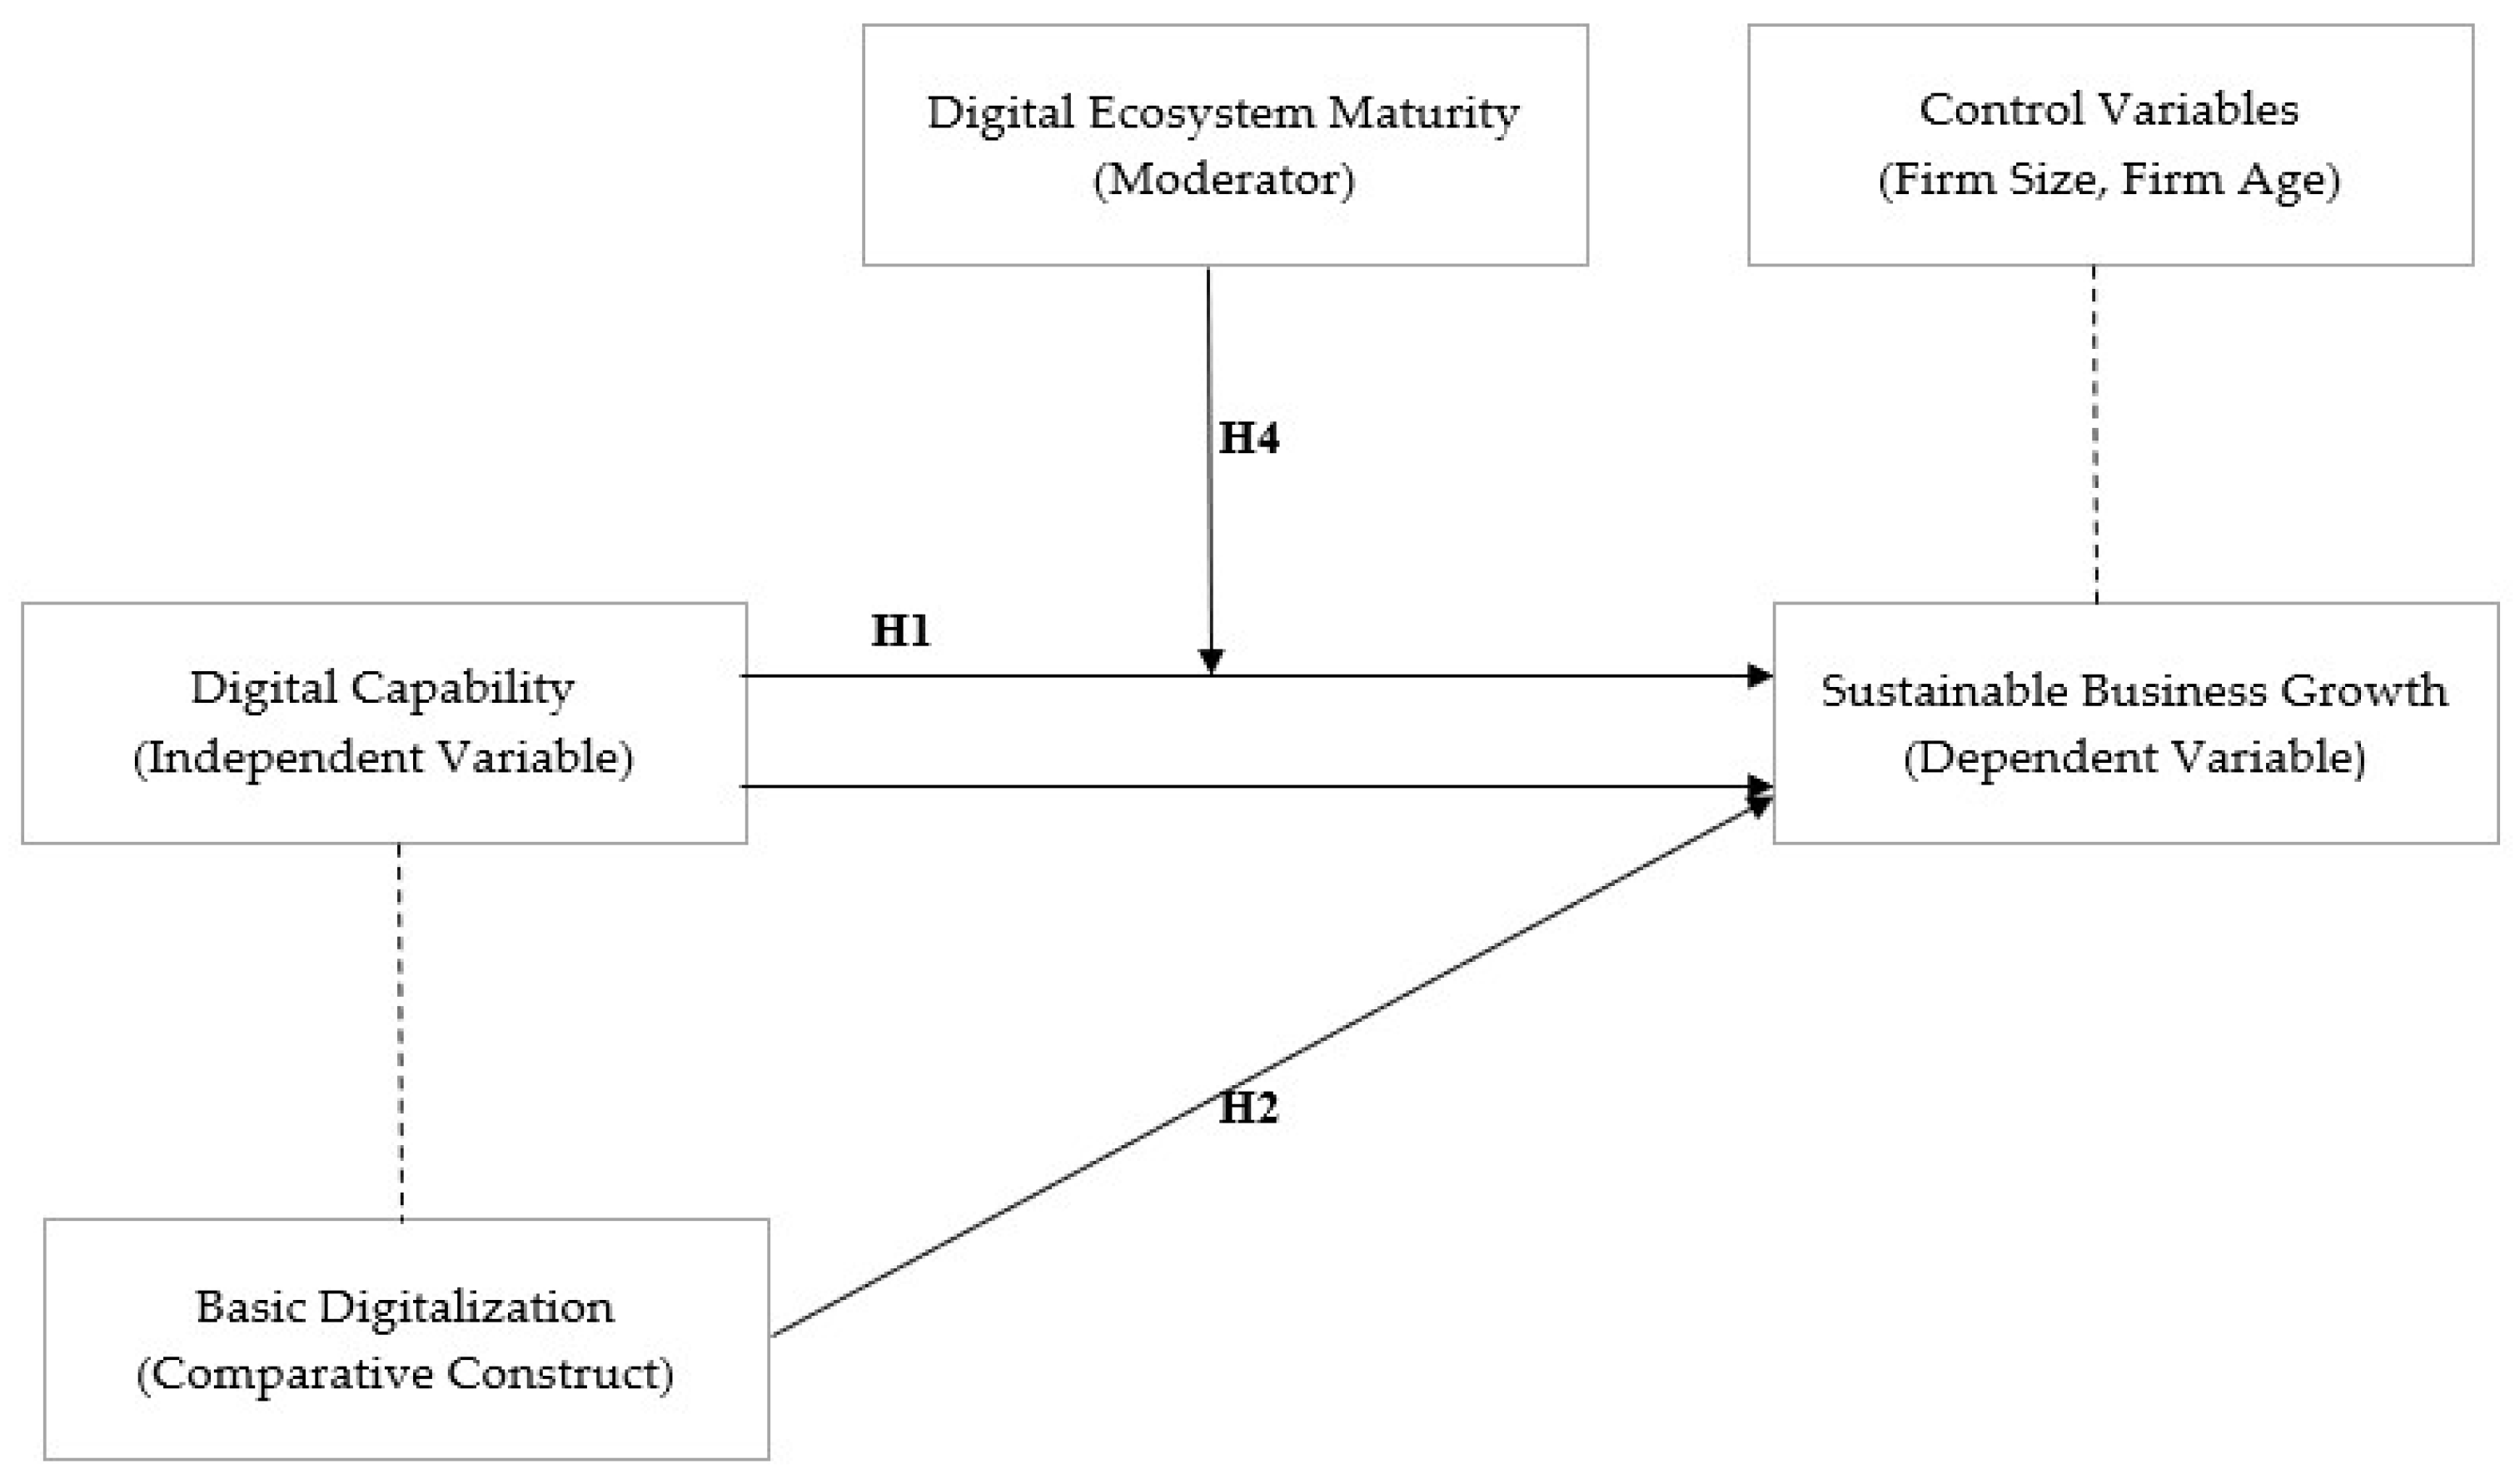
The study thus focuses on the effect of digital capabilities on the sustainable business growth of entrepreneurial ventures and compares this relationship across Lebanon, Iraq and Egypt through the following research questions: Do ventures with high digital capability level have impact on sustainable business growth? Do advanced digital capabilities outperform basic digitalization in promoting sustainable business growth? Does digital ecosystem maturity strengthen this relationship across Lebanon, Iraq, and Egypt? To address these questions, the study employed a quantitative cross-sectional research design based on firm-level survey data collected from SMEs operating in Lebanon, Iraq, and Egypt. Relationships among digital capabilities, basic digitalization, digital ecosystem maturity, and sustainable business growth were estimated using Partial Least Squares Structural Equation Modeling (PLS-SEM).
This study contributes to the literature in three ways. First, it extends the Resource-Based View, Dynamic Capabilities Theory, and Digital Ecosystem Theory by demonstrating how ecosystem maturity conditions the effectiveness of firm-level digital capabilities in emerging markets. Second, it provides comparative firm-level evidence from Lebanon, Iraq, and Egypt—three underexplored digital ecosystems within the MENA region. Third, the findings distinguish the effects of advanced digital capabilities from basic digitalization, showing that higher-order digital capabilities contribute more strongly to sustainable business growth and that these effects are amplified in more mature digital ecosystems. The rest of the paper is devoted to reviewing the literature and developing the hypotheses (
Section 2), methodology (
Section 3), results (
Section 4), discussion (
Section 5), and implications, limitations and future directions (
Section 6).
3. Research Methodology
3.1. Research Design
The current study uses a quantitative, cross-sectional study to examine the intersections between digital potential and sustainable development in entrepreneurial businesses. To represent cross-country heterogeneity in three nascent digital ecosystems, a comparative method is used to represent Lebanon, Iraq, and Egypt. The identified design fits well to analyze hypothesized relationships, moderating effect, and cross-country differences using firm-level data collected from SMEs operating in these countries.
3.2. Sample and Data Collection
The current study concentrates on small- and medium-sized businesses, entrepreneurial enterprises that are actively digital and also operating in Lebanon, Iraq, and Egypt. The information was gathered through a structured online survey carried out by the owners of the firm, managers or other critical decision-makers, who were considered knowledgeable about their firms’ digital capabilities and business performance.
Data were collected using a structured online questionnaire which was developed in Google Forms. The link was sent to 100 respondents via email and WhatsApp; 40 responses were recovered. To increase the sample size, the questionnaire was distributed through the Prolific research platform between January 2026 and April 2026. The Prolific platform was selected after sending the questionnaire via email because it provided access to diverse participants across multiple countries while allowing researchers to apply screening criteria to recruit respondents who met the study’s eligibility requirements. Screening questions were used to ensure that respondents were employed in, owned, or managed SMEs located in Lebanon, Iraq, or Egypt and possessed sufficient knowledge of their firms’ digital transformation activities.
A total of 250 questionnaires were distributed through Prolific, via email, and WhatsApp. Of this, 131 responses were received. After screening for response quality, completeness, and eligibility, 22 responses were excluded because of incomplete responses and failure to satisfy the inclusion criteria. The final analytical sample consisted of 109 valid firm-level responses, comprising 51 firms from Egypt, 34 from Lebanon, and 24 from Iraq.
Prior to the main survey, a pilot study was conducted involving 30 respondents to assess the clarity, relevance, and wording of the questionnaire items. Feedback from the pilot study resulted in minor revisions to improve question clarity and readability before the questionnaire was distributed to the full sample.
In the questionnaire, measuring items included digital capabilities, basic digitalization, digital ecosystem maturity, sustainable business growth, and firm characteristics. Secondary firm information was also included to verify the characteristics of selected organization reported by respondents. The final sample included firms from a range of industries, including services, retail, manufacturing, and technology, thereby enhancing the representativeness of the study across different sectors within the three emerging digital ecosystems.
3.3. Measurement of Variables
3.3.1. Digital Capabilities (Independent Variable)
Digital capabilities were operationalized as a multidimensional construct that captures the ability of firm to deploy and leverage digital technology effectively for strategic and operational purposes. This comprises dimensions such as digital infrastructure adoption (e.g., cloud systems, APIs), data and analytics capabilities, digital product and service development, digital revenue integration. Measurement items were adapted from a validated measurement scale developed by [
36,
67,
68]. The measures of each dimension are based on five-point Likert scales (1 = strongly disagree–5 = strongly agree) which have already been verified in other studies.
3.3.2. Basic Digitalization (Comparative Variable)
Basic digitalization was operationalized as a reflective latent construct that represented the firm’s adoption and use of digital technology such as websites, social media platforms, simple forms of automation, and basic digital business tools. Unlike advanced digital capabilities, which capture organizational competencies that are higher-order, basic digitalization shows the extent to which firms have adopted essential digital technologies to support their routine business operations. The measurement items were adapted from previous SMEs’ digital transformation and adoption of digital technology [
1,
34]. All items were assessed using a five-point Likert scale ranging from 1 (strongly disagree) to 5 (strongly agree).
3.3.3. Sustainable Business Growth (Dependent Variable)
A multidimensional construct is used to measure sustainable business growth in terms of stability of revenues, scalability, stability in profits, and sustainability over time. The items are evaluated by Likert scales and, where possible, the objective indicators are supplemented by the increase or decrease in revenues trends. Sustainable business growth was adapted from the multidimensional business growth and sustainability measures proposed by [
69,
70]. All items were assessed using a five-point Likert scale ranging from 1 (strongly disagree) to 5 (strongly agree).
3.3.4. Digital Ecosystem Maturity (Moderator)
Digital ecosystem maturity is valued using perceptual indicators such as digital infrastructure development, institutional quality, regulatory support and technological readiness. This variable will be included as a moderating variable that would determine the strength of the relationship between digital capabilities and sustainable business growth. The measurement items were adapted from the digital maturity frameworks developed by [
71,
72]. The measures of each dimension are based on five-point Likert scales (1 = strongly disagree–5 = strongly agree) which have already been verified in other studies.
3.3.5. Control Variables
In its analysis, it corrects the firm-level characteristics that can affect the growth results—that is, the firm size, firm age, industry, and capital intensity.
Although digital capabilities and sustainable business growth are conceptually multidimensional constructs, they were operationalized in this study as first-order reflective latent constructs. The measurement items representing the different dimensions of each construct were combined to capture the overall level of digital capabilities and sustainable business growth. This approach was adopted because the primary objective of the study was to examine the overall structural relationships among the constructs rather than the individual effects of each dimension. The measurement model was subsequently assessed using reliability and validity criteria before evaluating the structural model.
3.4. Reliability and Validity
The reliability of the measurements is confirmed by computing the Cronbach alpha coefficients of all the multi-item constructs; coefficients above 0.70 can be defined as acceptable [
73]. Convergent validity was assessed using indicator loadings and the Average Variance Extracted (AVE), with AVE values above 0.50 indicating adequate convergent validity. Discriminant validity was examined using the Heterotrait–Monotrait (HTMT) Ratio and the Fornell–Larcker criterion to ensure that the constructs were empirically distinct.
Common Method Bias
Because the study relied on self-reported survey data collected from a single respondent per firm, common method bias (CMB) was assessed using the full collinearity variance inflation factor (VIF) approach proposed by [
74]. The results showed that all full collinearity VIF values were below the recommended threshold of 3.3, indicating that common method bias was unlikely to affect the study’s findings.
3.5. Data Analysis Strategy
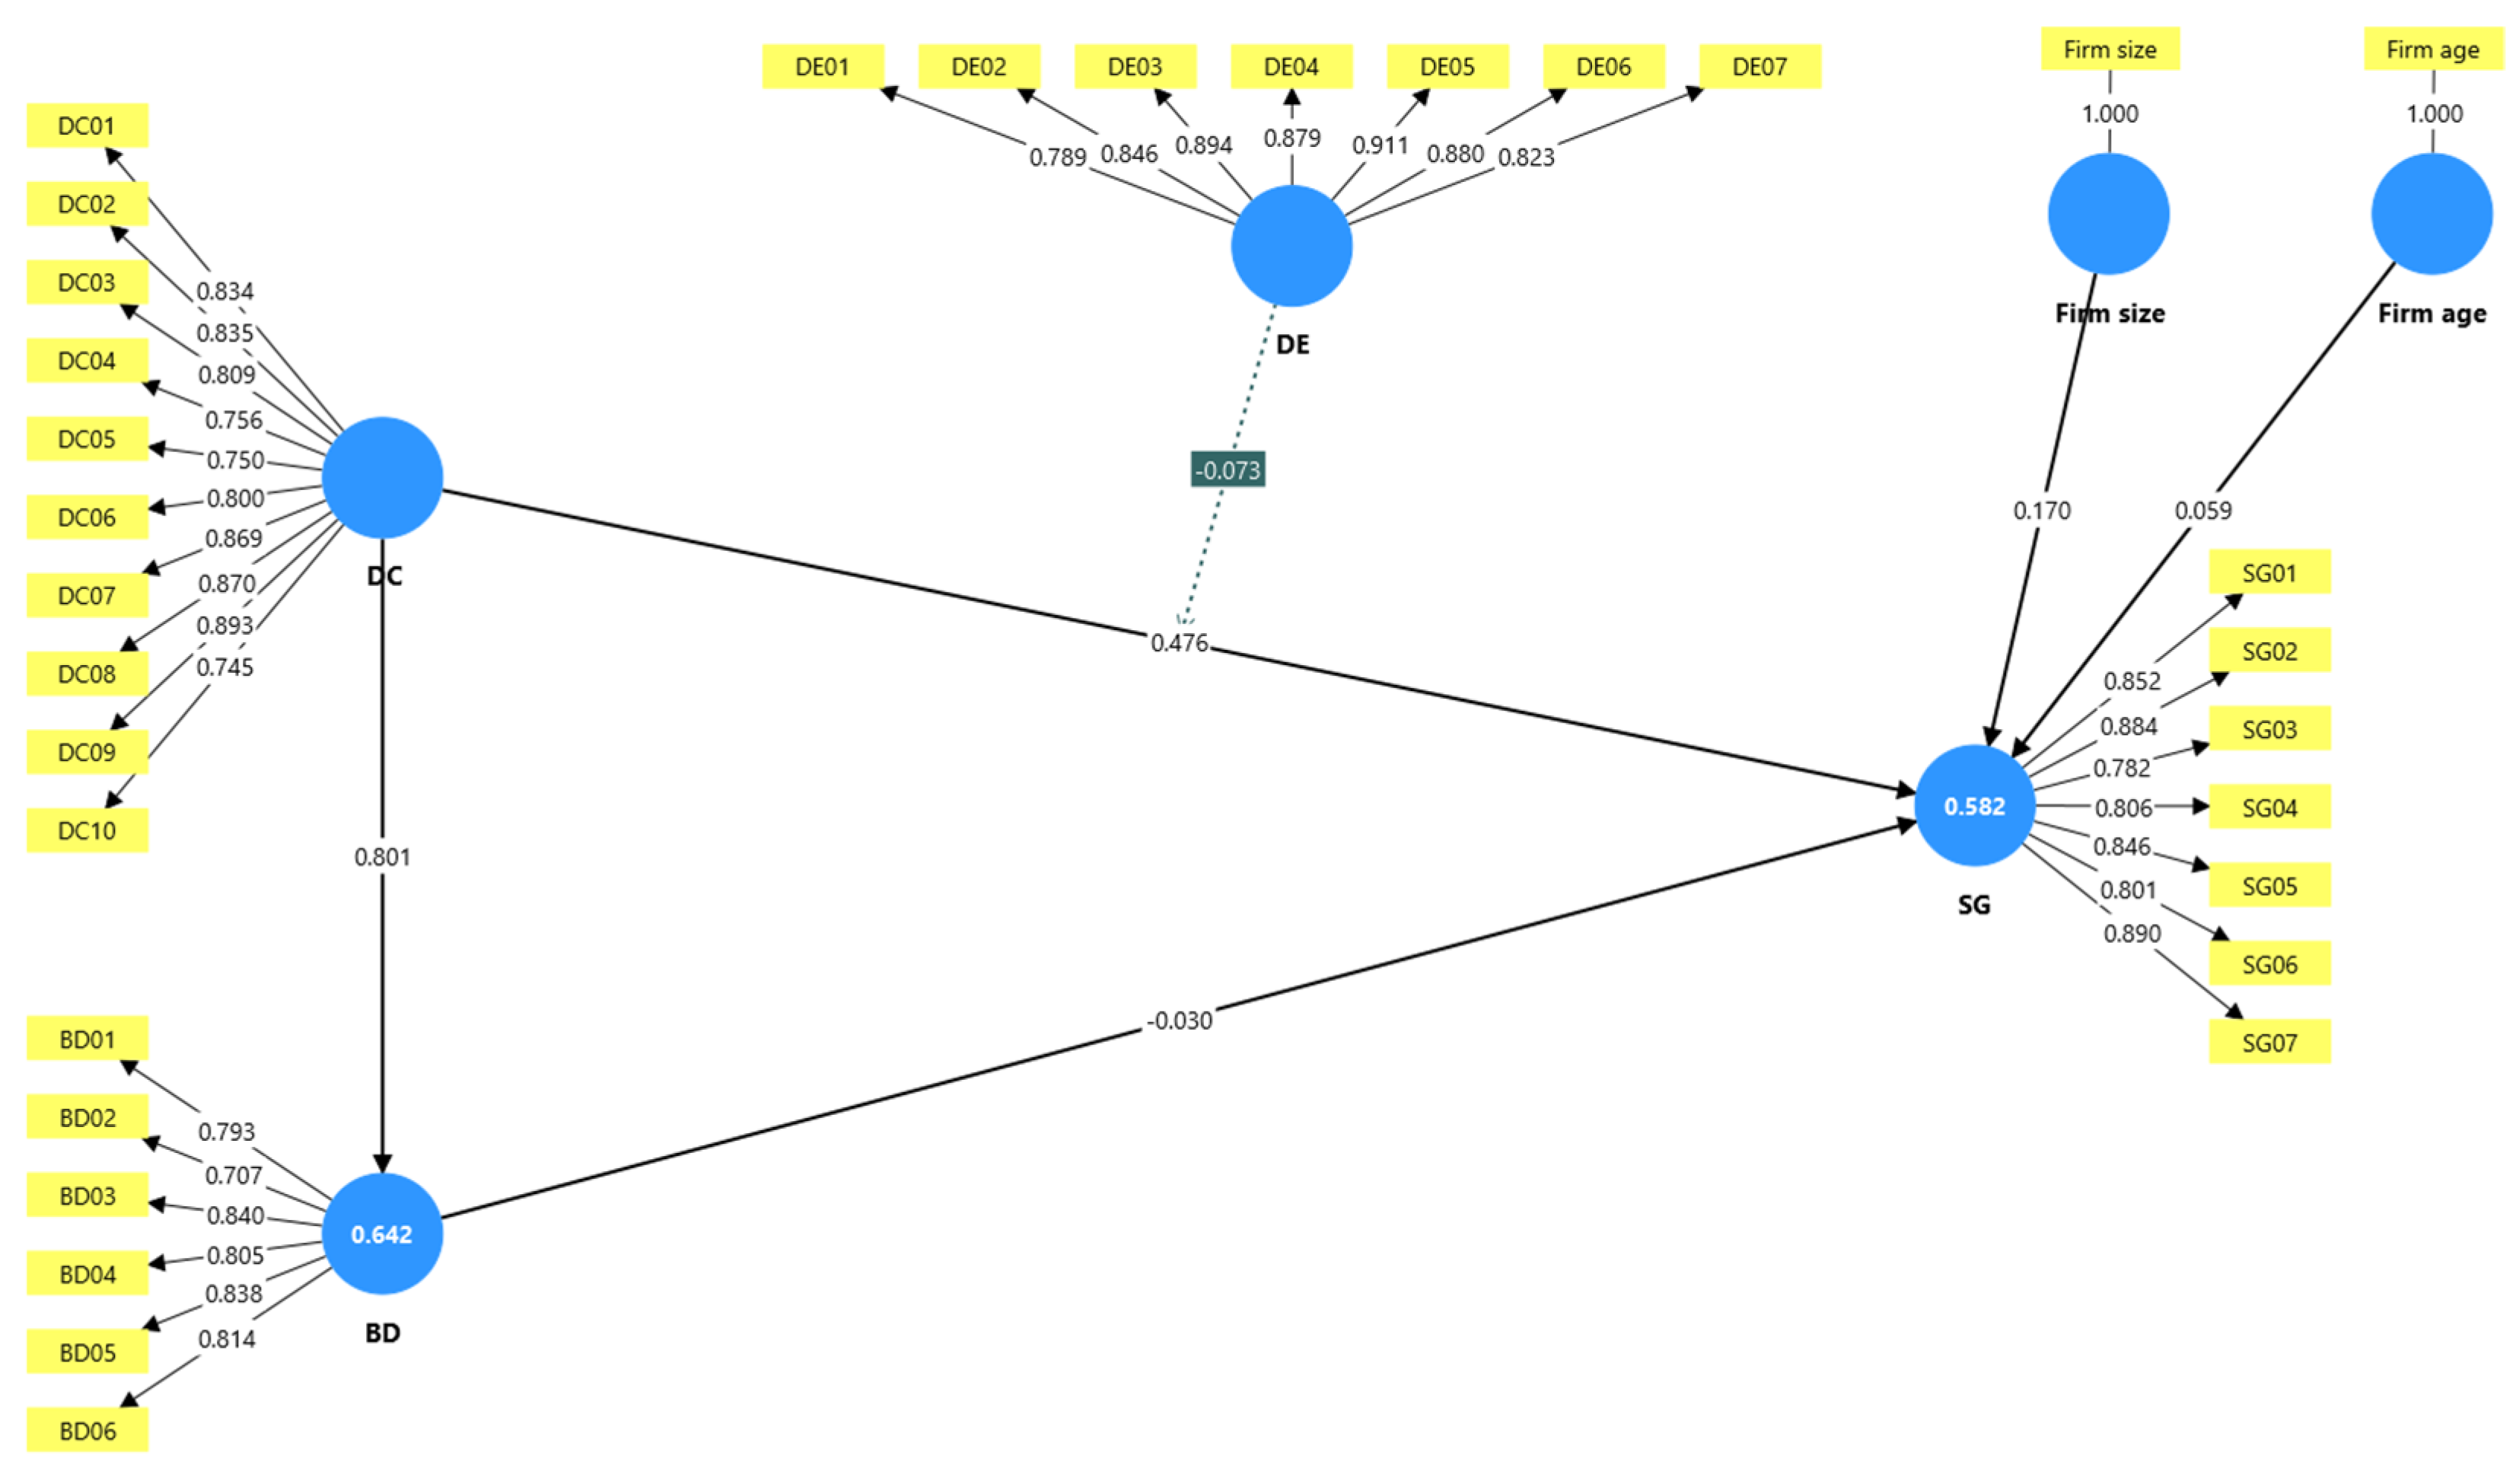
The data were analyzed using Partial Least Squares Structural Equation Modeling (PLS-SEM) with SmartPLS 4 (the output is presented in
Figure 2). The measurement model was first evaluated to check for the reliability and validity of each construct such as internal reliability, convergent validity, and discriminant validity. Subsequently, the structural model was assessed using bootstrapping with 5000 subsamples to estimate the significance of the hypothesized relationships. Hypothesis H1 was tested by examining the direct effect of digital capability (DC) on sustainable business growth (SG). Hypothesis H2 was assessed by simultaneously estimating the effects of digital capability (DC) and Basic digitalization (BD) on sustainable business growth (SG) and comparing their respective path coefficients. Hypothesis H3 was tested using Bootstrap Multi-Group Analysis (MGA) to determine whether the relationship between digital capability and Sustainable Business Growth differed significantly across Egypt, Iraq, and Lebanon. Hypothesis H4 was examined using a two-stage interaction approach in SmartPLS 4 to test the moderating effect of digital ecosystem maturity (DE). In line with standard moderation procedures, the structural model included the direct effects of digital capability (DC) and digital ecosystem maturity (DE) on sustainable business growth (SG), together with the interaction effect (DE × DC → SG). Control variables, including firm age and firm size, were included in the structural model to account for their potential influence on sustainable business growth.
3.6. Ethical Considerations
Respondents volunteered to take part in the study, and their anonymity and confidentiality were guaranteed. The collection and processing of the data were performed according to the existing ethical standards of conducting research.
4. Results
4.1. Descriptive Statistics
Table 1 presents the socio-economic characteristics of the respondents and provides important insights into the demographic and organizational structure influencing digital transformation and e-commerce-related decision-making within firms operating in Egypt, Lebanon, and Iraq. The distribution of years of experience indicates that a relatively large proportion of respondents (33.0%) have less than 3 years of experience, followed by 24.8% with 3–5 years and 21.1% with 6–10 years of experience. This suggests that the sample is moderately skewed toward early- to mid-career professionals. The presence of 13.8% with 11–20 years and 7.3% with more than 20 years of experience further indicates that while experienced professionals are represented, many respondents are still in the developing stages of their professional careers. This pattern is consistent with studies in emerging markets that show increasing participation of younger professionals in digital and entrepreneurial roles due to the rapid expansion of technology-driven business environments.
In terms of geographical distribution, the respondents are primarily concentrated in Egypt (46.8%), followed by Lebanon (31.2%) and Iraq (22.0%). This distribution reflects the regional spread of digital and entrepreneurial activity within the selected Middle Eastern economies, with Egypt emerging as a dominant hub due to its large market size and expanding technology ecosystem. Lebanon and Iraq also represent significant portions of the sample, indicating that digital transformation activities are not confined to one dominant economy but are dispersed across the region.
Regarding industry sector classification, the results show that Technology/Software/IT (28.4%) and Services (23.9%) constitute the largest proportions of the sample, followed by E-commerce/Digital Business (13.8%) and Retail/Trade (11.0%). Manufacturing (6.4%) and Healthcare/Medical (5.5%) also contribute notable shares, while smaller sectors such as Education, Fintech, Construction, and Green Technology each account for less than 2%. This distribution highlights the dominance of technology-oriented and service-based industries in driving digital transformation. It also reflects the increasing integration of e-commerce and digital tools across both traditional and emerging sectors, particularly in response to changing consumer behavior and competitive pressures.
Firm size distribution indicates that half of the firms (46.8%) employ between 1 and 9 employees, while 44.9% have 10–49 employees, and 8.3% employ 50–249 employees. This suggests that the sample includes both small and medium firms. This is particularly important as small firms often face resource constraints but increasingly adopt digital technologies to remain competitive and expand market reach.
In terms of firm age, the findings reveal that 33.0% of firms are 1–3 years old, 26.6% are 4–7 years old, 16.5% are more than 15 years old, 11.9% are less than 1 year old, and another 11.9% fall within the 8–15 years category. This indicates a strong presence of young firms in the sample, suggesting a dynamic entrepreneurial environment where new business creation is active. The presence of established firms also indicates that digital transformation is not limited to startups but is also being adopted by mature organizations.
4.2. Construct Reliability and Convergent Validity
Table 2 presents the assessment of construct reliability and convergent validity of the measurement model, comprising the key constructs of basic digitalization (BD), digital capability (DC), digital ecosystem (DE), and sustainable business growth (SG). The evaluation was conducted using standard measurement model criteria, including outer loadings, Cronbach’s alpha, composite reliability coefficients (rho_A and rho_C), and Average Variance Extracted (AVE). The outer loadings of all measurement items were examined, and most indicators exceeded the recommended threshold value of 0.70, indicating that the items adequately represent their respective latent constructs [
75]. Specifically, the indicators for basic digitalization (BD01–BD06) recorded loadings ranging from 0.707 to 0.840, with all items meeting the acceptable minimum threshold, although BD02 (0.707) sits at the lower boundary of adequacy. For digital capability (DC01–DC10), the outer loadings ranged from 0.745 to 0.893, demonstrating strong indicator reliability across all items. Similarly, digital ecosystem (DE01–DE07) showed high loadings ranging from 0.789 to 0.911, while Sustainable Business Growth (SG01–SG07) recorded loadings between 0.782 and 0.890. Overall, these results confirm that the measurement items strongly reflect their respective constructs, with no evidence of weak or poorly performing indicators.
Cronbach’s alpha values for all constructs exceeded the recommended threshold of 0.70, ranging from 0.888 for basic digitalization to 0.944 for digital capability, thereby confirming satisfactory internal consistency reliability [
76]. This indicates that the items within each construct consistently measure the same underlying concept. Similarly, composite reliability coefficients (rho_A and rho_C) further support the internal consistency of the constructs. The rho_A values ranged from 0.895 (basic digitalization) to 0.949 (digital ecosystem), while rho_C values ranged from 0.914 to 0.953 across all constructs. These values exceed the acceptable threshold of 0.70, indicating strong reliability and minimal measurement error within the model [
77]. The particularly high reliability values for digital capability and digital ecosystem suggest strong internal consistency among their indicators.
Furthermore, the Average Variance Extracted (AVE) values for all constructs surpassed the recommended threshold of 0.50 proposed by [
78], ranging from 0.641 for basic digitalization to 0.742 for digital ecosystem. This indicates that each construct explains more than 50% of the variance in its indicators, thereby confirming adequate convergent validity.
4.3. Discriminant Validity—HTMT Ratio
Table 3 presents the results of the discriminant validity assessment using the Heterotrait–Monotrait (HTMT) Ratio, a robust criterion proposed by [
79] and widely regarded as a superior approach compared to the Fornell–Larcker criterion and cross-loading assessment. Discriminant validity is established when HTMT values are below the recommended threshold of 0.90, while a more conservative threshold of 0.85 is often applied for stricter evaluation [
77].
The results in
Table 3 indicate that all HTMT values are below the recommended threshold of 0.90, which provide acceptable evidence of discriminant validity across the measurement model. This implies that all constructs are empirically distinct and do not exhibit problematic levels of multicollinearity or conceptual overlap. Specifically, the HTMT value between basic digitalization (BD) and digital capability (DC) is relatively high (0.861), which is slightly above the strict 0.85 threshold but remaining below the recommended cut-off of 0.90. This suggests an acceptable relationship between the two constructs. In contrast, BD shows low HTMT values with digital ecosystem (0.376), Firm age (0.083), Firm size (0.125), sustainable business growth (0.588), and the interaction term DE × DC (0.633), indicating clear conceptual distinction.
Digital capability (DC) also demonstrates acceptable discriminant validity with other constructs, including digital ecosystem (0.414), Firm age (0.037), Firm size (0.145), Sustainable Business Growth (0.702), and DE × DC (0.588). Although the HTMT value between DC and sustainable business growth (0.702) is high compared to other relationships, it remains below the conservative threshold, confirming that both constructs are empirically distinguishable. Digital ecosystem (DE) exhibits low HTMT relationships with Firm age (0.174), Firm size (0.144), sustainable business growth (0.581), and DE × DC (0.134), further reinforcing its distinctiveness within the model. Similarly, Firm age shows very weak associations with other constructs, with HTMT values of 0.083 (BD), 0.037 (DC), 0.174 (DE), 0.155 (SG), and 0.161 (DE × DC), indicating that it is clearly independent from the core digital and performance constructs.
Firm size also demonstrates consistently low HTMT values across all constructs, including BD (0.125), DC (0.145), DE (0.144), Firm age (0.227), SG (0.319), and DE × DC (0.132), confirming its distinct measurement within the model. Sustainable Business Growth (SG) shows moderate but acceptable relationships with BD (0.588), DC (0.702), DE (0.581), Firm age (0.155), Firm size (0.319), and DE × DC (0.428). Although SG has stronger associations with BD and DC, all values remain below the threshold, confirming adequate discriminant validity. Finally, the interaction term (DE × DC) demonstrates low-to-moderate HTMT values with BD (0.633), DC (0.588), DE (0.134), Firm age (0.161), Firm size (0.132), and SG (0.428), indicating that it is empirically distinct from both its constituent constructs and the outcome variable.
Overall, the HTMT results provide acceptable evidence of discriminant validity across the measurement model. Nevertheless, the relatively high HTMT value between basic digitalization and digital capability (0.861) suggests that these constructs are closely related, and their discriminant validity should be interpreted with caution. This interpretation is consistent with the Fornell–Larcker results, which also indicate borderline discriminant validity for these constructs.
4.4. Discriminant Validity—Fornell–Larcker
Table 4 presents the Fornell–Larcker criterion used to assess discriminant validity within the measurement model. According to [
78], discriminant validity is established when the square root of the Average Variance Extracted (AVE), presented on the diagonal, is greater than the correlations between constructs shown in the off-diagonal elements. The results in
Table 4 indicate that this condition is satisfied for all constructs, thereby confirming adequate discriminant validity. However, the relationship between basic digitalization (BD) and digital capability (DC) is borderline, as the correlation between the two constructs equals the square root of the AVE for BD. Therefore, the discriminant validity between these constructs should be interpreted with some caution.
Specifically, basic digitalization (BD) records a square root of AVE of 0.801, which is higher than its correlations with digital capability (0.801), digital ecosystem (0.343), Firm age (−0.057), Firm size (0.115), and sustainable business growth (0.541). Although the correlation between BD and DC (0.801) is equal to the square root of AVE for BD (0.801), it does not exceed it. This indicates that the two constructs are closely related as the discriminant validity is acceptable but borderline, suggesting that they are conceptually distinct yet highly related.
Similarly, digital capability (DC) shows a square root of AVE of 0.818, which is greater than its correlations with digital ecosystem (0.394), Firm age (0.025), Firm size (0.140), and sustainable business growth (0.664). Furthermore, although DC exhibits a high correlation with BD, the HTMT results provide additional support that the two constructs remain empirically distinguishable.
Digital ecosystem (DE) demonstrates a strong square root of AVE value of 0.861, exceeding its correlations with BD (0.343), DC (0.394), Firm age (0.170), Firm size (0.144), and sustainable business growth (0.551). This confirms that digital ecosystem is a distinct construct within the model and is not overly overlapping with other variables.
Firm age shows a perfect diagonal value of 1.000, which is higher than its correlations with BD (−0.057), DC (0.025), DE (0.170), SG (0.150), and Firm size (0.227), indicating acceptable discriminant validity and clear independence from other constructs in the model.
Firm size also demonstrates a square root of AVE of 1.000, which exceeds its correlations with BD (0.115), DC (0.140), DE (0.144), Firm age (0.227), and sustainable business growth (0.307), confirming that it is empirically distinct from all other variables in the model.
Sustainable business growth (SG) records a square root of AVE of 0.838, which is higher than its correlations with BD (0.541), DC (0.664), DE (0.551), Firm age (0.150), and Firm size (0.307). Although SG shows strong relationships with digital capability and digital ecosystem, all correlations remain below the diagonal value, confirming adequate discriminant validity.
Thus, the Fornell–Larcker criterion confirms that all constructs in the model are empirically distinct. While high correlations are observed between digital capability and sustainable business growth, as well as between basic digitalization and digital capability, these do not exceed their respective square root of AVE values. These findings are consistent with the HTMT results and collectively confirm the adequacy of discriminant validity for the measurement model, thereby supporting its suitability for further structural model analysis and hypothesis testing.
4.5. Variance Inflation Factor (VIF)
Table 5 presents the Variance Inflation Factor (VIF) values used to assess multicollinearity among the latent constructs in the structural model. According to [
77], VIF values below the threshold of 5.0 indicate that multicollinearity is not a concern in Structural Equation Modeling, while values below 3.3 are often considered ideal in more conservative assessments. The results in
Table 5 show that all VIF values fall within acceptable limits, ranging from 1.096 to 3.113, indicating that multicollinearity does not pose a threat to the stability of the structural model estimates.
Similarly, digital ecosystem (DE → SG) shows a low VIF value of 1.251, while Firm age (1.143) and Firm size (1.096) also demonstrate extremely low VIF values, confirming negligible shared variance among predictors of sustainable business growth. The interaction term (DE × DC → SG) records a VIF value of 1.731, indicating a moderate but still acceptable level of correlation with other predictors. This suggests that the inclusion of the interaction effect does not introduce multicollinearity concerns into the model. In comparison, digital capability (DC → SG) shows the highest VIF value of 3.113, followed closely by basic digitalization (BD → SG) with a VIF of 3.097. Although these values are higher than the other predictors, they remain below the conservative threshold of 5.0 and are within acceptable limits under SEM guidelines. These findings suggest that BD and DC share some explanatory variance in predicting sustainable business growth; however, this overlap is not severe enough to distort parameter estimates or reduce model reliability.
The VIF results provide strong evidence that multicollinearity is not a critical issue in the structural model. All predictor constructs demonstrate acceptable levels of collinearity, ensuring that the regression estimates remain stable, unbiased, and interpretable. Consequently, the structural relationships in the model can be confidently assessed in subsequent hypothesis testing and structural analysis.
4.6. Model Fit
Table 6 presents the model fit indices for both the saturated and estimated models. In PLS-SEM, the Standardized Root Mean Square Residual (SRMR) is a commonly used indicator of model fit, where values below 0.08 are considered acceptable [
77,
80], indicating a good fit between the hypothesized model and the observed data.
In this study, the SRMR value for the saturated model is 0.072, while the estimated model reports a value of 0.073. Both values are below the recommended threshold of 0.08, indicating that the model demonstrates an acceptable level of fit. The closeness of the SRMR values between the saturated and estimated models further suggests consistency in model specification and minimal misfit.
The discrepancy measures also support the overall adequacy of the model fit. The d_ULS values are 2.771 for the saturated model and 2.795 for the estimated model, while the d_G values are 1.827 and 1.839, respectively. The minimal differences between the saturated and estimated models indicate a low level of discrepancy between the empirical data and the model-implied covariance structure, further confirming an acceptable model fit.
In addition, the chi-square statistics are 934.256 for the saturated model and 932.342 for the estimated model. As commonly noted in the PLS-SEM literature, chi-square values are sensitive to sample size and model complexity and should therefore not be used as a standalone indicator of model fit. Nonetheless, the similarity between both values suggests a stable model specification.
The Normed Fit Index (NFI) values are 0.725 for the saturated model and 0.726 for the estimated model. Although these values are below the conventional threshold of 0.90 proposed by Bentler and Bonett [
81], they are typical in PLS-SEM applications, where model evaluation prioritizes prediction-oriented assessment rather than strict covariance-based fit criteria.
The model fit assessment indicates an acceptable level of model adequacy. The SRMR values are within recommended thresholds, and the small differences between the saturated and estimated models across d_ULS, d_G, and chi-square further confirm model stability. While the NFI values suggest moderate fit, the results remain consistent with PLS-SEM standards, supporting the suitability of the model for further structural analysis and hypothesis testing.
4.7. Hypothesis Testing
Table 7 and
Table 8 present the results of the structural model analysis and Multi-Group Analysis (MGA) used to test the study hypotheses derived from the integrated theoretical framework of the Resource-Based View (RBV), Dynamic Capabilities Theory, and Digital Ecosystem Theory.
4.7.1. H1: Digital Capabilities and Sustainable Business Growth
Hypothesis H1 proposed that digital capabilities are positively associated with sustainable business growth. The results in
Table 7 support this hypothesis, showing a positive and statistically significant relationship between digital capability (DC) and sustainable business growth (SG) (β = 0.476, t = 3.866,
p < 0.001). This indicates that firms with stronger digital capabilities tend to achieve higher levels of sustainable business growth. From a theoretical perspective, this finding aligns with the Resource-Based View and Dynamic Capabilities Theory, which emphasize that valuable, rare, and adaptable capabilities enhance long-term firm performance through improved efficiency, innovation, and responsiveness to environmental change. Therefore, H1 is supported.
4.7.2. H2: Basic Digitalization and Sustainable Business Growth
Hypothesis H2 proposed that basic digitalization is positively associated with sustainable business growth, but that this relationship is weaker than that of digital capabilities. The results show that basic digitalization (BD) has a negative and statistically insignificant effect on sustainable business growth (β = −0.030, t = 0.189, p = 0.850). This indicates that the basic adoption of digital tools alone does not significantly contribute to sustainable business growth in the sampled firms. The finding suggests that simple digital adoption, without the development of deeper capabilities such as integration, analytics, and innovation capacity, is insufficient to generate meaningful long-term performance outcomes. Therefore, H2 is not supported.
4.7.3. H3: Cross-Country Variation in Digital Capability Effects
Hypothesis H3 proposed that digital capabilities are positively associated with sustainable business growth, but that the strength of this relationship differs across countries (Egypt, Iraq, and Lebanon). Bootstrap Multi-Group Analysis (MGA) was conducted to compare the structural path from digital capability to sustainable business growth across the three countries (
Table 8).
The results show that the difference in the digital capability–sustainable business Growth relationship between Egypt and Lebanon is statistically significant (p = 0.000), as is the difference between Iraq and Lebanon (p = 0.000), while the difference between Egypt and Iraq is not statistically significant (p = 0.325). This indicates that Lebanon differs significantly from both Egypt and Iraq in terms of how digital capabilities translate into sustainable business growth, whereas Egypt and Iraq exhibit similar structural effects.
These findings are consistent with Digital Ecosystem Theory, which suggests that institutional quality, infrastructure, and market conditions shape the effectiveness of firm-level capabilities. Therefore, H3 is supported in terms of cross-country variation in effect strength, with Lebanon emerging as the most structurally distinct context. However, these findings should be interpreted with caution because MICOM results indicated that compositional invariance was not fully established for sustainable business growth in the Egypt–Lebanon comparison as shown in
Table 9, which may affect the comparability of the MGA results. In addition, discriminant validity is further supported by the cross-loadings shown in
Table 10, where each item has a higher loading on its respective construct than on any other.
4.7.4. H4: Moderating Role of Digital Ecosystem Maturity
In line with the standard moderation analysis procedure, the structural model estimated both the main effect of Digital ecosystem maturity (DE) on sustainable business growth (SG) and the interaction effect between digital ecosystem maturity and digital capability (DE × DC).
The results indicate that digital ecosystem maturity is positive and has a significant direct effect on sustainable business growth (β = 0.324, t = 4.440, p < 0.001). This finding suggests that firms that are operating in mature digital ecosystems tend to achieve higher levels of sustainable business growth, irrespective of their level of digital capability.
Hypothesis H4 proposed that digital ecosystem maturity strengthens the relationship between digital capabilities and sustainable business growth. The results in
Table 7 show that the interaction term (DE × DC → SG) is negative and not statistically significant (β = −0.073, t = 1.350,
p = 0.177). This indicates that digital ecosystem maturity does not significantly moderate the relationship between digital capabilities and sustainable business growth in the sampled data. Although the direction of the coefficient is negative, the effect is not statistically meaningful, suggesting that ecosystem conditions do not significantly enhance or weaken the impact of digital capabilities on sustainable business growth in this study. Therefore, H4 is not supported.
Conclusively, the hypothesis testing results indicate that digital capabilities play a central and statistically significant role in driving sustainable business growth, supporting H1. In contrast, H2 was not supported, as basic digitalization alone does not contribute significantly. Additionally, the effect of digital capabilities varies across countries, which support H3 and confirm contextual differences in line with Digital Ecosystem Theory. However, H4 was not supported, as the moderating role of digital ecosystem maturity on the relationship between digital capabilities and sustainable business growth is not statistically significant. These findings collectively highlight that those advanced digital capabilities, rather than basic digital adoption or ecosystem interaction effects, are the primary drivers of sustainable business growth in the examined contexts.
5. Discussion
5.1. Interpretation of Ecosystem-Specific Findings
The findings of this study provide evidence on how digital capabilities, basic digitalization, and digital ecosystem conditions influence sustainable business growth across different national contexts.
First, the results show that digital capability (DC) has a positive and significant effect on sustainable business growth (SG) (β = 0.476,
p < 0.001), supporting H1. This finding is consistent with prior studies that emphasize digital capabilities as strategic resources that enhance firm performance and sustainability. For instance, research grounded in the Resource-Based View (RBV) argues that firms achieve superior performance when they develop valuable and inimitable capabilities rather than relying solely on technology access [
38,
62]. Similarly, studies in the digital transformation literature have shown that capabilities such as data analytics, integration, and digital innovation significantly improve operational efficiency and long-term growth outcomes [
36,
82].
In contrast, basic digitalization (BD) shows a negative and non-significant effect on sustainable business growth (β = −0.030,
p = 0.850); H2 was not supported. This finding aligns with recent research suggesting that mere adoption of digital tools does not automatically lead to performance improvement unless accompanied by higher-order capabilities. Studies have argued that “digital adoption without capability development” often results in limited productivity gains and weak strategic impact [
33,
35]. Therefore, the result reinforces the argument that digital transformation value lies in capability depth rather than basic adoption.
Second, the interaction effect between digital ecosystem and digital capability (DE × DC) is negative and insignificant (β = −0.073,
p = 0.177), H4 was not supported. This result differs from expectations in Digital Ecosystem Theory, which suggests that stronger ecosystems enhance the value of firm-level capabilities. However, some empirical studies have also found weak or inconsistent moderating effects of external environments, especially in emerging economies where institutional support and infrastructure are uneven [
27]. This suggests that ecosystem maturity alone may not be sufficient to strengthen capability–performance relationships unless firms already possess strong internal absorptive capacity.
In addition to the moderation analysis, digital ecosystem maturity was found to have a positive and statistically significant direct effect on sustainable business growth (β = 0.324,
p < 0.001). This suggests that firms operating within more mature digital ecosystems tend to achieve higher levels of sustainable business growth regardless of their level of digital capability. Therefore, while digital ecosystem maturity does not strengthen the relationship between digital capabilities and sustainable business growth, it contributes independently to improved business outcomes through supportive institutional, technological, and market conditions [
27].
Third, the Multi-Group Analysis confirms significant cross-country differences in the DC → SG relationship, supporting H3. The relationship differs significantly between Egypt and Lebanon, and between Iraq and Lebanon, while no significant difference exists between Egypt and Iraq. This aligns with Digital Ecosystem Theory, which argues that institutional quality, infrastructure, and market maturity shape how digital capabilities translate into performance outcomes [
27,
75]. Prior cross-country studies in digital transformation also show that firms in less stable or less digitally mature environments experience weaker capability realization due to infrastructural and institutional constraints. This explains why Lebanon differs significantly from the other two countries in this study.
In the context of Lebanon, the financial crisis has been a long-term phenomenon, the currency has lost its value, banks have been subject to restrictions and institutional instability, which has impacted how companies are using digital technologies [
14,
83]. The financial crisis in Lebanon is an ongoing issue, the currency’s value has been eroded, banking has become restricted, and there is institutional instability which affects the use of digital technologies in the business environment. Many entrepreneurial companies have embraced digital channels, online payment options, and overseas digital markets as tools for business continuity, market expansion through foreign customers, and organization resiliency, rather than as instruments for efficiency or increase in the size of the market [
15,
84]. Digital capabilities thus work in a highly constrained institutional environment, with a structural impact on the sustainable business growth of businesses in the countries that is different from the other countries.
In Iraq, entrepreneurial firms continue to operate within a post-conflict environment characterized by ongoing institutional reconstruction, uneven digital infrastructure, and relatively weak regulatory coordination [
14,
85]. Under these conditions, digital capabilities often compensate for institutional deficiencies by enabling firms to access wider markets, improve operational coordination, and reduce transaction costs [
85]. However, the benefits remain constrained by infrastructure gaps and regulatory uncertainty.
By comparison, Egypt has experienced a more coordinated and state-led digital transformation through sustained public investment in digital infrastructure, e-government services, and national digitalization initiatives [
13,
14]. These institutional developments provide firms with a comparatively more supportive environment in which advanced digital capabilities can be translated into sustainable business growth. Collectively, these findings demonstrate that the relationship between digital capabilities and sustainable business growth differs across national contexts. While the moderation analysis did not support a significant moderating role of digital ecosystem maturity (H4), the Multi-Group Analysis indicates that country-specific institutional and ecosystem characteristics are associated with differences in how digital capabilities translate into sustainable business growth [
1,
27].
Lastly, the Measurement Invariance of Composite Models (MICOM) was conducted prior to the Multi-Group Analysis (MGA) to check whether the measurement model was comparable across the three countries. Compositional invariance was established for all the constructs except the sustainable business growth in the Egypt–Lebanon comparison, which was not fully established. For all the constructs that were established, their original correlation is higher than or equal to the corresponding 5% quantile except sustainable business growth, which shows a slightly lower original correlation (0.990) than the corresponding 5% quantile (0.994), indicating that compositional invariance was not fully established for this construct. Overall, the MICOM results provide substantial evidence of measurement invariance across the three national samples, supporting the subsequent application of Multi-Group Analysis (MGA) to compare the structural relationships across countries. Nevertheless, because compositional invariance was not fully established for sustainable business growth in the Egypt–Lebanon comparison, the MGA findings should be interpreted with caution.
5.2. Theoretical and Practical Implications
From a theoretical perspective, this study contributes to the integration of the Resource-Based View (RBV), Dynamic Capabilities Theory, and Digital Ecosystem Theory. The significant positive effect of digital capabilities on sustainable business growth reinforces the RBV argument that valuable and difficult-to-imitate firm resources are key drivers of long-term competitive advantage. It also supports Dynamic Capabilities Theory by showing that firms capable of effectively leveraging digital technologies are better positioned to achieve sustainable performance outcomes.
However, the insignificant effect of basic digitalization challenges the assumption that technology adoption alone is sufficient for performance improvement. Instead, the findings emphasize that competitive advantage lies not in access to digital tools, but in the ability to integrate, adapt, and transform them into strategic capabilities. This distinction strengthens the theoretical separation between basic digitalization and higher-order digital capabilities.
In addition, the multi-group results extend Digital Ecosystem Theory by demonstrating that the impact of digital capabilities varies significantly across countries. The observed differences between Egypt, Iraq, and Lebanon confirm that institutional environments, infrastructure development, and market conditions influence how effectively firms convert digital capabilities into sustainable business growth. This adds empirical proof that the link between digital capabilities and sustainable business growth is different among the three national contexts investigated. While the moderation hypothesis was not supported, the significant direct effect of digital ecosystem maturity suggests that ecosystem conditions contribute independently to sustainable business growth, even though they do not significantly moderate the relationship between digital capabilities and growth.
However, the Multi-Group Analysis indicates that country-specific institutional and ecosystem characteristics could have an effect on the relationship between digital capabilities and business outcomes. More importantly, the findings suggest that digital ecosystems should not be viewed only in terms of technological maturity or infrastructure availability. Instead, institutional stability, regulatory effectiveness, financial systems, and broader political–economic conditions shape the extent to which firms can transform digital capabilities into sustainable business growth. This extends Digital Ecosystem Theory by demonstrating that ecosystem maturity reflects both technological and institutional dimensions, particularly within emerging economies that experience economic instability or post-conflict reconstruction. Nevertheless, because full compositional invariance was not established for sustainable business growth across all group comparisons, the observed cross-country differences should be interpreted cautiously and warrant further validation in future research.
From a practical perspective, the findings provide important guidance for managers and policymakers. For managers, the results suggest that investment should move beyond basic digital tools toward the development of advanced digital capabilities, such as data analytics, system integration, and digital innovation capacity. Firms that focus only on digital adoption without capability development are unlikely to achieve sustainable business growth benefits.
For policymakers, the cross-country differences highlight the importance of strengthening national digital ecosystems. The significant direct effect of digital ecosystem maturity indicates that strengthening digital infrastructure, institutional quality, and regulatory support can directly improve firms’ sustainable business growth. Although these ecosystem conditions did not significantly strengthen the impact of digital capabilities, they provide a supportive environment that benefits firms more generally. The weaker or varying effects across countries suggest that ecosystem development plays a critical role in enabling firms to fully benefit from digital transformation. In Egypt, the continued investment in digital infrastructure, digital skill development, and innovation support programs can further enhance firms’ capacity to adopt digital skills as a tool for sustainable business growth. For the Lebanese context, policy should focus on enhancing financial stability, access to digital financial services, and institutional trust in order to help companies use digital tools more effectively in the context of economic uncertainty. Despite institutional reconstruction in Iraq, it is important to continue to develop digital infrastructure, facilitate digital ecosystem development through friendly entrepreneurs, and ensure proper coordination of the regulatory environment.
Thus, the study underscores that sustainable business growth is driven primarily by digital capabilities. In addition, digital ecosystem maturity has a significant positive direct effect on sustainable business growth. However, its hypothesized moderating effect on the relationship between digital capabilities and sustainable business growth was not statistically supported.
6. Conclusions
6.1. Summary of Findings
This study examined the effects of digital capabilities, basic digitalization, and digital ecosystem conditions on sustainable business growth, drawing on the Resource-Based View (RBV), Dynamic Capabilities Theory, and Digital Ecosystem Theory. The findings from the structural model analysis show that digital capabilities have a positive and statistically significant effect on sustainable business growth (β = 0.476, p < 0.001), supporting H1 and confirming that firms with stronger digital capabilities achieve higher levels of sustainable business growth.
In contrast, basic digitalization was found to have a negative and statistically insignificant effect on sustainable business growth (β = −0.030, p = 0.850), indicating that the mere adoption of digital tools does not translate into improved long-term performance. Therefore, H2 was not supported. Similarly, the interaction effect between digital ecosystem and digital capability was negative and insignificant (β = −0.073, p = 0.177), suggesting that ecosystem maturity does not significantly strengthen the relationship between digital capabilities and sustainable business growth in the sampled firms. Accordingly, H4 was not supported.
The Multi-Group Analysis further revealed that the impact of digital capabilities on sustainable business growth differs significantly across countries, supporting H3. The results showed statistically significant differences between Egypt and Lebanon, and between Iraq and Lebanon, while no significant difference was found between Egypt and Iraq. This indicates that national context may shape how digital capabilities translate into sustainable business growth outcomes. However, these findings should be interpreted with caution because compositional invariance for sustainable business growth was not fully established in one MICOM comparison (Egypt–Lebanon), which may limit the comparability of the group-specific estimates.
Accordingly, the study confirms that advanced digital capabilities are the primary driver of sustainable business growth, while basic digitalization alone is insufficient to improve sustainable business growth, and although cross-country differences were observed, the hypothesized moderating effect of digital ecosystem maturity was not supported.
6.2. Limitations of the Study
Despite the contributions of this study, several limitations should be acknowledged. First, the research relies on cross-sectional data, which limits the ability to make causal inferences over time. Longitudinal data would provide stronger evidence of how digital capabilities influence sustainable business growth dynamically.
Second, the study is based on self-reported survey data from a single respondent within each firm, which may introduce common method bias and subjective measurement error. Although statistical tests were used to ensure reliability and validity, future research could incorporate objective performance indicators to improve robustness.
Third, the study focuses on three countries including Egypt, Iraq, and Lebanon with relatively small country-specific subsamples (Egypt = 51, Lebanon = 34, and Iraq = 24). Although these sample sizes were adequate to conduct PLS-SEM analysis, the relatively small subsamples may limit the generalizability of the findings to other emerging or developed economies and also the statistical power of the Multi-Group Analysis (MGA). Accordingly, the cross-country differences should be interpreted with appropriate caution, as different institutional environments may produce different outcomes.
Fourth, while the study includes digital ecosystem as a moderator, the non-significant interaction effect suggests that other contextual variables (e.g., regulatory quality, industry type, or digital maturity stages) may play a more complex role than captured in the current model.
Finally, although the Measurement Invariance of Composite Models (MICOM) assessment provided evidence of measurement invariance across the three country samples, compositional invariance was not fully established for sustainable business growth in the Egypt–Lebanon comparison. Consequently, the Multi-Group Analysis results should be interpreted with caution, and future studies should further validate these cross-country comparisons using larger samples and fully invariant measurement models.
6.3. Future Research Directions
Future research can extend this study in several important ways. First, longitudinal studies are recommended to examine how digital capabilities evolve over time and how they influence sustainable business growth in dynamic environments.
Second, future studies should consider incorporating objective firm-level performance data, such as financial performance, productivity metrics, or market share, to complement perceptual survey measures.
Third, researchers may expand the geographical scope to include more diverse countries across different development levels, enabling stronger cross-country comparisons and broader generalization of findings.
Fourth, future studies could explore additional moderators and mediators, such as innovation capability, organizational culture, leadership style, or regulatory quality, to better explain how digital capabilities translate into sustainable business growth.
Finally, qualitative or mixed-method approaches could provide deeper insights into how firms develop and deploy digital capabilities in practice, especially within different ecosystem environments.