Article

Toward a Transferable Methodology for Identifying and Characterizing Odor Nuisance Sources Using In Situ Measurements: A Case Study from Płock, Poland

by
Marta Wiśniewska
*,
Piotr Manczarski
,
Anna Rolewicz-Kalińska
and
Krystyna Lelicińska-Serafin
Faculty of Environmental Engineering, Warsaw University of Technology, Nowowiejska 20 Street, 00-653 Warsaw, Poland
*
Author to whom correspondence should be addressed.
Sustainability 2026, 18(16), 8464; https://doi.org/10.3390/su18168464
Submission received: 7 June 2026 / Revised: 13 August 2026 / Accepted: 14 August 2026 / Published: 18 August 2026
(This article belongs to the Special Issue Innovations in Environment Protection and Sustainable Development)

Abstract

Odor nuisance is a significant source of environmental complaints. Populations living in the vicinity of odor-emitting facilities may be exposed to a variety of chemical compounds that cause adverse olfactory sensations, thereby conflicting with the United Nations Sustainable Development Goal 3 (UN SDGs). Odor nuisance is characterized by high temporal variability, largely depending on meteorological conditions. The present study comprised 29 measurement series conducted at 20 measurement points. The research involved the use of a MultiRAE Pro multi-gas detector, a Dräger X-pid® 9500 portable gas detector with a chromatography function and a Nasal Ranger® field olfactometer (odor concentration, cod determination). Meteorological measurements and observations were carried out simultaneously with odorimetric investigations. The results obtained during the measurement campaign were subjected to statistical analysis. These findings indicate that field olfactometry and portable gas chromatography for determining volatile organic compounds (VOC) are appropriate tools for the rapid verification of odor complaints reported by residents in urban and suburban areas. In contrast, the portable detector with gas chromatography functionality used during the measurement campaign proved unsuitable for air-quality testing due to excessively high detection and quantification thresholds.

1. Introduction

All forms of human activity, including urbanization near residential areas, have a significant impact on air quality. An increasing volume of pollutants originates from both municipal facilities—such as landfills, recycling plants, and wastewater treatment plants—and industrial operations, including oil refineries, manufacturing plants, breweries, distilleries, and other industrial operations. These sources contribute substantially to atmospheric emissions of chemical compounds across various chemical groups. Chemical compounds that are characterized by a distinctive odor are classified as odorants. From this perspective, the aforementioned facilities may serve as sources of odor emissions and may thus be subject to an environmental impact assessment [1,2,3,4].
Table 1 presents the odor characteristics of selected facilities that have the potential to cause odor nuisance in urban agglomerations.
Air pollutants can adversely affect both living organisms and the abiotic components of the environment. Some of these pollutants exhibit carcinogenic properties and may therefore pose a serious threat to human health, particularly at elevated concentrations [27]. Among air pollutants, particular attention should be paid to substances responsible for unpleasant odors in ambient air, commonly referred to as odorants [13,28,29].
Odor nuisance is a major source of environmental complaints [30,31]. Populations living in the vicinity of odor-emitting facilities may be exposed to a variety of chemical compounds, such as volatile organic compounds (VOC), that evoke adverse olfactory sensations. Such disturbances conflict with Goal 3 of the United Nations 2030 Agenda for Sustainable Development (UN SDGs)—good health and well-being [13,32,33,34,35,36,37]. Odor nuisance can lead to a range of negative effects, including psychological distress, stress, and physiological impairment [38]. Furthermore, it can adversely affect the local economy and reduce the quality of life of affected communities. Cases of odor nuisance arise when residents perceive a discrepancy between the odors they experience and those they consider acceptable or expect in their living environment [39].
According to Kim and Park [40], odor measurements provide a basis for assessing and addressing odor-related problems, evaluating compliance with odor regulations, and supporting administrative decision-making [41]. Odor nuisances may also hinder the operation of existing industrial facilities and limit the development or construction of new ones [42].
Methods for odor measurement can be broadly classified into olfactory and chemical approaches [43]. Olfactory assessment includes parameters such as odor concentration (odor detection threshold), odor intensity, and hedonic tone. Among these indicators, odor concentration is the most commonly used parameter in odor impact assessments [44].
Furthermore, odor nuisance exhibits considerable temporal variability, largely influenced by meteorological conditions [45]. The continuous emission of unpleasant odors at low concentrations may be as burdensome to the exposed population as the periodic release of odors at high concentrations, because the nuisance effect can accumulate over prolonged exposure [46,47].
Such studies provide reliable information on, among other aspects, the odor nuisance experienced by residents. Several methods are available for the quantitative analysis of both odors (sensory methods) and the individual compounds responsible for adverse olfactory perceptions (analytical and sensor-based methods) [48].
Analytical methods include gas chromatography and gas chromatography coupled with mass spectrometry. These techniques enable the separation, identification, and quantification of individual odorants present in a gas mixture. However, none of these methods, when used independently, can provide comprehensive information about emitted odors [48,49].
Examples of sensor-based methods include electronic noses (e-noses) and gas detectors [48,50]. The operation of an electronic nose is based on a calibration model developed from sensor-array signals and odor-intensity ratings on a verbal scale [51]. Electronic noses can be used for in situ measurements. However, a significant limitation of these devices is their sensitivity to temperature and relative humidity [50,52].
Olfactometry is a quantitative technique used to determine odor concentration levels [53,54]. Olfactometric methods are commonly applied to assess the odor concentration of process gases [55,56,57]. These methods can be classified as either static or dynamic, and as indirect (laboratory-based) or direct (field-based) approaches.
Dynamic olfactometry is based on the analysis of air samples collected at the emission source. Measurements may be conducted either under field conditions (in situ) or in laboratory conditions (ex situ). In the latter case, a gas sample must be collected in a sampling bag made of appropriate material and subsequently analyzed in the laboratory. Unfortunately, during storage and transport, the sample may be affected by adsorption and condensation processes, which can alter its composition [53].
Measurement methods used for odor analysis and odor nuisance assessment, along with their advantages and limitations, are described in detail elsewhere [57]. Dynamic olfactometry, including field olfactometry, is one of the most widely used methods for odor assessment. It provides statistically defined information on the sensitivity and magnitude of odor samples through controlled dilution using an olfactometer. Although this method does not identify the chemical compounds present in the tested gas mixture, it enables determination of the odor detection threshold. This corresponds to the dilution factor required to reduce odor perception to the detection limit.
Chemical methods are used to determine the quantitative composition of compounds responsible for odor emissions. Unlike olfactometric methods, their performance is independent of human sensory responses. Nevertheless, odor investigations should not rely solely on the identification and quantification of individual components of an odorous gas mixture. They should rather incorporate these analyses as one element of a comprehensive assessment [50,58]. Malodorous compounds in a mixture may interact synergistically or antagonistically, altering odor intensity and hedonic tone. Therefore, when assessing the odor impact of facilities causing odor nuisance, determining both odor and odorant concentrations is beneficial [59,60,61,62,63,64,65,66].
Sensor-based methods for odorant measurements, increasingly employed in portable gas detectors, are characterized by ease of operation, relatively low investment and operating costs, and high mobility [31,48,67]. However, these devices generally exhibit limited sensitivity, which can be affected by environmental factors and interfering substances [53,68].
This study aims to refine methodological approaches to identifying and characterizing sources of odor nuisance in urban agglomerations using in situ measurement techniques. The specific objective is to develop a transferable methodology for rapidly identifying odor nuisance sources, thereby facilitating the implementation of mitigation and preventive measures.
Previous studies have proposed various methodologies for odor assessment. However, many of these approaches require long-term monitoring, entail substantial costs, and often fail to provide clear responses to residents’ complaints. This limitation is critical because odor impacts in urban areas are generally episodic rather than continuous, making it difficult to synchronize measurement campaigns with reported odor episodes. Consequently, there is a clear need for a methodology that serves as a practical tool for public authorities responsible for verifying odor complaints.
A review of the available literature indicates that relatively few studies have focused on odor investigations in urban agglomerations, indicating a significant research gap in this field.

2. Materials and Methods

The study comprised 29 measurement series conducted between 12 January 2023 and 7 May 2024. Based on prior surveys and an analysis of residents’ complaints covering 2012–2021 [69], the refinery was identified as the primary source of odor nuisance in Płock. This conclusion was supported by prevailing wind directions and the specific odor characteristics reported by residents.
The surveys also provided information on the peak odor-nuisance period and the types and intensities of the perceived odors. However, the analysis of public complaints revealed that verification procedures were limited to subjective on-site assessments by administrative personnel who lacked both specialized expertise in odor management and access to appropriate measurement equipment.
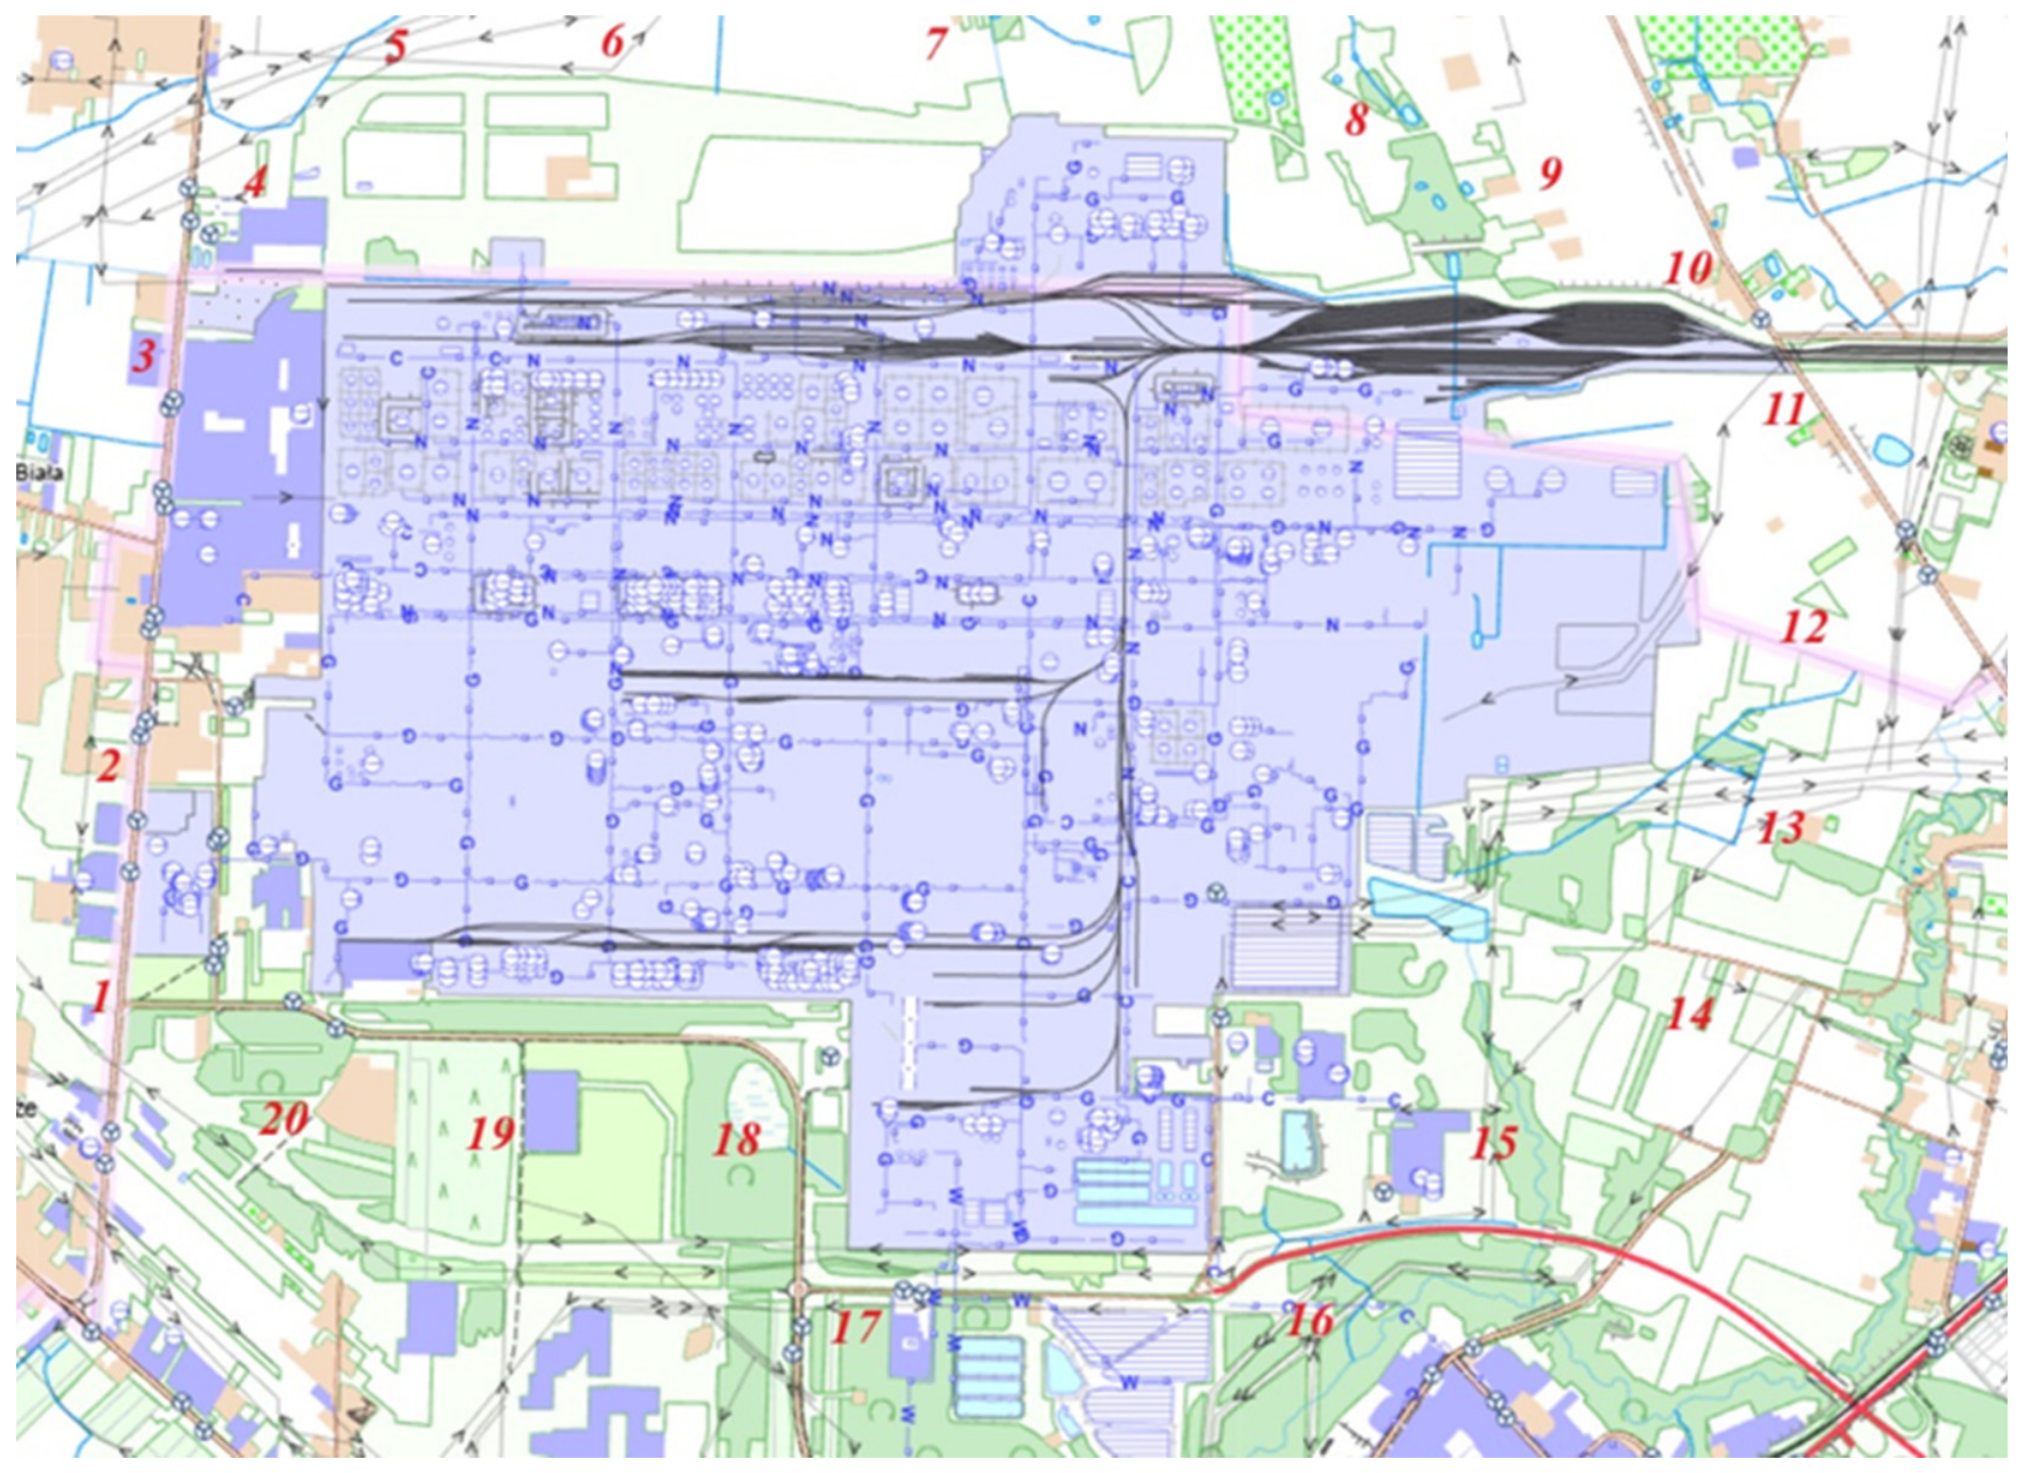
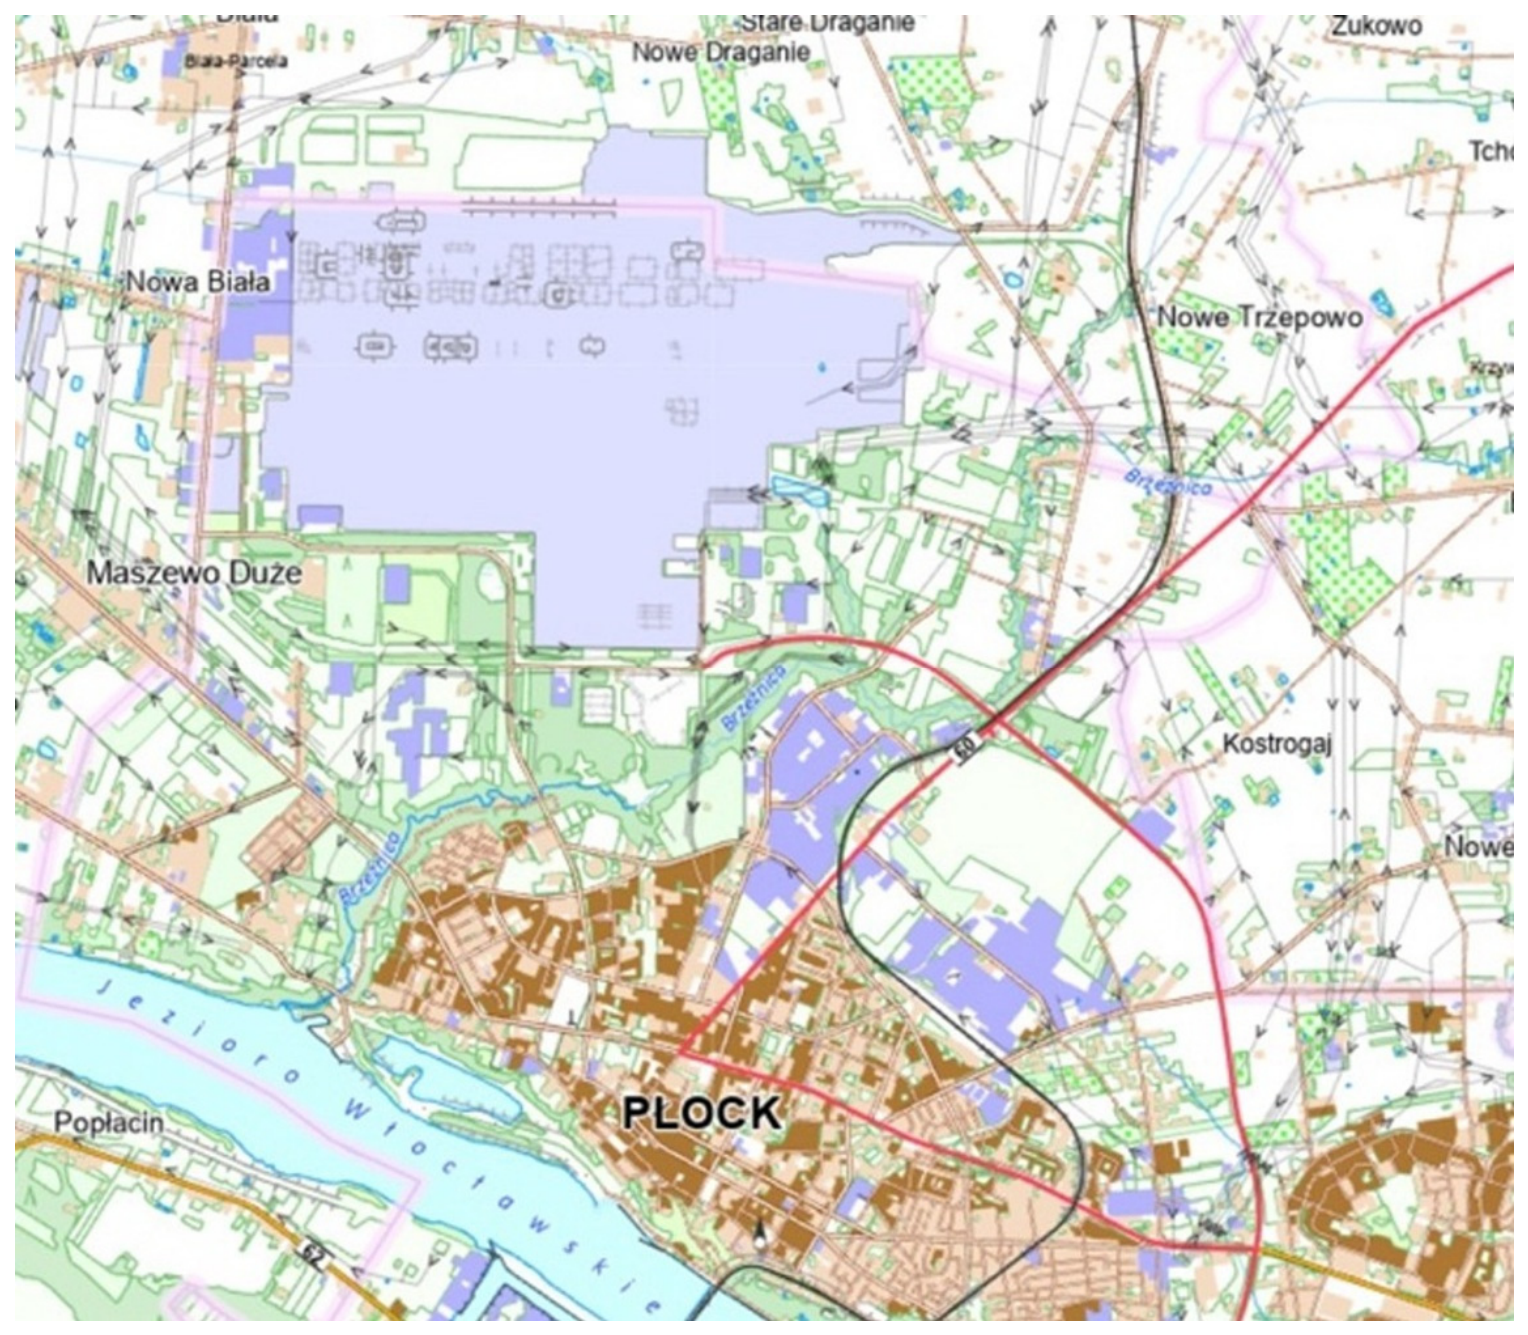
To address this, 20 measurement points were established around the refinery. Their exact locations are shown in Figure 1, while Figure 2 illustrates the spatial relationship between the refinery and the residential areas of Płock.
According to Figure 2, the residential development of the Plock city agglomeration is located on the south (S) and southeast (SE) side of the refinery.

2.1. Odor Intensity Sensory Evaluation and Olfactometric Measurements of Odor Concentrations

The receptor points were located both upwind and downwind of the facility under investigation. Upwind locations were used to determine the background concentrations of odorous air pollutants, whereas downwind locations were used to assess the facility’s impact on the surrounding area. The precise location of each measurement point was selected based on several factors, including the prevailing wind direction (WD) at the time of measurement.
At each measurement point, odor intensity (i) was assessed using a sensory evaluation method based on a six-point scale: 0—no odor; 1—rarely perceptible odor; 2—very weak odor; 3—weak odor; 4—strong odor; and 5—very strong odor [70].
Odor measurements were performed using a Nasal Ranger® field olfactometer (St. Croix Sensory Inc., Lake Elmo, MN, USA), which enables the determination of the Dilution-to-Threshold (D/T) ratio, defined as the ratio of odor-free air to odorous air. During the measurement procedure, the proportion of the odorous air stream bypassing the built-in filters was gradually increased until the odor became detectable. Following adaptation to purified air (BLANK position), in which the entire air stream passes through the filters, the assessor selected the available D/T settings in ascending order: 2, 4, 7, 15, 30, and 60 (uncertainty ± 10%), followed by 60, 100, 200, 300, 400, and 500 (uncertainty ± 5%), with intermediate BLANK positions used as required.
The measurement was completed when a perceptible difference between the odorous air sample and the BLANK air sample was identified. Based on the determined D/T value, the odor concentration (cod) was calculated and expressed as odor units per cubic meter (ou/m3) in accordance with the requirements of the European Standard EN 13725-2003 [71]. Before each measurement series, the panelist performing the olfactometric assessments underwent a Triangle Test in accordance with ISO 4120:2004 [72]. The test required the assessor to identify, from three odor sticks presented, the one containing the reference odorant, n-butanol. This procedure was conducted to verify the assessor’s sensory discrimination ability prior to field measurements.

2.2. Chemical Sensor Measurements of Odorant Concentrations

The study involved the use of a MultiRAE Pro multi-gas detector (RAE Systems, Inc., San Jose, CA, USA) equipped with four sensors for the detection of selected gaseous pollutants, namely ammonia (NH3—range: 0 ÷ 100 ppm, resolution: 1 ppm), hydrogen sulfide (H2S—range: 0–100 ppm, resolution: 0.1 ppm), methyl mercaptan (CH3SH—range: 0 ÷ 10 ppm, resolution: 0.1 ppm), and volatile organic compounds (VOC—range: 0 ÷ 1000, resolution: 10 ppb). A certified service provider regularly calibrated all sensors.
The VOC sensor was calibrated using isobutylene as a reference gas at a concentration of 0.01 ppm. The remaining sensors were calibrated using the following reference gases: 50 ppm NH3, 10 ppm H2S, and 5 ppm CH3SH. The detector operates in conjunction with ProRAE Studio II software (RAE Systems), which enables the retrieval and analysis of measurement data recorded at one-minute intervals.
The second portable analytical device used in the study was the Dräger X-pid 9500, a portable gas detector with chromatographic functionality (Drägerwerk AG & Co. KGaA, Lübeck, Germany). Although it also incorporates a photoionization detector (PID), its operation is also based on gas chromatography, enabling the separation and identification of individual VOC within a gas mixture. In particular, the instrument enables the determination of BTEX compounds (benzene, toluene, ethylbenzene, and xylene), which are associated with unpleasant odors and may pose risks to human health.
The retention time for the analyzed BTEX compounds is approximately 30 s, enabling rapid field-based measurements and compound identification, with a detection limit of 50 ppb.
The sensors used in portable gas detectors differ in both design and operating principles. Common examples include electrochemical and PID sensors. In electrochemical sensors, analyte molecules diffuse through a membrane and an electrolyte toward the surface of a working electrode, which is polarized relative to a reference electrode. The electrical signal generated by the electrochemical redox reaction is proportional to the analyte concentration in the vicinity of the sensor [73,74,75,76].
The operating principle of PID sensors is based on photoionization. This process requires a high-energy ultraviolet light source, typically emitting radiation at wavelengths shorter than 143 nm. The energy of the emitted photons determines which compounds can be detected. If the ionization potential of a molecule is lower than the energy of the incident photons, ionization occurs, generating an electrical current proportional to the concentration of ionized compounds in the sample [76].

2.3. Meteorological Measurements and Observations

Selected meteorological parameters, including air temperature (T), air relative humidity (RH), and wind speed (v), were measured at a height of 1.5 m using a portable Kestrel 4500 NV weather meter equipped with an anemometer (Nielsen-Kellerman Company located in Boothwyn, Pennsylvania, USA), in accordance with the European standard developed by the Association of German Engineers (Verein Deutscher Ingenieure, VDI 3940) [77]. This standard was used in preparing the meteorological measurement protocol preparation. The wind direction was determined using the plume method with reference to the refinery. The study period was selected to account for seasonal variability in Poland, as well as corresponding fluctuations in T and RH. In accordance with the application of the astronomical convention for the seasons, 13 measurement series were carried out in spring, 4 series in summer and autumn, and 8 series in winter.

2.4. Statistical Analysis of the Results Obtained

Meteorological conditions (air temperature, T; relative humidity, RH; wind speed, v; and wind direction, WD) were recorded once per measurement session and were therefore common to all 20 spatial measurement points sampled within that session. Odor concentration (cod), VOC, and perceived odor intensity (i) were recorded separately at each point. This design produces a two-level, hierarchical data structure, with measurement points nested within sessions. To account for this structure and to obtain valid standard errors and significance tests, the relationships between meteorological conditions and cod, VOC, and i were modeled using linear mixed-effects models rather than a simple pooled multiple regression. For each response variable separately, T, RH, v and WD (categorical, 8-point compass, reference level = E) were specified as fixed effects. A random intercept for measurement session was included to account for the nested sampling design (points nested within sessions). Models were fitted using restricted maximum likelihood (REML) with the statsmodels 0.14 implementation in Python 3.12. To assess whether the session-level random effect was warranted, i.e., whether the nested structure induced meaningful residual correlation among points sampled within the same session, each mixed model was refitted by maximum likelihood and compared against the corresponding fixed-effects-only model of identical mean structure using a likelihood-ratio (LR) test. Because the null hypothesis (session variance = 0) lies on the boundary of the parameter space, the LR statistic was referred to a 50:50 mixture of a point mass at zero and a χ21 distribution rather than a standard χ21. The proportion of total residual variance attributable to session (intraclass correlation coefficient, ICC = τ2/(τ2 + σ2)) was computed from the REML variance components as an effect-size measure of clustering.
Moreover, the results from the measurement campaign were analyzed using Statistica 13.1 (StatSoft). The following statistical methods were applied:
  • Descriptive statistics (minimum, mean, maximum, and standard deviation);
  • Pearson’s correlation analysis;
  • Mann–Whitney U test (Wilcoxon rank sum for measurements divided by background (upwind) and impacted (downwind) measurements—stratified by wind direction.
To conduct the test, points 11–20 were selected because the concentrations at these points could potentially influence the perceived nuisance in the studied agglomeration. The values recorded at these points were then divided into leeward and windward sides, separately for i, VOC, and cod. The prepared data was subjected to the Mann–Whitney U test.
These methods are appropriate for evaluating odor nuisance phenomena [78].

2.5. Zero-Inflation and Hurdle Model

Preliminary inspection of the point-level data revealed a substantial proportion of zero readings for cod, VOC, and i, particularly under wind directions that carried the potential plume away from the receptor grid. Because a linear model that treats a zero-inflated variable as continuous can misestimate both the probability of detection and the magnitude of positive readings, cod was additionally modeled using a two-part (hurdle) specification. The first part modeled the probability of a non-zero reading (detection vs. non-detection) as a function of T, RH, v and WD using a logistic generalized estimating equations (GEE) model with an exchangeable working correlation structure clustered by measurement session. Analogous to the random intercept in the LMM, this approach accounts for the non-independence of the 20 points sharing the same session-level meteorological conditions. The second part modeled the magnitude of cod conditional on detection (cod > 0), using a linear mixed-effects model with the same fixed-effect structure and a random intercept for session. This model was fitted to the subset of non-zero observations. Both parts were fitted in Python 3.12 using statsmodels 0.14.

3. Results and Discussion

During the measurement campaign, the following meteorological parameters were recorded: T (minimum 0 °C, maximum 28 °C, mean 14.7 °C), RH (minimum 30%, maximum 99%, mean 59%), and v (minimum 0.6 m/s, maximum 4.2 m/s, mean 2.0 m/s).
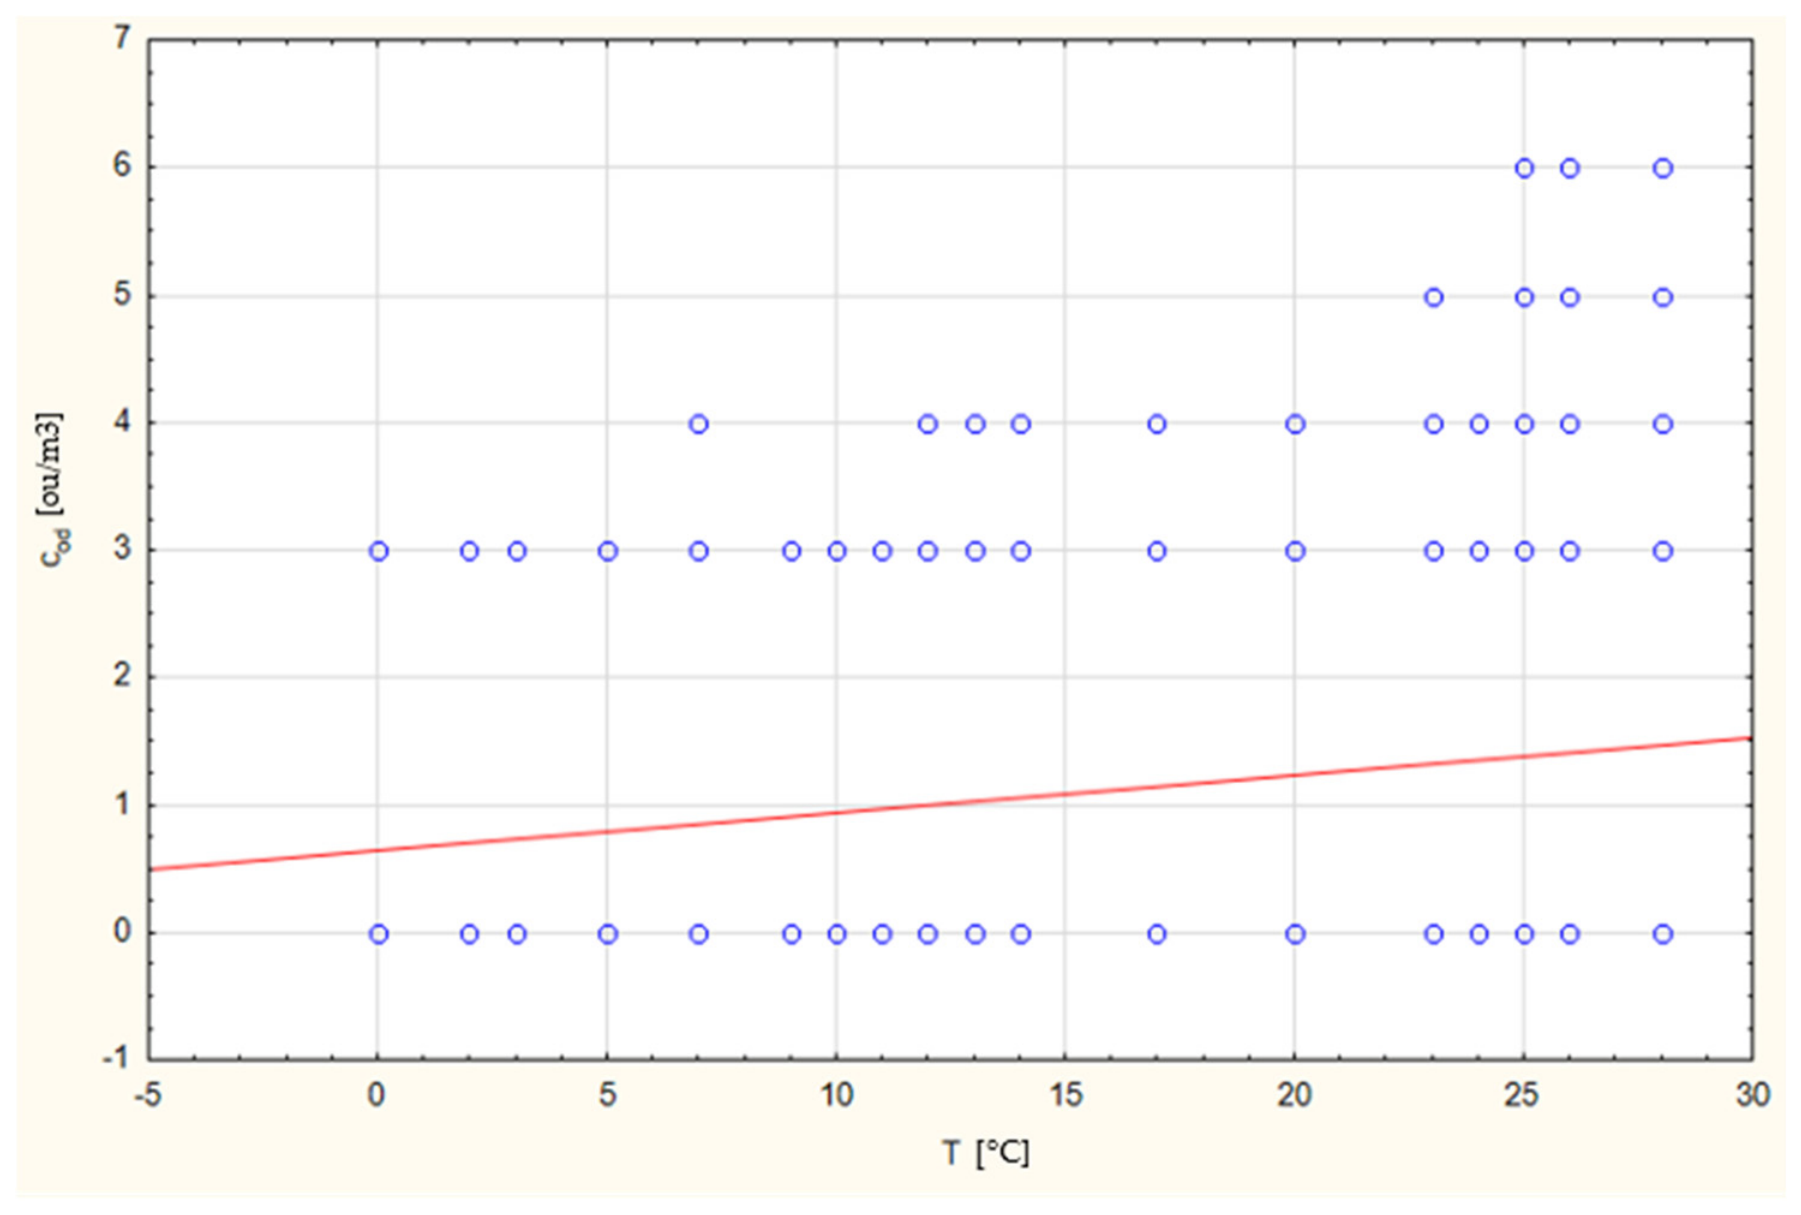
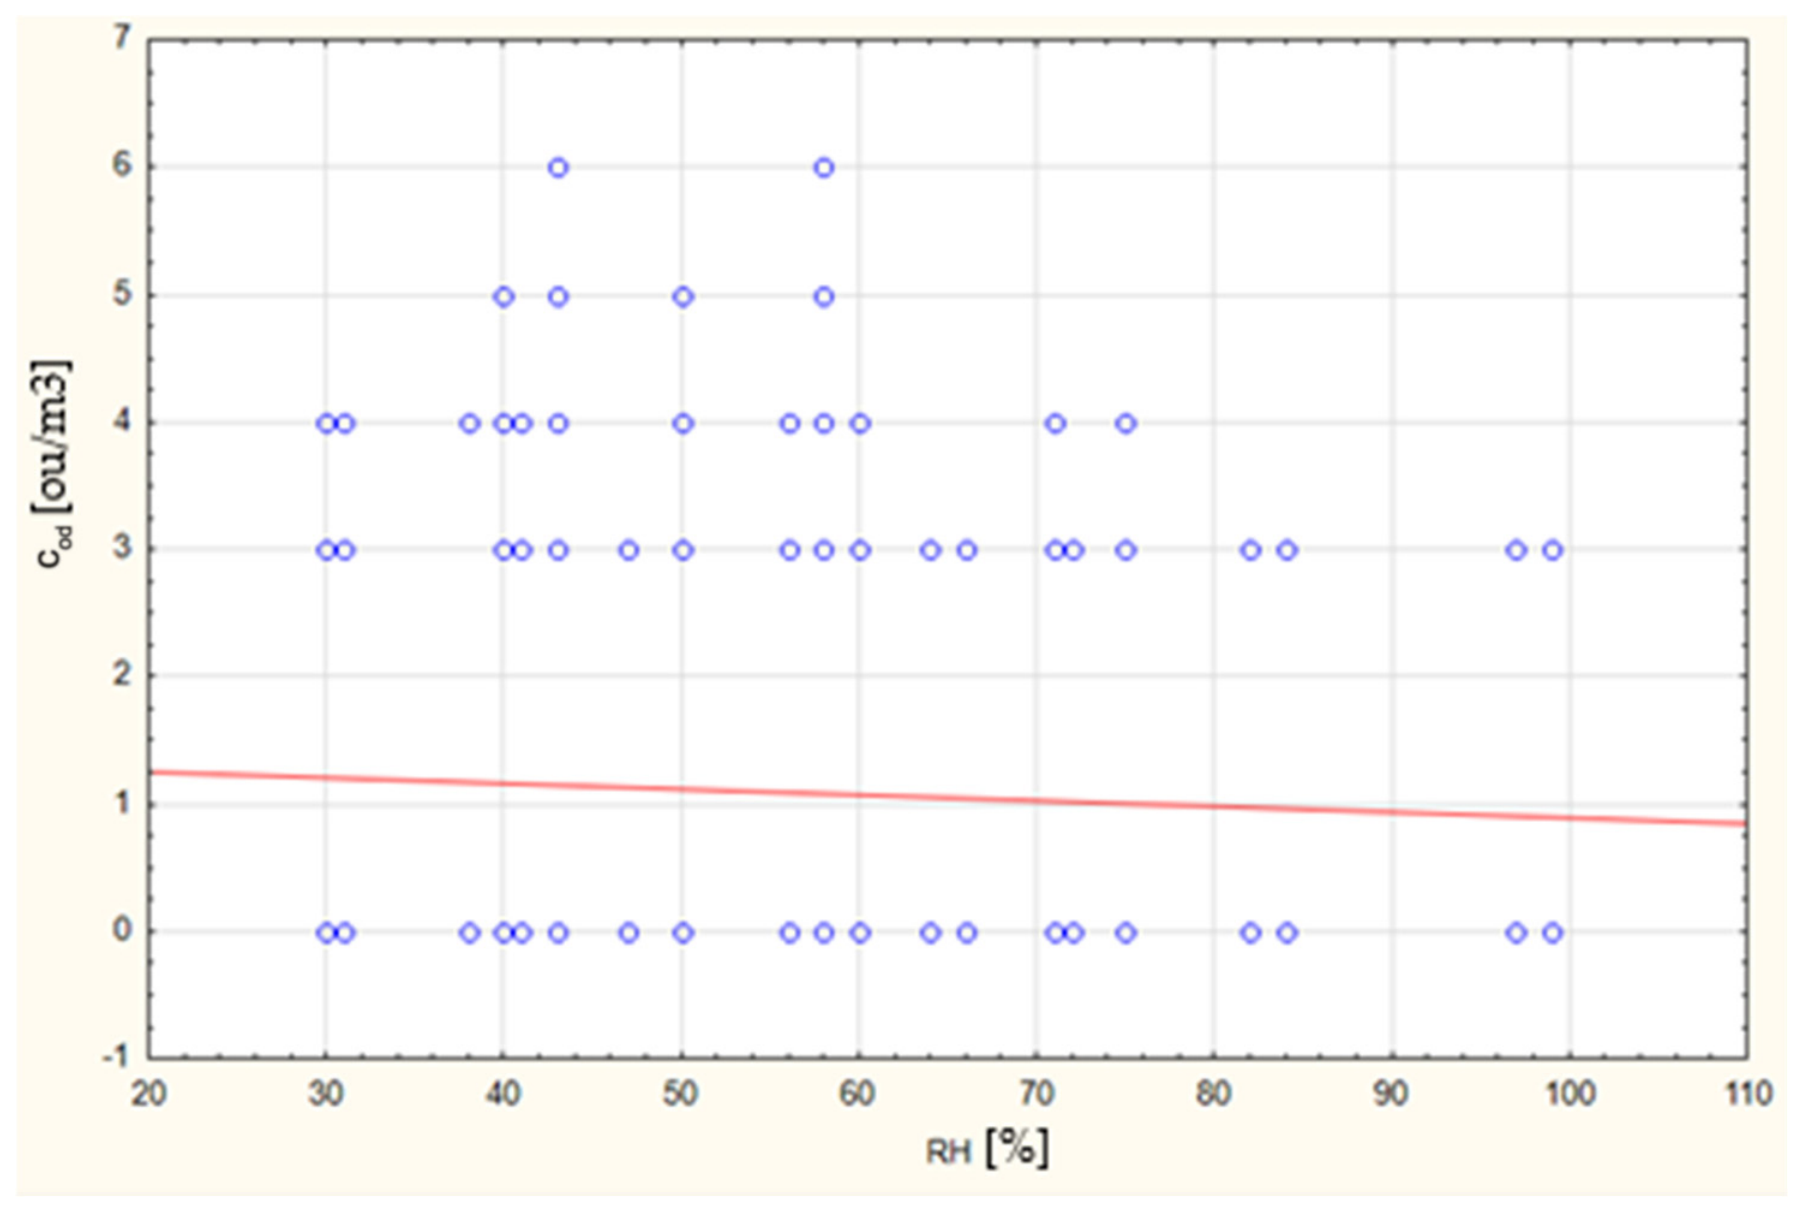
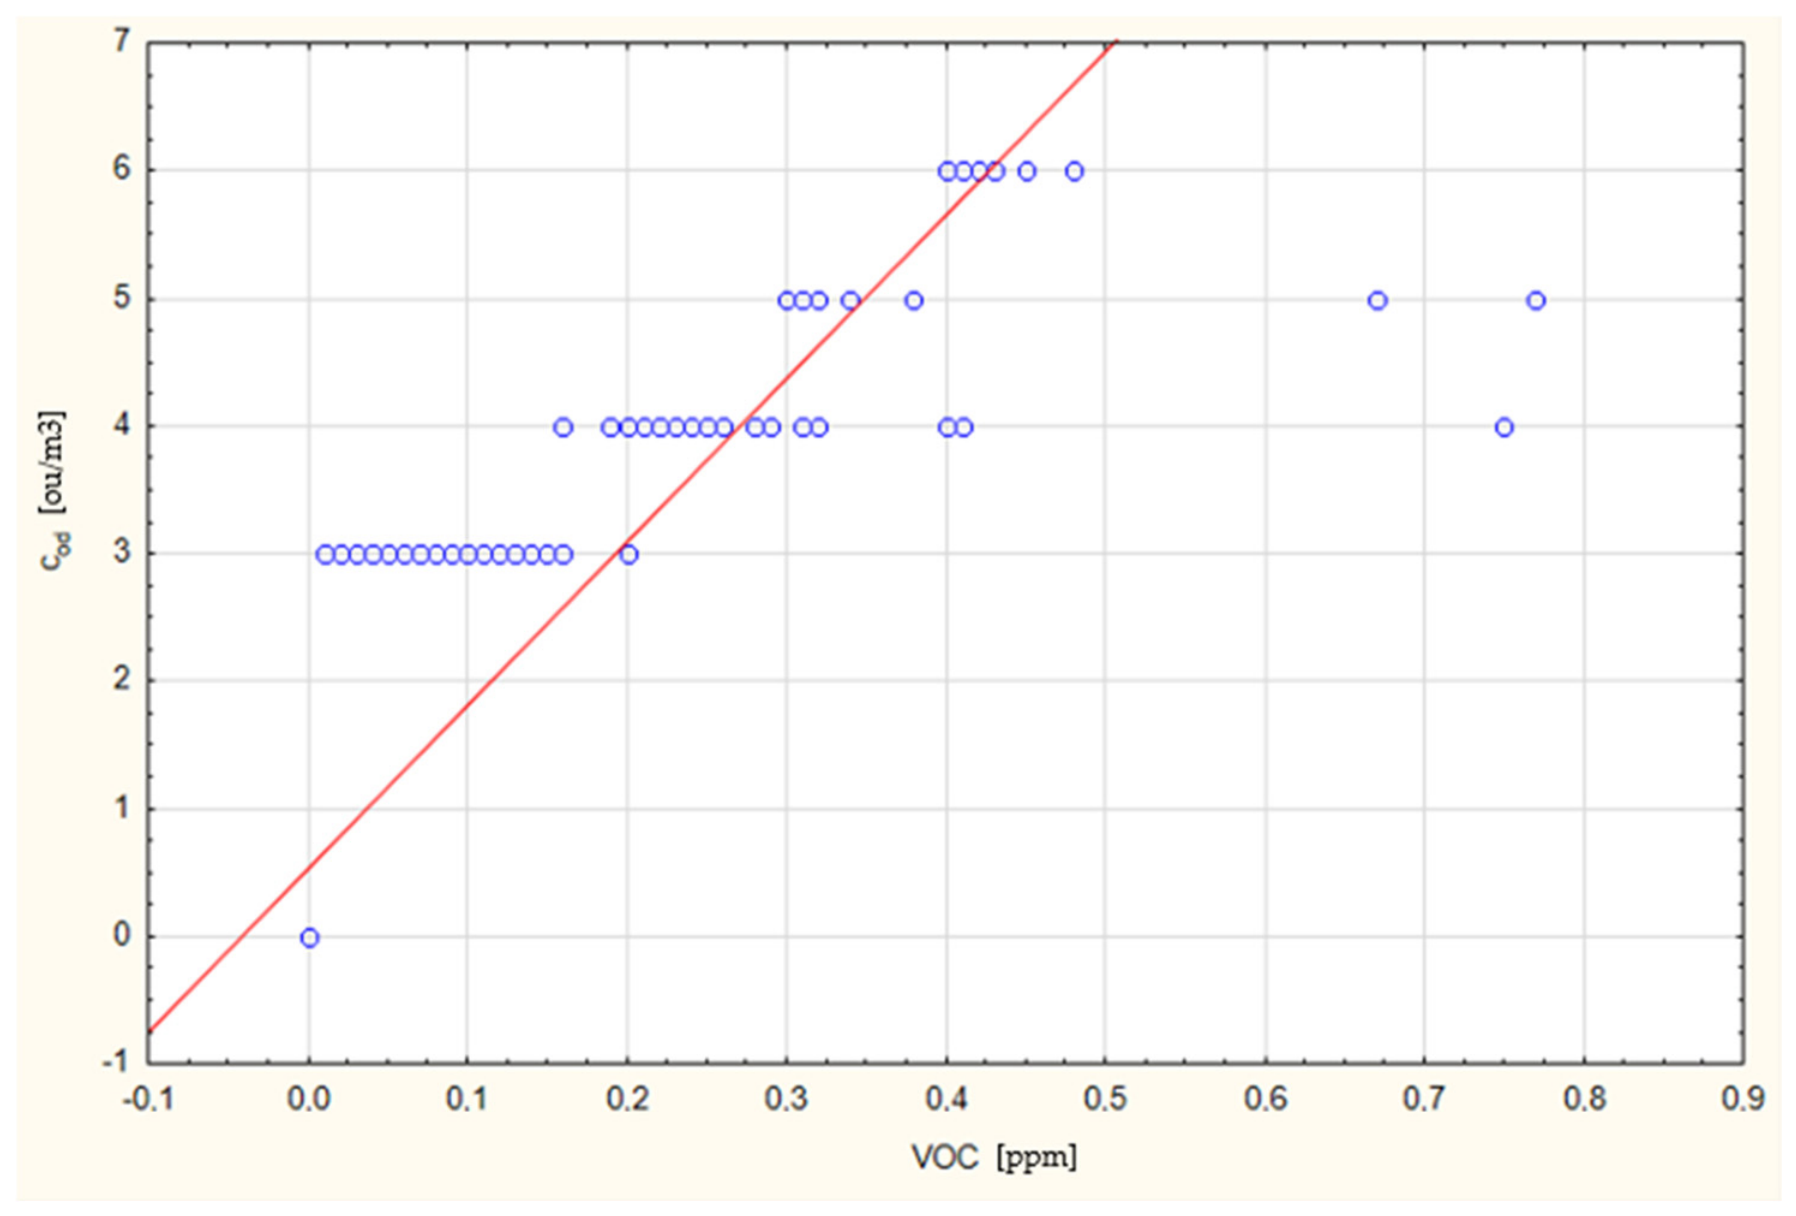
Figure 3, Figure 4 and Figure 5 present scatter plots of the analyzed parameters, illustrating relationships among the measured variables.
Analyzing Figure 3, Figure 4 and Figure 5, the following relationships can be observed:
  • An increase in T corresponds to an increase in cod (Figure 3; positive correlation).
  • An increase in RH corresponds to a decrease in cod (Figure 4; negative correlation).
  • An increase in VOC concentration corresponds to an increase in cod (Figure 5; positive correlation).
The observed relationships among cod, T, and RH are consistent with the findings reported by Wilson and Baieto [79] and Szulczyński et al. [80]. These authors demonstrated that an increase in T is associated with an increase in cod (relationship 1; Figure 3), which is attributed to enhanced anaerobic microbial activity. Higher temperatures, together with reduced oxygen solubility, create more favorable conditions for such processes. The cited works refer to the general literature on the relationship between T and cod, developed primarily for biological sources. In the case of refineries, the operating mechanism is volatilization. Relationship 2 (Figure 4) indicates that increasing RH may reduce cod. This effect is explained by the sorption of odorant compounds onto the surfaces of water droplets, thereby reducing their concentration in ambient air.
Relationship 3 (Figure 5), which describes higher cod associated with elevated VOC levels, is consistent with the findings by Besis et al. [81].
Table 2 summarizes the fixed-effects estimates, session-level variance components, and ICC for the three mixed-effects models.
The estimated between-session random-intercept variance was negligible for all three response variables (τ2 ≈ 0 for cod and i; τ2 = 0.0071 for VOC, ICC = 0.7%), and the boundary-corrected likelihood-ratio test did not detect a significant session-level random effect for any of the three models (p = 0.50 in each case).
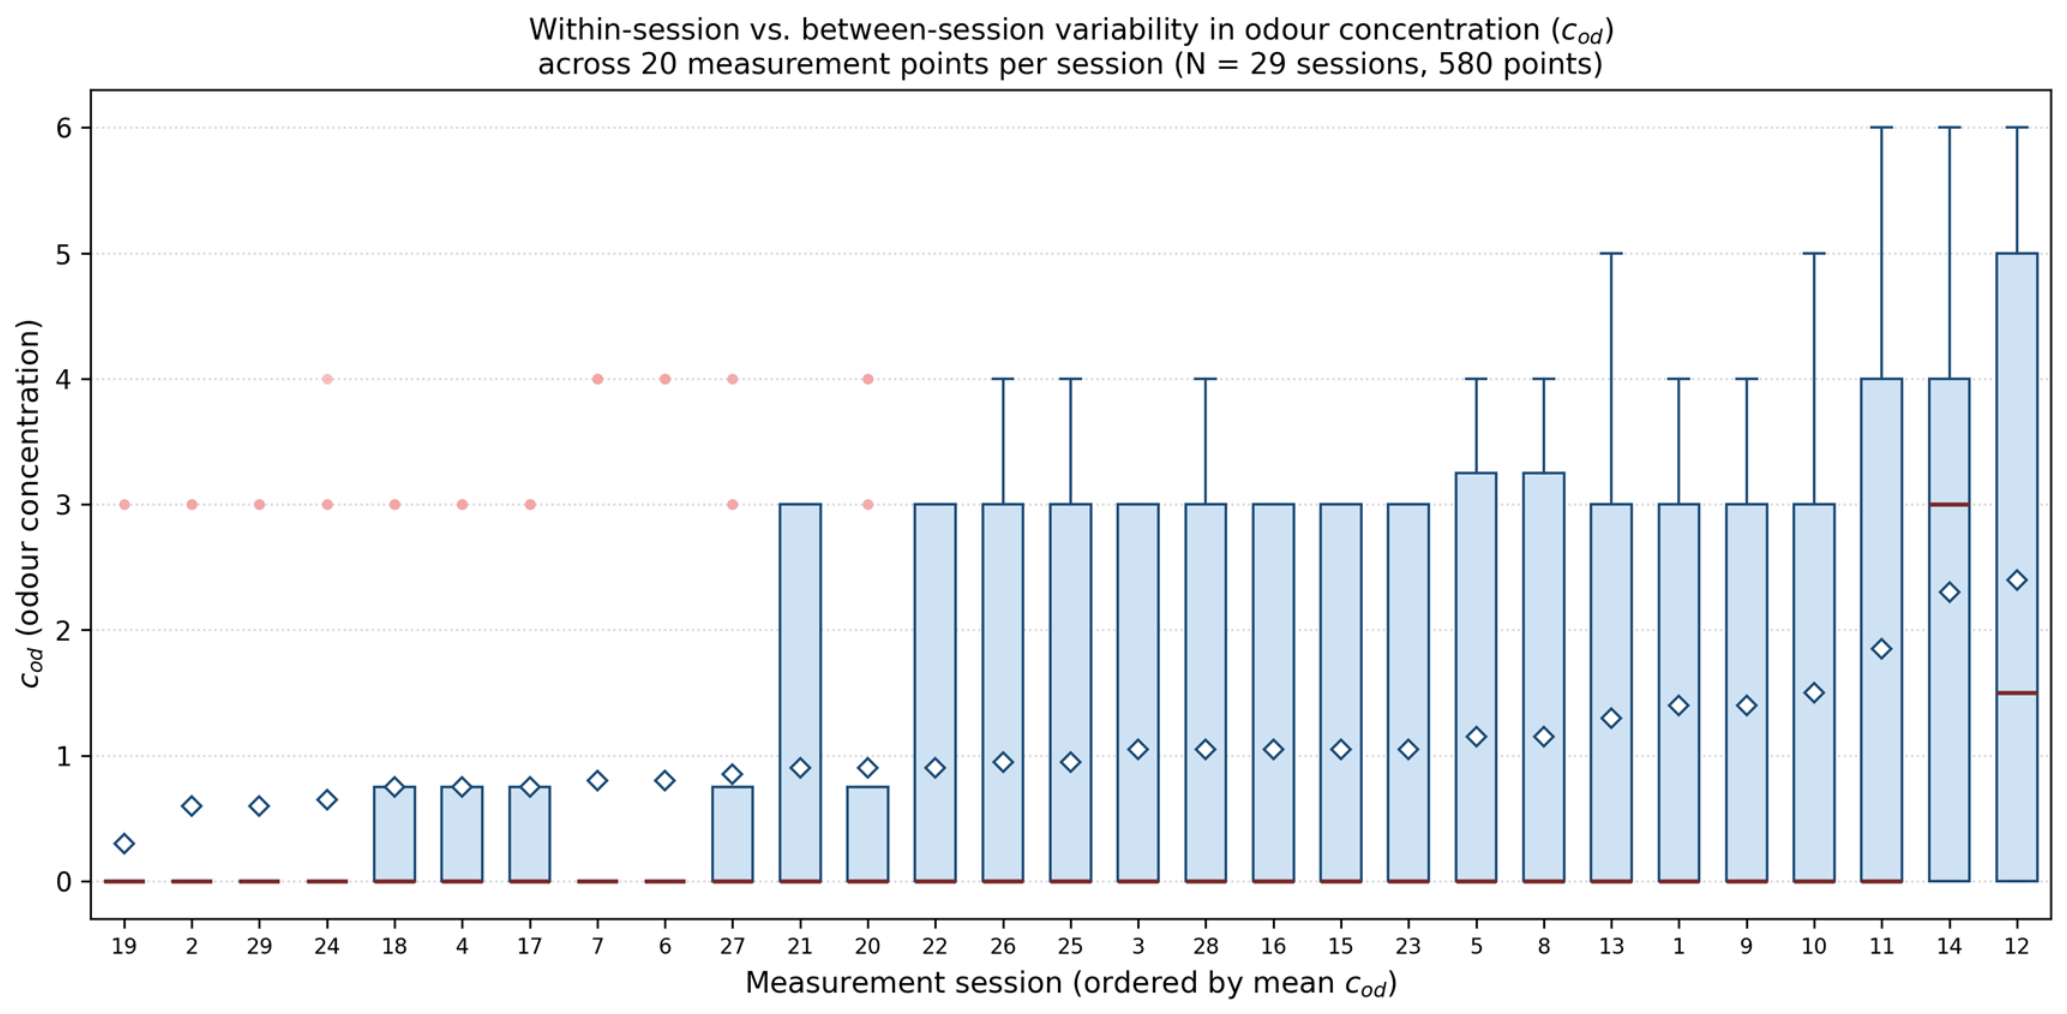
Figure 6 shows the distribution of cod values among the 20 points sampled within each session, ordered by session mean. In most sessions, the within-session spread was comparable to, or exceeded, the spread of session means across the campaign. This finding suggests that, once T, RH, v, and WD were accounted for, the residual variation in odor concentration among the points sampled within the same session was not attributable to unmeasured, session-specific factors common to all 20 points, but rather reflected point-specific spatial variability—most plausibly related to each point’s distance and bearing relative to the refinery—not captured by the present set of predictors.
Among the fixed effects, wind direction from the north (WD = N, relative to the E reference category) was associated with higher readings across all three response variables (cod: β = 1.233, p = 0.002; i: β = 0.612, p < 0.001; VOC: β = 0.044, p = 0.070), consistent with a plume-transport mechanism in which a northerly wind carries emissions from the refinery toward the monitored area. However, this pattern should be treated as a candidate driver warranting confirmation under a larger number of northerly wind episodes rather than as an established result, for reasons detailed in Section 4. “Limitations”. Air temperature was a significant positive predictor of VOC (β = 0.003, p = 0.002) and i (β = 0.017, p = 0.042), and marginally so for cod (β = 0.031, p = 0.086), in line with the expected temperature dependence of volatilization. Wind speed was marginally negatively associated with VOC (β = −0.011, p = 0.051), plausibly reflecting dilution at higher wind speeds; wind from the south (WD = S) was associated with significantly lower VOC (β = −0.066, p = 0.008) than the reference direction, though this estimate is subject to the same limitation. Relative humidity was not a significant predictor of any response.
The near-zero ICC indicates that, for the broad meteorological covariates considered here, the nested sampling design does not introduce material clustering once T, RH, v, and WD are accounted for. At the same time, the large unexplained within-session variance (σ2 = 2.69 for cod, more than double the maximum WD effect size) indicates that session-level meteorology alone explains only a limited share of the spatial pattern in odor exposure, pointing to point-specific spatial covariates. In particular, each point’s distance and angular position relative to the refinery, expressed relative to wind direction (i.e., an explicit upwind/downwind classification), are promising predictors for future models.
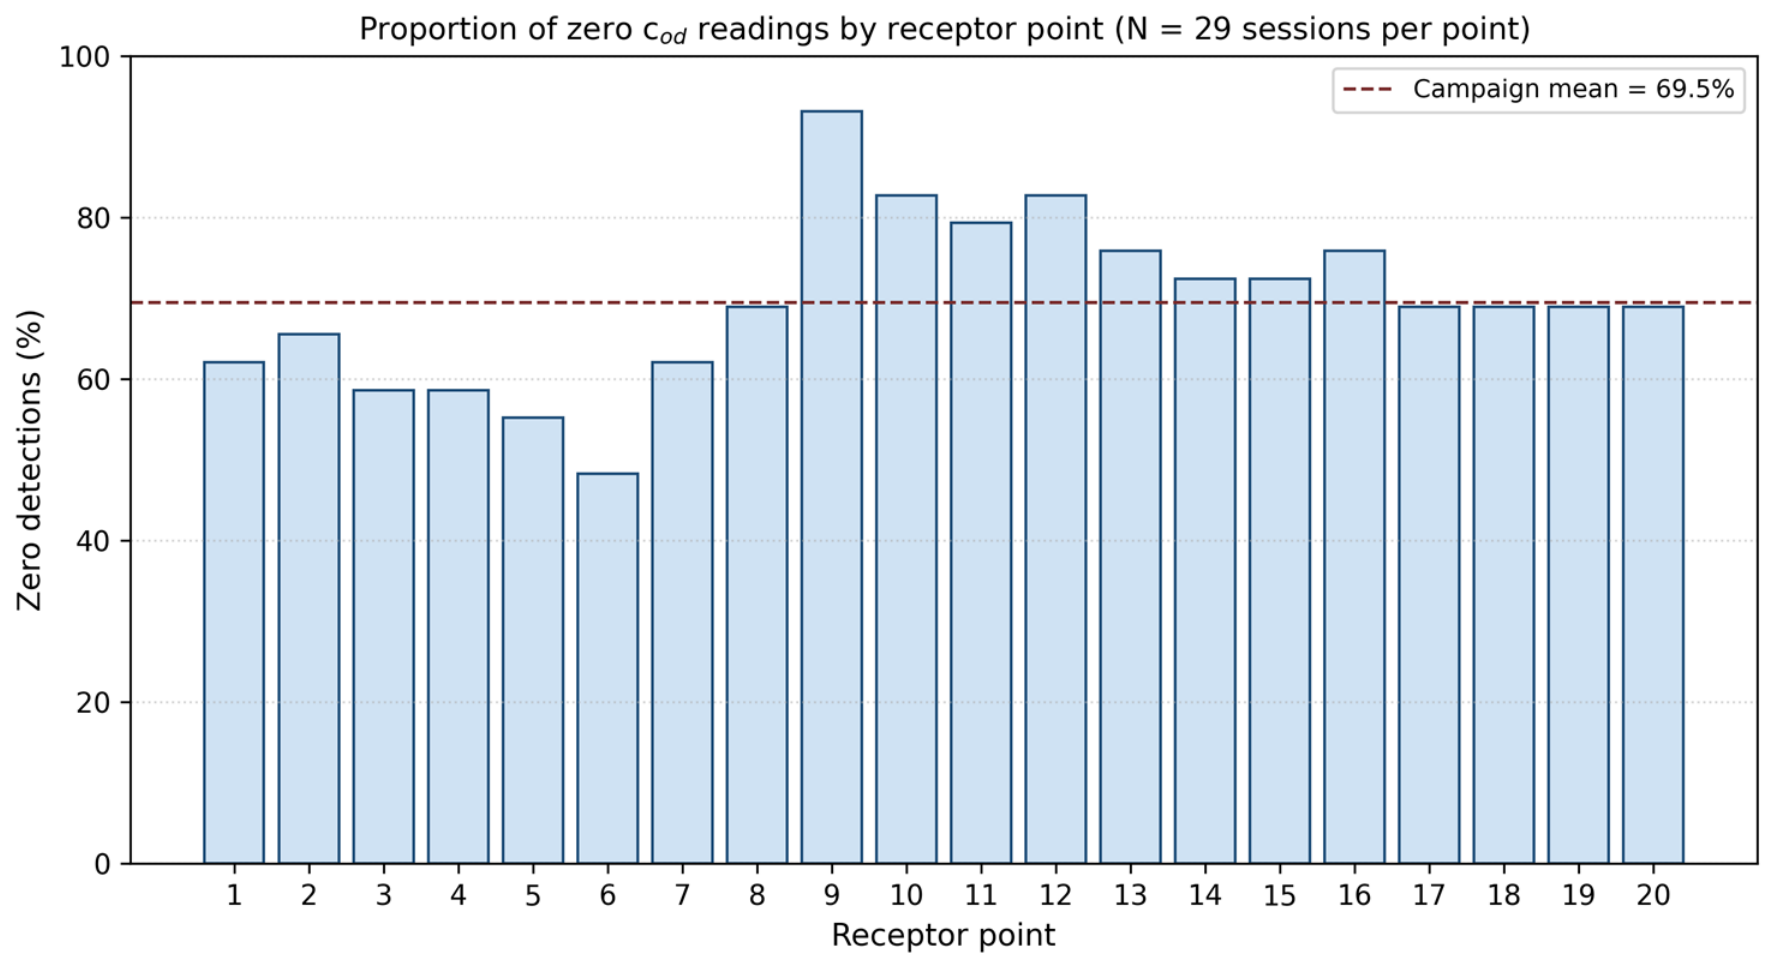
Across the full dataset, 69.5% of all point-level cod readings (403 of 580) were zero. The proportion of zero readings varied by receptor point, from 48.3% (point 6) to 93.1% (point 9), and by wind direction, from 47.5% under northerly winds to 77.5% under southerly winds (Figure 7), consistent with a plume-transport process in which zero readings predominate when the wind does not carry emissions toward the receptor grid.
Zero readings were also strongly concordant across the three response variables: conditional on cod = 0 (n = 403), VOC was also 0 in 100% of cases, and i was also 0 in 100% of cases. This near-perfect co-occurrence indicates that the zero readings across the three instruments largely reflect a single shared detection event rather than three independently obtained measurements. It is consistent with these zeros corresponding to a common instrument detection threshold. The reverse direction is not quite as clean: across all 580 point-level observations, the zero/non-zero indicators for cod and i agreed in 578 cases (99.7%), with two exceptions in which cod = 3 ou/m3 was recorded together with i = 0 (session 4, point 4, WD = W; session 15, point 8, WD = SW). In both cases, VOC was likewise very low (0.02 ppm), consistent with a borderline, near-threshold detection. Nonetheless, a non-zero instrumental odor concentration reported alongside a “no odor” intensity rating from the same field procedure is a face-validity concern for the intensity measure that we flag explicitly rather than absorb into an aggregate agreement statistic. The dataset does not include a separate flag distinguishing a confirmed absence of odor from a reading below the instrument’s limit of detection. This distinction could not be recovered post hoc and is noted as a limitation in Section 4. Limitations. Future measurement campaigns should explicitly record the detection-limit status at each receptor point to enable direct testing of this distinction.
Table 3 presents the two-part (hurdle) model fitted to cod. In Part A, the probability of a non-zero reading increased significantly with air temperature (p < 0.001). It was markedly higher under northerly winds relative to the reference direction (odds ratio ≈ 2.69, p < 0.001), with a weaker, marginal effect of north-westerly winds (p = 0.090). In Part B, restricted to the 177 non-zero observations, wind direction from the north remained a significant positive predictor of magnitude (p = 0.049), whereas temperature was no longer significant (p = 0.176)—indicating that temperature primarily affects whether odor is detected at all, rather than how strong the reading is once detected.
Notably, the intraclass correlation attributable to session was 21.1% in Part B (magnitude given detection), in clear contrast to the near-zero ICC obtained for the full, zero-inflated cod variable in the pooled continuous model. This indicates that zero inflation was masking genuine session-level clustering in the continuous LM. Once non-detections are excluded, the remaining strictly positive readings within a session are appreciably more similar to one another than to readings from other sessions. The pooled continuous model, therefore, remains an adequate description of overall cod patterns and their meteorological drivers. However, the hurdle decomposition provides a more accurate account of where nested-design dependence resides—predominantly in the magnitude of positive readings rather than in the zero/non-zero outcome.
Table 4 presents descriptive statistics for the analyzed parameters across all 29 measurement series. Mean odor concentration values exceeding 1 ou/m3 are highlighted in bold.
An analysis of Table 4 shows that the highest average VOC concentrations were recorded at measurement points 1 (0.08 ppm), 2 (0.07 ppm), and 3 (0.08 ppm), located to the southwest (SW) and west (W) of the refinery. Cod exceeding 1 ou/m3 (in bold), which in some countries, such as the United Kingdom [82], Austria [83], and Germany [30,84], are used as immission (air quality) limit values, were observed at measurement points 1–7 and 14–20. When analyzing the MultiRae Pro detector for electrochemical sensors, all measurement results were below the detection limits of 1 ppm for NH3, 0.1 ppm for H2S, and 0.1 ppm for CH3SH.
All measurement results obtained with the Drager X-pid® 9500 detector for specific VOC were below the device’s detection limit. For benzene, the detection limit equals 50 ppb. Unfortunately, due to the lack of baseline data on the expected concentrations of selected VOC at the measurement points, the results obtained could not be comprehensively evaluated or compared.
Table 5 presents the minimum, maximum and average values categorized by seasons in which the respective measurement series were conducted.
An analysis of Table 5 indicates that the highest concentrations were recorded in summer, consistent with literature reports [79,80] that higher temperatures increase odor nuisance.
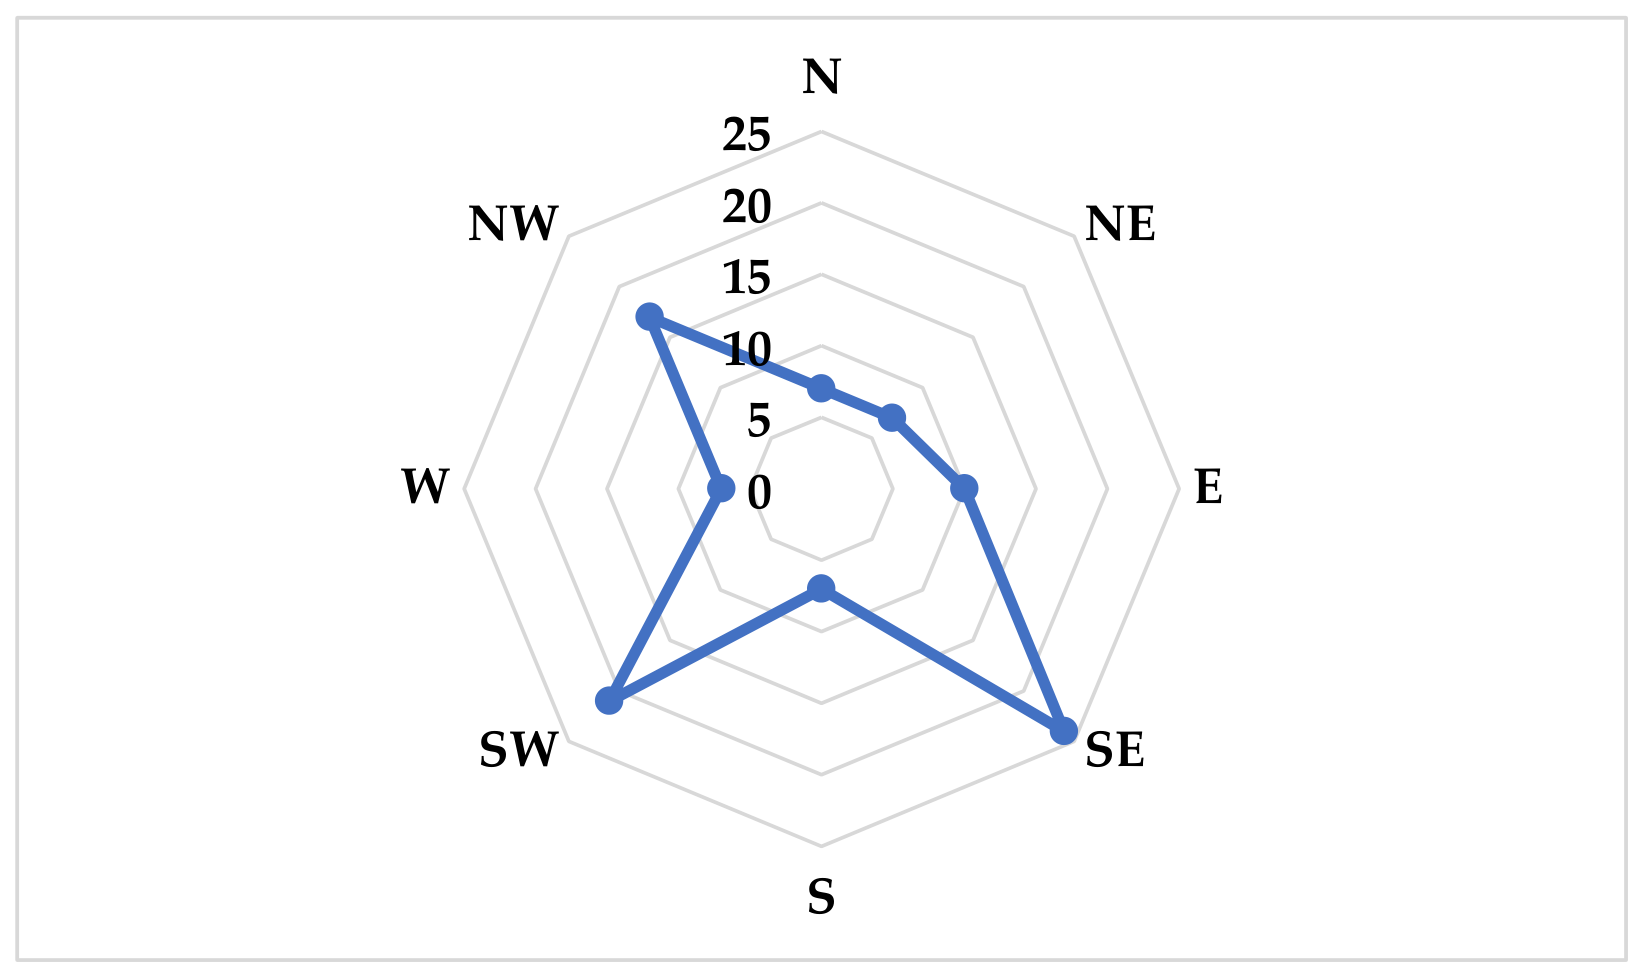
Figure 8 presents the frequency distribution of WD recorded during the entire measurement campaign.
An analysis of Figure 8 reveals that southeast (SE, 24%) and southwest (SW, 21%) winds predominated during the study period. This wind pattern reduces the risk of the refinery’s odor affecting the urban agglomeration on the opposite side of the prevailing wind. The measurement campaign was conducted primarily under convective transport conditions, which may underestimate the frequency and intensity of odor episodes experienced by residents. Meteorological data for the Mazovian Voivodeship in Poland indicate that the dominant WD in this region is westerly (W) [85]. This pattern is unfavorable for the transport of pollutants from the refinery to the urban agglomeration, thereby helping to reduce odor nuisance.
Table 6 presents the results of the Mann–Whitney U test comparing measurements obtained upwind and downwind of the refinery in relation to the analyzed urban agglomeration.
The municipal complaint records analyzed in [69] cover the period 2012–2021 and therefore predate the 2023–2024 field campaign. Consequently, they should be regarded as supporting historical evidence rather than as a direct validation of the instrumental measurements. The results clearly indicate the significant differences between the upwind and downwind measurements. The conclusions presented in [69], based on the analysis of survey results (155/788 respondents indicated the N wind direction as the one from which they most often experienced odor nuisance, while 127/788 indicated the NW direction) and the resident complaints about odor nuisance, are consistent with the instrumental studies presented in this manuscript. In all analyses, wind plays a major role in the spread of odors.
According to Naddeo et al. [86], field research methods are particularly effective for assessing odor nuisance in a given area. However, these methods are typically expensive and time-consuming. Implementing the methodology developed in this study by properly trained personnel within municipal administrative units could reduce research costs compared to those conducted by external agencies. Furthermore, this approach would shorten the time required to objectively verify complaints about the odor impact of a specific facility, while providing a solid basis for enforcing mitigation measures.
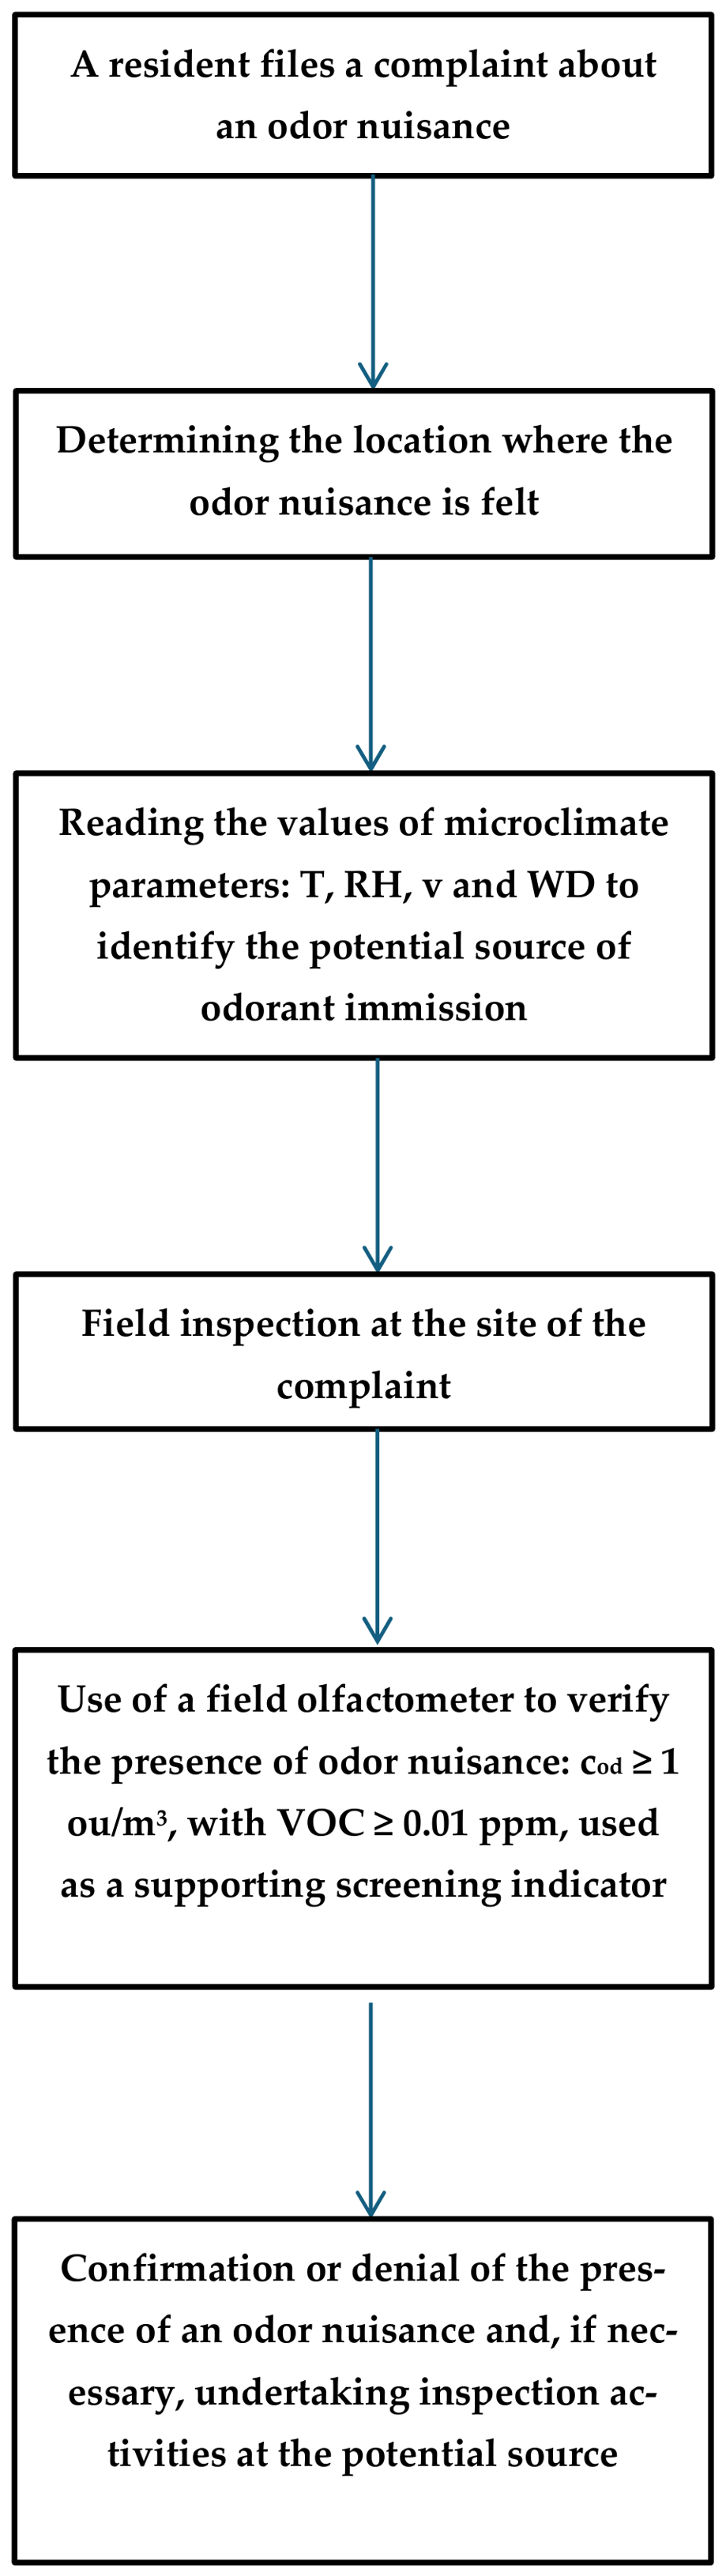
Based on the research conducted, a methodology for assessing odor nuisance in urban agglomerations using portable in situ measurement devices is proposed. The presented framework primarily addresses odor nuisance from a refinery, which was the focus of the study conducted in Płock. Therefore, validation is required for other potentially problematic facilities in different geographic locations. Nonetheless, this methodology provides a robust proof of concept for a specific site, which in turn confirms the feasibility of the approach and encourages broader future validation. A schematic representation of the methodology is illustrated in Figure 9.
The methodology outlined in Figure 9 begins by submitting an odor nuisance complaint to state administrative bodies. This initial step leads to the second stage, which focuses on identifying the specific location where the nuisance is experienced. In the third stage, designated personnel retrieve microclimatic data, specifically wind direction, from a representative meteorological station to identify the potential source of the emission. In the fourth stage, inspectors conduct an on-site investigation at the potential source of the reported odor nuisance. If the nuisance is confirmed, the fifth stage involves measuring the odor concentration (cod ≥ 1 ou/m3) and the volatile organic compound concentration (VOC ≥ 0.01 ppm), which are used as supporting screening indicators. If the sample contains a minimum of 1 ou/m3 of cod and subsequently a VOC level of 0.01 ppm, the inspectors validate the complaint in the sixth stage and initiate appropriate enforcement actions against the responsible entity. Contrarily, if the measured concentrations fall below these thresholds, the complaint is dismissed.


4. Research Limitations

During the study, the following limitations were identified:
  • Restricted physical access: Proximity to the refinery fence line was limited by dense vegetation, agricultural areas, wetlands, and restricted access signage along access roads.
  • Large spatial scale: The substantial spatial dimensions of the study area posed logistical challenges for synchronized data collection.
  • Analytical detection limits: The portable gas chromatograph’s detection and quantification limits were insufficient for trace-level ambient air quality studies in urban agglomerations. The session-clustered mixed-effects framework correctly resolves the point-level pseudo-replication identified in Section 2.1 (points nested within sessions). It cannot compensate for a separate, coarser limitation: WD, like the other meteorological covariates, was recorded only once per session. Consequently, the effective number of independent replicates for each WD category is determined by the number of sessions featuring that direction, rather than the total number of points. Across the 29 sessions, the distribution categories were uneven and, for several categories, sparse: SE = 7, SW = 6, NW = 5, E = 3, and N = S = NE = W = 2 sessions each. The WD = N effect, identified above as the strongest and most consistent predictor across (cod), VOC, and (i), therefore rests on only two independent measurement days. While the model’s standard errors are formally valid given the fitted structure, they cannot substitute for a larger number of independent northerly wind episodes. Accordingly, the WD = N effect, along with the other two-session categories (S, NE, and W), is presented as a candidate driver warranting confirmation through additional sessions under those specific wind directions, rather than as an established, generalizable finding. An additional limitation concerns the interpretation of zero readings. As noted in Section 4, two point-level observations registered a non-zero (cod) reading (3 ou/m3) alongside a zero-intensity rating (i = 0), both occurring under low VOC readings suggestive of near-threshold detection. While these two cases represent a small sample of the dataset (2 out of 580 observations), they illustrate a broader limitation. Without an instrument-level detection-limit flag, zero readings cannot be unambiguously attributed to a genuine absence of odor rather than a measurement below the limit of detection for any of the three response variables.
  • Panellist-induced variability: The reliance on single-panelist assessments introduced human sensory variability that was not explicitly accounted for [77]. A limitation of relying on a single panelist is the inability to recognize gradual, long-term drift in the absolute odor threshold, nor to calibrate intensity (e.g., due to seasonal rhinitis). Intensity calibration is possible with the assistance of a second assessor, such as a second trained person. In the present study, this approach was applied.

5. Conclusions

Based on the analysis of the research results obtained, the following conclusions were formulated:
  • Field olfactometry and portable VOC gas detectors (Multi Rae Pro and Dräger X-pid® 9500, but for individual compound determination) are appropriate tools for the rapid verification of odor complaints reported by residents in urban and surrounding areas. However, their successful implementation requires significant investment in equipment and specialized staff training. Standardizing training for personnel responsible for odor monitoring is essential to ensure objective, quantitative, and qualitative assessments of urban air quality, thereby supporting the enforcement of more effective mitigation measures.
  • The methodology proposed in this study serves as a practical framework for urban agglomerations to enhance residents’ quality of life and well-being, directly aligning with UN SDGs.
  • The portable gas detector with gas chromatography functionality used for in situ measurements is unsuitable for air quality studies and odor nuisance assessment because ambient BTEX concentrations at the study site were consistently below the device’s quantification limit for accuracy.
  • The relationship between meteorological conditions and odor concentration (cod), VOC and perceived intensity (i) was modeled using linear mixed-effects models with a random intercept for measurement session, formally accounting for the nested sampling design (20 points per session, sharing identical meteorological readings). The estimated session-level clustering was negligible for all three response variables when modelled as continuous outcomes (ICC ≈ 0–0.7%, LR test p = 0.50), and wind direction—particularly northerly winds—together with air temperature emerged as candidate predictors of elevated odor readings; because wind direction varies only at the session level and several categories (N, S, NE, W) are each represented by only two sessions, these directional effects should be regarded as provisional and warrant confirmation with additional sessions under the corresponding wind directions before being treated as established A substantial proportion of point-level readings (69.5% for cod) were zero, with near-perfect concordance across cod, VOC and i (100% conditional on cod = 0; 99.7% overall agreement, reflecting two sessions in which a non-zero cod reading coincided with a zero intensity rating), consistent with a shared instrument detection threshold rather than three independent measurements. A two-part hurdle model showed that temperature and northerly winds primarily govern whether odor is detected at all, while wind direction alone governs the magnitude of positive readings. Critically, session-level clustering re-emerged once zero-inflation was addressed explicitly (ICC = 21.1% for magnitude given detection), indicating that the nested design matters most for the strictly positive portion of the data. The substantial within-session, point-to-point variability that remains unexplained by session-level meteorology motivates the inclusion of point-specific spatial predictors (distance and bearing from the emission source, expressed relative to the wind direction). Future campaigns should record explicit detection-limit flags and prioritize a more balanced distribution of sessions across wind directions to distinguish the confirmed absence of odor from instrument non-detection.

Author Contributions

Conceptualization, M.W.; methodology, M.W.; validation, P.M., K.L.-S. and A.R.-K.; formal analysis, P.M.; investigation, P.M., K.L.-S. and A.R.-K.; resources, P.M., K.L.-S. and A.R.-K.; data curation, M.W.; writing—original draft preparation, M.W.; writing—review and editing, P.M., K.L.-S. and A.R.-K.; visualization, M.W.; supervision, P.M., K.L.-S. and A.R.-K.; project administration, M.W.; funding acquisition, M.W. All authors have read and agreed to the published version of the manuscript.

Funding

This research was funded by the National Science Centre, grant number 2021/41/N/ST10/00777.

Institutional Review Board Statement

Not applicable.

Informed Consent Statement

Not applicable.

Data Availability Statement

The data presented in this study are openly available in the repository of Warsaw University of Technology at https://doi.org/10.71724/5bt6-hj34.

Conflicts of Interest

The authors declare no conflicts of interest.

Abbreviations

The following abbreviations are used in this manuscript:
codOdor concentration
iOdor intensity
ICCIntraclass correlation coefficient
D/TDilution to threshold
GEEGeneralized estimating equations
LRLikelihood-ratio
REMLRestricted maximum likelihood
RHAir relative humidity
TAir temperature
UN SDGsUnited Nations Sustainable Development Goals
WDWind direction
vWind speed
VOCVolatile organic compounds

References

  1. Capelli, L.; Sironi, S.; Del Rosso, R.; Guillot, J.M. Measuring odours in the environment vs. dispersion modelling: A review. Atmos. Environ. 2013, 79, 731–743. [Google Scholar] [CrossRef] [Scilit]
  2. Chen, C.L.; Shu, C.M.; Fang, H.Y. Location and Characterization of Emission Sources or Airborne Volatile Organic Compounds Inside a Refinery in Taiwan. Environ. Monit. Assess. 2006, 120, 487–498. [Google Scholar] [CrossRef] [Scilit] [PubMed]
  3. Davoli, E.; Gangai, M.L.; Morselli, L.; Tonelli, D. Characterisation of odorants emissions from landfills by SPME and GC/MS. Chemosphere 2003, 51, 357–368. [Google Scholar] [CrossRef] [Scilit] [PubMed]
  4. De Santis, F.; Fino, A.; Menichelli, S.; Vazzana, C.; Allegrini, I. Monitoring the air quality around an oil refinery through the use of diffusive sampling. Anal. Bioanal. Chem. 2004, 378, 782–788. [Google Scholar] [CrossRef] [Scilit] [PubMed]
  5. Cheng, Z.; Zhu, S.; Chen, X.; Wang, L.; Lou, Z.; Feng, L. Variations and environmental impacts of odor emissions along the waste stream. J. Hazard Mater. 2020, 384, 120912. [Google Scholar] [CrossRef] [Scilit] [PubMed]
  6. Curren, J.; Hallis, S.A.; Snyder, C.L.; Suffet, I.H. Identification and quantification of nuisance odors at a trash transfer station. Waste Manag. 2016, 58, 52–61. [Google Scholar] [CrossRef] [Scilit] [PubMed]
  7. Liu, J.; Zheng, G. Emission of volatile organic compounds from a small-scale municipal solid waste transfer station: Ozone-formation potential and health risk assessment. Waste Manag. 2020, 106, 193–202. [Google Scholar] [CrossRef] [Scilit] [PubMed]
  8. Zhao, Y.; Lu, W.; Wang, H. Volatile trace compounds released from municipal solid waste at the transfer stage: Evaluation of environmental impacts and odour pollution. J. Hazard Mater. 2015, 300, 695–701. [Google Scholar] [CrossRef] [Scilit] [PubMed]
  9. Fang, W.; Huang, Y.; Ding, Y.; Qi, G.; Liu, Y.; Bi, J. Health risks of odorous compounds during the whole process of municipal solid waste collection and treatment in China. Environ. Int. 2015, 158, 106951. [Google Scholar] [CrossRef] [Scilit] [PubMed]
  10. Gonzalez, D.; Colon, J.; Sanchez, A.; Gabriel, D. A systematic study on the VOCs characterization and odour emissions in a full-scale sewage sludge composting plant. J. Hazard Mater. 2019, 373, 733–740. [Google Scholar] [CrossRef] [Scilit] [PubMed]
  11. Rincón, C.A.; De Guardia, A.; Couvert, A.; Le Roux, S.; Soutrel, I.; Daumoin, M.; Benoist, J.C. Chemical and odor characterization of gas emissions released during composting of solid wastes and digestates. J. Environ. Manag. 2019, 233, 39–53. [Google Scholar] [CrossRef] [Scilit] [PubMed]
  12. Shao, L.M.; Zhang, C.Y.; Wu, D.; Lu, F.; Li, T.S.; He, P.J. Effects of bulking agent addition on odorous compounds emissions during composting of OFMSW. Waste Manag. 2014, 34, 1381–1390. [Google Scholar] [CrossRef] [Scilit] [PubMed]
  13. Fang, J.J.; Yang, N.; Cen, D.Y.; Shao, L.M.; He, P.J. Odor compounds from different sources of landfill: Characterization and source identification. Waste Manag. 2012, 32, 1401–1410. [Google Scholar] [CrossRef] [Scilit] [PubMed]
  14. Lim, J.-H.; Cha, J.-S.; Kong, B.-J.; Baek, S.-H. Characterization of odorous gases at landfill site and in surrounding areas. J. Environ. Manag. 2018, 206, 291–303. [Google Scholar] [CrossRef] [Scilit] [PubMed]
  15. Wang, Y.; Li, L.; Qiu, Z.; Yang, K.; Han, Y.; Chai, F.; Li, P.; Wang, Y. Trace volatile compounds in the air of domestic waste landfill site: Identification, olfactory effect and cancer risk. Chemosphere 2021, 272, 129582. [Google Scholar] [CrossRef] [Scilit] [PubMed]
  16. Orzi, V.; Cadena, E.; D’Imporzano, G.; Artola, A.; Davoli, E.; Crivelli, M.; Adani, F. Potential odour emission measurement in organic fraction of municipal solid waste during anaerobic digestion: Relationship with process and biological stability parameters. Bioresour. Technol. 2010, 101, 7330–7337. [Google Scholar] [CrossRef] [Scilit] [PubMed]
  17. Qamaruz-Zaman, N.; Milke, M.W. VFA and ammonia from residential food waste as indicators of odor potential. Waste Manag. 2012, 32, 2426–2430. [Google Scholar] [CrossRef] [Scilit] [PubMed]
  18. Asadi, M.; McPhedran, K. Estimation of greenhouse gas and odour emissions from a cold region municipal biological nutrient removal wastewater treatment plant. J. Environ. Manag. 2021, 281, 111864. [Google Scholar] [CrossRef] [Scilit] [PubMed]
  19. Fan, F.Q.; Xu, R.H.; Wang, D.P.; Meng, F.G. Application of activated sludge for odor control in wastewater treatment plants: Approaches, advances and outlooks. Water Res. 2020, 181, 115915. [Google Scholar] [CrossRef] [Scilit] [PubMed]
  20. Frechen, F.-B.; Stuetz, R. Odours in Wastewater Treatment: Measurement, Modelling, and Control; IWA Publishing: London, UK, 2001. [Google Scholar]
  21. Jiang, G.M.; Melder, D.; Keller, J.; Yuan, Z.G. Odor emissions from domestic wastewater: A review. Crit. Rev. Environ. Sci. Technol. 2017, 47, 1581–1611. [Google Scholar] [CrossRef] [Scilit]
  22. Lewkowska, P.; Cieslik, B.; Dymerski, T.; Konieczka, P.; Namiesnik, J. Characteristics of odors emitted from municipal wastewater treatment plant and methods for their identification and deodorization techniques. Environ. Res. 2016, 151, 573–586. [Google Scholar] [CrossRef] [Scilit] [PubMed]
  23. Vitko, T.G.; Cowden, S.; Suffet, I.H. Evaluation of bioscrubber and biofilter technologies treating wastewater foul air by a new approach of using odor character, odor intensity, and chemical analyses. Water Res. 2022, 220, 118691. [Google Scholar] [CrossRef] [Scilit] [PubMed]
  24. Jaramillo-Perez, J.M.; Macias-Hernández, B.A.; Tello-Leal, E. A dataset of volatile organic compounds (VOCs) concentrations collected near a petroleum refinery area. Data Brief 2025, 61, 111900. [Google Scholar] [CrossRef] [Scilit] [PubMed]
  25. Chen, L.Y.; Jeng, P.T.; Chang, M.W.; Yen, S.H. Rationalization of an odor monitoring system: A case study of Lin-Yuan Petrochemical Park. Environ. Sci. Technol. 2000, 34, 1166–1173. [Google Scholar] [CrossRef] [Scilit]
  26. Jia, H.; Gao, S.; Duan, Y.; Fu, Q.; Che, X.; Xu, H.; Wang, Z.; Cheng, J. Investigation of health risk assessment and odor pollution of volatile organic compounds from industrial activities in the Yangtze River Delta region, China. Ecotoxicol. Environ. Saf. 2021, 208, 111474. [Google Scholar] [CrossRef] [Scilit] [PubMed]
  27. Navarrete-Aliaga, O.; Muriach, M.; Delgado-Saborit, J.M. Toxicological Effects of Air Pollutants on Human Airway Cell Models Using Air–liquid Interface Systems: A Systematic Review. Curr. Environ. Health Rep. 2025, 12, 26. [Google Scholar] [CrossRef] [Scilit] [PubMed]
  28. Sówka, I.; Skrętowicz, M.; Sobczyński, P.; Zwoździak, J. Estimating odour impact range of a selected wastewater treatment plant for winter and summer seasons in Polish conditions using CALPUFF model. Int. J. Environ. Pollut. 2014, 54, 242–250. [Google Scholar] [CrossRef] [Scilit]
  29. Ying, D.; Chuanyu, C.; Bin, H.; Yueen, X.; Xuejuan, Z.; Yingxu, C.; Weixiang, W. Characterization and control of odorous gases at a landfill site: A case study in Hangzhou, China. Waste Manag. 2012, 32, 317–326. [Google Scholar] [CrossRef] [Scilit] [PubMed]
  30. Bokowa, A.; Diaz, C.; Koziel, J.A.; McGinley, M.; Barclay, J.; Schauberger, G.; Guillot, J.-M.; Sneath, R.; Capelli, L.; Zorich, V.; et al. Summary and overview of the odour regulations worldwide. Atmosphere 2021, 12, 206. [Google Scholar] [CrossRef] [Scilit]
  31. Hayes, J.E.; Stevenson, R.J.; Stuetz, R.M. The impact of malodour on communities: A review of assessment techniques. Sci. Total Environ. 2014, 500–501, 395–407. [Google Scholar] [CrossRef] [Scilit] [PubMed]
  32. Aatamila, M.; Verkasalo, P.K.; Korhonen, M.J.; Suominen, A.L.; Hirvonen, M.R.; Viluksela, M.K.; Nevalainen, A. Odour annoyance and physical symptoms among residents living nearwaste treatment centres. Environ. Res. 2011, 111, 164–170. [Google Scholar] [CrossRef] [Scilit] [PubMed]
  33. Boers, D.; Geelen, L.; Erbrink, H.; Smit, L.A.M.; Heederik, D.; Hooiveld, M.; Yzermans, C.J.; Huijbregts, M.; Wouters, I.M. The relation between modeled odor exposure from livestock farming and odor annoyance among neighboring residents. Int. Arch. Occup. Environ. Health 2016, 89, 521–530. [Google Scholar] [CrossRef] [Scilit] [PubMed]
  34. Capelli, L.; Sironi, S.; Del Rosso, R.; Céntola, P.; Rossi, A.; Austeri, C. Olfactometric approach for the evaluation of citizens’ exposure to industrial emissions in the city of Terni, Italy. Sci. Total Environ. 2011, 409, 595–603. [Google Scholar] [CrossRef] [Scilit] [PubMed]
  35. United Nations. Transforming Our World: The 2030 Agenda for Sustainable Development; Resolution Adopted by the General Assembly on 25 September 2015; United Nations: New York, NY, USA, 2015. [Google Scholar]
  36. Lee, H.-D.; Jeon, S.-B.; Choi, W.-J.; Lee, S.-S.; Lee, M.-H.; Oh, K.-J. A novel assessment of odor sources using instrumental analysis combined with resident monitoring records for an industrial area in Korea. Atmos. Environ. 2013, 74, 277–290. [Google Scholar] [CrossRef] [Scilit]
  37. Palmiotto, M.; Fattore, E.; Paiano, V.; Celeste, G.; Colombo, A.; Davoli, E. Influence of a municipal solid waste landfill in the surrounding environment: Toxicological risk and odor nuisance effects. Environ. Int. 2014, 68, 16–24. [Google Scholar] [CrossRef] [Scilit] [PubMed]
  38. Schiffman, S.S.; Williams, C.M. Science of Odor as a Potential Health Issue. J. Environ. Qual. 2005, 34, 129–138. [Google Scholar] [CrossRef] [Scilit]
  39. Pottier, B.; Artigue, V.; Tixier, J.; Olivier, S.; Chaignaud, M.; Fanlo, J.-L. Odour Nuisance: A New Methodology to Evaluate and Anticipate the Risk. Chem. Eng. Trans. 2022, 95, 43–48. [Google Scholar]
  40. Kim, K.-H.; Park, S.-Y. A comparative analysis of malodor samples between direct (olfactometry) and indirect (instrumental) methods. Atmos. Environ. 2008, 42, 5061–5070. [Google Scholar] [CrossRef] [Scilit]
  41. Kulig, A.; Szyłak-Szydłowski, M.; Wiśniewska, M. Application of Chemical Sensors and Olfactometry Method in Ecological Audits of Degraded Areas. Sensors 2021, 21, 6190. [Google Scholar] [CrossRef] [Scilit] [PubMed]
  42. Feng, Y.X.; Peng, J.C.; Guo, Y.R.; Li, Q.R.; Xiau, A.S.; Dong, R.; Ding, D.W.; Li, M.J. Identification and evaluation of odor emissions from a petrochemical production area in China. Atmos. Pollut. Res. 2026, 17, 102818. [Google Scholar] [CrossRef] [Scilit]
  43. Wang, Y.; Shao, L.; Kang, X.; Zhang, H.; Lü, F.; He, P. A critical review on odor measurement and prediction. J. Environ. Manag. 2023, 336, 117651. [Google Scholar] [CrossRef] [Scilit] [PubMed]
  44. Brancher, M.; Griffiths, K.D.; Franco, D.; Lisboa, H.D.M. A review of odour impact criteria in selected countries around the world. Chemosphere 2017, 168, 1531–1570. [Google Scholar] [CrossRef] [Scilit] [PubMed]
  45. Drew, G.H.; Gerard, S.R.; Burge, V.C.; Lowe, M.; Kinnersley, R.; Sneath, R.; Longhurst, P.J. Appropriateness of selecting different averaging times for modelling chronic and acute exposure to environmental odours. Atmos. Environ. 2007, 41, 2870–2880. [Google Scholar] [CrossRef] [Scilit]
  46. Daskalopoulos, E.; Badr, O.; Probert, S.D. Economic and environmental evaluations of waste treatment and disposal technologies for municipal solid waste. Appl. Energy 1997, 58, 209–255. [Google Scholar] [CrossRef] [Scilit]
  47. Meišutovič-Akhtarieva, M.; Marčiulaitienė, E. Research on odours emitted from non- hazardous waste landfill using dynamic olfactometry. In Proceedings of the “Environmental Engineering” 10th International Conference, Vilnius, Lithuania, 27–28 April 2017. [Google Scholar] [CrossRef] [Scilit]
  48. Wiśniewska, M. Methods of assessing odour emissions from biogas plants processing municipal waste. J. Ecol. Eng. 2020, 21, 140–147. [Google Scholar] [CrossRef] [Scilit] [PubMed]
  49. Grzelka, A.; Sówka, I.; Miller, U. Methods for assessing the odor emissions from livestock farming facilities. J. Ecol. Eng. 2018, 2, 56–64. [Google Scholar] [CrossRef] [Scilit] [PubMed]
  50. Capelli, L.; Sironi, S.; Del Rosso, R. Electronic Noses for Environmental Monitoring Applications. Sensors 2014, 14, 19979–20007. [Google Scholar] [CrossRef] [Scilit] [PubMed]
  51. Szulczyński, B.; Gębicki, J. Electronic nose—An instrument for odour nuisances monitoring. E3S Web Conf. 2019, 100, 00079. [Google Scholar] [CrossRef] [Scilit]
  52. Nakamoto, T.; Sumitimo, E. Study of robust odor sensing system with auto-sensitivity control. Sens. Actuators B Chem. 2003, 89, 285–291. [Google Scholar] [CrossRef] [Scilit]
  53. Muñoz, R.; Sivret, E.; Parcsi, G.; Lebrero, R.; Wang, X.; Suffet, I.H.; Stuetz, R. Monitoring techniques for odour abatement assessment. Water Res. 2010, 44, 5129–5149. [Google Scholar] [CrossRef] [Scilit] [PubMed]
  54. Szyłak-Szydłowski, M. Comparison of Two Types of Field Olfactometers for Assessing Odours in Laboratory and Field Tests. Chem. Eng. Trans. 2014, 14, 67–72. [Google Scholar] [CrossRef] [Scilit]
  55. Badach, J.; Kolasińska, P.; Paciorek, M.; Wojnowski, W.; Dymerski, T.; Gębicki, J.; Dymnicka, M.; Namieśnik, J. A case study of odour nuisance evaluation in the context of integrated urban planning. J. Environ. Manag. 2018, 213, 417–424. [Google Scholar] [CrossRef] [Scilit] [PubMed]
  56. Hawko, C.; Verriele, M.; Crunaire, S.; Leger, C.; Locoge, N.; Savary, G. A review of environmental odor quantification and qualification methods: The question of objectivity in sensory analysis. Sci. Total Environ. 2021, 795, 148862. [Google Scholar] [CrossRef] [Scilit] [PubMed]
  57. Conti, C.; Guarino, M.; Bacenetti, J. Measurements techniques and models to assess odor annoyance: A review. Environ. Int. 2020, 134, 105261. [Google Scholar] [CrossRef] [Scilit] [PubMed]
  58. Rincón, C.A.; De Guardia, A.; Couvert, A.; Wolbert, D.; Le Roux, S.; Soutrel, I.; Nunes, G. Odor concentration (OC) prediction based on odor activity values (OAVs) during composting of solid wastes and digestates. Atmos. Environ. 2019, 201, 1–12. [Google Scholar] [CrossRef] [Scilit]
  59. Wiśniewska, M.; Kulig, A.; Lelicińska-Serafin, K. The Use of Chemical Sensors to Monitor Odour Emissions at Municipal Waste Biogas Plants. Appl. Sci. 2021, 11, 3916. [Google Scholar] [CrossRef] [Scilit]
  60. Capelli, L.; Sironi, S.; Del Rosso, R.; Céntola, P.; Grande, M.I. A comparative and critical evaluation of odour assessment methods on a landfill site. Atmos. Environ. 2008, 42, 7050–7058. [Google Scholar] [CrossRef] [Scilit]
  61. Bax, C.; Sironi, S.; Capelli, L. How can odors be measured? An overview of methods and their applications. Atmosphere 2020, 11, 92. [Google Scholar] [CrossRef] [Scilit]
  62. Fang, J.; Zhang, H.; Yang, N.; Shao, L.; He, P. Gaseous pollutants emitted from a mechanical biological treatment plant for municipal solid waste: Odor assessment and photochemical reactivity. J. Air Waste Manag. Assoc. 2013, 63, 1287–1297. [Google Scholar] [CrossRef] [Scilit] [PubMed]
  63. Schiavon, M.; Martini, L.M.; Corrà, C.; Scapinello, M.; Coller, G.; Tosi, P.; Ragazzi, M. Characterisation of volatile organic compounds (VOCs) released by the composting of different waste matrices. Environ. Pollut. 2017, 231, 845–853. [Google Scholar] [CrossRef] [Scilit] [PubMed]
  64. Wiśniewska, M.; Kulig, A.; Lelicińska-Serafin, K. Olfactometric testing as a method for assessing odour nuisance of biogas plants processing municipal waste. Arch. Environ. Prot. 2020, 46, 60–68. [Google Scholar] [CrossRef] [Scilit]
  65. Zhu, Y.-L.; Zheng, G.-D.; Gao, D.; Chen, T.-B.; Wu, F.-K.; Niu, M.-J.; Zou, K.-H. Odor composition analysis and odor indicator selection during sewage sludge composting. J. Air Waste Manag. Assoc. 2016, 66, 930–940. [Google Scholar] [CrossRef] [Scilit] [PubMed]
  66. Laor, Y.; Parker, D.; Pagé, T. Measurement, prediction, and monitoring of odors in the environment: A critical review. Rev. Chem. Eng. 2014, 30, 139–166. [Google Scholar] [CrossRef] [Scilit]
  67. Wiśniewska, M.; Kulig, A.; Lelicińska-Serafin, K. The importance of the microclimatic conditions inside and outside of plant buildings in odorants emission at municipal waste biogas installations. Energies 2020, 13, 6463. [Google Scholar] [CrossRef] [Scilit]
  68. Gostelow, P.; Parsons, S.; Stuetz, R. Odour measurements for sewage treatment works. Water Res. 2001, 35, 579–597. [Google Scholar] [CrossRef] [Scilit] [PubMed]
  69. Wiśniewska, M.; Szyłak-Szydłowski, M. The Impact of Objects with a Potential Odour Nuisance on the Life Comfort of the Urban Agglomeration Inhabitants. Appl. Sci. 2024, 14, 10708. [Google Scholar] [CrossRef] [Scilit]
  70. Wiśniewska, M.; Kulig, A.; Lelicińska-Serafin, K. Odour Emissions of Municipal Waste Biogas Plants—Impact of Technological Factors, Air Temperature and Humidity. Appl. Sci. 2020, 10, 1093. [Google Scholar] [CrossRef] [Scilit]
  71. EN 13725-2003; Air Quality. Determination of Odour Concentration by Dynamic Olfactometry. European Committee for Standardization: Brussels, Belgium, 2003.
  72. ISO 4120:2004; Sensory Analysis—Methodology—Triangle Test. International Organization for Standardization: Geneva, Switzerland, 2004.
  73. Bontempelli, G.; Comisso, N.; Toniolo, R.; Schiavon, G. Electroanalytical sensors for nonconducting media based on electrodes supported on perfluorinated ion-exchange membranes. Electroanalysis 1997, 9, 433–443. [Google Scholar] [CrossRef] [Scilit]
  74. Cao, Z.; Buttner, W.J.; Stetter, J.R. The properties and applications of amperometric gas sensors. Electroanalysis 1992, 4, 253–266. [Google Scholar] [CrossRef] [Scilit]
  75. Szulczyński, B.; Gębicki, J. Currently commercially available chemical sensors employed for detection of volatile organic compounds in outdoor and indoor air. Environments 2017, 4, 21. [Google Scholar] [CrossRef] [Scilit]
  76. Rezende, G.C.; Le Calvé, S.; Brandner, J.J.; Newport, D. Micro photoionization detectors. Sens. Actuators B Chem. 2019, 287, 86–94. [Google Scholar] [CrossRef] [Scilit]
  77. Verein Deutscher Ingenieure. VDI 3940 Part 2: Measurement of Odour Impact by Field Inspection—Measurement of the Impact Frequency of Recognizable Odours Plume Measurement; VDI-Verlag GmbH: Düsseldorf, Germany, 2006. [Google Scholar]
  78. Wysocka, I.; Dębowski, M. Advantages and Limitations of Measurement Methods for Assessing Odour Nuisance in Air—A Comparative Review. Appl. Sci. 2025, 15, 5622. [Google Scholar] [CrossRef] [Scilit]
  79. Wilson, A.D.; Baietto, M. Applications and Advances in Electronic-Nose Technologies. Sensors 2009, 9, 5099–5148. [Google Scholar] [CrossRef] [Scilit] [PubMed]
  80. Szulczyński, B.; Dymerski, T.; Gębicki, J.; Namieśnik, J. Instrumental measurement of odour nuisance in city agglomeration using electronic nose. E3S Web Conf. 2018, 28, 01012. [Google Scholar] [CrossRef] [Scilit]
  81. Besis, A.; Latsios, I.; Papakosta, E.; Simeonidis, T.; Kouras, A.; Voliotis, A.; Samara, C. Spatiotemporal variation of odor-active VOCs in Thessaloniki, Greece: Implications for impacts from industrial activities. Environ. Sci. Pollut. Res. 2021, 28, 59091–59104. [Google Scholar] [CrossRef] [Scilit] [PubMed]
  82. DEFRA UK 2010, Ref: PB13554. Odour Guidance for Local Authorities. Available online: https://www.gov.uk/government/uploads/system/uploads/attachment_data/file/69305/pb13554-local-auth-guidance-100326.pdf (accessed on 1 April 2025).
  83. ÖAW. Umweltwissenschaftliche Grundlagen und Zielsetzungen im Rahmen des Nationalen Umweltplans für die Bereiche Klima, Luft, Geruch und Lärm; Kommissionfür Reinhaltung der Luft der Österreichische Akademie der Wissenschaften, Ed.; Schriftenreihe der Sektion I. Band, 17; Bundesministeriums für Umwelt, Jugend und Familie: Vienna, Austria, 1994; Volume 17. [Google Scholar]
  84. Federal Immission Control Act (Act on the Prevention of Harmful Effects on the Environment Caused by Air Pollution, Noise, Vibration and Similar Phenomena). Federal Ministry for Environment, Nature Conservation and Reactor Safety BImSchG. 2015. Available online: https://www.gesetze-im-internet.de/bimschg/ (accessed on 12 April 2024).
  85. Masovian Voivodeship Assembly. Appendix No. 1 to Resolution No. 134/23 of the Masovian Voivodeship Assembly of 11 July 2023. General Information on the Location and Topography of the Masovian Zone and the Płock City Zone. Available online: https://mazovia.pl/pl/bip/sejmik/uchwaly-sejmiku/rejestr-uchwal-sejmiku/uchwala-13423-sejmiku-wojewodztwa-mazowieckiego-z-dnia-2023-07-11.html (accessed on 12 April 2024).
  86. Naddeo, V.; Belgiorno, V.; Zarra, T. Odour Characterization and Exposure Effects. In Odour Impact Assessment Handbook; John Wiley & Sons, Inc.: New York, NY, USA, 2012. [Google Scholar] [CrossRef] [Scilit]
Figure 1. Location of measurement points around the refinery.
Sustainability 18 08464 g001
Figure 2. Refinery location in relation to urban agglomeration.
Sustainability 18 08464 g002
Figure 3. Scatter plot of cod, ou/m3 and T, °C.
Sustainability 18 08464 g003
Figure 4. Scatter plot of cod, ou/m3 and RH, %.
Sustainability 18 08464 g004
Figure 5. Scatter plot of cod, ou/m3 and VOC, ppm.
Sustainability 18 08464 g005
Figure 6. Distribution of odor concentration (cod) across the 20 measurement points within each of the 29 sessions, ordered by session mean. Diamonds mark session means; the red line marks session medians. The within-session spread is comparable to or larger than the between-session spread, consistent with the near-zero estimated ICC reported above.
Sustainability 18 08464 g006
Figure 7. Proportion of zero cod readings by receptor point, pooled across the 29 measurement sessions (n = 29 per point). The dashed line marks the campaign-wide mean (69.5%).
Sustainability 18 08464 g007
Figure 8. The wind rose for the entire measurement campaign.
Sustainability 18 08464 g008
Figure 9. A proposed methodology for assessing odor nuisance in urban agglomerations using portable in situ measurement devices.
Sustainability 18 08464 g009
Table 1. Odor characteristics of facilities typical of urban agglomerations.
Odor SourceCharacteristic OdorantsReferences
Waste transfer stationSulphur compound, NH3, VOC, aromatics, terpenes, halogenated compounds, alkane, alkene[5,6,7,8]
Composting plantSulphur compounds, nitrogen compounds, VOC, aromatics, terpenes, halogenated compounds, alkane, alkene[9,10,11,12]
LandfillSulphur compounds, nitrogen compounds, VOC, aromatics, terpenes, halogenated compounds, alkane, alkene[13,14,15]
Anaerobic digestion plantSulphur compounds, nitrogen compounds, VOC, aromatics, terpenes[16,17]
Wastewater treatment plantSulphur compounds, nitrogen compounds, VOC, aromatics, halogenated compounds, alkane, alkene[18,19,20,21,22,23]
Petrochemical plantSulphur compounds, VOC, aromatics, halogenated compounds, alkane, alkene[24,25,26]
Table 2. Fixed-effects estimates (coefficient (SE)) and variance components from linear mixed-effects models of cod, VOC and i, with T, RH, v and WD (ref. = E) as fixed effects and a random intercept for measurement session.
PredictorcodVOCi
Intercept−0.006 (0.795)0.024 (0.050)0.053 (0.365)
T (°C)0.031 (0.018) †0.003 (0.001) **0.017 (0.008) *
RH (%)0.008 (0.008)0.000 (0.000)0.003 (0.004)
v (m/s)0.007 (0.091)−0.011 (0.006) †−0.032 (0.042)
WD: N (vs. E)1.233 (0.392) **0.044 (0.024) †0.612 (0.180) ***
WD: S (vs. E)−0.269 (0.399)−0.066 (0.025) **−0.187 (0.183)
WD: other levels (NE, NW, SE, SW, W)n.s.n.s.n.s.
Random-effect variance, session (τ2)≈00.0071≈0
Residual variance (σ2)2.6900.00910.568
ICC≈0.0000.007≈0.000
LR test vs. pooled model (session RE)p = 0.50 (n.s.)p = 0.50 (n.s.)p = 0.50 (n.s.)
p < 0.10, * p < 0.05, ** p < 0.01, *** p < 0.001, n.s.—not significant.
Table 3. Two-part (hurdle) model for cod: probability of detection (Part A, logistic GEE with session clustering) and magnitude conditional on detection (Part B, linear mixed-effects model, n = 177 non-zero observations). † p < 0.10, * p < 0.05, *** p < 0.001, n.s.—not significant.
PredictorPart A: P(Detection) (Logistic GEE)Part B: Magnitude|Detected (LMM, n = 177)
Intercept−2.070 (0.578) ***3.146 (0.861) ***
T (°C)0.028 (0.008) ***0.026 (0.019)
RH (%)0.009 (0.006)0.000 (0.008)
v (m/s)0.080 (0.064)−0.138 (0.098)
WD: N (vs. E)0.988 (0.232) ***0.785 (0.399) *
WD: NW (vs. E)0.292 (0.172) †0.344 (0.320)
WD: other levels (NE, S, SE, SW, W)n.s.n.s.
Random-effect structureSession (exchangeable, GEE)Session (random intercept)
ICC/within-cluster correlation-0.211
Table 4. Descriptive statistics VOC, i, and cod.
Measurement PointGeographical Direction Relative to the RefineryParameterAverageMinimumMaximumStandard Deviation
1SWVOC, ppm0.0800.670.1565
i, -0.55030.8275
cod, ou/m31.31051.7547
2WVOC, ppm0.0700.770.1576
i, -0.52030.8290
cod, ou/m31.21051.7399
3NWVOC, ppm0.0800.750.1565
i, -0.69030.9675
cod, ou/m31.45041.7846
4NWVOC, ppm0.0500.320.0964
i, -0.55020.7831
cod, ou/m31.41041.7427
5NWVOC, ppm0.0500.280.0909
i, -0.62020.7752
cod, ou/m31.52041.7448
6NWVOC, ppm0.0600.260.0895
i, -0.72020.7972
cod, ou/m31.76041.7659
7NVOC, ppm0.0200.20.0428
i, -0.41020.5680
cod, ou/m31.17041.5369
8NVOC, ppm0.0100.20.0407
i, -0.31020.5414
cod, ou/m30.97041.4756
9NEVOC, ppm0.0000.030.0058
i, -0.07010.2579
cod, ou/m30.21030.7736
10NEVOC, ppm0.0000.030.0081
i, -0.17010.3844
cod, ou/m30.52031.1533
11 *NEVOC, ppm0.0100.090.0170
i, -0.21010.4123
cod, ou/m30.62031.2368
12 *EVOC, ppm0.0100.10.0188
i, -0.17010.3844
cod, ou/m30.52031.1533
13 *EVOC, ppm0.0400.320.0893
i, -0.41030.8245
cod, ou/m30.90051.6550
14 *SEVOC, ppm0.0600.450.1278
i, -0.55031.0207
cod, ou/m31.14061.9589
15 *SEVOC, ppm0.0600.420.1305
i,-0.59031.0528
cod, ou/m31.21062.0767
16 *SVOC, ppm0.0600.480.1258
i, -0.52030.9864
cod, ou/m31.03061.9177
17 *SVOC, ppm0.0600.410.1158
i, -0.52030.9110
cod, ou/m31.21061.9526
18 *SWVOC, ppm0.0500.40.1056
i, -0.48030.8290
cod, ou/m31.10051.7185
19 *SWVOC, ppm0.0500.430.1064
i, -0.52030.9111
cod, ou/m31.17061.8721
20 *SWVOC, ppm0.0500.30.0917
i0.45030.7831
cod, ou/m31.07051.6676
*—measurement points located on the side of the analyzed urban agglomeration.
Table 5. Characteristics of cod and VOC by season.
ParameterSeasonSpringSummerAutumnWinter
VOC, ppmminimum0000
maximum0.340.770.10.25
average0.0410.140.010.018
cod, ou/m3minimum0000
maximum5634
average1211
Table 6. Mann–Whitney U test results for i, VOC, and cod on the upwind and downwind sides.
ParameteriVOCcod
UpwindDownwindUpwindDownwindUpwindDownwind
Sample average0.1272731.4285710.007863640.1585710.3545451.428571
Sample size220702207022070
Sample SD0.3727991.0977110.03224450.1499210.9985041.996322
Median0100.1303
Skewness3.0173290.08562945.1072820.4779842.51788−0.425269
Skewness shapeAsymmetrical, right/positive (pval = 0)Symmetrical (pval = 0.765)Asymmetrical, right/positive (pval = 0)Symmetrical (pval = 0.096)Asymmetrical, right/positive (pval = 0)Symmetrical (pval = 0.138)
Normality00.00000167200.00000802309.661 × 10−7
Rank26,80815,38726,742.515,452.526,80815,387
U (statistic value)24982432.52498
n1n2—U12,90212,967.512,902
Disclaimer/Publisher’s Note: The statements, opinions and data contained in all publications are solely those of the individual author(s) and contributor(s) and not of MDPI and/or the editor(s). MDPI and/or the editor(s) disclaim responsibility for any injury to people or property resulting from any ideas, methods, instructions or products referred to in the content.