Article

Nuclear Energy in the Sustainability Equation: A Method of Moments Quantile Regression Analysis (MMQR) of Load Capacity Factor in OECD Countries

1
Department of Economics, Faculty of Economics and Administrative Sciences, Çankırı Karatekin University, Çankırı 18100, Türkiye
2
Department of Business Administration, Faculty of Economics and Administrative Sciences, Çankırı Karatekin University, Çankırı 18100, Türkiye
3
Project Support Office, Rectorate, Hacettepe University, Ankara 06800, Türkiye
*
Author to whom correspondence should be addressed.
Sustainability 2026, 18(16), 8451; https://doi.org/10.3390/su18168451
Submission received: 2 July 2026 / Revised: 8 August 2026 / Accepted: 16 August 2026 / Published: 18 August 2026

Abstract

Nuclear energy has attracted significant interest from policymakers because of its potential to improve environmental sustainability (ES). This study investigates the interplay among nuclear energy consumption (NEC), economic growth (GDP), renewable energy utilization (REN), urbanization (URB), and ES, measured by the load capacity factor (LCF). We analyze 16 OECD countries selected for continuous nuclear operation and complete data from 2000 to 2023. Unlike prior single-country or single-energy studies, we jointly model nuclear and renewable energy within a panel quantile framework to compare their heterogeneous effects on ES. Using the Method of Moments Quantile Regression, we find that NEC, REN, and URB are positively associated with LCF; GDP is negatively associated; REN shows a larger elasticity than NEC; and NEC’s effect strengthens at higher quantiles. Robustness checks with alternative estimators, indicators, sample periods, year fixed effects, and a formal test of the load capacity curve hypothesis broadly confirm these findings, although the implied turning point of the income–LCF relationship lies beyond the sample income range. Results suggest that OECD countries would benefit from coordinated investment in both nuclear and renewable energy, alongside sustainable urbanization policies.

1. Introduction

Global warming, the utilization of fossil fuels, the processes of industrialization and development, deforestation, and the broader implications of modernization collectively constitute significant environmental challenges. These phenomena, primarily driven by human-induced greenhouse gas emissions that stem from a steadily growing global population, have emerged as critical agenda items for countries worldwide since the 1970s and quickly gained urgency in contemporary discourse [1,2]. The pursuit of effective solutions to these pressing global environmental challenges is of paramount concern to policymakers and governments. The United Nations Conference on the Environment, convened in 1972, was a pivotal moment in this pursuit, and the subsequent Environment and Development Conference of 1992 laid a firm foundation for addressing environmental challenges.
The first substantive measures for curbing global warming were introduced at the Climate Change Conference of the Parties in Paris in 2015, where resolutions were formulated to address the discord between the outcomes of human activities and the needs of the natural environment through processes of compromise [1]. The resulting Paris Agreement stated that all participating countries pledged to strive toward limiting the increase in global temperatures to below 2 °C, with an aspirational target of 1.5 °C, relative to pre-industrial benchmarks by the year 2100 [3]. For this objective to be met, the Intergovernmental Panel on Climate Change [4] projects that net greenhouse gas emissions must be reduced by 43% between the years 2019 and 2030. In this context, the significance of low-carbon, high-energy-density alternative energy sources is increasing, paralleling the growth of renewable energy. Nuclear energy consumption (NEC) has become a crucial modern energy source, offering the potential to enhance environmental sustainability (ES) and to address climate change.
NEC has the third-smallest carbon footprint among all energy sources, emitting approximately 15–50 g of carbon dioxide (CO2) per kilowatt-hour of energy produced. Thus, it is widely regarded as an environmentally sustainable form of energy production, offering a renewable alternative for addressing the escalating global demands for energy and being characterized by its capacity to produce emissions more efficiently and at lower levels [5]. As the depletion of gas and oil reserves is anticipated in the near future, the preservation of energy distribution is a critical concern, and the reduction in greenhouse gas emissions and air pollution is a key point within both environmental and economic policy frameworks [6]. Accordingly, the value of NEC as a significant contributor to environmental mitigation and energy advancement is increasingly recognized; it possesses the potential to alleviate the long-term impacts of climate change [7,8].
By October 2025, there were 438 operational nuclear power facilities across 31 countries, collectively contributing to about 397 gigawatts of electrical capacity, with an additional 70 plants under construction across 15 countries [9]. A majority of the currently operating nuclear power plants (247 of 438) are in Organisation for Economic Co-operation and Development (OECD) member countries. The United States currently operates 94 active nuclear power plants, the highest number among OECD members. France has 57 operational nuclear power plants; South Korea has 26; Canada has 17; the United Kingdom has nine; Spain has seven; and Sweden and the Czech Republic have six each. Finland and Slovakia each have five, Switzerland and Hungary each have four, Belgium has three, Mexico has two, and Slovenia and the Netherlands each have one [9,10].
In 2023, Finland met over one-fourth of its energy needs with NEC, while France obtained more than one-third, Slovakia nearly one-fourth, and Sweden more than one-fifth of their total energy needs from NEC [10]. According to more recent data, NEC is now the primary source of energy in France, while it ranks second in Finland, Slovakia, and Slovenia and third in the Czech Republic, Belgium, and Switzerland. Furthermore, NEC accounts for approximately 9% of global electricity generation; however, within the 16 OECD countries analyzed in this study, it increases to approximately 31%. France procures over 67% of its total electricity from NEC; Slovakia 60.6%; Hungary 47.1%; and Belgium 41.5%. The Netherlands, which maintains only one operational nuclear power plant, generates approximately 3% of its electricity from NEC. Thus, 63.737% of global NEC consumption can be attributed to 16 OECD member countries. The United States single-handedly accounts for 29.22% of the total and France is responsible for 13.50% [9,10] (see Table A2 in the Appendix A). These data clearly illustrate the significant demand for NEC in OECD countries, underscoring its vital role in advancing Sustainable Development Goals (SDGs) 7 and 13 of the United Nations.
To devise effective sustainable development strategies, scholars are increasingly concentrating on the factors that contribute to environmental degradation (ED), particularly in relation to the SDGs [11]. Since the 1990s, numerous studies (e.g., refs. [12,13,14,15,16]) have employed CO2 emissions as a significant indicator in the examination of environmental impacts. Subsequent research conducted in [17,18,19] employed ecological footprints as a metric for assessing environmental quality (EQ), rather than relying on CO2 emissions. CO2 emissions and ecological footprints are both significant indicators of EQ; however, to date, emphasis has largely been placed on the demand side of these relationships, particularly on output effects. This focus has resulted in the overlooking of the supply side, especially concerning input effects [20]. The original framework was centered on the ramifications of energy consumption, given that CO2 emissions predominantly stem from fossil-fuel combustion. In contrast, the ecological footprint framework considers human demands on natural resources across six distinct land-use categories. However, it still notably overlooks the supply side, which is represented by the availability of resources, or biocapacity [21].
To address deficiencies on the supply side related to the degradation of EQ, Ref. [22] advocated for the development of a more comprehensive and effective environmental assessment indicator, known as the load capacity factor (LCF). This metric is derived from the ratio of biocapacity to ecological footprint, and it analyzes the trajectory of EQ deterioration by considering both supply and demand dynamics. The ecological footprint aggregates demand across six land-use categories (cropland, grazing land, forest land, fishing grounds, built-up land, and carbon uptake land) and is expressed in global hectares. Biocapacity is the productive, supply-side counterpart to these categories, adjusted for national yield. The LCF, as an indicator of the degree of ES, is now attracting considerable attention from researchers (e.g., refs. [23,24,25,26]). A sustainable environment is characterized by an LCF value that is greater than or equal to 1, whereas an unsustainable environment is indicated by an LCF less than or equal to 1 [2,21].
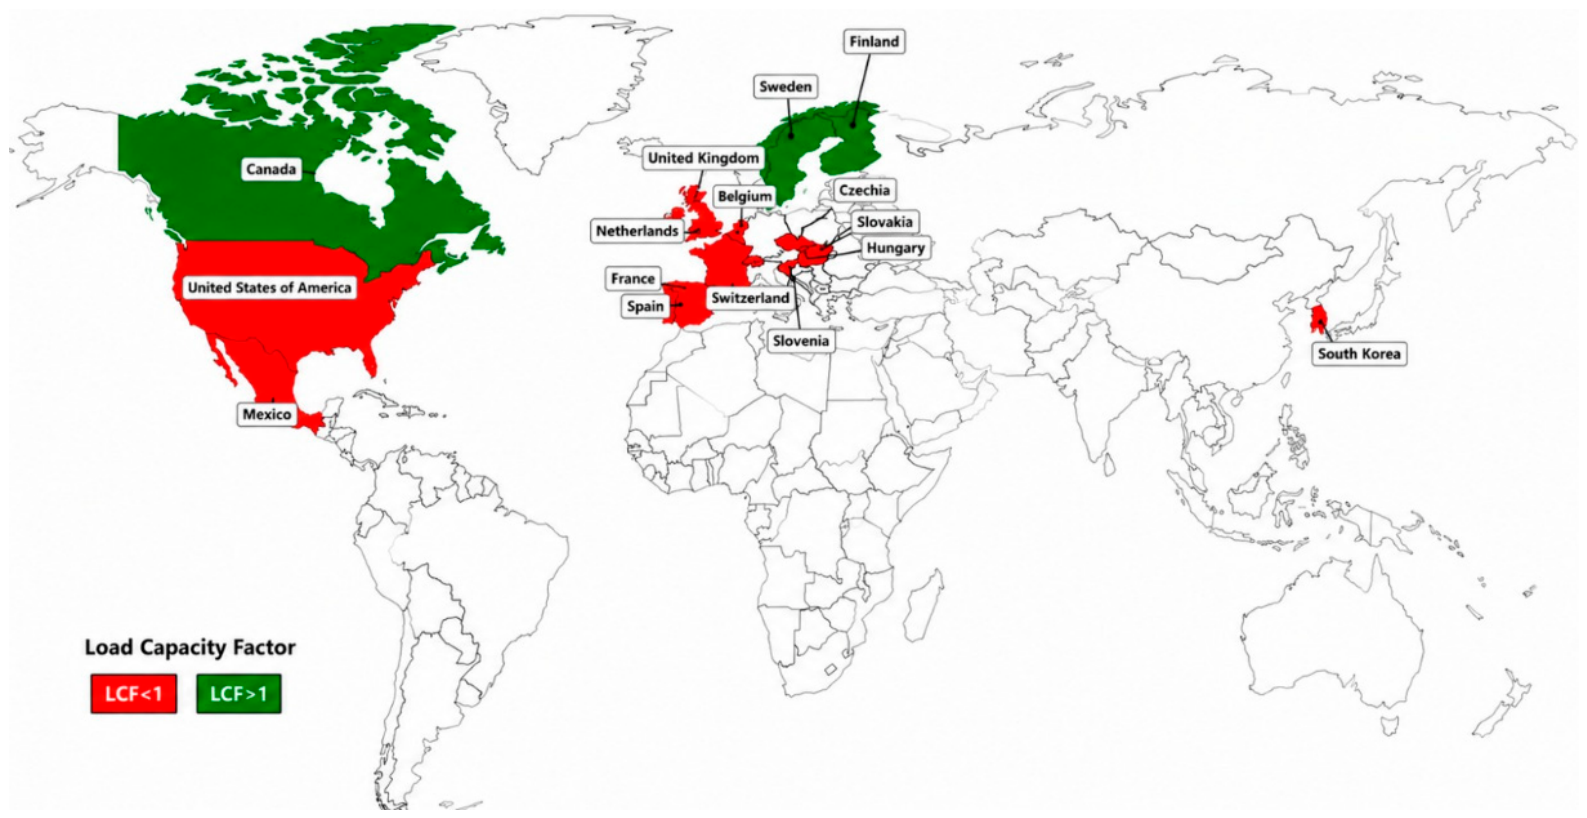
Figure 1 illustrates the mean LCF values for the 16 OECD countries included in this study, covering the period from 2000 to 2023. LCF values exceed the sustainability threshold of 1 in Canada, Finland, and Sweden (marked in green in Figure 1). Conversely, the LCF values of the United States, Belgium, the United Kingdom, the Czech Republic, France, South Korea, the Netherlands, Spain, Switzerland, Hungary, Mexico, Slovakia, and Slovenia, all of which are marked in red in Figure 1, fall below the threshold of 1. This indicates that the consumption of natural resources is unsustainable in those 13 OECD countries, while it is sustainable in Canada, Finland, and Sweden. ED evident in these OECD countries constitutes a significant obstacle to the achievement of the SDGs [27].
Figure 1. Sustainability levels of sample countries. Source: [28]. Note: Authors’ compilation.
Sustainability 18 08451 g001
Figure 2 illustrates the average LCF values for the 16 selected OECD countries from 2000 to 2023. As also shown in Figure 2, Finland, Sweden, and Canada are the only countries with LCF values exceeding 1. The calculated average LCF values for these countries from 2000 to 2023 are 1.98, 1.53, and 1.88, respectively; these values suggest that the biocapacities of Finland, Sweden, and Canada surpass their ecological footprints and indicate elevated levels of EQ. In contrast, France (0.498), South Korea (0.117), the Czech Republic (0.42), the United States (0.44), Belgium (0.149), Switzerland (0.234), Spain (0.338), the United Kingdom (0.24), the Netherlands (0.182), and Mexico (0.466) have notably low LCF values (LCF < 0.5), suggesting that their ecological conditions may be considered unsustainable. Taken together, these findings indicate that the ecological footprints of the majority of OECD countries surpass their biocapacity. This presents a considerable challenge to both sustainable development and ecosystem health, indicating that the populations of these countries may not possess the ecological capacity required to uphold their current standards of living. This positions OECD countries unfavorably in terms of ES [29].
The LCF reflects national environmental pressure rather than energy-sector performance alone. Because biocapacity depends heavily on land area, forest cover, and agricultural yield—factors largely exogenous to energy policy—Canada, Finland, and Sweden’s LCF > 1 status partly reflects geographic endowments rather than their energy mix alone. The threshold LCF = 1 should thus be read as a joint outcome of energy policy, land endowment, and ecological trade, rather than as a pure energy-policy benchmark. Accordingly, our coefficients should be interpreted as within-country associations between changes in NEC and the LCF, net of country-specific heterogeneity, rather than as explaining cross-country LCF rankings.
The present study was undertaken to empirically examine the impacts of NEC on ES, particularly through the lens of the LCF, in 16 OECD countries that both produced and consumed nuclear energy from 2000 to 2023. Moreover, this study examines the influence of renewable energy sources, economic expansion, and urban population density on LCF values. The Method of Moments Quantile Regression (MMQR) is employed to examine the extent to which the effects of NEC, economic growth (measured by gross domestic product, GDP), renewable energy utilization (REN), and urbanization (URB) are symmetric across countries with varying degrees of ES. This analysis sheds light on the dynamics of the relationship between NEC, characterized as a low-carbon, high-energy-intensity, clean energy source, and EQ, examining variations not only at the mean level but also across quantiles (Q0.25, Q0.50, Q0.75, Q0.90, and Q0.95).
The study was shaped by a variety of motivations. Notably, the countries selected for analysis host over 50% of the world’s current nuclear power facilities. Moreover, these countries are responsible for two-thirds of the total electricity generated and utilized from nuclear power facilities. This reflects these countries’ high dependence on NEC, a clean, high-density energy source, to achieve their SDGs. Second, the relationship between NEC and LCF values has not been thoroughly investigated using a substantial sample, particularly in OECD countries. Therefore, the present study emphasizes the LCF, which is regarded as the most sophisticated metric for evaluating ES. This metric takes into account not only the demand aspects of EQ but also the supply aspects. A significant number of the OECD countries examined in this study fall considerably short of the sustainability threshold of LCF ≥ 1, indicating a biocapacity deficit. In this context, a comprehensive examination of the LCF values of these countries, recognized for their pivotal roles in nuclear energy production and consumption as a means to address global warming, is imperative for progress toward SDGs.
Third, from a methodological perspective, this study employs the MMQR method introduced by [30] to investigate the dynamics of the relationship between NEC and EQ not solely at the average level but also across various percentiles. This makes it possible to analyze impact strength independently for each level of the considered variable. Fourth, the analysis encompasses the period from 2000 to 2023, using recent data to better understand the implications of international environmental policies including the Kyoto Protocol and the Paris Agreement. The fifth and final motivation for this research is to investigate the impacts of NEC on EQ, and the interactions among REN, URB, GDP, and LCF. The 16 OECD countries selected for this analysis collectively account for over 40% of global GDP in 2023; their per capita income levels are approximately three times the global average, with 77 out of every 100 individuals living in urban environments [31]. Moreover, these countries account for 20% of the overall consumption of renewable energy sources. Thus, examining these variables in the selected countries will yield valuable insights that can guide policy recommendations designed to promote the attainment of SDGs 7, 8, 11, and 13.
The existing NEC–LCF literature has three main limitations: most studies rely on short or single-country time spans; prevailing methods (ARDL, Fourier, and DOLS) estimate average or country-specific effects and rarely allow NEC’s impact to vary across sustainability levels; and nuclear-specific considerations beyond emissions (lifecycle impacts, energy security, construction costs, waste/decommissioning), as well as the LCF’s measurement limitations, have received limited attention. This study addresses these gaps by covering 16 OECD countries over the period 2000–2023, applying MMQR to estimate heterogeneous, quantile-specific effects of NEC alongside those of REN, GDP, and URB, and explicitly discussing nuclear energy’s lifecycle trade-offs and the LCF’s measurement limitations.
The remainder of this paper is structured as follows: in Section 2, we provide a comprehensive review of the literature. Section 3 describes the data sources and econometric methodologies utilized, while Section 4 provides an interpretation of the results. Finally, Section 5 draws conclusions and offers policy recommendations.

2. Literature Review

The hypothesized relationships tested here rest on two theoretical frameworks. First, the STIRPAT/IPAT tradition models environmental pressure as a function of population, affluence, and technology [32,33] and its stochastic formulation [34] motivates including URB (population-scale) and GDP (affluence) alongside NEC and REN, which jointly proxy the technology term governing the carbon intensity of the energy mix. It should be noted that URB as a share of total population is not equivalent to the population (P) term in the original STIRPAT model; rather, it captures the spatial concentration of the population, which may influence environmental pressure differently than total population size. Second, the Environmental Kuznets Curve framework [35] has been extended into the load capacity curve (LCC) hypothesis for the LCF indicator [36], positing a non-monotonic income–LCF relationship. NEC and REN are treated as technology-side substitutions for carbon-intensive generation, while URB and GDP act as scale/affluence drivers whose net effect on LCF remains an empirical question, consistent with Section 2.1, Section 2.2, Section 2.3 and Section 2.4 and Hypotheses 1–4.

2.1. Correlation Between NEC and LCF

Beyond point-of-generation emissions, nuclear energy’s sustainability profile is increasingly assessed across its full lifecycle. Harmonized lifecycle assessments show that nuclear energy’s greenhouse-gas intensity is comparable to wind and well below fossil generation [37], though more recent work cautions that cost and emissions estimates depend heavily on reactor design, fuel-cycle assumptions, and construction-phase impacts [38]. At the system level, nuclear is frequently identified as a firm, dispatchable complement to variable renewables in deep decarbonization pathways [39], with country-level modeling similarly finding a role for new nuclear capacity alongside renewables in net-zero electricity systems [40]. This motivates joint modeling of NEC and REN, as done here, rather than treating them as substitutes.
At the same time, nuclear expansion faces well-documented constraints: OECD reactor projects have shown some of the largest construction-cost overruns and schedule delays among energy infrastructure types [41], and long-term waste storage and decommissioning remain unresolved governance challenges [42]. Broader reviews confirm that nuclear energy’s energy-security and low-carbon benefits are consistently debated alongside these cost, waste, and safety concerns [43]. These considerations also bear on how the LCF should be interpreted: ecological-footprint and biocapacity accounting has faced sustained methodological critique, including land-equivalence assumptions, limited scope, and its inability to price carbon or long-horizon infrastructure risks [44,45]. This reinforces that the LCF reflects aggregate national environmental pressure, rather than providing a full lifecycle accounting for any single energy source.
The variety and the volume of scholarly research dedicated to environmental concerns have both increased considerably in recent years, largely because of the swift global decline in EQ and its adverse effects on human well-being [46]. Countries now have opportunities for direct investments in resources such as REN and NEC, thereby reducing their reliance on fossil fuels and creating substantial alternative resource pools to address the challenges posed by fluctuating oil prices. Widely recognized as a valuable source of clean energy, NEC has drawn considerable interest among policymakers with its substantial potential to increase GDP and alleviate ED [47,48]. Investigations of NEC and its correlation with ES still constitute a relatively novel field of research, but they are rapidly growing in number.
Table 1 presents an overview of empirical research to date on the effects of NEC on ES across diverse countries, regions, and methodological approaches. The body of literature reviewed here largely reports positive empirical findings on the impact of NEC on LCF values, which serve as indicators of ES and are calculated as the ratio of biocapacity to ecological footprint. Nonetheless, it is essential to recognize that some empirical results may be classified as negative or neutral, highlighting the complexity of the available data. Various studies have been conducted on Finland [49,50], France [7,51], Germany [52], South Korea [53], Pakistan [21,47,54], India [6,55], the United States [20], and Russia [56], as well as comparative analyses involving France and the United States [48] and a broader examination encompassing the United States, China, Russia, France, Canada, Spain, Sweden, Korea, Ukraine, and Germany [2]. These investigations have emphasized NEC’s role as a pivotal factor influencing the ES in these economies. NEC is widely recognized as exerting a beneficial influence on LCF values, although some studies have indicated either the absence of a significant correlation or a negative association between the two variables. A recent investigation of the BRICS countries [5] suggested that the NEC has detrimental effects on ES, while other research focusing on South Africa [57] and Germany [58] revealed no significant effect of NEC on LCF values. Inconsistencies across the findings of numerous studies necessitate deeper investigation into the effects of NEC on the LCF. This is especially pertinent to the present study, considering that the 16 analyzed countries are members of the OECD.
The divergence in Table 1 likely reflects three factors rather than the role of nuclear energy alone. First, sample composition: studies of countries where nuclear is a marginal or declining share of the mix, such as South Africa [57] or Germany post-phase-out [58], tend to find null or negative effects, whereas studies of large, stable-nuclear-share countries like France [7,51] or Finland [49,50] more consistently find a positive effect. Second, econometric approaches: average-effect estimators (ARDL, DOLS, and FMOLS) impose a constant elasticity, whereas quantile-based approaches allow the relationship to vary with the underlying sustainability level, thereby reconciling conflicting average-effect findings. Third, time horizon: divergent post-Fukushima policy responses mean that studies dominated by pre- or post-Fukushima observations may capture different policy phases, rather than a stable relationship. Methodologically, MMQR has previously been applied to NEC–LCF questions in a ten-country panel [2] and to G7 economies using LCF [59], but neither addresses a strictly balanced, post-Paris Agreement OECD panel restricted to continuously nuclear-generating economies—the gap this study addresses.
Hypothesis 1.
NEC improves the LCF.
Table 1. Literature summary.
RefPeriodsCountries or RegionsMethodsResults
[2]1995–2020USA, China, Russia, France, Canada, Spain, Sweden, Korea, Ukraine, and GermanyMMQRNEC improves LCF
[3]1995–2018USA, China, France, Russia, Korea, Canada, Ukraine, and GermanyQoQR and GCiQNEC improves LCF except for France, USA, and Germany
[5]1990–2018BRICS countriesLM-bootstrap cointegration and Driscoll-KraayNEC decreases LCF
[6]1970–2018IndiaARDLNEC improves LCF
[7]1977–2017FranceFourier autoregressive distributed lagNEC improves LCF
[20]1965–2018USABootstrap Fourier Granger causality in quantiles NEC improves LCF
[21]1971–2021PakistanDynamic ARDLNEC improves LCF
[47]1971–2021PakistanDynamic ARDLNEC improves LCF
[48]1978–2021USA and FranceAsymmetric ARDLNuclear energy R&D expenditures improve LCF
[49]1990–2022FinlandNARDLNEC improves LCF
[50]1990–2022FinlandQQ and KRLSNEC improves LCF
[51]1980–2018FranceAARDLNEC improves LCF
[52]1974–2018GermanyAARDL, DOLS, and Fourier causalityNEC improves LCF
[53]1977–2018South Korea ARDLNEC improves LCF
[54]1990–2022PakistanDynamic ARDLNEC improves LCF
[55]1970–2022IndiaDOLSNEC improves LCF
[56]1992–2018RussiaARDLNEC improves LCF
[57]1985–2022South AfricaARDL and KRLSNEC does not improve LCF
[58]1974–2018GermanyFMOLS and DOLSNuclear energy R&D expenditures do not affect LCF
[60]1990–2021France, USA, Canada, Russia, and ChinaCS-ARDLNEC improves LCF
[61]1981–2022CanadaFourier ARDLNuclear energy R&D expenditures improve LCF

2.2. Correlation Between GDP and LCF

Previous studies have thoroughly examined the interplay between economic expansion and environmental considerations, with findings indicating a relationship between GDP and levels of CO2 emissions. It has been noted that emissions generally increase alongside the growth of economic activity [2]. However, in recent years, this body of literature has evolved into a more intricate landscape as research has increasingly concentrated on the interplay between GDP and the LCF, with the LCF serving as a more comprehensive measure of ES. The heterogeneity observed in this literature primarily arises from the characteristics of datasets (longitudinal or cross-sectional); the classification of country groups (whether studies address single countries or panels of countries); and the econometric techniques employed in the analysis. Several studies, including those by [62] and [63], have indicated that the relationship between GDP and the LCF tends to move in the same direction. Conversely, research conducted in [11,23,64,65] revealed a negative correlation between these two variables. The existence of these contradictory results warrants a more thorough investigation of the topic within the context of the 16 OECD countries engaged in the production and consumption of nuclear energy.
Hypothesis 2.
GDP decreases the LCF.

2.3. Correlation Between REN and LCF

The dangers associated with the escalation of global climate change have seized the attention of governments, policymakers, and researchers alike. Efforts are being made to formulate a range of strategies to mitigate the ED attributable to fossil fuels. In pursuit of this objective, novel strategic decisions have focused on replacing fossil fuels with renewable sources, including wind, solar, and geothermal energy. In this context, studies of the correlation between REN, often referred to as green energy, and the environmental quality have increased significantly in recent years. A considerable number of studies (e.g., Refs. [26,62,66,67,68]) have reached the conclusion that REN plays a significant role in promoting ES. Reference [27] argued that an emphasis on REN markedly contributed to the advancement of ES within OECD countries. Similarly, Ref. [69] suggested that REN plays a significant role in enhancing EQ through the mitigation of ED in both G7 and E7 countries. However, other studies [70,71,72] demonstrated a negative correlation between REN and LCF values, suggesting that an increase in REN may result in a decline in ES. The discrepancies observed in studies examining the correlation between REN and LCF across the 16 OECD countries that engage in nuclear energy production and consumption warrant further research.
Hypothesis 3.
REN improves the LCF.

2.4. Correlation Between URB and LCF

URB represents a profound social transformation characterized by the aggregation of populations and economic endeavors in unison with the proliferation of urban settlements [73]. This phenomenon offers considerable advantages, including economic advancement, job creation, wealth accumulation, educational opportunities, enhanced welfare, and the development of social frameworks [74]. Nonetheless, it may also result in adverse consequences, including infrastructural deficiencies, haphazard processes of urbanization, and the encroachment of concrete structures upon green spaces [75]. Examination of the interplay between URB and environmental factors reveals a lack of consensus within the scholarly literature. The dynamics of urban transformation are pivotal in shaping the environmental consequences of these processes. If the processes of urban transformation are led by individuals with relatively high levels of education, productivity, and environmental consciousness, one might anticipate that URB will yield beneficial effects for the environment. In contrast, if URB occurs with an insufficiently skilled labor force, growth-centric objectives, and a populace with no understanding of environmental issues, ED is likely to ensue [76].
In this context, an evaluation of studies examining the relationship between URB and ES reveals a consistently demonstrated increase in LCF values in association with URB [62,66,77,78]. These studies indicate a positive correlation between the degree of URB and the level of ES. Nevertheless, other studies have suggested that URB and ES may be inversely correlated [29,60,65,79]. These contradictory results may be attributed to the underlying data structures, classifications of country groups, and specific applications employed in different studies. Other factors, such as levels of education, presence of environmentally conscious individuals, implementation of smart URB policies, or adoption of cleaner energy sources, may also play significant roles in these outcomes. In summary, discrepancies in the literature regarding the relationship between URB and LCF values across the 16 OECD countries engaged in the production and consumption of nuclear energy necessitate further study.
Hypothesis 4.
URB improves the LCF.

2.5. Research Gap

Taken together, Section 2.1, Section 2.2, Section 2.3 and Section 2.4 identify three consolidated gaps that motivate the design of this study. First, existing NEC–LCF studies rarely explain why estimated effects diverge across countries; the comparative reading offered in Section 2.1 suggests that sample composition (the nuclear share in the electricity mix), econometric approach (average- versus quantile-based estimators), and time horizon relative to the Fukushima accident are the most likely sources, yet no prior study has tested this explicitly within a single, harmonized panel. Second, although MMQR has been applied to NEC–LCF and related sustainability questions in cross-country panels [2,59], no study has combined MMQR with a strictly balanced, post-Paris Agreement OECD panel restricted to continuously nuclear-generating economies over 2000–2023. Third, the theoretical grounding for the GDP–LCF, REN–LCF, and URB–LCF relationships in Section 2.2, Section 2.3 and Section 2.4 has generally been asserted rather than derived from an explicit framework; the opening discussion of this section addresses this by anchoring all four hypotheses in the STIRPAT and LCC frameworks. The present study is designed to close these three gaps jointly, rather than incrementally extending any single prior study.

3. Data and Methodology

3.1. Variables and the Econometric Model

This study evaluates the influence of NEC, GDP, REN, and URB on ES. The analysis is based on annual data from 16 OECD countries engaged in the production and consumption of nuclear energy, spanning 2000–2023, and is encapsulated within the fundamental econometric framework in Equation (1). Here, LCF, NEC, GDP, REN, and URB represent, respectively, LCF (measured as biocapacity/ecological footprint), nuclear energy consumption (per capita, Kwh), economic growth (per capita, constant 2015 US dollar value), renewable energy consumption (per capita, Kwh), and urbanization (percentage of the total population). ε i t denotes the error term. The symbols φ 0 , φ 1 , φ 2 , φ 3 , and φ 4 represent the intercept and the coefficients associated with the variables in the model. The indices denoted as i and t pertain to the 16 OECD countries included in the study, all of which are engaged in the production and consumption of nuclear energy. The countries included are the United States, Belgium, the United Kingdom, the Czech Republic, Finland, France, South Korea, the Netherlands, Spain, Sweden, Switzerland, Canada, Hungary, Mexico, Slovakia, and Slovenia; the data cover the period 2000–2023.
l n L C F i t = φ 0 + φ 1 l n N E C i t + φ 2 l n G D P i t + φ 3 l n R E N i t + φ 4 l n U R B i t + ε i t
The sample is restricted to OECD member countries, whose broadly comparable regulatory, institutional, and energy-market frameworks (liberalized electricity markets, comparable environmental reporting standards, and comparable data quality) reduce cross-country heterogeneity that could otherwise confound the estimated relationships. Within the OECD, the 16 countries were selected because they were the only members that (i) operated at least one nuclear power plant continuously throughout 2000–2023, and (ii) reported uninterrupted, comparable data on nuclear energy consumption, renewable energy consumption, GDP, urbanization, and LCF for the entire period, thereby allowing a strictly balanced panel. OECD countries that began or terminated nuclear generation during this period (e.g., Italy, which does not operate nuclear plants, or Germany, which phased out nuclear generation by 2023) were excluded to avoid structural breaks and missing-data interpolation. Non-OECD nuclear producers (e.g., China, Russia, and India) were excluded because harmonized data across all model variables were unavailable for the full period, and their institutional and market structures differ substantially from those of the OECD sample. We acknowledge that this criterion may introduce sample-selection bias and that the findings generalize primarily to industrialized, market-based nuclear-energy economies; this limitation is discussed further in Section 5.
Table 2 provides detailed information on the data sources and indicators employed in this analysis. The data pertaining to LCF were obtained from [28], while NEC and REN data were derived from [10] and GDP and URB data were obtained from [31]. NEC and REN are expressed in kilowatt-hours per capita and represent primary energy measured using the substitution method (also referred to as the input-equivalent approach) as provided by [10]. This method accounts for the thermal inefficiencies of fossil-fuel electricity generation, ensuring that low-carbon sources are compared on a consistent primary-energy basis. GDP is expressed in constant 2015 US dollars per capita, and urbanization (URB) is expressed as the percentage of the total population residing in urban areas. Per capita values are obtained by dividing the total primary energy consumption by the corresponding population series from the same source. The complete dataset and the estimation code used in this study are available in [80] to ensure full replicability of the reported results.
All variables in Equation (1) are expressed in natural logarithmic form. This transformation does not eliminate the nonlinearity or heterogeneity in the NEC–LCF relationship; rather, it stabilizes variance, reduces the influence of skewness and extreme values common in cross-country energy and ecological-footprint data, and allows coefficients to be interpreted as elasticities [81]. The nonlinearity and cross-country heterogeneity in this relationship—evidenced by the slope-heterogeneity test and varying coefficients across quantiles—is instead modeled through the MMQR estimator described below, which allows the relationship to vary across the conditional distribution of LCF rather than assuming a single, constant effect [30].

3.2. Econometric Methods

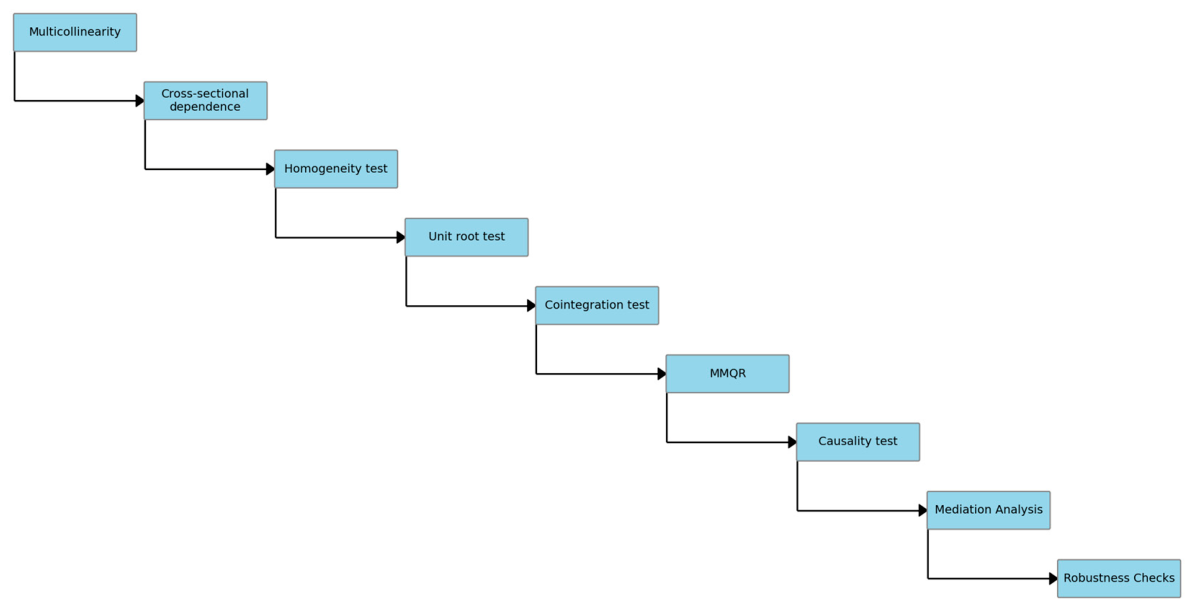
The flow chart of the empirical analysis is provided in Figure 3. We first conduct tests for multicollinearity, cross-sectional dependence (CSD), and homogeneity. In the light of the observed CSD within our dataset, we proceed to implement the second-generation unit root test by [82] to achieve more robust results. In the subsequent phase, the second-generation cointegration test, proposed by [83], was applied within the model’s heterogeneous framework. Given the attributes inherent to the dataset, and the extensive panel data for OECD countries from 2000 to 2023, the MMQR was employed to identify the heterogeneous impacts of independent variables across quantiles of the LCF distribution. The next phase of the econometric analysis entailed a thorough examination of the causal relationship between the load capacity factor (lnLCF) and the independent variables: nuclear energy consumption (lnNEC), economic growth (lnGDP), renewable energy consumption (lnREN), and urbanization (lnURB). To achieve this objective, the causality test suggested by [84] was employed. Finally, a mediation analysis based on the [85] approach investigates the indirect effect of NEC on LCF through fossil-fuel consumption. A series of robustness checks—alternative estimators (CCE-MG, AMG, DOLS, and FMOLS), sub-period and alternative-quantile analyses, and country-based sensitivity tests—further verify the MMQR findings.

3.2.1. MMQR Estimation

The MMQR estimator accommodates cross-country heterogeneity by estimating a distinct coefficient vector at each quantile (Q0.25–Q0.95), allowing the marginal effect of NEC, GDP, REN, and URB on LCF to vary across the distribution, and by incorporating country-specific fixed effects through the location-scale specification of [30], which absorbs time-invariant unobserved heterogeneity—such as baseline environmental-regulation stringency, technological capacity, and industrial structure—that would otherwise bias the coefficients. Quantile regression is theoretically appropriate because the NEC–LCF relationship is unlikely to be homogeneous across countries at different baseline levels of ecological pressure: countries near or below the biocapacity threshold (lower quantiles) may respond differently than those with substantial ecological deficits (upper quantiles). Conventional mean-based estimators (OLS, fixed-effects, and GMM) would obscure this heterogeneity, whereas MMQR characterizes the full conditional distribution and is robust to outliers and the non-normality common in cross-country ecological-footprint data.
Time-specific common shocks are addressed at two levels. First, the second-generation panel tests applied here (CIPS, slope-homogeneity, and Westerlund) are robust to cross-sectional dependence arising from common shocks. Second, although the baseline MMQR specification does not include explicit time fixed effects, we assess sensitivity to the choice of sample window by re-estimating the model over the sub-period 2005–2020. The signs and magnitudes of the coefficients remain materially consistent over this restricted window.
The MMQR estimator applied here follows the method of [30]. For each country i and quantile τ 0.25 ,   0.50 ,   0.75 ,   0.90 ,   0.95 , the conditional quantile of ln L C F i t is modeled as a location-scale function of the covariates in Equation (2) where X i t contains ln N E C i t , ln G D P i t , ln R E N i t , and ln U R B i t . α i and δ i are country-specific fixed effects in, respectively, the location and scale of the conditional distribution; β and γ are the (quantile-invariant) location and scale coefficient vectors, estimated in a first stage by pooled OLS/fixed-effects moment conditions; and q τ is estimated in a second stage as the τ -th sample quantile of the standardized residuals from the first-stage regression, following [30].
Q ln L C F τ X i t = α i + q τ δ i + X i t β + q τ X i t γ
β τ = β + q τ γ
The specification in Equation (1) is static, with no lagged dependent variable or regressors, so no lag-order selection procedure was required; Equation (3) then recovers the quantile-specific coefficients from this static specification. This follows the contemporaneous, elasticity-based specification standard in the cross-country EKC-type literature on nuclear/renewable energy and ecological footprint [2,7,20,43], consistent with our panel’s balanced, moderate time dimension ( T = 24 ), which limits the efficiency of dynamic panel estimators. Note that a static specification does not allow for gradual (lagged) adjustment of LCF, and we discuss this alongside broader endogeneity limitations in Section 5.
Identification of the quantile-specific coefficients relies on three assumptions: (i) conditional on the country-specific location and scale fixed effects ( α i , δ i ), the regressors are treated as exogenous with respect to the idiosyncratic error term; (ii) each covariate’s scale effect on the conditional distribution of ln L C F is homogeneous across quantiles up to the factor q τ , i.e., covariates shift the entire distribution rather than having an unrestricted quantile-specific form; and (iii) the country fixed effects α i and δ i are treated as correlated with the regressors (a “fixed-effects” rather than “random-effects” assumption), which is why the location-scale specification is used rather than pooled quantile regression.

3.2.2. Panel Causality Test

Regarding endogeneity, the location-scale fixed-effects structure of MMQR primarily controls for country-specific, time-invariant unobserved heterogeneity and does not by itself resolve endogeneity arising from time-varying omitted variables (e.g., year-to-year changes in energy-efficiency policy or technological progress) or potential reverse causality between NEC and LCF. To provide additional evidence on the direction of this relationship, we apply the Dumitrescu–Hurlin panel causality test [84], which indicates bidirectional Granger causality between lnNEC and lnLCF. This supports the plausibility of a two-way relationship but does not, on its own, correct for endogeneity in the MMQR estimates; we therefore interpret the MMQR results as robust conditional associations rather than strict causal effects.

3.2.3. Mediation Analysis

To explore the channels through which NEC affects LCF, we conduct a mediation analysis following the [85] approach, which decomposes the total effect into direct and indirect effects operating through a mediating variable. The indirect effect’s significance is assessed using the Sobel–Goodman test [86]. The share of fossil fuels in primary energy consumption (FF) is used as the mediating variable, since nuclear energy may improve sustainability in part by displacing fossil-fuel generation. The mediation model comprises three fixed-effects equations: Equation (4) shows the total effect of NEC on LCF ( c ); Equation (5) shows the effect of NEC on FF ( a ); and Equation (6) shows the effect of NEC and FF on LCF, yielding NEC’s direct effect ( c ) and FF’s effect on LCF ( b ).
ln L C F i t = c ln N E C i t + γ 1 ln G D P i t + γ 2 ln R E N i t + γ 3 ln U R B i t + μ i + ε i t
ln F F i t = a ln N E C i t + δ 1 ln G D P i t + δ 2 ln R E N i t + δ 3 ln U R B i t + ν i + η i t
ln L C F i t = c ln N E C i t + b ln F F i t + γ 1 ln G D P i t + γ 2 ln R E N i t + γ 3 ln U R B i t + ω i + ξ i t
The indirect effect is computed as a × b , with significance tested via the Sobel–Goodman test using bootstrapped standard errors (1000 replications); the proportion mediated by FF is a × b / c . All regressions include country fixed effects and robust standard errors, with lnGDP, lnREN, and lnURB as controls, consistent with the baseline specification.

3.2.4. Robustness Checks

To assess the reliability of the MMQR findings, we conducted several robustness checks. First, we employ two alternative estimators that account for cross-sectional dependence and slope heterogeneity: the Common Correlated Effects Mean Group (CCE-MG) estimator of [87] and the Augmented Mean Group (AMG) estimator of [88]. Second, we report the DOLS and FMOLS estimates of [89] as alternative long-run estimators. Third, we re-estimate the MMQR model over the subperiod 2005–2020 to test sensitivity to the choice of sample period. Fourth, we examine alternative quantiles (Q0.10 and Q0.99). Fifth, we replace the dependent variable with the logarithms of ecological footprint (lnEF) and biocapacity (lnBIO) as alternative environmental indicators. Sixth, we perform a leave-one-out sensitivity analysis by sequentially excluding each country and re-estimating the MMQR model.

4. Empirical Findings

4.1. Descriptive Statistics and Preliminary Tests

Prior to beginning the empirical analysis, we examined the essential characteristics of the variables under consideration. The descriptive statistics of the dataset are presented in Table 3. We found that mean GDP (10.312), with values ranging from 9.102 to 11.414, was the highest, followed by mean NEC (8.511), with values ranging from 4.903 to 10.060. These variables were followed by REN (8.259), URB (4.339), and LCF (−0.807). This indicates that average per capita NEC (log form) exceeds average per capita REN across the sample period, reflecting the relative scale of nuclear versus renewable consumption embedded in these countries’ energy mixes over 2000–2023, rather than differences in policy priority; aggregate consumption levels are shaped by historical infrastructure investment, resource endowments, and the timing of energy-transition policies. Furthermore, REN (1.298) has the highest standard deviation, whereas URB (0.156) has a lower standard deviation.
After a thorough analysis of the statistical properties of the study data, preliminary tests were conducted to assess the presence of multicollinearity and CSD within the model framework. The findings from those pretests are given in Table 4. The variance inflation factors (VIFs) presented in Table 4 are below the widely accepted threshold of 5, indicating that multicollinearity does not pose a substantial issue in the model. In other words, the independent variables are adequately differentiated and do not compromise the integrity of the regression estimates [90].
Table 4 also provides the initial observations regarding CSD. Panel B confirms the presence of CSD across all variables in the model. The results derived from three different CSD tests lead to the rejection of the null hypothesis of cross-sectional independence at the 1% significance level, reflecting the existence of CSD. In the presence of CSD, it is imperative to perform appropriate unit root tests. Employing second-generation unit root tests is advisable, as they are more appropriate than first-generation tests. Second-generation tests account for CSD among series, yielding results that are more precise than those produced by first-generation unit root tests [90], thereby offering enhanced reliability. In the present study, the second-generation CIPS unit root test was employed, as described by [82], and the findings are presented in Table 5.
As shown in Table 5, the CIPS unit root test indicates that LCF, NEC, and REN are stationary at levels, whereas GDP and URB are stationary after first differencing. Furthermore, Table 6 presents findings obtained from the heterogeneity slope estimator as described by [91]. The primary hypothesis was rejected at the 1% significance level, while the alternative hypothesis of the slope coefficients exhibiting heterogeneity was accepted [92]. Thus, the model exhibits heterogeneity. Empirical findings indicate the presence of slope heterogeneity among OECD countries, which can be attributed to their varying economic frameworks.
The panel cointegration test by [83], which is classified as a second-generation panel cointegration test, was also applied due to the existence of inter-unit correlation within the study framework. Although the CIPS results (Table 5) show mixed integration orders—lnLCF, lnNEC, and lnREN are I(0), while lnGDP and lnURB are I(1)—the error-correction-based test by [83] remains informative here. We attempted to estimate a dynamic CS-ARDL model to explicitly identify the long-run relationship, but the available time dimension (T = 24) proved insufficient for the required lag structure. We therefore rely on the Pedroni and Westerlund panel cointegration tests, which strongly support the existence of a long-run equilibrium among the variables, and treat the MMQR estimates as characterizing the distributional heterogeneity around this long-run relationship.
The results of this test are presented in Table 7. Among the four Westerlund [83] statistics, the panel-based Gt and Pt statistics reject the null hypothesis of no cointegration at the 1% and 5% levels, respectively, while the group-mean Ga is insignificant and Pa is marginally significant. Following standard practice, rejection by at least one panel statistic is sufficient to conclude cointegration for the panel as a whole, while the non-significant group-mean statistics indicate non-uniformity across countries—consistent with the slope heterogeneity in Table 6.

4.2. MMQR Estimation Results

The ability to offer information about the impacts of an independent variable at percentiles, as well as that variable’s impact across various other levels and scales, is a noteworthy benefit of the MMQR estimator [90]. Because quantile regression is unable to reliably identify unobserved heterogeneity, it becomes less stable in the presence of outliers. However, quantile heterogeneity can be estimated using the MMQR estimator. Since moving averages are used in traditional quantile regression, conditional heterogeneity is absent. By accounting for conditional heterogeneity of variance, the MMQR estimator improves the accuracy of the findings. Moreover, MMQR is seen to be more suitable in situations where variables display endogeneity and data are categorized based on individual-specific effects. For nonlinear models, this econometric model works well [2]. Standard quantiles (i.e., Q0.25, Q0.50, Q0.75, Q0.90, and Q0.95) adequately represent the behavior of the lower tail, the median, and the upper tail of the distribution. Although the sample comprises 16 cross-sectional units, MMQR quantiles are estimated over the pooled panel of N × T = 384 country-year observations, not the 16 countries individually; Q0.90 and Q0.95 thus correspond to roughly 38 and 19 pooled observations, sufficient for stable quantile estimates and consistent with standard practice in the panel quantile regression literature [2,90].
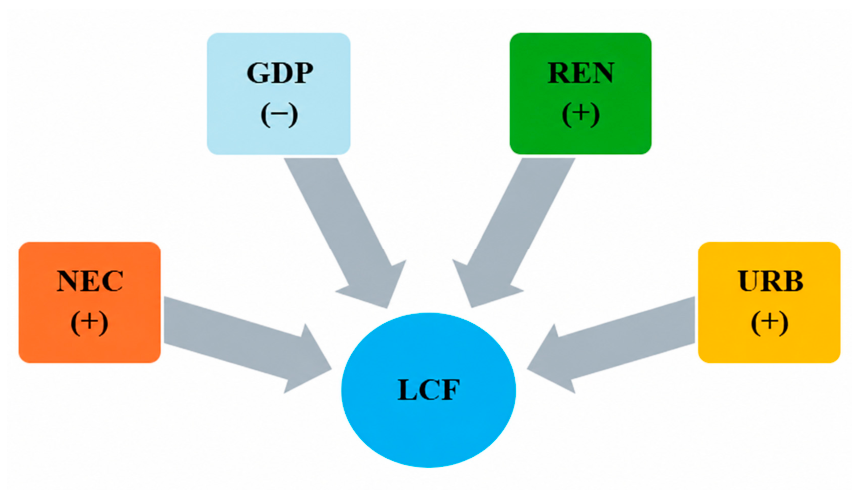
Variability across LCF levels can be thoroughly evaluated using quartiles while preserving the simplicity of robustness results and avoiding undue complexity. The findings obtained from MMQR provide a nuanced understanding of the varying impacts of the independent variables lnNEC, lnGDP, lnREN, and lnURB on lnLCF, the dependent variable. Table 8 indicates that NEC exerts a favorable and significant influence on LCF values across all quantiles. With each 1% rise in NEC, we observe a notable enhancement in the LCF, quantified as increases of 0.093% at Q0.25, 0.157% at Q0.50, 0.199% at Q0.75, 0.245% at Q0.90, and 0.268% at Q0.95. Thus, NEC’s beneficial impact on the LCF increases progressively from lower to upper quantiles, culminating in its greatest effect at Q0.95. The data illustrates a positive correlation between NEC and the LCF across the entire distribution of LCFs in OECD countries. This suggests that the LCF-captured environmental benefits of nuclear energy increase consistently across the sustainability distribution, positioning it as a viable low-carbon contributor to ES.
However, nuclear energy is neither renewable nor fully carbon-neutral: lifecycle assessments show that uranium mining, enrichment, plant construction, cooling-water use, and decommissioning carry non-trivial environmental footprints [37,38], and unresolved long-term waste storage remains a significant liability [93]. The LCF-based results reported here capture nuclear energy’s net effect on the aggregate footprint-biocapacity balance; they do not constitute a full lifecycle or risk assessment, and they do not account for low-probability, high-consequence accident risk, which varies with reactor design, age, and regulatory oversight. Cross-country differences in nuclear governance—safety regulation, waste-management institutions, and public acceptance—likely also shape how consistently NEC translates into LCF gains, a dimension that our country-specific heterogeneity terms only partially capture. Nuclear energy may nonetheless support energy security by reducing reliance on imported fossil fuels and indirectly aiding sustainability during price shocks; however, this depends on national context.
This increasing pattern suggests that the marginal contribution of nuclear energy to load capacity is greatest among observations in the upper quantiles of the conditional LCF distribution—i.e., where ecological conditions are already relatively more favorable. Observations in these upper quantiles typically share features such as more mature nuclear infrastructure, higher capacity factors, and energy policies that have long prioritized nuclear as a decarbonization pillar, along with a lower reliance on carbon-intensive baseload alternatives. In contrast, among observations in the lower quantiles, nuclear energy generally constitutes a smaller share of the generation mix and is accompanied by a larger fossil-fuel base, which may dilute its marginal ecological benefit.
The findings from the MMQR analysis suggest the existence of a negative and statistically significant correlation between GDP and ES, with coefficients ranging from 1.059 to 1.084 across all quantiles. These results indicate that a 1% increase in economic welfare is associated with a decrease in the LCF ranging from 1.059% to 1.084%. The observed decline ranges from a minimum of 1.059% in Q0.25 to a maximum of 1.084% in Q0.95, thereby demonstrating that GDP adversely impacts ES in these OECD countries. Higher GDP levels correlate with environmental stress, potentially stemming from the heightened utilization of natural resources and higher levels of emissions [57]. Our finding of an inverse correlation between GDP and the LCF based on the MMQR estimator aligns closely with the findings of other studies [27,60,76].
Conversely, the findings from the MMQR estimator indicate a noteworthy positive correlation between REN and LCF. The observed positive relationship reflects distinct effects across various percentiles. A 1% increase in REN is associated with increases in LCF of 0.634% at Q0.25, 0.621% at Q0.50, 0.612% at Q0.75, 0.602% at Q0.90, and 0.597% at Q0.95. This indicates that the utilization of REN is a feasible approach for mitigating carbon pollution while simultaneously significantly reducing the environmental impact, as discussed in the study conducted in [5]. These results align with the conclusions reached by other researchers [5,20,57].
Finally, the findings indicate a statistically significant positive correlation between the LCF and the degree of URB. The degree of URB plays a crucial role in the improvement of ES across all quantiles. In OECD countries, a 1% rise in URB is associated with increases in LCF of 0.747% at Q0.25, 1.081% at Q0.50, 1.304% at Q0.75, 1.544% at Q0.90, and 1.666% at Q0.95. These results indicate that the beneficial impact of URB is minimal at Q0.25 and reaches a peak at Q0.95. Our findings are in line with previous research undertaken by [77] across 24 European Union countries, [62] on newly industrializing economies, [94] on BRICS countries, and [95] on 17 Asia-Pacific countries. The aggregate findings of these studies provide robust evidence supporting the positive correlation between URB and the LCF, thereby reinforcing the results obtained in the present work. The outcomes of the MMQR estimation are further summarized in Figure 4.

4.3. Causality Results

Table 9 presents the results obtained from the causality test conducted as described by [84]. These findings indicate bidirectional Granger causality between lnNEC and lnLCF and between lnGDP and lnLCF, meaning that past values of each variable significantly predict the other; unidirectional Granger causality runs from lnREN and lnURB to lnLCF. Because this test identifies predictive (Granger) precedence rather than structural causality, it complements but does not substitute the endogeneity discussion in Section 3.2: the bidirectional lnNEC–lnLCF result is consistent with a genuine two-way relationship but equally consistent with both variables responding to a common omitted driver, and should be read as supportive evidence of temporal precedence rather than proof of a causal mechanism.

4.4. Mediation Analysis Findings

As described in Section 3.2.3, we conducted a mediation analysis using the fossil-fuel share (FF) as the mediator of the relationship between NEC and LCF, following the Baron–Kenny approach and using the Sobel–Goodman significance test (1000 bootstrap replications), while controlling for GDP, renewable energy, and urbanization. The results (Table 10) show that the total effect of nuclear energy on LCF is positive and significant, and nuclear energy significantly reduces the fossil-fuel share, confirming that expansion displaces fossil fuels. However, the pathway from the fossil-fuel share to LCF is not significant; therefore, the indirect effect via fossil-fuel substitution is also not significant, while the direct effect of nuclear energy remains positive, significant, and nearly identical to the total effect.
This suggests that the NEC–LCF relationship is predominantly direct, rather than mediated by fossil-fuel displacement. A plausible explanation is that LCF, as a composite ratio of biocapacity to ecological footprint, captures dimensions of environmental pressure beyond fossil-fuel emissions. Although nuclear energy reduces fossil-fuel dependence, this may not immediately translate into improvements in LCF, since the ecological footprint also reflects land use and resource consumption. Alternative channels—energy efficiency, technological innovation, and reduced carbon intensity—may be more relevant mediators, though data limitations prevent formal testing in this study. The proportion mediated (0.017) confirms that less than 2% of nuclear energy’s total effect on LCF operates through fossil-fuel displacement, reinforcing the conclusion that the relationship is predominantly direct.

4.5. Robustness Checks Findings

Robustness results are summarized in Table 11, Table 12, Table 13, Table 14 and Table 15. Table 11 presents the CCE-MG and AMG long-run estimates: the GDP coefficient is negative and significant in the AMG specification, consistent with the baseline MMQR finding, while NEC, REN, and URB are insignificant in both specifications, with CCE-MG exhibiting very large standard errors—consistent with the well-documented small-sample limitations of these heterogeneous mean-group estimators when T is short and N moderate [96].
We also estimate the model using DOLS and FMOLS by [89] (Table 12). DOLS yields a negative and significant NEC coefficient, opposite in sign to MMQR, while FMOLS yields a positive and significant coefficient consistent with MMQR. This divergence reflects a key difference in assumptions: both DOLS and FMOLS impose a common, homogeneous long-run relationship across countries, whereas MMQR allows the relationship to vary across the LCF distribution. Given the significant slope heterogeneity confirmed in Table 6, the homogeneous estimates should be interpreted with caution. FMOLS yields a positive and significant NEC coefficient, while DOLS yields a negative and significant one, highlighting the sensitivity to the homogeneity assumption. Consequently, we do not rely on these homogeneous estimates as primary evidence but present them for completeness.
Table 13 reports the panel cointegration test of [97] as an additional robustness check. The panel t, group t, panel ADF, and group ADF statistics all reject the null hypothesis of no cointegration, confirming the long-run equilibrium relationship among the variables.
Table 14 summarizes additional MMQR robustness results across four alternative specifications. In the shortened sample period (2005–2020, Panel A), the coefficients of all covariates retain their expected signs and statistical significance, with NEC, REN, and URB remaining positive and GDP negative across all quantiles; the NEC coefficients are slightly smaller than in the baseline, while the GDP and REN elasticities are somewhat larger in absolute value. The alternative-quantile estimates (Panel B) show that at the extreme lower tail (Q0.10) NEC is only marginally significant and smaller in magnitude, whereas at the extreme upper tail (Q0.99) it becomes highly significant and substantially larger—confirming that NEC’s marginal contribution is weakest among observations with very low LCF and strongest among those with already high LCF; the remaining covariates maintain their expected signs and significance at both extremes. When the dependent variable is replaced by lnEF (Panel C) and lnBIO (Panel D), the coefficients of all regressors remain broadly consistent with the baseline pattern. NEC remains positive and significant for both alternative indicators; its magnitude declines across quantiles for lnEF (from 0.144 at Q0.25 to 0.068 at Q0.95) and rises for lnBIO (from 0.267 to 0.288), consistent with LCF being defined as the biocapacity-to-footprint ratio. Across all panels, GDP retains its negative association with environmental quality (positive for lnEF, negative for lnBIO), while REN and URB maintain their beneficial roles, reinforcing the robustness of the main findings to alternative sample periods, quantile choices, and environmental indicators.
A leave-one-out sensitivity analysis (Table 15) demonstrates that the estimated lnNEC coefficients vary only modestly when each of the 16 OECD countries is sequentially removed from the sample. At the upper quantile (Q0.95), for instance, the coefficient of nuclear energy consumption ranges from 0.163 to 0.322, compared with the full-sample estimate of 0.268, and remains statistically significant in every iteration. This narrow dispersion confirms that no single country exerts disproportionate influence on the results.
To address potential time-specific common shocks that are not captured by the baseline location-scale specification, we re-estimate the MMQR model including year dummy variables and present standard errors clustered at the country level to account for within-country serial dependence. As shown in Table 16, the signs and statistical significance of the main covariates (lnNEC, lnGDP, lnREN, and lnURB) remain fully consistent with the baseline results in Table 8. The year dummies are largely insignificant, except for the final two years (2022–2023), which display small but significant negative coefficients, suggesting a modest common negative shock in those years. The stability of the covariate coefficients confirms that the main findings are not driven by omitted common time trends.
To explicitly test the LCC hypothesis, we augment the baseline specification with a quadratic income term. Because the level and square of log GDP are highly collinear, we first mean-center the variable: we compute l n g d p c as the deviation of each country-year’s log GDP from the overall panel mean, and l n g d p c 2 as the square of this centered value. The MMQR estimates using these centered variables (Table 17) show that the coefficient on l n g d p c 2 is positive and statistically significant at the median and upper quantiles (Q0.50–Q0.95), confirming a U-shaped relationship between income and the load capacity factor. However, the implied turning points range from 11.82 (at Q0.95) to 13.09 (at Q0.50) on the log-GDP scale, all of which lie above the sample maximum of 11.41. This means that while the LCC pattern is empirically supported, none of the sample countries have yet reached the income level at which further growth would begin to improve the LCF. Consequently, the net marginal effect of income on environmental sustainability remains negative throughout the observed income range, consistent with our baseline linear specification.
Taken together, the extensive set of robustness checks—encompassing alternative estimators (CCE-MG, AMG, DOLS, and FMOLS), alternative sample periods and quantile specifications, an augmented model with year fixed effects, alternative environmental indicators (ecological footprint and biocapacity), a formal test of the load capacity curve hypothesis with a quadratic income term, and the leave-one-out exercise—broadly supports the main findings, although some estimators (notably DOLS) produce divergent results due to their restrictive homogeneity assumptions, which are rejected by the slope-heterogeneity test (Table 6). The main conclusions are therefore not driven by estimator choice, sample period, variable measurement, or country-level outliers.

5. Conclusions and Implications for Policy

5.1. Summary of Findings

This study investigated the interplay among NEC, GDP, REN, URB, and LCF over the period from 2000 to 2023 across 16 OECD countries selected from among the 31 countries engaged in the production and consumption of nuclear energy globally, employing the MMQR methodology as described by [30]. The analysis indicated a positive, statistically significant correlation between NEC and LCF across all quantiles examined. This indicates NEC is positively associated with LCF across the sample and period examined which is consistent with nuclear energy’s role as a low-carbon component of a sustainable energy portfolio; however, it should not be interpreted as proof that expanding nuclear investment will directly cause improved sustainability outcomes elsewhere or in the future.
Similarly, REN emerged as another notable determinant of the LCF across all quantiles. This finding reflects the significant role of green energy sources in promoting ES within OECD countries. Empirical evidence also indicates that the degree of URB within OECD countries contributes positively to EQ enhancement. The management of URB, when guided by careful planning and commitment to ES, is likely to yield beneficial outcomes for ecological preservation. However, the negative correlation between economic growth (GDP) and the LCF suggests that advancements in economic activity in OECD countries are accompanied by environmental costs. An increase in economic engagement appears to exert a detrimental influence on ES, thereby intensifying environmental pressures. A supplementary test of the load capacity curve hypothesis reveals a U-shaped income–LCF relationship; however, the turning point lies above the sample’s maximum income level, indicating that the sample countries have not yet reached the threshold where further growth would improve the load capacity factor.

5.2. Policy Recommendations

Our findings support several significant policy recommendations tailored to the 16 OECD countries engaged in nuclear energy production and consumption. Both nuclear and renewable energy positively influence ES; REN shows a larger average effect (0.597–0.634) than NEC (0.093–0.268), although NEC’s effect strengthens at upper quantiles. Thus, renewables and nuclear are complementary: renewables offer greater average benefits, whereas nuclear contributes a smaller but growing share, particularly in high-LCF countries. OECD countries should invest in both and not prioritize one over the other.
Nuclear investment should be weighed against country-specific costs, energy-security needs, and public acceptance, alongside the lifecycle and governance considerations discussed above. Because the estimated NEC association strengthens toward the upper quantiles of the conditional LCF distribution, its marginal contribution appears greatest where countries are already closer to ecological balance, while REN’s larger, more stable coefficient across the distribution suggests it delivers more uniform benefits regardless of a country’s current position. This distributional pattern—not a claim about specific countries’ effects—should inform differentiated policy timing rather than country-specific targeting, since the model does not estimate country-level interaction effects. Given the negative GDP–LCF association, growth strategies must be carefully planned alongside energy transitions. Moreover, the LCC test reveals that the turning point lies above the sample’s maximum income level, indicating that economic growth alone is unlikely to improve the load capacity factor; it must be accompanied by deliberate investments in clean energy and sustainable urbanization. Sustainable urbanization policies—smart cities, energy-efficient buildings, and electric vehicles—should also be pursued.

5.3. Limitations and Future Research

This analysis is not without limitations. Notably, 31 countries worldwide are engaged in both the production and consumption of nuclear energy, but the present study considered only 16 OECD member countries, selected based on continuous nuclear operation and complete data availability over the period 2000–2023 (Section 3.1). This criterion, while ensuring balanced-panel comparability, may introduce sample-selection bias and limit generalizability to OECD-type, market-based nuclear-energy economies. If global data were accessible, a more comprehensive analysis involving other countries that engage in the production and consumption of nuclear energy would be possible, enabling a broader assessment of the implications of NEC on ES across a more diverse array of countries and energy-transition contexts.
In addition, while the MMQR framework accounts for time-invariant country-specific heterogeneity and cross-sectional dependence, it does not fully address endogeneity arising from time-varying omitted variables (e.g., short-run changes in environmental regulation, technological progress, or industrial structure), nor potential reverse causality between NEC and LCF. The Dumitrescu–Hurlin results (Table 9) offer supportive evidence of a bidirectional relationship, but future research using dynamic panel GMM or instrumental-variable quantile approaches would further strengthen causal identification.
Our analysis treats NEC as a single cross-country variable, abstracting from heterogeneity in nuclear governance—accident risk, waste-management capacity, regulatory regimes, and energy-security contexts—which differ substantially across OECD countries and are not modeled separately. The estimated NEC–LCF relationship should thus be read as a net statistical association under prevailing institutional conditions, not as evidence that nuclear energy is risk-free or environmentally costless.
A further limitation is that the LCF is jointly shaped by the energy mix, land endowment/biocapacity, and ecological trade (Section 1). Our country-specific MMQR terms only partially absorb this. Future work could decompose the LCF into its biocapacity and footprint components or directly control for land area and forest cover. Moreover, future research could explore the influence of additional macroeconomic variables by incorporating factors such as financial development and foreign direct investment. Finally, our specification incorporates neither spatial spillover effects across neighboring or economically integrated countries nor country-level nuclear risk variables (e.g., reactor age, safety-incident history, and waste-storage capacity); both are left for future research.

Author Contributions

Conceptualization, M.A.D., B.T., A.Ö. and O.B.; methodology, M.A.D. and B.T.; formal analysis, M.A.D., B.T., A.Ö. and O.B.; writing—original draft preparation, M.A.D., B.T., A.Ö. and O.B. All authors have read and agreed to the published version of the manuscript.

Funding

This research received no external funding.

Institutional Review Board Statement

Not applicable.

Informed Consent Statement

Not applicable.

Data Availability Statement

The dataset and Stata 19 replication code constructed for this study are publicly available in the Mendeley Data repository in [80]. The raw data were derived from publicly available sources: the World Nuclear Association, Our World in Data, the Global Footprint Network, and the World Bank databases. No new data were generated in this study.

Conflicts of Interest

The authors declare no conflicts of interest.

Abbreviations

The following abbreviations are used in this manuscript:
AMGAugmented Mean Group
CCE-MGCommon Correlated Effects Mean Group
CO2Carbon Dioxide
CSDCross-Sectional Dependence
EDEnvironmental Degradation
EQEnvironmental Quality
ESEnvironmental Sustainability
GDPEconomic Growth
FFShare Of Fossil Fuels in Primary Energy Consumption
LCCLoad Capacity Curve
LCFLoad Capacity Factor
MMQRMethod of Moments Quantile Regression
NECNuclear Energy Consumption
OECDOrganisation For Economic Co-Operation and Development
RENRenewable Energy Utilization
SDGsSustainable Development Goals
URBUrbanization
VIFVariance Inflation Factors

Appendix A

Table A1. Share of Primary Energy Consumption Categorized By Source in 2023 (%).
CountryCoalOilNuclearGasRenewablesHydropower
Finland7.66527.23425.5943.55724.61011.340
France2.07932.83034.84914.38710.1125.743
Sweden3.21822.41620.4011.51324.63227.82
S. Korea23.86842.07512.43416.9694.3960.258
Slovakia14.93926.75424.37722.8884.8086.234
Czechia 30.61826.38818.15316.3907.0391.411
Belgium4.30649.71912.44921.33112.0390.156
Slovenia11.33435.56918.60110.4367.38816.672
Switzerland0.27434.63718.36810.9606.65129.11
USA8.73838.2847.64034.1238.9522.263
Canada2.69731.2795.65032.5124.81523.047
Hungary4.14537.10915.31032.40010.8220.214
Spain1.96945.1358.98019.08220.8863.948
UK2.67338.8335.18633.32219.2790.707
Netherlands4.71749.7921.04427.81716.6100.02
Mexico3.38743.4571.32344.0375.5932.203
Source: [10]. Note: Authors’ compilation.
Table A2. Profiles of the Sample Countries’ Nuclear Energy Production and Consumption in 2024.
CountryNumber of Reactors in OperationNuclear Electricity Generation
(TWh)
Share of Electricity Production (%)Nuclear Energy Consumption
(TWh)
Share of Nuclear Energy Consumption in the World (%)
Finland531.139.1801.164
France57364.467.392813.504
Sweden648.729.11231.790
S. Korea26179.431.74606.693
Slovakia517.060.6450.654
Czechia 628.040.2721.048
Belgium329.741.5761.106
Slovenia15.635.0140.204
Switzerland423.028.6560.814
USA94781.918.2200829.220
Canada1781.213.42083.027
Hungary415.247.1390.568
Spain752.119.91331.935
UK937.312.3991.440
Netherlands13.42.890.131
Mexico212.04.8300.437
Total247171030.73438063.737
World43826678.966872100
Source: [9,10]. Note: Authors’ compilation.
Table A3. Correlation Matrix.
12345
(1)
LLCF
1.0000
(2)
LNEC
0.26951.0000
(3)
LGDP
−0.02240.37081.0000
(4)
LREN
0.62000.37350.58131.0000
(5)
LURB
−0.1257−0.08450.50310.08051.0000
Note: Authors’ compilation.

References

  1. Narin, M.; Taşdoğan, C. Doğal Kaynaklar ve Çevre Ekonomisi; Gazi Kitabevi: Ankara, Türkiye, 2019. [Google Scholar]
  2. Ali, M.; Samour, A.; Soomro, S.A.; Khalid, W.; Tursoy, T. A step towards a sustainable environment in top-10 nuclear energy consumer countries: The role of financial globalization and nuclear energy. Nucl. Eng. Technol. 2025, 57, 103142. [Google Scholar] [CrossRef] [Scilit]
  3. Ozcan, B.; Depren, S.K.; Kartal, M.T. Impact of nuclear energy and hydro electricity consumption in achieving environmental quality: Evidence from load capacity factor by quantile based non-linear approaches. Gondwana Res. 2024, 129, 412–424. [Google Scholar] [CrossRef] [Scilit]
  4. IPCC. AR6 Synthesis Report: Climate Change 2023. Available online: https://www.ipcc.ch/report/sixth-assessment-report-cycle (accessed on 10 November 2025).
  5. Wang, S.; Zafar, M.W.; Vasbieva, D.G.; Yurtkuran, S. Economic growth, nuclear energy, renewable energy, and environmental quality: Investigating the environmental Kuznets curve and load capacity curve hypothesis. Gondwana Res. 2024, 129, 490–504. [Google Scholar] [CrossRef] [Scilit]
  6. Adebayo, T.S.; Ozturk, I.; Ağa, M.; Uhunamure, S.E.; Kirikkaleli, D.; Shale, K. Role of natural gas and nuclear energy consumption in fostering environmental sustainability in India. Sci. Rep. 2023, 13, 11030. [Google Scholar] [CrossRef] [Scilit] [PubMed]
  7. Pata, U.K.; Samour, A. Do renewable and nuclear energy enhance environmental quality in France? A new EKC approach with the load capacity factor. Prog. Nucl. Energy 2022, 149, 104249. [Google Scholar] [CrossRef] [Scilit]
  8. Saidi, K.; Omri, A. Reducing CO2 emissions in OECD countries: Do renewable and nuclear energy matter? Prog. Nucl. Energy 2020, 126, 103425. [Google Scholar] [CrossRef] [Scilit]
  9. WNA. World Nuclear Power Reactors & Uranium Requirements. Available online: https://world-nuclear.org/information-library/facts-and-figures/world-nuclear-power-reactors-and-uranium-requireme (accessed on 10 June 2025).
  10. Our World in Data. Available online: https://ourworldindata.org/ (accessed on 10 January 2025).
  11. Dai, J.; Ahmed, Z.; Alvarado, R.; Ahmad, M. Assessing the nexus between human capital, green energy, and load capacity factor: Policymaking for achieving sustainable development goals. Gondwana Res. 2024, 129, 452–464. [Google Scholar] [CrossRef] [Scilit]
  12. Caglar, A.E.; Mert, M. Carbon hysteresis hypothesis as a new approach to emission behavior: A case of top five emitters. Gondwana Res. 2022, 109, 171–182. [Google Scholar] [CrossRef] [Scilit]
  13. Chien, F.; Ajaz, T.; Andlib, Z.; Chau, K.Y.; Ahmad, P.; Sharif, A. The role of technology innovation, renewable energy and globalization in reducing environmental degradation in Pakistan: A step towards sustainable environment. Renew. Energy 2021, 177, 308–317. [Google Scholar] [CrossRef] [Scilit]
  14. Raza, M.Y.; Tang, S. Inter-fuel substitution, technical change, and carbon mitigation potential in Pakistan: Perspectives of environmental analysis. Energies 2022, 15, 8758. [Google Scholar] [CrossRef] [Scilit]
  15. Su, T.; Chen, Y.; Lin, B. Uncovering the role of renewable energy innovation in China’s low carbon transition: Evidence from total-factor carbon productivity. Environ. Impact Assess. Rev. 2023, 101, 107128. [Google Scholar] [CrossRef] [Scilit]
  16. Chishti, M.Z.; Azeem, H.S.M.; Khan, M.K. Asymmetric nexus between commercial policies and consumption-based carbon emissions: New evidence from Pakistan. Financ. Innov. 2023, 9, 33. [Google Scholar] [CrossRef] [Scilit]
  17. Liu, Y.; Sadiq, F.; Ali, W.; Kumail, T. Does tourism development, energy consumption, trade openness and economic growth matters for ecological footprint: Testing the Environmental Kuznets Curve and pollution haven hypothesis for Pakistan. Energy 2022, 245, 123208. [Google Scholar] [CrossRef] [Scilit]
  18. Jin, G.; Huang, Z. Asymmetric impact of renewable electricity consumption and industrialization on environmental sustainability: Evidence through the lens of load capacity factor. Renew. Energy 2023, 212, 514–522. [Google Scholar] [CrossRef] [Scilit]
  19. Destek, M.A.; Sinha, A. Renewable, non-renewable energy consumption, economic growth, trade openness and ecological footprint: Evidence from organisation for economic Co-operation and development countries. J. Clean. Prod. 2020, 242, 118537. [Google Scholar] [CrossRef] [Scilit]
  20. Kartal, M.T.; Samour, A.; Adebayo, T.S.; Depren, S.K. Do nuclear energy and renewable energy surge environmental quality in the United States? New insights from novel bootstrap Fourier Granger causality in quantiles approach. Prog. Nucl. Energy 2023, 155, 104509. [Google Scholar] [CrossRef] [Scilit]
  21. Ullah, S.; Lin, B. Green energy dynamics: Analyzing the environmental impacts of renewable, hydro, and nuclear energy consumption in Pakistan. Renew. Energy 2024, 232, 121025. [Google Scholar] [CrossRef] [Scilit]
  22. Siche, R.; Pereira, L.; Agostinho, F.; Ortega, E. Convergence of ecological footprint and emergy analysis as a sustainability indicator of countries: Peru as case study. Commun. Nonlinear Sci. Numer. Simul. 2010, 15, 3182–3192. [Google Scholar] [CrossRef] [Scilit]
  23. Fang, Z.; Wang, T.; Yang, C. Nexus among natural resources, environmental sustainability, and political risk: Testing the load capacity factor curve hypothesis. Resour. Policy 2024, 90, 104791. [Google Scholar] [CrossRef] [Scilit]
  24. Dada, J.T.; Tabash, M.I.; Al-Faryan, M.A.S.; Akinbobola, T.O. Determinants of Load Capacity Factor in Nigeria: Implications for Sustainable Development. Econ. Cult. 2025, 22, 17–33. [Google Scholar] [CrossRef] [Scilit]
  25. Alam, Q.; Voumik, L.C.; Rahman, M.H.; Khan, M.A.A. Impact of globalization, tourism, energy, and education on load capacity factors in selected 14 Indo-Pacific nations: An advanced econometric analysis. All Earth 2025, 37, 1–16. [Google Scholar] [CrossRef] [Scilit]
  26. Raihan, A.; Rashid, M.; Voumik, L.C.; Akter, S.; Esquivias, M.A. The dynamic impacts of economic growth, financial globalization, fossil fuel, renewable energy, and urbanization on load capacity factor in Mexico. Sustainability 2023, 15, 13462. [Google Scholar] [CrossRef] [Scilit]
  27. Pata, U.K.; Samour, A. Assessing the role of the insurance market and renewable energy in the load capacity factor of OECD countries. Environ. Sci. Pollut. Res. 2023, 30, 48604–48616. [Google Scholar] [CrossRef] [Scilit] [PubMed]
  28. Global Footprint Network, Ecological Footprint. Available online: https://www.footprintnetwork.org/our-work/ecological-footprint (accessed on 10 February 2025).
  29. Guloglu, B.; Caglar, A.E.; Pata, U.K. Analyzing the determinants of the load capacity factor in OECD countries: Evidence from advanced quantile panel data methods. Gondwana Res. 2023, 118, 92–104. [Google Scholar] [CrossRef] [Scilit]
  30. Machado, J.A.; Silva, J.S. Quantiles via moments. J. Econom. 2019, 213, 145–173. [Google Scholar] [CrossRef] [Scilit]
  31. World Bank. World Development Indicators. Available online: https://databank.worldbank.org/source/world-development-indicators (accessed on 10 February 2025).
  32. Ehrlich, P.R.; Holdren, J.P. Impact of population growth. Science 1971, 171, 1212–1217. [Google Scholar] [CrossRef] [Scilit] [PubMed]
  33. Dietz, T.; Rosa, E.A. Rethinking the environmental impacts of population, affluence and technology. Hum. Ecol. Rev. 1994, 1, 277–300. [Google Scholar]
  34. York, R.; Rosa, E.A.; Dietz, T. STIRPAT, IPAT and ImPACT: Analytic tools for unpacking the driving forces of environmental impacts. Ecol. Econ. 2003, 46, 351–365. [Google Scholar] [CrossRef] [Scilit]
  35. Grossman, G.M.; Krueger, A.B. Environmental Impacts of a North American Free Trade Agreement; NBER Working Paper No. 3914; National Bureau of Economic Research: Cambridge, MA, USA, 1991. [Google Scholar] [CrossRef] [Scilit]
  36. Pata, U.K.; Işık, C. Determinants of the load capacity factor in China: A novel dynamic ARDL approach for ecological footprint accounting. Resour. Policy 2021, 74, 102313. [Google Scholar] [CrossRef] [Scilit]
  37. Warner, E.S.; Heath, G.A. Life cycle greenhouse gas emissions of nuclear electricity generation: Systematic review and harmonization. J. Ind. Ecol. 2012, 16, S73–S92. [Google Scholar] [CrossRef] [Scilit]
  38. Pomponi, F.; Hart, J. The greenhouse gas emissions of nuclear energy–Life cycle assessment of a European pressurised reactor. Appl. Energy 2021, 290, 116743. [Google Scholar] [CrossRef] [Scilit]
  39. Sepulveda, N.A.; Jenkins, J.D.; De Sisternes, F.J.; Lester, R.K. The role of firm low-carbon electricity resources in deep decarbonization of power generation. Joule 2018, 2, 2403–2420. [Google Scholar] [CrossRef] [Scilit]
  40. Price, J.; Keppo, I.; Dodds, P.E. The role of new nuclear power in the UK’s net-zero emissions energy system. Energy 2023, 262, 125450. [Google Scholar] [CrossRef] [Scilit]
  41. Eash-Gates, P.; Klemun, M.M.; Kavlak, G.; McNerney, J.; Buongiorno, J.; Trancik, J.E. Sources of cost overrun in nuclear power plant construction call for a new approach to engineering design. Joule 2020, 4, 2348–2373. [Google Scholar] [CrossRef] [Scilit]
  42. Keppler, J.H.; Bilbao y Leon, S.; Kwong, G.; Cameron, D.; Tadesse, R.; Pini, P.-E.; Kruse, J.-H.; Mir, L.; Cortvriendt, C.; Yuen, P.W.; et al. Ensuring the Adequacy of Funding Arrangements for Decommissioning and Radioactive Waste Management; OECD/NEA, WPNE and NEA Committee for Technical and Economic Studies on NDC: Paris, France, 2021; p. 46. [Google Scholar] [CrossRef] [Scilit]
  43. Muhammad Amir, R.; Zeler, I. Discourses on the sustainability of nuclear energy: A semi-systematic literature review of scientific production. Discov. Sustain. 2024, 5, 503. [Google Scholar] [CrossRef] [Scilit]
  44. Wiedmann, T.; Barrett, J. A review of the ecological footprint indicator—Perceptions and methods. Sustainability 2010, 2, 1645–1693. [Google Scholar] [CrossRef] [Scilit]
  45. Galli, A.; Giampietro, M.; Goldfinger, S.; Lazarus, E.; Lin, D.; Saltelli, A.; Wackernagel, M.; Müller, F. Questioning the ecological footprint. Ecol. Indic. 2016, 69, 224–232. [Google Scholar] [CrossRef] [Scilit]
  46. Çakar, N.D.; Erdoğan, S.; Gedikli, A.; Öncü, M.A. Nuclear energy consumption, nuclear fusion reactors and environmental quality: The case of G7 countries. Nucl. Eng. Technol. 2022, 54, 1301–1311. [Google Scholar] [CrossRef] [Scilit]
  47. Özkan, O.; Alola, A.A.; Eluwole, K.K. Dynamic environmental quality effect of nuclear energy intensity, structural changes, and natural resources in Pakistan: Testing load capacity factor hypothesis evidence. Environ. Dev. Sustain. 2024, 27, 26783–26800. [Google Scholar] [CrossRef] [Scilit]
  48. Caglar, A.E.; Gönenç, S.; Destek, M.A. The influence of nuclear energy research and development investments on environmental sustainability: Evidence from the United States and France. Int. J. Sustain. Dev. World Ecol. 2024, 31, 861–872. [Google Scholar] [CrossRef] [Scilit]
  49. Georgescu, I.; Kinnunen, J. Nonlinear ARDL analysis of economic growth, nuclear energy, and innovation’s asymmetric effects on Finland’s load capacity factor. SN Bus. Econ. 2025, 5, 37. [Google Scholar] [CrossRef] [Scilit]
  50. Georgescu, I.; Kinnunen, J. Assessing the Impact of Nuclear Energy on Load Capacity, Economic Growth, and Innovation: A Quantile-on-Quantile Analysis for Finland. J. Clean. Prod. 2025, 512, 145693. [Google Scholar] [CrossRef] [Scilit]
  51. Ali, M.; Soomro, S.A.; Bakari, H.; Samour, A.; Tursoy, T. Does nuclear energy consumption contribute to load capacity factor? Modeling the effects of public debt and financial development in France. Nucl. Eng. Technol. 2025, 57, 103414. [Google Scholar] [CrossRef] [Scilit]
  52. Jin, X.; Ahmed, Z.; Pata, U.K.; Kartal, M.T.; Erdogan, S. Do investments in green energy, energy efficiency, and nuclear energy R&D improve the load capacity factor? An augmented ARDL approach. Geosci. Front. 2024, 15, 101646. [Google Scholar] [CrossRef] [Scilit]
  53. Pata, U.K.; Kartal, M.T. Impact of nuclear and renewable energy sources on environment quality: Testing the EKC and LCC hypotheses for South Korea. Nucl. Eng. Technol. 2023, 55, 587–594. [Google Scholar] [CrossRef] [Scilit]
  54. Khan, A.; Bazai, H.S.K. Assessing sustainability: A comprehensive analysis of nuclear energy, energy depletion, and agriculture in Pakistan. BTTN J. 2023, 2, 17–38. [Google Scholar] [CrossRef] [Scilit]
  55. Raihan, A. Effects of Nuclear Energy, Structural Changes, Economic Growth, and Natural Resources on India’s Load Capacity Factor. In Proceedings of the International Conference on Environmental and Energy Economics, Rome, Italy, 26–29 August 2024. [Google Scholar]
  56. Hakkak, M.; Altintaş, N.; Hakkak, S. Exploring the relationship between nuclear and renewable energy usage, ecological footprint, and load capacity factor: A study of the Russian Federation testing the EKC and LCC hypothesis. Renew. Energy Focus 2023, 46, 356–366. [Google Scholar] [CrossRef] [Scilit]
  57. Nwani, C.; Omoke, P.C. Towards an ecologically sustainable electricity mix in South Africa: Evaluating the policy implications of renewable and nuclear energy. Util. Policy 2025, 96, 101972. [Google Scholar] [CrossRef] [Scilit]
  58. Pata, U.K.; Kartal, M.T.; Erdogan, S.; Sarkodie, S.A. The role of renewable and nuclear energy R&D expenditures and income on environmental quality in Germany: Scrutinizing the EKC and LCC hypotheses with smooth structural changes. Appl. Energy 2023, 342, 121138. [Google Scholar] [CrossRef] [Scilit]
  59. Aybudak, H.G.; Khalid, W.; Usman, M.; Seraj, M.; Rafay, A.; Ali, Q.S. Assessing the impacts of economic growth, stringent environmental policies, renewable energy, and non-renewable energy on environmental sustainability in G-7 economies: Insights from the method of moments quantile regression. Asia-Pac. J. Reg. Sci. 2025, 9, 743–772. [Google Scholar] [CrossRef] [Scilit]
  60. Teng, W.; Islam, M.M.; Vasa, L.; Abbas, S.; Shahzad, U. Impacts of nuclear energy, greener energy, and economic progress on the load capacity factor: What we learn from the leading nuclear power economies? Geosci. Front. 2024, 15, 101739. [Google Scholar] [CrossRef] [Scilit]
  61. Yurtkuran, S.; Pata, U.K. The effect of nuclear and fossil fuel energy R&D expenditures on environmental qualities in Canada. Sustain. Energy Technol. Assess. 2024, 68, 103872. [Google Scholar] [CrossRef] [Scilit]
  62. Durmus, S.; Agırkaya, M.B.; Akyol, H. Drivers of the Load Capacity Factor in New İndustrialized Countries: Economic Growth, Financial Development and Urbanization on Load Capacity Factor. Int. J. Econ. Financ. Issues 2025, 15, 184. [Google Scholar] [CrossRef] [Scilit]
  63. Alola, A.A.; Doganalp, N.; Obekpa, H.O. The influence of renewable energy and economic freedom aspects on ecological sustainability in the G7 countries. Sustain. Dev. 2023, 31, 716–727. [Google Scholar] [CrossRef] [Scilit]
  64. Özbay, F.; Tekin, B.; Shah, S.A.R.; Abbas, N. Is the load capacity curve a true phenomenon for OECD economies? Hidden behavior of financial institutions and markets in Environmental Sustainability. J. Environ. Manag. 2024, 370, 122812. [Google Scholar] [CrossRef] [Scilit] [PubMed]
  65. Çamkaya, S. The Relationship between environmental quality and urbanization under the LCC hypothesis: Empirical evidence from Türkiye. Fiscaoeconomia 2024, 8, 739–760. [Google Scholar] [CrossRef] [Scilit]
  66. Sun, A.; Bao, K.; Aslam, M.; Gu, X.; Khan, Z.; Uktamov, K.F. Testing load capacity and environmental Kuznets curve hypothesis for China: Evidence from novel dynamic autoregressive distributed lags model. Gondwana Res. 2024, 129, 476–489. [Google Scholar] [CrossRef] [Scilit]
  67. Ben-Salha, O.; Zmami, M. The impact of human capital on the load capacity factor in the middle east and north Africa. Econ. Environ. 2024, 91, 940. [Google Scholar] [CrossRef] [Scilit]
  68. Caglar, A.E.; Gökçe, N.; Balsalobre-Lorente, D. Towards the vision of going green: The role of different energy research and development investments, urbanization and income in load capacity factor. Sustain. Energy Technol. Assess. 2024, 68, 103888. [Google Scholar] [CrossRef] [Scilit]
  69. Khan, U.; Khan, A.M.; Khan, M.S.; Ahmed, P.; Haque, A.; Parvin, R.A. Are the impacts of renewable energy use on load capacity factors homogeneous for developed and developing nations? Evidence from the G7 and E7 nations. Environ. Sci. Pollut. Res. 2023, 30, 24629–24640. [Google Scholar] [CrossRef] [Scilit] [PubMed]
  70. Altıntaş, N.; Açıkgöz, F.; Okur, M.; Öztürk, M.; Aydın, A. Renewable energy and banking sector development impact on load capacity factor in Malaysia. J. Clean. Prod. 2024, 434, 140143. [Google Scholar] [CrossRef] [Scilit]
  71. Xu, D.; Salem, S.; Awosusi, A.A.; Abdurakhmanova, G.; Altuntaş, M.; Oluwajana, D.; Kirikkaleli, D.; Ojekemi, O. Load capacity factor and financial globalization in Brazil: The role of renewable energy and urbanization. Front. Environ. Sci. 2022, 9, 823185. [Google Scholar] [CrossRef] [Scilit]
  72. Huilan, W.; Akadiri, S.S.; Haouas, I.; Awosusi, A.A.; Odu, A.T. Impact of trade liberalization and renewable energy on load capacity factor: Evidence from novel dual adjustment approach. Energy Environ. 2022, 35, 795–814. [Google Scholar] [CrossRef] [Scilit]
  73. Ochoa, J.J.; Tan, Y.; Qian, Q.K.; Shen, L.; Moreno, E.L. Learning from best practices in sustainable urbanization. Habitat Int. 2018, 78, 83–95. [Google Scholar] [CrossRef] [Scilit]
  74. Zhang, L.; Ye, W. Will urbanization reduce residential traffic energy consumption? Evidence from China urban household survey. Appl. Econ. Lett. 2020, 27, 489–493. [Google Scholar] [CrossRef] [Scilit]
  75. Tan, F.; Lu, Z. The impact of urban compactness on urban sustainable development in China: The case of Nanjing. Sustain. Dev. 2019, 27, 270–280. [Google Scholar] [CrossRef] [Scilit]
  76. Caglar, A.E.; Destek, M.A.; Manga, M. Analyzing the load capacity curve hypothesis for Turkiye: A perspective for the sustainable environment. J. Clean. Prod. 2024, 444, 141232. [Google Scholar] [CrossRef] [Scilit]
  77. Guney, E.; Sogut, Y.; Demirtas, N.; Koseoglu, Y.; Sanver, C. Harmonising progress: Assessing the impact of economic freedom, economic growth, urbanisation and environmental protection expenditures on load capacity in selected European Union countries. Environ. Sci. Eur. 2024, 37, 51. [Google Scholar] [CrossRef] [Scilit]
  78. Ridwan, M.; Akther, A.; Tamim, M.A.; Ridzuan, A.R.; Esquivias, M.A.; Wibowo, W. Environmental health in BIMSTEC: The roles of forestry, urbanization, and financial access using LCC theory, DKSE, and quantile regression. Discov. Sustain. 2024, 5, 429. [Google Scholar] [CrossRef] [Scilit]
  79. Saint Akadiri, S.; Ozkan, O.; Alola, A.A. Investigating the determinants of load capacity factor in Nigeria: An asymmetric quantile approach on urbanization, economic growth, FDI, and resource dependency. Resour. Policy 2025, 104, 105586. [Google Scholar] [CrossRef] [Scilit]
  80. Demir, M.A.; Tekin, B.; Özarslan, A.; Balcı, O. Nuclear Energy in the Sustainability Equation: A Method of Moments Quantile Regression Analysis (MMQR) of Load Capacity Factor in OECD Countries; Mendeley Data, V1; Elsevier: Amsterdam, The Netherlands, 2026. [Google Scholar] [CrossRef]
  81. Saidi, S.; Hammami, S. Modeling the causal linkages between transport, economic growth and environmental degradation for 75 countries. Transp. Res. Part D Transp. Environ. 2017, 53, 415–427. [Google Scholar] [CrossRef] [Scilit]
  82. Pesaran, M.H. A simple panel unit root test in the presence of crosssection dependence. J. Appl. Econom. 2007, 22, 265–312. [Google Scholar] [CrossRef] [Scilit]
  83. Westerlund, J. Testing for error correction in panel data. Oxf. Bull. Econ. Stat. 2007, 69, 709–748. [Google Scholar] [CrossRef] [Scilit]
  84. Dumitrescu, E.I.; Hurlin, C. Testing for Granger non-causality in heterogeneous panels. Econ. Model. 2012, 29, 1450–1460. [Google Scholar] [CrossRef] [Scilit]
  85. Baron, R.M.; Kenny, D.A. The moderator–mediator variable distinction in social psychological research: Conceptual, strategic, and statistical considerations. J. Personal. Soc. Psychol. 1986, 51, 1173–1182. [Google Scholar] [CrossRef] [Scilit] [PubMed]
  86. Sobel, M.E. Asymptotic confidence intervals for indirect effects in structural equation models. Sociol. Methodol. 1982, 13, 290–312. [Google Scholar] [CrossRef] [Scilit]
  87. Pesaran, M.H. Estimation and inference in large heterogeneous panels with a multifactor error structure. Econometrica 2006, 74, 967–1012. [Google Scholar] [CrossRef] [Scilit]
  88. Eberhardt, M.; Bond, S. Cross-Section Dependence in Nonstationary Panel Models: A Novel Estimator; Munich Personal RePEc Archive: Munich, Germany, 2009. [Google Scholar]
  89. Pedroni, P. Fully modified OLS for heterogeneous cointegrated panels. In Nonstationary Panels, Panel Cointegration, and Dynamic Panels; Baltagi, B.H., Fomby, T.B., Hill, R.C., Eds.; Emerald Group Publishing Limited: Leeds, UK, 2001. [Google Scholar] [CrossRef] [Scilit]
  90. Tekin, B.; Shahbaz, M. Assessing the impacts of financial development and agriculture, fisheries, and forestry value added on the ecological footprint of BRICS-T nations: B. Tekin and M. Shahbaz. Clean Technol. Environ. Policy 2025, 27, 7277–7296. [Google Scholar] [CrossRef] [Scilit]
  91. Pesaran, M.H.; Yamagata, T. Testing slope homogeneity in large panels. J. Econom. 2008, 142, 50–93. [Google Scholar] [CrossRef] [Scilit]
  92. Ateş, B.; Çaha, H. Türkiye ve BRICS ülkelerinde enerji tüketiminin ekonomik refaha etkisi. Dicle Üniversitesi İktisadi Ve İdari Bilim. Fakültesi Derg. 2023, 13, 1–27. [Google Scholar] [CrossRef] [Scilit]
  93. Sarker, B.K.; Snigdha, S.S.; Ahmed, E.; Karmkar, R.C.; Hossain, M.T.; Mikat, H.; Ahmed, S.; Hossain, F. Geological disposal of radioactive waste and spent nuclear fuel: A long-term solution for nuclear waste management. Environ. Sci. Pollut. Res. 2026, 33, 9528–9540. [Google Scholar] [CrossRef] [Scilit] [PubMed]
  94. Qin, C.; Hassan, H.H.B.; Hussain, Z.; Rakhimova, M.; Ooi, C.K. The Impact of Sustainable Technologies, Urbanization, Human Capital, and Trade Openness on Load Capacity Factor: Evidence from BRICS Countries. Int. J. Energy Econ. Policy 2025, 15, 692. [Google Scholar] [CrossRef] [Scilit]
  95. Sugiharti, L.; Voumik, L.C.; Ghosh, S.; Das, M.K.; Esquivias, M.A.; Rashid, M.; Rahmawati, Y. Impact of tourism, natural resources, urbanization and globalization on load capacity factors in ASEAN Countries: Driscoll Kraay and quantile regression approaches. Environ. Dev. Sustain. 2025, 1–26. [Google Scholar] [CrossRef] [Scilit]
  96. Eberhardt, M.; Teal, F. Productivity Analysis in Global Manufacturing Production; Discussion Paper 515; Department of Economics, University of Oxford: Oxford, UK, 2010. [Google Scholar]
  97. Pedroni, P. Panel cointegration: Asymptotic and finite sample properties of pooled time series tests with an application to the PPP hypothesis. Econom. Theory 2004, 20, 597–625. [Google Scholar] [CrossRef] [Scilit]
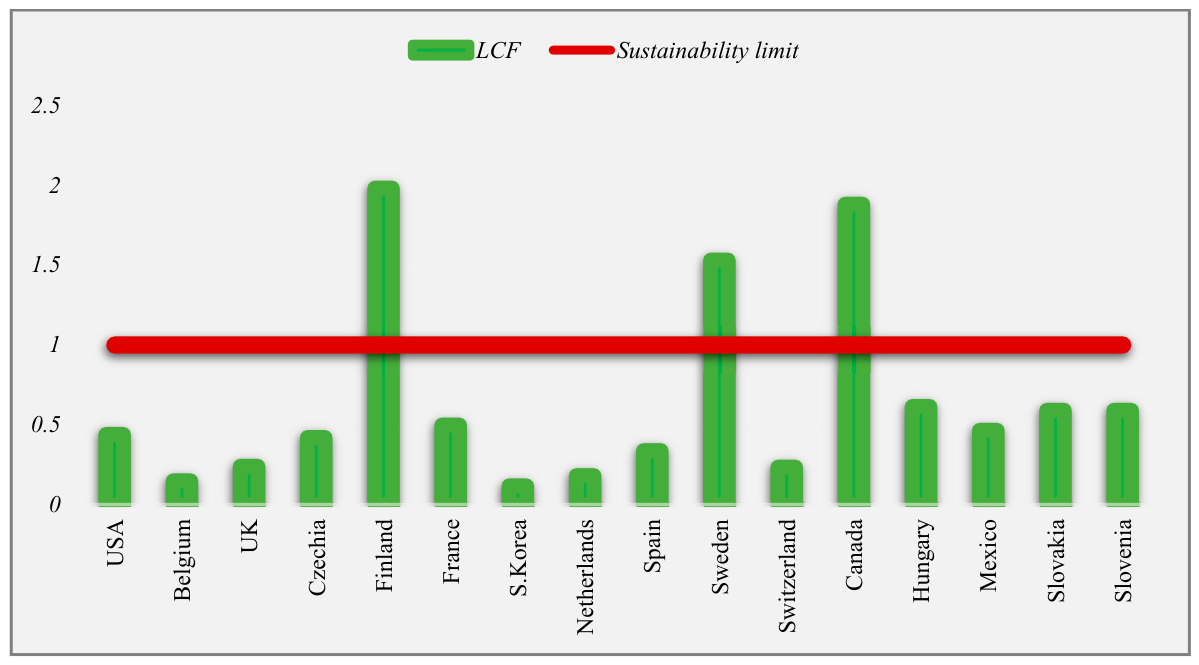
Figure 2. LCF values and sustainability limit for sample countries. Source: [28]. Note: Authors’ compilation.
Sustainability 18 08451 g002
Figure 3. Flow chart of empirical analysis. Notes: Authors’ compilation. Arrows indicate the sequential order of the empirical analysis.
Sustainability 18 08451 g003
Figure 4. Outcomes of MMQR estimation. Note: Authors’ compilation.
Sustainability 18 08451 g004
Table 2. Detailed information about the selected indicators and data sources.
VariablesAbbreviationsMetricsSources
Renewable energy consumptionRENKwh per person[10]
Nuclear energy consumptionNECKwh per person[10]
Load capacity factorLCFBiocapacity/ecological footprint (global hectares per person)[28]
Economic growthGDPGDP per capita (constant 2015 US $)[31]
UrbanizationURBShare of total population[31]
Note: Authors’ compilation.
Table 3. Descriptive statistics.
VariableslnLCFlnNEClnGDPlnRENlnURB
Obs.384384384384384
Mean−0.8078.51110.3128.2594.339
Std. dev.0.8331.1280.5941.2980.156
Min.−2.2474.9039.1024.2383.927
Max.1.34010.06011.41410.4744.587
Note: Authors’ compilation.
Table 4. Multicollinearity and CSD test results.
Panel A: MulticollinearityPanel B: CSD Test
VariablesVIF1/VIFVariablesCD-Testp-Value
lnGDP2.490.402321lnLCF13.656 ***0.000
lnREN1.690.593294lnNEC11.335 ***0.000
lnURB1.610.620195lnGDP47.15 ***0.000
lnNEC1.330.753324lnREN25.464 ***0.000
Mean VIF1.78 lnURB33.474 ***0.000
Breusch–Pagan LM test230 ***0.0000
LM adj. test14.09 ***0.0000
Notes: *** indicates significance at the 1% level. Authors’ compilation.
Table 5. CIPS panel unit root test.
Constant + Trend
VariablesI(0)I(1)Result
lnLCF−3.690 ***−5.966 ***I(0)
lnNEC−3.123 ***−4.765 ***I(0)
lnGDP−2.035−3.808 ***I(1)
lnREN−2.827 **−5.313 ***I(0)
lnURB−1.311−2.953 ***I(1)
Notes: Critical values at 10%: −2.63; 5%: −2.72; and 1%: −2.88; ** and *** indicate significance at the 5% and 1% levels, respectively. Authors’ compilation.
Table 6. Results for the slope homogeneity test of [91].
TestTest Scorep-Value
Δ ~ 10.263 ***0.000
Δ ~ a d j 11.850 ***0.000
Notes: *** indicates significance at the 1% level. Authors’ compilation.
Table 7. Westerlund cointegration test.
Dependent Variable: LLCF
StatisticsValueRobust p-Value
Gt−3.3100.000
Ga−5.9560.378
Pt−14.0330.023
Pa−10.5970.060
Table 8. MMQR results.
Quantiles
VariablesLocationScaleQ0.25Q0.50Q0.75Q0.90Q0.95
lnNEC0.152 ***
(0.023)
0.059 ***
(0.014)
0.093 ***
(0.028)
0.157 ***
(0.024)
0.199 ***
(0.025)
0.245 ***
(0.033)
0.268 ***
(0.036)
lnGDP−1.067 ***
(0.061)
−0.008
(0.038)
−1.059 ***
(0.072)
−1.068 ***
(0.061)
−1.074 ***
(0.067)
−1.081 ***
(0.083)
−1.084 ***
(0.094)
lnREN0.622 ***
(0.026)
−0.012
(0.016)
0.634 ***
(0.031)
0.621 ***
(0.026)
0.612 ***
(0.029)
0.602 ***
(0.036)
0.597 ***
(0.041)
lnURB1.056 ***
(0.194)
0.314 ***
(0.120)
0.747 ***
(0.231)
1.081 ***
(0.195)
1.304 ***
(0.213)
1.544 ***
(0.269)
1.666 ***
(0.298)
Constant−0.813
(0.711)
−1.301 ***
(0.440)
0.466
(0.848)
−0.917
(0.715)
−1.838 **
(0.775)
−2.834 ***
(0.985)
−3.338 ***
(1.088)
Obs.384384384384384384384
Notes: ** and *** indicate significance at the 5% and 1% level. Standard errors are given in parentheses. Authors’ compilation.
Table 9. Dumitrescu–Hurlin causality test results.
Null HypothesisW-Bar StatisticsZ-Bar StatisticsProbabilityDecision
lnNEC → lnLCF3.7870 ***3.57400.0004
lnLCF → lnNEC3.5839 ***3.16790.0015Bidirectional causality
lnGDP → lnLCF5.7355 ***7.47090.0000
lnLCF → lnGDP4.4206 ***4.84120.0000Bidirectional causality
lnREN → lnLCF5.0138 ***6.02750.0000
lnLCF → lnREN2.68811.37620.1688Unidirectional causality
lnURB → lnLCF7.9508 ***11.90150.0000
lnLCF → lnURB2.34510.69520.4900Unidirectional causality
Notes: *** indicates significance at the 1% level. Authors’ compilation.
Table 10. Mediation analysis results (NEC → FF → LCF).
PathCoefficientStd. Errorzp-Value
Total effect (c): lnNEC → lnLCF0.1520.0265.8870
a: lnNEC → lnFF−0.5070.023−22.2260
b: lnFF → lnLCF−0.0050.058−0.0880.93
Direct effect (c’): lnNEC → lnLCF0.150.0393.8070
Indirect effect (a × b)0.0030.030.0880.93
Proportion mediated0.017
Table 11. CCE-MG and AMG long-run estimates.
VariableCCE-MG CoefficientCCE-MG Std. ErrorAMG CoefficientAMG Std. Error
lnNEC0.0160.067−0.020.066
lnGDP−12.89119.566−0.550 **0.215
lnREN0.2242.5850.0090.04
lnURB309.74176.5930.3942.947
Note: ** p < 0.05.
Table 12. DOLS and FMOLS long-run estimates.
VariableDOLS CoefficientDOLS t-StatisticFMOLS CoefficientFMOLS t-Statistic
lnNEC−2.01−7.740.014.4
lnGDP−0.52−19.83−0.69−52.81
lnREN−1.17−13.880.057.18
lnURB2.0390.286.553.47
Table 13. Pedroni panel cointegration test.
sValue
Panel v−0.158
Panel rho−2.142
Panel t−10.56 ***
Group rho−1.099
Group t−14.10 ***
Panel ADF−6.304 ***
Group ADF−7.015 ***
Note: *** p < 0.01.
Table 14. Summary of additional MMQR robustness results—all covariates across specifications.
Panel A: Shortened Period (2005–2020)Panel B: Alternative Quantiles (Q0.10 and Q0.99)
Var.Q0.25Q0.50Q0.75Q0.90Q0.95Var.Q0.10Q0.99
lnNEC0.087 ** (0.037)0.151 *** (0.027)0.181 *** (0.027)0.219 *** (0.033)0.246 *** (0.037)lnNEC0.056 * (0.034)0.405 *** (0.090)
lnGDP−1.190 *** (0.096)−1.189 *** (0.071)−1.189 *** (0.071)−1.189 *** (0.085)−1.189 *** (0.100)lnGDP−1.054 *** (0.088)−1.104 *** (0.171)
lnREN0.759 *** (0.046)0.744 *** (0.034)0.738 *** (0.034)0.729 *** (0.041)0.722 *** (0.048)lnREN0.642 *** (0.038)0.569 *** (0.076)
lnURB0.921 *** (0.294)1.246 *** (0.215)1.397 *** (0.217)1.596 *** (0.261)1.730 *** (0.302)lnURB0.551 ** (0.277)2.386 *** (0.632)
Panel C: Dependent variable—lnEFPanel D: Dependent variable—lnBIO
Var.Q0.25Q0.50Q0.75Q0.90Q0.95Var.Q0.25Q0.50Q0.75Q0.90Q0.95
lnNEC0.144 *** (0.012)0.127 *** (0.012)0.100 *** (0.016)0.082 *** (0.020)0.068 *** (0.023)lnNEC0.267 *** (0.031)0.274 *** (0.031)0.282 *** (0.041)0.287 *** (0.050)0.288 *** (0.052)
lnGDP0.116 *** (0.036)0.181 *** (0.036)0.283 *** (0.046)0.353 *** (0.058)0.404 *** (0.068)lnGDP−1.020 *** (0.086)−0.881 *** (0.086)−0.724 *** (0.113)−0.624 *** (0.135)−0.599 *** (0.143)
lnREN−0.030 *** (0.011)−0.022 ** (0.011)−0.010 (0.014)−0.001 (0.018)0.005 (0.021)lnREN0.613 *** (0.032)0.603 *** (0.032)0.592 *** (0.042)0.585 *** (0.051)0.583 *** (0.053)
lnURB0.266 *** (0.100)0.168 * (0.098)0.013 (0.128)−0.092 (0.161)−0.170 (0.190)lnURB0.988 *** (0.238)1.180 *** (0.237)1.398 *** (0.311)1.536 *** (0.378)1.570 *** (0.397)
Notes: Standard errors in parentheses. *** p < 0.01, ** p < 0.05, * p < 0.10.
Table 15. Leave-one-out analysis—lnNEC coefficients across quantiles when each country is sequentially excluded.
Excluded CountryQ0.25Q0.50Q0.75Q0.90Q0.95
United States0.164 ***0.205 ***0.249 ***0.292 ***0.322 ***
Belgium0.084 ***0.157 ***0.216 ***0.281 ***0.309 ***
United Kingdom0.054 **0.121 ***0.178 ***0.204 ***0.226 ***
Czech Republic0.060 ***0.154 ***0.220 ***0.286 ***0.318 ***
Finland0.127 ***0.170 ***0.200 ***0.229 ***0.245 ***
France0.104 ***0.129 ***0.140 ***0.156 ***0.163 ***
South Korea0.114 ***0.185 ***0.237 ***0.294 ***0.316 ***
Netherlands0.152 ***0.172 ***0.186 ***0.202 ***0.208 ***
Spain0.104 ***0.164 ***0.209 ***0.260 ***0.282 ***
Sweden0.087 ***0.150 ***0.192 ***0.243 ***0.264 ***
Switzerland0.052 **0.137 ***0.204 ***0.268 ***0.292 ***
Canada0.089 ***0.136 ***0.163 ***0.205 ***0.222 ***
Hungary0.093 ***0.157 ***0.200 ***0.260 ***0.283 ***
Mexico0.095 ***0.169 ***0.218 ***0.273 ***0.297 ***
Slovakia0.110 ***0.164 ***0.196 ***0.233 ***0.257 ***
Slovenia0.089 ***0.135 ***0.177 ***0.227 ***0.254 ***
Range (Min–Max)0.052–0.1640.121–0.2050.140–0.2490.156–0.2940.163–0.322
Mean0.0990.1590.20.2470.269
Notes: Each row reports the lnNEC coefficient from the MMQR model re-estimated after removing the indicated country. *** p < 0.01, ** p < 0.05.
Table 16. Year-fixed-effects MMQR estimates—main covariates.
VariableQ0.25Q0.50Q0.75Q0.90Q0.95
lnNEC0.072 ***0.136 ***0.190 ***0.237 ***0.268 ***
−0.027−0.022−0.023−0.028−0.032
lnGDP−1.071 ***−1.085 ***−1.096 ***−1.106 ***−1.112 ***
−0.067−0.057−0.062−0.074−0.085
lnREN0.674 ***0.663 ***0.653 ***0.645 ***0.639 ***
−0.031−0.026−0.028−0.034−0.039
lnURB1.015 ***1.145 ***1.256 ***1.351 ***1.413 ***
−0.229−0.194−0.21−0.251−0.286
Notes: The model includes 23 year dummies (coefficients not reported). Standard errors in parentheses. *** denotes statistical significance at the 1% level. Estimation is carried out with country-level clustered standard errors.
Table 17. LCC test—quantile-specific estimates with quadratic GDP.
Quantile l n g d p c (S.E.) l n g d p c 2 (S.E.)Turning Point (lnGDP)
Q0.25–1.102 *** (0.082)0.122 (0.088)
Q0.50–1.039 *** (0.070)0.187 ** (0.075)13.09
Q0.75–1.003 *** (0.075)0.224 *** (0.081)12.55
Q0.90–0.949 *** (0.097)0.281 *** (0.105)12
Q0.95–0.924 *** (0.109)0.306 ** (0.118)11.82
Note: *** p < 0.01, ** p < 0.05.
Disclaimer/Publisher’s Note: The statements, opinions and data contained in all publications are solely those of the individual author(s) and contributor(s) and not of MDPI and/or the editor(s). MDPI and/or the editor(s) disclaim responsibility for any injury to people or property resulting from any ideas, methods, instructions or products referred to in the content.