4.1. Prediction Power
The predictive analysis reveals that entrepreneurial ecosystem conditions are strong determinants of inclusive growth outcomes across 37 countries during the period 2020–2024. The results in
Table 1 show that the NES indicators predict SDG 8 (Decent Work) and SDG 9 (Innovation and Infrastructure) with high accuracy, as the XGBoost model explains 63% and 70% of the cross-country variance, respectively, while maintaining low prediction errors (NRMSE = 5.0% and 5.3%). In contrast, predictive performance for SDG 10 (Reduced Inequality) is weaker (R
2 = 0.39; NRMSE = 7.5%), consistent with the understanding that inequality is largely shaped by redistributive and institutional mechanisms beyond the entrepreneurial ecosystem framework.
Across all three goals, XGBoost consistently outperforms the linear Elastic Net model, underscoring the importance of nonlinearities and complementarities among ecosystem pillars. These findings suggest that the impact of individual conditions—such as finance or education—depends on their interaction with others; for example, financial depth contributes to stronger innovation only when supported by effective education systems and adequate infrastructure. Such interdependencies are better captured by nonlinear machine-learning models than by traditional linear approaches.
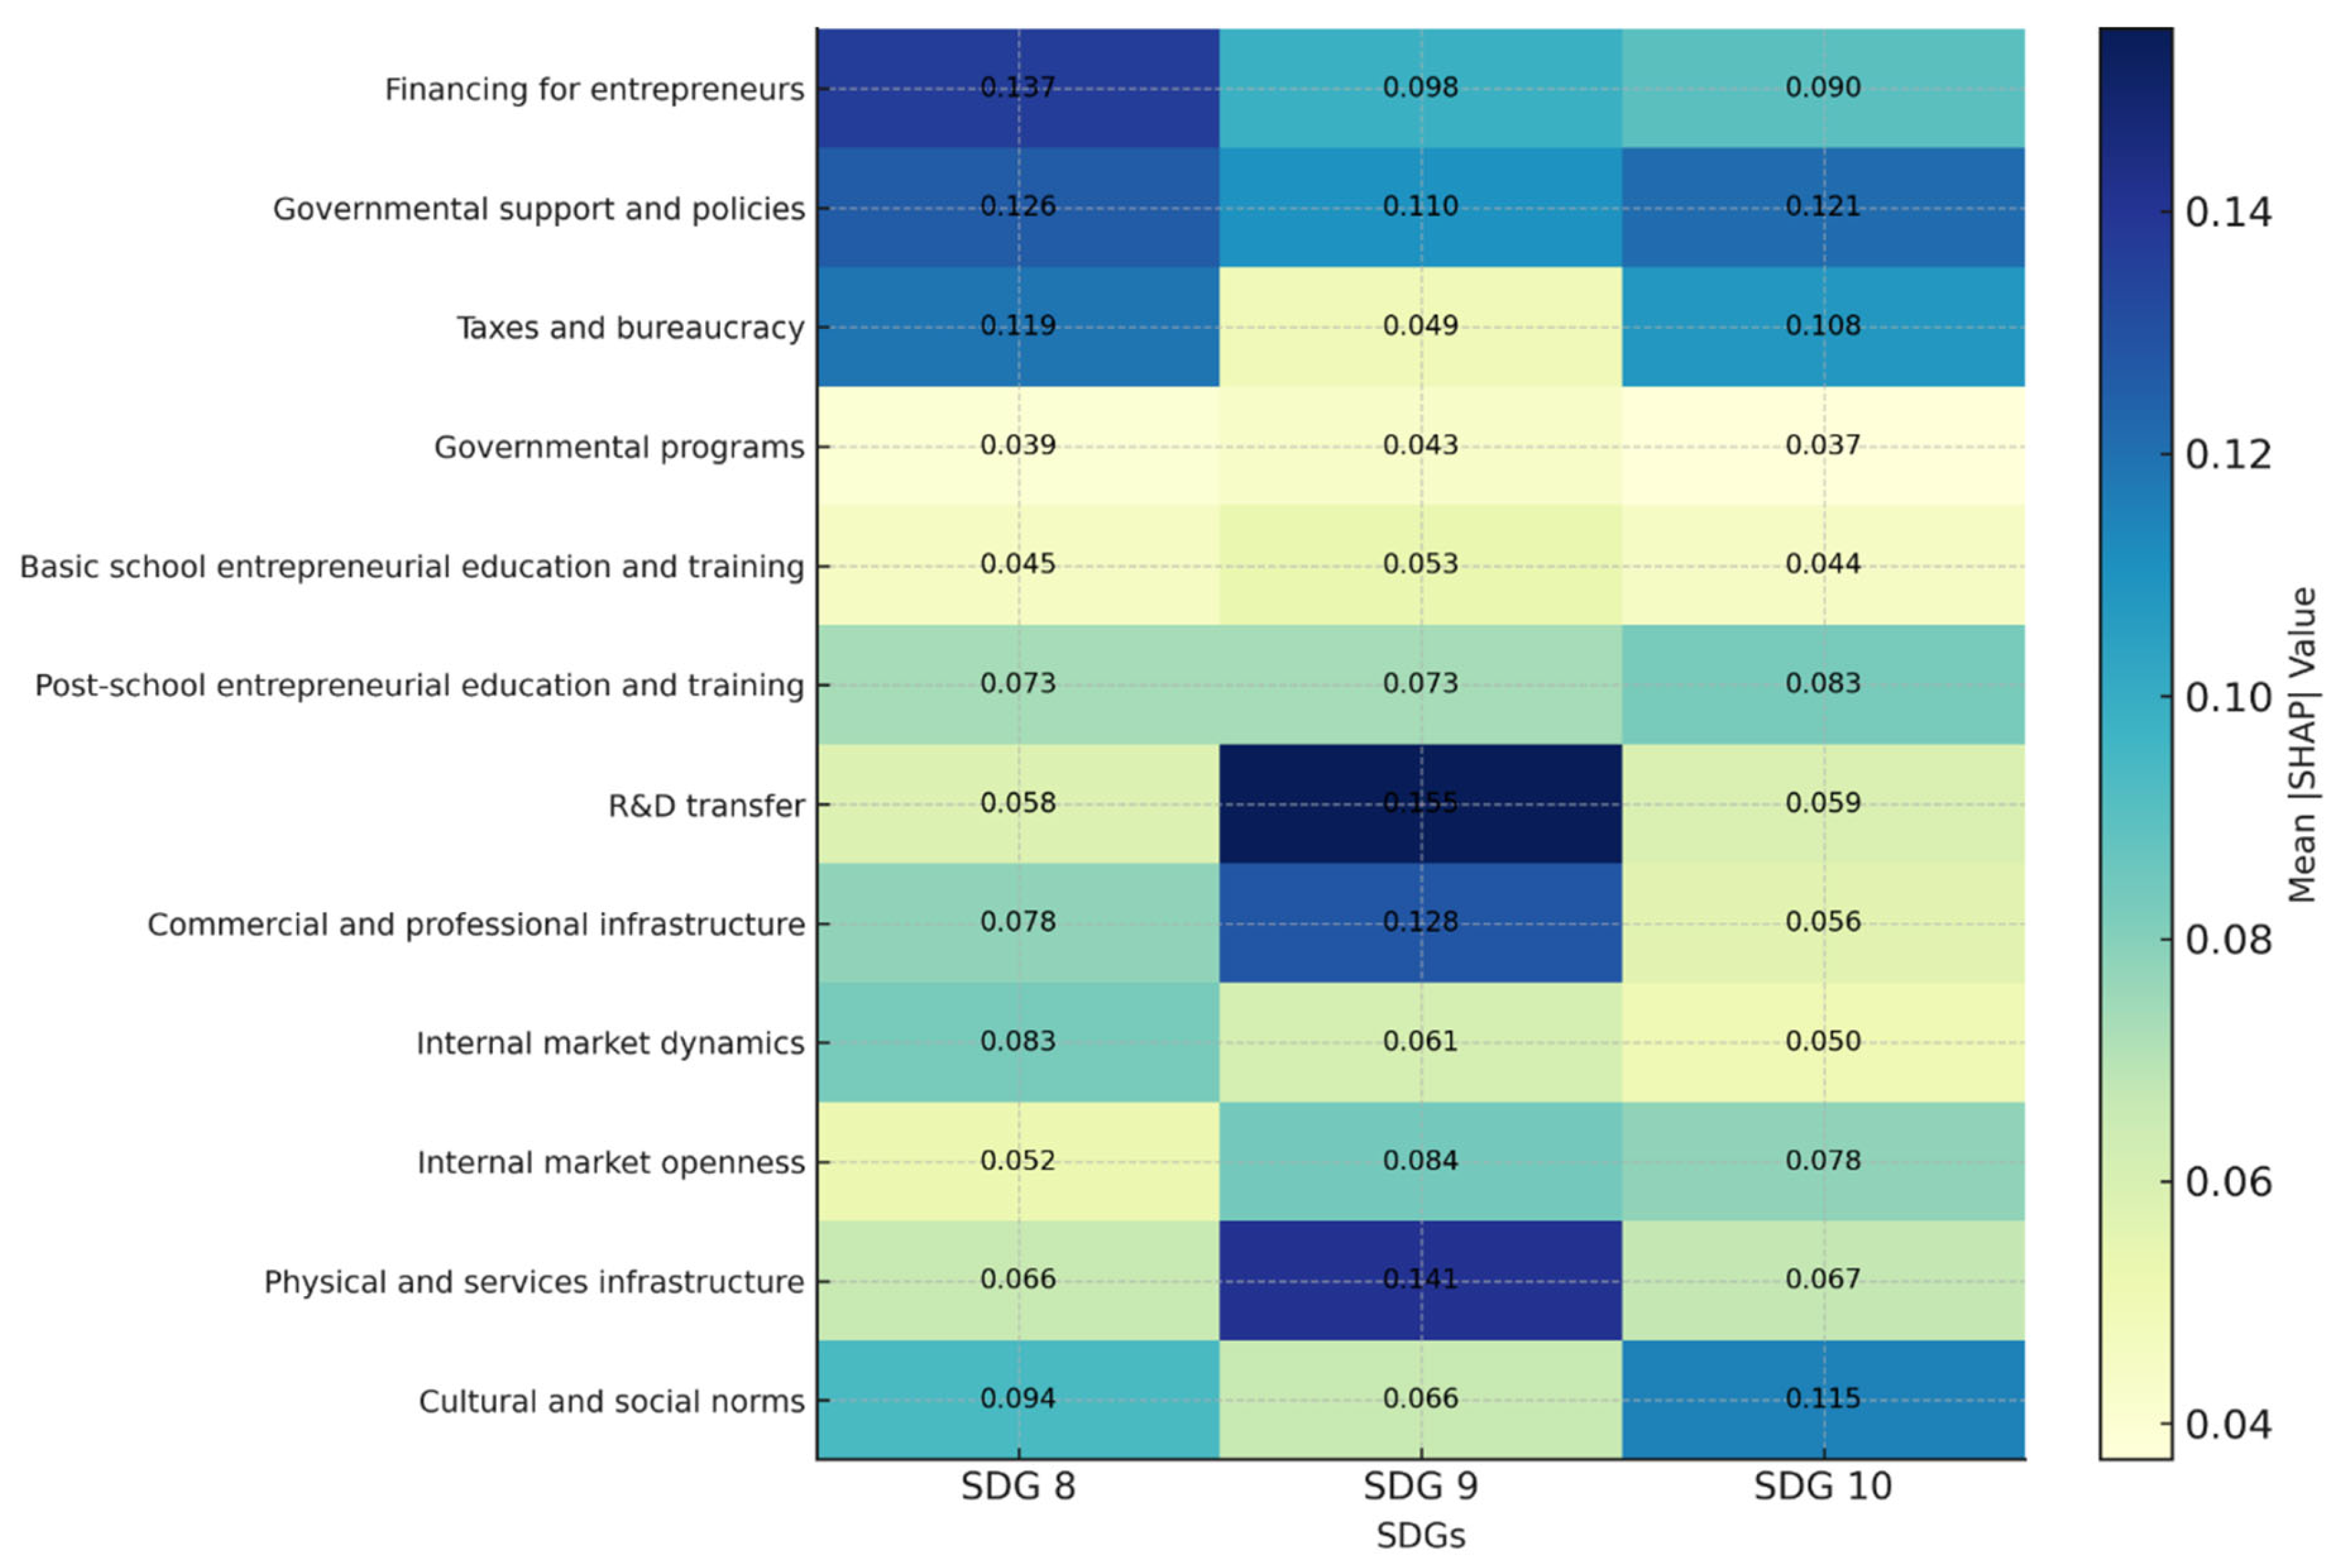
In contrast, the weakest predictors across all SDGs reveal areas where entrepreneurial ecosystems exert limited influence. As shown in
Figure 3, government programmes and basic school entrepreneurial education consistently exhibit the lowest SHAP values, indicating minimal explanatory power for the outcomes of SDG 8, SDG 9, or SDG 10. This pattern suggests that while targeted initiatives and early-stage entrepreneurial curricula may contribute to awareness, they are insufficient drivers of systemic progress in employment, innovation, or inequality. Their weak and uniform influence across SDGs implies that these factors operate more as supportive background conditions rather than active levers of inclusive development. Strengthening these domains may therefore require deeper structural reforms rather than isolated expansion of training or government initiatives.
Together, these results suggest that progress in employment and innovation depends on the strength and interaction of multiple ecosystem pillars, while inequality is shaped more by broader institutional and redistributive forces. Notably, elements such as government programmes and basic entrepreneurial education appear too weak to drive meaningful change on their own, emphasizing the need for more integrated, system-wide approaches to achieve truly inclusive development.
4.2. Forecasting and Scenario Analysis
Under the linear trend extrapolation specified in Equation (6), both SDG 8, and SDG 9 are projected to improve steadily through to 2030, albeit with notable variation across countries, as reported in
Table 2. These projections reinforce the earlier findings, indicating that innovation outcomes (SDG 9) are considerably more responsive to incremental enhancements in entrepreneurial ecosystem conditions than employment outcomes (SDG 8). Countries such as Canada, Austria, and South Korea display pronounced gains in SDG 9, reflecting the compounding effects of strong R&D transfer and infrastructural progress. In contrast, economies such as Brazil and Morocco show only modest improvements, suggesting persistent structural bottlenecks that limit the translation of ecosystem dynamics into employment and innovation gains.
: ∈ {SDG 8, SDG 9}
: The Extrapolated Score for NES indicator in country for the prediction year (2025 ≤ t ≤ 2030), used as input for the SDG prediction model.
: The Observed Score for NES indicator in country in the first observation year (2024).
: The Observed Score for NES indicator in country in the last observation year (2024).
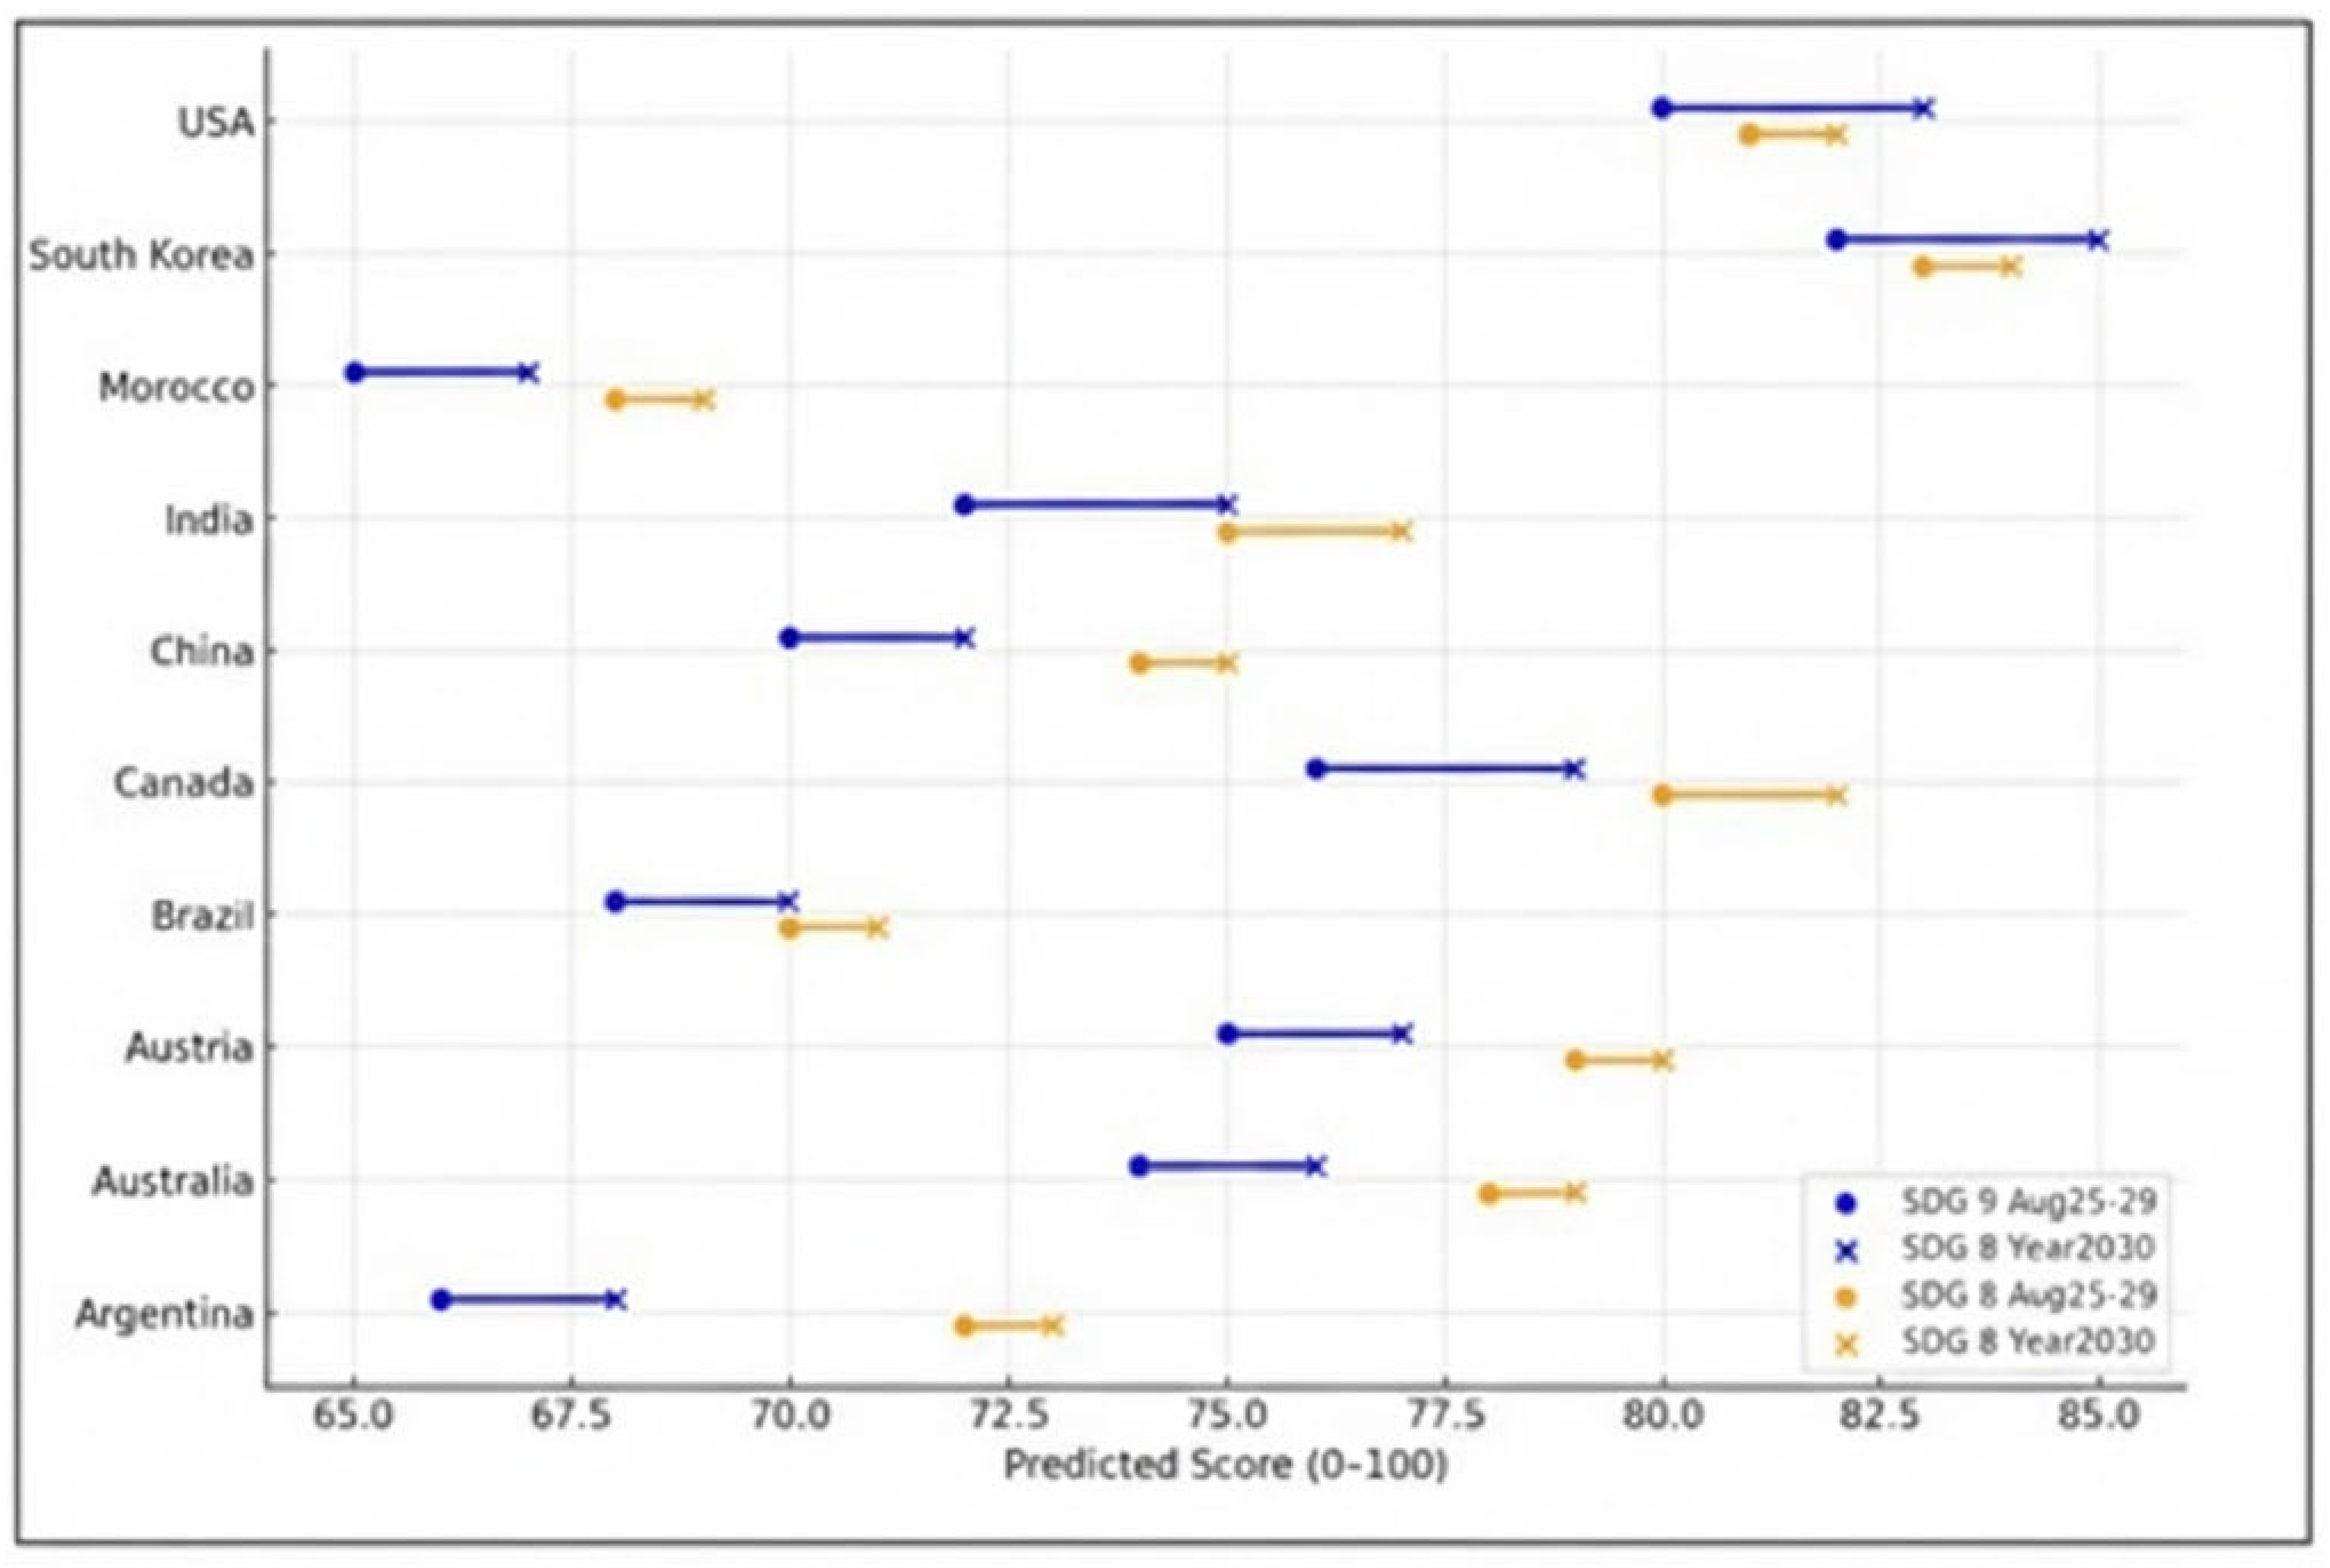
The comparison of the 2025–2029 averages with the 2030 baseline forecasts reveals clear patterns of uneven progress across countries, with innovation-related outcomes showing stronger momentum than employment gains. As shown in
Figure 4, the slope chart effectively captures the magnitude and direction of these changes, illustrating that SDG 9 generally follows a steeper upward trajectory than SDG 8. For clarity, only a representative subset of countries is displayed, since including all economies would obscure cross-country trends. Taken together,
Table 2 and
Figure 4 indicate that while both decent work and innovation outcomes advance over time, the most pronounced gains occur in SDG 9, thereby emphasizing the need for sustained investment in entrepreneurial ecosystems to achieve the 2030 Agenda targets.
To deepen this analysis, we designed a set of policy shock scenarios to test how targeted interventions in specific entrepreneurial ecosystem conditions could alter the baseline forecasts using the scenario shock adjustment in Equation (7). The scenarios were defined in line with theoretical expectations and prior literature:
Scenario A (Finance-led): +5 points to Financing for Entrepreneurs, Governmental Support & Policies, and Taxes and bureaucracy. This represents policies emphasizing access to capital, regulatory support, and advanced skills.
Scenario B (Innovation-led): +5 points to R&D Transfer, Commercial & Professional Infrastructure, and Physical Infrastructure & Services. This reflects innovation-oriented strategies focused on knowledge transfer and infrastructure capacity.
Scenario C (Balanced): +3 points applied equally to all 12 NES indicators, simulating a broad-based but less intensive reform package.
: The Predicted SDG Score for country , for outcome (SDG 8 or SDG 9), in year , resulting from the policy shock.
: The specific trained XGBoost model for SDG .
: The new, modified score for NES indicator in country for year under the policy intervention. This input is fed into the XGBoost model.
: The Baseline Score calculated using the Linear Trend Extrapolation we defined. This serves as the starting point for the shock.
: The specific NES indicator being targeted by policy intervention.
: The magnitude of the policy shock.
Before examining the policy shock scenarios, it is important to establish the reliability of the forecasting models.
Table 3 reports validation results for SDG 8 and SDG 9 using grouped cross-validation and a back-testing strategy (train 2020–23 → test 2024). The models achieve strong predictive accuracy for SDG 9 (R
2 around 0.63–0.66, NRMSE ≈ 5%), while performance for SDG 8 is weaker (R
2 ≈ 0.47–0.51, NRMSE ≈ 6%). This confirms the robustness of the forecasting approach.
The logic behind these experiments was to compare targeted versus comprehensive policy interventions, and to identify which levers generate the strongest improvements in dimensions of inclusive development. The models were re-estimated using the same XGBoost forecasting framework as in the baseline to ensure comparability.
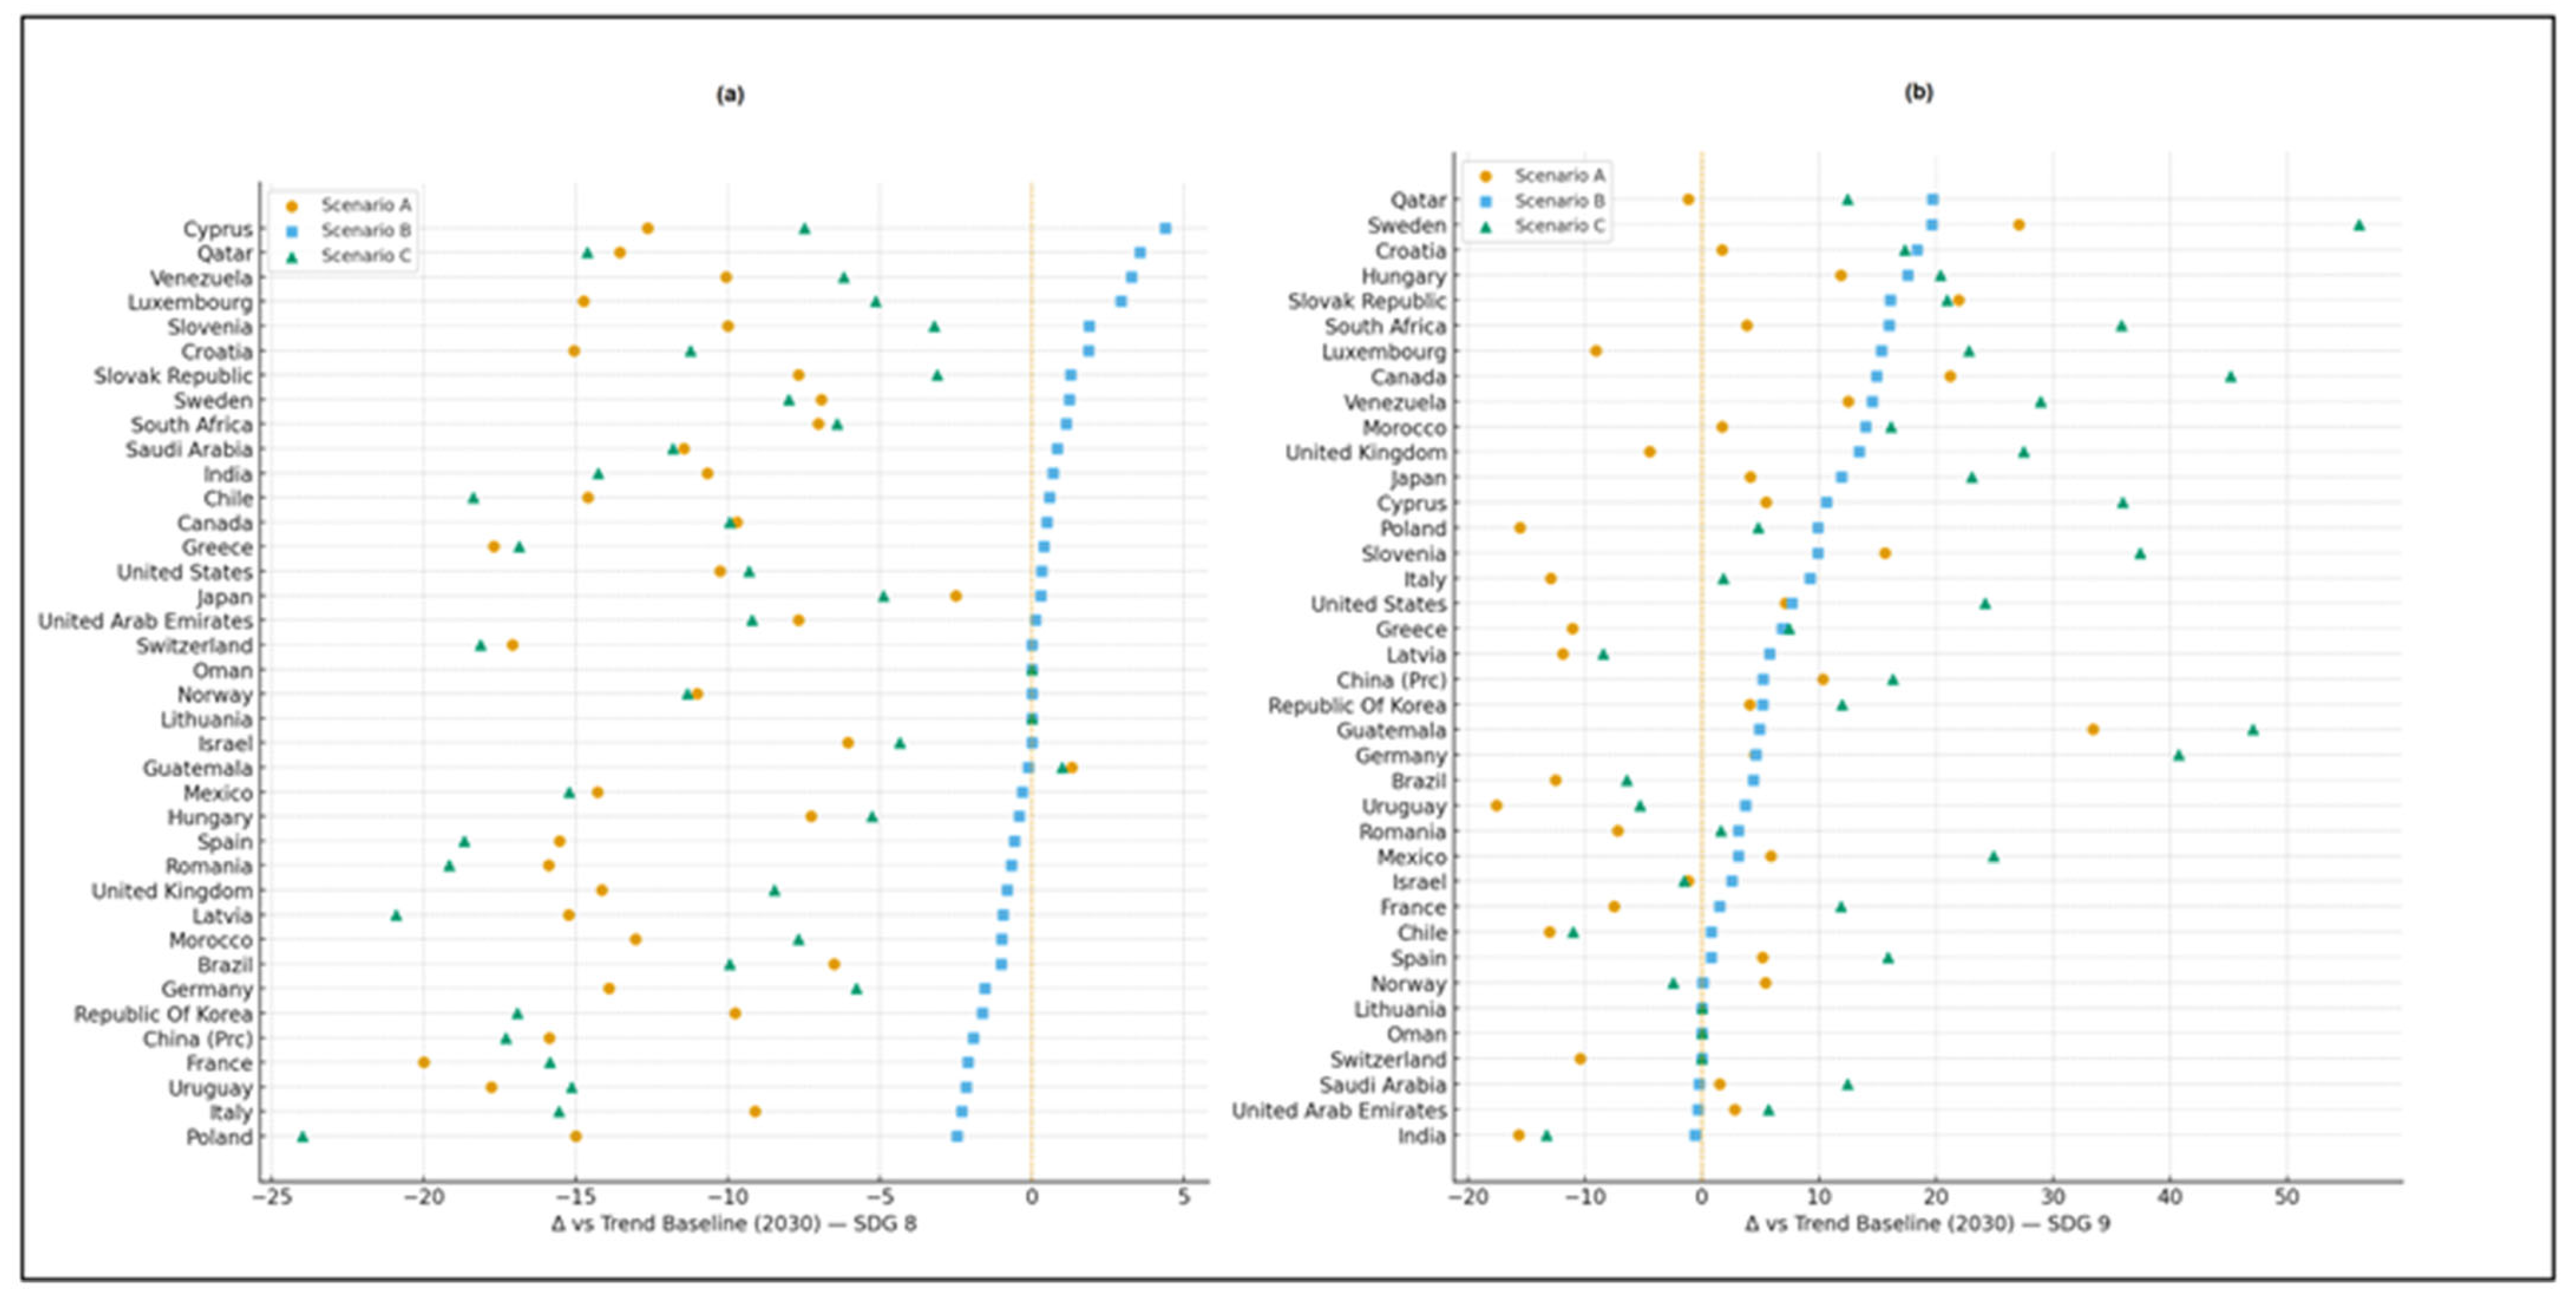
Table 4 shows a clear divergence across strategies. Scenario B (Innovation-led) delivers the largest and most consistent gains for SDG 9 (≈+8 points by 2030 on average), confirming that innovation outcomes are particularly sensitive to R&D and infrastructure levers. Scenario A (Finance-led) produces modest improvements in SDG 9 (+1.5 by 2030) but mixed effects on SDG 8, with some countries experiencing declines due to nonlinear interactions between finance, regulation, and other pillars. Finally, Scenario C (Balanced) produces the largest overall increases in SDG 9 (+15.5 points by 2030). However, it is associated with substantial average decline in SDG 8 (−11 points), reflecting potential trade-offs when all ecosystem pillars are moved simultaneously.
At the country-level
Figure 5 underscores these patterns and reveals important heterogeneity. Under Scenario B, countries such as Croatia, Poland, and South Africa emerge as strong beneficiaries, registering double-digit gains in SDG 9 by 2030. By contrast, Scenario A shows that finance-oriented reforms do not yield broad employment gains; in fact, the United States, China, and Brazil experience declines in SDG 8 despite small boosts in SDG 9, highlighting nonlinear trade-offs in the ecosystem. Scenario C raises SDG 9 sharply in many European economies (e.g., Sweden and Germany, with projected gains of over +40 points by 2030), but SDG 8 simultaneously falls, illustrating that balanced reforms may shift benefits toward innovation capacity at the expense of employment inclusiveness.
Some individual cases stand out. Guatemala and Venezuela, for example, achieve remarkable improvements in SDG 9 across scenarios (often exceeding +30 points), suggesting that even relatively weaker ecosystems can achieve outsized innovation gains if the right levers are targeted. Conversely, Uruguay shows modest improvements across scenarios, reinforcing that well-performing ecosystems may yield only incremental benefits from additional shocks.
Together, the baseline and scenario results provide an answer to the second research question, while current trajectories already point to steady progress, targeted innovation-driven reforms (Scenario B) are the most effective in accelerating SDG 9, whereas employment outcomes (SDG 8) remain harder to shift and may require complementary labour market or redistributive policies beyond the NES framework. These findings highlight both the potential and the limits of entrepreneurial ecosystems in shaping inclusive development, reinforcing the central insight from our first research question that innovation is more directly ecosystem-driven than employment.
To assess whether the scenario findings are sensitive to the choice of forecasting algorithm, we re-estimated the models using Random Forest regression as a robustness check. Validation results are reported in
Table 5. While Random Forests performed less consistently across countries under grouped cross-validation (R
2 values close to zero), back-testing on the temporal split yielded stronger results, particularly for SDG 9 (R
2 = 0.77, NRMSE = 11.5). Importantly, the direction of effects remained consistent with the XGBoost analysis: innovation outcomes (SDG 9) are more predictable and responsive to ecosystem conditions than employment outcomes (SDG 8). These findings confirm that the main scenario conclusions do not depend on a single modelling approach.
4.3. Causality Analysis
The final analytical step bridges predictive insight with causal rigour, specifically addressing RQ3: identifying which entrepreneurial ecosystem conditions exert the strongest causal influence on inclusive development outcomes (SDGs 8, 9, and 10). To estimate the debiased causal effects of each NES indicator, the study applies the Double ML framework, leveraging its ability to overcome high-dimensional confounding and multicollinearity, see Equation (8). Subsequently, SHAP values derived from the predictive analysis are incorporated to assess the robustness and interpretability of these causal findings. This integration provides a comprehensive view, identifying both the magnitude of the causal effects and the practical relevance of each policy lever.
As shown in
Table 6, the combined Double ML–SHAP analysis highlights three consistently high-impact levers (financing for entrepreneurs, R&D transfer, and physical and services infrastructure), each demonstrating strong causal effects reinforced by high predictive importance across all SDGs. These represent the structural pillars of inclusive, innovation-driven growth. In contrast, governmental programmes show positive causal effects but only modest predictive relevance, implying effective but limited reach, while governmental support and policies and cultural and social norms exhibit high SHAP values but negative causal impacts, signalling inefficiencies and institutional rigidity.
: Debiased causal effect of condition on SDG .
SDG outcome in country , year .
: value of NES ecosystem indicator , in year for country .
: Denotes the predicted SDG outcome based on all NES indicators and country–year fixed effects.
: Denotes the predicted value of ecosystem condition given all control conditions.
Further validation is presented in
Table 7, where rank correlations between Double ML and SHAP rankings are consistently positive (0.67 for SDG 8, 0.82 for SDG 9, and 0.58 for SDG 10) indicating strong alignment between causal influence and predictive importance. The robustness matrix confirms that financing, R&D, and infrastructure show consistent convergence across all SDGs, whereas institutional and cultural domains remain misaligned, limiting their effective causal influence.
The consistent positive rank correlations confirm that the key drivers identified by Double ML are not artefacts of the model structure but genuinely correspond to high-importance features in the predictive space. Financing, R&D transfer, and infrastructure emerge as robust, causally validated policy levers across the inclusive development spectrum, while institutional and cultural domains remain the main barriers limiting causal effectiveness despite their high SHAP relevance.