Author Contributions
Conceptualization, K.R.-P., S.V.-A. and F.V.-A.; methodology, K.R.-P., S.V.-A., J.M.A.-F. and L.A.-P.; software, F.V.-A.; validation, K.R.-P., S.V.-A., F.V.-A., B.P.-G. and J.R.-P.; formal analysis, K.R.-P., S.V.-A., F.V.-A. and J.M.A.-F.; investigation, K.R.-P., S.V.-A., J.R.-P., K.P.-A., D.B.-M. and W.L.T.T.; resources, B.P.-G., D.B.-M. and W.L.T.T.; data curation, K.R.-P., S.V.-A., F.V.-A. and K.P.-A.; writing—original draft preparation, K.R.-P., S.V.-A. and F.V.-A.; writing—review and editing, K.R.-P., S.V.-A., F.V.-A., J.M.A.-F., J.R.-P., L.A.-P., K.P.-A., D.B.-M., W.L.T.T. and B.P.-G.; visualization, F.V.-A. and K.R.-P.; supervision, B.P.-G. and F.V.-A.; project administration, B.P.-G., K.R.-P. and S.V.-A. All authors have read and agreed to the published version of the manuscript.
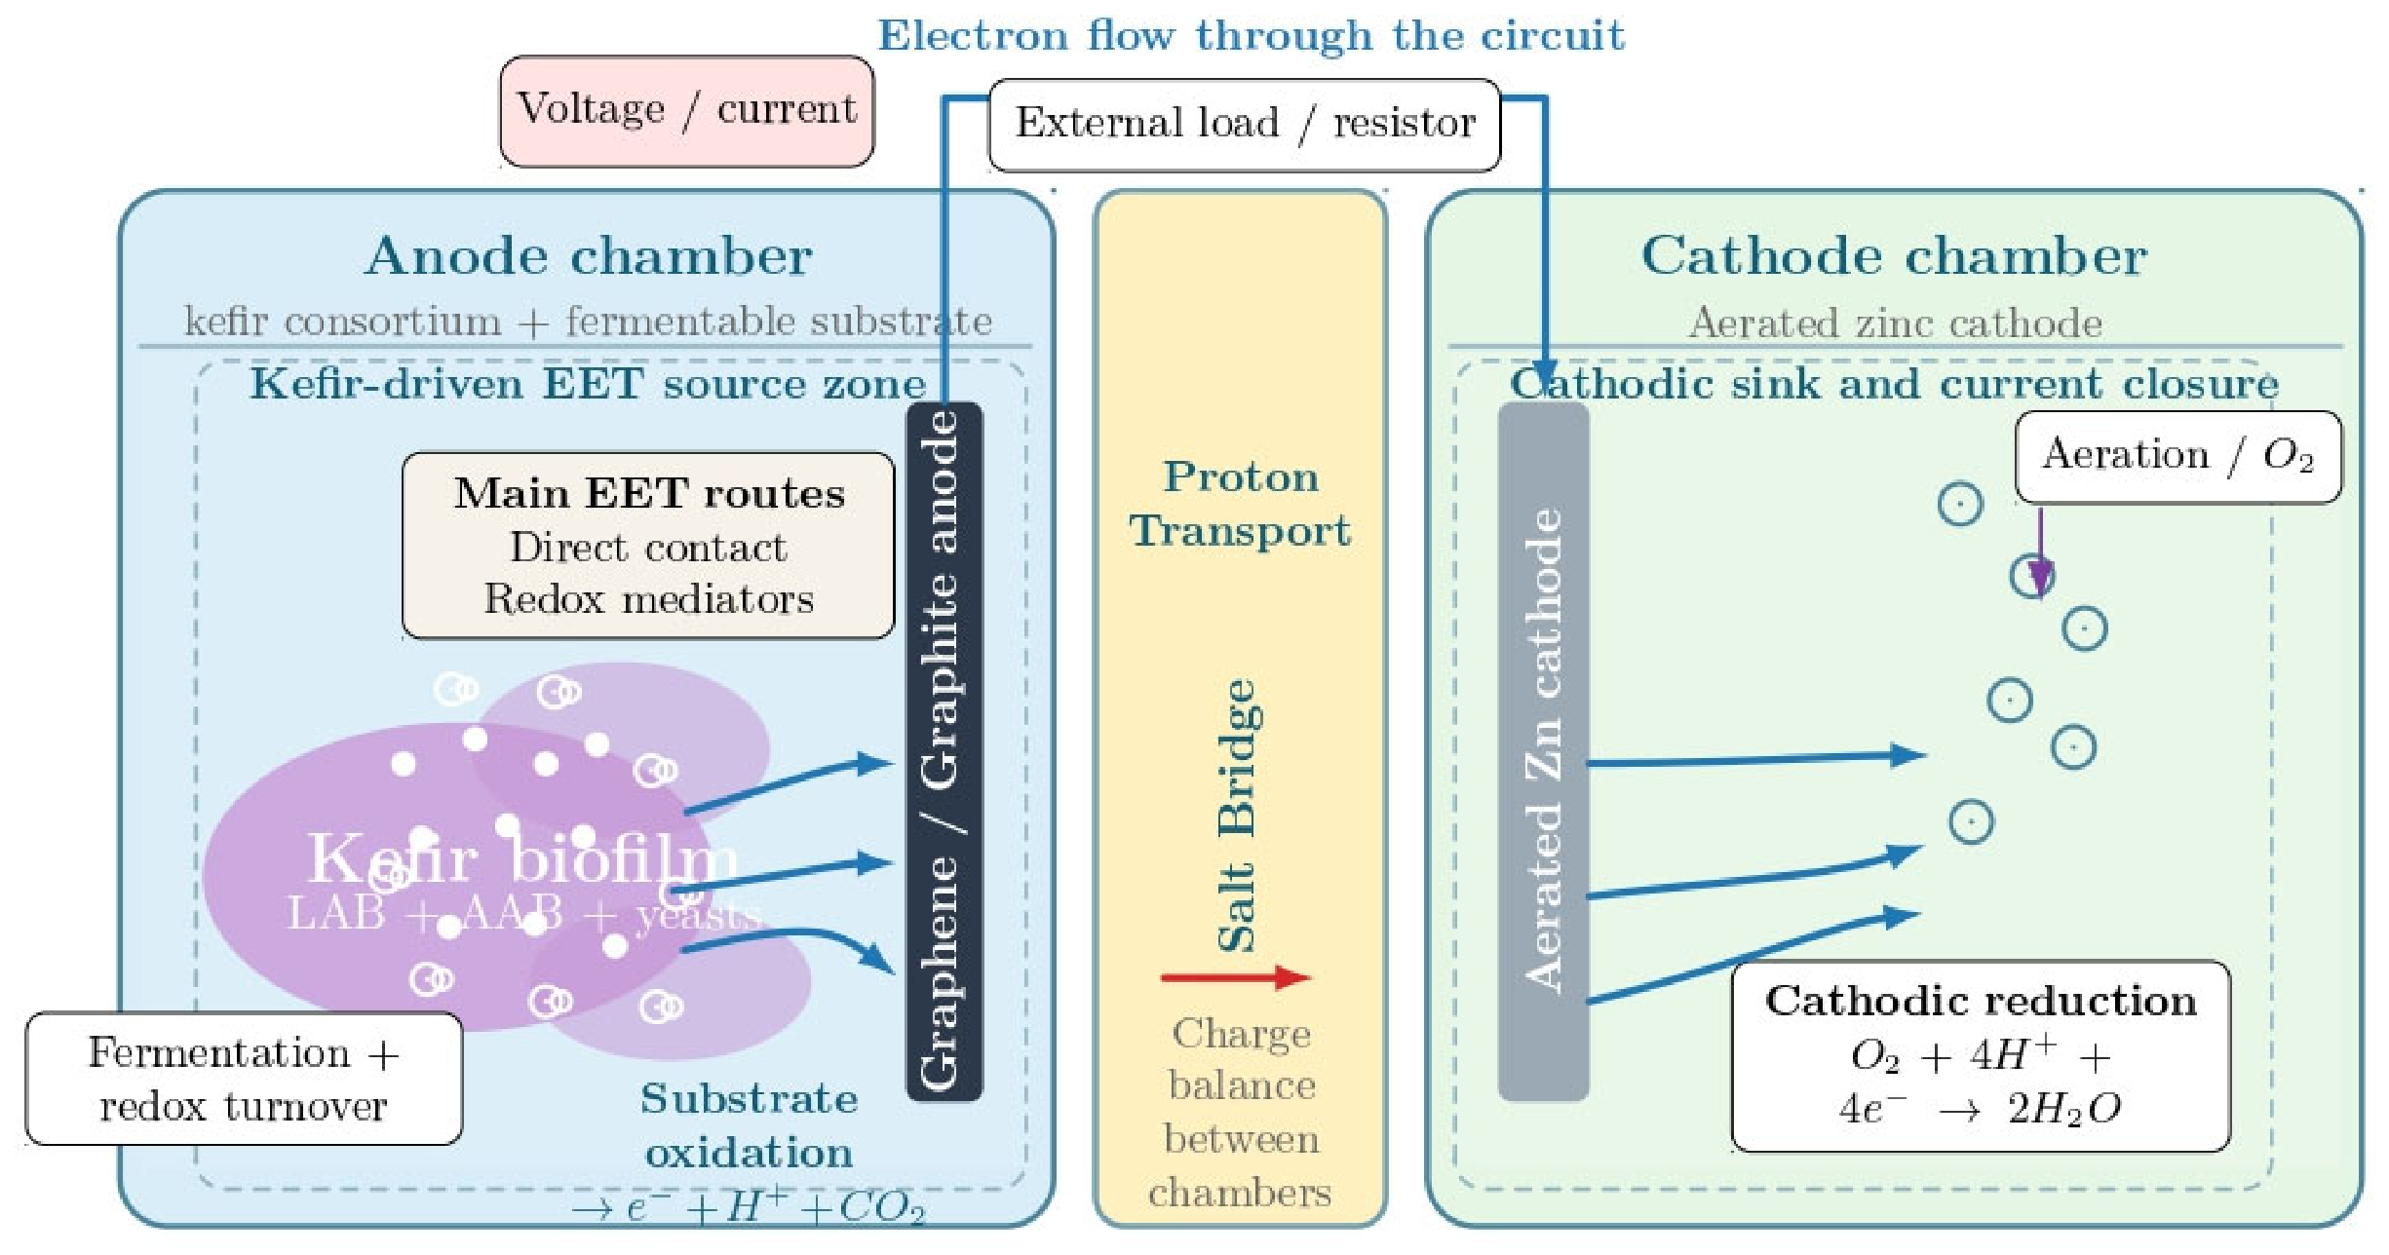
Figure 1.
Conceptual scheme of the reactor configuration used in this study. The anaerobic anode chamber contained the kefir consortium and fermentable substrate, with either graphene or graphite as the anodic material. The diagram illustrates putative electron-transfer and charge-balance pathways under the tested configuration, but it should not be interpreted as direct mechanistic evidence of extracellular electron transfer. Voltage and current were monitored under an external LED-connected circuit, protons migrated through an in-house salt bridge, and the cathode consisted of a zinc electrode operated under passive exposure to atmospheric oxygen.
Figure 1.
Conceptual scheme of the reactor configuration used in this study. The anaerobic anode chamber contained the kefir consortium and fermentable substrate, with either graphene or graphite as the anodic material. The diagram illustrates putative electron-transfer and charge-balance pathways under the tested configuration, but it should not be interpreted as direct mechanistic evidence of extracellular electron transfer. Voltage and current were monitored under an external LED-connected circuit, protons migrated through an in-house salt bridge, and the cathode consisted of a zinc electrode operated under passive exposure to atmospheric oxygen.
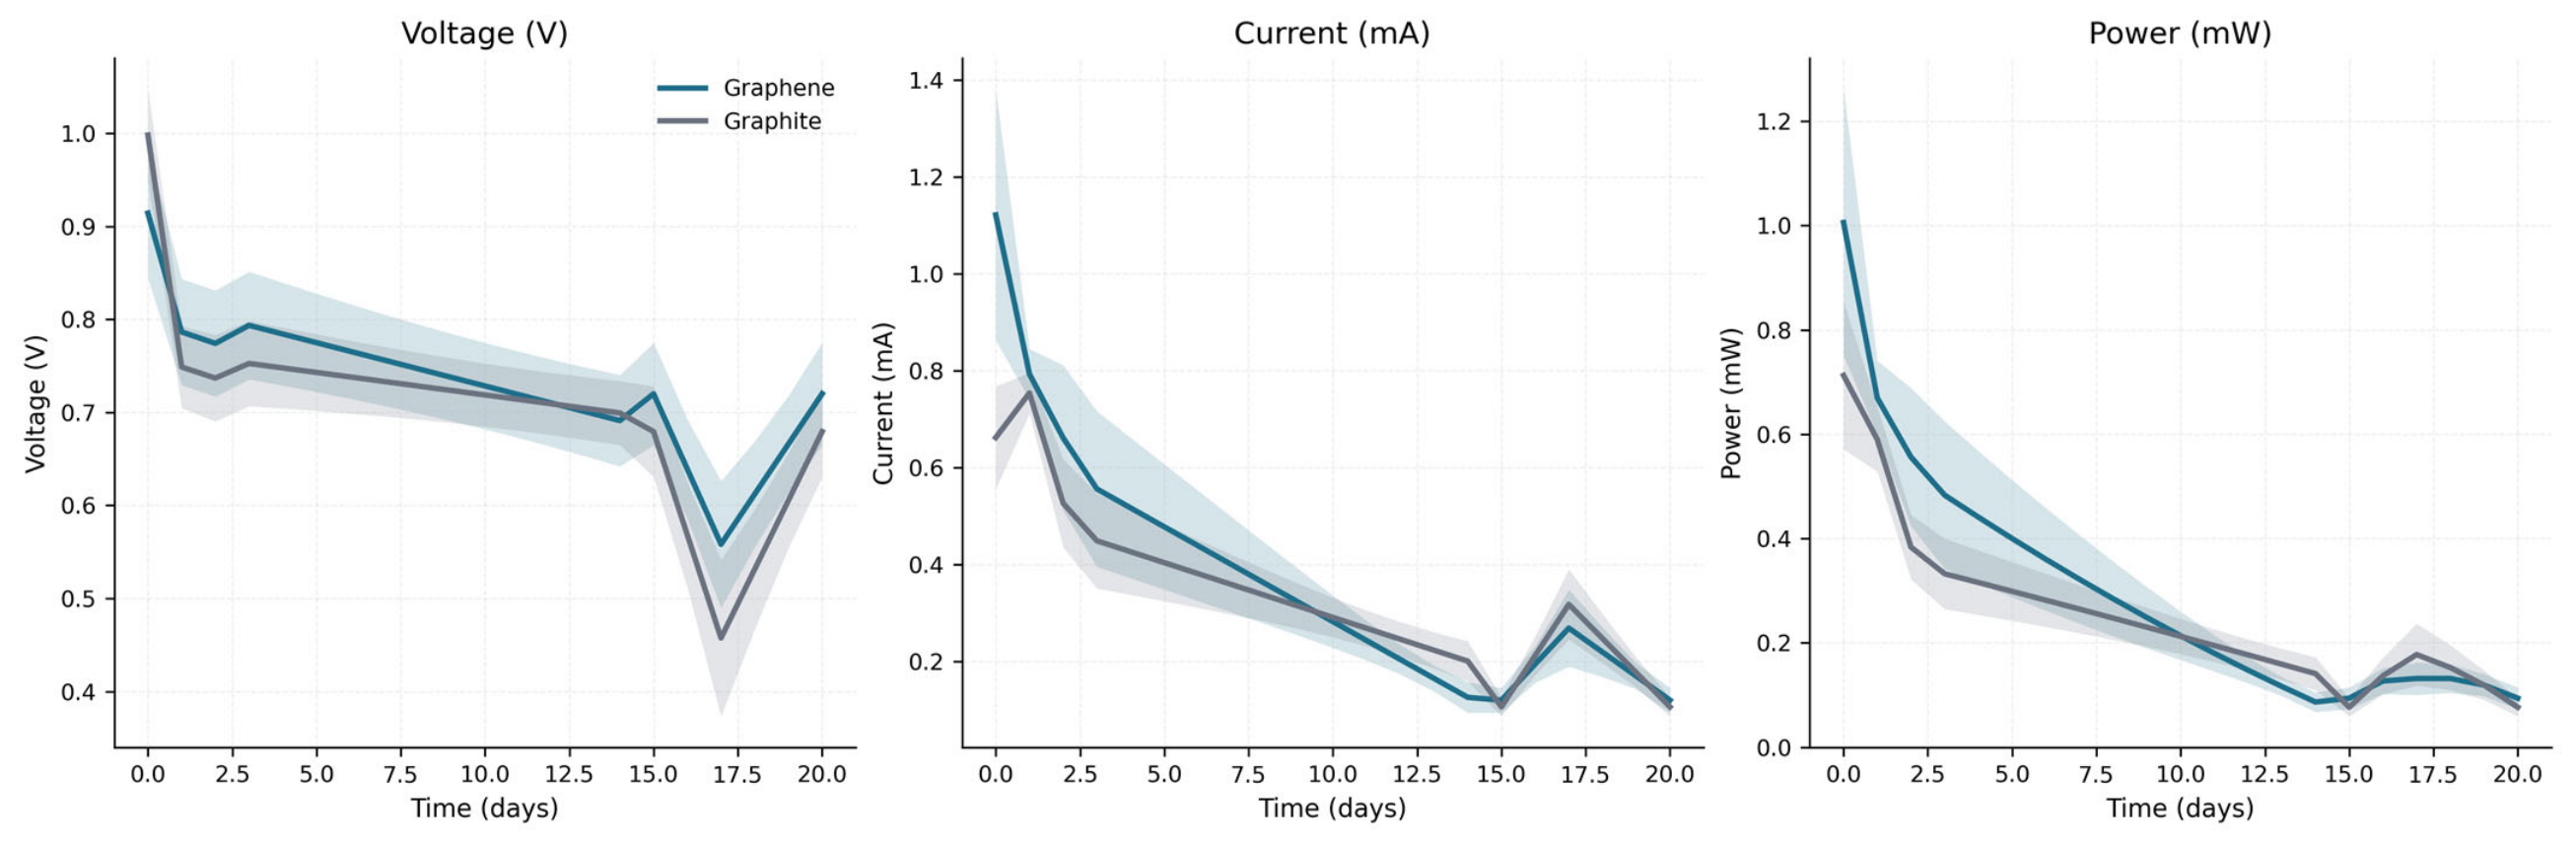
Figure 2.
Temporal trajectories of voltage, current, and power by anode material in kefir-inoculated microbial fuel cells. Lines represent the mean response at each time point and shaded bands indicate uncertainty around the mean. Graphene showed higher early electrical output than graphite, although both materials followed the same declining temporal pattern.
Figure 2.
Temporal trajectories of voltage, current, and power by anode material in kefir-inoculated microbial fuel cells. Lines represent the mean response at each time point and shaded bands indicate uncertainty around the mean. Graphene showed higher early electrical output than graphite, although both materials followed the same declining temporal pattern.
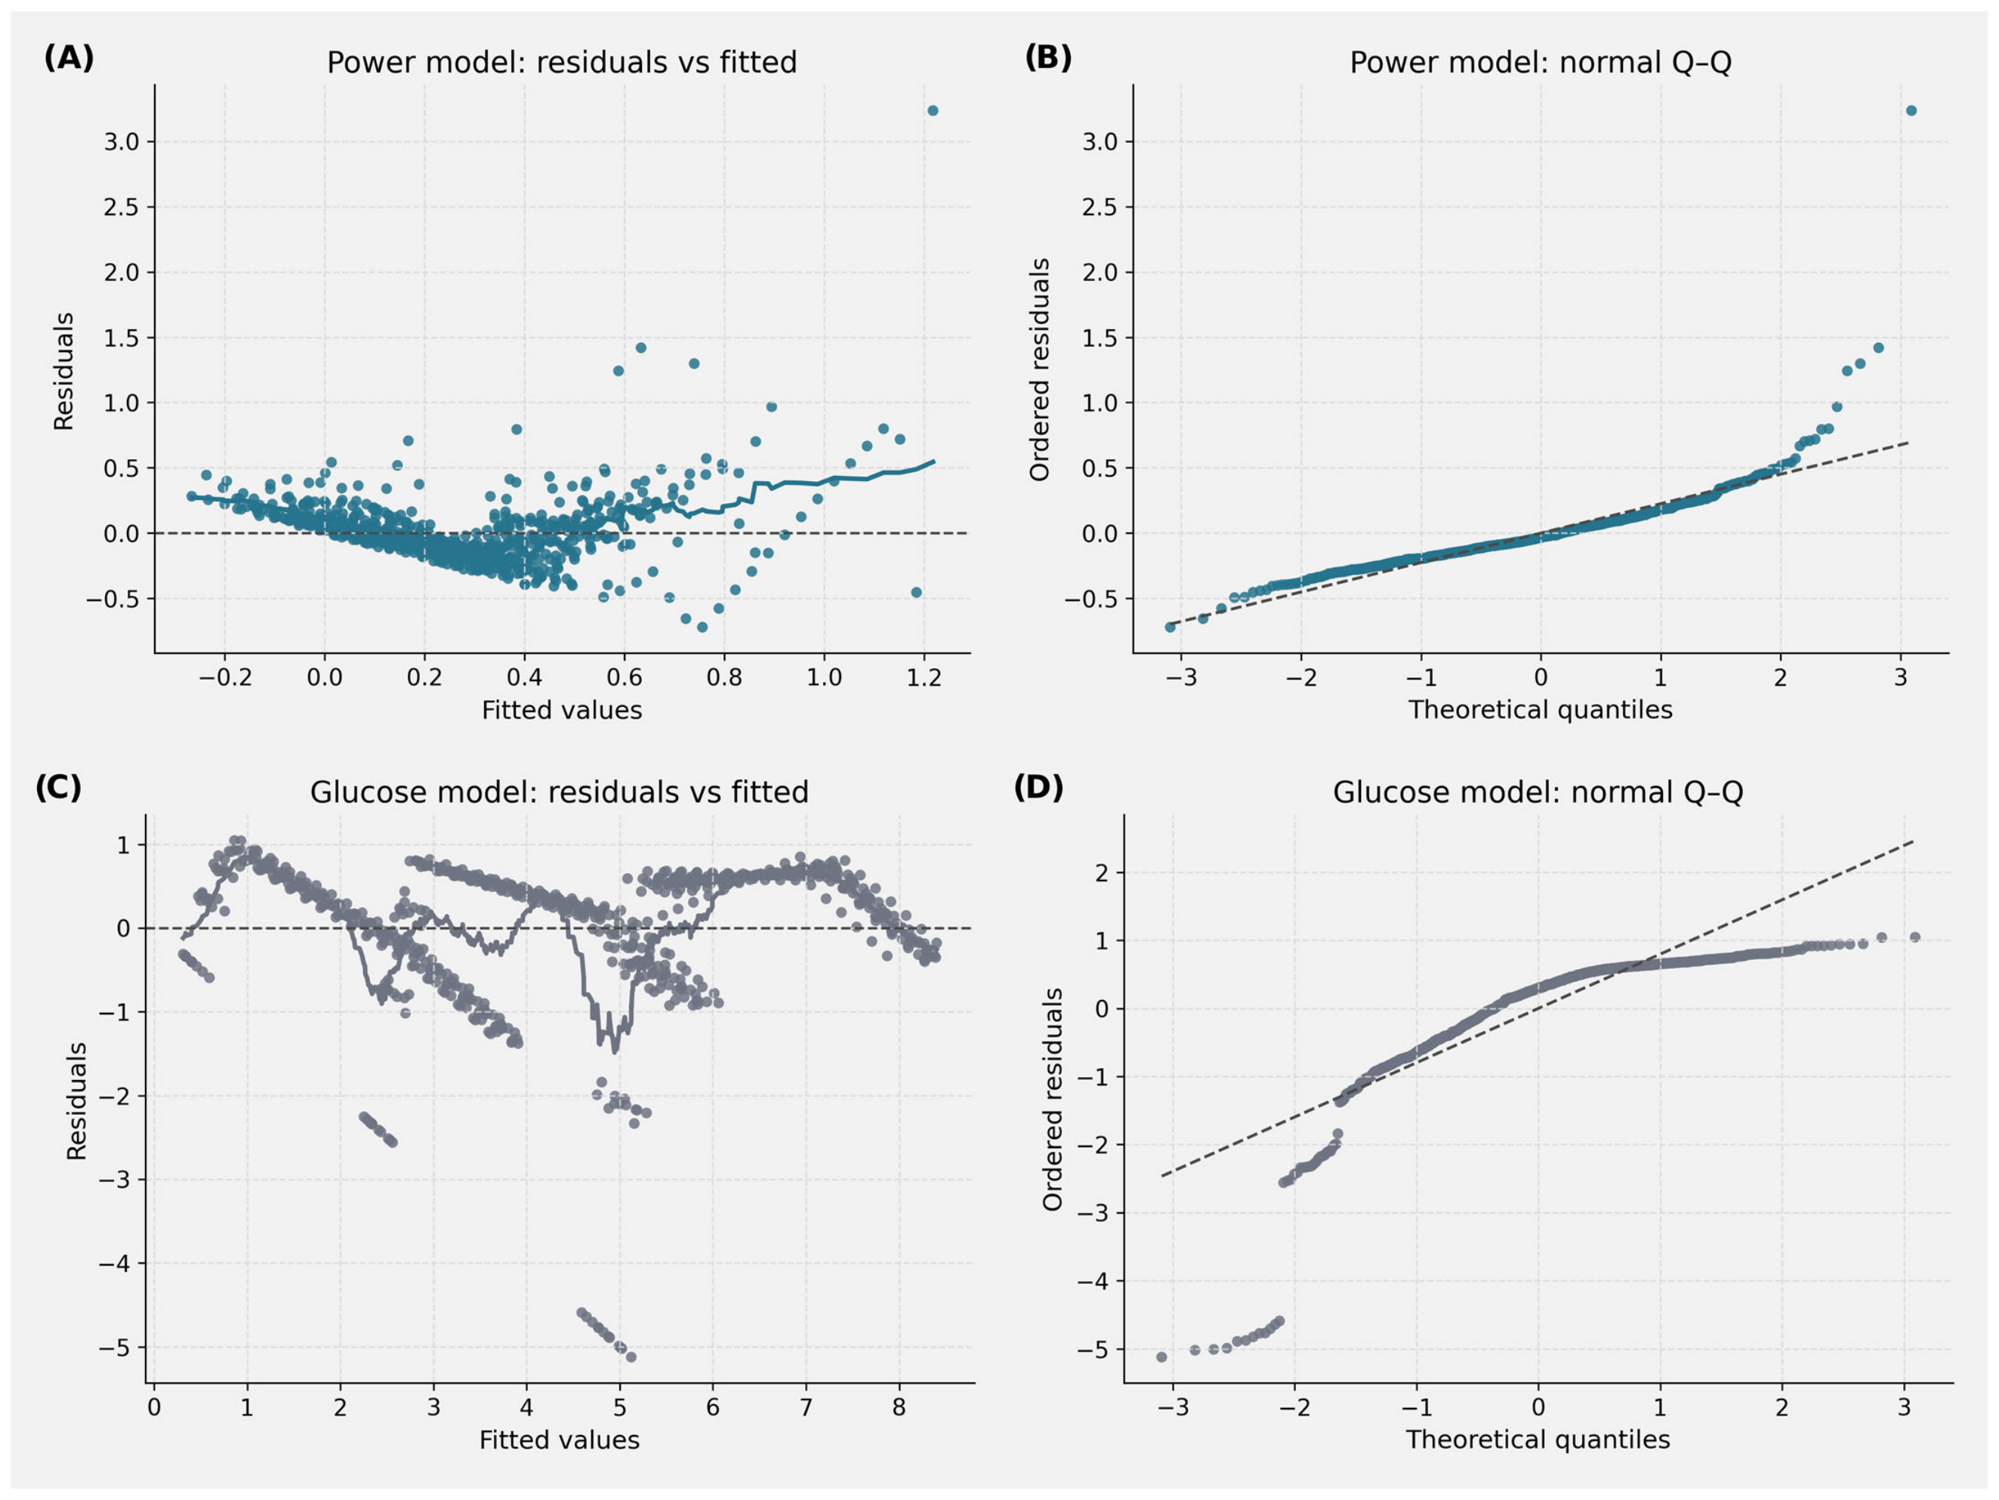
Figure 3.
Diagnostic plots for the longitudinal mixed-effects models used in
Table 7. Panel (
A) shows residuals versus fitted values for the power model; Panel (
B) shows the normal Q–Q plot for the power model; Panel (
C) shows residuals versus fitted values for the glucose-consumption model; Panel (
D) shows the normal Q–Q plot for the glucose-consumption model. The power model showed mild heteroscedasticity and upper-tail deviation, whereas the glucose-consumption model showed stronger structured residual behavior consistent with bounded batch depletion. These diagnostics are presented to support transparent interpretation of model behavior.
Figure 3.
Diagnostic plots for the longitudinal mixed-effects models used in
Table 7. Panel (
A) shows residuals versus fitted values for the power model; Panel (
B) shows the normal Q–Q plot for the power model; Panel (
C) shows residuals versus fitted values for the glucose-consumption model; Panel (
D) shows the normal Q–Q plot for the glucose-consumption model. The power model showed mild heteroscedasticity and upper-tail deviation, whereas the glucose-consumption model showed stronger structured residual behavior consistent with bounded batch depletion. These diagnostics are presented to support transparent interpretation of model behavior.
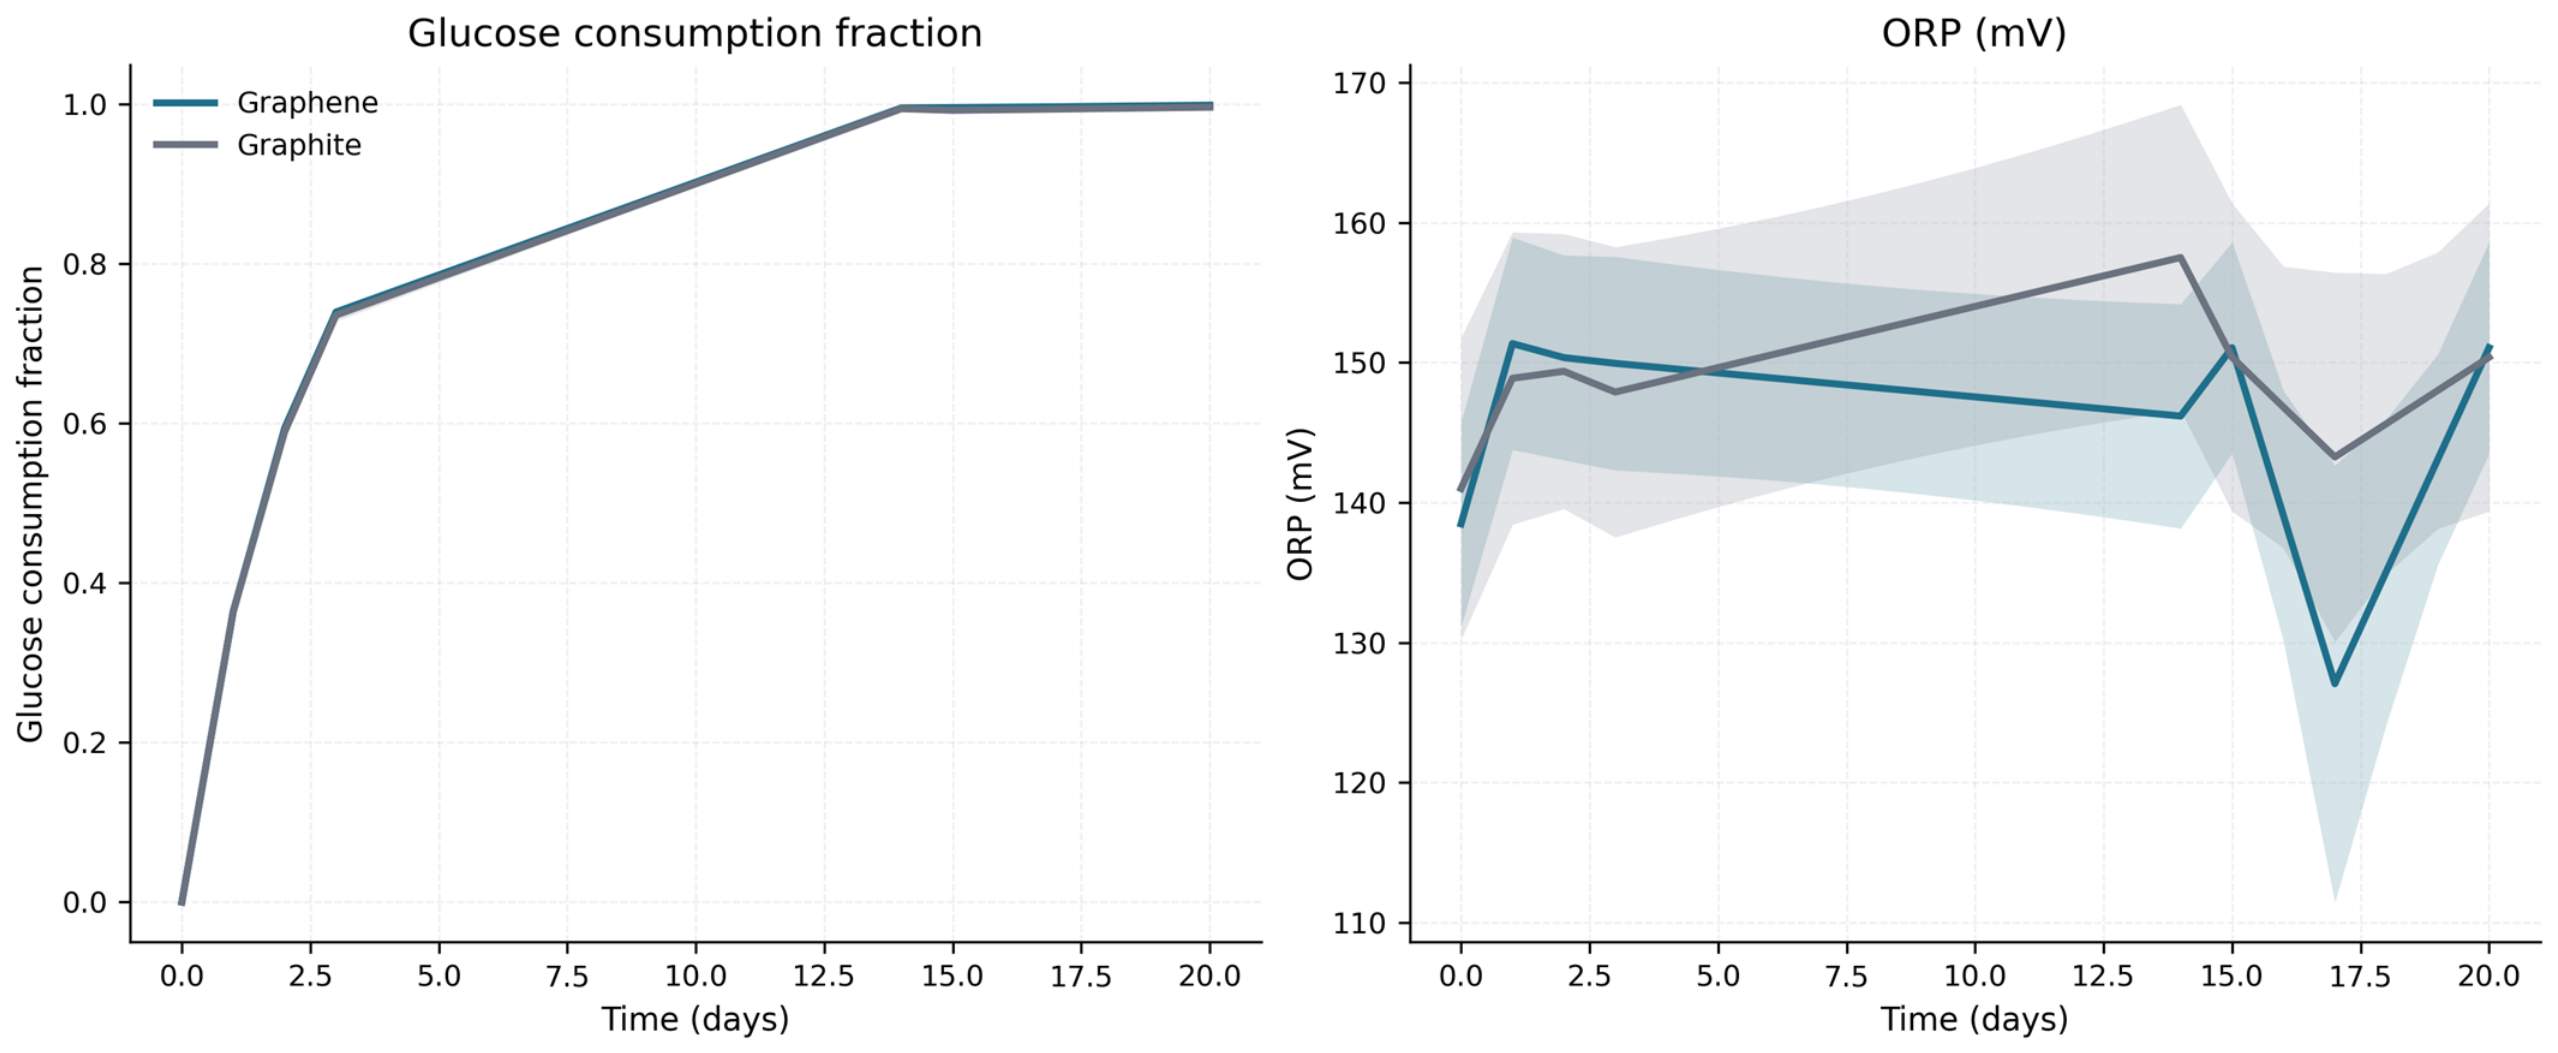
Figure 4.
Temporal evolution of glucose consumption fraction and oxidation-reduction potential (ORP) according to anode material. Both materials exhibited rapid and near-complete substrate depletion, whereas ORP showed moderate fluctuations without a stable separation between graphene and graphite.
Figure 4.
Temporal evolution of glucose consumption fraction and oxidation-reduction potential (ORP) according to anode material. Both materials exhibited rapid and near-complete substrate depletion, whereas ORP showed moderate fluctuations without a stable separation between graphene and graphite.
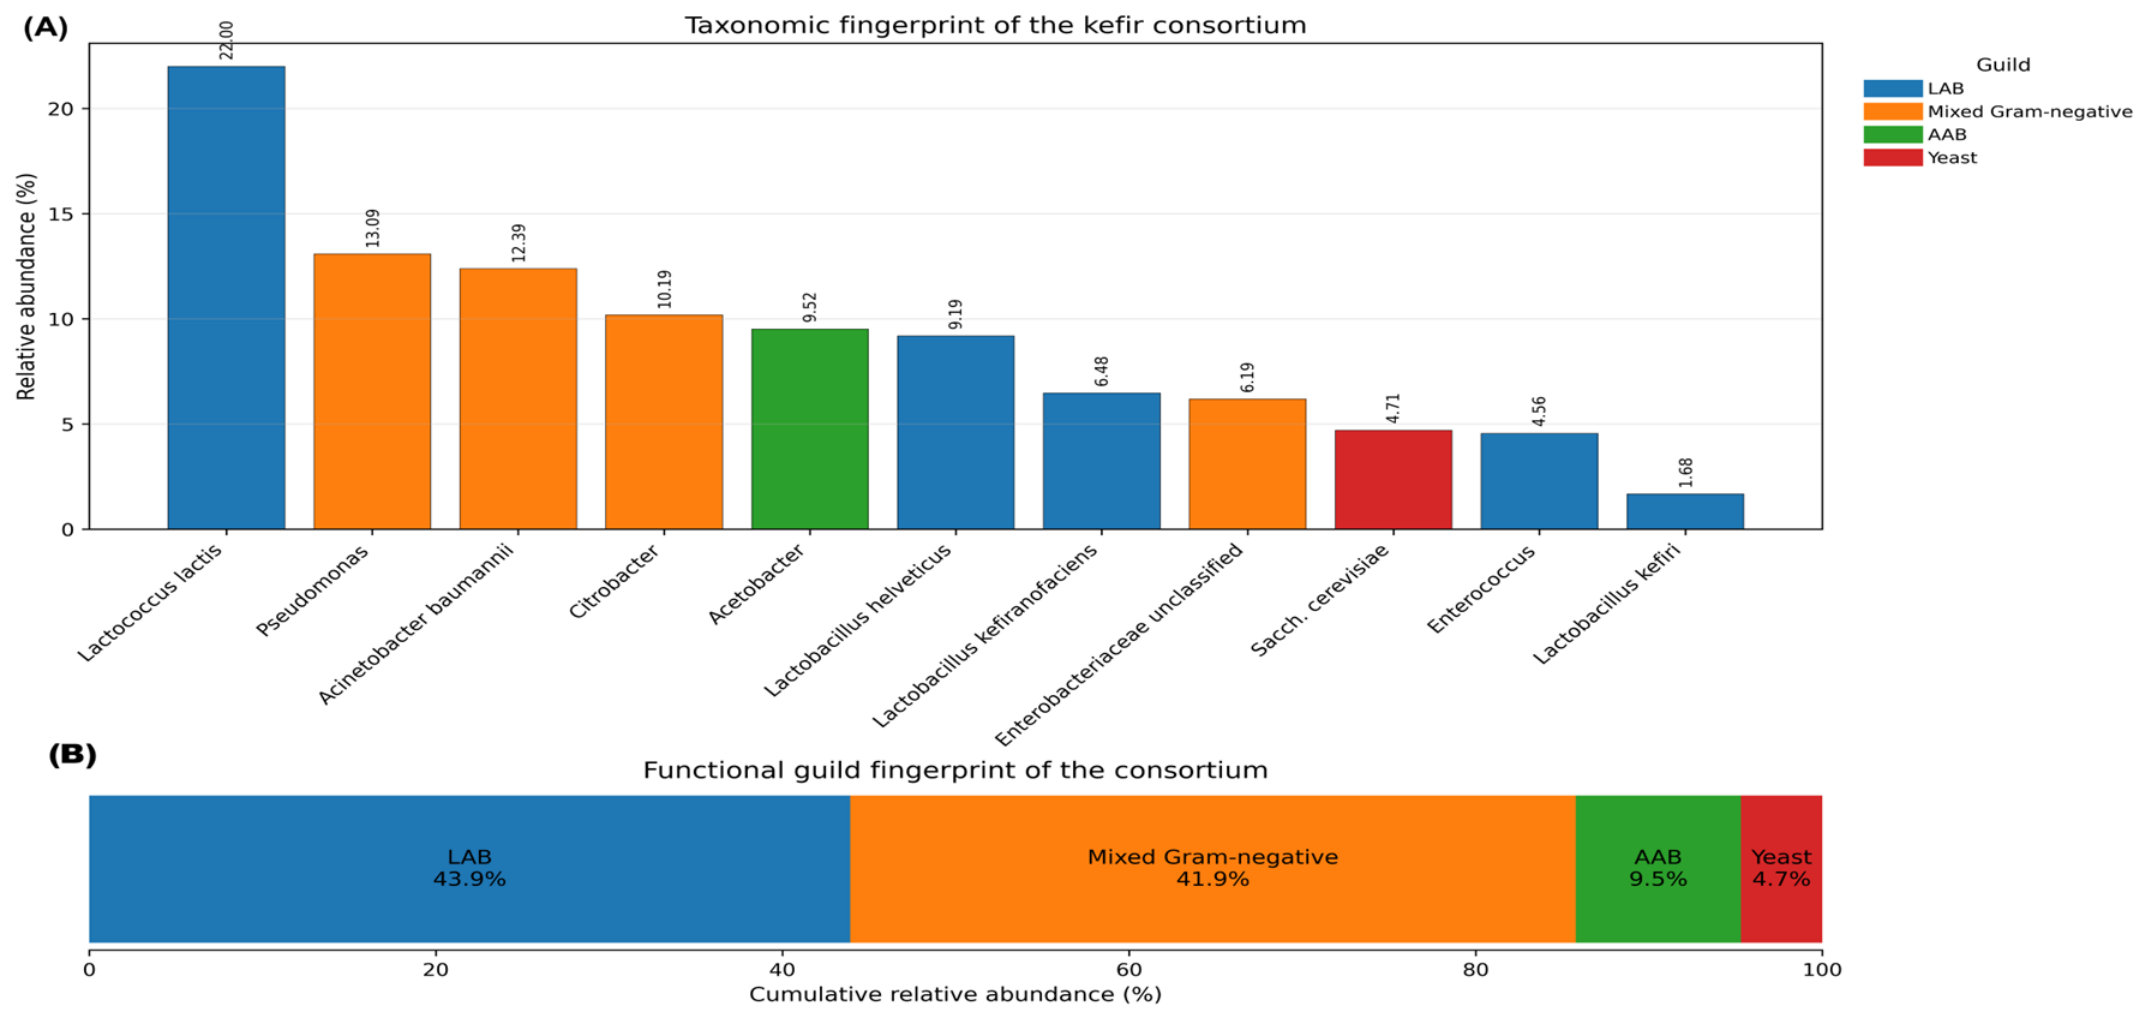
Figure 5.
Taxonomic and functional fingerprint of the kefir consortium. (A) Relative abundance of the dominant taxa identified in the inoculum, grouped by major functional guild. (B) Cumulative relative abundance of the principal guilds, including lactic acid bacteria (LAB), mixed Gram-negative bacteria, acetic acid bacteria (AAB), and yeast. The figure summarizes the compositional structure of the inoculum used to drive the anodic bioprocess.
Figure 5.
Taxonomic and functional fingerprint of the kefir consortium. (A) Relative abundance of the dominant taxa identified in the inoculum, grouped by major functional guild. (B) Cumulative relative abundance of the principal guilds, including lactic acid bacteria (LAB), mixed Gram-negative bacteria, acetic acid bacteria (AAB), and yeast. The figure summarizes the compositional structure of the inoculum used to drive the anodic bioprocess.
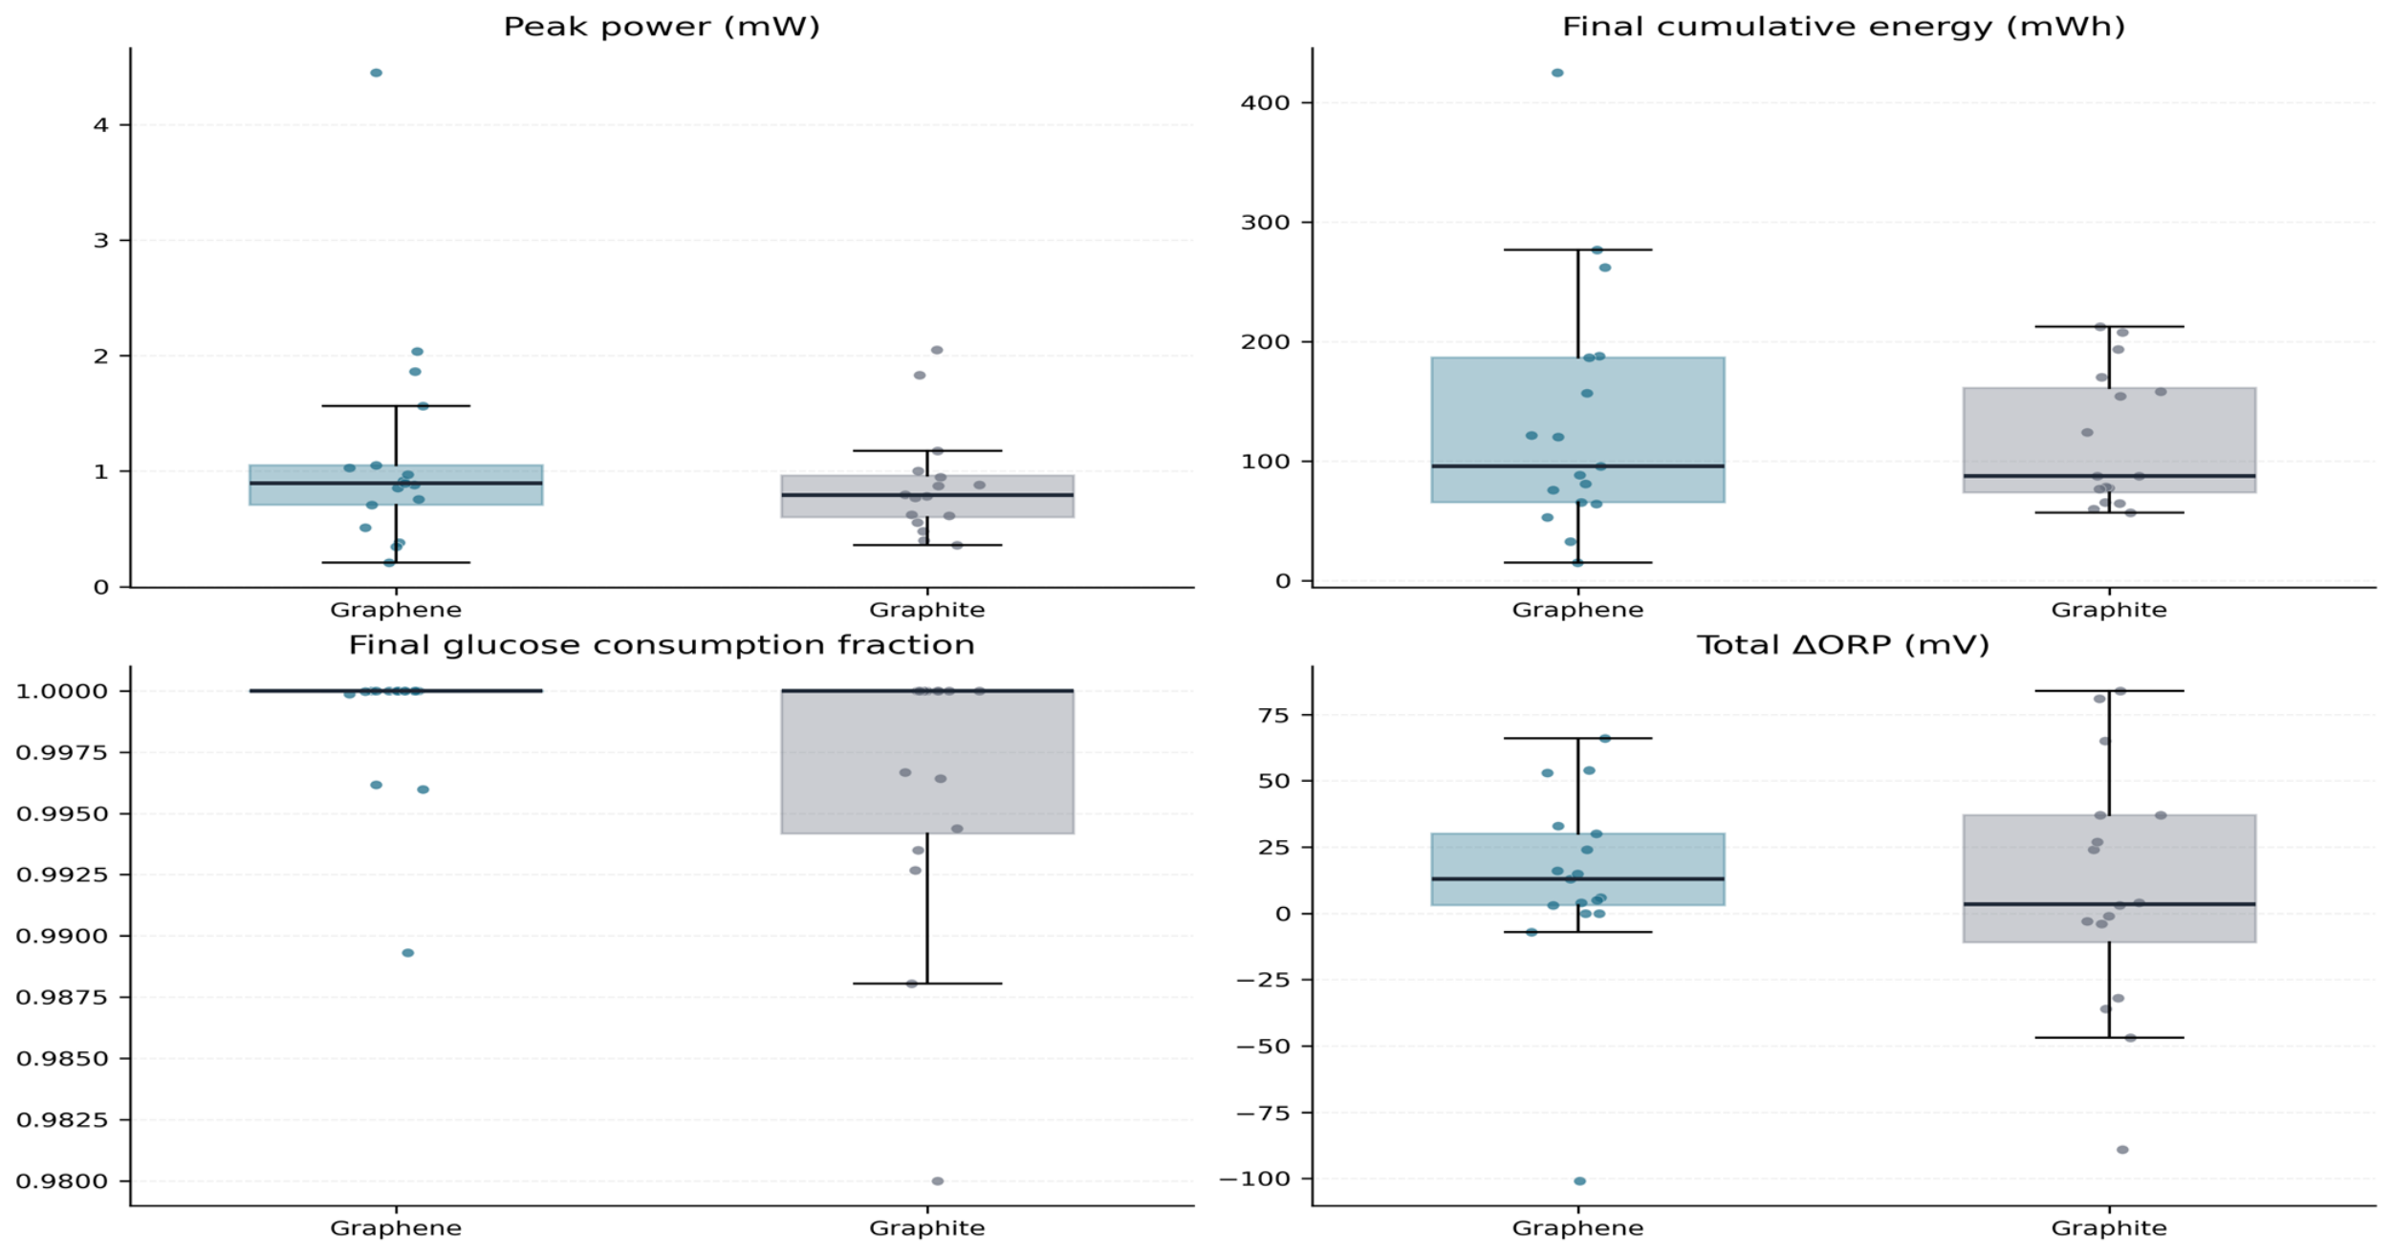
Figure 6.
Series-level comparison of key performance endpoints in kefir-inoculated MFCs according to anode material. Boxplots and individual points are shown for peak power, final cumulative energy, final glucose consumption fraction, and total ΔORP. Graphene tended to show higher electrical metrics, but broad overlap between materials remained evident.
Figure 6.
Series-level comparison of key performance endpoints in kefir-inoculated MFCs according to anode material. Boxplots and individual points are shown for peak power, final cumulative energy, final glucose consumption fraction, and total ΔORP. Graphene tended to show higher electrical metrics, but broad overlap between materials remained evident.
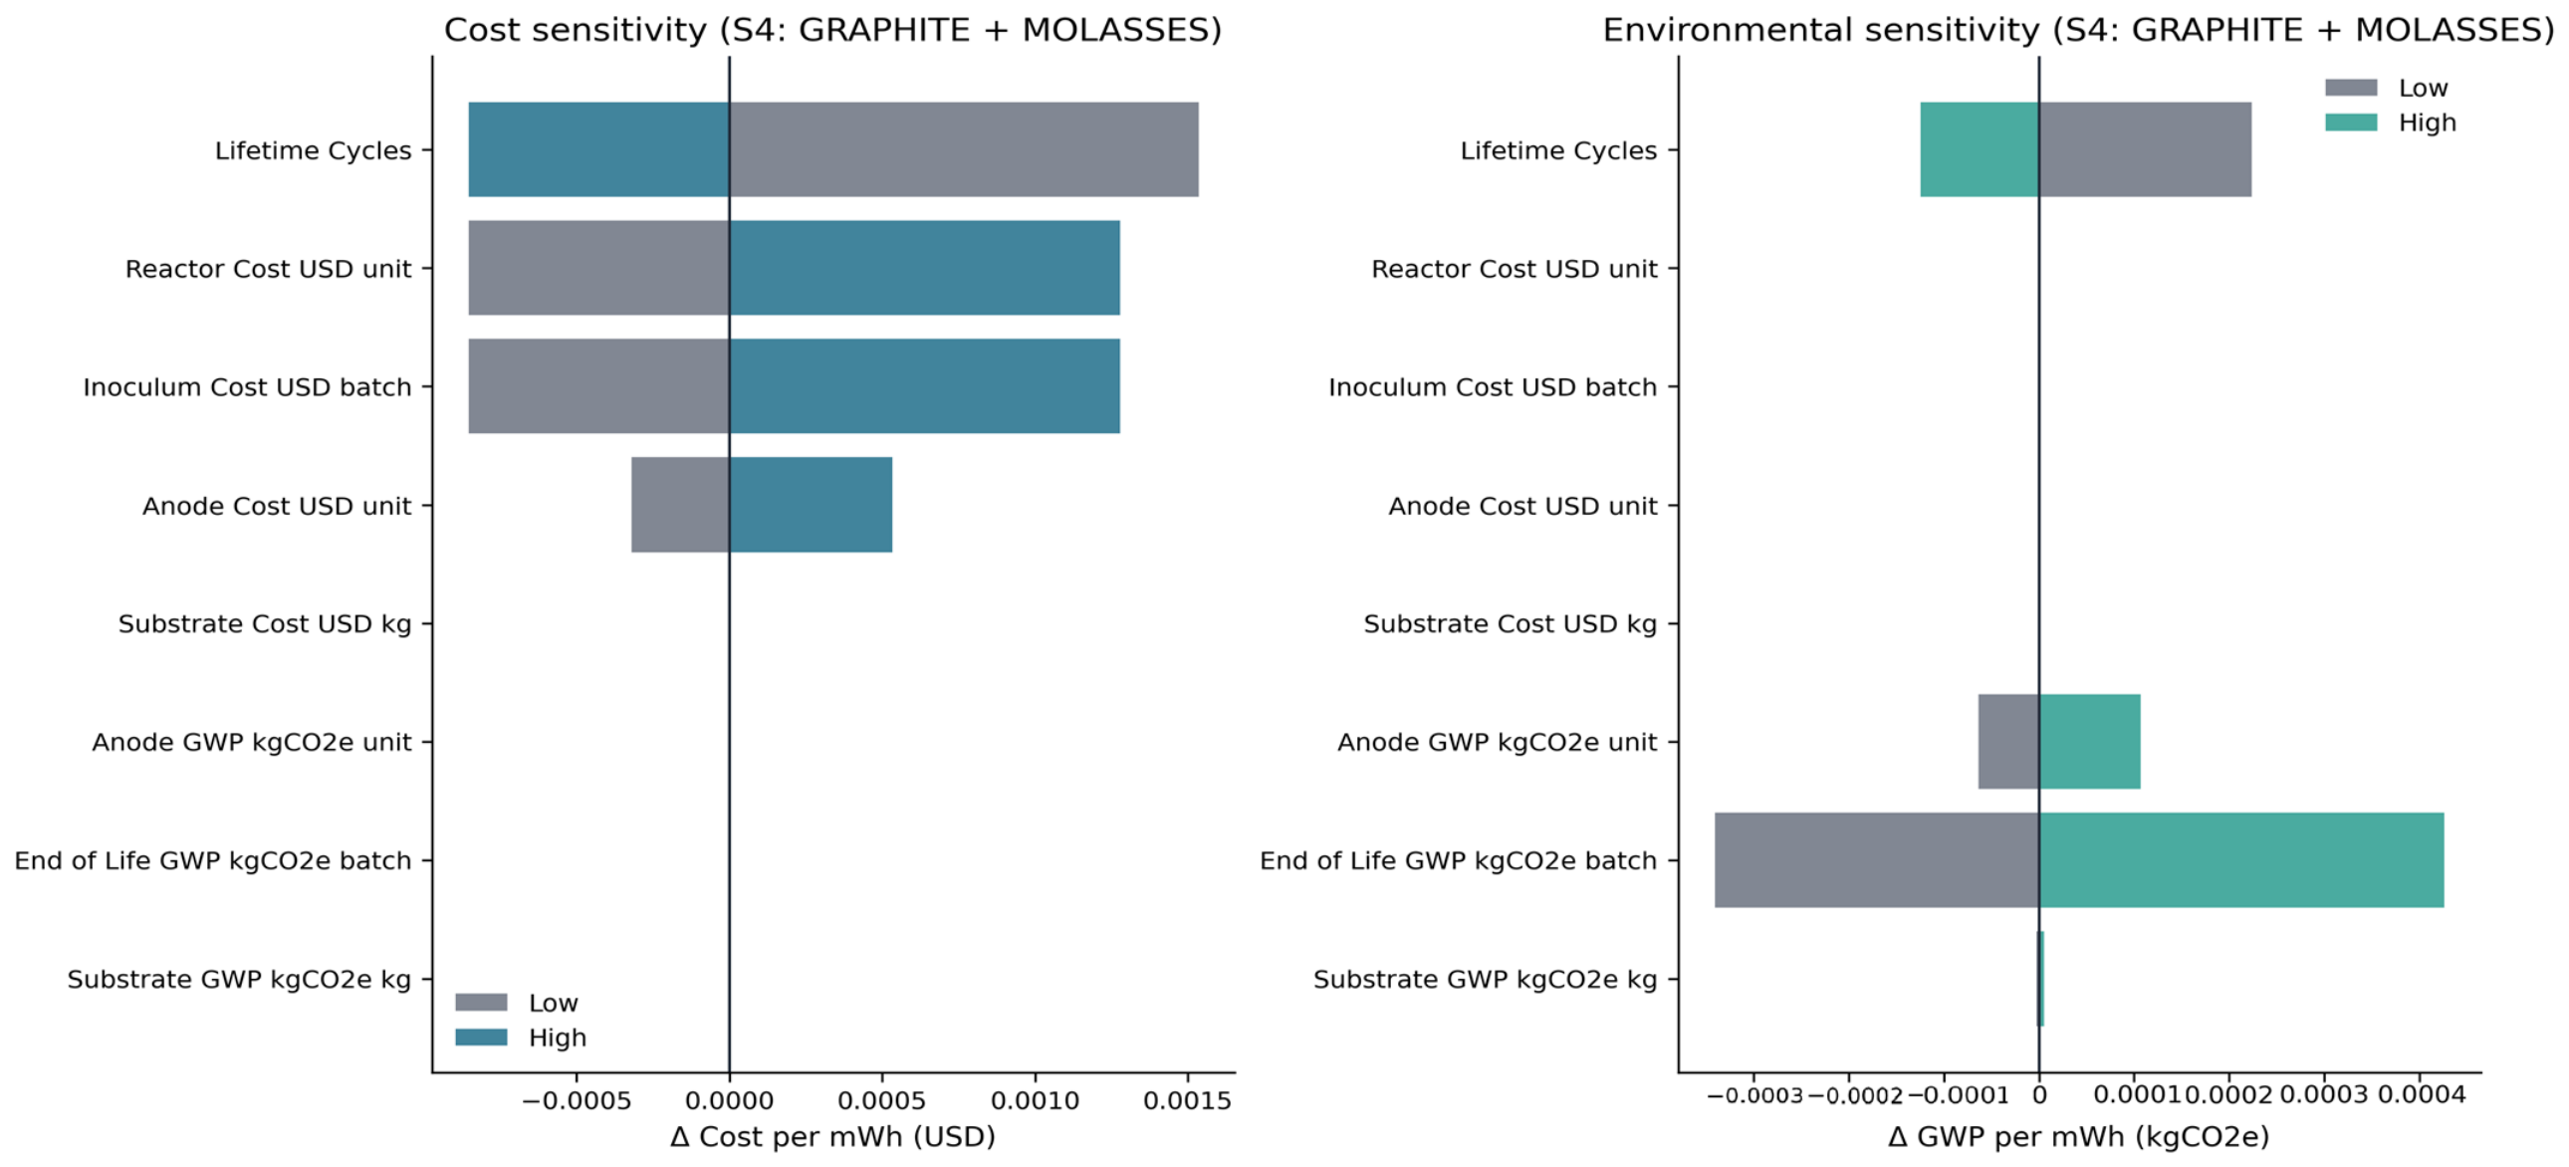
Figure 7.
One-at-a-time sensitivity analysis of the deterministic LCA/TEA base case. The figure shows the effect of low and high input values on cost per mWh and GWP per mWh. Economic outcomes were mainly driven by lifetime cycles, reactor cost, inoculum cost, and anode cost, whereas environmental outcomes were especially sensitive to end-of-life burden, lifetime cycles, and anode-related GWP.
Figure 7.
One-at-a-time sensitivity analysis of the deterministic LCA/TEA base case. The figure shows the effect of low and high input values on cost per mWh and GWP per mWh. Economic outcomes were mainly driven by lifetime cycles, reactor cost, inoculum cost, and anode cost, whereas environmental outcomes were especially sensitive to end-of-life burden, lifetime cycles, and anode-related GWP.
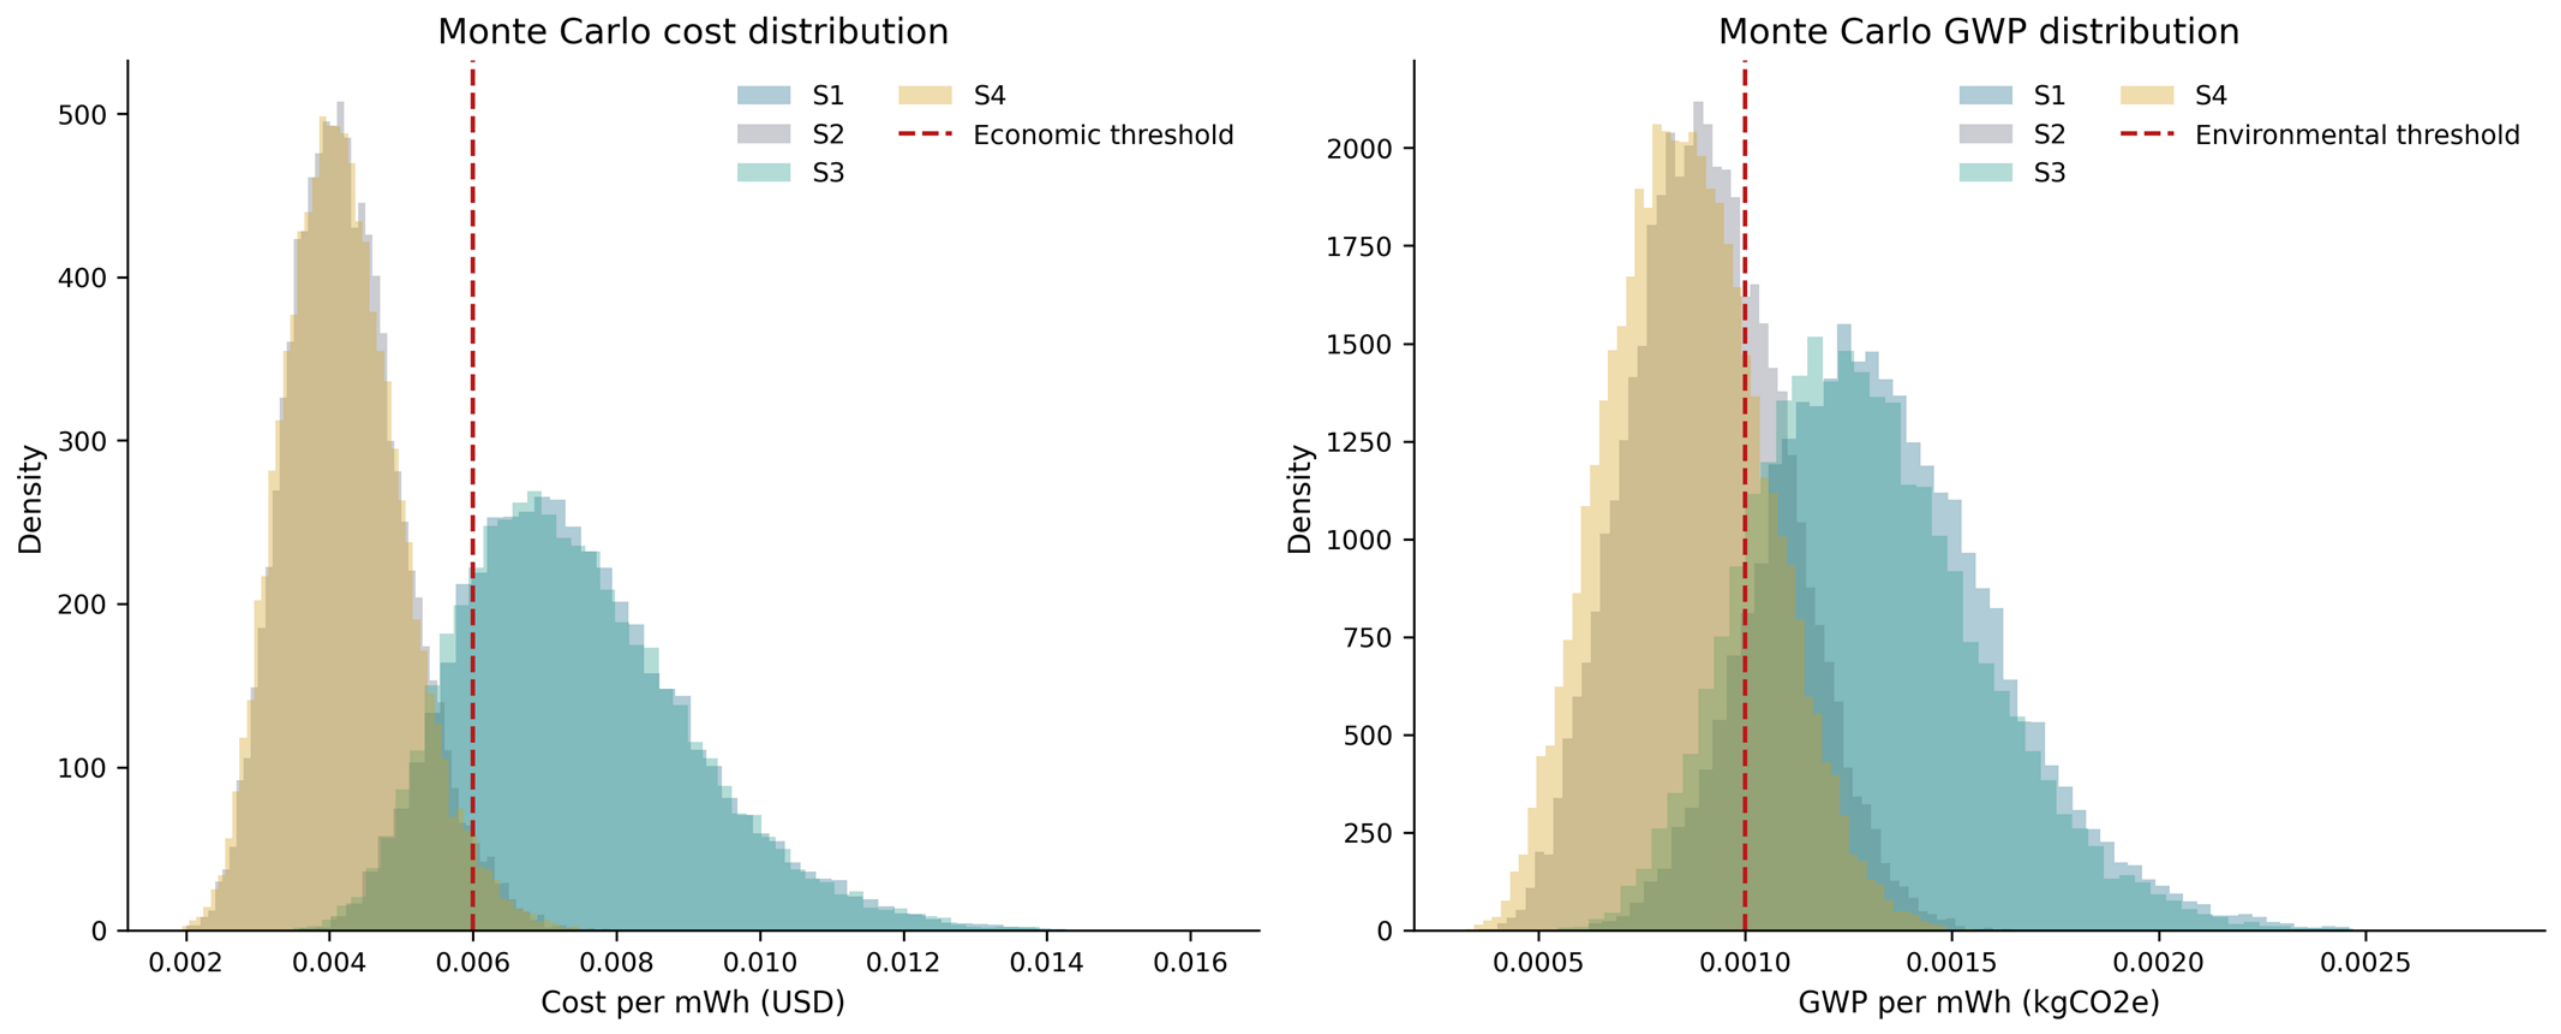
Figure 8.
Monte Carlo distributions of economic and environmental performance across scenarios. Probability distributions are shown for cost per mWh and GWP per mWh. The scenario with graphite and molasses concentrated more strongly in the lowest cost and lowest impact ranges, indicating the highest overall probabilistic viability.
Figure 8.
Monte Carlo distributions of economic and environmental performance across scenarios. Probability distributions are shown for cost per mWh and GWP per mWh. The scenario with graphite and molasses concentrated more strongly in the lowest cost and lowest impact ranges, indicating the highest overall probabilistic viability.
Table 1.
Core design of the kefir-driven MFC experiment.
Table 1.
Core design of the kefir-driven MFC experiment.
| Item | Specification |
|---|
| Experimental design | Comparative, parallel-treatment longitudinal reactor study |
| Reactor type | Double-chamber microbial fuel cell |
| Anode treatments | Graphene; Graphite |
| Cathode configuration | Air-exposed zinc cathode under passive oxygen access |
| Salt Bridge | Low-cost salt bridge fabricated in-house |
| Operating mode | Fed-batch |
| Anode condition | Anaerobic |
| Monitoring period | 20 days |
| Main response | Voltage (V) |
| Secondary measured responses | ORP |
Table 2.
Reactor hardware, materials, and assembly notes.
Table 2.
Reactor hardware, materials, and assembly notes.
| Component | Specification | Brand/Supplier | Notes |
|---|
| Reactor body | Double-chamber MFC reactor | In-house fabricated | Uniform design for all units |
| Salt Bridge | Low-cost Salt Bridge | In-house fabricated | Hydrated before installation |
| Graphene anode | Conductive graphene sheet/plate | Commercially purchased | Treatment-specific anodic material |
| Graphite anode | Graphite plate/sheet | Commercially purchased | Comparative anodic material |
| Cathode | Zinc plate/sheet | Integrated into custom reactor | Air-exposed, not actively aerated |
| Tubing and fittings | PVC tubing, 16 mm | Commercial | Reactor connection element |
| External load | One LED per MFC | Commercial electronic component | Non-ohmic external load |
Table 3.
Measurement workflow, analytical principle, and reporting units.
Table 3.
Measurement workflow, analytical principle, and reporting units.
| Variable | Type | Measurement Principle | Instrument/Method | Unit |
|---|
| Voltage | Directly measured | Closed-circuit voltage under LED-connected load | Proskit 1225, Taiwan | V |
| Current | Directly measured | Closed-circuit current under LED-connected load | Proskit 1225, Taiwan | mA |
| Temperature | Directly measured | Anode temperature | BLE-C600 (YIERYI, China) | °C |
| ORP | Directly measured | Redox electrode | BLE-C600 (YIERYI, China) | mV |
| Reducing sugars | Directly measured | UV–Vis colorimetry | DNS assay with external calibration | g/L glucose equivalents |
Table 4.
Statistical analysis framework used in the study.
Table 4.
Statistical analysis framework used in the study.
| Analysis Block | Outcome(s) | Data Level | Method | Purpose |
|---|
| Descriptive analysis | Voltage, current, power, consumed glucose, ORP, cumulative energy | Observation | Summary statistics | To characterize central tendency and dispersion by anode material |
| Longitudinal modeling | Power_mW; Consumed_Glucose_g_L | Repeated measures | Linear mixed-effects models | To estimate time effects, material effects, and time × material interaction |
| Series-level comparison | Peak power, final cumulative energy, final consumption fraction, total ΔORP, mean power, max power per g consumed | Reactor series | Nonparametric comparison | To assess endpoint differences between graphene and graphite |
| Deterministic sensitivity | Cost per mWh; GWP per mWh | Scenario | One-at-a-time sensitivity analysis | To identify dominant economic and environmental drivers |
| Probabilistic sustainability screening | Viability, best-cost probability, best-GWP probability | Scenario | Monte Carlo simulation | To propagate uncertainty across LCA/TEA inputs |
Table 5.
Scenario structure and uncertainty inputs for the integrated LCA/TEA analysis.
Table 5.
Scenario structure and uncertainty inputs for the integrated LCA/TEA analysis.
| Scenario ID | Anode | Substrate | Main Varying Inputs |
|---|
| S1 | Graphene | Glucose | Higher anode cost and anode GWP; conventional substrate cost and burden |
| S2 | Graphite | Glucose | Lower anode cost and anode GWP; conventional substrate cost and burden |
| S3 | Graphene | Molasses | Higher anode cost and anode GWP; lower substrate cost and lower substrate GWP; circularity credits |
| S4 | Graphite | Molasses | Lower anode cost and anode GWP; lower substrate cost and lower substrate GWP; circularity credits |
Table 6.
Descriptive statistics of electrochemical, substrate-consumption, redox, and operational variables in kefir-inoculated MFCs stratified by anode material. The table reports the number of observations, mean, standard deviation, median, interquartile range, minimum, and maximum for current, voltage, power, consumed glucose, consumption fraction, ORP, temperature, and cumulative energy.
Table 6.
Descriptive statistics of electrochemical, substrate-consumption, redox, and operational variables in kefir-inoculated MFCs stratified by anode material. The table reports the number of observations, mean, standard deviation, median, interquartile range, minimum, and maximum for current, voltage, power, consumed glucose, consumption fraction, ORP, temperature, and cumulative energy.
| Anode | Variable | N | Mean | SD | Median | IQR | Min | Max |
|---|
| GRAPHENE | Current_mA | 357 | 0.369419 | 0.470394 | 0.195 | 0.309697 | 0.01 | 4.2 |
| GRAPHENE | Voltage_V | 357 | 0.728501 | 0.227232 | 0.805455 | 0.341818 | 0.11 | 1.22 |
| GRAPHENE | Power_mW | 357 | 0.295808 | 0.426992 | 0.144007 | 0.258337 | 0.002 | 4.452 |
| GRAPHENE | Consumed_Glucose_g_L | 357 | 4.522655 | 2.230661 | 4.658949 | 3.867013 | 0 | 8.048692 |
| GRAPHENE | Glucose_Consumption_Fraction | 357 | 0.826307 | 0.241914 | 0.90249 | 0.215066 | 0 | 1 |
| GRAPHENE | ORP_mV | 357 | 145.8683 | 33.8315 | 147.0909 | 44 | 7 | 222 |
| GRAPHENE | Temperature_C | 357 | 24.35987 | 0.40678 | 24.48 | 0.421818 | 23.03 | 25.1 |
| GRAPHENE | Cumulative_Energy_mWh | 357 | 91.49495 | 91.51432 | 60.63873 | 91.86122 | 0 | 425.3795 |
| GRAPHITE | Current_mA | 336 | 0.333568 | 0.285476 | 0.2275 | 0.356705 | 0.01 | 1.52 |
| GRAPHITE | Voltage_V | 336 | 0.700818 | 0.2067 | 0.679091 | 0.270909 | 0.02 | 1.35 |
| GRAPHITE | Power_mW | 336 | 0.251456 | 0.258193 | 0.145169 | 0.264276 | 0.0008 | 2.052 |
| GRAPHITE | Consumed_Glucose_g_L | 336 | 4.234736 | 2.39838 | 4.086114 | 4.195823 | 0 | 8.224868 |
| GRAPHITE | Glucose_Consumption_Fraction | 336 | 0.823873 | 0.241745 | 0.903879 | 0.211689 | 0 | 1 |
| GRAPHITE | ORP_mV | 336 | 150.2872 | 40.60899 | 145.9545 | 46.63636 | 44 | 252 |
| GRAPHITE | Temperature_C | 336 | 24.35658 | 0.310642 | 24.40955 | 0.37375 | 23.21 | 24.94 |
| GRAPHITE | Cumulative_Energy_mWh | 336 | 73.97782 | 53.93576 | 58.99781 | 68.46814 | 0 | 212.7504 |
Table 7.
Longitudinal mixed-effects models for power output and glucose consumption as a function of time and anode material. Graphene was the reference category; time was modeled in days; reactor ID was included as a random intercept. Fixed-effect estimates, standard errors, z statistics, p values, and 95% confidence intervals are reported. Random-intercept variance is reported separately.
Table 7.
Longitudinal mixed-effects models for power output and glucose consumption as a function of time and anode material. Graphene was the reference category; time was modeled in days; reactor ID was included as a random intercept. Fixed-effect estimates, standard errors, z statistics, p values, and 95% confidence intervals are reported. Random-intercept variance is reported separately.
| Outcome | Term | Estimate | Std. Error | z | p Value | 95% CI |
|---|
| Power_mW | Intercept | 0.625569 | 0.049506 | 12.636 | 1.33 × 10−36 | 0.528539 to 0.722599 |
| Power_mW | Anode material (Graphite vs. Graphene) | −0.156350 | 0.071098 | −2.199 | 0.027872 | −0.295699 to −0.017001 |
| Power_mW | Time (days) | −0.032976 | 0.002265 | −14.557 | 5.28 × 10−48 | −0.037416 to −0.028536 |
| Power_mW | Time × anode material | 0.011200 | 0.003253 | 3.443 | 0.000576 | 0.004823 to 0.017576 |
| Power_mW | Random-intercept variance (reactor ID) | 0.029742 | — | — | — | — |
| Consumed_Glucose_g_L | Intercept | 2.772343 | 0.454941 | 6.094 | 1.10 × 10⁻⁹ | 1.880675 to 3.664011 |
| Consumed_Glucose_g_L | Anode material (Graphite vs. Graphene) | −0.177357 | 0.653359 | −0.271 | 0.786042 | −1.457917 to 1.103204 |
| Consumed_Glucose_g_L | Time (days) | 0.175031 | 0.008411 | 20.811 | 3.48 × 10−96 | 0.158547 to 0.191516 |
| Consumed_Glucose_g_L | Time × anode material | −0.011056 | 0.012079 | −0.915 | 0.360017 | −0.034731 to 0.012618 |
| Consumed_Glucose_g_L | Random-intercept variance (reactor ID) | 3.354160 | — | — | — | — |
Table 8.
Series-level comparison of key experimental endpoints according to anode material. Values are reported at the MFC-series level as mean ± SD, together with median (IQR) to support nonparametric interpretation. Between-group comparisons were performed using Mann–Whitney U tests.
Table 8.
Series-level comparison of key experimental endpoints according to anode material. Values are reported at the MFC-series level as mean ± SD, together with median (IQR) to support nonparametric interpretation. Between-group comparisons were performed using Mann–Whitney U tests.
| Endpoint | Graphene (N = 17), Mean ± SD | Graphite (N = 16), Mean ± SD | Graphene Median (IQR) | Graphite Median (IQR) | Mann–Whitney U | p Value |
|---|
| Peak power (mW) | 1.143 ± 0.987 | 0.884 ± 0.470 | 0.896 (0.705–1.050) | 0.791 (0.599–0.962) | 155.5 | 0.494 |
| Final cumulative energy (mWh) | 135.89 ± 105.61 | 117.26 ± 56.50 | 95.94 (65.76–186.58) | 87.53 (73.86–161.24) | 138.0 | 0.957 |
| Final glucose consumption fraction | 0.9989 ± 0.0028 | 0.9964 ± 0.0057 | 1.0000 (1.0000–1.0000) | 1.0000 (0.9942–1.0000) | 164.0 | 0.250 |
| Total ΔORP (mV) | 12.59 ± 36.18 | 9.38 ± 46.89 | 13.00 (3.00–30.00) | 3.50 (−11.00–37.00) | 150.5 | 0.614 |
| Mean power (mW) | 0.296 ± 0.233 | 0.251 ± 0.121 | 0.213 (0.140–0.397) | 0.179 (0.157–0.347) | 141.0 | 0.871 |
| Maximum power per g consumed (mW per g consumed) | 0.425 ± 0.250 | 0.407 ± 0.265 | 0.419 (0.277–0.543) | 0.293 (0.212–0.542) | 149.0 | 0.653 |
Table 9.
Monte Carlo probabilistic summary of economic and environmental viability across scenarios. The table reports scenario-wise viability probabilities, probability of being the lowest-cost scenario, and probability of being the lowest-GWP scenario under uncertainty propagation.
Table 9.
Monte Carlo probabilistic summary of economic and environmental viability across scenarios. The table reports scenario-wise viability probabilities, probability of being the lowest-cost scenario, and probability of being the lowest-GWP scenario under uncertainty propagation.
| Scenario ID | Probability Viable | Probability Best Cost | Probability Best GWP |
|---|
| S1 | 0.0386 | 0.00435 | 0.02465 |
| S2 | 0.6707 | 0.47785 | 0.38995 |
| S3 | 0.0561 | 0.00475 | 0.0385 |
| S4 | 0.75965 | 0.51305 | 0.5469 |



 ,
,