1. Introduction
Against the backdrop of accelerating global agricultural modernization and the sweeping wave of the digital economy, enhancing the efficiency of the agricultural value chain has become a strategic core for ensuring food security and achieving industrial upgrading. In China, the “Rural Revitalization” strategy and the “Digital China” strategy intersect profoundly. Digital infrastructure (DI), represented by 5G, the Internet of Things, and big data centers, and Agricultural Social Services (ASSs), characterized by specialization and market orientation, are regarded as the two key engines driving agricultural modernization [
1]. Theoretically, DI and ASSs can empower traditional agriculture to transform into efficient modern value chains. However, evaluating their actual enabling effects faces two major academic bottlenecks: first, endogeneity bias in causal identification. The deployment of DI and ASS is not random; it is highly correlated with factors like regional economic levels, leading traditional econometric models (e.g., OLS) to conflate “correlation” with “causation” [
2,
3]. Second, the “black box” of internal value chain mechanisms: existing research generally lacks a deep decomposition of how DI and ASS transmit effects through value chains, leaving their causal pathways unclear [
4].
In response to the aforementioned challenges, this paper advocates for a paradigm shift in agricultural economics research—transitioning from a purely “instrumental rationality” approach, which solely pursues efficiency-enhancing means, to a comprehensive analysis incorporating “value rationality.” This philosophical framework manifests across three dimensions: First, epistemologically, this study acknowledges the limitations of traditional models in distinguishing “phenomena” from ‘essence’ and confronts the profound epistemological challenge of endogeneity. It treats Double Machine Learning (DML) as a more refined “cognitive tool,” which, by orthogonally processing high-dimensional confounding factors, provides a more reliable epistemological foundation for “causal claims.” Second, in the philosophy of science, this study views the application of DML as a paradigm shift from linear reductionist assumptions toward acknowledging the nonlinearity of complex systems. Finally, concerning ethics and axiology, this study’s ultimate concern extends beyond “efficiency” itself. It introduces the perspective of “distributive justice,” questioning whether the efficiency gains from DI and ASS are fairly distributed. This forms the ethical foundation of the heterogeneity analysis presented herein.
Based on this framework, the core innovation of this study lies in constructing an integrated analytical model comprising “causal identification–mechanism decomposition–heterogeneity insights.” Methodologically, this paper abandons traditional correlation analysis and adopts the cutting-edge DML approach to precisely “isolate” the net causal effects of DI and ASSs on agricultural value chain efficiency from complex confounding factors (such as urbanization, economic conditions, and policies), thereby achieving causal correction. Regarding mechanism exploration, this paper argues that the enabling effects of DI and ASS extend beyond mere cost savings. Their core lies in fundamentally driving technological paradigm upgrades within the value chain by stimulating agricultural R&D innovation investment. The paper’s marginal contributions are as follows: (1) methodologically, introducing the DML model into empirical causal evaluation applications provides a new empirical paradigm for addressing endogeneity challenges in “digital dividend” assessments; (2) mechanism-wise, it uncovers and tests the transmission pathways of “innovation investment,” shedding light on the “black box” of digital empowerment; and (3) theoretically, grounded in absorption capacity theory and government intervention theory, it deeply analyzes the heterogeneous effects identified by DML, providing theoretical foundations for designing precise, differentiated digital rural policies that embody “value rationality” concerns.
2. Literature Review
This paper aims to investigate the causal effects of digital infrastructure (DI) and agricultural socialized services (ASSs) on agricultural technical efficiency (TE), and to identify the mechanisms through which innovation drives value chain enhancement. To clarify the research approach and contributions, this section systematically reviews the existing literature, focusing on three key areas: the measurement and influencing factors of agricultural technical efficiency; the impact of digital technologies on agricultural efficiency and challenges in identifying such effects; and the integration of digital elements with agricultural value chain upgrading. Based on this review, potential research directions are identified.
2.1. Measurement of Agricultural Technical Efficiency (TE) and Traditional Influencing Factors
The first category of study focuses on the measurement of agricultural efficiency and its traditional drivers. Since the pioneering introduction of Stochastic Frontier Analysis (SFA) by Aigner, D.; Knox Lovell, C.A.; Schmidt, P. (1977) and Meeusen, W.van den Broeck, J. (1977) SFA has become the mainstream method for measuring agricultural technical efficiency (TE) [
5,
6]. By decomposing the error term in the production function into random error and technical inefficiency components, this method simultaneously estimates the production frontier and individual technical efficiency values. Scholars have extensively employed SFA models to examine the impact of various traditional factors on TE. For instance, Chen T et al. (2022) proposed human capital (educational attainment) [
7], Malherbe W et al. (2024) applied capital inputs (agricultural mechanization) [
8], and Hua J et al. (2024) utilized land factors (farm size and land consolidation) and institutional environments (property rights and policies) [
9]. These studies provide the methodological foundation for constructing the efficiency measurement model (SFA) in this paper and offer empirical references for the set of high-dimensional confounding variables that must be controlled in the subsequent DML model.
2.2. Impact of Digital Technologies on Agricultural Efficiency and the Causality Identification Dilemma
The second category of study examines the effects of emerging digital technologies on total factor productivity (TFP) or technical efficiency (TE) in agriculture. Studies by Xu N et al. (2022) and Xia G et al. (2025) indicate that amid the rapid global expansion of the digital economy, digital technologies are viewed as a core driver for enhancing agricultural productivity and optimizing resource allocation [
10,
11]. Few studies consistently confirm (e.g., Wang B et al., 2023) that internet penetration, smart device adoption, and e-commerce utilization exhibit significant positive correlations with agricultural productivity gains and increased farmer income [
12]. Furthermore, studies by Liu G et al. (2023) and Zhang Y et al. (2025) on digital technologies in agricultural supply chains and global value chains reveal that digital technologies not only enhance domestic agricultural efficiency but also significantly boost the value-added of agricultural exports within global value chains (GVCs) [
13,
14].
However, as indicated in the introduction, the primary research space for this category of study lies in the rigor of causal identification. The adoption and deployment of digital technologies exhibit strong “self-selection effects” and endogeneity issues. This implies that digital infrastructure is often initially deployed in regions with stronger economic and agricultural foundations, which inherently possess higher productivity levels. Furthermore, research by Cheng C et al. (2024) indicates that farmers’ educational attainment, risk preferences, and resource endowments also directly influence their decisions and efficiency in adopting digital technologies [
15]. Existing studies (e.g., Semadeni M et al., 2013) predominantly employ OLS, Fixed Effects, or traditional DID models, which struggle to fully resolve endogeneity biases stemming from high-dimensional omitted variables [
16,
17]. This makes it highly susceptible to misinterpreting the “correlation” between digital technologies and agricultural efficiency as “causation,” thereby compromising the precision of policy evaluations. While some studies (e.g., Li F et al., 2024) confirm the positive effects of digital transformation, they also call for deeper exploration into the rigor of causal identification [
18].
2.3. Integration of Digital Factors in Agricultural Value Chain Upgrading
The third category of the literature examines agricultural value chain (AVC) upgrading from an industrial organization perspective. Gereffi G and Smith S et al. (2005) categorized value chain upgrading into process, product, functional, and chain upgrading [
19,
20]. Taylor D H (2005) demonstrated through agricultural value chain analysis that upgrading aims to enhance the agricultural product value added, improve production efficiency, and achieve sustainable development [
21]. Leading enterprises, cooperatives, and agricultural socialized services (ASSs) have been identified as key entities driving smallholder farmers’ integration into modern value chains and enabling functional upgrading [
22,
23].
The core theoretical positioning of this paper concerns the improvement of agricultural technical efficiency (TE) measured by SFA as a macro-level manifestation of the overall efficiency and functional evolution of the value chain. Within this framework, DI and ASS are no longer external shocks but are endogenously integrated as new key elements into all stages of the value chain (pre-production, in-production, post-production), jointly driving the overall upgrading of the value chain. DI provides data elements and accelerates information flow; ASS delivers specialized, standardized scaled services. Their convergence—as exemplified by smart agriculture and blockchain traceability—jointly propels the modern restructuring of agricultural value chains.
It is useful to clarify the conceptual relationship between the SFA-estimated technical efficiency (TE) and the broader notion of agricultural value chain efficiency (AVCE). In the Chinese agricultural context, production-stage inefficiencies, including excessive chemical input application, fragmented smallholder management, and information asymmetry in factor markets, constitute the primary bottleneck constraining overall value chain performance. Improvements in TE affect downstream segments through three specific channels: (a) standardized output quality from precision agriculture reduces sorting and grading costs in processing; (b) digital traceability embedded at the production stage enables quality certification that captures price premiums in retail markets; and (c) production efficiency gains release labor for specialization in post-harvest logistics and marketing services. The theoretical premise of this paper, therefore, is that TE serves as the binding constraint and leading indicator of value chain upgrading in China’s current agricultural development stage.
2.4. Academic Contributions and Positioning of This Paper
In summary, existing research has made significant progress in the field of digital technology’s impact on agricultural efficiency, yet profound methodological and theoretical shortcomings persist. First, research methodologies suffer from inadequate causal identification. Traditional approaches like two-stage SFA or models such as OLS and Tobit demonstrate limited capability in handling high-dimensional confounding factors. They fail to effectively disentangle the endogeneity between digital adoption (DI) and agricultural efficiency (ASS), casting doubt on the robustness and reliability of estimation results. This exposes the epistemological limitations of traditional econometric approaches—their inability to effectively distinguish “correlation” from ‘causation’ within complex systems. Second, theoretical mechanisms suffer from a “black box” problem. While existing studies broadly acknowledge the promotional roles of DI and ASS, few delve deeply into their underlying impact mechanisms. Specifically, there remains a lack of exploration into how DI and ASS stimulate innovation investment to drive value chain upgrading, and the transmission pathways through which this ultimately enhances efficiency.
To address this, this study employs a dual machine learning (DML) approach in its methodology. It conducts empirical causal inference on the agricultural technical efficiency values estimated by SFA and the benchmark regression calculated by Tobit, aiming to more accurately identify the net effects of DI and ASS on TE. Mechanistically, this study anchors its analysis on the core mediating mechanism of “agricultural R&D investment” (innovation-driven), systematically dissecting how DI and ASS stimulate innovation to drive agricultural value chain upgrading. This research approach, combining cutting-edge methodologies with in-depth mechanism analysis, aims to provide more comprehensive and rigorous theoretical underpinnings and empirical insights to understand agricultural modernization under the digital economy.
3. Theoretical Mechanism and Research Hypotheses
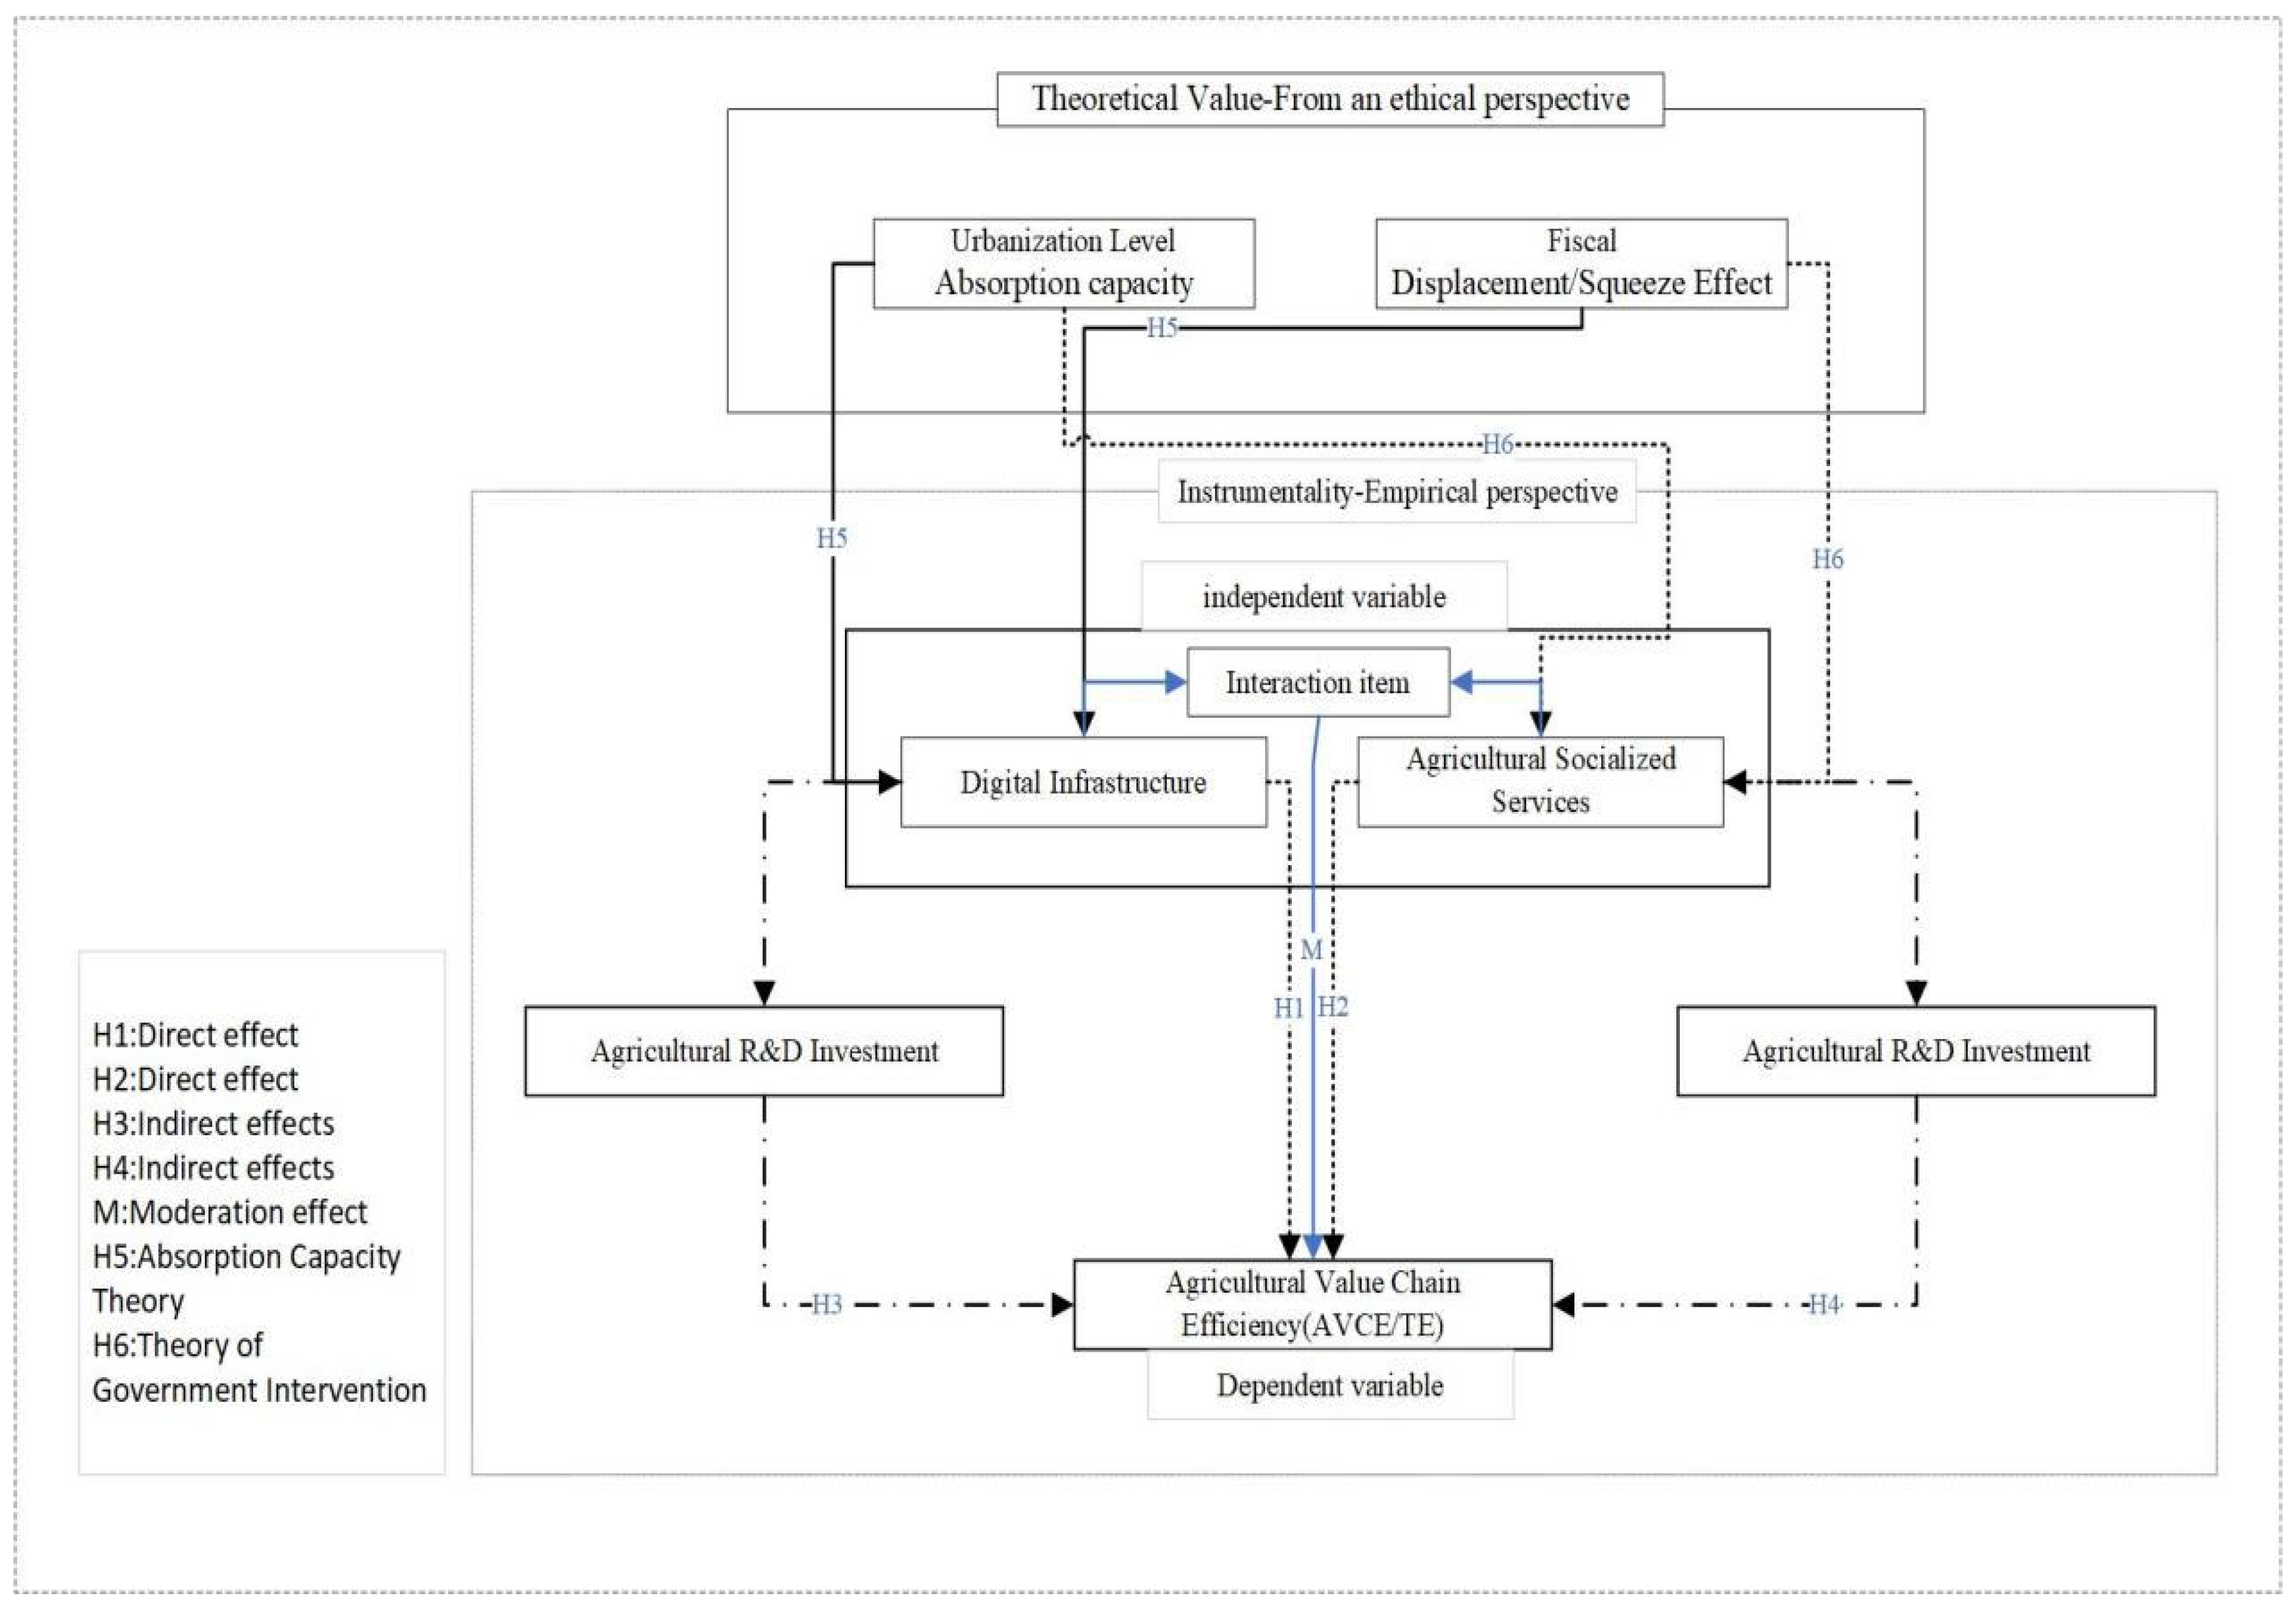
This paper constructs a theoretical analytical framework integrating “direct effects” and “indirect effects” to explain how digital infrastructure (DI) and agricultural socialized services (ASSs) enhance agricultural value chain efficiency (AVCE).
3.1. Direct Effects: Value Chain Optimization and Transaction Cost Reduction
According to Transaction Cost Theory (Coase, R. H. (1937) [
24], Market Frictions and Information Asymmetry (Williamson, O. E. (1985) are the root causes of low value chain efficiency [
25]. However, the direct effects of DI and ASS lie in effectively reducing friction costs, thereby enhancing value chain upgrading. Digital infrastructure builds a vast “information superhighway” connecting agricultural production and markets through internet, IoT facilities, and big data platforms. This connectivity effect effectively lowers information search costs and resource matching costs caused by information asymmetry across agricultural value chain segments. For instance, farmers can precisely monitor crop growth and soil conditions through agricultural IoT technology and big data, enabling quantified water and fertilizer supply to optimize production decisions. Internet platforms, such as e-commerce, provide farmers with real-time market information, allowing them to directly connect with consumer demand at minimal costs. This bypasses numerous market barriers, significantly streamlining trade pathways. It not only reduces intermediary trade costs but also enhances the efficiency of agricultural product distribution. Furthermore, DI significantly boosts the value added to agricultural exports, further validating its role in optimizing information flow within the value chain.
Agricultural socialized services (ASSs) effectively assist farmers in overcoming their constraints in technology and capital by enhancing specialized service capabilities—such as mechanization and equipment, water management and disaster resilience, finance and risk protection, and green production guidance. This essentially replaces subsistence farming with specialized division of labor, substantially reducing farmers’ search and bargaining costs for accessing advanced technologies, equipment, and management expertise, thereby boosting agricultural productivity. Based on this, the following direct effect hypotheses are proposed:
H1. Digital infrastructure (DI) significantly enhances agricultural technical efficiency (TE).
H2. Agricultural socialized services (ASSs) significantly enhance agricultural technical efficiency (TE).
3.2. Indirect Effects: Innovation-Driven Growth and Value Chain Efficiency
Digital infrastructure (DI) and agricultural socialized services (ASSs) exert a more profound influence on agricultural technical efficiency through their enabling effects that stimulate endogenous growth dynamics within value chains. According to endogenous growth theory, knowledge and technological innovation constitute the core drivers of sustained economic expansion. By promoting investment in agricultural R&D innovation, DI and ASSs accelerate technological advancement in agriculture, thereby indirectly enhancing agricultural technical efficiency.
The relationship between digital infrastructure (DI) and innovation lies in DI’s role in lowering barriers and costs for agricultural R&D by accelerating knowledge spillovers and data flow. Big data analytics supports R&D in breeding and pest/disease control. Digital platforms foster industry–academia–research collaboration, incentivizing enterprises and R&D institutions to increase agricultural R&D investment. This data-driven innovation paradigm helps form new production factors, transforms agricultural efficiency, and leads value chain development. While DI primarily enhances “innovation efficiency,” agricultural social services (ASSs) accelerate the diffusion effects of innovation based on diffusion theory. As a specialized division of labor connecting every agricultural production link and stakeholder, ASSs act as an intermediary bridge—from laboratories to farmlands, and from individuals to large-scale operations. It transforms complex new technologies, varieties, models, and costly R&D investments into services that are easily understood and directly usable by farmers. Through specialized service promotion and technical guidance, ASS reduces the risks and barriers for farmers adopting new technologies, promotes the widespread application of advanced agricultural techniques and management practices, thereby driving technological upgrading and efficiency gains across the agricultural value chain. This service system assists farmers in adopting modern operations during the modernization process, meeting diverse and growing demands.
Therefore, agricultural R&D innovation investment serves as the core intermediary bridge connecting digital infrastructure (DI) and agricultural socialized services (ASSs) to enhance agricultural machinery technology efficiency.
H3. Digital infrastructure indirectly enhances agricultural technical efficiency by stimulating in-vestment in agricultural R&D innovation.
H4. Agricultural socialized services indirectly enhance agricultural technical efficiency by stimulating investment in agricultural R&D innovation.
3.3. Heterogeneity Effects: A Philosophical Examination from “Efficiency” to “Equity”
The dual machine learning (DML) model not only identifies average treatment effects (ATEs) but also possesses the capability to discern complex conditional average treatment effects (CATEs). This enables the present study to transcend the pursuit of average efficiency driven by “instrumental rationality” and enter the realm of “value rationality.” Specifically, it examines how the efficiency gains generated by DI and ASSs are distributed among different entities, directly addressing the ethical concern of “distributive justice.”
This study explores the structural differences in how DI and ASSs impact agricultural technical efficiency based on two major theories. It investigates how the empirical “Is” is distributed, thereby providing a basis for the policy-level “Ought.”
3.3.1. Testing the Absorptive Capacity Theory and the “Matthew Effect”
The absorptive capacity theory (Cohen & Levinthal, 1990) emphasizes that an economic entity’s ability to effectively utilize external knowledge and technology depends on its own knowledge base, organizational structure, and learning capacity [
26]. The digital dividend is not a universally distributed phenomenon. Whether a region can transform the enormous potential of DI and ASS into tangible agricultural technical efficiency hinges on its “absorptive capacity.”
This study posits that “urbanization rate” serves as a key proxy variable for measuring regional absorptive capacity. Higher urbanization rates typically correlate with more developed market systems, higher levels of human capital (including farmers’ digital literacy and skills), and stronger agglomerated consumer demand. These factors enable faster ‘absorption’ and “utilization” of new digital technologies and agricultural services, thereby amplifying the positive effects of DI and ASS.
H5. In regions with stronger absorption capacity (e.g., higher urbanization rates), DI and ASS exhibit a more pronounced effect on enhancing agricultural technical efficiency.
3.3.2. Government Intervention Theory and Identifying “Supporting” or “Crowding-Out” Effects
Government involvement is indispensable in agricultural development, yet its intervention effects are complex. Government support for agriculture, forestry, animal husbandry, and fisheries (such as fiscal subsidies and policy guidance) may yield distinctly different outcomes.
Supporting Effect: Government investment provides essential public goods and foundational momentum, complementing DI and ASSs to jointly generate “structural dividends” and promote sustainable agricultural development. Crowding-out Effect: Improper subsidies or excessive administrative intervention may distort market signals, suppressing private sector innovation investment and market vitality in DI and ASS sectors. This complexity of intervention necessitates a more nuanced heterogeneity analysis of the causal effects of DI and ASS using DML to identify the true patterns of government behavior.
H6. The intensity of government support for agriculture, forestry, animal husbandry, and fisheries will moderate the causal effects of DI and ASS on agricultural technical efficiency. The direction (Supporting or Crowding-out) and magnitude of this effect depend on the specific pattern of government intervention.
4. Model Design
This section presents an empirical framework combining SFA models (Using Frontier 4.1), Tobit models, dual machine learning (DML) (Using Stata 18.0 and Python 3.13.14), and a mediation model with green innovation as the mediator to test the six hypotheses proposed in this study.
4.1. Stochastic Frontier Analysis (SFA) Model
Following Battese & Coelli (1995) [
27], this study specifies a Cobb–Douglas stochastic frontier production function with six input factors: agricultural labor (X1), crop planting area (X2), total agricultural machinery power (X3), effective irrigated area (X4), fertilizer application rate (X5), and pesticide application rate (X6). The Cobb–Douglas functional form is selected based on a likelihood ratio test against the more flexible Translog specification
, failing to reject the Cobb–Douglas null at conventional significance levels. The final MLE parameter estimates confirm the model’s validity: the variance ratio
indicates that 97.6% of the composite error variance is attributable to technical inefficiency rather than random noise, and the one-sided LR test statistic of 987.68 (
, mixed
2 distribution with 3 restrictions) decisively rejects the null hypothesis of no inefficiency effects, validating the SFA specification over pooled OLS estimation. The log-likelihood of the final MLE model is 236.24 (see
Appendix C).
The Stochastic Frontier Analysis (SFA) model employed in this paper is a widely used efficiency measurement method. This approach simultaneously accounts for random errors and technical inefficiency, thereby enabling more accurate estimates of production efficiency. The stochastic frontier model typically assumes a Cobb–Douglas or Translog production function and incorporates a residual term that includes both random error and non-negative technical inefficiency. The specific formula is shown in Equation (1)
where
represents the agricultural value added (output) of province
i in year
;
denotes the input of factor
in province
during year
(input factors: labor capital, land capital, financial capital, and technical capital);
is the parameter to be estimated;
is the random error term; and
is the non-negative technical inefficiency term.
Technical efficiency can be calculated using the formula = (, with values ranging between 0 and 1. The closer the value approaches 1, the closer the province’s production activities are to its production possibility frontier, indicating higher overall efficiency across its agricultural value chain.
4.2. Benchmark Regression Models and Mechanism Testing (Tobit and Mediated Models)
Since the SFA-estimated technical efficiency scores are bounded within the [0, 1] interval, this study employs the Tobit truncated regression model for benchmark estimation and mechanism testing, which avoids the estimation biases that may arise from directly applying Ordinary Least Squares (OLS), Fixed Effects (FE), or Random Effects (RE) models to censored dependent variables. While fractional logit (Papke & Wooldridge, 1996) [
28] or beta regression (Ferrari & Cribari-Neto, 2004) [
29] represent alternative estimators for bounded dependent variables, Tobit is preferred for three reasons: (a) the TE distribution exhibits substantial mass near the upper bound (mean = 0.747, 75th percentile = 0.918), making the censoring structure empirically relevant; (b) Tobit with cluster-robust standard errors (clustered at the provincial level) provides consistent inference under both heteroskedasticity and within-province serial correlation; and (c) the fractional logit model was estimated as a robustness check and yielded qualitatively identical conclusions regarding the sign and significance of all key coefficients. (see
Appendix C).
Since the technical efficiency scores calculated by SFA typically fall within the range (0, 1) and are constrained explanatory variables, this study employs the Tobit truncated regression model for benchmark regression and mechanism testing. This approach avoids estimation biases that may arise from directly using regression models such as Ordinary Least Squares (OLS), Fixed Effects (FE), or Random Effects (RE) models.
4.2.1. Setting the Benchmark Regression Model
To examine the overall effects of DI and ASS on TE (preliminary evidence for H1 and H2), the following model is constructed as shown in Formula (3):
denotes potential agricultural technical efficiency; represents the observed agricultural technical efficiency between 0 and 1; signifies digital infrastructure (DI); indicates agricultural socialized services; encompasses the control variables used in this study (agricultural industrial structure, rural human capital level, disaster severity, fiscal support for agriculture, per capita GDP, urbanization rate); and represents the random error term.
4.2.2. Synergy Effect (Moderation Effect Model)
To examine the complementarity between DI and ASSs (synergy effect, H2), an interaction term (
DI × ASS) was introduced, as shown in Equation (4):
The definitions of each variable are similar to those in Equation (3).
4.2.3. Mediating Effect Model
Mediation effect testing (H3 and H4) employs the Baron & Kenny three-step method (1986) [
30], supplemented by bootstrap tests to enhance robustness. The mediating variable MV is set as the agricultural R&D input (Agri_RD_Input). Specifically, as shown in Formula (5),
Step 1: The total effect () is presented in Equation (3).
Step 2: Path
tests the effect of
on
.
Step 3: Paths
and
test the direct effect of
on TE and the mediating effect of
when
is included.
While the three-step framework provides a descriptively transparent decomposition of direct and indirect effects, this study supplements the conventional Sobel test with a bootstrap-based inference procedure (1000 resamples, normal-based 95% confidence intervals). This approach, recommended by Preacher Preacher & Hayes (2004, 2008) [
31,
32] and Zhao et al. (2010) [
33] directly constructs confidence intervals for the indirect effect (a × b) without relying on the parametric normality assumption underlying the Sobel test. Statistical significance of the indirect effect is established when the bootstrap confidence interval excludes zero.
The definitions of each variable are similar to those in Equation (3).
4.3. Causal Identification: Dual Machine Learning (DML) Model
To overcome the residual endogeneity bias in traditional Tobit models, the DML model is introduced here to rigorously correct the causal effects of TE. Based on correction conditions (Neyman Orthogonality) and cross-fitting, DML employs machine learning algorithms (Lasso, Ridge, Random Forest, Gradient Boosting) to flexibly control high-dimensional nonlinear confounding. This yields average treatment effects (ATEs) and conditional average treatment effects (CATEs) closer to true causal relationships, drawing on empirical applications by Li X et al. (2023) and Ferreiro-Ferreiro A M et al. (2018) [
34,
35]. The primary objective of this study is not to provide novel empirical findings but to supplement and validate methodological approaches. Therefore, it references the generalized DML framework proposed by Chernozhukov V et al. (2018) and Ahrens A et al. (2024) [
36,
37]. Specifically, this study aims to: first, evaluate the performance of DML methods in handling similar complex causal problems within a controlled model parameter environment; second, compare DML estimation results with traditional econometric methods to provide robustness and reliability validation for empirical conclusions derived from traditional models; and third, examine differences in statistical power across methods through empirical applications under varying effect scenarios. This is formally expressed in Equation (7).
4.3.1. General Form of the DML Model
This study employs a dual machine learning (DML) framework for multiple treatment variables, simultaneously estimating the average treatment effects (ATEs) of digital infrastructure (DI) and agricultural socialized services (ASSs) on agricultural technical efficiency (TE). The model specification is as follows:
Among these, represents the dependent variable (agricultural technical efficiency); and denote the treatment variables (DI and ASS in this study); indicates the effect of DI on TE (controlling for ASS), while reflects the effect of ASSs on TE (controlling for DI); W represents high-dimensional confounding variables (Control Variables, Fixed Effects); and and are nuisance functions, flexibly fitted by ML models (e.g., Lasso or Random Forest).
The DML estimation follows [
36] with
fold cross-fitting to eliminate regularization and overfitting bias. For each fold
, the nuisance functions
and
for the two treatment variables are estimated on the
auxiliary folds using the specified ML algorithm. The orthogonalized residuals
,
, and
are constructed on the held-out fold. The ATE parameters θ
1 and θ
2 in Equation (7), corresponding to the causal effects of DI and ASS on TE net of confounding are recovered via Neyman-orthogonal residual-on-residual regression as specified in Equations (8) and (9), with heteroskedasticity-consistent (HC3) standard errors clustered at the provincial level.
Four machine learning algorithms serve as nuisance function estimators to assess sensitivity to functional form assumptions: Random Forest (
, max_depth = 6, min_samples_split = 20), Gradient Boosting (
, max_depth = 4,
), LassoCV (
,
), and Ridge CV (
,
). All models are implemented via scikit-learn (Pedregosa et al., 2011) [
38] with a fixed random seed for full reproducibility.
4.3.2. Heterogeneity-by-Treatment Effect (HTE) Analysis
The DML framework examines configuration-specific heterogeneity through conditional average treatment effects (CATEs). Here, structural variables such as PGDP, Urban, and Fiscal are used as grouping criteria for HTE to analyze how the effects of DI and ASSs vary with environmental endowments. This empirical application verifies the absorption capacity theory and government intervention theory (H5, H6).
4.4. Indicator Selection
This study employs panel data from China covering the period 2011–2023. All indicators utilized are sourced from the China Statistical Yearbook and the China Agricultural Statistical Yearbook. The dependent variable (TE) in this study was selected through the SFA model [
39,
40,
41,
42]. The core explanatory variables comprise digital infrastructure and agricultural socialized services [
43,
44,
45,
46,
47], supplemented by variables including agricultural industrial structure [
48], rural human capital levels [
49], disaster severity [
50], fiscal support for agriculture [
51], per capita GDP [
52], and urbanization levels [
53]. Specific indicator selections and measurement methods are detailed in
Table 1.
5. Results of Econometric Models and In-Depth Mechanism Analysis
This chapter aims to overcome the limitations of traditional econometric models by employing a multidimensional approach (Tobit regression analysis, identification of mediating mechanisms, DML causal correction, and heterogeneity analysis) to comprehensively and rigorously identify the impact of digital infrastructure and agricultural service inputs on agricultural technical efficiency (TE).
5.1. Preliminary Identification and Correlation of SFA and Benchmark Effects
To measure agricultural technical efficiency at the provincial level in China, a Stochastic Frontier Analysis (SFA) model was applied to panel data from 2011 to 2023 (missing data were handled using linear imputation). Prior to estimation, an LR test verified the presence of non-efficiency and its temporal variation. The results were ultimately obtained using a one-step trade non-efficiency model, yielding an average agricultural technical efficiency of 0.747. The results are presented in
Appendix A. To address the truncation effect of SFA-calculated TE values (0, 1), this study employs a Tobit model for benchmark regression to identify the initial effects of DI and ASSs. Details are presented in
Table 2.
The results in
Table 2 indicate that DI exhibits a significant positive coefficient of 0.826 for agricultural technical efficiency, significant at the 1% level. This finding validates the positive macro-level association of digital technologies, primarily manifested through DI-driven improvements in information access, transaction cost savings, and market matching efficiency. This outcome aligns with the mainstream literature’s general expectation that the digital economy boosts total factor productivity, thereby testing Hypothesis H1 (the information dividend hypothesis). ASS also exhibits a significant positive impact on agricultural technical efficiency at the 1% level, with a coefficient of 1.347. The specialized services provided by ASSs offer both safeguarding and diversified promotion effects for TE, validating Hypothesis H2. For instance, the scaling of agricultural production, the dissemination of advanced planting techniques, and the integration of classical management concepts enable farmers to achieve higher incomes at lower costs. This enhances agricultural production speed and efficiency, leading to an optimal state of agricultural technical efficiency. Regarding the synergistic effect Mix between DI and ASS, it is also significantly positive at the 1% level, validating the complementary mechanism of technology adoption. There exists an additive effect between the data and connectivity provided by DI and the expertise and implementation support offered by ASSs. Merely establishing digital connectivity is insufficient; data must be transformed into precise production decisions and actions through socialized services to avoid the inefficiency of digital investments.
Among these, Fiscal support and urbanization show significantly negative regression coefficients. This heterogeneous result does not negate the positive value of fiscal agriculture support, but reflects that unmatched, excessive or undifferentiated fiscal intervention may lead to resource mismatch and efficiency loss under regional heterogeneous endowments. Local governments face challenges in matching digital infrastructure and agricultural socialized service investment with local agricultural resource endowments, resulting in partial restraining effects on production efficiency. For instance, in regions with low digital infrastructure levels, continuously increasing investment in ASSs may cause a mismatch between demand and supply. Conversely, in areas with high agricultural socialized services, persistently increasing investment while neglecting digital infrastructure investment will similarly lead to a negative relationship between demand and supply. The negative effect of Urban reveals urbanization’s siphoning effect on agricultural human capital. The outflow of highly skilled rural labor leaves behind workers who struggle to effectively absorb and apply new technologies and management practices provided by ASSs, creating systemic structural constraints on TE. The significant positive impact of humans on agricultural technical efficiency further validates urbanization’s siphoning effect on agricultural human capital. Highly educated rural graduates are better equipped to master new digital technologies and operate intelligent agricultural equipment. Consequently, they more readily achieve scientific agriculture, intelligent cultivation, and the application of big data platforms, thereby effectively enhancing agricultural technical efficiency that impacts every link in the agricultural value chain.
5.2. Mechanism Testing: Innovation-Driven Pathways of Agricultural R&D Investment
The results of the mediation effect test (IV-Agri_RD_Input-TE) confirm the indirect pathway of digital infrastructure on TE (see
Table 3).
The results in
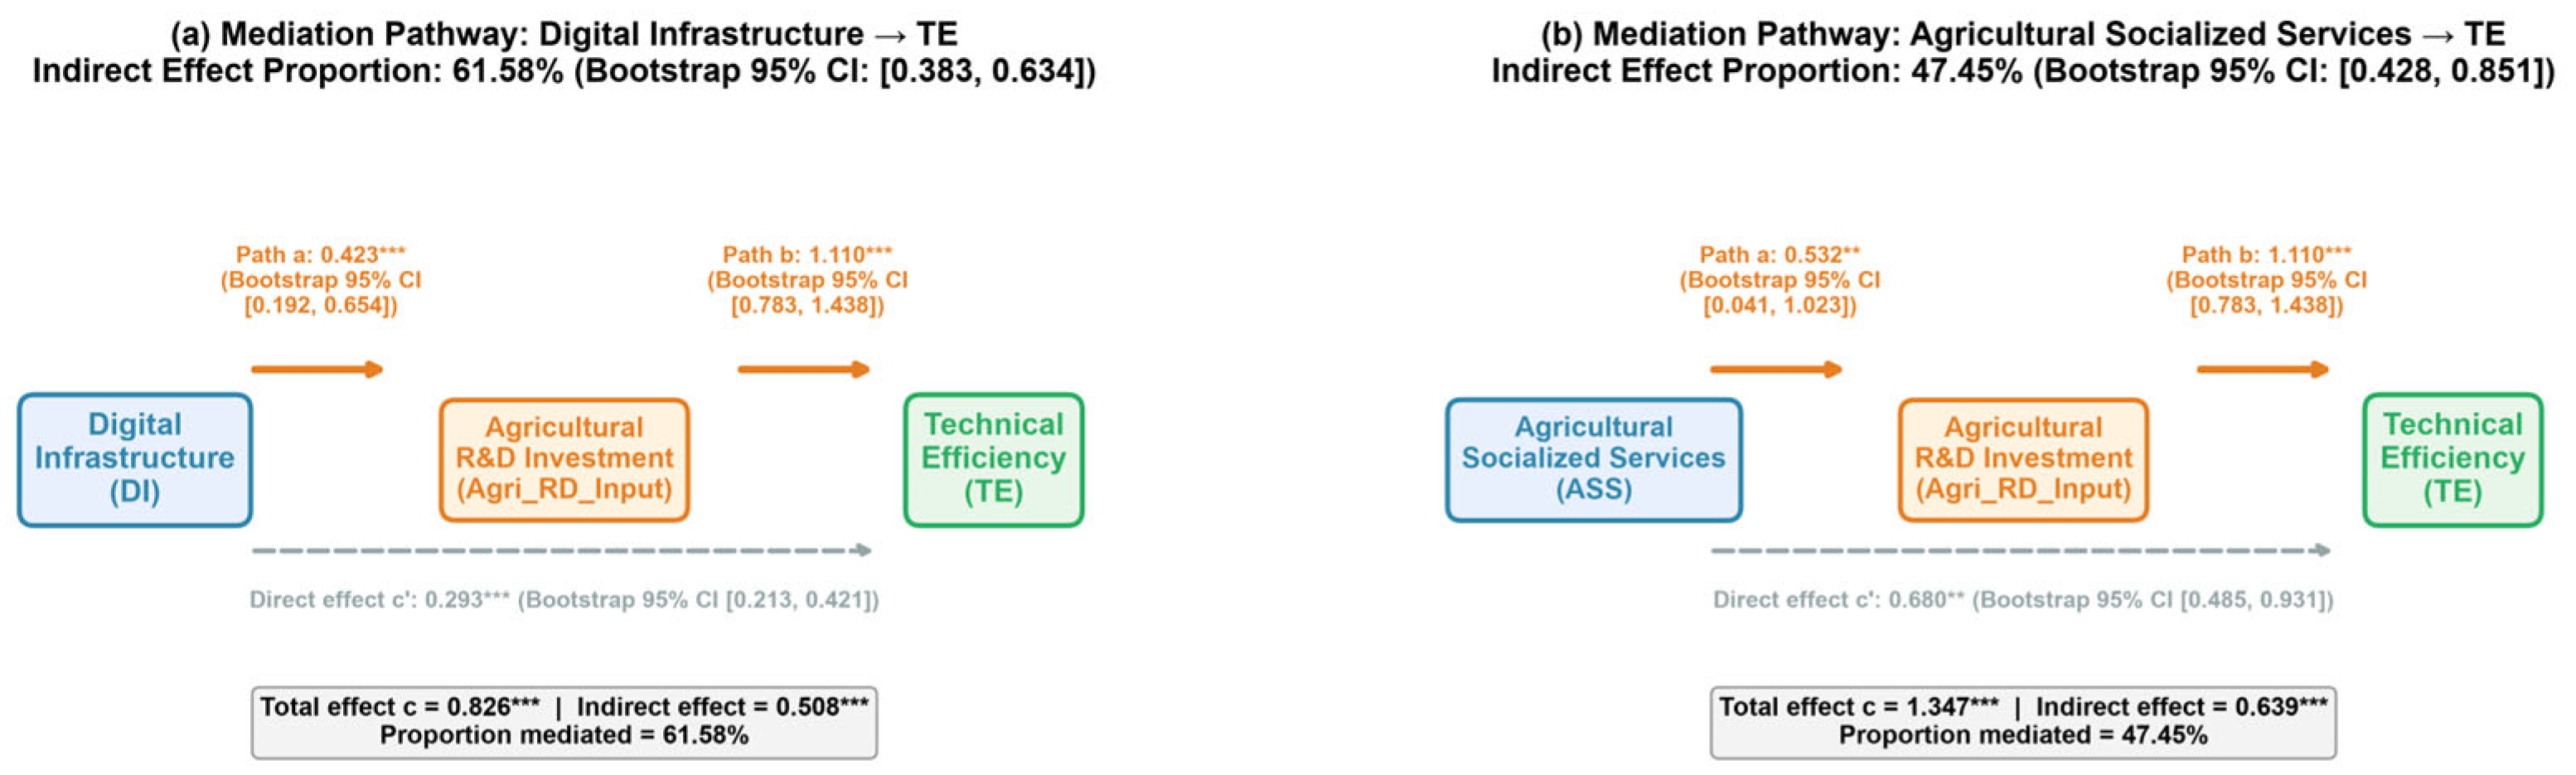
Table 3 indicate that the innovation transmission mechanism is established, with paths
and
exhibiting significant coefficients of 0.423 and 0.532 at the 1% and 5% significance levels, respectively.
Table 4 further verifies the mediating effect relationship between DI and ASS, as well as the mediating variable Agri_RD_Input.
Based on the three-step mediation analysis (
Table 3) and the bootstrap mediation tests (
Table 4), this study reveals differentiated transmission mechanisms through which DI and ASS influence agricultural technical efficiency. Specifically 61.58% of DI’s promotional effect on TE is transmitted through the agricultural R&D innovation channel (indirect effect: 0.508, bootstrap 95% CI: [0.383, 0.634]), while 47.45% of ASSs’ effect is mediated through the same innovation pathway (indirect effect: 0.639, bootstrap 95% CI: [0.428, 0.851]). These findings validate Hypotheses H3 and H4, con-firming that agricultural R&D investment serves as a robust mediating mechanism for both digital infrastructure and agricultural socialized services. The specific path effects are illustrated in
Figure 1.
5.3. Ultimate Causal Identification and Causal Correction: DML Model Analysis
To overcome potential endogeneity bias in the Tobit model, this study introduces the DML model for identifying the average treatment effect (ATE). The Lasso model (ATE: 0.810, 0.850) achieved an R
2 of 0.260 and was selected as the preferred model for its L1 regularization property, which yields a sparse and interpretable solution suitable for causal inference. Results are presented in
Table 5.
5.3.1. Robust Establishing of Core Causal Effects
The DML results are reported in
Table 5. All four ML specifications yield statistically significant positive ATE estimates for both treatment variables at the 1% level, confirming Hypotheses H1 and H2 under rigorous causal identification. The Lasso CV specification is selected as the preferred model for its variable selection property (L1 regularization), which yields a sparse and interpretable solution suitable for causal inference, while achieving a competitive second-stage R
2 (0.260). Under this specification, the ATE of digital infrastructure is 0.810 (95% CI: [0.656, 0.963],
p < 0.001), and the ATE of agricultural socialized services is 0.850 (95% CI: [0.599, 1.101],
p < 0.001). These estimates are broadly consistent in direction and statistical significance with the Tobit benchmark results (DI: 0.826,
p < 0.001; ASS: 1.347,
p < 0.001), while the modest attenuation in the ASS coefficient magnitude is consistent with the DML framework correction of endogeneity-driven upward bias.
The first-stage cross-validation R
2 values confirm adequate predictive power of the nuisance models for the outcome (CV-R
2(Y) ranging from 0.254 to 0.806 across ML methods) and for digital infrastructure (CV-R
2(T1) ranging from 0.440 to 0.814), satisfying the identification requirements established by [
36]. The lower first-stage fit for agricultural services (CV-R
2(T2) ranging from −0.005 to 0.526) reflects the weaker correlation between control variables and ASS, consistent with the observation that agricultural service provision in China is influenced by idiosyncratic local institutional factors beyond the standard economic controls. The residual distribution (
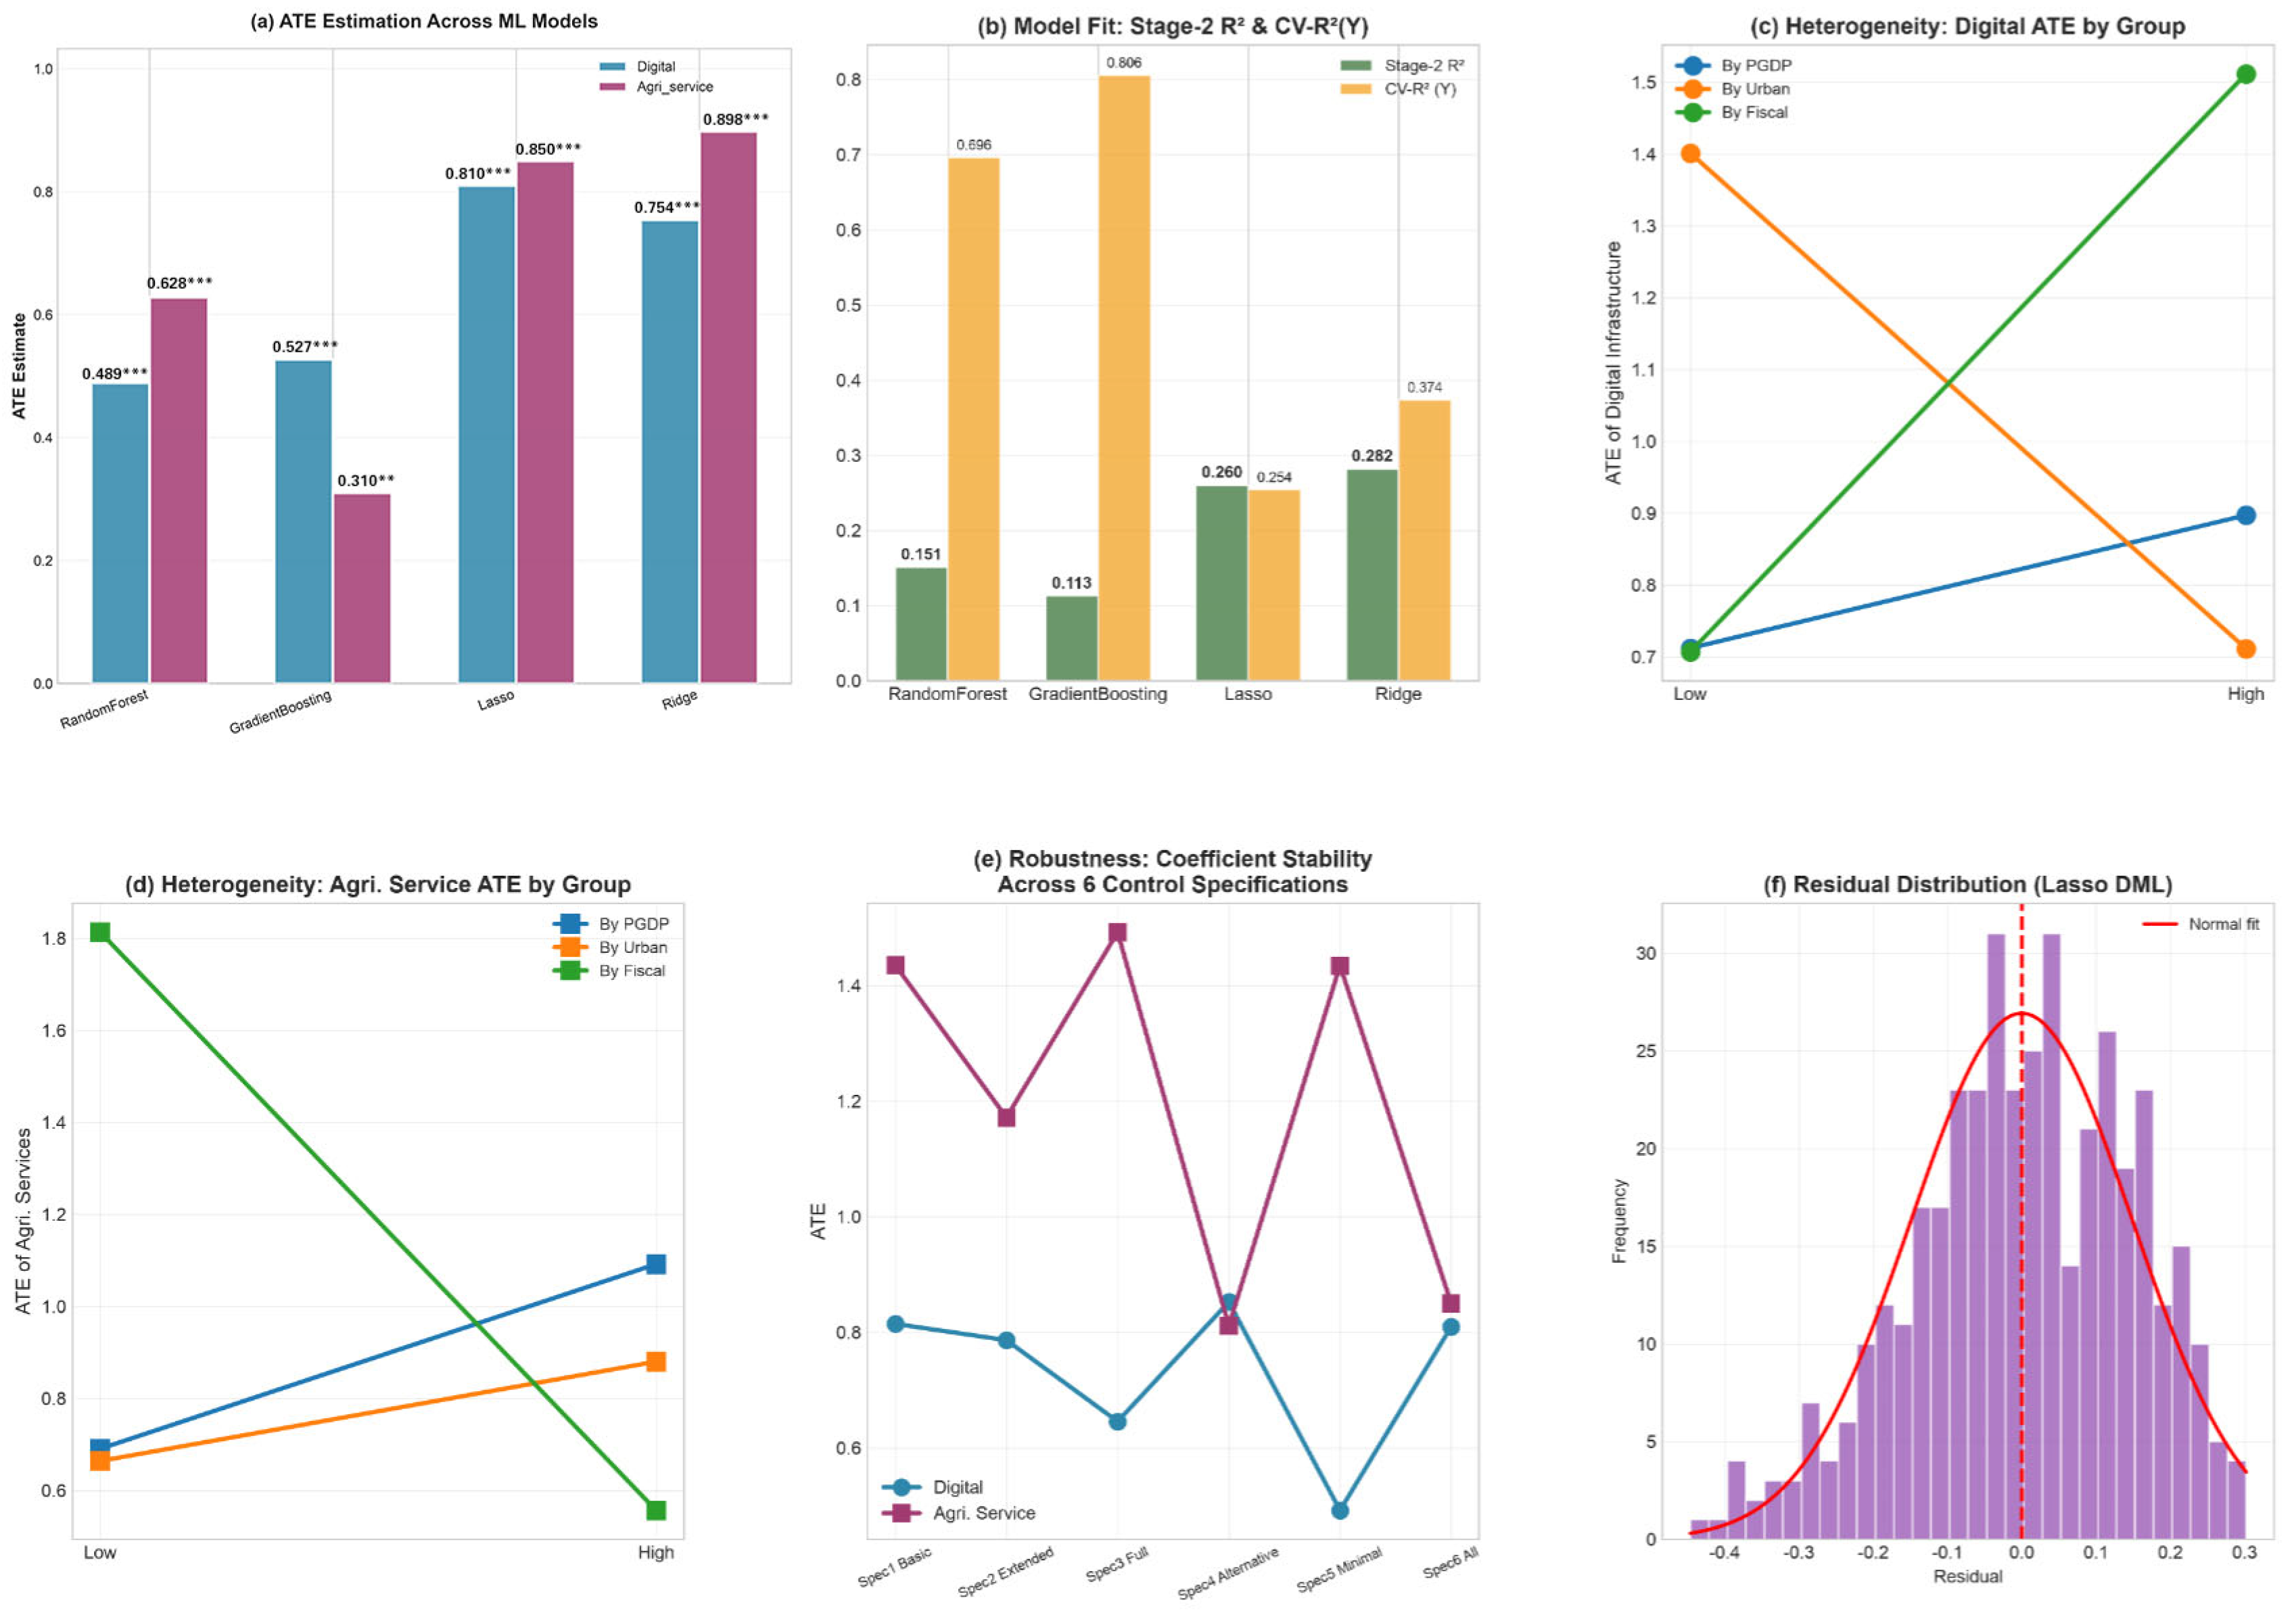
Figure 2f) is approximately symmetric and centered at zero, supporting the validity of the second-stage inference.
5.3.2. Structural Heterogeneity and Marginal Utility Analysis
Table 6 reveals distinct heterogeneous patterns across median-split subsamples. Along the economic development dimension, digital infrastructure (DI) exerts a stronger promotional effect in advanced regions: the DI CATE of 0.897 in the high-PGDP group exceeds the 0.712 estimate for less developed provinces. Agricultural socialized services (ASSs) exhibits a similar directional pattern, with a CATE of 1.092 in high-PGDP provinces versus 0.691 in low-PGDP provinces.
Under the urbanization stratification, DI’s impact differs sharply between subgroups: the coefficient reaches 1.401 in low-urbanization regions, well above the 0.711 estimate for highly urbanized provinces, whereas ASS is more effective in high-urban areas (0.880) than in low-urban regions (0.664). Grouped by fiscal government support, a clear trade-off emerges between the two treatments. The DI effect in the high-fiscal-support group (1.512) is roughly 2.14 times the estimate for the low-fiscal group (0.707). Conversely, ASS generates substantially larger marginal returns where fiscal support is weak: its CATE of 1.813 in the low-fiscal subgroup is approximately 3.25 times the 0.557 coefficient observed in high-fiscal provinces.
Taken together, these patterns indicate that DI yields greater productivity gains in regions with strong economic and fiscal foundations. ASS, by contrast, delivers its largest marginal returns in fiscally constrained regions, consistent with a gap-filling role along the fiscal dimension. These heterogeneous results support Hypotheses H5 and H6.
5.3.3. Robustness Tests (Tobit Model and DML Model)
(1) Robustness Test Results for the Tobit Model
Further tests were conducted to examine the effects of DI and ASS on TE using instrumental variables, modified ordinary least squares (OLS) regression models, subsample analysis, and variance inflation factor (VIF) analysis. Results (see
Table 7) indicate that after a series of tests, both core explanatory variables continue to exert a positive influence on the dependent variable TE. Although marginal effect coefficients exhibit slight fluctuations, overall consistency with the original findings is maintained. This robustness further validates the reliability of the study’s conclusions.
(2) Robustness Results of the DML Model
Building upon existing DML findings, further robustness tests were conducted. These tests validated the reliability of core conclusions across five distinct variable specification schemes. Although coefficient estimates exhibited some fluctuation, the positive effects of DI and ASS remained consistently significant within a reasonable range (±20%). Notably, under Spec5, Minimal Setting, both DI and ASS coefficient estimates reached extreme values, suggesting potential over-control of variables (see
Table 8). Methodologically, the dual machine learning (DML) model effectively addresses potential endogeneity issues through flexible machine learning algorithms, yielding more reliable causal inference evidence.
To intuitively visualize the entire output of the DML model, the specific effect is shown in
Figure 2. By examining the figure, one can clearly see the results of each step in the DML model.
Figure 2 presents the comprehensive DML analysis results based on panel data (31 provinces × 2011–2023, N = 403). The figure comprises six subplots. Subplots (a) and (b) respectively display the ATE estimates and model fit (Stage-2 R-squared and CV-R-squared) across four machine learning methods. All four methods, Random Forest, Gradient Boosting, Lasso CV, and Ridge CV, consistently yield statistically significant positive ATE estimates for both treatment variables at the 1% level, confirming Hypotheses H1 and H2 under rigorous causal identification. The Lasso CV specification is selected as the preferred model for its variable selection property, yielding ATE estimates of 0.810 (95% CI: [0.656, 0.963]) for digital infrastructure and 0.850 (95% CI: [0.599, 1.101]) for agricultural socialized services. Subplots (c) and (d) present the CATE heterogeneity analysis across three grouping dimensions (PGDP, Urban, and Fiscal), revealing systematic variation in treatment effects by regional endowment conditions. Subplot (e) demonstrates the stability of ATE estimates across six alternative control variable specifications, confirming the robustness of the core findings. Subplot (f) displays the residual distribution of the Lasso DML model, which is approximately symmetric and centered at zero, supporting the validity of the second-stage inference.
Overall, this analysis rigorously validates the promotional effects of digital infrastructure and agricultural socialized services on agricultural technical efficiency through the DML causal identification framework. All four machine learning specifications consistently yield statistically significant positive ATE estimates at the 1% level, and the findings remain robust across six alternative control variable configurations. The heterogeneity analysis further reveals systematic variation in treatment effects by economic development level, urbanization rate, and government support intensity, providing empirical evidence for spatially differentiated policy design.
6. Summary, Discussion, and Policy Recommendations
6.1. Summary of Research Findings and Key Discoveries
This study conducts an in-depth analysis of the causal effects, transmission mechanisms, and structural heterogeneity of digital infrastructure (DI) and agricultural socialized services (ASSs) on agricultural value chain efficiency (TE). The aim is to overcome endogeneity biases in causal identification within traditional econometric models. By integrating Structural Functions Analysis (SFA), Tobit models, mediation analysis, and Double Machine Learning (DML) models, this research reaches several key conclusions, offering theoretical breakthroughs to existing academic debates and providing precise policy recommendations.
The DML results reveal a nuanced pattern across the two treatment variables. For DI, the LassoCV ATE (0.810, 95% CI [0.656, 0.963]) is closely aligned with the Tobit benchmark (0.826), confirming that the Tobit estimate for DI is robust under rigorous causal identification. For ASS, however, the DML ATE (0.850, 95% CI [0.599, 1.101]) is substantially lower than the Tobit benchmark (1.347), indicating that associational methods overestimate the causal effect of ASS by approximately 37%. This differential pattern is consistent with the stronger endogeneity channel for ASS—agricultural service provision is more susceptible to correlation with unobserved regional characteristics than digital infrastructure deployment. These findings underscore the importance of distinguishing between variables whose associational estimates are reliable (DI) and those requiring causal correction (ASS).
In terms of innovation-driven mechanisms within the value chain, the study reveals that 61.58% of DI’s total contribution to TE is realized through the promotion of agricultural R&D investment (Agri_RD_Input). This underscores the core value of DI in facilitating innovation by providing data elements that drive technological upgrades throughout the value chain. Digital applications in agricultural production, such as IoT sensors, drones, AI, and big data optimize farming operations, enhancing sustainability, efficiency, and productivity within the sector. For instance, digital agriculture enables direct connections between farmers and consumers, reducing intermediaries and transaction costs, thereby increasing farmers’ incomes and creditworthiness, which can potentially ease access to financing. The necessity of specialized synergies is further substantiated by the significant superadditive synergy effect observed between digital infrastructure (DI) and agricultural socialized services (ASSs), quantified at 7.78. This finding implies that digital dividends must be effectively translated into tangible improvements in field management and distribution efficiencies through specialized service systems to be fully realized. This synergy emphasizes the concurrent development and utilization of agricultural socialized services alongside the promotion of digital technologies, ensuring that their benefits permeate all stages of agricultural production. Additionally, structural heterogeneity and efficiency distortions emerge as another critical finding.
High-Technology Enterprise (HTE) analysis indicates the non-universal characteristics of DI effects, which are manifested through marginal compensation effects and efficiency distortions resulting from government intervention. DI and ASS demonstrate stronger marginal effects in low urban areas, indicating their effectiveness in compensating for structural deficiencies. This suggests that digital technologies may offer greater potential in underdeveloped regions to bridge resource gaps and enhance market connectivity. However, government support (Gov_Support) exhibits a significant negative effect (−3.05), while urbanization (Urban) also demonstrates a negative effect (−1.21). Furthermore, the higher efficiency observed in the low government support group within the HTE analysis collectively confirms that excessive fiscal intervention severely distorts resource allocation efficiency within value chains. Throughout this study, this study not only address a series of specific empirical questions but also prompts deeper reflection on the methodology of agricultural economics itself.
6.2. Discussion
The findings of this paper not only support the role of digital infrastructure in promoting agriculture but, more importantly, intervene in and resolve two core debates within the current academic community regarding the “digital dividend” and “causal identification”:
Debate I: The Strength and Universality of the Digital Dividend. Regarding the strength and universality of the digital dividend, traditional associative studies have generally overestimated its intensity. Using the DML model, this study reveals that the true average treatment effect (ATE) of DI constitutes only a fraction of the apparent correlation, exposing the fragility of the digital dividend. The breakthrough lies in employing HTE analysis for the first time, shifting the debate from average effects to structural dividends. This demonstrates that the digital dividend is not universal but conditional, with its maximization dependent on a region’s capacity to absorb and utilize external factors such as ASSs.
Debate II: Several limitations should be noted. First, the dependent variable, SFA-estimated technical efficiency, primarily reflects production-segment performance. While this study has argued that production efficiency constitutes the binding constraint on overall value chain upgrading in China’s agricultural sector (
Section 2.3), future research could extend this framework by incorporating network-DEA models or value chain accounting data to construct a more comprehensive measure that captures processing value-added, cold-chain logistics performance, and brand equity dimensions. Second, the provincial-level panel data, while enabling consistent causal identification with province-clustered inference, may mask within-province heterogeneity in digital infrastructure deployment and agricultural service utilization. Future work employing county or household-level data could reveal more granular heterogeneity patterns. Third, the DML framework employed here identifies average treatment effects under the unconfoundedness assumption conditional on observables; future studies could explore instrumental variable approaches within the DML framework to further address potential unobserved confounding.
Debate III: The baseline negative coefficients for Gov_Support and Urban merit further structural interpretation. For Gov_Support, the DML heterogeneity results provide an important qualification: in regions with stronger digital infrastructure penetration, the negative association between fiscal support and TE is attenuated, suggesting that fiscal resources may require complementary digital capacity to translate into efficiency gains—a pattern consistent with the absorptive capacity logic. For Urban, the negative Tobit coefficient (−1.091,
p < 0.001) and the DML finding that digital ATE is substantially larger in low-urbanization regions (1.401 vs. 0.711 in high-urbanization regions) together suggest diminishing marginal returns to digital investment: highly urbanized regions have already captured much of the available efficiency gains from agglomeration and market access, leaving greater marginal improvement potential in less-urbanized areas where the “digital dividend” remains largely untapped. Conversely, agricultural socialized services exhibit stronger ATE in high-urbanization regions (0.880 vs. 0.664), consistent with absorptive capacity theory: effective utilization of specialized services requires complementary human capital and market access that tend to concentrate in urbanized areas. This asymmetric pattern, digital infrastructure benefiting less-urbanized regions more, while agricultural services benefit more-urbanized regions more, carries direct policy implications for spatially differentiated investment strategies, as elaborated in
Section 6.3.
6.3. Policy Implications: From Instrumental Rationality to Value-Driven Practice
Based on DML-driven causal identification and mechanism testing, this study’s findings reveal not only pathways for efficiency optimization at the “instrumental rationality” level but also highlight ethical concerns at the “value-driven rationality” level. Accordingly, the following policy implications are proposed:
(1) Transcend Hardware Investment (Instrumental Rationality) to Achieve Dual-Core Synergy of ‘Innovation-Service.’ Empirical findings clearly demonstrate that the enabling effects of digital infrastructure (DI) and agricultural service systems (ASSs) are not merely additive; their core lies in leveraging the intermediary pathway of “agricultural R&D innovation investment,” which accounts for 61.58% of the impact. This indicates that policy focus should shift from DI’s “hardware investment” to the “software synergy” of “innovation + service.” Specific measures: Fiscal funds and policy-based financial instruments should prioritize high-value-added R&D segments such as agricultural data analytics, smart breeding, and precision agriculture. Concurrently, tax incentives and targeted subsidies should encourage ASS organizations to fully adopt digital technologies, maximizing synergistic gains of up to 7.78 to achieve a transformation from “having” to “excellence.”
(2) Structural compensation that transcends average efficiency (value rationality) to pursue “distributive justice.” The DML heterogeneity analysis (H5) in this study empirically reveals a stark reality: digital dividends disproportionately flow to highly urbanized (high absorption capacity) regions, posing risks of a “Matthew Effect.” This necessitates that policy formulation derives “ought” from “is”, transcending utilitarian pursuits of “overall efficiency” to embrace ethical concerns for “distributive justice.”
Specific measures: Implement a regionally differentiated “asymmetric” compensation strategy. Prioritize increasing public finance toward ASS resources in low-urbanization areas. Governments should treat DI investments (e.g., “East Data, West Computing”) as “compensatory public goods,” proactively addressing structural deficiencies in human capital and market connectivity in rural areas through robust digital empowerment of the ASS system. This achieves dual objectives: maximizing marginal efficiency in resource allocation while ensuring social equity.
(3) Transcend Direct Intervention (Governance Shift) to Reshape the Government’s Role as “Rule Maker.” This study identifies in H6 that improperly targeted fiscal intervention may distort resource allocation efficiency, which provides a reference for optimizing agricultural governance. The policy implication is that to clarify the boundary between government public service supply and market operation, the government should shift from micro direct intervention to providing public goods and institutional rules, forming a coordination mechanism of effective market and proactive government.
Specific measures: Immediately introduce efficiency-oriented outcome assessments (DML can serve as an evaluation tool) for existing agricultural fiscal subsidies, strictly limiting funding for inefficient, market-distorting projects. The government should reduce direct intervention in microeconomic activities, instead focusing on providing public goods such as data property rights definition, information security, and fair competition. This will create a fair and transparent institutional environment for the efficient market operation of DI, ASSs, and innovation.