Article

The Impact of New Energy Vehicle Pilot Policies on Urban Green Transition in China

1
School of Economics and Management, Hubei University of Technology, Wuhan 430068, China
2
Hubei Development Research Center of Agricultural Equipment Manufacturing Industry, Wuhan 430068, China
3
School of Economics and Management, Wuhan University, Wuhan 430072, China
*
Author to whom correspondence should be addressed.
Sustainability 2026, 18(16), 8110; https://doi.org/10.3390/su18168110 (registering DOI)
Submission received: 29 June 2026 / Revised: 28 July 2026 / Accepted: 3 August 2026 / Published: 8 August 2026

Abstract

Against the backdrop of carbon peaking and carbon neutrality targets alongside the drive for high-quality urban development, the rollout of new energy vehicle pilot initiatives has become a core pathway to facilitate low-carbon transition in the transport sector. China launched the demonstration and promotion pilot policies for NEVs in 2009. Based on the externality theory, Porter Hypothesis, and financial resource allocation theory, this paper analyzes how different stakeholders respond to policy shocks and systematically elaborates on the internal mechanism through which NEV pilot policies affect urban green transition. It thoroughly clarifies the inherent transmission channels through which NEV trial policies reshape urban low-carbon development. Using a multi-period difference-in-differences (DID) framework with panel data spanning 282 cities from 2003 to 2022, the findings indicate that pilot policies have significantly enhanced the urban green transition in China. However, this positive effect is predominantly driven by improvements in green technical efficiency (GTE), while the policy’s impact on green technological progress (GTP) is notably weaker. The effects of these policies exhibit regional heterogeneity: the marginal gains generated by the trials turn out to be more substantial within central and western China, as well as in resource-growing and regenerative cities. Further tests reveal that green technological innovation and financial support positively moderate the impact of new energy vehicle pilot policies on urban green transition.

1. Introduction

Tackling global climate risks and advancing full-scale green, low-carbon restructuring of socioeconomic systems has reached worldwide consensus. Urban areas are the primary sources of carbon emissions and key centers of resource consumption, making them essential to fulfilling the commitments specified by the Paris Agreement. As the leading emitter of CO2, China commits to carbon peaking by 2030 and carbon neutrality before 2060. However, reaching such climate targets will require a significant increase in the proportion of renewable power within total electricity production [1]. Among various strategies for green transformation, the electrification of transportation stands out as a highly viable and effective solution. Unlike traditional gasoline-powered internal combustion engine vehicles, new energy vehicles (NEVs) generate less exhaust emissions, which is crucial for improving urban air quality [2]. But their total environmental performance is conditional because the net emission-reduction gains are constrained by regional power generation structure, battery manufacturing embedded carbon, and end-of-life recycling processes across the full life cycle [3,4]. Establishing a power system dominated by green energy will not only support steady economic growth, but also provide significant ecological and environmental benefits [5].
Governments worldwide are promoting vehicle electrification not only to address energy, climate, and environmental challenges, but also to secure or expand their position in the global automotive value chain [6]. To foster the sustainable growth of the domestic NEV industry, Chinese governments at all levels have successively issued various favorable regulatory rules and fiscal incentive plans. A significant initiative, known as the “Ten Cities, Thousand Vehicles” demonstration program, was formally initiated back in 2009 under the joint release of multiple central ministries. This scheme planned to put one thousand electric vehicles into trial demonstration operations annually across 10 pilot cities within 3 years, signaling the official launch of China’s large-scale popularization of NEVs. In 2010, 12 more cities were incorporated into the pilot program. By 2013, the pilot initiative had grown to 88 cities, creating a comprehensive framework for national promotion. Official data released by the Ministry of Transport in 2026 indicates that the transportation sector accounts for roughly one-tenth of China’s overall carbon emissions, and urban road vehicles contribute over 75 percent of this transport-related carbon output. As hubs for industrial manufacturing, daily commuting and freight logistics, cities bear the main responsibility for delivering the country’s carbon-reduction targets. Data on vehicle registrations from the Ministry of Public Security also reflects fast growth in new energy vehicles. The national stock of new energy vehicles stood at 13.1 million by late 2022, taking up a 4.1 percent market share. This figure jumped to 43.97 million by the end of 2025, with penetration rising to 12.01 percent. NEVs made up almost half of newly purchased cars that year. By combining market-driven incentives and administrative regulation, this mixed policy framework offers a dependable quasi-natural experiment for determining the causal impacts of composite policy tools on urban green transformation. Academic research examining the connection between NEV policy implementation and urban green upgrading has significantly increased in recent years. The current representative literature is categorized and summarized across several study dimensions in Table 1.
Most previous studies have simply equated urban green transformation with carbon-emission reduction or total-factor-productivity improvement, failing to analyze its internal structure in depth. This study additionally breaks down green total factor productivity into green technical efficiency and green technical progress: green technical efficiency reflects the optimal use of resource allocation and existing technology, while green technical progress reflects the breakthrough outward shift in the production frontier. Without distinguishing these two dimensions, one cannot precisely identify the policy’s pathways of action. Distinguishing the two is crucial for policy evaluation, with policies aimed at improving efficiency and those aimed at promoting technical progress differing markedly in their design logic and implementation effects. A typical means of improving efficiency is strengthening environmental regulation, while a typical means of promoting technical progress is increasing R&D subsidies. In addition, current research primarily emphasizes the immediate impacts of policy, often neglecting a thorough examination of the fundamental mechanisms that drive its effectiveness. It is essential to distinctly outline the specific routes by which policy facilitates urban green transformation, and such pathways may stem from firms’ innovation incentives, from the guidance of financial resources, or from other channels. Clarifying the answer to this question has important practical significance for optimizing and improving the relevant policies.
Compared to prior works, this paper delivers three core marginal contributions. First, it deconstructs the dual dimensions of urban green transformation, employing the global super-efficiency SBM-Malmquist index to precisely decompose GTFP into GTE and GTP, which supplements structural decomposition evidence for the policy evaluation literature. Second, this study constructs a complete logical framework connecting policy stimuli, micro-firm behavioral responses, and urban green performance, and further verifies such theoretical linkage through empirical tests. Green innovation and fiscal support are confirmed as core mediating pathways, through which demand-driven effects and risk mitigation mechanisms jointly propel regional green transformation. Third, this paper conducts heterogeneous analyses by geographical divisions and city resource endowments. The heterogeneous policy effects identified in this analysis offer solid empirical evidence for differentiated low-carbon governance policies tailored to local conditions.
The remaining content of this research is structured into six sections. Section 2 summarizes prior studies linked to our research theme. Section 3 elaborates the theoretical logic and derives testable hypotheses. Section 4 illustrates the empirical design, involving data sources and indicator definition, as well as econometric model setup. Section 5 discusses a series of empirical results from benchmark regressions, parallel trend tests, robustness and heterogeneity analyses, and mechanism tests. Section 6 concludes this work and delivers corresponding policy suggestions.

2. Literature Review

2.1. Economic and Environmental Effects of NEV Policies

NEV policies act as pivotal levers to accelerate the low-carbon restructuring of the transportation industry. Existing studies mainly explore how these policies shape technological innovation, industrial development, and environmental quality.
From the perspective of technological innovation, policy incentives alter firms’ innovation expectations and profit composition. Such policy shifts channel innovation resources toward low-carbon technological areas, thereby advancing major technical advances in power batteries, drive motors, and electronic control systems, as well as intelligent connected vehicle technologies [7]. Long-term, stable policies can reduce the risks of innovation activities and incentivize manufacturers to steadily scale up capital input for eco-friendly technological research and development [8]. Synergistic demand stimulation and supply policy backing exert pronounced promotional effects on green innovation, jointly boosting the scale and sophistication of firms’ innovative outputs [9]. Moreover, different policy tools produce varied innovation incentives; R&D subsidies combined with market-oriented constraints are more conducive to disruptive green technological breakthroughs [10].
For industrial development, NEV pilot policies expand market scale, improve supporting infrastructure, and drive the coordinated upgrading of upstream and downstream industrial chains [11]. Policy-driven market growth generates economies of scale, lowers production costs of complete vehicles and components, and strengthens the industry’s international competitiveness [12]. Enhanced charging infrastructure improves consumer experience, boosts NEV adoption rates, and forms a virtuous industrial cycle [13]. However, regional disparities in industrial foundations lead to uneven policy effects, and regions with superior economic and supporting conditions tend to gain more policy dividends [14]. In addition, heterogeneous policy instruments generate differentiated stimulus for innovative activities. Integrating research and development subsidies with market-binding mechanisms can better facilitate the emergence of revolutionary green technologies [15].
Regarding environmental effects, the popularization of NEVs delivers direct environmental benefits and drives coordinated green upgrades to transportation, energy, and urban infrastructure [37]. As clean transportation tools, NEVs occupy a central position in curbing carbon release and air pollutants within the transportation sector [16]. The promotion of low-carbon transportation, exemplified by NEVs, optimizes urban energy consumption patterns and reduces reliance on fossil fuels [17]. Large-scale substitution of conventional fuel vehicles with NEVs directly reduces fossil fuel consumption and enhances urban air quality [18]. Empirical studies confirm that electric vehicles substantially decrease urban carbon emission intensity [19]. The expansion of EV charging infrastructure and the population of NEVs significantly reduce city-level NO2 and PM2.5 [20,21]. However, the emissions reduction benefits of NEVs depend on the power generation mix: in regions reliant on coal-fired power, the full life-cycle carbon advantage of NEVs is diminished [22]. Moreover, research using the CGE model has evaluated reducing coal consumption and appropriately lowering electricity prices can jointly achieve both environmental and economic benefits [38].

2.2. Measurement and Driving Factors of Urban Green Transition

Urban green transformation aims to reconcile economic expansion with reduced resource depletion and environmental burdens, which constitutes an essential underpinning for high-quality socioeconomic development. With deepening theoretical and empirical research, the connotation of green transformation has extended far beyond simple pollutant reduction. This concept has developed into a multi-layered system covering resource efficiency promotion, technological advancement, industrial restructuring, and ecological governance [39]. Green total factor productivity (GTFP) incorporates expected gains alongside pollutant-related undesired outputs into its evaluation system. Owing to this integrated feature, it has been widely adopted by the existing literature to quantify the level of urban green transformation [23].
In terms of empirical estimation, the global super-efficiency SBM-Malmquist index addresses the defects of conventional models in cross-period comparative analysis and avoids biased judgments on technological degradation, which offers distinct advantages for evaluating the dynamic evolution of urban green efficiency [24]. Urban green transition is driven by the combined effects of multiple influencing factors [25]. Environmental regulatory policies guide firms to deploy green technologies by formulating industrial standards, implementing targeted supervision, and rolling out multi-type incentive tools [28]. As a core endogenous driver, green technological innovation helps lift energy utilization efficiency and popularize clean production modes [29]. In addition, green finance steers social capital flows to low-carbon and environmentally sustainable industries, relieves the financing pressure on green investment projects, and furnishes solid financial guarantees for the long-term green development of cities [30].

2.3. Study on Charging Infrastructure, User Behavior and Grid–Vehicle Coupling

The transformation and upgrading of the energy sector relies on cross-departmental collaboration. The delayed deployment of smart charging infrastructure in several European countries prevents electric vehicle owners from benefiting from low electricity prices during off-peak hours, and obstructs the integration of transport demand with power system flexibility. Such barriers substantially impede the improvement of resource utilization efficiency [31]. Apart from exploring the direct impacts of purchase subsidies for new energy vehicles (NEVs), a growing literature focuses on three indirect channels through which pilot policies facilitate urban green transition: charging network construction, residents’ charging decision-making, and grid coordination. First, with the advancement of generative artificial intelligence, scholars widely adopt multi-objective spatial optimization algorithms to plan the layout of public charging piles, balancing user accessibility, grid load and construction costs. Huang et al. [32] adopted the SAML model combined with SHAP technology and spatial loss functions to explore nonlinear relationships in the layout of electric vehicle charging stations. The study identified parking space quantity, road density, population density, and the distribution of commercial and residential zones as the core determinants for selecting optimal charging station locations. Lamontagne et al. [33] constructed a mixed logit model based on massive urban charging orders, and found that charging prices, parking convenience, and power supply stability are the three core factors affecting residents’ willingness to use public charging piles. Consumers tend to hesitate to purchase new energy vehicles due to range anxiety related to charging. Taking users’ heterogeneous personal preferences and the maximization of perceived utility as core considerations, Lv et al. [34] proposed a multi-scenario charging station reservation system based on three binary linear programming models.
In summary, the extant literature fully demonstrates that spatial and geographical characteristics exert decisive impacts on charging station planning [35], while charging cost stands as the dominant factor shaping residents’ charging decisions [36]. Beyond emission reduction achieved through the substitution of fuel vehicles, new energy vehicle (NEV) pilot policies facilitate low-carbon development via the whole industrial chain, including the rational layout of charging infrastructure, adjustments to residents’ travel and charging behaviors, and the upgrading of urban energy structures. Such research findings enrich and complement the policy evaluation analytical framework constructed in this paper.

3. Theoretical Foundation and Research Hypotheses

3.1. Theoretical Foundation

From the perspective of externality theory, conventional fuel vehicles generate notable negative externalities manifested in air contamination and excessive carbon release. Such market failures will distort the allocation of transportation resources if urban mobility systems operate merely under unregulated market mechanisms [40]. Through consumption incentives, infrastructure supply and industrial guidance, NEV pilot policies internalize environmental costs, correct resource misallocation and create institutional conditions for urban green transition.
The Porter Hypothesis holds that reasonable policy interventions can trigger the innovation compensation effect of enterprises, stimulate R&D of green technologies and efficiency improvement, and achieve environmental improvement alongside productivity growth [41]. According to the financial resource allocation theory, green transition projects are characterized by large investment scale and long payback periods. Policy signals reduce the risk identification costs of financial institutions, guide capital to flow into green industries, and alleviate financing constraints [30]. Jointly driven by the above three theories, NEV pilot policies promote the restructuring of technological, capital, and industrial factors, and ultimately advance urban green transition.

3.2. Direct Influence Mechanism of Policies on Urban Green Transition

NEV pilot policies drive urban green transition through three direct paths. First, purchase subsidies, traffic priority, and user-side incentives raise the penetration rate of NEVs, accelerate the replacement of fuel vehicles by clean transportation tools, and curb fossil resource consumption plus pollutant release, thus achieving pollution reduction effects. Second, the policies boost the construction of charging infrastructure, energy storage systems and distributed energy facilities, accelerate the clean transformation of urban energy structure and elevate the efficiency of energy utilization, realizing the green upgrading of infrastructure. Third, the policies drive the green upgrading of industrial chains including vehicle manufacturing, spare parts production and vehicle recycling, which facilitates the overall low-carbon restructuring of industrial structure. Combined with the above effects, urban GTFP keeps rising and green transition is continuously advanced.

3.3. Moderating Role of Green Technological Innovation

Green technological innovation serves as a key moderator conditioning the policy’s green transition effect. NEV pilot policies increase the expected returns of green innovation and reduce R&D risks, motivating enterprises to expand R&D investment in power batteries, motor and electronic control systems, lightweight materials, and intelligent connected technologies. Increased R&D input promotes the output and transformation of green patents, improves energy efficiency and clean production capacity, and further lifts GTE and GTP. Green technological change expands production frontiers, while green technical efficiency optimizes the allocation of existing resources. Both factors jointly enhance urban GTFP, forming a complete transmission chain from policy incentives and R&D growth to efficiency improvement and green transition.

3.4. Moderating Role of Financial Support

Financial support functions as an important moderator that strengthens policy marginal benefits. NEV pilot policies serve as long-term strategic signals from the government, which in turn reduce information asymmetry and investment risks for financial institutions. As a result, this encourages commercial banks to increase the volume of eco-friendly credit and drives investments from green bond issuances and industrial funds into the NEV industrial chain. The steady financial inflow helps companies engaged in R&D, capacity expansion, and infrastructure development, resulting in increased investments in green fixed assets and R&D.
The surge in green investment fosters clean production technologies, optimizes energy structures, and promotes low-carbon industrial upgrade. These changes enhance urban ecological sustainable growth.
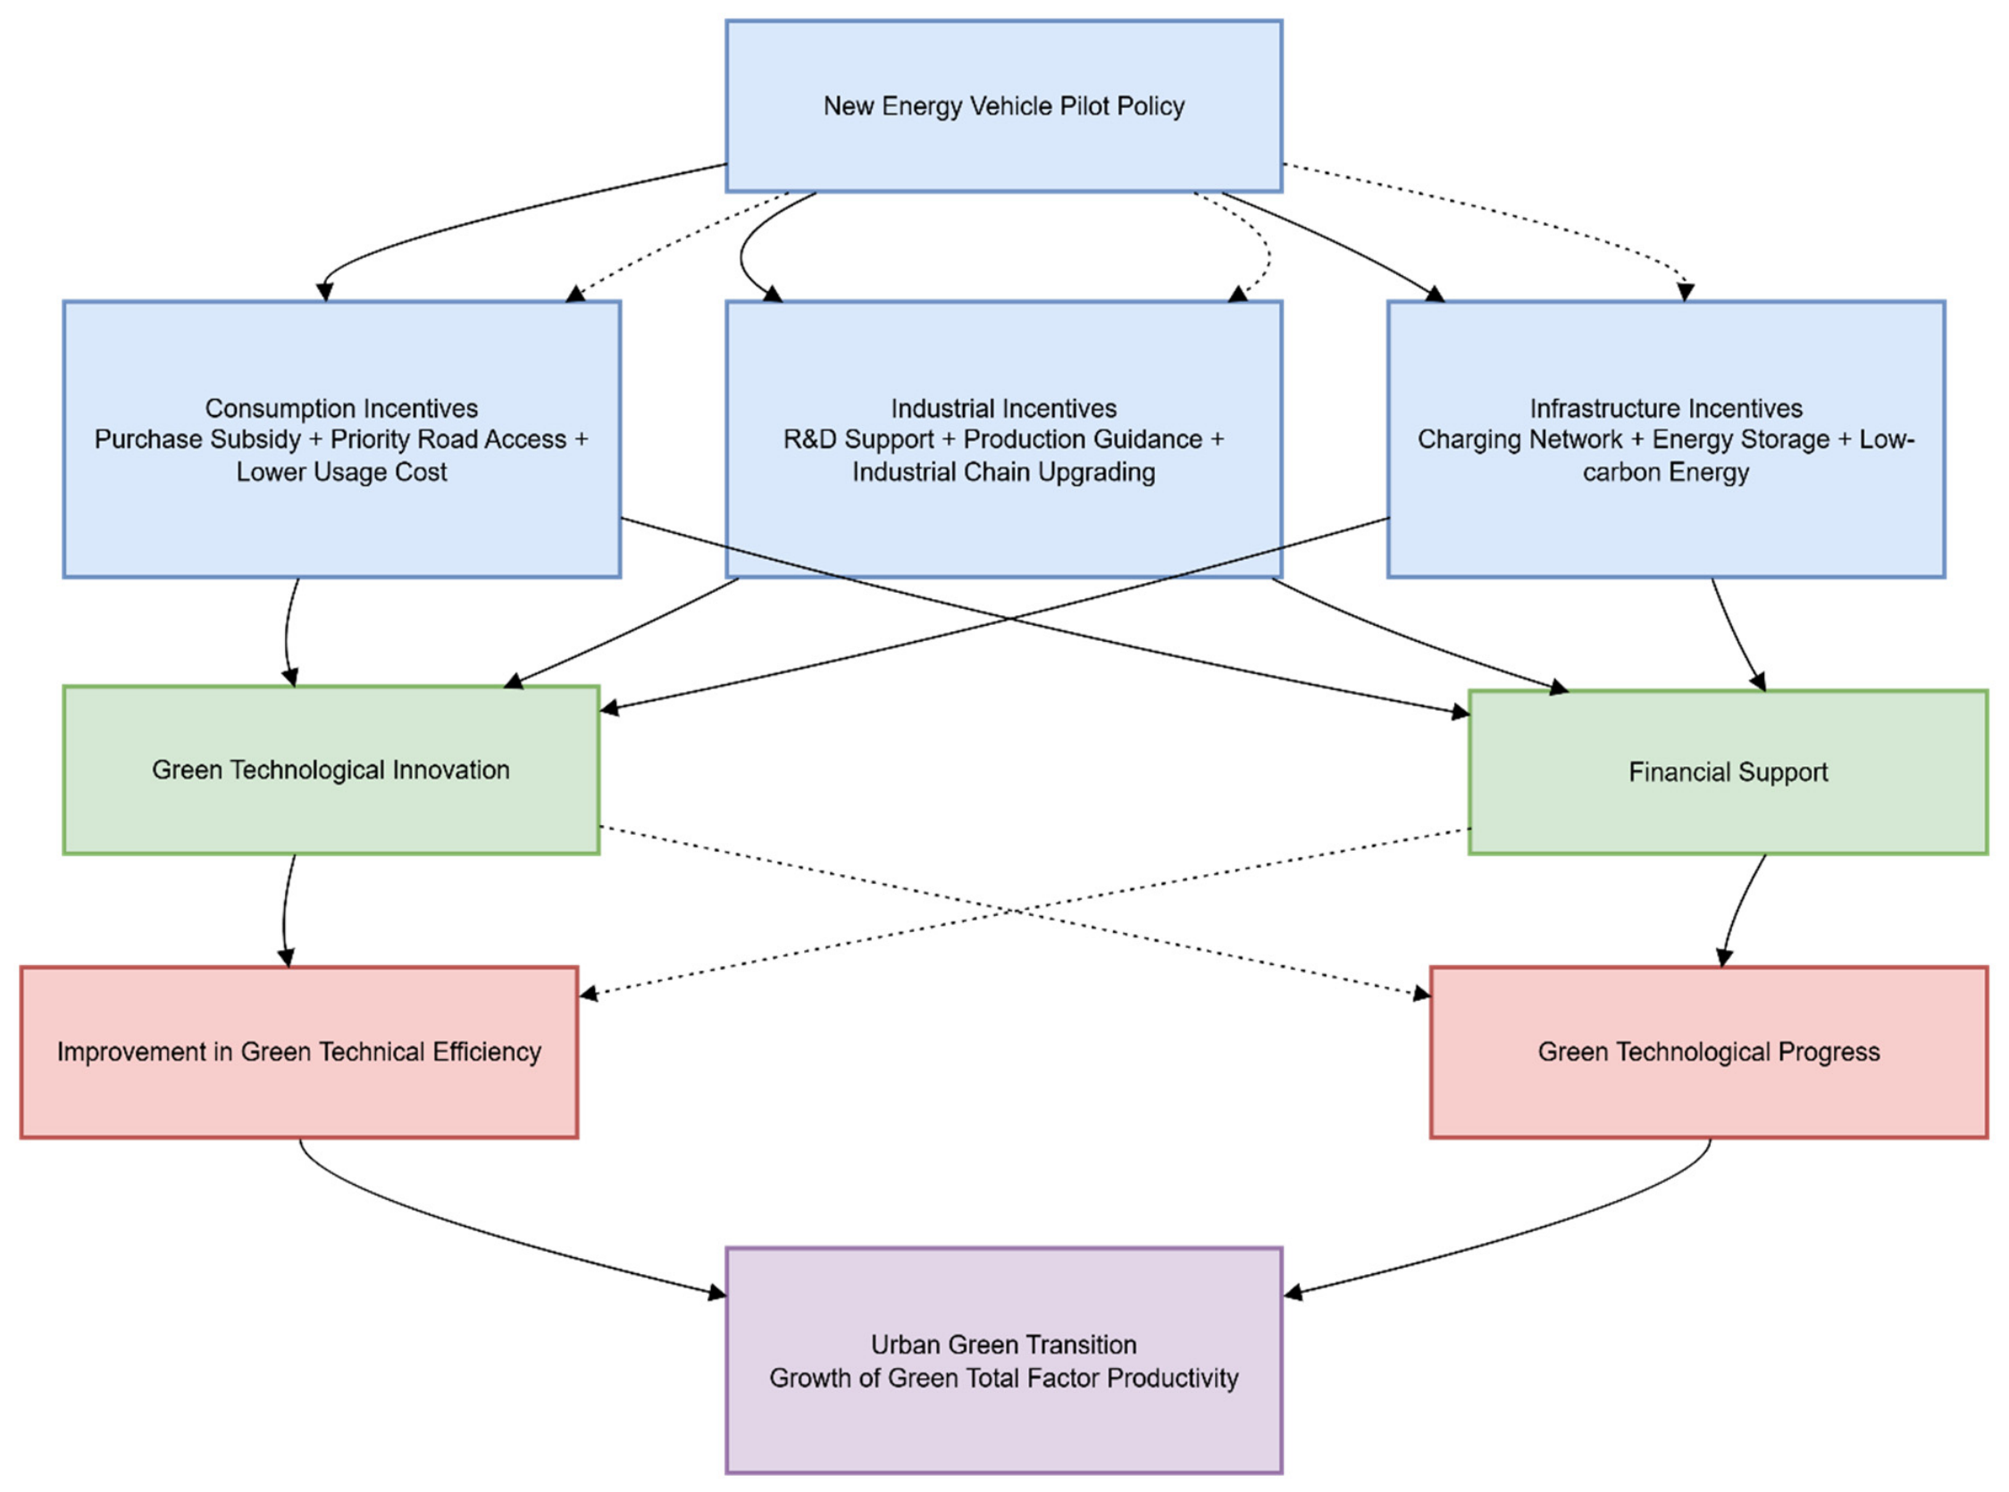
Drawing on this theoretical analysis, this research establishes the subsequent analytical framework (Figure 1).
Based on the conceptual framework, this study formulates three main hypotheses:
H1. 
NEV pilot policies have a significant and notable favorable effect on urban green transition.
H2. 
Green technological innovation strengthens the positive impact of NEV pilot policies on urban green transition.
H3. 
Financial support strengthens the positive impact of NEV pilot policies on urban green transition.

4. Research Design

4.1. Econometric Models

4.1.1. Baseline Regression Model

In 2009, China initiated the first batch of NEV demonstration pilot cities and subsequently expanded the initiative to additional cities in later years. Given the staggered implementation of the policy across cities, this paper adopts the multi-period DID model with dual fixed effects to quantify the persistent impacts of NEV trial schemes on cities’ sustainable eco-growth [42]. The baseline model is specified as:
G T F P i t = α 0 + α 1 D I D i t + j = 1 5 α j   C o n t r o l i t + μ i + γ t + ε i t
where G T F P denotes the green economic efficiency (urban green transition level) of city i in year t ; D I D i t is the core policy variable; C o n t r o l i t represents a set of control variables; μ i captures city-specific fixed heterogeneity; γ t absorbs time-invariant yearly shocks; ε i t denotes the stochastic error component.

4.1.2. Moderating Boundary Effect Test Model

To further explore the influencing mechanism of NEV pilot policies on urban green transformation, this study first regresses the pilot policy variable on green innovation and financial support, respectively. Then, the interaction terms between the policy dummy variable and the two mechanism variables are incorporated into Equation (1) to examine their moderating effects on urban green transformation. The corresponding empirical models are constructed as follows:
M i t = β 0 + β 1 × D I D i t + j = 1 5 β j   C o n t r o l i t + μ i + γ t + ε i t
G T F P i t = γ 0 + γ 1 × D I D i t × M i t + j = 1 5 γ j   C o n t r o l i t + μ i + γ t + ε i t
where M i t stands for the following moderating variables: green technological innovation ( G T I i t ) and financial support ( F S i t ).

4.2. Variable Definition and Measurement

4.2.1. Dependent Variable: Measurement of Green Economic Efficiency

This study measures green total factor productivity (GTFP) to assess urban green transformation; the indicator can reflect the coupling coordination between economic growth and environmental pressure. Traditional DEA models suffer from bias when handling non-desirable outputs and slack variables, while standard Malmquist indices risk misidentifying “technical regression” due to fluctuating frontiers. Therefore, we adopt the global super-efficiency SBM-Malmquist index, which decomposes GTFP into GTE and GTP.
First, each sample city is defined as a separate decision-making unit (DMU) to build the production possibility set. Suppose there are n cities i = 1 , , n , each operating in period t ( t = 1 , , T ) by utilizing m types of inputs x R + m , producing s 1 desirable outputs y g R + s 1 , and generating s 2 undesirable outputs y b R + s 2 .  Table 2 details the full input–output indicator system adopted within this analysis.
  • Step 1: Construct global production possibility set
To address the non-transitivity problem arising from differing production frontiers across time periods in traditional Malmquist indices, we adopt the global reference technology proposed by Oh (2010) [26]. All input and output data from every decision-making unit across all periods t = 1 , , T are pooled together to form a unified global production possibility set, denoted as P G :
P G = P 1 P 2 P T
where P t refers to the production possibility set in period t. Using this global set, a consistent and comparable global production frontier can be derived.
  • Step 2: Computing the Super-Efficiency SBM Directional Distance Function
The traditional SBM model yields a maximum efficiency score of 1, making it impossible to distinguish between multiple efficient decision-making units (DMUs). To address this limitation, this paper adopts the super-efficiency SBM (Super-SBM) model proposed by Tone (2002) [27], which allows the efficiency score of efficient DMUs to exceed 1. For a specific decision-making unit x 0 , y 0 g , y 0 b , the super-efficiency SBM directional distance function based on the global frontier, denoted as S G x 0 , y 0 g , y 0 b , is defined as:
S G x 0 , y 0 g , y 0 b = m i n 1 m i = 1 m x ¯ i x i 0 1 s 1 + s 2 r = 1 s 1 y ¯ r g y r 0 g + k = 1 s 2 y ¯ k b y k 0 b
The constraints are   x ¯ i x 0 , y ¯ r g y 0 g , y ¯ k b y 0 b . λ j 0 , and   λ is the weight vector. The triplet x ¯ i , y ¯ r g , y ¯ k b represents the projection point on the production frontier used to evaluate the decision-making unit x 0 , y 0 g , y 0 b . The value of this distance function can be greater than or equal to 1; a larger value indicates higher efficiency of the DMU relative to the global frontier.
  • Step 3: Calculating the Global Malmquist Productivity Index
The change in green economic efficiency from period t to period t + 1 is given by:
G T F P t t + 1 = E G x t + 1 , y g , t + 1 , y b , t + 1 E G x t , y g , t , y b , t
  • Step 4: Decomposition into Technological Progress and Technical Efficiency Change
The global Malmquist index can be precisely decomposed as follows:
G T F P t t + 1 = G T P t t + 1 × G T E t t + 1
where GTE and GTP are defined as: G T E t t + 1 = E t + 1 x t + 1 , y g , t + 1 , y b , t + 1 E t x t , y g , t , y b , t ,   G T P t t + 1 = E G x t + 1 , y g , t + 1 , y b , t + 1 / E t + 1 x t + 1 , y g , t + 1 , y b , t + 1 E G x t , y g , t , y b , t / E t x t , y g , t , y b , t . GTE measures the improvement in resource allocation efficiency; GTP measures the outward shift in the production frontier.
To obtain the cumulative change values of each index in each city year by year, this paper sets the base year to 2003 (with all index values equal to 1 in that year) and calculates the cumulative indices from 2004 to 2022 using chain multiplication. Specifically, G T F P i , t = s = 2004 t G T F P i , s 1 s , G T E i , t = s = 2004 t G T E i , s 1 s , G T P i , t = s = 2004 t G T P i , s 1 s .

4.2.2. Core Explanatory Variable

The primary explanatory variable, DID, is defined as the interaction between the pilot city indicator and the policy implementation period. Specifically, DID equals 1 for observations from NEV pilot cities during or after policy implementation and 0 otherwise.

4.2.3. Control Variables

To rigorously control for potential confounders affecting urban green development, this paper incorporates five control indicators: (1) Economic development level (GDPPC), calculated as the log value of municipal per capita urban gross domestic product; (2) fixed asset investment (INVEST), expressed by the natural log of each city’s actual fixed asset investment volume; (3) employment scale (EMPLOY), proxied through the logarithmic transformation of total local employed population; (4) industrialization level (STRU), captured by the share of secondary industry in urban; and (5) urbanization level (UR), measured by each city’s urbanization rate.

4.2.4. Mediating Variables

Two mediating variables are adopted within this empirical analysis: (1) Green technological innovation (GTI), quantified by taking the natural log of total granted green invention patents, with one added to avoid taking the logarithm of zero; and (2) financial support (FS), calculated as the quotient of financial institutions’ year-end outstanding loans divided by regional gross domestic product.

4.3. Data Sources and Descriptive Statistics

This research compiles a balanced panel dataset that spans 2003 to 2022 and covers 282 prefecture-level cities across China. The core data are extracted from official statistical publications, such as the China Urban Statistical Yearbook, China Labor Statistical Yearbook, China Environmental Statistical Yearbook, and China Energy Statistical Yearbook, with municipal statistical yearbooks adopted as complementary data sources. Linear interpolation is applied to fill missing observations and maintain the integrity of time-series information. To stabilize sample distribution, eliminate the interference of extreme outliers, and improve the reliability of empirical outcomes, all variables are processed with two-tailed 1% winsorization.
Table 3 summarizes the descriptive statistical results. The average value of GTFP reaches 1.444, which suggests that cities in China have generally made tangible progress in the green transition. Meanwhile, its standard deviation of 0.947 reveals obvious gaps in green development performance across sample cities. The sample average urbanization rate equals 0.509, accompanied by a standard deviation of 0.175, implying uneven progress of urbanization among different cities. In addition, the mean industrialization rate hits 46.217%, demonstrating that industry still occupies a dominant position in urban economic composition.

5. Empirical Results

5.1. Baseline Regression Results

Table 4 reports the core benchmark regression estimation results. It can be observed that the DID estimator listed in column (1) carries a positive coefficient with statistical significance, which proves that NEV pilot policy exerts a robust and favorable effect on urban green transition, thereby providing strong support for hypothesis H1. Column (2) reports a significantly positive DID coefficient, verifying that the policy effectively lifts urban green technical efficiency. Driven by top-down policy incentives, local governments invest in infrastructure renovation and optimize auxiliary industrial conditions to facilitate green innovation. In contrast, column (3) yields a smaller coefficient. This reveals that the policy exerts a stronger impact on GTE than on GTP. A potential explanation is that existing micro-level policies tend to support mature technologies such as lithium iron phosphate batteries, while neglecting the development of emerging technologies like solid-state batteries. This may lead firms to focus only on incremental innovations within the scope of government subsidies, discouraging breakthrough innovations and ultimately resulting in a limited promotional effect on technological progress.
Moreover, Table 4 further reveals that fixed asset investment has a positive influence on urban green transformation, as equipment and facility renovation supported by capital inputs can mitigate environmental pollution. In contrast, higher levels of economic development and expanded employment scales impose restraining effects on cities’ green transition efficiency. A possible reason is that as urban economies grow, industrialization intensifies and excessive population agglomeration increases resource consumption and environmental pressure, raising the difficulty of urban green transition.

5.2. Robustness Tests

5.2.1. Parallel Trend Test

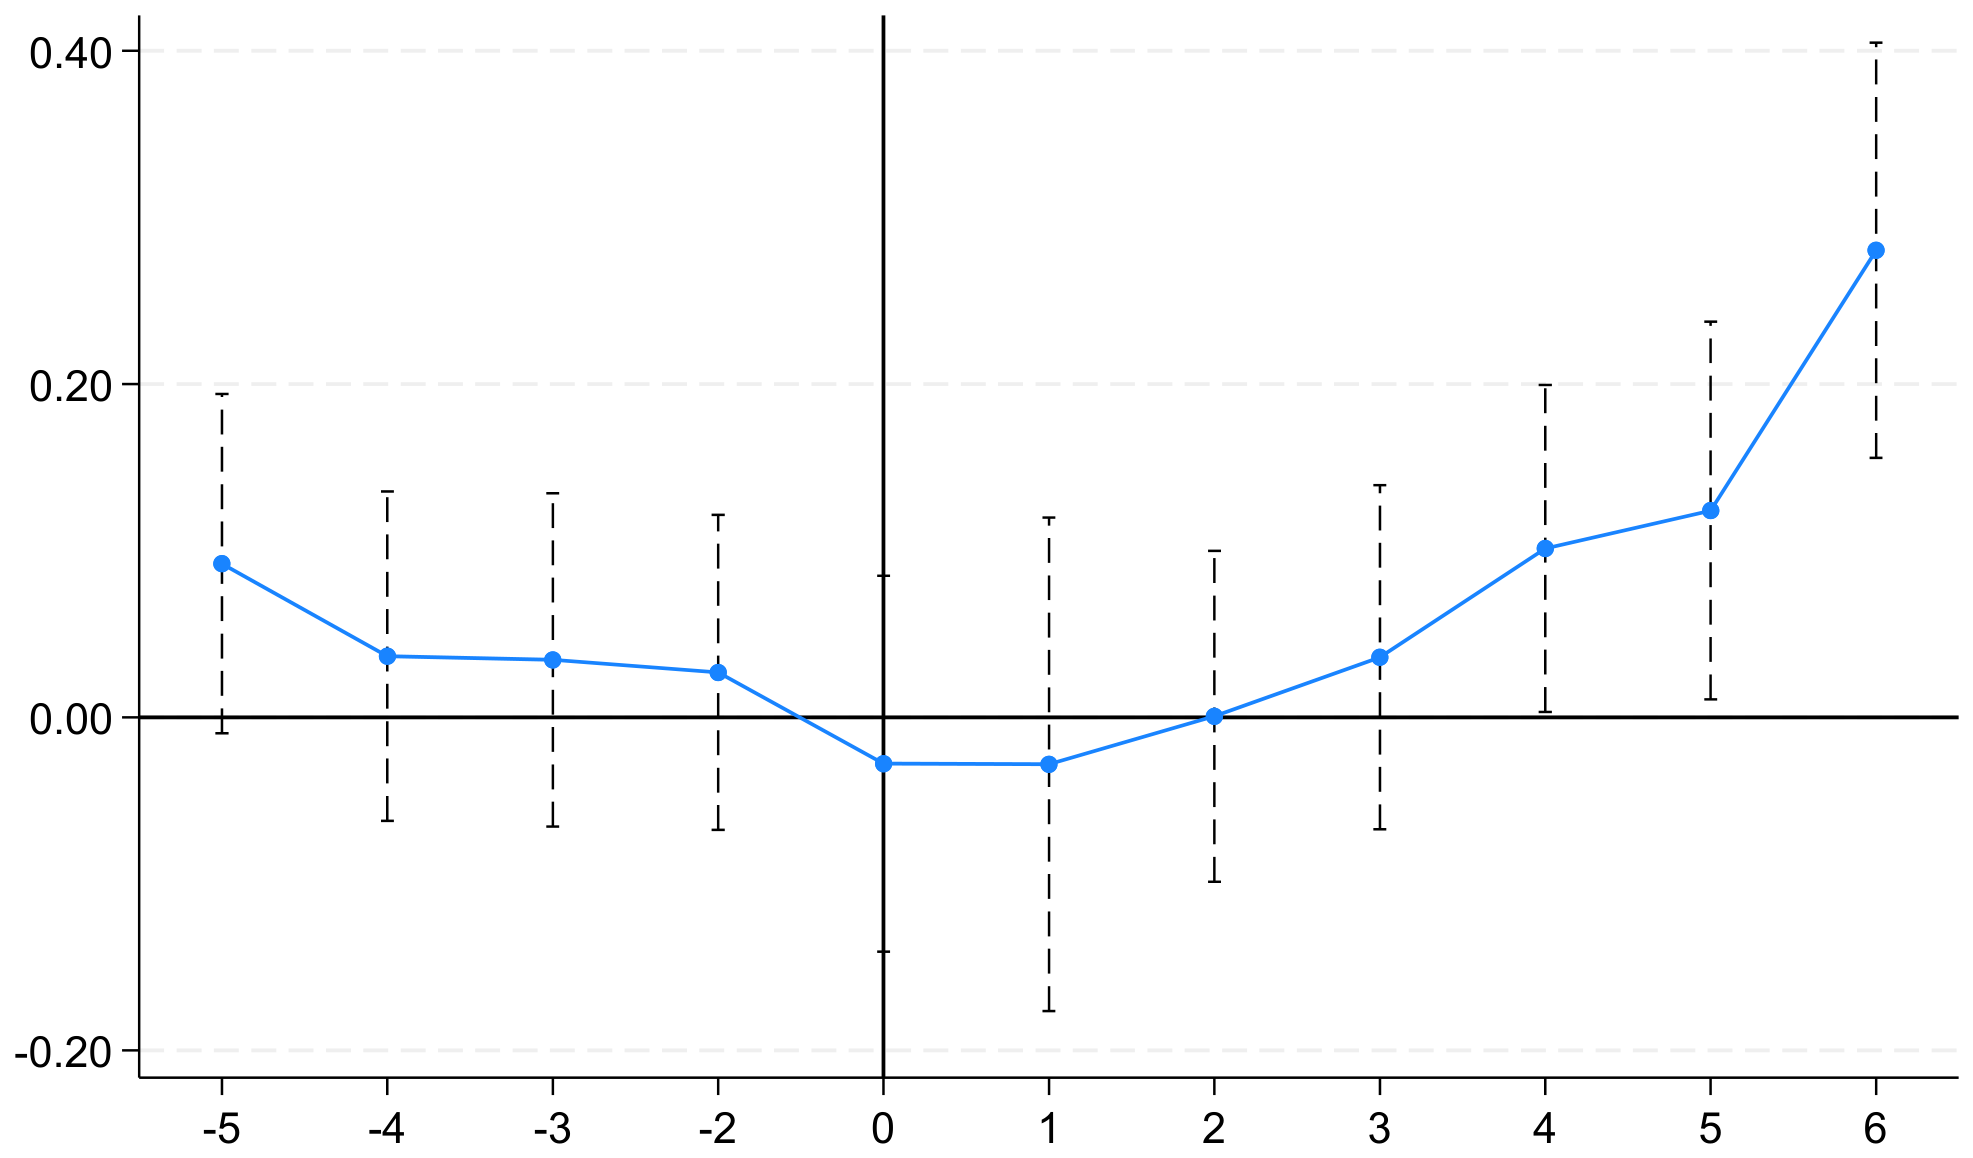
Consistent with standard empirical specifications in the existing literature, this paper conducts a parallel trend test to verify whether green transformation trajectories of new energy vehicle pilot and non-pilot cities remained comparable before the policy took effect. To achieve a complete dynamic assessment, the research spans five pre-policy years and six post-policy years in the sample window. The joint test for the four pre-policy periods yields (F(4, 5323) = 1.15) with a p-value of 0.3289, indicating that we cannot reject the null hypothesis that all pre-treatment coefficients are jointly equal to zero. This result strongly validates the parallel trend assumption. Meanwhile, the joint test for the six post-policy periods shows (F(6, 5323) = 5.79) (p < 0.001), confirming a sustained and significantly positive policy treatment effect after implementation.
Figure 2 illustrates that eco-friendly growth trajectories of treated and control cities do not display prominent gaps in pre-policy periods. After policy implementation, the estimated treatment effect maintains a sustained upward positive trend. Such evidence validates that NEV trial initiatives substantially accelerate urban low-carbon upgrading, while the policy influence only appears after a certain delay. Collectively, all the above test outcomes fully endorse the rationality of the parallel trend prerequisite for the baseline difference-in-differences framework.

5.2.2. Placebo Test

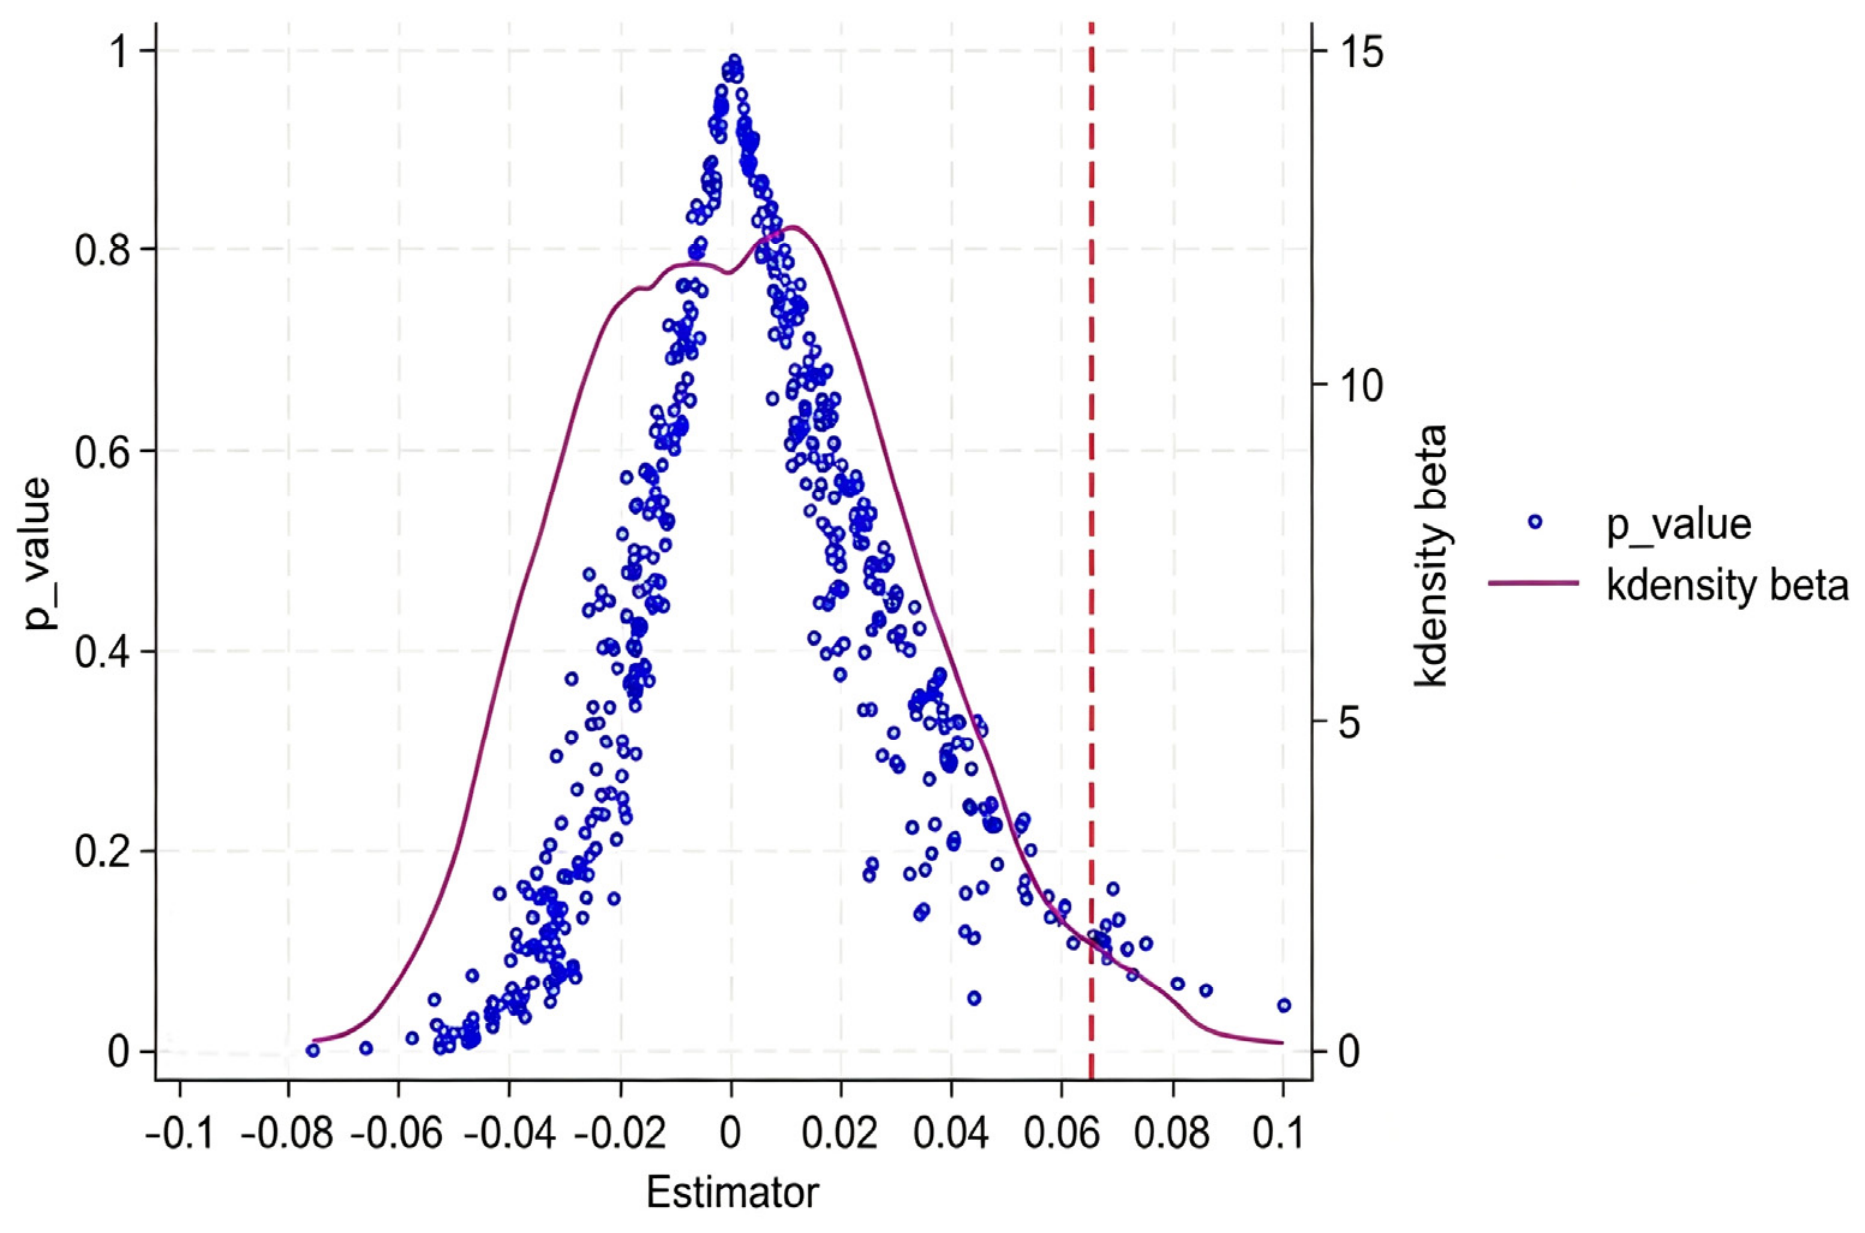
We implement a counterfactual placebo test to rule out potential bias induced by unobserved stochastic disturbances. The treatment group is randomly allocated 500 times on the basis of the actual policy launch schedule across 282 prefecture-level cities. Only 12 out of 500 placebo estimates exceed the true baseline coefficient of 0.0653, yielding an empirical one-sided p-value of 0.024 and a two-sided p-value of 0.048. Figure 3 visualizes the corresponding regression coefficients of the fake policy dummy, most of which are distributed below 0.1, with very few outliers above this level. This result aligns with theoretical predictions, which further corroborates the credibility and stability of the benchmark regression estimates shown in Table 4.

5.2.3. Time Placebo Test

We shift the policy implementation date forward by 1–5 years to construct fake treatment dummies (did1–did5). Table 5 shows all coefficients are insignificant—confirming that observed effects are indeed due to the real policy.

5.2.4. Alternative Dependent Variable

We adopt an alternative indicator of green economic efficiency to re-estimate the benchmark regression and further verify the reliability of our empirical findings. Retaining the original input–output evaluation system, this paper employs the global non-radial and non-oriented super-efficiency SBM (Super-SBM) model for recalculation. As documented in column (1) of Table 6, the DID estimates are significantly positive.
To further eliminate methodological dependence in alternative variable verification, we use the entropy weight method (EWM) to estimate the urban green transition index. The evaluation system comprehensively covers four dimensions: innovation development, economic effect, environmental performance, and social welfare, including multiple positive and negative urban-level indicators (see Table 7 for details). Different from the relative efficiency logic of SBM, the EWM-based green transition index is a data-driven composite evaluation outcome without input–output setting or frontier estimation, which ensures complete methodological independence. The regression results are shown in column (2) of Table 6, which confirms that NEV pilots significantly promote urban green transformation. This outcome consolidates the rationality of the core theoretical hypothesis and proves that our research conclusions will not alter with changes in efficiency measurement methods.

5.2.5. Excluding Other Policy Interference

To eliminate the interference brought by other related green policies, this paper incorporates binary indicator variables for the New Energy Demonstration City initiative, China’s carbon emission trading pilot, and national smart city pilot scheme into the benchmark regression model.
Table 8 reports the results. The coefficient of the DID remains significantly positive, which demonstrates that our core benchmark conclusions hold steady after controlling for the impacts of other parallel policy interventions.

5.2.6. Alternative Econometric Model

To mitigate the negative weight bias embedded in the traditional two-way fixed effects staggered DID model under heterogeneous cohort treatment effects, we follow the CS-DID estimation framework proposed by Callaway & Sant’Anna (2021) [43] and re-estimate the benchmark model. Table 9 presents multiple types of average treatment effects on the treated (ATT). The overall simple weighted average ATT is significant at the 5% level, which preliminarily confirms that NEV pilot policies exert a significant positive impact on urban green total factor productivity, consistent with the baseline TWFE regression result. In terms of dynamic effects, the pre-policy average coefficient (Pre_avg) is 0.1893 without statistical significance, which satisfies the parallel trend prerequisite. The post-policy average ATT (Post_avg) reaches 0.3475 and is significant at the 1% level, demonstrating that the policy can continuously release green transformation dividends after implementation. In addition, the calendar-time average ATT and cohort group average ATT are both positively significant. All ATT indicators derived from the CS-DID approach verify the robustness of the core policy effect after eliminating the estimation bias caused by asynchronous policy rollout and heterogeneous treatment effects across cities.

5.3. Heterogeneity Analysis

5.3.1. Regional Heterogeneity

We categorize all sampled municipalities into eastern, central, and western regional groups to examine how policy influences differ across geographic spaces. Table 10 collects the results. Within the eastern subsample, the estimated coefficients for GTFP and GTP are both negative. This pattern implies that the NEV pilot policy yields weak and even negative marginal effects in eastern cities with solid economic strength, a mature automobile industry, sound infrastructure, and strong innovation capacity. The low-carbon industrial layout in eastern cities is already complete, leading to diminishing marginal gains from extra pilot incentives. Meanwhile, policy subsidies may crowd out market-driven green upgrading and trigger inefficient resource redistribution. This contrast demonstrates that uniform national policy outcomes conceal huge differences contingent on cities’ development stages and industrial foundations.
By comparison, the coefficients of overall green productivity and green technical efficiency (GTE) are statistically positive for central and western cities. Consistently, we employ the Bootstrap Fisher combination test with 1000 repeated samplings for regional difference identification. The inter-group p-value between central and western regions is 0.003, confirming the statistically significant regional heterogeneous effects of NEV pilot policies. Central and western areas are currently experiencing a critical phase of industrial restructuring and upgrading. Driven by the pilot policy, local urban infrastructure and macro operational environments have seen sustained optimization, which facilitates the expansion of green industries and accelerates the spillover and adoption of green technologies, ultimately advancing regional green transition. Nevertheless, the policy delivers only marginal gains in green technological progress within these regions. This finding implies that current policy support fails to generate adequate incentives for firms to invest in radical, breakthrough green innovation.

5.3.2. Heterogeneity Across City Types

Cities in our sample are split into resource-based and non-resource-based categories. Table 11 documents all relevant regression estimates, demonstrating that the NEV pilot program yields no statistically significant policy spillover for non-resource cities. In contrast, the policy delivers strong impetus to advance comprehensive green restructuring among resource-based urban regions. To prevent overinterpretation of subgroup coefficients merely by simple numerical comparison, we employ the Bootstrap Fisher combination test with 1000 repeated samplings. The estimation results indicate that the p-value for the coefficient gap between growing and regenerative resource-based cities stands at 0.03, while the p-value between mature and declining resource-based cities equals 0.016. This evidence confirms notable heterogeneity in policy effects across different categories of resource-based cities. Such divergent empirical results stem from marked gaps in local institutional contexts, factor endowment conditions, industrial path dependence, and regional technology absorption capabilities. Growing and regenerative resource-based cities feature more adaptable industrial frameworks, stable fiscal revenue, and flexible labor supply, alongside continuously upgraded infrastructure and investment climate. Benefiting from these advantages, these cities are capable of accommodating emerging new energy sectors, capturing policy incentives and advancing green industrial diversification, which ultimately lifts urban green total factor productivity considerably.
In contrast, mature and declining resource-based cities suffer from strong resource lock-in and rigid industrial solidification. Long-term dependence on traditional resource industries squeezes the development space of low-carbon emerging sectors. Meanwhile, these cities are constrained by incomplete green supply chains, insufficient public fiscal capacity, and weak technological absorption and transformation capabilities. In this context, the externally implanted NEV industrial policies fail to match local factor conditions and industrial foundations, cannot form effective green production capacity, and even disrupt the original low-carbon transformation process, resulting in weaker or negative policy effects. Overall, NEV policy dividends are highly place-specific and strongly dependent on the city’s development stage and industrial base. A unified nationwide pilot expansion strategy is unreasonable. Instead, differentiated and targeted policy arrangements should be implemented according to local factor endowments and industrial carrying capacity.
Consistent with the above heterogeneous regression results, NEV pilot policies substantially improve urban green technical efficiency while generating only limited and often insignificant green technological progress. Such structural differences stem from divergent policy mechanisms across time horizons. Over the short and medium run, pilot incentives help streamline resource allocation, optimize infrastructure operations, and promote the uptake of mature clean technologies, bringing about steady and broadly distributed efficiency gains. In contrast, genuine green technological progress relies on high-risk, long-cycle R&D breakthroughs that expand the technological frontier, which cannot be easily stimulated by temporary pilot schemes. Existing policy frameworks generally favor low-risk technologies that fit subsidy requirements instead of exploratory innovation activities. This pattern consequently imposes restrictions on radical technological advancement. Overall, the policy-induced green transition is dominated by the efficient utilization of existing resources and technologies, rather than transformative technological progress. Excessive reliance on short-term efficiency gains may form an incremental improvement trap and hinder long-term green development. Therefore, future NEV policy design should shift from efficiency optimization toward incentivizing breakthrough green innovation to achieve more sustainable, technology-driven urban low-carbon transformation.

5.4. Test of Moderating Boundary Effects

Benchmark estimation results demonstrate that the NEV pilot policy yields a more pronounced improvement in green technological efficiency (GTE) relative to green technological progress (GTP). To explore the structural differences in such heterogeneous policy effects, this section empirically examines two transmission pathways derived from the theoretical analytical framework.

5.4.1. Moderating Effect of Green Technological Innovation

All findings from the moderating effect identification are compiled within Table 12. Column (1) reports a DID coefficient of 0.1669, implying that the NEV pilot initiative raises green patent authorization levels in pilot cities by roughly exp 0.1669 1 × 100 % = 18.16 % than non-pilot cities. This result verifies that the policy stimulates local green innovation activities among enterprises through market expansion and industrial standard optimization. Column (2) yields a statistically positive cross-term coefficient of 0.0211, which proves that cities with superior green innovation endowments can better capture the policy’s green transformation benefits. Quantitatively, every 10% growth in green patent output enhances the policy’s marginal contribution to urban green upgrading by 0.21 percentage points. Accordingly, Hypothesis H2 is strongly supported by the empirical results.
Further analysis shows that this interaction term has a significantly larger promoting effect on GTE than on GTP. It reveals that the green innovation driven by the current policy is mainly concentrated on cost reduction and efficiency improvement innovations, such as optimizing production processes and upgrading pollution control technologies. By contrast, the policy provides insufficient incentives for breakthrough technological innovations, including research on basic materials for power batteries and new energy storage principles. From the supply-side perspective of technological innovation, this explains why the policy contributes more to the improvement of technical efficiency than to technological progress.

5.4.2. Moderating Effect of Financial Support

Column (5) within Table 12 indicates that the NEV pilot policy raises the proportion of financial institution loans to GDP in pilot cities by approximately 7.63 percentage points. The new energy vehicle pilot policy, together with continuous subsidy commitments, sends positive industrial signals to the financial market and guides social capital to flow into green industries. Meanwhile, the interaction term DID × FS in column (6) is significantly positive with a coefficient of 0.0858, confirming the positive moderating role of financial support. Accordingly, Hypothesis H3 holds true.
Financial support also generates a much stronger effect on GTE than on GTP. The reason is that credit funds tend to flow into projects with mature technologies and predictable cash flows, such as the construction of charging infrastructure and expanded production of mature vehicle models. Financial institutions remain relatively cautious about supporting high-risk and long-term cutting-edge technology R&D. From the perspective of capital supply, this accounts for the policy’s more pronounced effect on efficiency improvement.

6. Conclusions and Policy Implications

6.1. Conclusions

Achieving eco-friendly and sustainable socioeconomic progress constitutes an essential dimension of high-quality development. The widespread adoption of NEVs not only contributes significantly to energy conservation, emission reduction, and energy security, but also promotes urban green transformation. However, current academic research concerning the causal link between NEV pilot schemes and urban green upgrading still leaves ample room for supplementation. This study leverages China’s NEV demonstration and popularization pilot cities as a quasi-natural experiment and applies a multi-period DID model to assess the policy impacts. Drawing on the literature reviewed in Section 2.3, the environmental performance of new energy vehicles is constrained by a range of systematic factors. These include the generation mix of urban power supply, pollutant discharges generated during raw material processing and battery manufacturing, carbon emissions created in vehicle production, and extra power demand brought by transport electrification. Equally important, meaningful environmental gains arise from phasing out traditional gasoline vehicles, instead of simply enlarging the overall urban vehicle fleet. It follows that the observed growth in urban green efficiency represents comprehensive low-carbon advancement across the whole system, rather than a narrow outcome brought only by vehicle replacement.
The integration of theoretical analysis and empirical estimation suggests that the policy fosters green development chiefly via enhanced technical efficiency instead of technological progress. Authorities need to acknowledge that efficiency improvements cannot independently sustain long-run fundamental transformation. Hence, more targeted incentives for cutting-edge green technologies are required to supplement the current policy system focused on efficiency promotion. Further examinations reveal that green technological innovation and financial support exert positive moderating effects on the promotion impact of NEV pilot policies on urban green development.
Both channels predominantly drive improvements in green technical efficiency rather than breakthroughs in technological progress, elucidating the observed structural differences in policy effects. Heterogeneity analysis further shows that the policy delivers more prominent green development gains in central and western regions, alongside growing and regenerative resource-based cities.

6.2. Policy Implications

  • Adopt region-specific strategies. In eastern cities, where policy effects are weak or negative, authorities ought to shift focus from extensive popularization toward pioneering innovation, while integrating new energy vehicles into smart urban infrastructure. For central and western cities, where policy effects are significantly positive, continued support for infrastructure construction and technology catching-up is warranted, though overcapacity risks should be monitored.
  • Design targeted policies for resource-based cities. Growing and regenerative resource-based cities gain substantial benefits from this policy, so local governments may actively foster the new energy vehicle sector as a feasible industrial diversification route. On the contrary, empirical outcomes show the policy yields negative or insignificant impacts for mature and declining resource-based cities. Therefore, authorities ought to avoid introducing NEV industries blindly. Hindered by strong path dependence and structural rigidities, such cities should prioritize green transformation of existing traditional industries and labor retraining to deliver a just transition.
  • Adjust the scope for pilot rollout. Our empirical findings warn against unrestricted nationwide expansion of NEV pilot schemes. Although the policy yields positive average effects nationwide, obvious heterogeneity demonstrates that its effectiveness heavily depends on local economic fundamentals, industrial composition, and institutional absorptive capacity. Accordingly, new pilot cities should be selected conditionally rather than promoted universally. We suggest evaluating candidate cities against multiple readiness benchmarks, covering industrial foundations, infrastructure maturity, fiscal capacity and labor skill endowments. For cities failing to satisfy basic readiness standards, resources should be directed toward developing fundamental capabilities before launching comprehensive NEV promotion initiatives.
  • Refine the combination of policy instruments. The estimated policy outcomes reflect a complete set of supporting measures rather than any standalone policy tool. Future policy adjustments need to tailor the coordination of subsidies, infrastructure investment and industrial support to local circumstances, instead of merely raising or lowering the overall intensity of policy implementation.

6.3. Future Research Outlook

This paper explores the green transformation effects of new energy vehicle pilot policies. However, this study still has certain limitations that point to directions for further research:
  • Micro-level mechanism exploration. The analysis draws on city-level macro panel data and thus fails to fully reflect micro heterogeneity in firms’ production decisions and residents’ charging behaviors. Future research could incorporate micro datasets to disentangle the inherent transmission channels of NEV pilot policies.
  • Targeted financial indicator optimization. The current financial support measurement adopts aggregate urban credit volume, which is too generalized to reflect industry-specific green financing for the NEV sector. Subsequent studies can construct targeted green finance indicators to more accurately identify its moderating effect.
  • Spatial spillover analysis. NEV pilot policies may exert spillover impacts on neighboring cities via industrial chain connections, technology diffusion, and shared infrastructure. Although our baseline DID estimations capture only the direct policy influences on treated cities, further research could adopt spatial DID specifications or compare adjacent pilot and non-pilot cities. Such extensions would help disentangle direct and indirect policy effects and enable a fuller evaluation of the overall policy influence.

Author Contributions

Conceptualization, Y.H. and W.Y.; methodology, Y.H.; software, Y.H.; validation, W.Y.; data curation, W.Y.; writing—original draft preparation, Y.H. and F.Z.; writing—review and editing, F.Z. All authors have read and agreed to the published version of the manuscript.

Funding

This research was funded by the humanities and social sciences research project of the Ministry of Education of China, grant number 23YJA790028.

Institutional Review Board Statement

Not applicable.

Informed Consent Statement

Not applicable.

Data Availability Statement

The original data presented in the study are openly available in National Bureau of Statistics of China at https://www.stats.gov.cn/english/ (accessed on 21 March 2025).

Conflicts of Interest

The authors declare no conflicts of interest.

References

  1. Yu, B.; Fang, D.; Xiao, K.; Pan, Y. Drivers of renewable energy penetration and its role in power sector’s deep decarbonization towards carbon peak. Renew. Sustain. Energy Rev. 2023, 178, 113247. [Google Scholar] [CrossRef]
  2. Zhang, L.; Wang, L.; Chai, J. Influence of new energy vehicle subsidy policy on emission reduction of atmospheric pollutants: A case study of Beijing, China. J. Clean. Prod. 2020, 275, 124069. [Google Scholar] [CrossRef]
  3. Owais, M. Emission reduction calculations for mass rapid transit: Theory, methodology, and practical application. Innov. Infrastruct. Solut. 2025, 10, 562. [Google Scholar] [CrossRef]
  4. Gao, Z.; Xie, H.; Yang, X.; Zhang, L.; Yu, H.; Wang, W.; Liu, Y.; Xu, Y.; Ma, B.; Liu, X.; et al. Electric vehicle lifecycle carbon emission reduction: A review. Carbon Neutraliz. 2023, 2, 528–550. [Google Scholar] [CrossRef]
  5. Xiao, K.; Yu, B.; Cheng, L.; Li, F.; Fang, D. The effects of CCUS combined with renewable energy penetration under the carbon peak by an SD-CGE model: Evidence from China. Appl. Energy 2022, 321, 119396. [Google Scholar] [CrossRef]
  6. Dua, R. China’s vehicle trade-in subsidy: Impact, cost-effectiveness, and barriers to electric vehicle purchase. Energy Sustain. Dev. 2026, 93, 102021. [Google Scholar] [CrossRef]
  7. Aghion, P.; Dechezleprêtre, A.; Hémous, D. Carbon taxes, path dependency, and directed technical change: Evidence from the auto industry. J. Political Econ. 2016, 124, 1–51. [Google Scholar] [CrossRef]
  8. Du, K.; Cheng, Y.; Yao, X. Environmental regulation, green technology innovation, and industrial structure upgrading: The road to the green transformation of Chinese cities. Energy Econ. 2021, 98, 105247. [Google Scholar] [CrossRef]
  9. Hao, C.; Liu, X. Do new energy vehicles reduce carbon emissions? A quasi-natural experiment using China’s 10 cities and the Thousand Vehicles Project. Energy 2025, 335, 138061. [Google Scholar] [CrossRef]
  10. Acemoglu, D.; Aghion, P.; Bursztyn, L.; Hémous, D. The environment and directed technical change. Am. Econ. Rev. 2012, 102, 131–166. [Google Scholar] [CrossRef] [PubMed]
  11. Yao, X.; Ma, S.; Bai, Y.; Jia, N. When are new energy vehicle incentives effective? Empirical evidence from 88 pilot cities in China. Transp. Res. Part A Policy Pract. 2022, 165, 207–224. [Google Scholar] [CrossRef]
  12. El-Hendawi, M.; Wang, Z.; Paranjape, R.; Fick, J.; Pederson, S.; Kozoriz, D. Impact of electric vehicles charging on urban residential power distribution networks. Energies 2024, 17, 5905. [Google Scholar] [CrossRef]
  13. An, Y.; Chow, J.Y.J.; Woo, S.; Lee, J. Urban public charging infrastructure planning for electric vehicles: A continuum approximation approach. Transp. Res. Part D. 2025, 141, 104605. [Google Scholar] [CrossRef]
  14. Li, T.; Huang, Y. How does China’s "ten cities, thousand vehicles" NEV promotion project affect carbon emissions from urban logistics? —An empirical analysis based on the multi-period difference-in-differences model. Sustainability 2026, 18, 4069. [Google Scholar] [CrossRef]
  15. Somuncu, T.; Hannum, C. The rebound effect of energy efficiency policy in the presence of energy theft. Energies 2018, 11, 3379. [Google Scholar]
  16. Chen, L.; Li, C. Impacts of full electrification of public sector vehicles on urban air quality: Evidence from 15 pilot cities in China. Transp. Res. Part A Policy Pract. 2025, 200, 104631. [Google Scholar] [CrossRef]
  17. Liu, B.; Wang, S.; Liang, X.; Han, Z. Carbon emission reduction prediction of new energy vehicles in China based on GRA-BiLSTM model. Atmos. Pollut. Res. 2023, 14, 101865. [Google Scholar] [CrossRef]
  18. Chen, L.; Ma, R. Clean energy synergy with electric vehicles: Insights into carbon footprint. Energy Strategy Rev. 2024, 53, 101394. [Google Scholar] [CrossRef]
  19. Kang, Z.; Ye, Z.; Hsu, S.C. Developing an hourly-resolution well-to-wheel carbon dioxide emission inventory of electric vehicles. Resour. Conserv. Recycl. 2023, 190, 106819. [Google Scholar] [CrossRef]
  20. Ma, Y.; Qiu, M.; Wang, Y.; Pan, J.; Guo, J.; Gu, F.; Li, X. Empirical evidence of air pollution reduction from electric vehicle usage across Chinese cities. Nat. Cities 2026, 3, 251–260. [Google Scholar] [CrossRef]
  21. Yang, Q.; Yuan, Q.; Yuan, Q.; Shen, H.; Wang, Y.; Jiao, H.; Zhang, L.; Gao, M. Reduced urban air pollution and mortality from the transition to new energy vehicles in China. Nat. Health 2026, 1, 865–875. [Google Scholar] [CrossRef]
  22. Holland, S.P.; Mansur, E.T.; Muller, N.Z. Are There Environmental Benefits from Driving Electric Vehicles? The Importance of Local Factors. Am. Econ. Rev. 2016, 106, 3700–3729. [Google Scholar] [CrossRef]
  23. Zhou, J.; Yu, X.; Chen, X. How does environmental legislation guide urban green transition development? Evidence from China. J. Environ. Manag. 2023, 345, 10. [Google Scholar] [CrossRef] [PubMed]
  24. Zhou, R.; Zhang, Y. Measurement of urban green total factor productivity and analysis of its temporal and spatial evolution in China. Sustainability 2023, 15, 9435. [Google Scholar] [CrossRef]
  25. Ma, I.; Long, H.; Chen, K.; Tu, S.; Zhang, Y.; Liao, L. Green growth efficiency of Chinese cities and its spatio-temporal pattern. Resour. Conserv. Recycl. 2019, 146, 441–451. [Google Scholar] [CrossRef]
  26. Oh, D.H. A global Malmquist-Luenberger productivity index. J. Product. Anal. 2010, 34, 183−197. [Google Scholar] [CrossRef]
  27. Tone, K. A slacks-based measure of super-efficiency in data envelopment analysis. Eur. J. Oper. Res. 2002, 143, 32–41. [Google Scholar] [CrossRef]
  28. Xu, W.; Yuan, Q.; Chen, N.; Ye, J. Green Finance and Energy Structure Transition: Evidence from China. Sustainability 2025, 17, 4838. [Google Scholar] [CrossRef]
  29. Zhang, J.; Chang, Y.; Zhang, L.; Li, D. Do technological innovations promote urban green development?—A spatial econometric analysis of 105 cities in China. J. Clean. Prod. 2018, 182, 395–403. [Google Scholar] [CrossRef]
  30. Zeng, Q.; Tong, Y.; Yang, Y. Can green finance promote green technology innovation in enterprises: Empirical evidence from China. Environ. Sci. Pollut. Res. Int. 2023, 30, 87628–87644. [Google Scholar] [CrossRef] [PubMed]
  31. Lah, O. Breaking the silos: Integrated approaches to foster sustainable development and climate action. Sustain. Earth Rev. 2025, 8, 1. [Google Scholar] [CrossRef]
  32. Huang, Y.; Ren, H.; Jia, X.; Yu, X.; Xie, D.; Zou, Y.; Chen, D.; Yang, Y. A Spatially Aware Machine Learning Method for Locating Electric Vehicle Charging Stations. World Electr. Veh. J. 2025, 16, 445. [Google Scholar] [CrossRef]
  33. Lamontagne, S.; Carvalho, M.; Frejinger, E.; Atallah, R. What makes a good public EV charging station? A revealed preference study. Transp. Res. Part D. Transp. Environ. 2025, 149, 105066. [Google Scholar] [CrossRef]
  34. Lv, S.; Wu, T.; Qin, Y.; Wang, X.; Xu, Z. A multi-scenario charging pile reservation mechanism considering consumers’ personalized preferences. Transp. Res. Part E Logist. Transp. Rev. 2025, 201, 104234. [Google Scholar] [CrossRef]
  35. Lee, E.H.; Lee, E. Electric vehicle charging station location selection using generative artificial intelligence. Transp. Res. Part E Logist. Transp. Rev. 2026, 213, 104930. [Google Scholar] [CrossRef]
  36. Sica, L.; Carboni, A.; Deflorio, F.; Botta, C. Electric vehicle recharging options in urban areas: Discrete choice modeling to estimate user preference. Sustain. Cities Soc. 2025, 121, 106175. [Google Scholar] [CrossRef]
  37. Zhao, X. Can green transportation accelerate carbon neutrality? Evidence from low-carbon transport systems pilot. Energy 2024, 313, 134139. [Google Scholar] [CrossRef]
  38. Xiao, K.; Dong, C.; Cai, Y.; Li, Y.; Ye, P.; Zhang, J. Unraveling Effects of Coal Output Cut Policy on Air Pollution Abatement in China using a CGE model. J. Clean. Prod. 2020, 269, 122369. [Google Scholar] [CrossRef]
  39. Li, Z.; Shi, Y.; Wojewodzki, M.; Wei, Y.; Guo, M. The Impact of New-Type Urbanization Policy on Urban Green Total Factor Productivity: New Evidence from China. Sustainability 2024, 16, 5220. [Google Scholar] [CrossRef]
  40. Copeland, B.R.; Taylor, M.S. Trade, growth and the environment. J. Econ. Lit. 2004, 42, 7–71. [Google Scholar] [CrossRef]
  41. Porter, M.E.; Van der Linde, C. Toward a new conception of the environment-competitiveness relationship. J. Econ. Perspect. 1995, 9, 97–118. [Google Scholar] [CrossRef]
  42. Sheldon, T.; Dua, R. Assessing the effectiveness of California’s “Replace Your Ride”. Energy Policy 2019, 132, 318–323. [Google Scholar] [CrossRef]
  43. Callaway, B.; Sant’Anna, P.H.C. Difference-in-differences with multiple time periods. J. Econom. 2021, 225, 200–230. [Google Scholar] [CrossRef]
Figure 1. Moderating boundary framework of NEV pilot policy’s impact on urban green transition.
Sustainability 18 08110 g001
Figure 2. Parallel trend test.
Sustainability 18 08110 g002
Figure 3. Individual placebo test.
Sustainability 18 08110 g003
Table 1. Pertinent literature by subject.
TopicCore Research Findings
Effects of NEV Policy
Effects of technological innovationPolicy support steers innovation resources to low-carbon technologies, as well as paired R&D subsidies and market constraints better foster disruptive technological breakthroughs [7,8,9,10].
Effects of industrial development Policy-driven market expansion can facilitate economies of scale, but disparities in regional industrial foundations often lead to uneven development outcomes. Furthermore, excessive subsidies may contribute to the overcapacity of low-end industries [11,12,13,14,15].
Effects of environmental improvementNEV substitution can reduce fossil fuel consumption and make a contribution to China’s carbon peaking targets, while the final emission mitigation performance depends on the low-carbon composition of electricity production [16,17,18,19,20,21,22].
Urban Green Transformation
Definition and measurement of green transformationGreen transformation is no longer limited to unilateral pollutant and carbon-reduction measures, but has developed into a comprehensive system covering efficiency optimization, technological upgrading, industrial adjustment and ecological restoration. As a reliable empirical tool, the global super-efficiency SBM-Malmquist index enables accurate measurement and factor decomposition of green total factor productivity [23,24,25,26,27].
Drivers of green transformationEnvironmental regulations force green technological upgrades; green innovation serves as a core endogenous driver; green finance provides essential funding support for urban green transformation [28,29,30].
NEV Supporting Charging Infrastructure
Charging infrastructure, user behavior and Grid–vehicle couplingCross-sector coordination is critical for energy transition. Delayed smart charging construction weakens power-transport synergy. Spatial optimization and discrete choice models identify charging station location and user demand drivers; charging anxiety restrains NEV adoption, and charging facilities underpin policy emission reduction gains [31,32,33,34,35,36].
Table 2. Input–output indicators for green economic efficiency calculation.
Indicator TypeVariable NameMeasurement MethodUnit
InputCapital investmentReal capital stock estimated via perpetual inventory method (base year: 2003, depreciation rate: 9.6%)10,000 CNY
Labor inputNumber of employed persons at year-end10,000 people
Land inputBuilt-up area10,000 km2
Energy inputTotal social electricity consumption (converted to standard coal)10,000 tons standard coal
Desirable outputEconomic outputReal GDP (deflated to 2003 prices)10,000 CNY
Undesirable outputPollutionIndustrial wastewater, SO2, and dust emissions10,000 tons
Table 3. Descriptive statistics.
VariableSymbolNMinMaxMeanStandard Deviation
Green Economic Efficiency G T F P 56400.1431.8871.4440.947
Green Technical Progress G T P 56400.14714.1881.3060.739
Green Technical Efficiency G T E 56400.068.911.2340.71
Urban Economic Development Level G D P P C 56404.59513.05610.3340.848
Urbanization Level U R 56400.1061.0070.5090.175
Industrialization Level S T R U 564010.6885.9246.21711.181
Fixed Asset Investment I N V E S T 564012.01818.75415.471.181
Employment Scale E M P L O Y 56401.3996.8953.5120.829
Table 4. Baseline regression.
Variable(1)(2)(3)
G T F P G T E G T P
D I D 0.0653 **
(2.0890)
0.0697 **
(2.5500)
0.0423 **
(2.1443)
G D P P C −0.3590 ***
(−3.0232)
−0.0258
(−0.6207)
−0.4670 ***
(−4.4644)
I N V E S T 0.0875 **
(2.0524)
0.0155
(0.7395)
0.0180
(0.6012)
E M P L O Y −0.3640 ***
(−5.5389)
−0.3959 ***
(−9.2656)
0.2049 ***
(4.4732)
S T R U −0.0032
(−0.8217)
−0.0005
(−0.2918)
0.0018
(0.9261)
U R −0.1881
(−1.2066)
−0.1887 **
(−2.1361)
−0.0412
(−0.3967)
Constant5.3124 ***
(6.0137)
2.7592 ***
(6.4061)
5.0666 ***
(7.6877)
Fixed/Year EffectsYesYesYes
Obs564056405640
R20.3810.6440.751
Note: **, and *** denote significance levels of 5% and 1%, respectively. t-statistics are reported in parentheses.
Table 5. Time placebo test.
Variable(1)
G T F P
(2)
G T F P
(3)
G T F P
(4)
G T F P
(5)
G T F P
did10.0428
(1.3147)
did2 0.0270
(0.8395)
did3 0.0126
(0.3889)
did4 −0.0045
(−0.1363)
did5 −0.0328
(−0.9648)
G D P P C −0.3617 ***
(−3.0434)
−0.3631 ***
(−3.0480)
−0.3648 ***
(−3.0551)
−0.3665 ***
(−3.0615)
−0.3686 ***
(−3.0674)
I N V E S T 0.0879 **
(2.0581)
0.0881 **
(2.0577)
0.0884 **
(2.0628)
0.0886 **
(2.0710)
0.0888 **
(2.0755)
E M P L O Y −0.3586 ***
(−5.4371)
−0.3544 ***
(−5.3754)
−0.3509 ***
(−5.3354)
−0.3476 ***
(−5.2890)
−0.3437 ***
(−5.2476)
S T R U −0.0032
(−0.8203)
−0.0033
(−0.8307)
−0.0033
(−0.8424)
−0.0034
(−0.8605)
−0.0035
(−0.8887)
U R −0.1820
(−1.1605)
−0.1773
(−1.1291)
−0.1723
(−1.0951)
−0.1650
(−1.0465)
−0.1540
(−0.9840)
Constant5.3159 ***
(6.0138)
5.3159 ***
(6.0166)
5.3189 ***
(6.0187)
5.3243 ***
(6.0183)
5.3354 ***
(6.0214)
Fixed EffectsYesYesYesYesYes
Obs56405640564056405640
R20.3810.3810.3810.3810.381
Note: **, and *** denote significance levels of 5% and 1%, respectively. t-statistics are reported in parentheses.
Table 6. Alternative dependent variable.
Variable(1)
G T F P
(2)
G T F P
D I D 0.0083 *
(1.8373)
0.0037 **
(2.2789)
Constant0.3524 ***
(4.7331)
−0.1537 ***
(−5.4340)
ControlsYesYes
Fixed EffectsYesYes
Obs56405640
R20.6280.945
Note: *, **, and *** denote significance levels of 10%, 5%, and 1%, respectively. t-statistics are reported in parentheses.
Table 7. Comprehensive urban green transition evaluation index system.
Category DimensionSpecific IndicatorIndicator Attribute
Innovation DevelopmentProportion of S&T expenditure in fiscal expenditurePositive
Proportion of education expenditure in fiscal expenditure
Economic EffectActual utilized foreign capitalPositive
Total output value of foreign-invested enterprises
Number of foreign-invested enterprises
Environmental EffectIndustrial wastewater discharge per unit industrial outputNegative
Industrial sulfur dioxide emissions per unit industrial output
Industrial smoke and dust emissions per unit industrial output
Comprehensive utilization rate of general solid wastePositive
Centralized treatment rate of sewage treatment plants
Harmless treatment rate of domestic garbage
Green coverage rate of built-up areas
Social WelfareNumber of practicing physicians per resident populationPositive
Average wage of on-the-job employees
Table 8. Exclusion of other policy interference.
Variable(1)
G T F P
(2)
G T F P
(3)
G T F P
D I D 0.0572 *
(1.8769)
0.0632 **
(2.0303)
0.0641 **
(2.0943)
New Energy Demonstration City0.1201 ***
(2.6978)
China Carbon Emission Trading Pilot 0.1094 **
(2.1342)
National Smart City Pilot 0.0327
(0.9102)
Constant5.3783 ***
(6.0693)
5.2936 ***
(6.0161)
5.3991 ***
(5.9466)
ControlsYesYesYes
Fixed EffectsYesYesYes
Obs564056405640
R20.3820.3810.381
Note: *, **, and *** denote significance levels of 10%, 5%, and 1%, respectively. t-statistics are reported in parentheses.
Table 9. Alternative econometric model.
Variables(1)
Simple Weighted Average ATT
(2)
Dynamic Average ATT
(3)
Calendar-Time Average ATT
(4)
Group Average ATT
Simple ATT0.1911 **
(2.1992)
Pre_avg 0.1893
(1.4935)
Post_avg 0.3475 ***
(2.6638)
CAverage 0.1251 **
(2.1185)
GAverage 0.1867 *
(1.9305)
Note: *, **, and *** denote significance levels of 10%, 5%, and 1%, respectively. t-statistics are reported in parentheses.
Table 10. Heterogeneity test results by region.
VariableEast RegionCentral RegionWest Region
(1)
GTFP
(2)
GTE
(3)
GTP
(4)
GTFP
(5)
GTE
(6)
GTP
(7)
GTFP
(8)
GTE
(9)
GTP
DID −0.1510 *
(−1.7644)
−0.0007
(−0.0118)
−0.0713 *
(−1.8964)
0.0914 ***
(3.0889)
0.0672 **
(2.0326)
0.0288
(1.1143)
0.3134 ***
(5.5351)
0.2734 ***
(4.4691)
0.0470
(1.2513)
G D P P C −0.4077 *
(−1.8654)
−0.0472
(−0.4866)
−0.7154 ***
(−4.7165)
−0.3611 ***
(−5.4872)
0.1190
(1.6451)
−0.3868 ***
(−5.9163)
−0.3256 *
(−1.8471)
−0.0951
(−1.4270)
−0.2045 **
(−2.0815)
I N V E S T 0.2434 **
(2.2488)
0.1123 **
(2.3267)
0.1055 *
(1.8897)
0.1349 ***
(3.7099)
−0.0265
(−0.7747)
0.1145 ***
(3.7136)
0.0171
(0.2472)
−0.0294
(−0.7880)
−0.0023
(−0.0641)
E M P L O Y −0.3521 **
(−2.2092)
−0.5546 ***
(−7.4722)
0.5690 ***
(5.7387)
−0.4482 ***
(−8.8568)
−0.4584 ***
(−10.3488)
0.0442
(1.4335)
−0.3510 ***
(−3.6307)
−0.2067 ***
(−3.0697)
−0.0681 *
(−1.8744)
S T R U −0.0109
(−1.0835)
−0.0108 **
(−2.3165)
0.0076
(1.5852)
0.0008
(0.2346)
0.0013
(0.5606)
−0.0021
(−1.0544)
−0.0030
(−0.8131)
0.0059 **
(2.3539)
−0.0048 **
(−2.5167)
U R −0.1578
(−0.4680)
−0.3416 *
(−1.8448)
−0.0341
(−0.1755)
−0.2278
(−1.0884)
−0.4218 ***
(−3.0340)
0.2626 **
(2.0377)
−0.1184
(−0.5879)
0.0041
(0.0378)
0.0482
(0.3461)
Constant3.9825 **
(2.1848)
2.8872 **
(2.5333)
4.7743 ***
(4.9928)
4.6138 ***
(7.5692)
2.0937 ***
(3.4635)
3.2716 ***
(4.4132)
5.7442 ***
(3.9366)
2.9793 ***
(4.0097)
3.7776 **
(4.7249)
Fixed EffectsYesYesYesYesYesYesYesYesYes
Obs200020002000200020002000164016401640
R20.2130.6340.7600.5980.5940.8290.6280.7150.777
Note: *, **, and *** denote significance levels of 10%, 5%, and 1%, respectively. t-statistics are reported in parentheses.
Table 11. Heterogeneity test by city type.
Variable(1)
Non-Resource-Based Cities
(2)
Resource-Based Cities
(3)
Growing
(4)
Mature
(5)
Declining
(6)
Regenerative
D I D 0.0308
(0.6336)
0.0916 **
(2.3998)
0.6780 ***
(4.8187)
−0.1106 ***
(−3.1041)
−0.3169 ***
(−2.9345)
0.3177 ***
(3.0961)
G D P P C −0.4422 ***
(−2.6085)
−0.2713 **
(−2.3031)
−0.2011
(−1.2856)
−0.1009
(−1.2230)
0.0018
(0.0083)
−0.7506 ***
(−3.6420)
I N V E S T 0.2359 ***
(3.2058)
−0.0389
(−0.9180)
0.4032 ***
(4.2463)
−0.2098 ***
(−4.6636)
−0.0270
(−0.3902)
0.0774
(1.2218)
E M P L O Y −0.2627 ***
(−2.5904)
−0.5130 ***
(−10.0805)
−0.8672 ***
(−3.1829)
−0.3693 ***
(−6.1139)
−0.2112 ***
(−3.3359)
−0.3107 **
(−1.9921)
S T R U −0.0093
(−1.3223)
0.0019
(0.6450)
0.0075
(1.2952)
−0.0011
(−0.4827)
0.0209 ***
(2.7721)
0.0119
(1.3078)
U R −0.1588
(−0.7597)
−0.1664
(−0.9628)
0.7028
(1.1527)
−0.2119
(−0.9989)
0.6355 **
(2.1303)
−0.1443
(−0.5030)
Constant3.8027 **
(2.4954)
6.4664 ***
(8.2797)
−0.7573
(−0.4330)
6.9332 ***
(10.6005)
1.3806
(0.9458)
8.8024 ***
(6.8960)
Fixed EffectsYesYesYesYesYesYes
Obs340022402801200460300
R20.3090.6920.6380.6950.7860.828
Note: **, and *** denote significance levels of 5% and 1%, respectively. t-statistics are reported in parentheses.
Table 12. Moderating effect test.
Variable(1)(2)(3)(4)(5)(6)(7)(8)
G T I G T F P G T P G T E F S G T F P GTPGTE
D I D 0.1669 ***
(6.9929)
0.0763 ***
(5.7545)
D I D × G T I 0.0211 ***
(3.7542)
0.0103 ***
(2.6580)
0.0209 ***
(4.3994)
D I D × F S 0.0858 ***
(3.7795)
0.0322 **
(2.0402)
0.0640 ***
(3.0243)
G D P P C 0.2207 ***
(4.2382)
−0.3455 ***
(−2.9644)
−0.4615 ***
(−4.4540)
−0.0129
(−0.3114)
−0.2813 ***
(−5.1081)
−0.3426 ***
(−2.9631)
−0.4628 ***
(−4.4720)
−0.0158
(−0.3831)
I N V E S T −0.0348
(−1.3668)
0.0892 **
(2.1157)
0.0190
(0.6385)
0.0173
(0.8336)
−0.0506 ***
(−2.6523)
0.0899 **
(2.1338)
0.0191
(0.6429)
0.0176
(0.8475)
E M P L O Y 0.4555 ***
(12.5997)
−0.3868 ***
(−5.9508)
0.1962 ***
(4.3866)
−0.4174 ***
(−9.3062)
0.0288 *
(1.8410)
−0.3828 ***
(−6.0356)
0.2021 ***
(4.5402)
−0.4049 ***
(−9.3509)
S T R U 0.0031 *
(1.8342)
−0.0031
(−0.7889)
0.0018
(0.9504)
−0.0004
(−0.2208)
−0.0053 ***
(−4.8604)
−0.0029
(−0.7258)
0.0019
(0.9749)
−0.0003
(−0.1639)
U R 0.8665 ***
(6.9494)
−0.1951
(−1.2610)
−0.0413
(−0.3962)
−0.1941 **
(−2.2118)
0.2905 ***
(5.6305)
−0.2017
(−1.2957)
−0.0406
(−0.3859)
−0.1921 **
(−2.1905)
Constant−0.2454
(−0.5635)
5.2138 ***
(5.9967)
5.0198 ***
(7.6700)
2.6619 ***
(6.2841)
4.6212 ***
(13.0129)
5.1528 ***
(5.9616)
5.0095 ***
(7.6576)
2.6433 ***
(6.2426)
Fixed EffectsYesYesYesYesYesYesYesYes
Obs56405640564056405640564056405640
R20.9510.3820.7510.6450.8360.3820.7510.645
Note: *, **, and *** denote significance levels of 10%, 5%, and 1%, respectively. t-statistics are reported in parentheses.
Disclaimer/Publisher’s Note: The statements, opinions and data contained in all publications are solely those of the individual author(s) and contributor(s) and not of MDPI and/or the editor(s). MDPI and/or the editor(s) disclaim responsibility for any injury to people or property resulting from any ideas, methods, instructions or products referred to in the content.