Article

Evolutionary Game Behavior of Stakeholders in Existing Building EMC Based on Prospect Theory and Policy Incentives

1
School of Management, Shenyang Jianzhu University, Shenyang 110168, China
2
School of Business Administration, Liaoning Technical University, Huludao 125105, China
*
Author to whom correspondence should be addressed.
Sustainability 2026, 18(16), 8058; https://doi.org/10.3390/su18168058
Submission received: 1 July 2026 / Revised: 16 July 2026 / Accepted: 23 July 2026 / Published: 7 August 2026
(This article belongs to the Section Energy Sustainability)

Abstract

Energy Management Contracting (EMC) is important for scaling energy-saving retrofits in existing buildings, yet policy incentives often fail when stakeholders perceive costs, benefits, and enforcement risks differently. This study aims to examine how subjective cognitive biases affect strategic interactions among governments, energy service companies (ESCOs), and energy-consuming units (ECUs) in China’s existing-building EMC market. Prospect theory is introduced into a tripartite evolutionary game model, and replicator dynamics with MATLAB R2024a simulations are used to analyze policy incentives, regulatory constraints, and behavioral parameters. The simulation results show that, among conventional policy parameters, moderate incentives and bilateral penalties are more effective than simply increasing subsidies or imposing unilateral punishment; when regulatory costs exceed a sustainable range, active supervision becomes unstable and cooperative implementation is weakened. Among prospect-theory parameters, higher loss aversion increases the perceived burden of fiscal and regulatory costs, while lower probability weighting reduces the perceived certainty of inspection and punishment. Reducing γ from 0.69 to 0.4 substantially weakens deterrence, and increasing λ from 1.5 to 2.25 intensifies strategic fluctuations. These findings provide a behavioral basis for designing staged EMC governance policies and offer practical implications for improving the stability and effectiveness of existing-building EMC implementation.

1. Introduction

Nearly 40% of the existing building stock in China is still non-energy-efficient [1], and more than 30% of public buildings have a service life exceeding 20 years [2]. A large number of old buildings still suffer from poor envelope performance, outdated and inefficient equipment, and a lack of operation and maintenance management [3]. Optimizing building energy consumption has become a key link in achieving carbon reduction targets in the building sector [4,5,6]. Recent studies on environmental governance in China also show that policy effects are shaped by institutional context, stakeholder responses, and non-market regulatory channels, suggesting that low-carbon governance should be examined within specific national and institutional settings [7].
Energy-saving retrofits self-financed and organized by building owners, hereafter referred to as energy-consuming units (ECUs), often fail to fully realize energy-saving potential and may even lead to secondary energy waste [8]. Energy Service Companies (ESCOs) typically require high upfront investment, and financial institutions focus more on project feasibility and payback periods during financing reviews [9], resulting in insufficient motivation among ECUs and ESCOs to engage in energy-saving retrofits. At the governmental level, the promotion of building energy-saving retrofits is also subject to certain structural challenges. The distribution mechanisms of policy incentives among diverse stakeholders remain to be further refined, making it difficult to achieve full alignment between energy-saving outcomes and policy objectives [10]. Meanwhile, the administrative costs associated with project review, performance evaluation, and post-implementation supervision place considerable pressure on governmental resources, particularly in regions where fiscal capacity constrains the sustained provision of incentive funds [11]. Therefore, under the conventional retrofit model, relying solely on ECUs’ self-financing and government fiscal support is insufficient to sustain large-scale energy-saving retrofits, highlighting the need to explore more market-oriented and institutionally supported implementation mechanisms such as EMC.

1.1. Literature Review

The Energy Management Contracting (EMC) model provides a full-chain solution through ESCOs, covering energy efficiency diagnosis, design and construction, capital investment, operation and maintenance, and performance guarantee. Empirical studies on EMC implementation have examined this model from several complementary angles, including benefit-distribution mechanisms, sector-specific effectiveness, and the policy–legal environment shaping ESCO development. In the field of EMC research, Martiniello et al. [12] found that the EMC model can effectively improve the rationality of benefit distribution in energy-saving retrofit projects, achieve long-term cooperation, and ensure the orderly implementation of projects. Mohamad Munir et al. [13] argued that EMC is the optimal solution for implementing energy-saving measures in educational buildings, and constructed an EMC model based on regression analysis to verify the energy-saving effects after building retrofits. From a policy perspective, Wacinkiewicz and Słotwiński [14] explored the impact of legal factors on EMC implementation, investigating whether relevant regulations can increase ESCO projects in the public sector and remove barriers to EMC development. Wen et al. [15] empirically compared the effectiveness of different policy tools on ESCO industry growth in the Chinese and U.S. markets, finding that incentive tools had the most significant impact in China, while command-and-control policies were most influential in the U.S. Collectively, these studies confirm the practical value and policy sensitivity of EMC, yet they predominantly rely on empirical or regression-based approaches and offer limited insight into the dynamic strategic interactions among heterogeneous stakeholders.
In the building energy-saving retrofit market, previous studies have widely utilized standard evolutionary game theory to analyze stakeholder interactions. For instance, Zheng et al. [16] examined the strategic evolution of major EMC stakeholders, while Qiao et al. [17] applied a tripartite evolutionary game model and identified liquidated damages as an important determinant of cooperative behavior. These studies provide a strong foundation for understanding how objective incentives and institutional constraints shape the evolution of stakeholder strategies. Complementing this perspective, more recent research has incorporated prospect theory into evolutionary game models to capture cognitive biases under uncertainty. Lin et al. [18] showed that subjective evaluations of gains and losses affect cooperation in long-term energy contracts, while Liu et al. [19] found that loss aversion influences the low-carbon strategies of energy enterprises. However, these two research streams remain insufficiently integrated in the context of existing-building EMC. Existing EMC evolutionary game studies have primarily examined institutional and economic conditions, whereas prospect-theory applications have largely focused on other energy contexts. It therefore remains unclear how subjective perceptions interact with the distinct payoff structures of governments, ESCOs, and ECUs to shape their responses to the same policy instruments.
The relevance of prospect theory to this research gap is further supported by research showing that project-performance uncertainty and associated financial risks influence investment decisions in energy performance contracting [20]. Related applications to zero-waste governance and carbon trading demonstrate that subjective evaluations of gains, losses, and risk can alter cooperation and strategy evolution [21,22]. Empirical evidence further indicates that difficulty in estimating actual energy-saving performance can affect investment decisions and trust between ESCOs and ECUs [23]. Taken together, these findings highlight the distinction between objective and perceived payoffs. Conventional evolutionary game theory explains how strategy proportions adjust in response to payoff differences; when payoffs are specified objectively, however, it does not capture why actors facing the same policy conditions may evaluate them differently. Prospect theory complements this framework by introducing reference dependence, loss aversion, and nonlinear probability weighting into payoff evaluation [22]. Applied to the payoff structure examined in this study, underweighting the likelihood of inspection and punishment may weaken perceived deterrence, whereas loss aversion may amplify the perceived burdens associated with penalties, regulatory expenditure, and implementation or participation costs. Prospect theory therefore helps explain how objective policy conditions are translated into perceived payoff differences, whereas evolutionary game theory explains how those differences subsequently drive strategy evolution. This theoretical distinction is particularly relevant to China’s policy-driven existing-building retrofit market, where subsidies, penalties, and other policy instruments materially shape stakeholder strategies and ESCO development [15,16]. If policy design does not account for boundedly rational actors’ subjective evaluations, positive incentives may fail to produce the intended responses, and regulatory deterrence may be weakened.

1.2. Contributions of This Study

Against this background, this paper introduces prospect theory into a tripartite evolutionary game framework to examine incentive and regulatory interactions among the government, ESCOs, and ECUs in EMC for existing buildings in China. The main objective is to analyze how subjective cognitive biases affect strategic interactions and policy effectiveness within EMC systems. This study makes three main contributions:
(1)
It develops a tripartite evolutionary game model incorporating prospect theory to capture loss aversion and probability weighting among boundedly rational stakeholders.
(2)
It systematically investigates how variations in government incentive and regulatory intensities influence the evolutionary dynamics of all participating agents.
(3)
It reveals how loss aversion, diminishing sensitivity, and probability weighting distort the transmission of subsidies, penalties, and regulatory signals, thereby providing implications for improving EMC governance in China.

2. Model Assumptions and Establishment

2.1. Problem Description

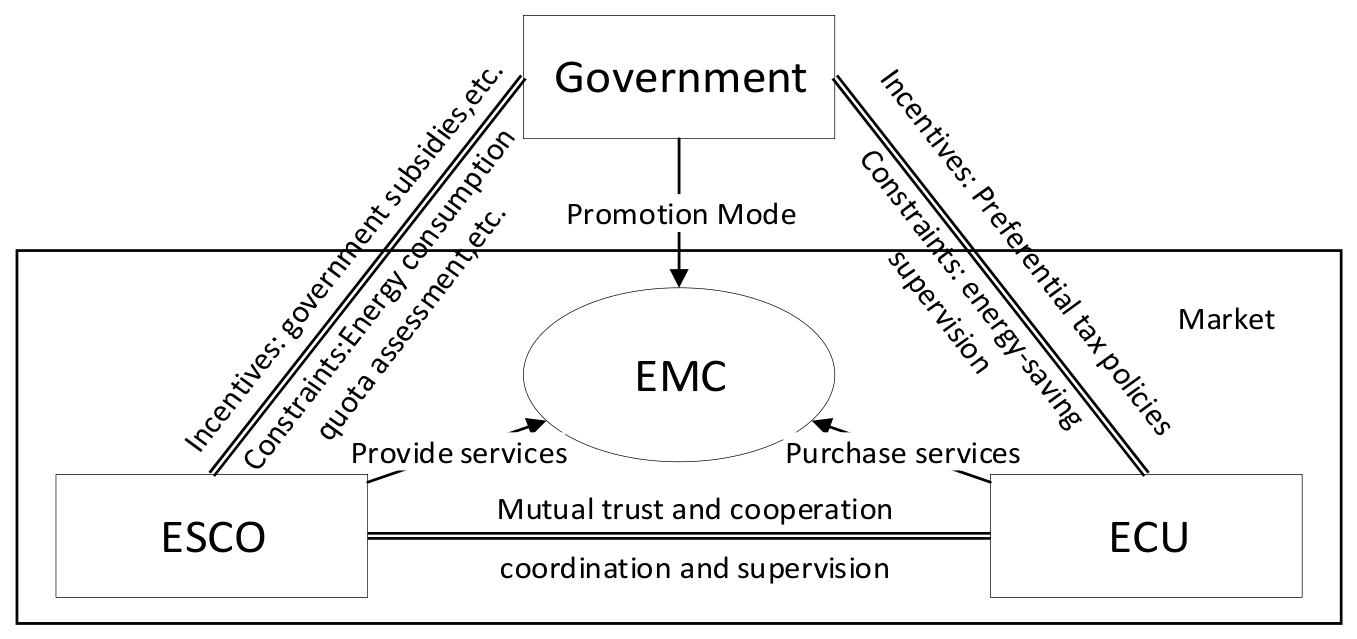
The EMC model for energy-saving retrofits of existing buildings exhibits significant positive externalities, benefiting not only participating stakeholders but also advancing the overarching sustainability agenda by bolstering energy security and meeting carbon reduction targets, as illustrated in Figure 1.
Based on this tripartite interaction framework, this study focuses on governments, ESCOs, and ECUs, which are the core decision-making actors directly involved in policy incentives, project implementation, and participation behavior. The government promotes the model, ESCOs provide energy-saving services, and ECUs purchase these services, forming a tripartite interaction framework. ESCOs undertake technological investment and performance responsibility, and their strategic choices directly affect retrofit outcomes [24]. However, driven by profit maximization and risk control, they may adopt conservative strategies, weakening energy-saving performance [25]. Meanwhile, ECUs, as both retrofit targets and beneficiaries, interact closely with ESCOs. Lack of cooperation from ECUs increases implementation risks for ESCOs, whereas underperformance by ESCOs imposes potential losses on ECUs [26]. The government influences both parties through incentive and regulatory policies such as subsidies, tax incentives, and supervision [10,11]. Policy intensity varies across stages: active intervention helps initiate the market, while routine regulation supports the transition toward market-driven mechanisms [27]. Consequently, stakeholder strategies exhibit different evolutionary patterns under varying policy conditions. Under conditions of incomplete information and bounded rationality, the decision-making behaviors of the government, ESCOs, and ECUs are not one-time optimal choices but dynamically evolve through continuous trial and error, imitation, and adjustment, eventually converging to a stable state [16,28].
Given that energy-saving retrofit projects for existing buildings are characterized by long cycles, information asymmetry, and uncertain returns, stakeholders under bounded rationality do not base their decisions purely on objective expected payoffs when facing policy incentives and violation risks. Therefore, incorporating the cognitive preference characteristics of prospect theory into the analytical framework and employing an evolutionary game model to analyze the multi-stakeholder evolutionary dynamics in government-driven EMC for existing building retrofits can help reveal the strategic choices and stability characteristics of each stakeholder under different incentive and constraint policy scenarios.

2.2. Basic Assumption

As bounded rational decision-makers, the government, ESCOs, and ECUs possess a certain ability to analyze market development trends; they can, nevertheless, neither fully grasp all market information nor accurately predict future outcomes. In the game process, these stakeholders need to consider their sensitivity to risk perception and deviations in subjective value [28,29], which is consistent with the core tenets of prospect theory [30].
V = i v ( Δ m i ) π ( p i )
v ( Δ m i ) = ( Δ m i ) α , Δ m i > 0 λ ( Δ m i ) β , Δ m i 0
In these expressions, V(·) represents the value function, which indicates the subjective perceived value of each decision-maker. Here, λ denotes the loss aversion coefficient, while α and β indicate the risk preference parameters. π (pi) represents the probability weighting function, defined as
π ( p i ) = ( p i ) γ [ ( p i ) γ + ( 1 p i ) γ ] 1 / γ ,   π ( 0 ) = 0 ,   π ( 1 ) = 1
Variations in government policy intensity significantly influence the relative expected payoffs of both ESCOs and ECUs when choosing strategies, thereby driving the dynamic evolution of strategy distributions at the population level over time. Under different policy parameter regimes, the system may ultimately converge to distinct evolutionary stable strategies (ESS).
Game Relationship between the Government and ESCOs: The strategy space for the government (G) consists of “active regulation” and “routine regulation”. Active regulation refers to the government incurring a higher administrative intervention cost V(−J) to implement full-process regulation with a higher inspection probability P1. This strategy entails providing complementary financial subsidies and tax incentives V(M), while imposing a penalty V(T) on ESCOs’ opportunistic behavior, aimed at strengthening compliance expectations among market participants and securing higher social benefits V(N1). In contrast, routine regulation reflects a cost-constrained regulatory mode. Under this regime, the government maintains routine regulation at a reduced regulatory cost V(−θJ) and a lower inspection probability P2. Consequently, the subsidy scale is reduced to V(−ηM), thereby reducing the incentive intensity perceived by market participants and potentially incurring credibility losses or environmental governance costs V(−O) due to market misconduct, with corresponding social benefits dropping to V(N_2).
The strategy space of the Energy Service Company (E) includes “standard implementation” and “opportunism”. Standard implementation refers to the ESCO bearing a higher standard implementation cost V(−Ce), and strictly complying with EMC agreements and industry standards to obtain energy-saving retrofitting revenue V(Re), government incentives distributed in proportion r denoted as V(rM), and brand premium benefits brought by standardized operation V(Ve), thereby avoiding the risk of violation. Opportunism, driven by short-term interests, is reflected in the ESCO bearing only a lower implementation cost V(−Co) and energy-saving theft cost V(−H) through means such as cutting corners, thereby seeking energy-saving retrofitting revenue V(Ro) and falsely reported energy-saving revenue V(G), while attempting to avoid penalties through lax regulation. The strategy combination matrix for government and ESCO is shown in Table 1.
Game Relationship between the Government and ECUs: The strategy space of the ECU is defined as “active participation” and “passive participation”. Specifically, active participation refers to the ECU’s full adoption of the EMC model and its proactive cooperation in project implementation and operation. Under this strategy, the ECU incurs coordination costs to obtain higher returns from equipment upgrades and energy-saving retrofits, receives government incentives V((1 − r)M), and effectively mitigates the risks of non-compliance under active government supervision.
In contrast, passive participation is driven by the ECU’s loss aversion and its intention to minimize disruptions to routine operations. This strategy is manifested in delayed responses, resistance, or superficial cooperation in energy-saving retrofits, enabling the ECU to avoid additional financial burdens and administrative costs associated with third-party verification, thereby reducing coordination costs. However, under this strategy, the expected energy-saving benefits decline to a lower level, and the ECU faces potential losses V(−G) when the ESCO adopts opportunistic behavior. Furthermore, under active government supervision, the ECU is also subject to a penalty V(S) for failing to meet carbon emission standards. The strategy combination matrix for government and ECU is shown in Table 2.
Game Relationship between ESCOs and ECUs: The strategy space of the ESCO includes “Standard implementation” and “opportunistic behavior”. Under standard implementation, the ESCO incurs a higher compliance cost V(−Ce) to fulfill contractual obligations, thereby obtaining implementation returns V(Re) and brand premium benefits V(Ve), while delivering higher energy-saving benefits V(K1) to the ECU. Under opportunistic behavior, the ESCO reduces investment and cuts service quality, bearing only lower implementation costs V(−Co) and energy-saving falsification costs V(−H), thereby gaining opportunistic returns V(Ro) and additional benefits V(G). However, this leads to a decline in the actual energy-saving performance, resulting in reduced energy-saving benefits V(K2) for the ECU.
The strategy space of the ECU (U) includes “active Participation” and “passive Participation.” Active cooperation means that the ECU bears coordination and energy-saving supervision costs V(−Q), and reduces information asymmetry risks through enhanced project monitoring, thereby safeguarding its own benefits. Passive cooperation, on the other hand, is reflected in the unit reducing project participation to avoid management intervention and save coordination costs. However, when the ESCO adopts opportunistic behavior, the unit will not only obtain a lower level of returns V(K2), but will also face perceived losses from the extraction of energy-saving benefits V(−G). The strategy combination matrix for the ESCO and ECU is shown in Table 3.
On the basis of systematically analyzing the core stakeholders involved in the promotion of the EMC model for existing buildings, and to characterize the evolutionary features of multi-agent behavior under incentive and constraint policies, this study constructs a tripartite evolutionary game model involving the government, ESCO, and ECU. The following basic assumptions are proposed:
Assumption 1.
The model considers three primary stakeholders: the government (G), ESCO (E), and ECU (U). This study focuses on their strategic interactions under policy interventions. Other external actors, such as financial institutions, equipment suppliers, and third-party verification bodies, are not modeled as independent strategic actors because their roles are mainly associated with financing support, technical provision, and verification services rather than direct participation in the incentive–regulation relationship examined in this study.
Assumption 2.
All agents are boundedly rational and operate under incomplete information. Their decision-making follows prospect theory, in which perceived gains and losses are evaluated relative to a reference point, and behavioral preferences are characterized by loss aversion and nonlinear probability weighting. This assumption allows the model to capture stakeholders’ subjective perceptions of policy incentives, regulatory costs, and enforcement risks in EMC decision-making.
Assumption 3.
The initial state prior to the implementation of energy-saving retrofit projects is defined as the reference point. Incremental revenues, subsidies, and positive externalities are treated as gains, while costs, penalties, and expected losses are treated as losses.
Assumption 4.
All model parameters are strictly positive. Probabilities, including government supervision probabilities and strategy selection probabilities, lie within [0,1]. Additionally, to ensure economic feasibility, the return of ESCO under standard implementation exceeds its cost (Re > Ce).
To facilitate the subsequent model construction and simulation analysis, the key parameters involved in the tripartite game are systematically defined and summarized in Table 4.

2.3. Model Establishment

Based on the above assumptions, Table 5 reports perceived payoffs in the fixed order of government, ESCO, and ECU. Positive and negative terms denote perceived gains and perceived costs or penalties, respectively, after transformation by the functions in Equations (1)–(3).

3. Model Analysis

3.1. Replicator Dynamics of the Government

Based on the constructed perceived payoff matrix for the tripartite game, the following results can be derived, the expected perceived payoff for the government when adopting active regulation is
E G 1 = y z [ V N 1 + V M + V J ] + ( 1 y ) z [ V ( N 1 ) + V ( P 1 T ) + V ( ( 1 r ) M ) + V ( J ) ] + y 1 z V N 1 + V P 1 S + V r M + V J + ( 1 y ) ( 1 z ) [ V ( N 1 ) + V ( P 1 ( S + T ) ) + V ( J ) ]
The expected perceived payoff for the government when adopting routine regulation is
E G 2 = y z [ V N 2 + V η M + V θ J ] + 1 y z V N 2 + V P 2 T + V O + V 1 r η M + V θ J + y 1 z V N 2 + V O + V P 2 S + V η r M + V θ J + ( 1 y ) ( 1 z ) [ V N 2 + V O + V ( P 2 ( S + T ) ) + V θ J ]
E ¯ G = x E G 1 + 1 x E G 2
The replicator dynamic equation for the government is
F x = d x d t = x E G 1 E ¯ G = x 1 x E G 1 E G 2 = x 1 x Δ E G
Δ E G = V N 1 V N 2 + V J V θ J 1 y z V O + y z [ V ( M ) V ( η M ) ] + ( 1 y ) z [ V ( P 1 T )   V ( P 2 T ) + V ( ( 1 r ) M ) V ( ( 1 r ) η M ) ] + y ( 1 z ) [ V ( P 1 S ) V ( P 2 S ) + V ( r M )   V ( η r M ) ] + ( 1 y ) ( 1 z ) [ V ( P 1 ( S + T ) ) V ( P 2 ( S + T ) ) ]

3.2. Replicator Dynamics of ESCO

The expected payoff for ESCO when adopting standardized implementation is
E E 1 = x z [ V ( R e ) + V ( r M ) + V ( V e ) + V ( C e ) ] + ( 1 x ) z [ V ( R e ) + V ( r η M ) + V ( V e ) + V ( C e ) ] + x ( 1 z ) [ V ( R e ) + V ( r M ) + V ( C e ) ] + ( 1 x ) ( 1 z ) [ V ( R e ) + V ( r η M ) + V ( C e ) ]
The expected payoff for ESCO when adopting opportunistic behavior is
E E 2 = x z [ V R o + V C o + V P 1 T + V H ] + x 1 z V R o + V C o + V P 1 T + V H + V G + 1 x z V R o + V C o + V P 2 T + V H + ( 1 x ) ( 1 z ) [ V ( R o ) + V ( C o ) + V ( P 2 T ) + V ( H ) + V ( G ) ]
The average expected payoff for ESCO under mixed strategies is
E ¯ E = y E E 1 + 1 y E E 2
Similarly, the replicator dynamic equation for ESCO is
F y = d y d t = y E E 1 E ¯ E = y 1 y E E 1 E E 2 = y 1 y Δ E E
Δ E E = V ( R e ) V ( R o ) + V ( C e ) V ( C o ) V ( H ) + z V ( V e ) ( 1 z ) V ( G ) + x [ V ( r M ) V ( P 1 T ) ] + ( 1 x ) [ V ( r η M ) V ( P 2 T ) ]

3.3. Replicator Dynamics of ECUs

The expected payoff for ECU when adopting active Participation is
E U 1 = x y [ V ( K 1 ) + V ( ( 1 r ) M ) + V ( Q ) ] + ( 1 x ) y [ V ( K 1 ) + V ( ( 1 r ) η M ) + V ( Q ) ] + x ( 1 y ) [ V ( K 2 ) + V ( ( 1 r ) M ) + V ( Q ) ] + ( 1 x ) ( 1 y ) [ V ( K 2 ) + V ( ( 1 r ) η M ) + V ( Q ) ]
The expected payoff for ECU when adopting passive Participation is
E U 2 = x y [ V ( P 1 S ) + V K 1 ] + ( 1 x ) y [ V ( P 2 S ) + V ( K 1 ) ] + x 1 y V P 1 S + V K 2 + V G + ( 1 x ) ( 1 y ) [ V ( P 2 S ) + V ( K 2 ) + V ( G ) ]
The average expected payoff for ECU under mixed strategies is
E ¯ U = z E U 1 + ( 1 z ) E U 2
Similarly, the replicator dynamic equation for ECU is
F z = d z d t = z E U 1 E ¯ U = z 1 z E U 1 E U 2 = z 1 z Δ E U
Δ E U = V ( Q ) ( 1 y ) V ( G ) + x [ V ( ( 1 r ) M ) V ( P 1 S ) ] + ( 1 x ) [ V ( ( 1 r ) η M ) V ( P 2 S ) ]

3.4. Stability Analysis of the One-Dimensional System

According to the stability theorem of differential equations in evolutionary game theory, if and only if the replicator dynamic equation of a certain strategy satisfies F ( i ) = 0 and its first derivative d F ( i ) / d i < 0 the corresponding probability i constitutes an ESS. For the government, the replicator dynamic equation is given by
F ( x ) = x ( 1 x ) Δ E G = 0
Thus, the boundary equilibrium solutions are x = 0 , x = 1 , and Δ E G = 0 . By decomposing the payoff difference Δ E G in terms of the participation probability z of ECUs and other related factors, it can be simplified as
Δ E G ( y , z ) = z Φ ( y ) + Ψ ( y )
where Φ ( y ) is the coefficient term associated with z , and Ψ ( y ) is the constant term independent of z . Letting Δ E G   ( y , z ) = 0 , the critical threshold of the strategy probability for ECUs can be derived as
z * = Ψ ( y ) Φ ( y )
Based on the economic interpretation of the parameters, assume that Φ   ( y ) < 0 , which implies that as the degree of Participation of ECUs increases, the marginal benefit of the government adopting active regulation gradually decreases. Under this condition, the evolution of government strategy can be divided into three cases:
Case 1: When z = z * , we have Δ E G = 0 and d F ( x ) d x = 0 , indicating that the government strategy is in a neutral stable state, and any x [ 0 , 1 ] can be maintained.
Case 2: When z < z * , since Φ   ( y ) < 0 , it follows that Δ E G > 0 . At this point, d F ( x ) d x x = 1   < 0 , thus x = 1 is an evolutionary stable strategy, meaning the government tends toward active regulation.
Case 3: When z > z * , we have Δ E G < 0 . In this case, d F ( x ) d x x = 0   < 0 , thus x = 0 is an evolutionary stable strategy, indicating that the government tends toward routine regulation.
Similarly, for ESCOs and ECUs, the corresponding replicator dynamic equations F   ( y ) = 0 and F   ( z ) = 0 can be constructed. By applying the same method of variable separation, the critical threshold functions x * = f   ( z ) and y * = g   ( x ) can be derived. Therefore, under different initial conditions, the system may cross different critical boundaries within the three-dimensional strategy space, eventually converging to different evolutionary stable equilibria.

3.5. Stability Analysis of Equilibrium Points

Based on the evolutionary dynamics of the government, ESCO, and ECUs, a system of coupled replicator dynamic equations is constructed. By setting the evolution rates to zero, namely F (x) = 0, F (y) = 0, and F (z) = 0, all equilibrium points in the three-dimensional strategy space can be obtained.
The system admits eight pure-strategy equilibrium points located at the boundaries of the strategy space, namely E1 (0,0,0), E2 (1,0,0), E3 (0,1,0), E4 (0,0,1), E5 (1,1,0), E6 (1,0,1), E7 (0,1,1), and E8 (1,1,1). At these equilibria, the system is stationary under the replicator dynamics, while their local stability against strategy mutations must be further determined by the Jacobian eigenvalues.
In addition to these boundary equilibria, there exists a mixed-strategy Nash equilibrium E9 (x*,y*,z*) within the interior of the strategy space when x, y, z ∈ (0,1). However, according to Selten’s refinement in evolutionary game theory, an ESS must be a strict Nash equilibrium, which necessarily corresponds to a pure strategy. Therefore, although E9 satisfies the static Nash equilibrium condition, it cannot resist small perturbations in dynamic evolution and is not asymptotically stable.
According to Lyapunov’s first method, the stability of each equilibrium point can be determined by the eigenvalues of the Jacobian matrix. Specifically, an equilibrium is asymptotically stable if all eigenvalues are negative, whereas it is unstable if at least one eigenvalue is positive. The Jacobian matrix is given as follows:
J = F x x F x y F x z F y x F y y F y z F z x F z y F z z = J 11 J 12 J 13 J 21 J 22 J 23 J 31 J 32 J 33
where
J = ( 1 2 x ) Δ E G x ( 1 x ) Δ E G y x ( 1 x ) Δ E G z y ( 1 y ) Δ E E x ( 1 2 y ) Δ E E y ( 1 y ) Δ E E z z ( 1 z ) Δ E U x z ( 1 z ) Δ E U y ( 1 2 z ) Δ E U
To avoid excessive algebraic expansion, the Jacobian matrix is presented in a structured form using the partial derivatives of the payoff-difference functions. Based on this matrix, the complete eigenvalue expressions for all eight pure-strategy equilibria are derived and reported in Table 6.
Only equilibria corresponding to pure-strategy Nash equilibria can qualify as ESS. Since E9 represents a mixed-strategy Nash equilibrium with limited practical interpretability, this study focuses on the eigenvalue analysis of the eight pure-strategy equilibrium points. The stability of each equilibrium is determined by the eigenvalues of the Jacobian matrix, as summarized in Table 6. According to Lyapunov’s first method, an equilibrium is an ESS if all eigenvalues are strictly negative; it is unstable if all eigenvalues are strictly positive; and it is a saddle point if eigenvalues of different signs coexist.
Specifically, for each equilibrium point Ei, the Jacobian matrix is first evaluated at the corresponding steady state, and the resulting eigenvalues (μ1, μ2, μ3) are explicitly derived as functions of model parameters. The stability classification in Table 7 is then determined solely based on the sign structure of these eigenvalues. To establish a rigorous transition from eigenvalue expressions to Table 7, the analysis proceeds as follows.
When all three eigenvalues of E8 (1,1,1) are strictly less than zero, this equilibrium constitutes an ESS. In this case, the government’s valuation of long-term environmental and social benefits is sufficient to offset short-term fiscal and administrative costs, as reflected by V (N2) + V (−ηM) + V (−θJ) < V(N1) + V (−J) + V (−M). Effective regulatory mechanisms reduce the attractiveness of ESCO opportunism relative to compliant performance, while the corresponding eigenvalue condition is expressed as V (Ro) + V (−H) + V (−Co) + V (−P1T) < V (Re) + V (Ve) + V (−Ce) + V (rM). Meanwhile, ECUs are sufficiently constrained to maintain active participation under the corresponding eigenvalue conditions V (−P1S) < V (−Q) + V ((1 − r)M). Under these conditions, the system gradually converges to and stabilizes at the cooperative equilibrium E8 (1,1,1). Against the backdrop of China’s ongoing promotion of building energy conservation and carbon reduction initiatives, this equilibrium mechanism, jointly driven by long-term benefit incentives, institutional constraints, and behavioral penalties, is consistent with the current trajectory of policy evolution. Therefore, each of E5 (μ3 > 0), E6 (μ2 > 0) and E7 (μ1 > 0) contains at least one strictly positive eigenvalue and is classified as a saddle point.
At E1 (0,0,0), the government adopts routine regulation while ESCOs behave opportunistically and ECUs remain passive. This configuration weakens market order and exposes the government to credibility losses, environmental governance costs, and insufficient penalty-related returns. As a result, the government has an incentive to shift from routine regulation to active regulation; the corresponding eigenvalue satisfies μ1 > 0. At E2 (1,0,0), although the government has already adopted active regulation, the absence of ESCO compliance and ECU participation creates a payoff structure in which both parties can improve their returns through unilateral deviation; the eigenvalues satisfy μ2 > 0 and μ3 > 0. At E3 (0,1,0), the passive behavior of ECUs undermines emission reduction targets, prompting the government to transition from routine to active intervention in order to maintain institutional credibility and public trust; meanwhile, under relatively weak regulatory intensity, ESCOs obtain higher relative returns by shifting toward opportunistic behavior, further amplifying systemic deviation; the eigenvalues satisfy μ1 > 0 and μ2 > 0. At E4 (0,0,1), ECUs engaging in active participation incur losses due to ESCO opportunistic behavior, gradually eroding their willingness to cooperate; simultaneously, declining market trust and mounting environmental performance pressure drive the government to strengthen regulatory oversight; the eigenvalues satisfy μ1 > 0 and μ3 > 0. Since at least one eigenvalue is positive at each of E1 through E4, none of these equilibria satisfies the strict all-negative condition required for ESS classification. The comprehensive stability results are summarized in Table 7.
The stability analysis of all eight boundary equilibria is summarized in Table 7. The points E1E4 are identified as saddle points or unstable equilibria, representing initial non-cooperative configurations of the system, from which the evolutionary dynamics move away under strategy adjustment. Therefore, the subsequent analysis focuses on the evolutionary behavior associated with E5E8, which correspond to four typical phase-dependent regimes in the development of the EMC market.
Scenario 1 (E5): When payoff inequalities support active regulatory intervention but demand-side incentives remain insufficient, the system passes through E5 (1,1,0), in which the government adopts active regulation, ESCOs choose standard implementation, and ECUs remain passive. This reflects an asymmetric equilibrium in which supply-side behavior is effectively constrained by regulation, while demand-side participation remains insufficient. The stability of this state relies heavily on sustained high-intensity supervision.
Scenario 2 (E6): Under conditions where perceived gains from opportunistic behavior exceed expected penalties, the system evolves toward E6 (1,0,1), characterized by active regulation, opportunistic ESCO behavior, and active ECU participation. This outcome indicates a misalignment between incentives and constraints. Due to probability weighting distortion, ESCOs may systematically underestimate enforcement risks, allowing opportunistic behavior to persist despite regulatory presence.
Scenario 3 (E7): When regulatory costs increase and marginal supervisory benefits decline, the system converges to E7 (0,1,1), in which the government adopts routine regulation while ESCOs and ECUs maintain compliant and active participation. This represents a cost-constrained equilibrium in which market participants have internalized regulatory expectations to a certain degree. However, this state should not be interpreted as spontaneous market stability independent of government intervention; rather, it reflects a transitional equilibrium shaped by ongoing regulatory cost pressures. Its stability remains fragile, as probability weighting may lead agents to gradually underestimate enforcement probability over time, potentially triggering strategic deviation if institutional constraints are not maintained.
Scenario 4 (E8): When both incentive and constraint mechanisms are well-aligned, the system converges to the ESS E8 (1,1,1), in which the government adopts active regulation, ESCOs choose standard implementation, and ECUs adopt active participation. This equilibrium demonstrates that under the current stage of EMC market development, strengthening regulatory constraints and incentive mechanisms can effectively suppress opportunistic behavior, improve service quality, and drive market standardization.
It should be emphasized that E8 (1,1,1) represents a critical institutional foundation for EMC market development within this framework, rather than an unconditionally permanent endpoint. Given that market credit systems remain insufficiently established, credible government oversight is necessary to constrain opportunistic implementation by ESCOs and passive participation by ECUs, thereby supporting supply-side stability and demand-side participation continuity. Maintaining this configuration through active regulation, however, entails high institutional operating costs.
The preceding analysis of E7 (0,1,1) suggests that premature reduction in regulatory intensity before market maturity may weaken deterrence, lead agents to underestimate violation risks through probability weighting distortion, and trigger strategic deviation that destabilizes market order. Therefore, any transition toward routine regulatory governance must be premised on the gradual establishment of endogenous market constraint mechanisms, rather than driven passively by cost pressures alone.
From a long-term perspective, the high-intensity supervisory model underpinning this equilibrium retains room for further optimization. As market mechanisms and constraint structures progressively mature, regulatory governance may gradually reduce its dependence on high-cost inputs while preserving necessary deterrence, thereby guiding the system toward a more robust and self-sustaining equilibrium with stronger endogenous disciplinary capacity.

4. Simulation Analysis

4.1. Model Validation

Based on the above analysis, the evolutionary game simulation process exhibits different evolutionary trends under varying parameter settings. To investigate the strategic choices and interactions among the government, ESCOs, and ECUs under policy incentives and constraints, this study employs MATLAB R2024a for numerical simulation. In evolutionary game simulations, parameter settings are typically determined using two approaches: (1) assigning values within a reasonable empirical range that satisfies equilibrium conditions; and (2) setting parameters based on case studies or relevant policy literature [16,31,32]. In this study, the parameters are set by combining policy documents, publicly available EMC industry information, and comparable evolutionary game studies. The specific parameter settings are as follows.
For behavioral parameters, based on the seminal empirical studies of Tversky and Kahneman, prospect theory parameters are introduced to capture bounded rationality. Specifically, the gain risk preference coefficient α and loss risk preference coefficient β are both set to 0.88, the probability weighting parameter for losses γ = 0.69, and the loss aversion coefficient λ = 1.5. These parameters reflect the asymmetric sensitivity of decision-makers to gains and losses and are adopted based on established empirical evidence [30,33].
From a behavioral mechanism perspective, the government can promote the implementation of EMC projects through subsidy and penalty mechanisms. According to policy documents such as the “14th Five-Year Plan for Building Energy Efficiency and Green Building Development” issued by the Ministry of Housing and Urban–Rural Development, EMC has been identified as a key institutional instrument for promotion. Under this policy context, although the government bears subsidy and regulatory costs, it gains long-term benefits such as improved administrative credibility and progress toward carbon neutrality goals, thereby weakening its sensitivity to short-term costs. Moreover, enhanced government participation helps reduce perceived risk. In China’s green retrofit process, the government typically reduces project uncertainty through subsidies, selection of qualified ESCOs, and policy advocacy, thereby alleviating the loss aversion and resistance of end-use consumers. The probability weighting parameter γ captures cognitive bias in stakeholders’ perceived inspection and punishment risks.
Regarding parameter setting, based on publicly available EMC project and industry information released by the China Energy Conservation Association (EMCA) and relevant studies, the baseline parameters are set as follows. The basic payoffs of compliant behavior and opportunistic behavior are Re = 19 and Ro = 18, respectively. Since compliant implementation requires higher equipment and technological investment, its cost is set as Ce = 12, significantly higher than the opportunistic cost Co = 4. The reputation benefit of compliance is set as Ve = 3, while under low energy-saving benefit acquisition cost H = 1, opportunistic behavior still retains incentives, reflecting moral hazard in practice [16,34]. To reflect coordination and regulatory costs for end-use consumers, Q = 7 is introduced to capture hidden costs such as production interruption, cross-department coordination, and supervision management [35].
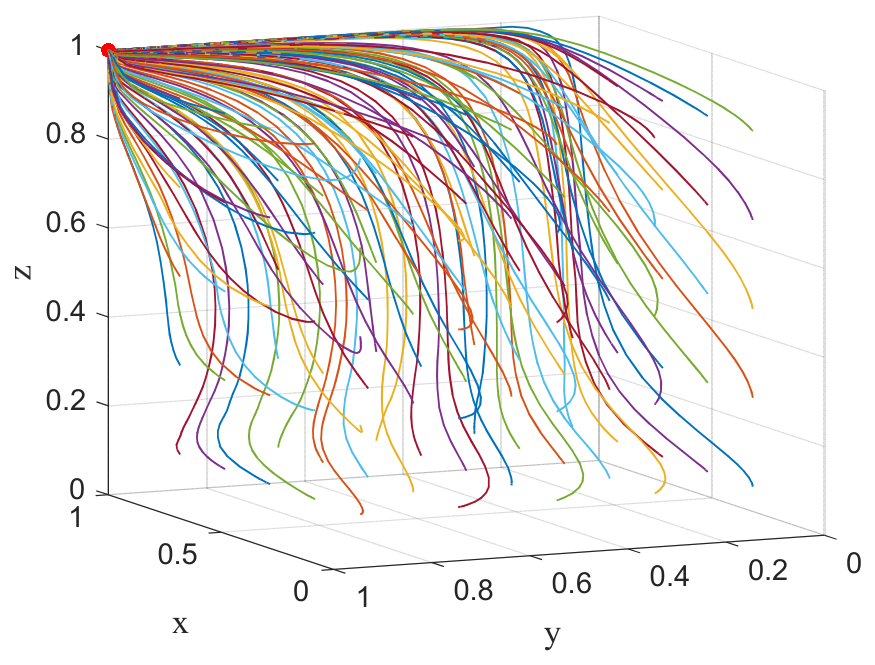
According to the “Action Plan for Carbon Peaking and Carbon Neutrality during 2024–2025” issued by the State Council of China and the “Special Fund Management Measures for Energy Conservation and Carbon Reduction” issued by the National Development and Reform Commission, a policy structure with stronger penalties than incentives is adopted. The penalty for ESCO opportunistic behavior is set as T = 10, and the penalty for end-use consumers is set as S = 10. The subsidy is set as M = 5, distributed according to r = 0.5 [36]. In terms of regulatory intensity, the detection probability under active regulation is set as P1 = 0.8, while that under routine regulation is P2 = 0.2, reflecting differences in policy enforcement intensity. From the government payoff perspective, active regulation yields higher long-term social benefits N1 = 28, while routine regulation yields N2 = 10. However, the former is accompanied by higher immediate cost J = 8. Under weakened regulation, the cost-saving coefficient is θ = 0.2, the subsidy reduction coefficient is η = 0.2, and market disorder losses are considered as O = 5 [29,37]. Based on the above analysis, we extract the parameter values and substitute them into the model to obtain the simulation results presented in Figure 2. Additional explanations of the source basis and setting logic of the key numerical parameters are provided in Appendix A.
In the baseline setting, this study assumes a unified reference point for the government, ESCOs, and energy users to represent their common initial state and simplify the model. The initial strategy probability of each party was set to 0.5. Considering possible heterogeneity in experience and environment, sensitivity analyses with different reference points were conducted, and the results remain robust.

4.2. Policy Incentive Strategy Evolutionary Game Simulation Analysis

Simulation and Analysis of Incentive Intensity Coefficient M

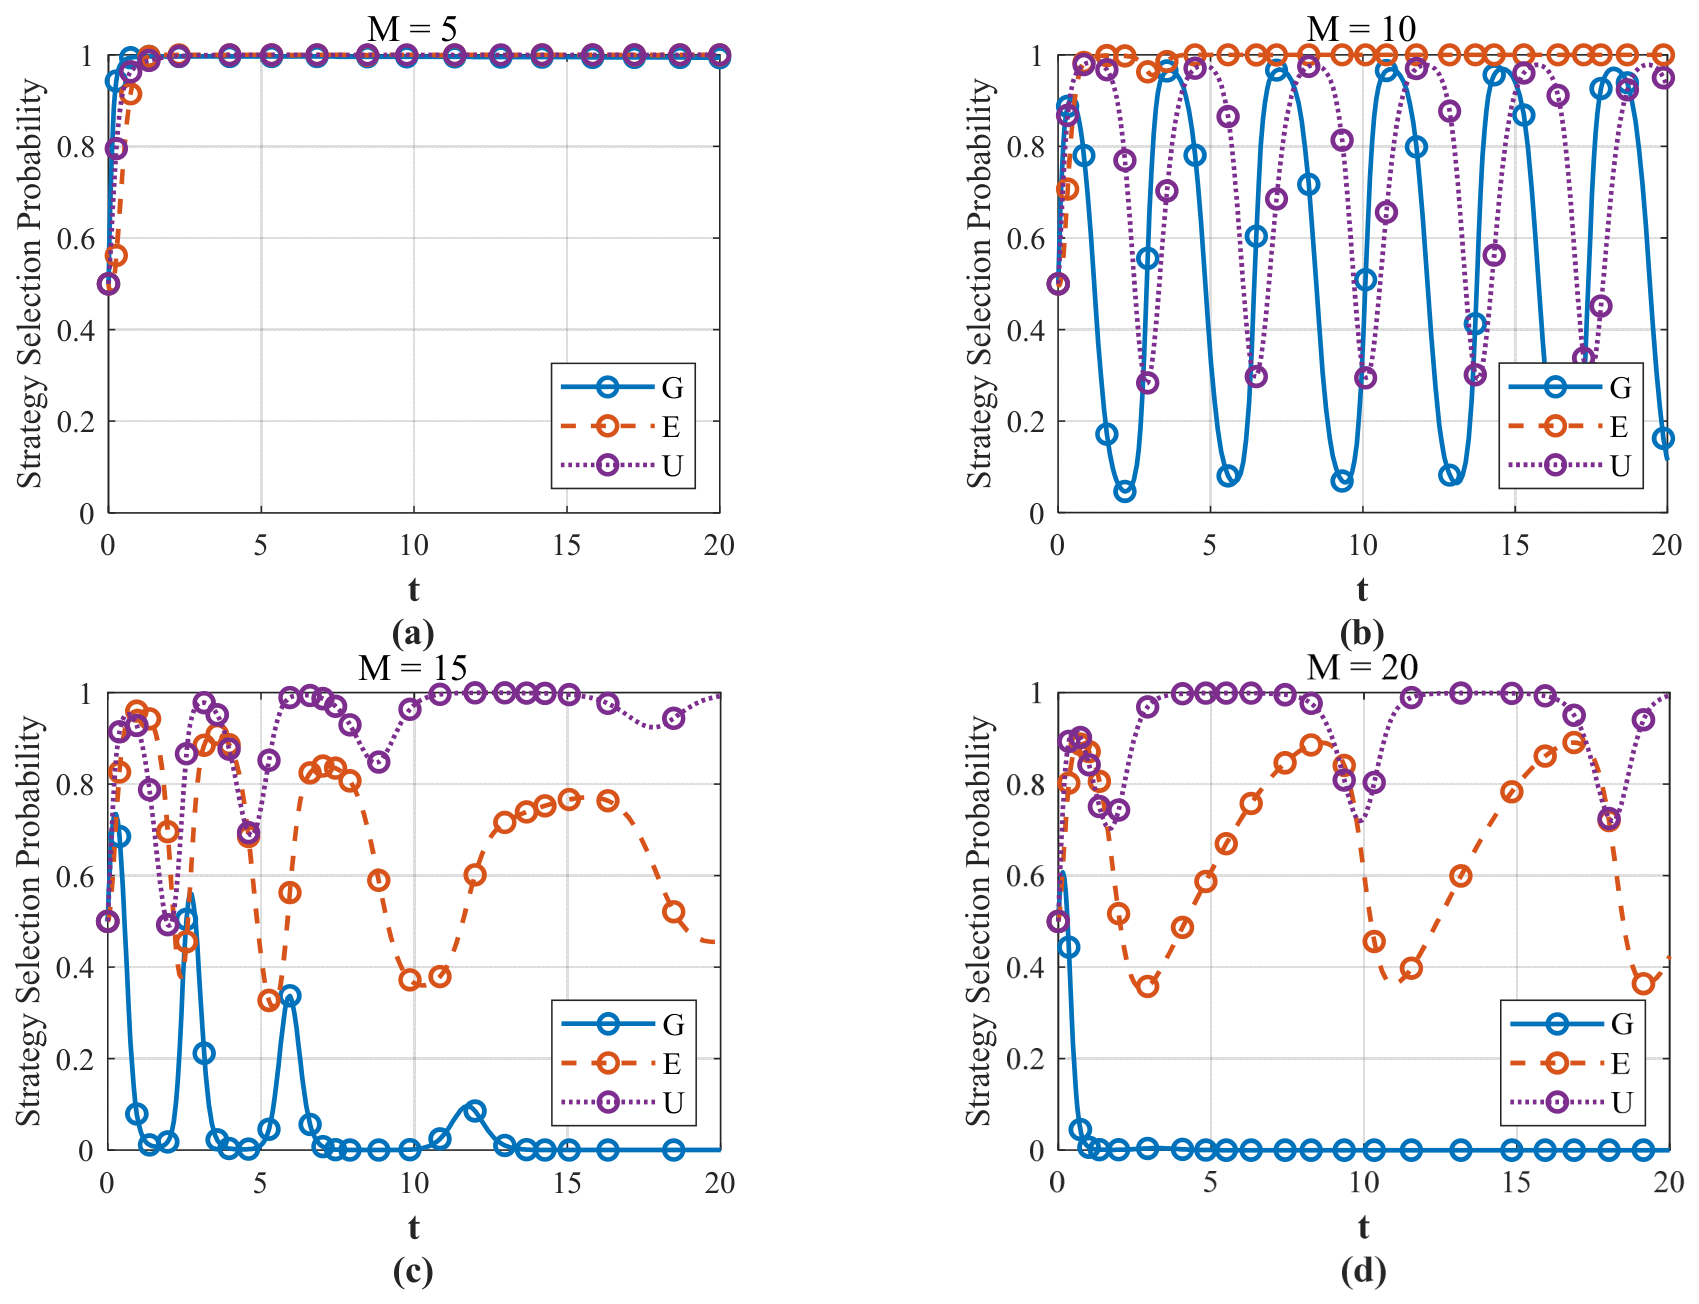
To examine the effect of fiscal subsidy intensity on system evolution, M is set to 5, 10, 15, and 20, respectively, while other parameters remain unchanged. The simulation results are shown in Figure 3a–d.
When M = 5, the three-party strategies rapidly converge to E8 (1,1,1), indicating that moderate subsidies can stimulate the participation of both ESCOs and ECUs without imposing excessive fiscal pressure on the government. When M increases to 10 and 15, the system exhibits pronounced fluctuations: the government strategy oscillates first, followed by the repeated switching of ESCOs and ECUs between compliant/opportunistic and active/passive strategies. Loss aversion amplifies the perceived fiscal burden, inducing a shift toward routine regulation. When M = 20, the government strategy quickly converges to x = 0, indicating a shift from active to routine regulation. Although excessive subsidies may sustain participation in the short term, weakened regulatory constraints make opportunistic behavior by ESCOs more likely, preventing the system from maintaining stability. Overall, fiscal subsidies exert a nonlinear effect: moderate subsidies promote convergence, whereas excessive subsidies may induce a shift toward routine regulation and system instability. This suggests that simply increasing subsidy intensity is insufficient to achieve a long-term stable equilibrium.

4.3. Policy Constraint Strategy Evolutionary Game Simulation Analysis

4.3.1. Simulation and Analysis of Government Penalty Intensity Coefficient T on ESCOs

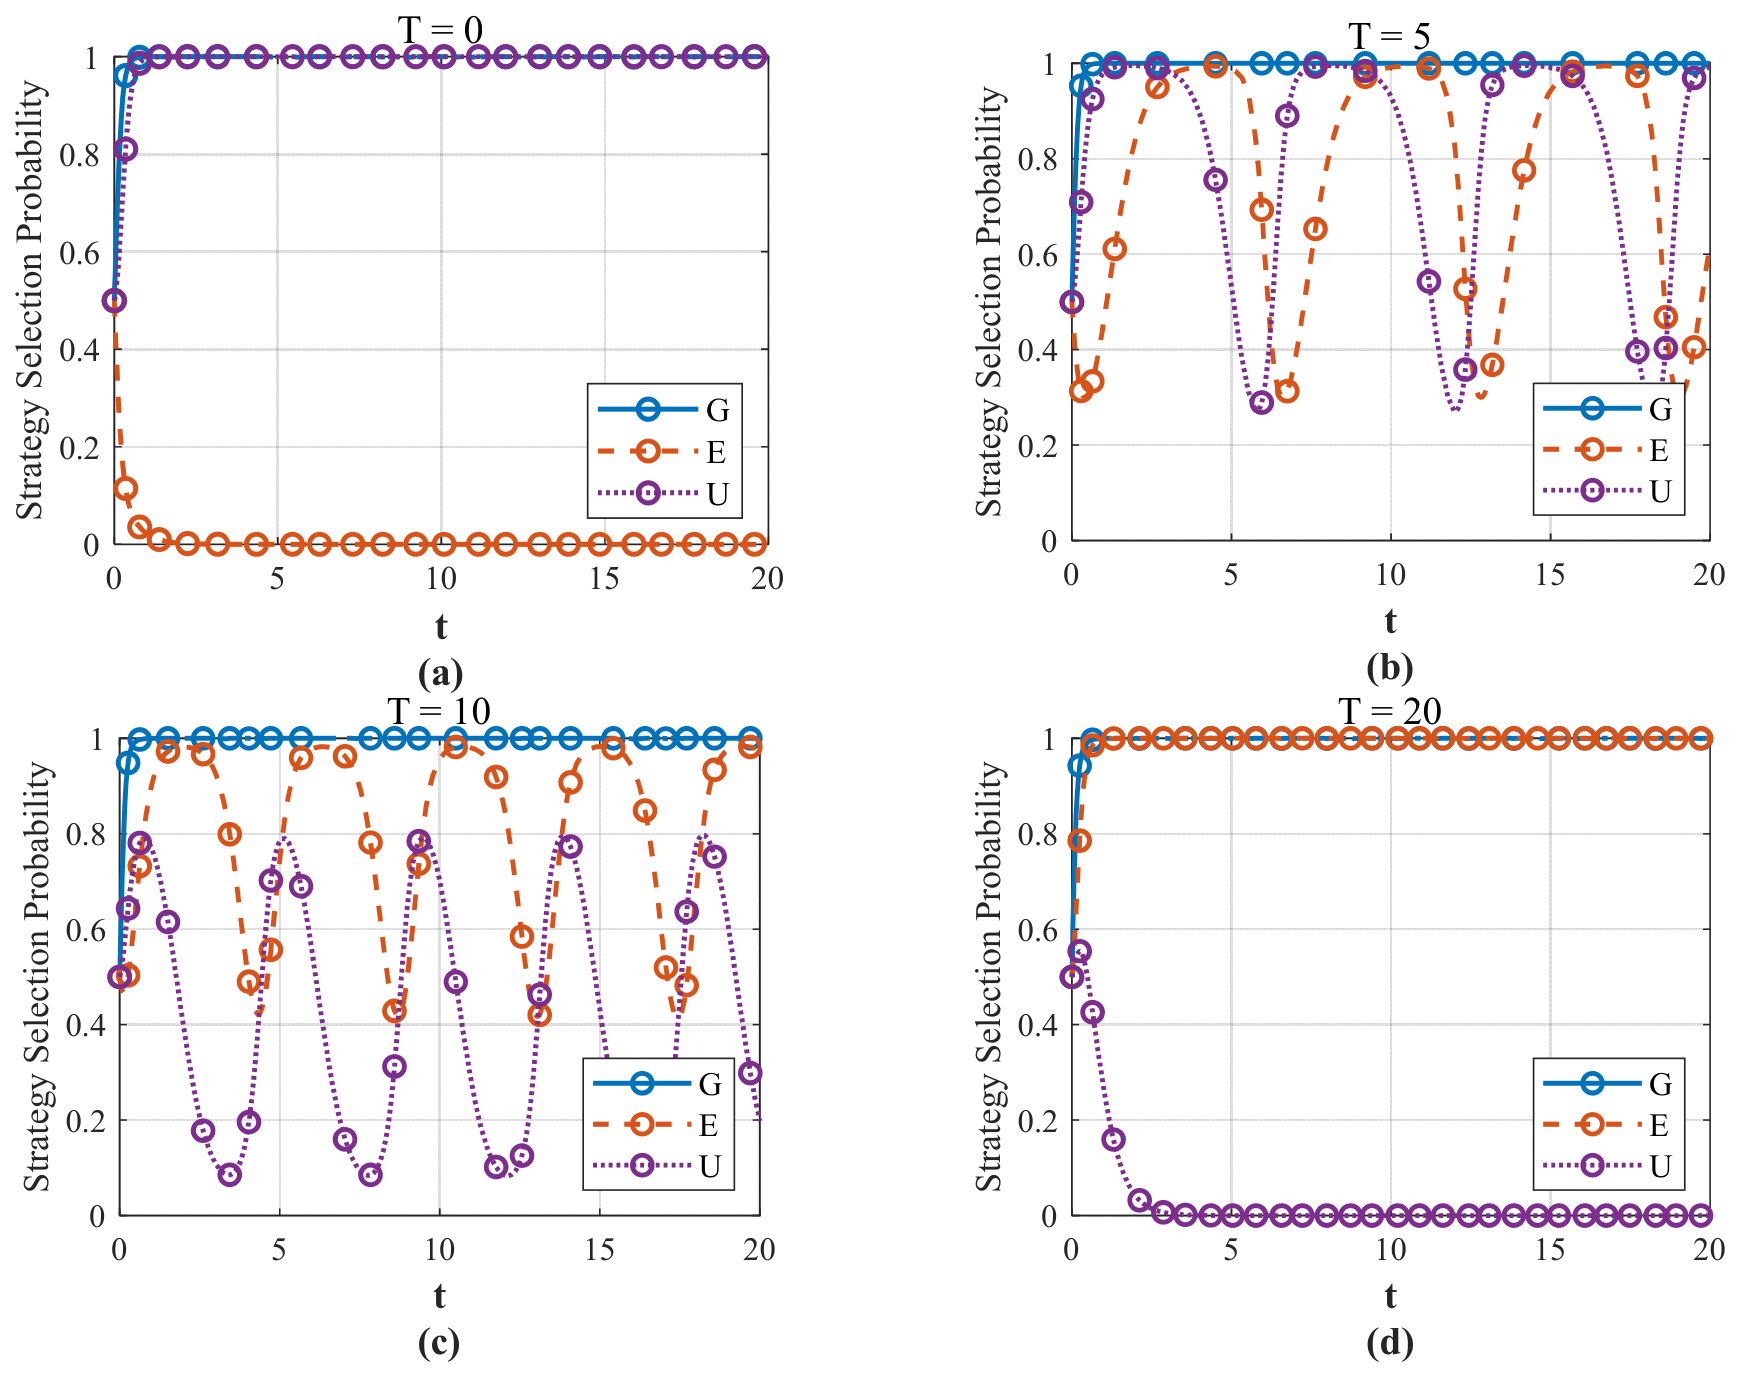
As T increases, the system exhibits four distinct evolutionary patterns, as shown in Figure 4a–d.
Under the baseline parameter setting, the strategies of all three agents rapidly converge to the ideal equilibrium E8 (1,1,1). However, in practical EMC retrofit markets, due to information asymmetry and high coordination costs Q, ECUs often show low participation willingness and weak regulatory engagement. This condition is represented by a relatively low ECU penalty level S = 5, which weakens their participation incentives. Against this background, the effect of government penalty intensity T on ESCO behavior is further examined.
When T = 0, in the absence of penalties, ESCOs converge to opportunistic behavior. In response, ECUs adopt active participation to avoid potential losses, while the government maintains strict supervision, resulting in a distorted market structure without effective disciplinary symmetry. When T = 5 or T = 10, although penalties are introduced, their intensity remains insufficient to stabilize the system, leading to persistent oscillations in strategy selection. When T = 20, the strong loss aversion effect associated with high penalties significantly increases the cost of non-compliance, driving ESCOs toward standard implementation. However, since the penalty imposed on ECUs remains lower than their participation cost, they shift to passive participation, effectively withdrawing from collaborative supervision. Consequently, the government must sustain high-intensity regulation and bear substantial long-term regulatory costs. This asymmetric outcome motivates the subsequent analysis of ECU penalty intensity.

4.3.2. Simulation and Analysis of Government Penalty Intensity Coefficient S on ECUs

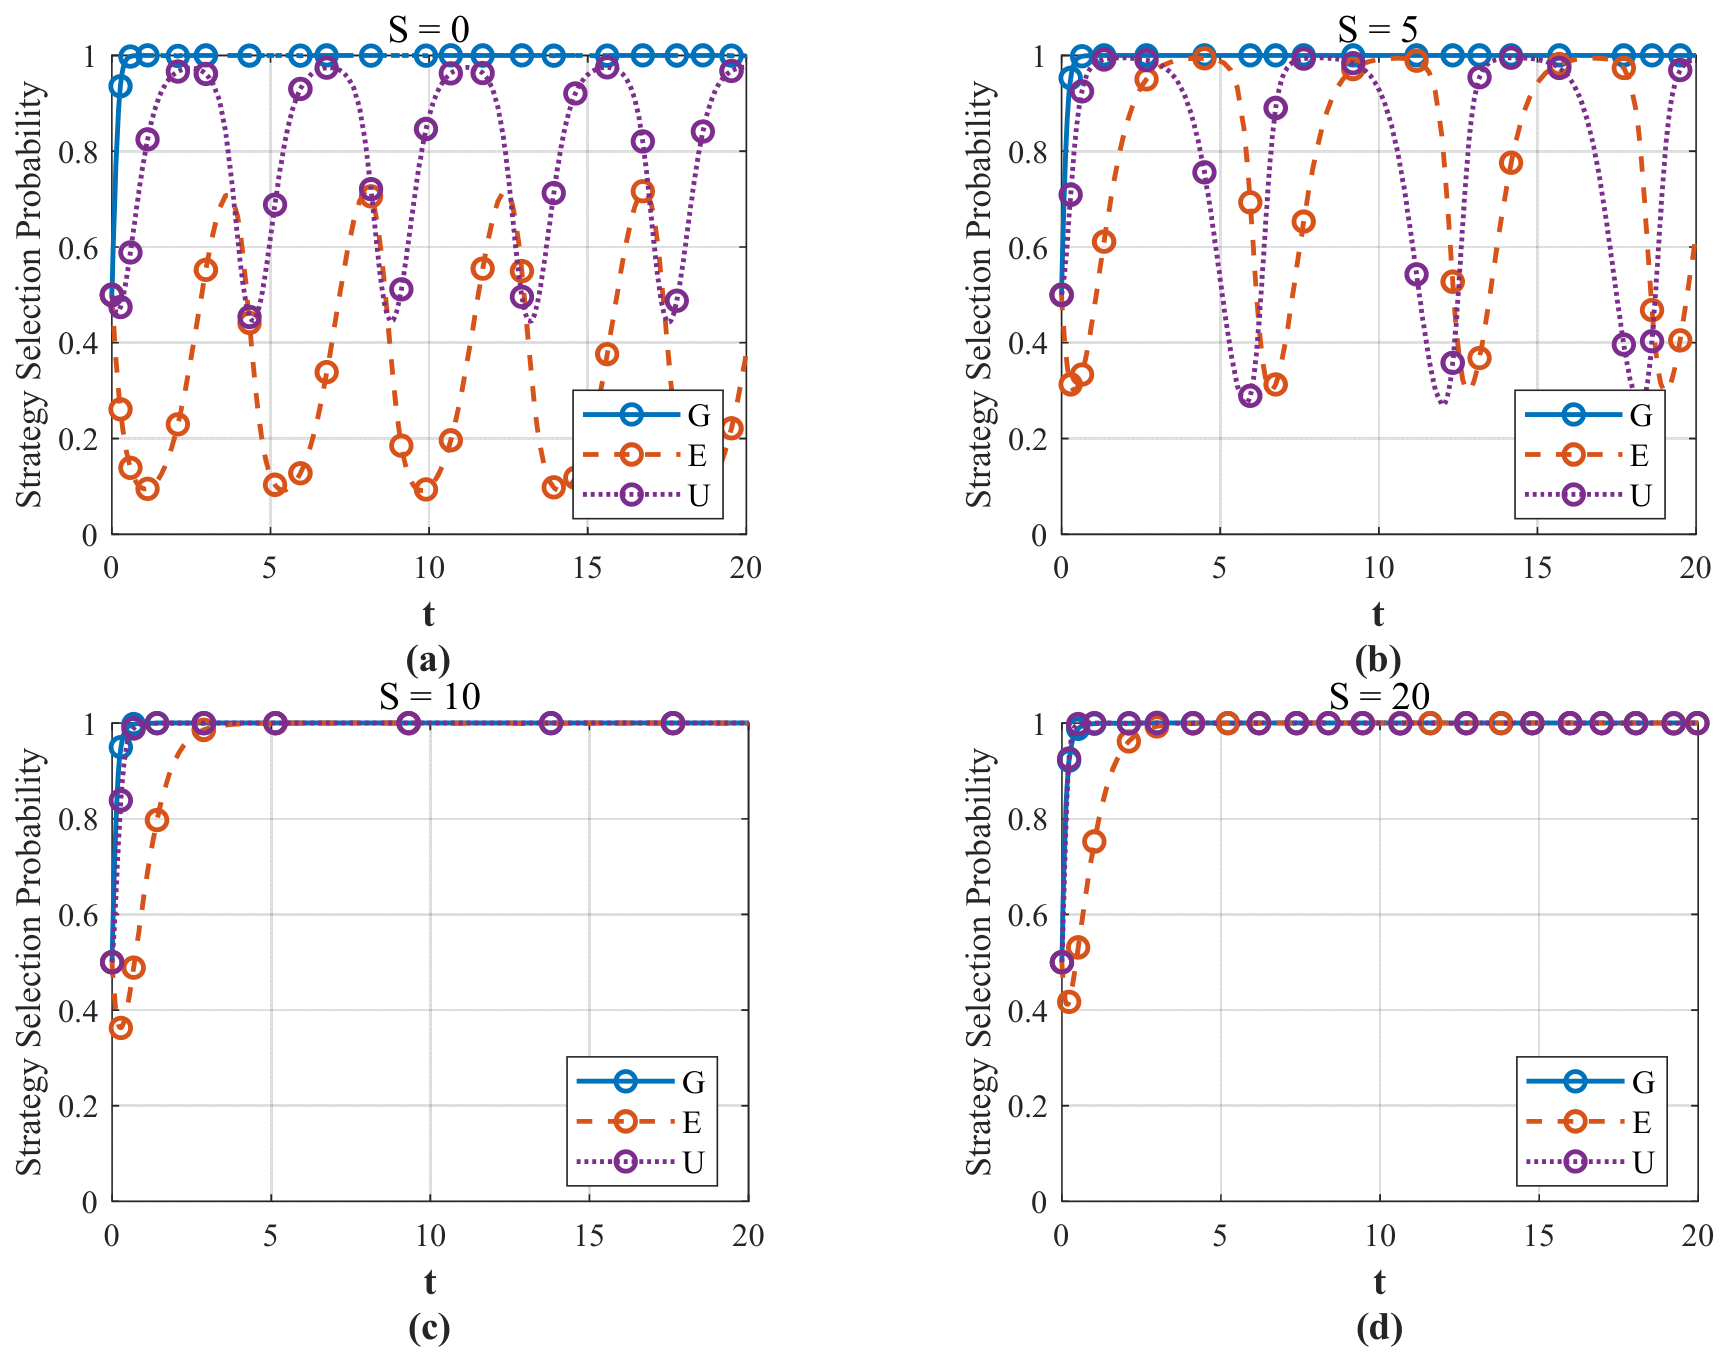
As S increases, the system exhibits four distinct evolutionary patterns, as shown in Figure 5a–d.
In practical EMC markets, severe information asymmetry, difficulties in detecting hidden violations, and limited enforcement capacity make it difficult to sustain such high-intensity regulation. As a result, the system often operates under suboptimal regulatory conditions. A high ESCO penalty intensity, such as T = 20, may suppress ESCO opportunism, but it may also obscure the endogenous governance role of ECUs and the need to constrain passive participation. To capture this, a lower ESCO penalty level T = 5 is set, and the effect of ECU penalty intensity S is further examined.
When S = 0, the system shows persistent oscillations without convergence, indicating weak constraints on both ESCOs and ECUs and the dominance of opportunistic behavior. When S = 5, oscillations persist but with reduced amplitude, suggesting that the incentive for ECU participation remains insufficient. When S = 10, the system undergoes a qualitative transition: ECUs converge to active participation, which in turn constrains ESCO opportunism and induces a gradual shift toward compliant behavior, even under low government penalties. When S = 20, the system follows a similar convergence path as S = 10, with only a faster convergence rate and no further change in the steady-state structure, indicating diminishing marginal effects of policy intensity.

4.3.3. Impact of Regulatory Cost J on the Evolutionary Strategies of Stakeholders

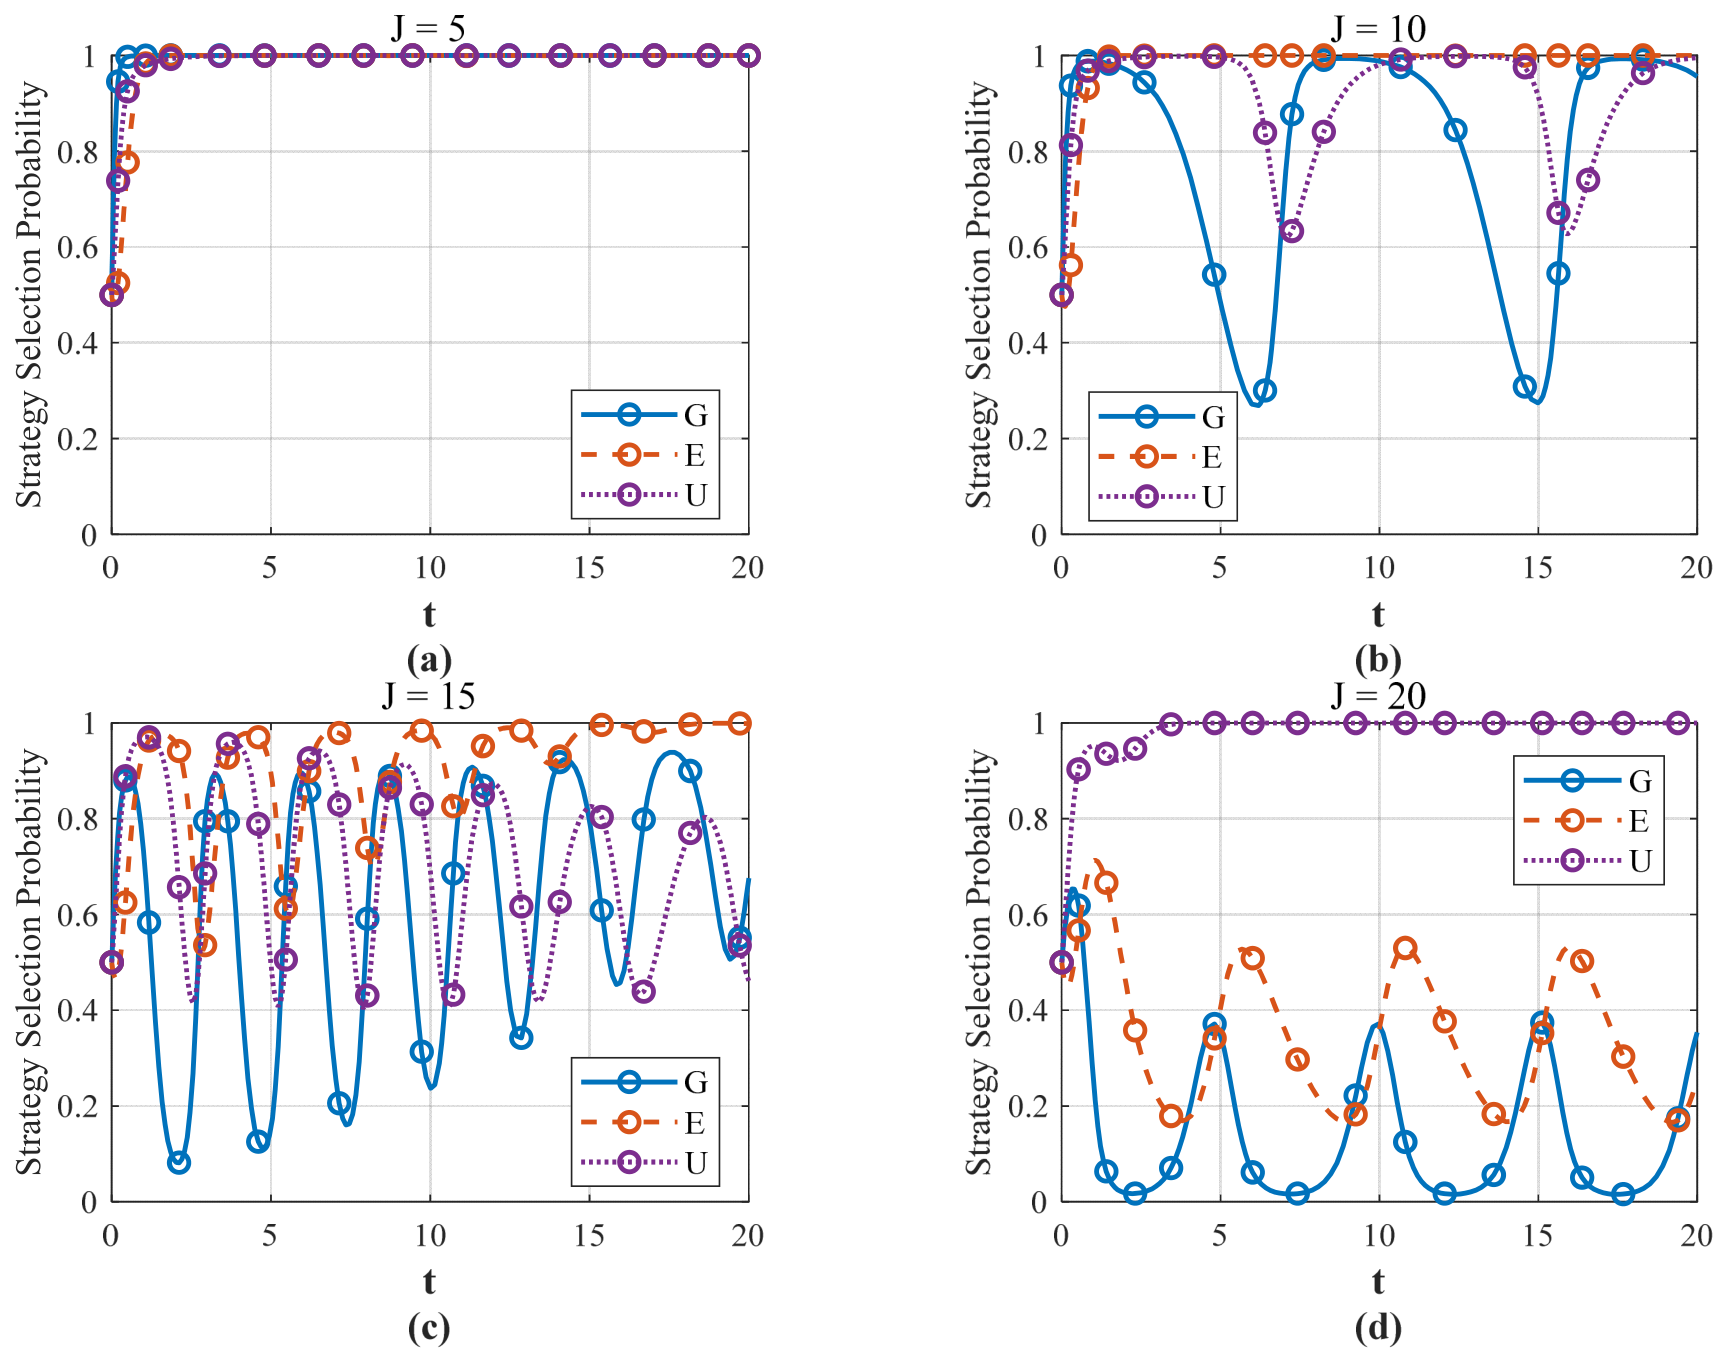
To examine the impact of government regulatory cost on system evolution, J is varied while keeping other parameters constant. The results are shown in Figure 6a–d.
When J = 5, the system rapidly converges to E8 (1,1,1). At this level, regulatory costs are low, and the government can sustain continuous supervision. Under stable regulation, ESCOs and ECUs converge to standard implementation and active participation, respectively. When J = 10, rising regulatory costs weaken the government’s ability to offset expenditures through penalties or indirect benefits. This induces a tendency to reduce supervision intensity; however, once regulation weakens, market behavior deviates, triggering renewed regulatory strengthening and resulting in dynamic oscillations. When J = 15, oscillations intensify and system stability further declines. When J = 20, the system exhibits persistent disorderly fluctuations, indicating that excessive regulatory costs undermine the sustainability of supervision and prevent the formation of a stable equilibrium, ultimately eroding the competitive advantage of the EMC model and hindering its widespread adoption.
In summary, once regulatory costs exceed a transition range, the government’s loss aversion amplifies the perceived burden of sustained enforcement, inducing oscillations between active and routine supervision. Under fluctuating regulatory intensity, ESCOs and ECUs adjust their strategies with lagged or uneven responses to changing incentive and penalty signals, preventing the system from converging to a stable equilibrium. These findings suggest that reducing regulatory costs through improved institutional efficiency—rather than simply increasing penalty intensity—is essential for sustaining long-term market stability.

4.4. Perceptual Variable Evolutionary Game Simulation Analysis

4.4.1. Impact of the Loss Aversion Coefficient λ on the Evolutionary Strategies of Stakeholders

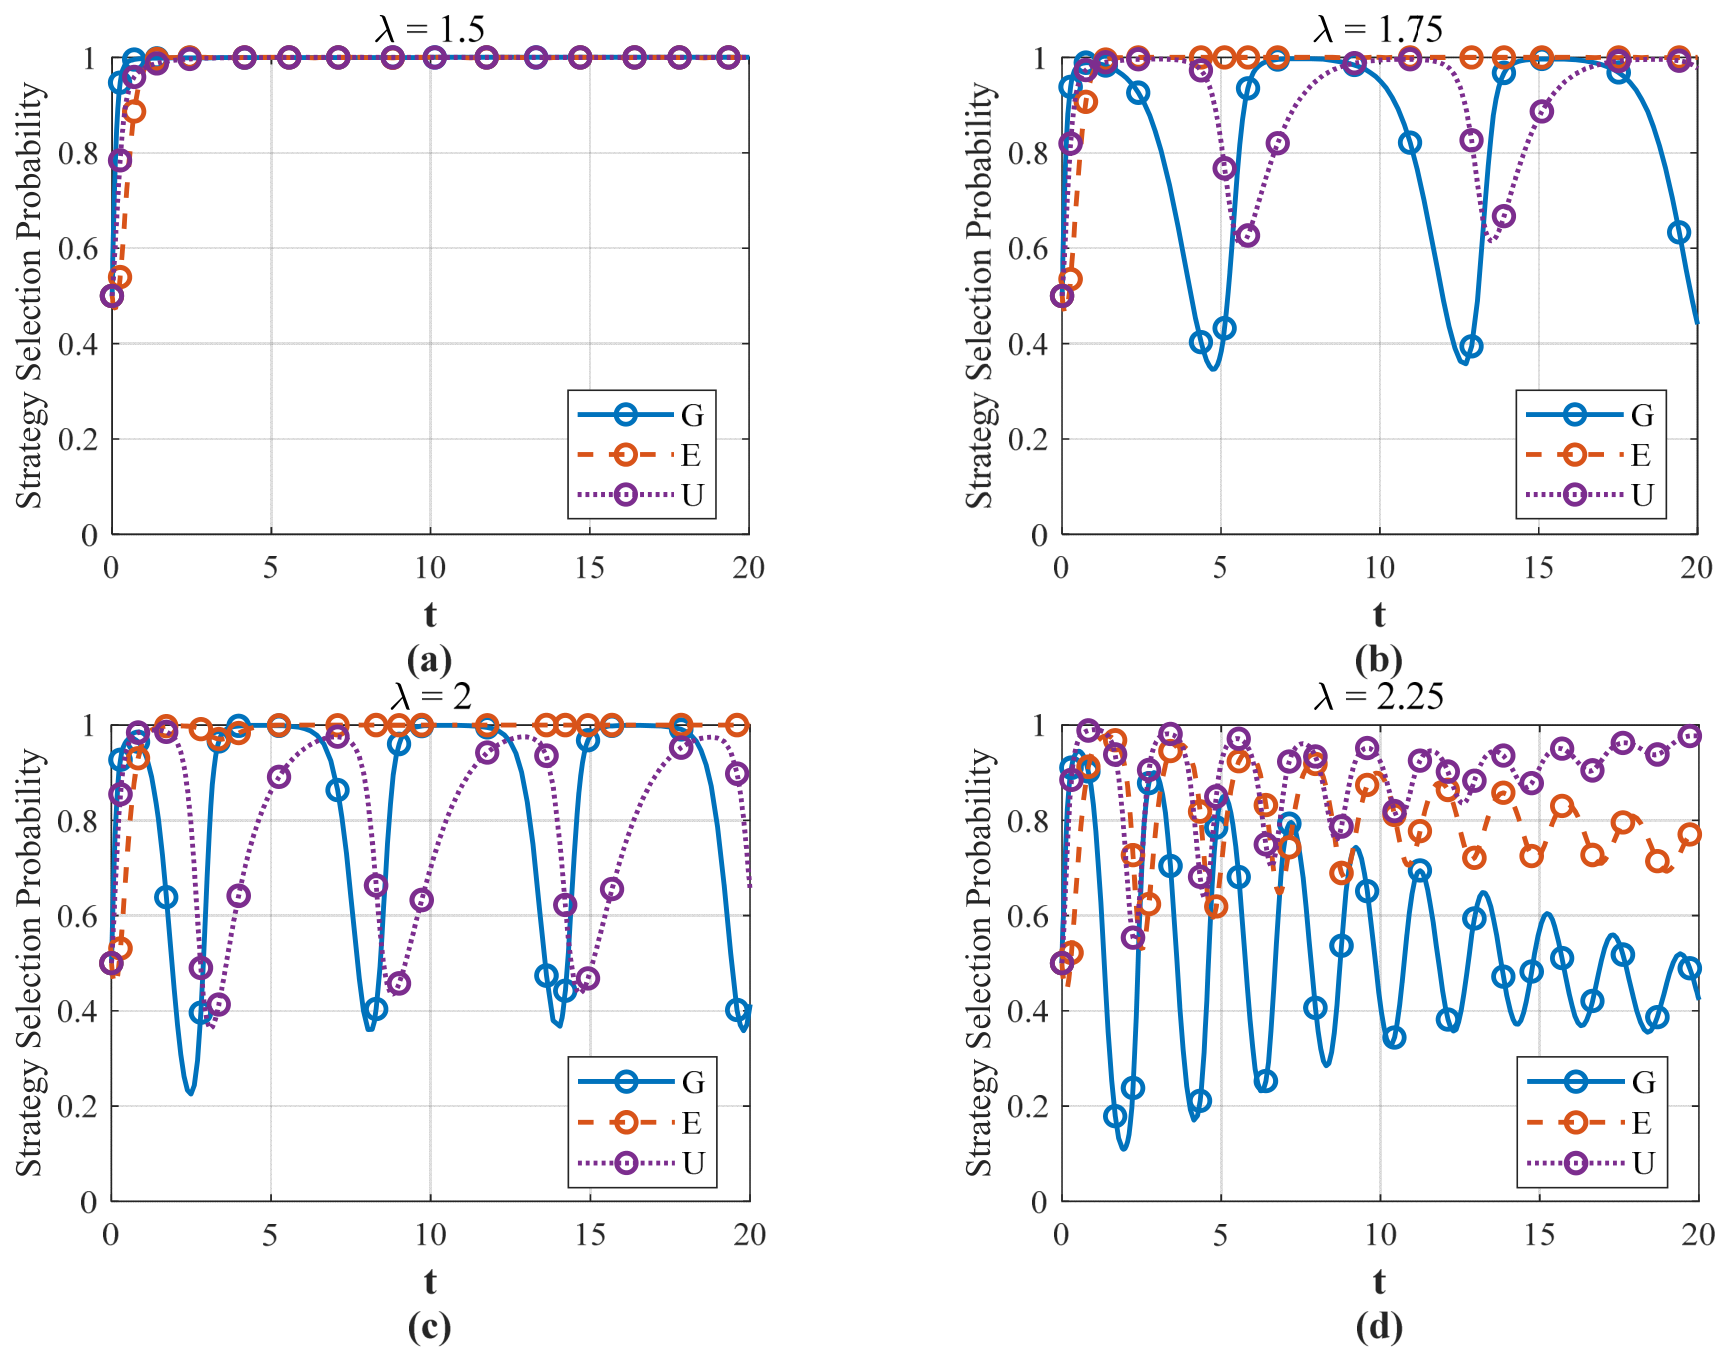
To examine the specific influence of loss aversion on decision-making, the coefficient λ is varied. As shown in Figure 7a–d, the system exhibits distinct evolutionary patterns under different levels of λ.
At λ = 1.5, the system rapidly converges to the state E8 (1,1,1), indicating that moderate loss aversion strengthens the deterrent effect of penalties while keeping the government’s perceived regulatory burden within a tolerable range. As λ increases, the system begins to exhibit periodic oscillations. The instability originates from the government’s amplified perceived disutility of regulatory costs, which induces a temporary retreat from active regulation. This weakens institutional constraints, encourages ECU free-riding, and subsequently creates space for ESCO opportunism, forcing the government to reintroduce strict supervision. At a high level of λ, the ECU becomes locked into active participation, while the government and ESCO enter high-frequency oscillations. In this case, ECU participation is not driven by positive incentives, but by defensive risk avoidance under amplified perceived losses. Overall, excessive loss aversion distorts the governance structure by inducing regulatory retreat and shifting governance costs to the demand side, resulting in an unsustainable market state.

4.4.2. Impact of Diminishing Sensitivity α on System Evolution

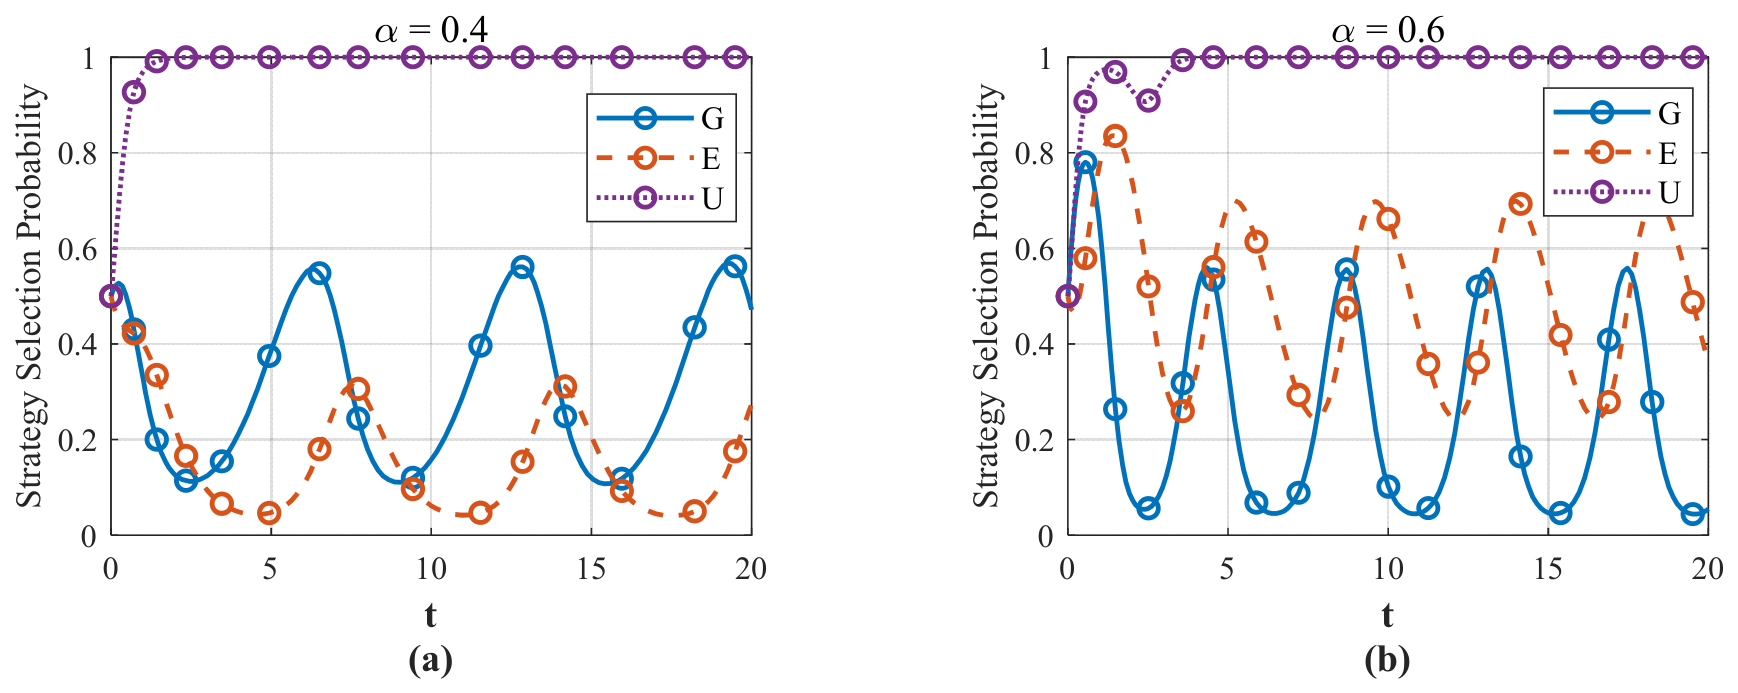
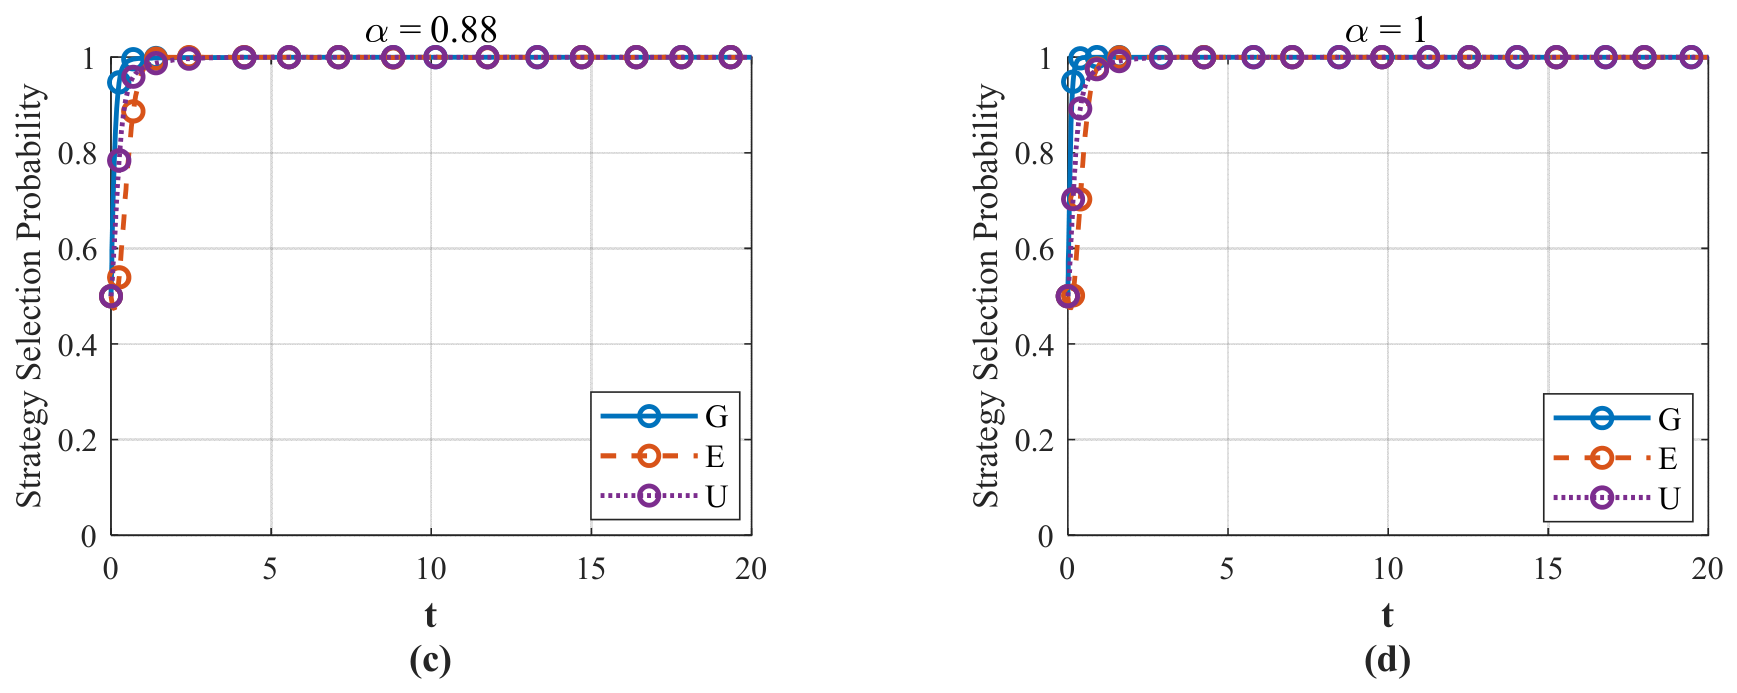
To evaluate how marginal sensitivity to gains and losses shapes strategic choices, this section examines the evolutionary process under varying α. The simulation results are depicted in Figure 8a–d.
In the gain domain, as α decreases from 0.88 to 0.4, the system shifts from convergence to periodic oscillations. A decrease in α weakens stakeholders’ marginal perception of positive gains. When α is relatively low, subsidies, reputational benefits, and compliance returns become less attractive relative to the perceived costs of regulation and implementation, making it more difficult for positive incentives to sustain stable cooperation. As a result, the government and ESCOs become more prone to strategic fluctuations. In contrast, ECUs maintain relatively high participation, suggesting that their behavior is driven less by incremental gains and more by avoiding potential losses caused by non-participation or ESCO opportunism. This result indicates that incentive policies should not rely solely on increasing nominal subsidy levels; they should also improve the visibility, credibility, and accessibility of expected gains.

4.4.3. Impact of Diminishing Sensitivity β on System Evolution

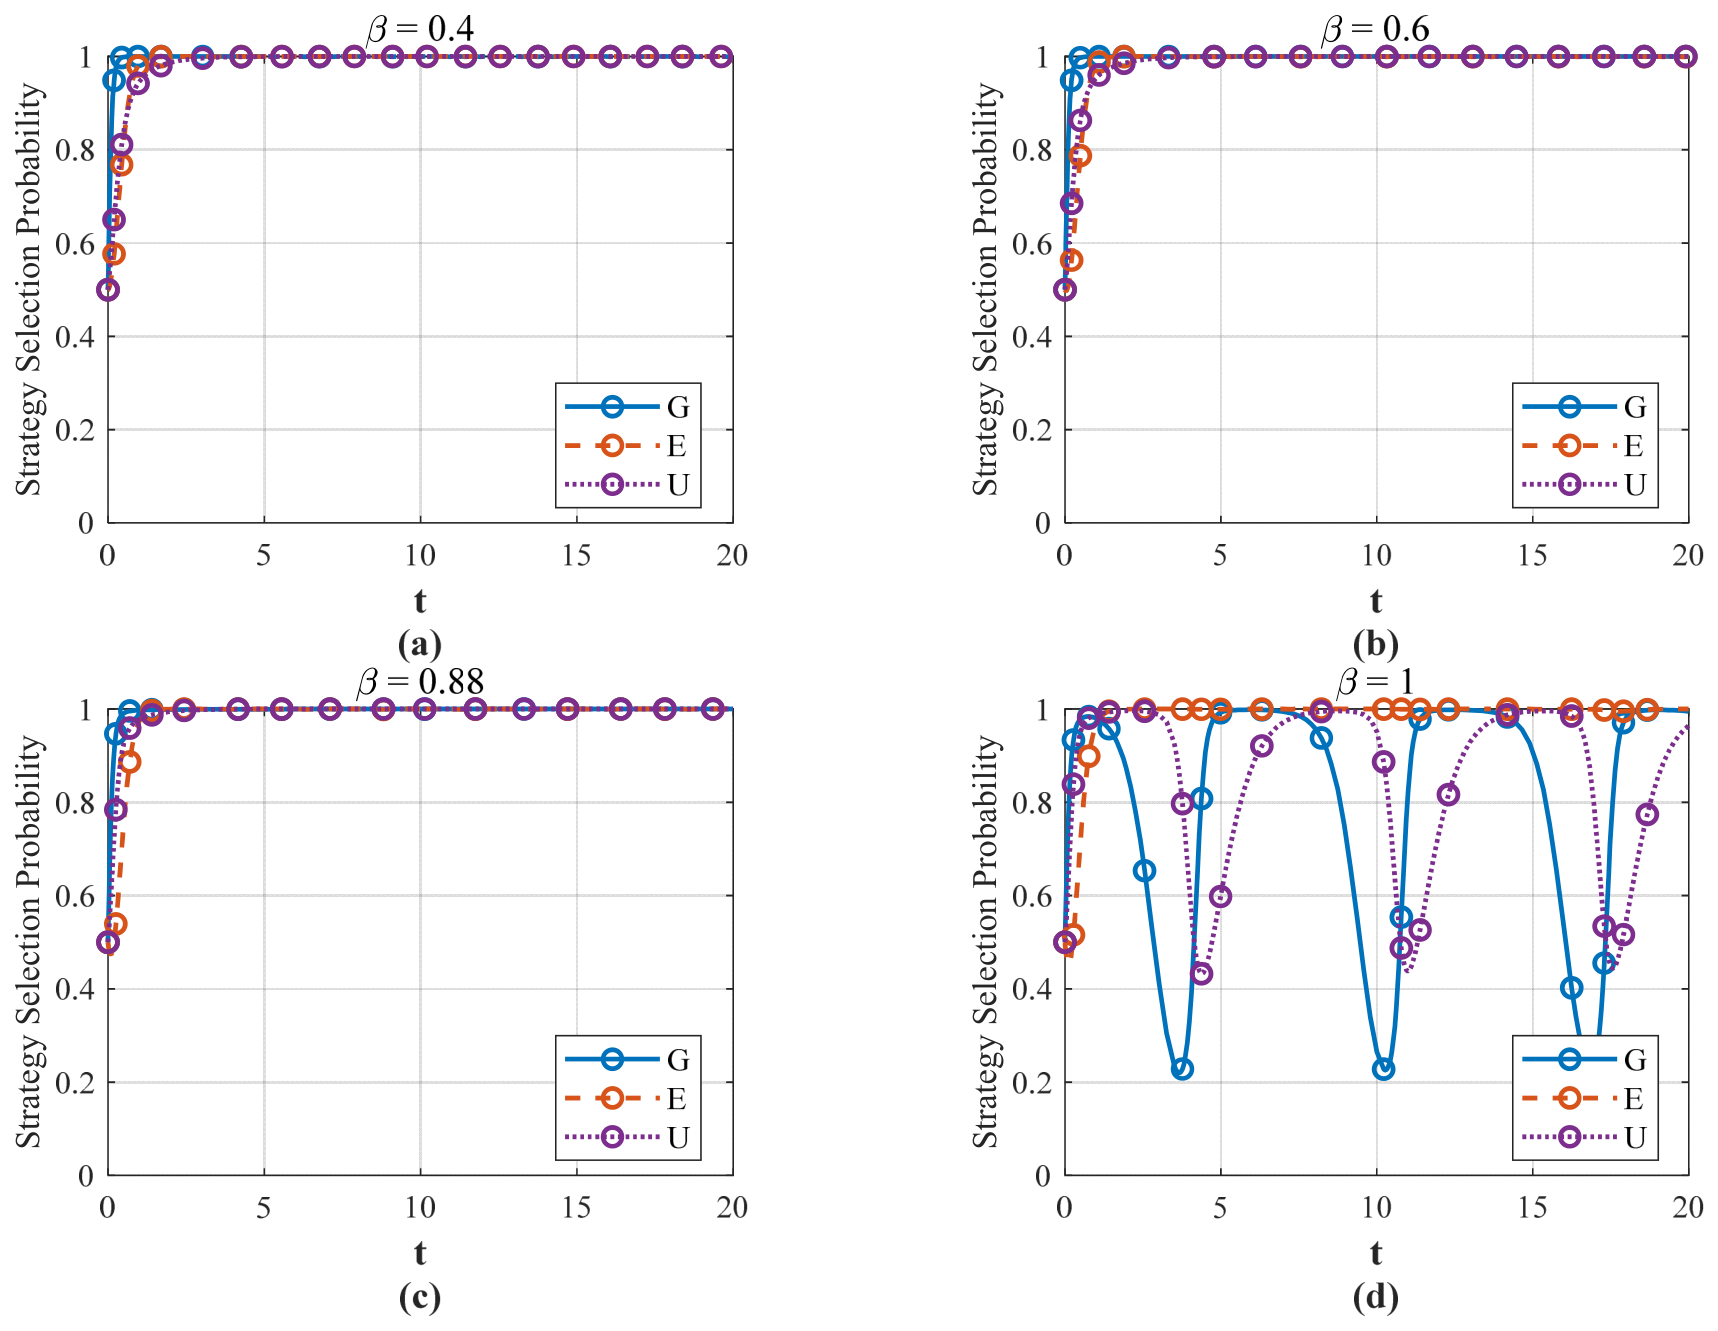
To evaluate how marginal sensitivity to gains and losses shapes strategic choices, this section examines the evolutionary process under varying β. The simulation results are depicted in Figure 9a–d.
In the loss domain, β affects how sensitively stakeholders respond to incremental losses. When β ≤ 0.88, perceived losses are smoothed, reducing the psychological burden associated with regulatory costs, coordination costs, and potential penalties, thereby supporting convergence. As β increases, stakeholders become more sensitive to rigid costs and potential losses. In this case, ESCOs may still maintain standardized implementation under sufficient constraints, but the government and ECUs become more likely to adjust their engagement levels in response to perceived cost pressure. Therefore, instability does not necessarily originate from ESCO opportunism alone; it may also arise from the amplified perception of governance and coordination costs among regulatory and demand-side actors.

4.4.4. Impact of Probability Weighting Parameter γ on the Evolutionary Strategies of Stakeholders

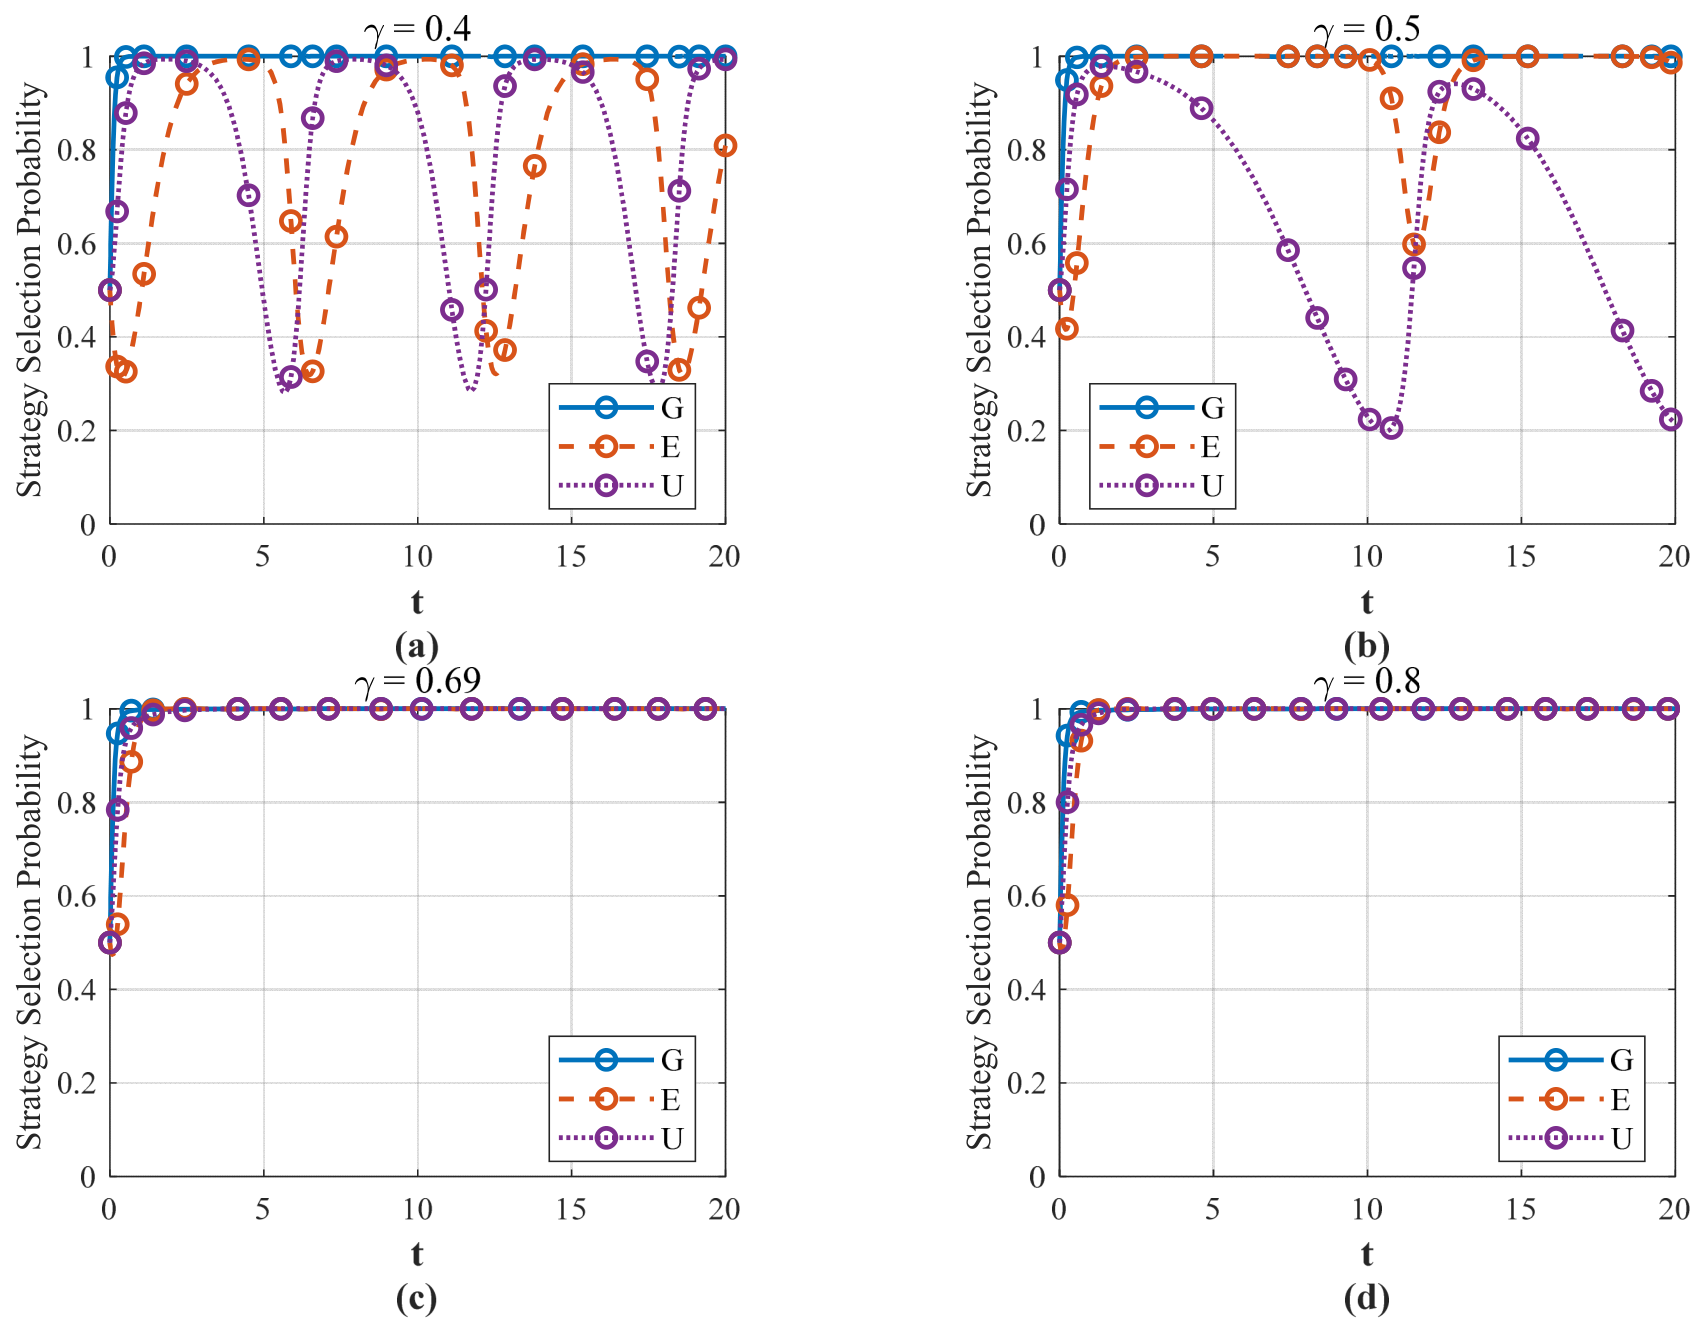
To examine the specific influence of the probability weighting coefficient on decision-making, the coefficient γ is varied. As shown in Figure 10a–d, the system exhibits distinct evolutionary patterns under different levels of γ.
Figure 10a–d shows that as γ gradually decreases from 0.69 to 0.5 and 0.4, the system exhibits a transition from stability to instability. The probability weighting coefficient alters the subjects’ subjective perception of small- or large-probability events. When γ gradually decreases, ESCOs and ECUs significantly weaken their perception of the risks of being inspected and punished, thereby disrupting the original equilibrium state and increasing their tendency toward opportunistic behavior. In contrast, when γ increases from 0.69 to 0.8, the system remains stable. Under the constraint of expected severe punishment, both parties tend to avoid speculative behavior, and the system eventually converges to E8 (1,1,1). This indicates that merely increasing penalty standards and maintaining high-frequency government supervision are insufficient to guarantee policy effectiveness. If market participants have obvious cognitive biases regarding regulatory probability and punishment risk, the implementation effect of incentive and constraint policies may still be weakened even under relatively strong supervision, thereby affecting the healthy development of the EMC market.

4.4.5. Cost-Constrained Governance Scenario Under Probability Weighting Distortion

To further investigate whether routine regulatory frameworks can preserve market stability under fiscal constraints, this section constructs a cost-constrained governance scenario. The preceding analysis has shown that probability weighting γ may distort stakeholders’ perception of inspection and punishment risks. Therefore, this section further examines whether strengthened penalties can maintain regulatory deterrence when the government shifts from active regulation to routine regulation, and whether this conclusion remains stable under the joint influence of probability weighting and loss aversion.
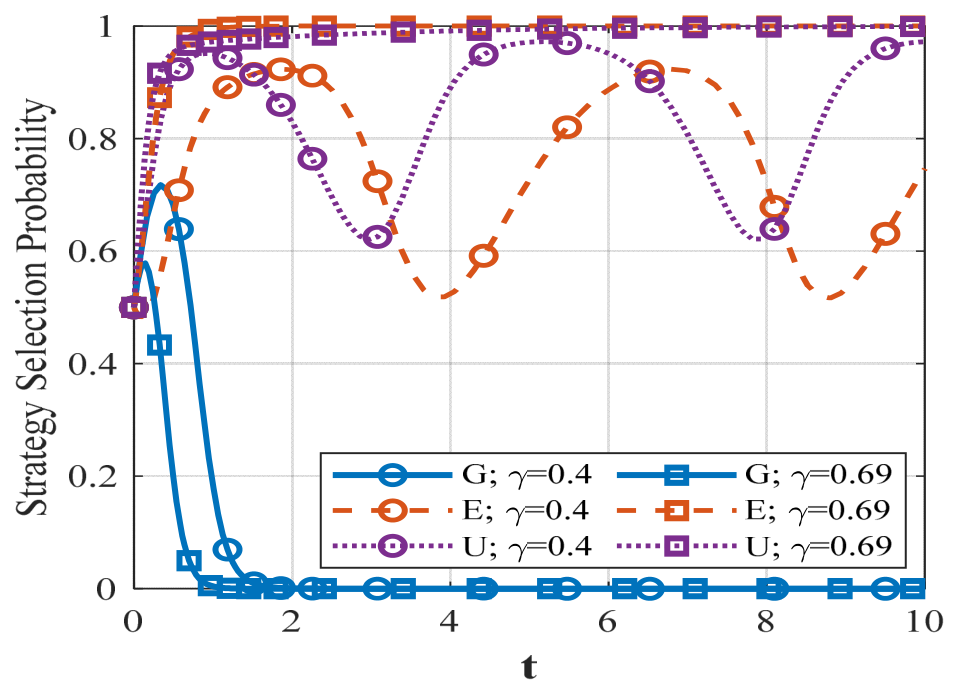
To examine whether routine regulation can preserve market stability under fiscal constraints, this study constructs a cost-constrained governance scenario. When regulatory cost J = 20, the fiscal burden of active regulation becomes unsustainable, and the government shifts toward routine regulation with inspection probability P2 = 0.4. Under this condition, this study examines whether strengthened penalty intensity, with 2T = 20, 2S = 20, can maintain comparable regulatory deterrence while reducing administrative expenditure. Under the baseline parameters, the expected penalty under active regulation is P1 × T=8, equivalent to P2 × 2T = 8 under this scenario, ensuring comparability between the two governance modes.
As shown in Figure 11, when γ is close to the baseline value of 0.69, strengthened penalties can still support convergence toward E7 (0,1,1), a cost-constrained configuration in which the government adopts routine regulation while ESCOs and ECUs maintain compliant and active participation. When γ decreases substantially, agents tend to underestimate medium- and low-probability inspections, weakening the deterrent effect of strengthened penalties and reducing system stability. This result indicates that the nominal equivalence of expected penalties does not necessarily imply behavioral equivalence under prospect theory; the stability of routine regulation depends more on stakeholders’ perceived certainty of enforcement than on the objective expected penalty alone.
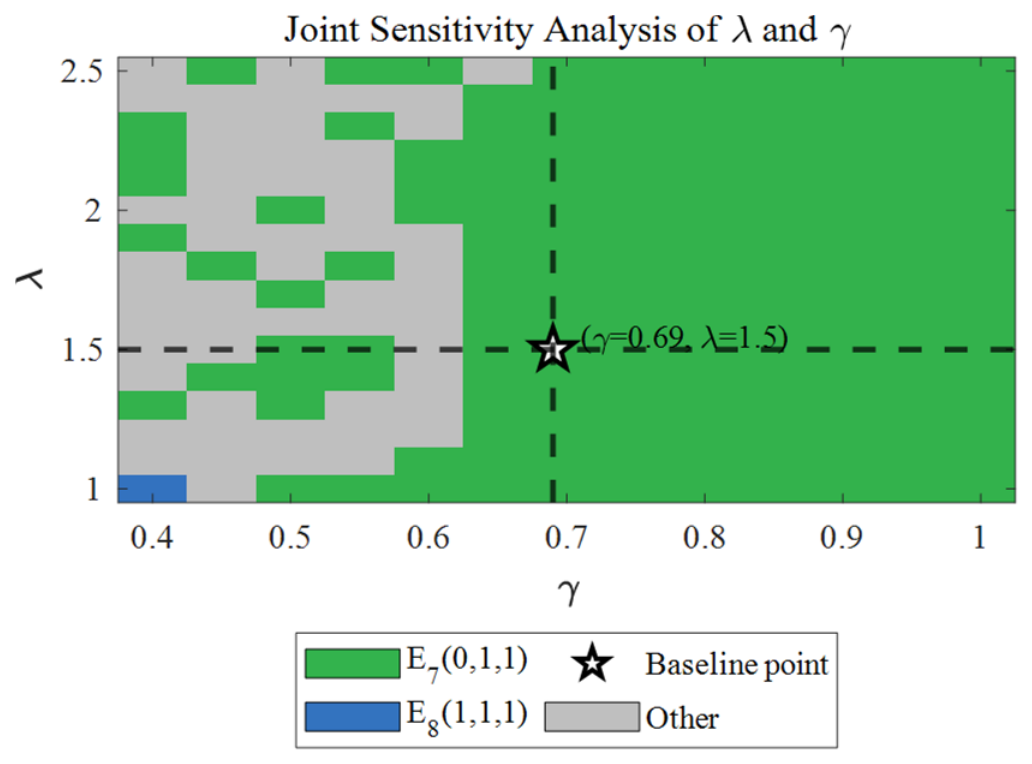
Figure 12 further indicates that the stability of the cost-constrained governance configuration depends on the interaction between probability weighting and loss aversion. When γ is close to or higher than 0.69, the cost-constrained stable region remains continuous across a wide range of λ. In contrast, when γ is relatively low, the stability pattern becomes more fragmented, and variations in λ may shift the system among cost-constrained stability, full participation, and transitional states. Therefore, under fiscal constraints, loss aversion mainly shapes local stability patterns when probability perception is strongly distorted, while the effectiveness of routine regulation depends more on reducing stakeholders’ cognitive distortion of inspection probability and improving the perceived certainty of enforcement.

5. Discussion

This study extends the conventional tripartite evolutionary game analysis of EMC governance by incorporating prospect-theory-based behavioral perceptions into the strategic interactions among governments, ESCOs, and ECUs. Previous studies on EMC and building energy retrofit governance have emphasized the roles of fiscal incentives, liquidated damages, risk sharing, and government regulation in shaping cooperation among market participants [12,14,15,16,17]. These studies provide an important objective-payoff foundation for understanding EMC implementation. The present study complements this stream of research by showing that policy effects are not transmitted only through objective costs and benefits; they are also reshaped by stakeholders’ perceived losses, reference dependence, and subjective weighting of enforcement probabilities. This is consistent with recent prospect-theory evolutionary-game studies in energy-related contexts [18,19].
From the perspective of policy drivers, fiscal incentives can catalyze the initial adoption of the EMC model [12,13], although their marginal effect declines as the subsidy-related fiscal burden increases [4]. During market formation, active regulation plays an important role in establishing cooperation by discouraging opportunistic implementation by ESCOs and passive participation by ECUs [16,38]. However, as regulatory cost J rises, sustaining high-intensity intervention becomes increasingly difficult. The cost-constrained scenario further shows that the government can shift to lower-cost routine regulation while preserving necessary deterrence through strengthened penalties and credible enforcement, thereby sustaining standardized implementation by ESCOs and active participation by ECUs. Active regulation is therefore important during market formation, but maintaining cooperation does not require regulatory intensity to remain unchanged. Long-term EMC governance should balance incentive effectiveness, regulatory credibility, and fiscal affordability.
Beyond positive incentives, the findings support the need for bilateral accountability. A unilateral penalty imposed only on ESCOs can reduce opportunistic behavior on the supply side, but it may also weaken the active participation of ECUs if demand side responsibilities remain unclear. Conversely, constraining ECUs without disciplining ESCO opportunism cannot guarantee service quality. This result is broadly consistent with studies highlighting the importance of balanced risk allocation and contractual discipline in energy performance contracting [12,17]. In practical EMC projects, stable cooperation requires simultaneous constraints on ESCO service quality and ECU participation obligations [38]. Therefore, governance mechanisms should combine ESCO performance guarantees, ECU data-sharing and cooperation duties, third-party measurement and verification (M&V), and credit-based accountability [39].
Furthermore, the integration of prospect-theory parameters shows that stakeholders’ decision-making is significantly shaped by cognitive biases. A higher loss aversion coefficient λ amplifies the perceived burden of fiscal and regulatory costs for the government, making it more likely to shift toward routine regulation when active supervision becomes costly. This result complements multi-agent evolutionary-game evidence showing that government supervision conditions can alter regulatory strategies [40]. A lower gain sensitivity coefficient α weakens the perceived attractiveness of positive incentives, such as subsidies, reputational benefits, and compliance gains, thereby reducing the motivational effect of incentive policies on ESCOs and the government. Meanwhile, a higher loss sensitivity coefficient β may induce defensive adjustments among governance actors facing rigid cost constraints [19]. The probability weighting parameter γ further explains why strengthened penalties may fail to generate effective deterrence when stakeholders underestimate the probability of inspection and enforcement. This finding is consistent with deterrence studies showing that punishment effectiveness depends not only on fine size, but also on uncertainty and perceived enforcement probability [41,42]. Taken together with the Jacobian analysis, these sensitivity results show that E8 (1,1,1) is locally asymptotically stable under the baseline payoff conditions but remains stable only within a bounded parameter range. Moderate incentives, sustainable regulatory costs, balanced bilateral penalties, and credible enforcement support convergence, whereas excessive costs, asymmetric constraints, or strong perceptual distortion generate oscillations.
These findings provide several managerial implications. For governments, the priority should be to transform high-cost supervision into credible and lower-cost institutional governance. Digital M&V platforms, standardized energy-saving verification procedures, public disclosure of project performance, and credit records can reduce regulatory costs while increasing the perceived certainty of enforcement. These measures are also consistent with previous studies emphasizing the importance of legal frameworks, risk allocation, and market transparency in supporting ESCO development and energy performance contracting [14,43,44]. For ESCOs, standardized implementation should be supported through reputation mechanisms, performance guarantee insurance, and contract templates that clarify savings measurement, service quality, and default responsibility. For ECUs, active participation should be institutionalized through data provision obligations, acceptance procedures, and shared responsibility for non-cooperation, so that energy users do not become passive beneficiaries without governance responsibilities.
Based on the above mechanisms, a phased policy roadmap can be proposed. In the short term, policymakers should prioritize low-cost instruments that directly improve perceived enforcement certainty, including digital M&V, information disclosure, project filing, and public credit records. By making inspection activities and non-compliance records more visible, these instruments reduce the likelihood that ESCOs and ECUs treat low-frequency enforcement as negligible, thereby preserving deterrence without continuously increasing inspection intensity [41]. In the medium term, governments should improve bilateral accountability by combining ESCO performance penalties, ECU cooperation obligations, progressive penalties, and third-party verification [45]. In the long term, as market credit systems and professional verification capacity mature, governance can gradually shift from high-intensity administrative intervention toward market-based instruments such as green finance, subsidized credit, risk-compensation funds, and performance guarantee insurance [43,44].
These findings should be interpreted within the institutional context of China’s existing-building EMC market and the prospect-theory-based tripartite evolutionary game setting adopted in this study, in which the government, ESCOs, and ECUs are treated as the core strategic actors. In this context, government incentives, administrative supervision, and carbon-reduction targets play central roles in shaping stakeholder behavior; therefore, the policy implications are most directly relevant to EMC markets embedded in similar policy-driven institutional settings, whereas their application to countries or regions with substantially different contracting, financing, and enforcement systems should be treated with caution.

6. Conclusions

This study aimed to explain how subjective cognitive biases influence the strategic interactions among governments, ESCOs, and ECUs in China’s existing building EMC market. To answer this question, prospect theory was incorporated into a tripartite evolutionary game framework, and numerical simulations were used to examine how policy incentives, regulatory constraints, loss aversion, diminishing sensitivity, and probability weighting affect system evolution. The results show that EMC governance is shaped not only by objective financial payoffs but also by stakeholders’ perceived gains, perceived losses, and subjective assessments of enforcement probability.
The findings indicate that fiscal incentives and regulatory constraints are effective only when they remain within sustainable ranges. Excessive subsidy intensity or regulatory cost may amplify the government’s perceived burden and weaken the persistence of active regulation. Therefore, EMC governance should not rely solely on increasing subsidies or supervision intensity, but should coordinate incentive design, regulatory effectiveness, and fiscal sustainability.
Stable EMC governance also requires bilateral accountability. Punishing only ESCO opportunism or only ECU passivity is insufficient to sustain cooperative market evolution. A more effective governance framework should simultaneously constrain supply-side opportunism and institutionalize demand-side participation responsibilities through performance guarantees, progressive penalties, third-party verification, and contract-based accountability.
At the behavioral level, the effectiveness of policy instruments depends on whether ESCOs and ECUs regard enforcement as credible. The simulation results show that when these actors assign less decision weight to the likelihood of inspection and enforcement, perceived deterrence weakens, making opportunistic implementation by ESCOs and passive participation by ECUs more likely. By making inspection activities, project performance, and the consequences of non-compliance more observable, digital M&V systems, information disclosure, and credit records can strengthen enforcement credibility and discourage these behaviors.
Taken together, these findings provide a behavioral perspective for understanding EMC market governance in China’s policy-driven institutional context. By demonstrating that cognitive bias parameters, rather than financial parameters alone, can influence market equilibrium, this study highlights the need to complement objective cost optimization with attention to stakeholders’ behavioral responses to policy signals. Effective EMC policy should account for the behavioral characteristics of boundedly rational agents, particularly in markets characterized by information asymmetry, long contract cycles, and uncertain returns. As the EMC market continues to develop under China’s carbon neutrality commitments, future governance should strengthen credible disclosure and verification mechanisms to make inspection outcomes and the consequences of non-compliance more visible to ESCOs and ECUs, thereby discouraging opportunistic implementation and passive participation. The government should also establish rapid dispute-resolution and loss-control mechanisms to reduce the implementation and coordination costs borne by market participants, thereby supporting standardized implementation and active participation. By stabilizing standardized implementation by ESCOs and active participation by ECUs, these measures can support a more self-sustaining market order in which the government relies less on high-intensity supervision while maintaining routine enforcement.
This study has several limitations that provide directions for future research. The tripartite framework focuses on governments, ESCOs, and ECUs as the core decision-making actors in EMC governance, while other actors, such as financial institutions, equipment suppliers, and third-party verification bodies, are not explicitly modeled. These actors may influence EMC implementation through financing conditions, technical provision, verification procedures, and risk-control services, and future research could further consider them in an extended multi-agent framework. In addition, the behavioral and payoff parameters are informed mainly by the existing literature, publicly available information, and simulation assumptions rather than direct field estimation. These parameter settings play an important role in the numerical results, which are intended to reveal evolutionary patterns under different scenarios. The current study does not directly incorporate survey, interview, or other qualitative evidence on the actors’ actual preferences. Future studies could combine such evidence with project-level EMC records or experimental methods to estimate stakeholder-specific behavioral parameters and further test model robustness through asynchronous updating, dynamic policy feedback, and prospect theory–expected utility theory (PT–EUT) comparisons. AI-based and data-driven prediction methods may also be integrated to improve parameter calibration and behavioral prediction in EMC governance simulations [46,47]. Future studies may further explore data-driven feature-construction methods, such as the High Correlated Variable Creator Machine (HCVCM) and Stronger Variable Creator Machine (SVCM), for variable construction and predictive modeling [48,49,50].

Author Contributions

Conceptualization, L.L. and M.X.; methodology, L.L. and M.X.; software, M.X.; formal analysis, M.X.; writing—original draft preparation, M.X.; writing—review and editing, L.L. and R.Z.; supervision, L.L. and R.Z.; project administration, L.L.; and funding acquisition, L.L. All authors have read and agreed to the published version of the manuscript.

Funding

This research was funded by the Liaoning Province Social Science Planning Fund, grant number L22BGL042.

Institutional Review Board Statement

Not applicable.

Informed Consent Statement

Not applicable.

Data Availability Statement

Data is contained within the article.

Conflicts of Interest

The authors declare no conflicts of interest.

Appendix A. Explanation of Numerical Parameter Settings

This appendix summarizes the source basis and setting logic of the key numerical parameters used in the simulations. The parameter values are used to construct comparable simulation scenarios and to capture the relative relationships among project returns, implementation costs, subsidies, penalties, regulatory costs, inspection probabilities, and subjective perception parameters under prospect theory. The source basis mainly includes public EMC industry information, policy documents on building energy efficiency and carbon reduction, comparable evolutionary game studies, and prospect-theory-related studies. For readability, the parameters in Appendix A are reported in their base form, while the corresponding perceived values are expressed through V(·) in the model formulation. The detailed explanations are presented in Table A1.
Table A1. Explanation of key numerical parameter settings.
ParameterValueSource Basis and Setting TypeSetting Logic
Re19EMCA public project/industry information; EMC studies [16,35]; baseline settingRe > Ro
Ro18EMCA public information; opportunism studies [16,38]; baseline settingRo close to Re
Ce12EMCA project information; EMC cost studies [16,35]; baseline settingCe > Co
Co4Opportunistic implementation studies [16,38]; baseline settingCo < Ce
Ve3Reputation and long-term cooperation studies [12,16]; baseline settingVe < main project returns
H1Information-asymmetry and moral-hazard studies [16,38]; baseline settingH < T
G8Benefit-sharing and contract-discipline studies [12,38]; baseline settingH < G < Re
Q7EMCA project coordination information; retrofit participation-cost studies [35,38]; baseline settingQ < Ce, but affects ECU participation
M5Building energy-efficiency and subsidy policy/studies [31,35]; policy-informed settingM < T, S
r0.5EMC shared-saving and benefit-sharing logic [12,16]; baseline assumptionNeutral sharing between ESCOs and ECUs
T10; 20Energy-conservation policy and penalty studies [16,31,36]; policy-informedT > M; strengthened T tests deterrence
S10; 20Bilateral accountability and retrofit participation studies [17,35,38]; policy-informed/scenario settingS = T in baseline
P10.8Active-regulation assumptions in evolutionary game studies [16,31]; policy-informed setting P1 > P2
P20.2; 0.4Routine-regulation logic [16,34]; policy-informed/scenario settingP1 > P2
N128Carbon-reduction and green-retrofit context [29,37]; policy-informed settingN1 > N2
N210Routine-regulation and green-retrofit studies [29,37]; policy-informed setting0 < N2 < N1
J8; 20Regulatory-cost and environmental-governance studies [31,36]; baseline/scenario settingJ affects sustainability of active regulation
θ0.2Routine-regulation cost-saving logic [16,34]; model assumptionRoutine regulation uses lower administrative resources
η0.2Reduced-incentive logic under routine regulation [31,35]; model assumptionθ = η for internal consistency
O5Market-order and environmental-governance studies [29,36]; policy-informed settingO represents moderate disorder loss
α0.88Prospect-theory settings [30,33]; behavioral parameterGain-domain sensitivity
β0.88Prospect-theory settings [30,33]; behavioral parameterLoss-domain sensitivity
λ1.5Prospect theory and behavioral simulation studies [30,33]; behavioral parameterModerate loss aversion baseline
γ0.69Prospect-theory probability weighting settings [30,33]; behavioral parameterBaseline probability weighting
The sensitivity and scenario analyses of the main policy and behavioral parameters are reported in the corresponding simulation sections. The manuscript examines variations in incentive intensity, penalty intensity, regulatory cost, loss aversion, diminishing sensitivity, probability weighting, and the cost-constrained governance scenario. Other project-payoff parameters are kept fixed to maintain a clear baseline payoff structure.

References

  1. Wu, Z.; Huang, H.; Chen, X.; Li, J.; He, Q.; Li, A.; Huang, J.; Lin, Y.; Liu, X.; Wang, J. Countermeasures for Low-Carbon Transformation of Construction Industry in China Toward the Carbon Peaking and Carbon Neutrality Goals. Strateg. Stud. CAE 2023, 25, 202–209. (In Chinese) [Google Scholar] [CrossRef]
  2. Peng, Z.; Zhao, S.; Shen, L.; Ma, Y.; Zhang, Q.; Deng, W. Retrofit or Rebuild? The Future of Old Residential Buildings in Urban Areas of China Based on the Analysis of Environmental Benefits. Int. J. Low-Carbon Technol. 2021, 16, 1422–1434. [Google Scholar] [CrossRef]
  3. Han, M.; Liu, J. Tracking Social Hotspots and Public Concerns on Carbon Peaking and Carbon Neutrality in China. J. Clean. Prod. 2024, 485, 144308. [Google Scholar] [CrossRef]
  4. Zhang, T.; Wu, K.; Tan, Y.; Xu, Z. Subsidy or Not? How Much Government Subsidy Can Improve Performance Level of Energy-Saving Service Company? Environ. Sci. Pollut. Res. 2023, 30, 67019–67039. [Google Scholar] [CrossRef] [PubMed]
  5. Jiang, R.; Dong, W.; Bai, L.; Qu, A.; Dong, Y. Which Built Environment Factors Promote Urban Residents’ Climate Change Adaptive Behaviors? Multi-Group Application of an Exploratory Framework via Adaptive Motivations’ Mediation. Sustain. Cities Soc. 2026, 139, 107214. [Google Scholar] [CrossRef]
  6. Feng, J.; Yao, Y.; Liu, Z. Developing an Optimal Building Strategy for Electric Vehicle Charging Stations: Automaker Role. Environ. Dev. Sustain. 2025, 27, 12091–12151. [Google Scholar] [CrossRef]
  7. Li, G.; Luo, J.; Liu, S. Performance Evaluation of Economic Relocation Effect for Environmental Non-Governmental Organizations: Evidence from China. Economics 2024, 18, 20220080. [Google Scholar] [CrossRef]
  8. Su, Y. Design and Application of Public Building EPC Project Operation Model Integrated with Carbon Trading. Constr. Econ. 2021, 42, 106–111. (In Chinese) [Google Scholar]
  9. Polzin, F.; von Flotow, P.; Nolden, C. What Encourages Local Authorities to Engage with Energy Performance Contracting for Retrofitting? Evidence from German Municipalities. Energy Policy 2016, 94, 317–330. [Google Scholar] [CrossRef]
  10. Bertoldi, P.; Boza-Kiss, B. Analysis of Barriers and Drivers for the Development of the ESCO Markets in Europe. Energy Policy 2017, 107, 345–355. [Google Scholar] [CrossRef]
  11. Painuly, J.P.; Park, H.; Lee, M.-K.; Noh, J. Promoting Energy Efficiency Financing and ESCOs in Developing Countries: Mechanisms and Barriers. J. Clean. Prod. 2003, 11, 659–665. [Google Scholar] [CrossRef]
  12. Martiniello, L.; Morea, D.; Paolone, F.; Tiscini, R. Energy Performance Contracting and Public-Private Partnership: How to Share Risks and Balance Benefits. Energies 2020, 13, 3625. [Google Scholar] [CrossRef]
  13. Mohamad Munir, Z.H.; Ahmad Ludin, N.; Junedi, M.M.; Ahmad Affandi, N.A.; Ibrahim, M.A.; Mat Teridi, M.A. A Rational Plan of Energy Performance Contracting in an Educational Building: A Case Study. Sustainability 2023, 15, 1430. [Google Scholar] [CrossRef]
  14. Wacinkiewicz, D.; Słotwiński, S. The Statutory Model of Energy Performance Contracting as a Means of Improving Energy Efficiency in Public Sector Units as Seen in the Example of Polish Legal Policies. Energies 2023, 16, 5060. [Google Scholar] [CrossRef]
  15. Wen, Y.; Huang, X.; Zheng, S.; Yuan, J.; Pu, Y. A Comparative Study on Energy Service Policy Development and Effectiveness in China and United States. Energy Strategy Rev. 2026, 63, 101996. [Google Scholar] [CrossRef]
  16. Zheng, S.; Zhou, Y.; Yuan, J.; Liu, R.; Lyu, P.; Han, Z.; Zhang, C. Understanding Governments, ESCOs, and Clients’ Behavioral Strategies in Public Building Energy-Efficiency Renovation Based on Evolutionary Game Theory. J. Manag. Eng. 2025, 41, 04025018. [Google Scholar] [CrossRef]
  17. Qiao, W.; Guo, H.; Li, W.; Qin, G. Research on Cooperation Development Mechanism of Existing Building Energy Efficiency Renovation Based on Tripartite Evolutionary Game. Build. Sci. 2020, 36, 70–79. (In Chinese) [Google Scholar]
  18. Lin, M.; Liu, S.Q.; Luo, K.; Zhu, L. A Prospect-Theory Evolutionary Game Model to Analyse Cooperation of Long-Term Energy Contracts. Energy 2025, 330, 136855. [Google Scholar] [CrossRef]
  19. Liu, X.; Wang, Q.; Li, Z.; Jiang, S. An Evolutionary Game Analysis of Decision-Making and Interaction Mechanisms of Chinese Energy Enterprises, the Public, and the Government in Low-Carbon Development Based on Prospect Theory. Energies 2025, 18, 2041. [Google Scholar] [CrossRef]
  20. Töppel, J.; Tränkler, T. Modeling Energy Efficiency Insurances and Energy Performance Contracts for a Quantitative Comparison of Risk Mitigation Potential. Energy Econ. 2019, 80, 842–859. [Google Scholar] [CrossRef]
  21. Qiao, X.; Fan, X.; Sun, J.; Li, Y.; Zhao, Y. Intergovernmental Cooperation in Zero-Waste City Development in China: An Evolutionary Game Analysis under Prospect Theory. Sustainability 2026, 18, 2636. [Google Scholar] [CrossRef]
  22. Hu, J.; Wang, T. Strategies of Participants in the Carbon Trading Market-an Analysis Based on the Evolutionary Game. Sustainability 2023, 15, 10807. [Google Scholar] [CrossRef]
  23. Ruan, H.; Gao, X.; Mao, C. Empirical Study on Annual Energy-Saving Performance of Energy Performance Contracting in China. Sustainability 2018, 10, 1666. [Google Scholar] [CrossRef]
  24. Yuan, H.; Gao, X.; Yang, C.; Zhang, X. Status, Problems and Solutions of Energy Management Contract in China. Electr. Power Technol. 2011, 23, 58–61. (In Chinese) [Google Scholar]
  25. Sarkar, A.; Singh, J. Financing Energy Efficiency in Developing Countries—Lessons Learned and Remaining Challenges. Energy Policy 2010, 38, 5560–5571. [Google Scholar] [CrossRef]
  26. Roshchanka, V.; Evans, M. Scaling up the Energy Service Company Business: Market Status and Company Feedback in the Russian Federation. J. Clean. Prod. 2016, 112, 3905–3914. [Google Scholar] [CrossRef]
  27. Hannon, M.J.; Bolton, R. UK Local Authority Engagement with the Energy Service Company (ESCo) Model: Key Characteristics, Benefits, Limitations and Considerations. Energy Policy 2015, 78, 198–212. [Google Scholar] [CrossRef]
  28. Chen, Z.; Xia, L.; Su, Y.; Chen, G.; Zhang, Z. Research on the Evolutionary Game of Safety Behavior of EPC Consortium Members Based on Prospect Theory. J. Asian Archit. Build. Eng. 2025, 24, 1606–1624. [Google Scholar] [CrossRef]
  29. Duan, J.; Wang, Y.; Zhang, Y.; Chen, L. Strategic Interaction among Stakeholders on Low-Carbon Buildings: A Tripartite Evolutionary Game Based on Prospect Theory. Environ. Sci. Pollut. Res. 2024, 31, 11096–11114. [Google Scholar] [CrossRef] [PubMed]
  30. Tversky, A.; Kahneman, D. Judgment under Uncertainty: Heuristics and Biases: Biases in Judgments Reveal Some Heuristics of Thinking under Uncertainty. Science 1974, 185, 1124–1131. [Google Scholar] [CrossRef] [PubMed]
  31. Yang, X.; Zhang, J.; Shen, G.Q.; Yan, Y. Incentives for Green Retrofits: An Evolutionary Game Analysis on Public-Private-Partnership Reconstruction of Buildings. J. Clean. Prod. 2019, 232, 1076–1092. [Google Scholar] [CrossRef]
  32. Zhao, R.; Peng, L.; Zhao, Y.; Feng, Y. Coevolution Mechanisms of Stakeholder Strategies in the Green Building Technologies Innovation Ecosystem: An Evolutionary Game Theory Perspective. Environ. Impact Assess. Rev. 2024, 105, 107418. [Google Scholar] [CrossRef]
  33. Hu, X.; Wang, R.; Wei, Y.; Lin, H.; Gui, X. Evolutionary Game Analysis of the Longitudinal Integration of Electronic Health Record Based on Prospect Theory. Sci. Rep. 2025, 15, 20583. [Google Scholar] [CrossRef] [PubMed]
  34. Su, Y. Multi-Agent Evolutionary Game in the Recycling Utilization of Construction Waste. Sci. Total Environ. 2020, 738, 139826. [Google Scholar] [CrossRef] [PubMed]
  35. Liu, F.; Xu, G. Incentive Mechanism and Scenario Simulation of Residential Energy-Efficiency Retrofits—From the Perspective of Tripartite Evolutionary Game. Energy Build. 2024, 320, 114653. [Google Scholar] [CrossRef]
  36. Fan, W.; Wang, S.; Gu, X.; Zhou, Z.; Zhao, Y.; Huo, W. Evolutionary Game Analysis on Industrial Pollution Control of Local Government in China. J. Environ. Manag. 2021, 298, 113499. [Google Scholar] [CrossRef] [PubMed]
  37. Wang, S.-Y.; Lee, K.-T.; Kim, J.-H. Green Retrofitting Simulation for Sustainable Commercial Buildings in China Using a Proposed Multi-Agent Evolutionary Game. Sustainability 2022, 14, 7671. [Google Scholar] [CrossRef]
  38. Qin, Z.; Wang, J.; Ji, C. Evolutionary Game Study on the Supervision Strategy in the Operation Phase of Green Public Buildings Based on System Dynamics Simulation. J. Phys. Conf. Ser. 2022, 2301, 012004. [Google Scholar] [CrossRef]
  39. Zhang, W.; Wang, Z.; Yuan, H.; Xu, P. Investigating the Inferior Manufacturer’s Cooperation with a Third Party under the Energy Performance Contracting Mechanism. J. Clean. Prod. 2020, 272, 122530. [Google Scholar] [CrossRef]
  40. Chen, J.; Zhang, L.; Deng, G. Research on the Multi-Agent Evolutionary Game Behavior of Joint Operation between Coal Power Enterprises and New Energy Power Enterprises under Government Supervision. Energies 2024, 17, 4553. [Google Scholar] [CrossRef]
  41. Feess, E.; Schildberg-Hoerisch, H.; Schramm, M.; Wohlschlegel, A. The Impact of Fine Size and Uncertainty on Punishment and Deterrence: Theory and Evidence from the Laboratory. J. Econ. Behav. Organ. 2018, 149, 58–73. [Google Scholar] [CrossRef]
  42. Soerenson, K. Prospects of Deterrence: Deterrence Theory, Representation and Evidence. Def. Peace Econ. 2024, 35, 145–159. [Google Scholar] [CrossRef]
  43. Wang, L.; Peng, J.; Wang, J. A Multi-Criteria Decision-Making Framework for Risk Ranking of Energy Performance Contracting Project under Picture Fuzzy Environment. J. Clean. Prod. 2018, 191, 105–118. [Google Scholar] [CrossRef]
  44. Cebekhulu, B.M.B.; Mathaba, T.N.D.; Mbohwa, C. Identifying Trends and Research Gaps in ESCO Research: A Systematic Literature Review. Energy Strategy Rev. 2024, 55, 101516. [Google Scholar] [CrossRef]
  45. Yuan, L.; He, W.; Wu, X.; Kong, Y.; Yang, Y.; Ramsey, T.S.; Degefu, D.M. Allocating Water Resources in Transboundary River Basins: A Sequential Rubinstein Bargaining Approach with Risk Discounting. J. Hydrol. Reg. Stud. 2026, 63, 102989. [Google Scholar] [CrossRef]
  46. Salem, K.M.; Rey-Hernández, J.M.; Rey-Martínez, F.J.; Elgharib, A.O. Assessing the Accuracy of AI Approaches for CO2 Emission Predictions in Buildings. J. Clean. Prod. 2025, 513, 145692. [Google Scholar] [CrossRef]
  47. Salem, K.M.; Rey-Martínez, F.J.; Elgharib, A.O.; Rey-Hernández, J.M. Decarbonizing the Built Environment: An AI-Powered Framework for Predictive Energy Planning. Earth Syst. Environ. 2026. [Google Scholar] [CrossRef]
  48. Shishegaran, A.; Saeedi, M.; Mirvalad, S.; Korayem, A.H. Computational Predictions for Estimating the Performance of Flexural and Compressive Strength of Epoxy Resin-Based Artificial Stones. Eng. Comput. 2023, 39, 347–372. [Google Scholar] [CrossRef]
  49. Shishegaran, A.; Varaee, H.; Rabczuk, T.; Shishegaran, G. High Correlated Variables Creator Machine: Prediction of the Compressive Strength of Concrete. Comput. Struct. 2021, 247, 106479. [Google Scholar] [CrossRef]
  50. Shishegaran, A.; Varaee, H. Comparison among Creator Variable Machine Methods: Compressive Strength Prediction of Ultra-High-Performance Concrete. Case Stud. Constr. Mater. 2026, 25, e06253. [Google Scholar] [CrossRef]
Figure 1. Tripartite Interaction Framework Analysis.
Sustainability 18 08058 g001
Figure 2. System evolution path diagram. Colored curves represent trajectories from different initial strategy combinations.
Sustainability 18 08058 g002
Figure 3. Impact of Incentive Intensity Coefficient M on Stakeholders. (a) M = 5; (b) M = 10; (c) M = 15; (d) M = 20.
Sustainability 18 08058 g003
Figure 4. Impact of Penalty Intensity Coefficient T on Stakeholders. (a) T = 0; (b) T = 5; (c) T = 10; (d) T = 20.
Sustainability 18 08058 g004
Figure 5. Impact of Penalty Intensity Coefficient S on Stakeholders. (a) S = 0; (b) S = 5; (c) S = 10; (d) S = 20.
Sustainability 18 08058 g005
Figure 6. Impact of Regulatory Cost J on the Evolutionary Strategies of Stakeholders. (a) J = 5; (b) J = 10; (c) J = 15; (d) J = 20.
Sustainability 18 08058 g006
Figure 7. Evolution of Stakeholders’ Strategies under Different Loss Aversion Coefficients λ. (a) λ = 1.5; (b) λ = 1.75; (c) λ = 2; (d) λ = 2.25.
Sustainability 18 08058 g007
Figure 8. Effects of Value Function Parameter α on System Evolution. (a) α = 0.4; (b) α = 0.6; (c) α = 0.88; (d) α = 1.
Sustainability 18 08058 g008aSustainability 18 08058 g008b
Figure 9. Effects of Value Function Parameter β on System Evolution. (a) β = 0.4; (b) β = 0.6; (c) β = 0.88; (d) β = 1.
Sustainability 18 08058 g009
Figure 10. Evolution of Stakeholders’ Strategies under Different Probability Weighting Parameters γ. (a) γ = 0.4; (b) γ = 0.5; (c) γ = 0.69; (d) γ = 0.8.
Sustainability 18 08058 g010
Figure 11. System evolution under the cost-constrained governance scenario with varying γ.
Sustainability 18 08058 g011
Figure 12. Joint sensitivity analysis of γ and λ under the cost-constrained governance scenario.
Sustainability 18 08058 g012
Table 1. Strategy Combination Matrix for Government and ESCO.
Government\ESCOStandardized Implementation (y)Opportunism (1 − y)
Active Regulation (x)Standard Implementation
Active Regulation
Opportunism
Active Regulation
Routine Regulation
(1 − x)
Standard Implementation
Routine Regulation
Opportunism
Routine Regulation
Table 2. Strategy Combination Matrix for Government and ECU.
Government\ECUActive Participation (z)Passive Participation (1 − z)
Active Regulation (x)Active Participation
Active Regulation
Passive Participation
Active Regulation
Routine Regulation (1 − x)Active Participation
Routine Regulation
Passive Participation
Routine Regulation
Table 3. Strategy Combination Matrix for ESCO and ECU.
ESCO\ECUActive Participation (z)Passive Participation (1 − z)
Standardized
Implementation (y)
Active Participation
Standardized Implementation
Passive Participation
Standardized Implementation
Opportunism (1 − y)Active Participation
Opportunism
Passive Participation
Opportunism
Table 4. Parameter Assumptions and Their Meanings in the Tripartite Game Model.
ParameterDescription
V(N1)Macro-social benefits obtained under active government intervention
V(N2)Macro-social benefits obtained under routine government intervention
V(−O)Administrative credibility loss and environmental remediation costs under routine regulation
V(−M)Integrated value of fiscal subsidies, tax incentives, and policy support
η η ( 0 , 1 ) reflecting the diminishing marginal effect of fiscal expenditure
V(−J)Costs required for the government to implement intervention policies
θ θ ( 0 , 1 ) Reflecting the conservation of administrative resources under routine status
P1Probability of the government actively supervising and investigating non-compliant behaviors
P2Probability of the government routine supervising and investigating non-compliant behaviors
V(T)Government penalty on ESCOs for fraud and opportunism
V(S)Joint government penalty on ECUs for failing to meet carbon emission standards
r Allocation proportion obtained by the ESCO from the total incentive
V(Re)Normal returns for the ESCO from standard implementation of energy-saving renovations
V(−Ce)Real engineering and O&M investment costs required for the ESCO’s standard implementation
V(Ve)Potential brand premium brought by standard implementation
V(Ro)Returns brought by the ESCO’s opportunistic behavior
V(−Co)Implementation costs when the ESCO adopts opportunistic behavior
V(−H)Costs incurred by the ESCO for the theft of energy savings.
V(G)Energy-saving gains misappropriated from the ECU through moral hazard
V(K1)Returns obtained by the ECU under standardized ESCO implementation
V(K2)Returns obtained by the ECU under opportunistic ESCO implementation
V(−Q)Coordination, cooperation, and supervision costs paid by the ECU for implementing EMC projects
αSensitivity parameter to gains in the value function
βSensitivity parameter to losses in the value function
λLoss aversion coefficient
γProbability weighting parameter.
Table 5. Perceived Payoff Matrix for the Tripartite Game among Government, ESCO, and ECU.
UG
x 1 − x
E y z V ( N 1 ) + V ( M ) + V ( J ) V ( N 2 ) + V ( η M ) + V ( θ J )
V ( R e ) + V ( r M ) + V ( V e ) + V ( C e ) V ( R e ) + V ( r η M ) + V ( V e ) + V ( C e )
V ( K 1 ) + V ( ( 1 r ) M ) + V ( Q ) V ( K 1 ) + V ( ( 1 r ) η M ) + V ( Q )
1 z V ( N 1 ) + V ( P 1 S ) + V ( r M ) + V ( J ) V ( N 2 ) + V ( O ) + V ( P 2 S ) + V ( η r M ) + V ( θ J )
V ( R e ) + V ( r M ) + V ( C e ) V ( R e ) + V ( r η M ) + V ( C e )
V ( P 1 S ) + V ( K 1 ) V ( P 2 S ) + V ( K 1 )
1 y z V ( N 1 ) + V ( P 1 T ) + V ( ( 1 r ) M ) + V ( J ) V ( N 2 ) + V ( P 2 T ) + V ( O ) + V ( ( 1 r ) η M ) + V ( θ J )
V ( R o ) + V ( C o ) + V ( P 1 T ) + V ( H ) V ( R o ) + V ( C o ) + V ( P 2 T ) + V ( H )
V ( K 2 ) + V ( ( 1 r ) M ) + V ( Q ) V ( K 2 ) + V ( ( 1 r ) η M ) + V ( Q )
1 z V ( N 1 ) + V ( P 1 ( S + T ) ) + V ( J ) V ( N 2 ) + V ( O ) + V ( P 2 ( S + T ) ) + V ( θ J )
V ( R o ) + V ( C o ) + V ( P 1 T ) + V ( H ) + V ( G ) V ( R o ) + V ( C o ) + V ( P 2 T ) + V ( H ) + V ( G )
V ( P 1 S ) + V ( K 2 ) + V ( G ) V ( P 2 S ) + V ( K 2 ) + V ( G )
Table 6. The eigenvalues of the Jacobian matrix corresponding to each equilibrium point.
Equilibrium PointμkEigenvalue Expressions
E 1 ( 0 , 0 , 0 ) μ1 V ( N 1 ) V ( N 2 ) + V ( J ) V ( θ J ) V ( O ) + V ( P 1 ( S + T ) ) V ( P 2 ( S + T ) )
μ2 V ( R e ) V ( R o ) + V ( C e ) V ( C o ) V ( H ) V ( G ) + V ( r η M ) V ( P 2 T )
μ3 V ( ( 1 r ) η M ) V ( G ) + V ( Q ) V ( P 2 S )
E 2 ( 1 , 0 , 0 ) μ1 V N 2 V N 1 V J + V θ J + V O V P 1 S + T + V P 2 S + T
μ2 V R e V R o + V C e V C o V H V G + V r M V P 1 T
μ3 V 1 r M V G + V Q V P 1 S
E 3 ( 0 , 1 , 0 ) μ1 V N 1 V N 2 + V P 1 S V P 2 S + V J V O + V r M V θ J V r η M
μ2 V G V R e + V R o + V H V C e + V C o + V P 2 T V r η M
μ3 V 1 r η M + V Q V P 2 S
E 4 ( 0 , 0 , 1 ) μ1 V N 1 V N 2 + V P 1 T V P 2 T + V J V O + V 1 r M V θ J V 1 r η M
μ2 V R e V R o + V V e V H + V C e V C o V P 2 T + V r η M
μ3 V G V 1 r η M V Q + V P 2 S
E 5 ( 1 , 1 , 0 ) μ1 V N 2 V N 1 V P 1 S + V P 2 S V J + V O V r M + V θ J + V r η M
μ2 V G V R e + V R o + V H V C e + V C o + V P 1 T V r M
μ3 V 1 r M + V Q V P 1 S
E 6 ( 1 , 0 , 1 ) μ1 V N 2 V N 1 V P 1 T + V P 2 T V J + V O V 1 r M + V θ J + V 1 r η M
μ2 V R e V R o + V V e V H + V C e V C o V P 1 T + V r M
μ3 V G V 1 r M V Q + V P 1 S
E 7 ( 0 , 1 , 1 ) μ1 V N 1 V N 2 + V J + V M V η M V θ J
μ2 V R o V R e V V e + V H V C e + V C o + V P 2 T V r η M
μ3 V P 2 S V Q V 1 r η M
E 8 ( 1 , 1 , 1 ) μ1 V N 2 V N 1 V J V M + V η M + V θ J
μ2 V R o V R e V V e + V H V C e + V C o + V P 1 T V r M
μ3 V P 1 S V Q V 1 r M
Table 7. Equilibrium Point Stability Analysis.
Equilibrium PointSign of EigenvaluesStability Conclusion
E1 (0,0,0)(+,−,* 1)saddle point
E2 (1,0,0)(−,+,+)saddle point
E3 (0,1,0)(+,+,−)saddle point
E4 (0,0,1)(+,*,+)unstable point
E5 (1,1,0)(−,−,+)saddle point
E6 (1,0,1)(−,+,−)saddle point
E7 (0,1,1)(+,−,−)saddle point
E8 (1,1,1)(−,−,−)ESS
1 “*” indicates that the eigenvalue sign depends on parameter values.
Disclaimer/Publisher’s Note: The statements, opinions and data contained in all publications are solely those of the individual author(s) and contributor(s) and not of MDPI and/or the editor(s). MDPI and/or the editor(s) disclaim responsibility for any injury to people or property resulting from any ideas, methods, instructions or products referred to in the content.