1. Introduction
Copper is essential for electrical infrastructure, sustainable-energy systems, transport, electronics, and data networks. Continued electrification is increasing demand for refined copper, while declining ore grades and the environmental burdens of mining strengthen the case for recovering copper from secondary resources [
1,
2,
3].
End-of-life electrical cables are particularly attractive secondary resources because the metallic core is physically protected by polymer insulation and can often be recovered at high purity. Available cable-recycling routes include stripping, shredding and gravity or air separation, electrostatic separation, cryogenic treatment, pyrolysis, and hydrometallurgical or electrochemical recovery. Reviews consistently identify mechanical separation as a comparatively simple and scalable route for high-grade cable scrap, although energy use, dust, noise, feed heterogeneity, and management of polymer fractions remain important design constraints [
4,
5,
6,
7].
Published environmental assessments demonstrate that secondary copper generally has a lower climate impact than primary copper, but the reported values vary widely because of differences in feed quality, transport, electricity mix, metallurgical route, allocation, and system boundary. A review of cradle-to-gate studies reported approximately 1.1–8.5 kg CO
2-eq/kg Cu for primary copper and 0.2–1.9 kg CO
2-eq/kg Cu for secondary copper [
8,
9,
10]. This variability makes transparent system boundaries and plant-specific activity data essential.
Despite the practical importance of mechanical cable processing, few transparent plant-scale reports document operational indicators before and after a technology replacement using explicit system boundaries and functional units. Such records are valuable for sustainability-related benchmarking, but a non-replicated comparison cannot distinguish differences associated with the line configuration from changes in feedstock, weather, workforce, maintenance, or production scheduling.
Accordingly, this study was designed as a descriptive industrial case report. The research question was: What differences in throughput, product quality, specific electricity consumption, electricity-related CO2 emissions, labour demand, and unit operating cost were observed between the complete operating records for the former line in June 2022 and the new line in June 2024? No confirmatory hypothesis was tested because one aggregate month per configuration does not permit valid statistical inference.
The contribution of the study is a transparent, data-rich plant-scale benchmark with explicit functional units, calculation formulas, emission-factor selection, boundary exclusions, and a scenario analysis for the copper content of the input material. The reported contrasts are descriptive observations from two non-contemporaneous months and are not interpreted as a causal estimate of the effect of the new technology.
2. Materials and Methods
2.1. Study Design and Data Sources
This study is a retrospective, observational, non-replicated descriptive industrial case report. The former line is represented by the complete line-level dataset for June 2022 and the new line by the corresponding dataset for June 2024. The observations are not contemporaneous, randomized, or replicated; therefore, the dataset contains one aggregate observation per configuration (n = 1) and cannot identify a causal technology effect. Potential temporal and operational confounders include feed composition, ambient temperature and humidity, operator experience, maintenance status, downtime, production scheduling, and the distribution of operating days.
Primary activity data were obtained from company production records, electricity-metre records, operating logs, cost records, and laboratory analyses of copper granulate. The principal variables were processed cable mass, measured electricity consumption, observed throughput, nominal capacity, recovery efficiency, copper content, product purity, number of operators, and reported unit operating cost. The organization of data collection and audit records was informed by the general principles of EN 16247-1 [
11].
2.2. Case Company and Technology
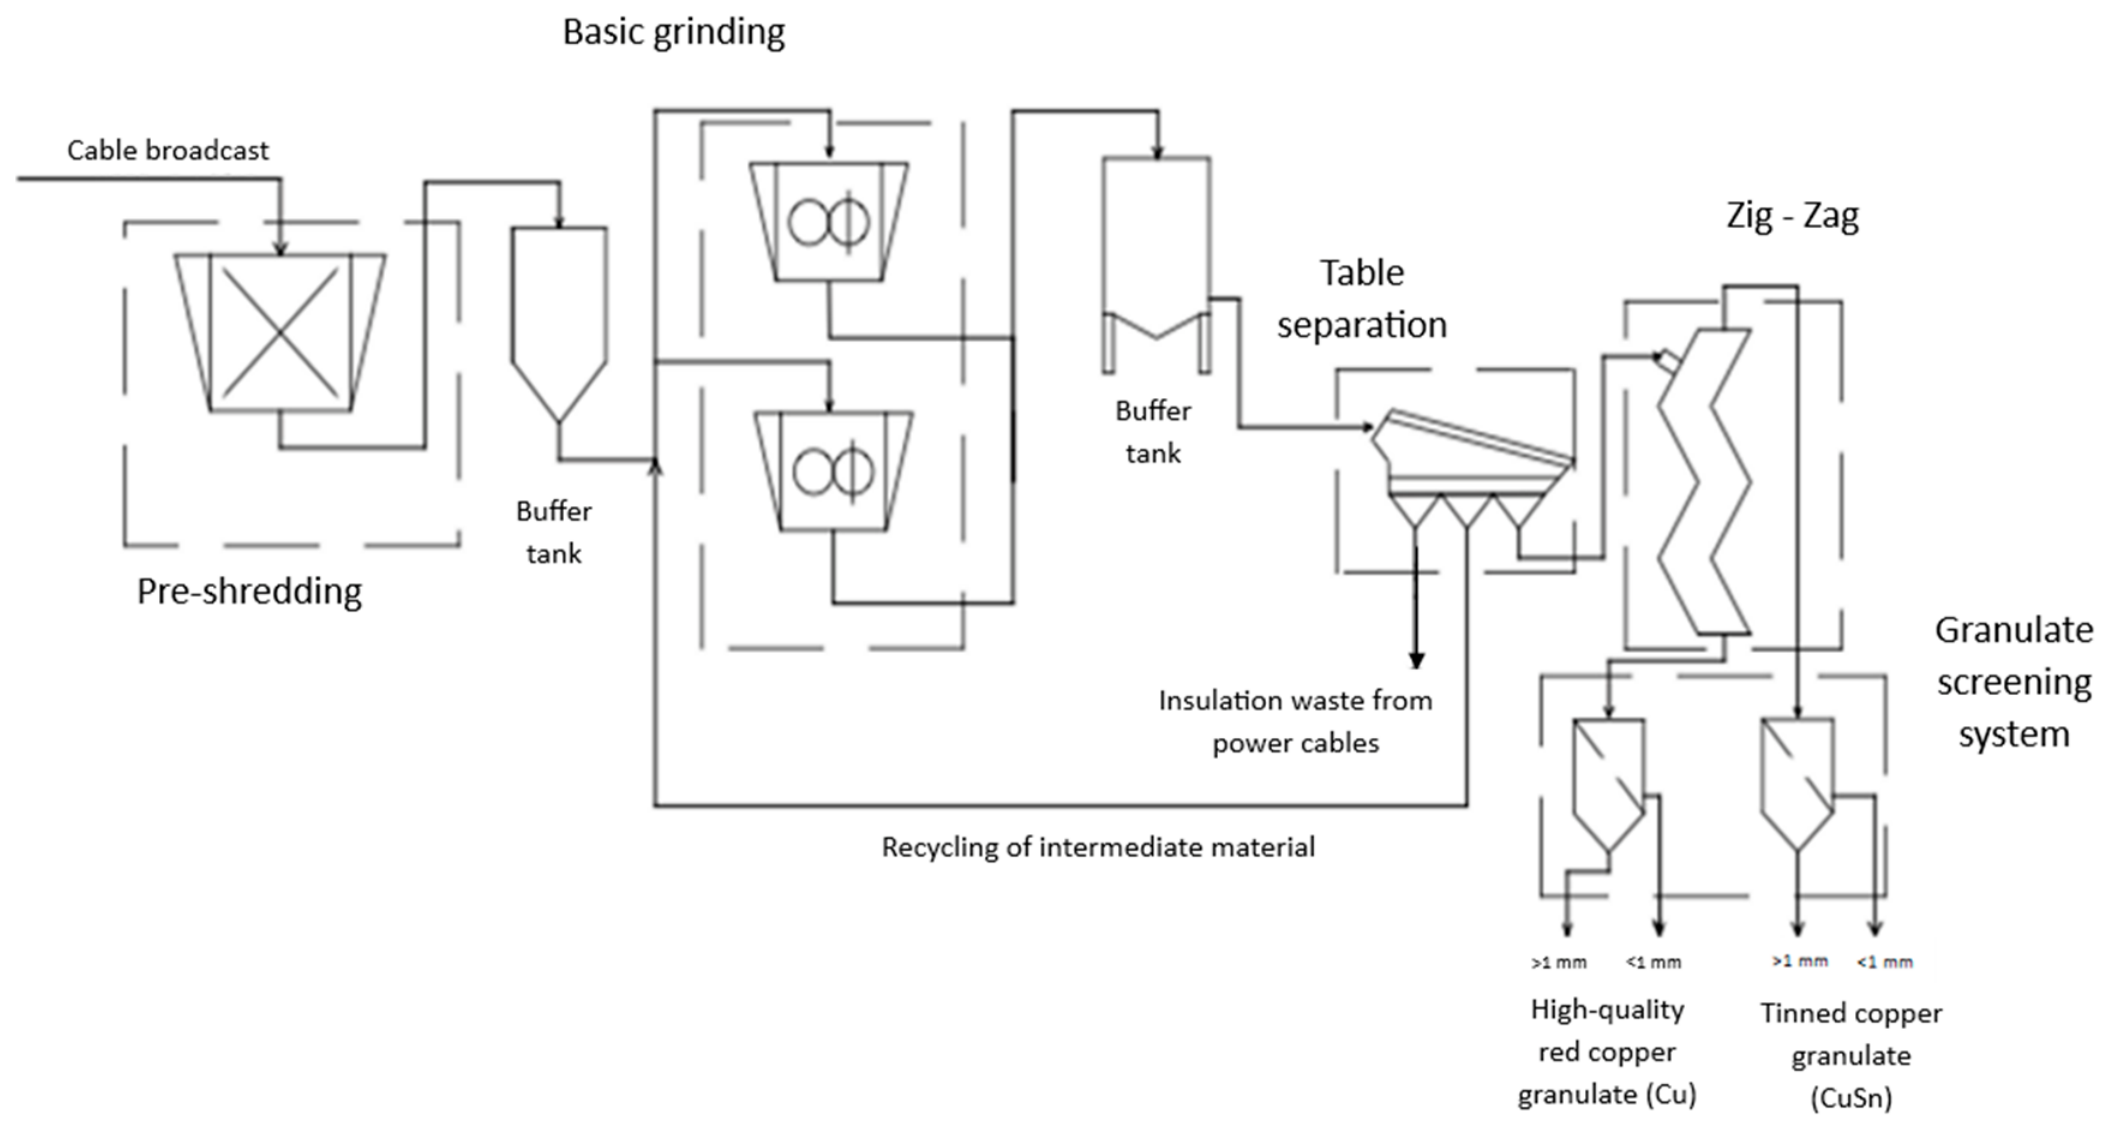
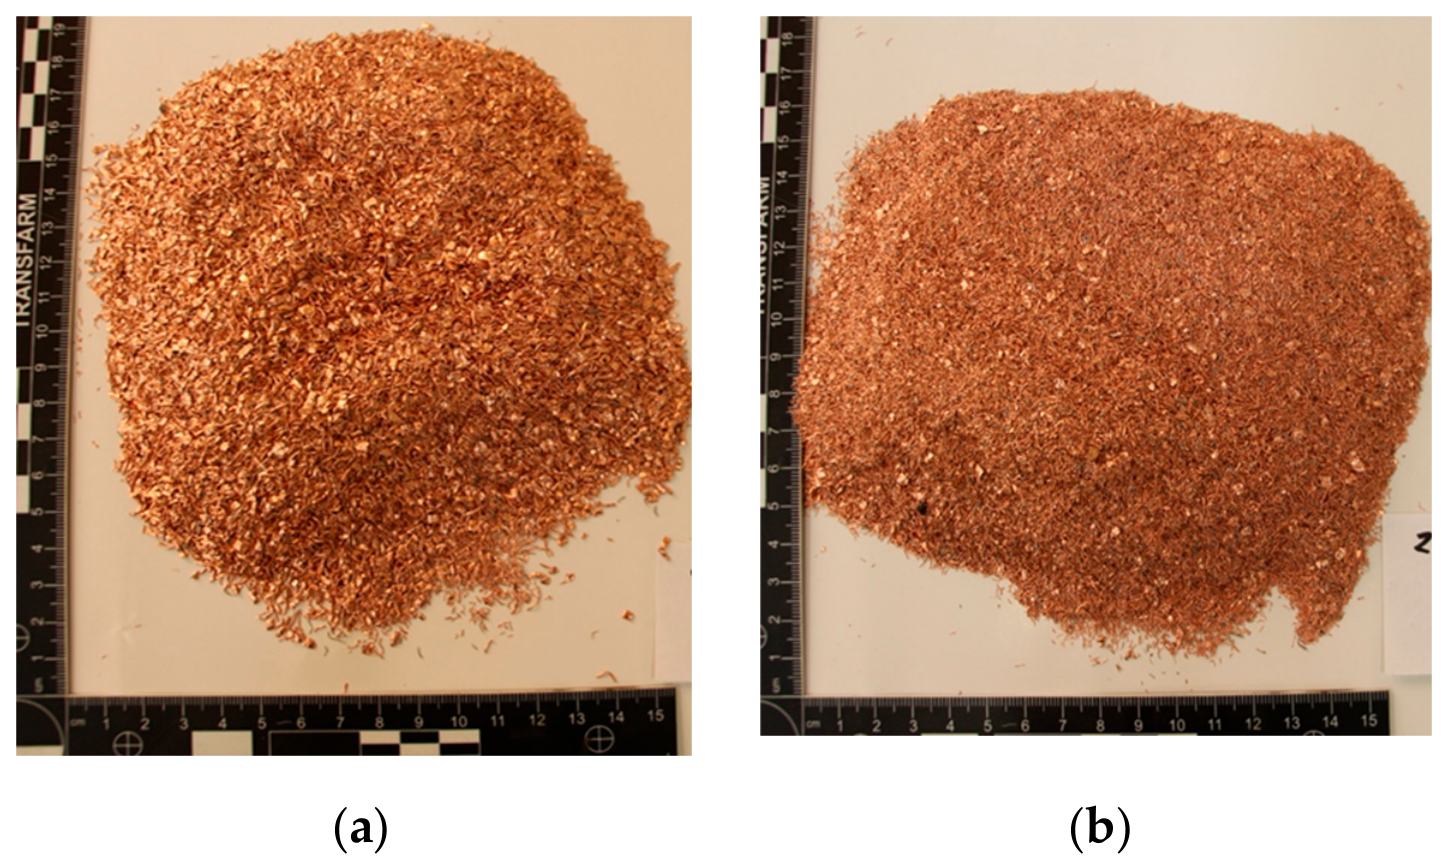
MERCURY HM Sp. z o.o. sp. k. (Bielsko-Biała, Poland) operates in the non-ferrous metal recycling sector and processes electrical cable scrap by mechanical separation. The former line combined pre-shredding, granulation, and separation in spatially separated operations, which required intermediate handling and produced a mixed copper granulate containing approximately 95–97% Cu (
Figure 1).
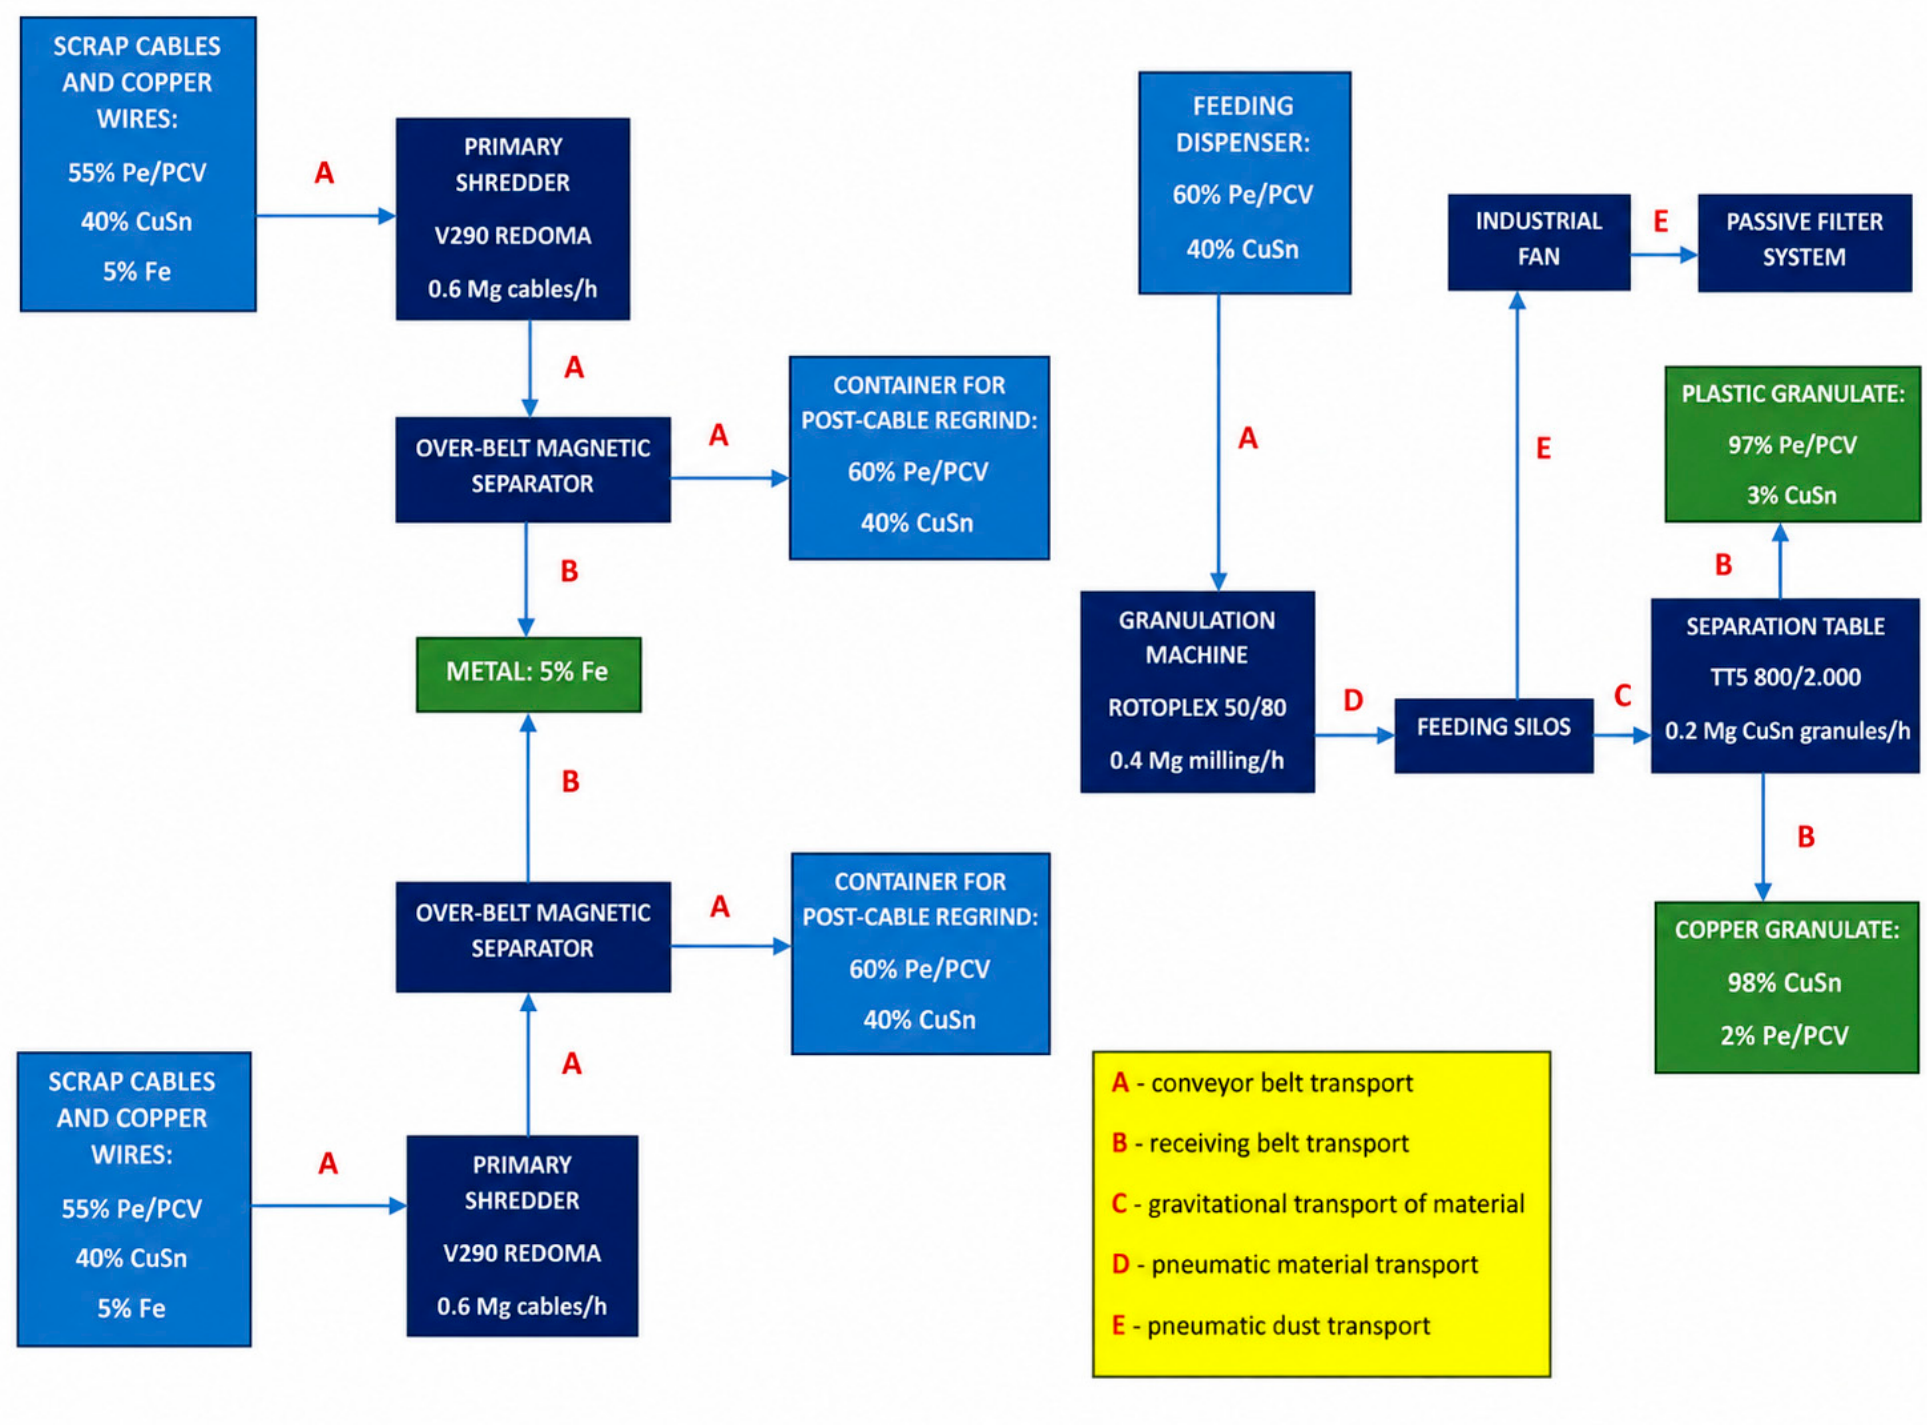
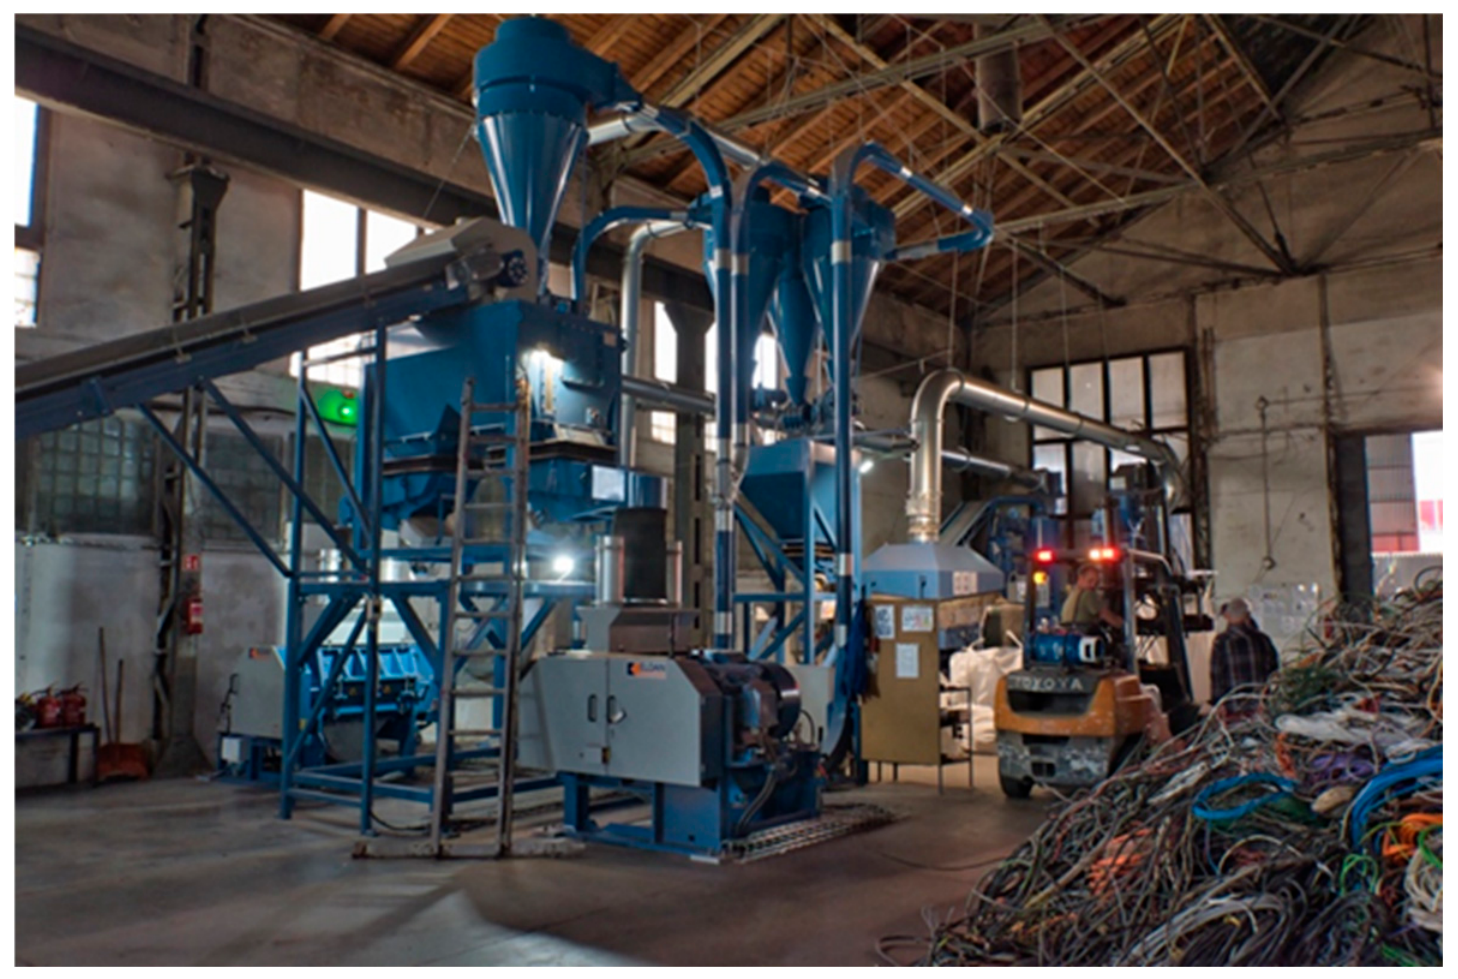
The new line was commissioned in 2024 following the research and development project “Development of an innovative technology for the separation of recycled copper cable granulates into pure copper (Cu) and tin-coated copper (CuSn) using hybrid mechanical separation methods” (POIR.01.01.01-00-0216/21). It integrates pre-shredding, magnetic separation, granulation, air-vibrating separation, pneumatic and belt transport, and a zig-zag classifier (
Figure 2).
The new line produces three material streams: high-purity red-copper granulate, tin-coated copper granulate, and polymer granulate from cable insulation. Four laboratory samples of the red-copper product were analyzed for elemental composition; the Cu results ranged from 99.29% to 99.71% (
Table 1 and
Figure 3).
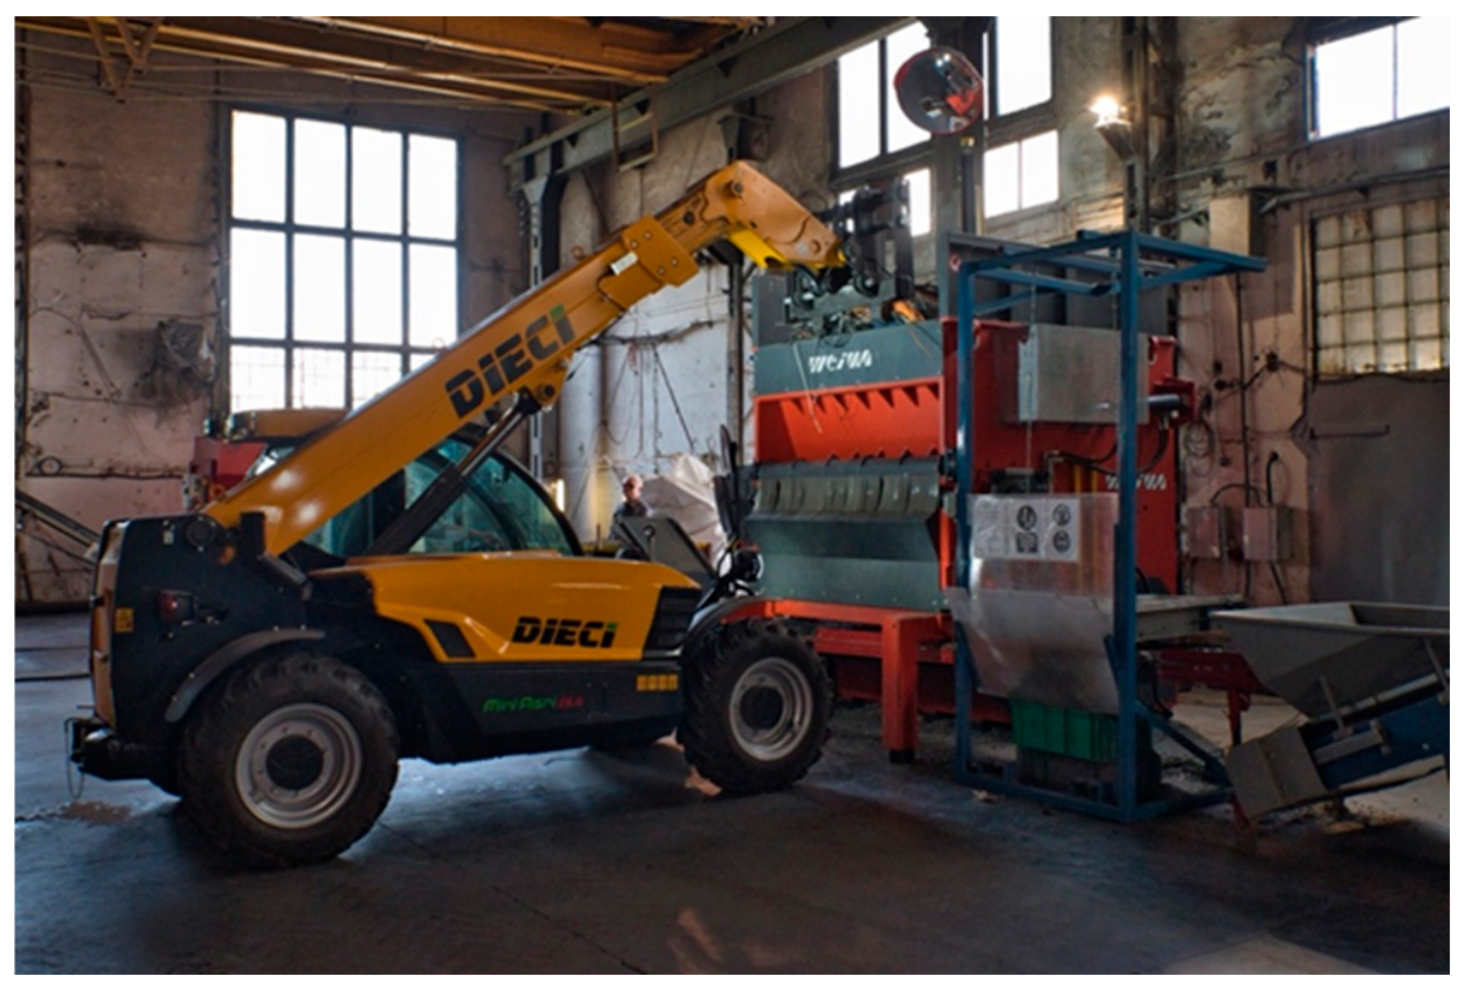
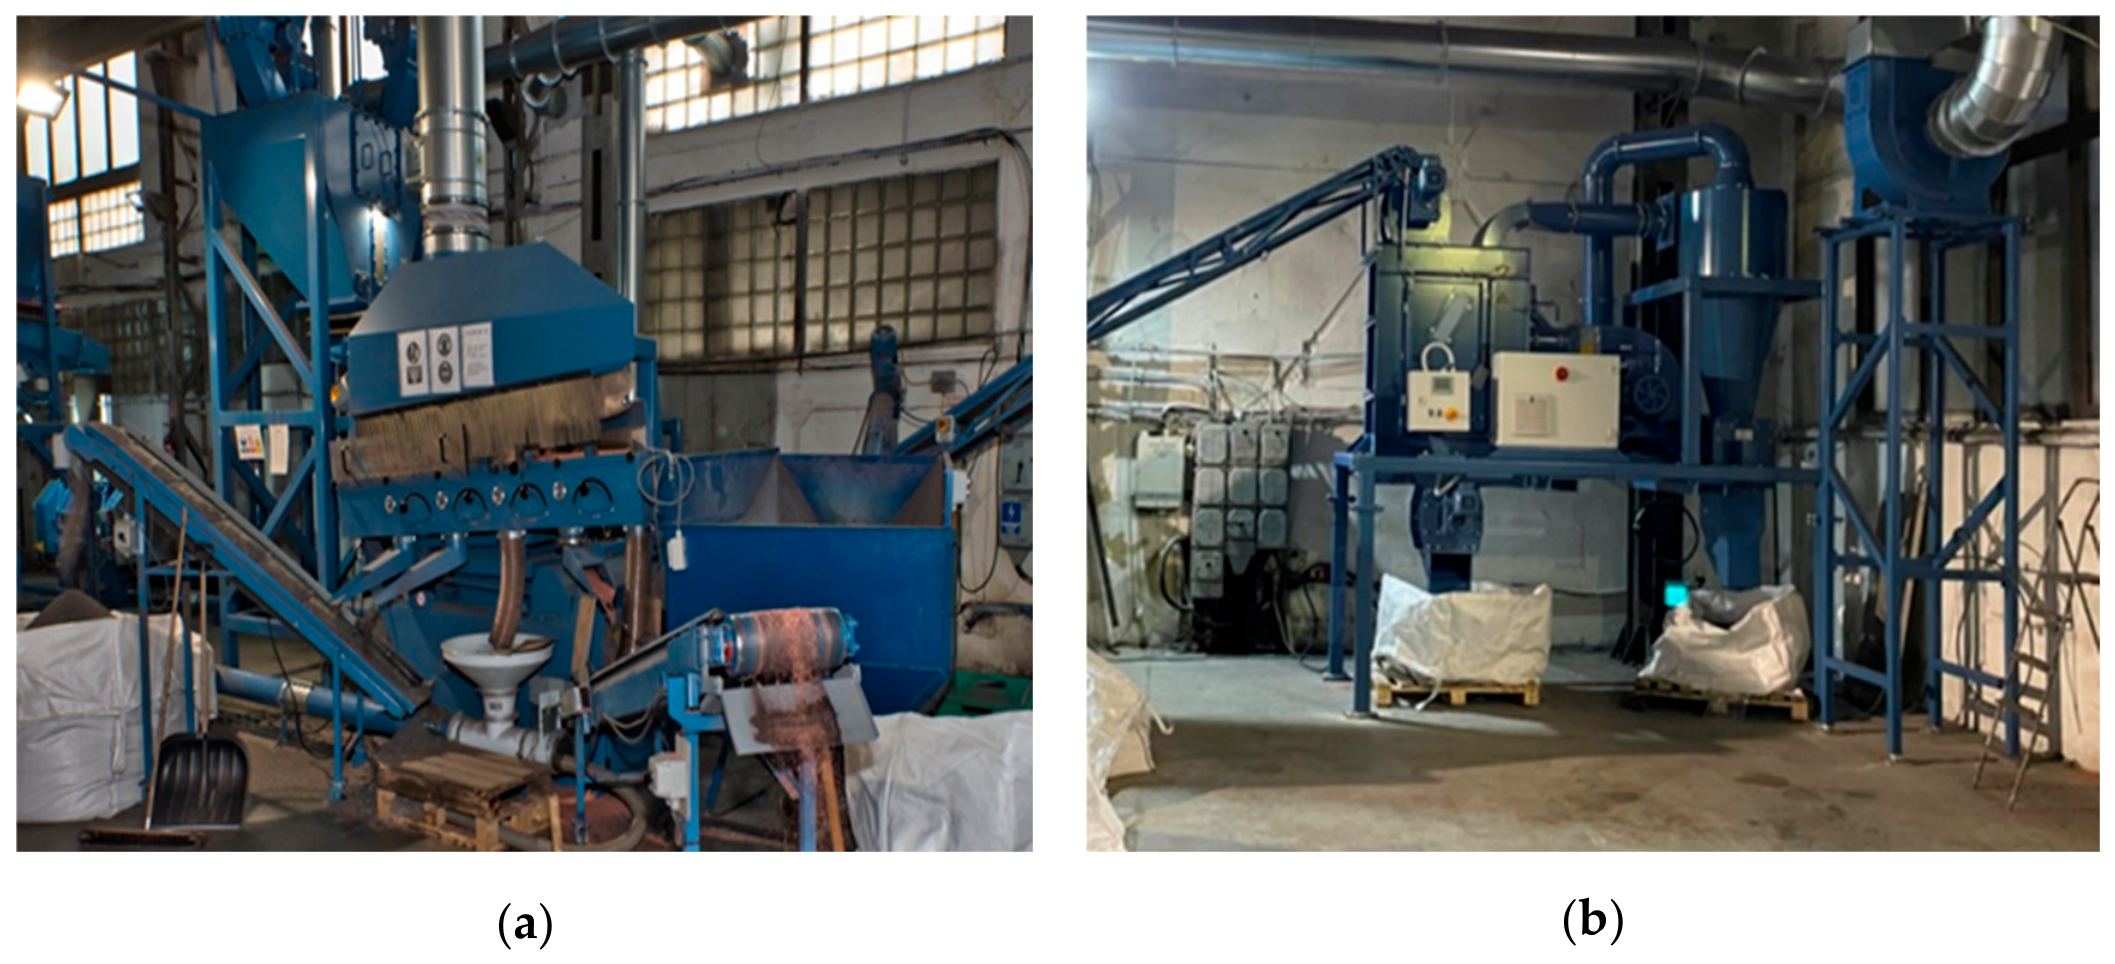
Technological Unit I consists of a WEIMA pre-shredder, a belt conveyor, and a drum magnetic separator. Technological Unit II consists of a feed silo and two ELDAN granulation mills. Technological Unit III consists of an air-vibrating separation table and a zig-zag air classifier; material transport is enclosed by belt and pneumatic systems, and dust-generating points are connected to ventilation (
Figure 4,
Figure 5 and
Figure 6).
2.3. System Boundary and Emission-Factor Selection
The inventory is a gate-to-gate operational assessment of the studied recycling line, not a full product carbon footprint or life-cycle assessment. The included flow is purchased electricity directly attributed to cable processing. The functional units are 1 Mg of processed cable and 1 Mg of recovered copper. The boundary terminology and reporting logic follow the GHG Protocol Product Standard and ISO 14067 principles [
12,
13].
The following sources were excluded because line-specific data were unavailable or because they were outside the study objective: on-site fuel use and other Scope 1 sources; cable collection and transport; upstream production of cables; manufacture and embodied emissions of the new equipment; building heating and lighting; maintenance; treatment or use of the polymer fraction; waste disposal; and downstream melting, refining, and transport of copper products. The reported values must therefore be interpreted as the electricity-related operational component of the process.
For the product-based indicator, all measured electricity-related emissions were attributed to the recovered copper mass, and no environmental credit was assigned to the polymer co-product. This conservative, consistent treatment avoids introducing an uncertain economic or mass allocation but is not equivalent to a multi-product life-cycle allocation.
A location-based approach was used because the plant was connected to the Polish grid and no supplier-specific contractual emission factor or renewable-energy certificate data were available for the analyzed months. KOBiZE reports an end-user electricity factor of 685 kg CO
2/MWh for 2022, including renewable generation and transmission and distribution losses [
14]. This factor is appropriate for a Polish grid consumer under a location-based calculation under the GHG Protocol Scope 2 Guidance [
15,
16].
The same factor was applied to both periods to create a consistent electricity-intensity benchmark and to avoid combining operational differences with changes in the national electricity mix. Consequently, the reported percentage differences reflect the measured electricity intensities of the two observed months. This standardization improves comparability but does not isolate a causal effect of the line replacement.
2.4. Calculation Procedure
The calculations were performed as follows:
where
E is monthly electricity consumption (kWh),
M_cable is monthly processed cable mass (Mg),
x_Cu is the copper mass fraction,
η is recovery efficiency,
EF is 685 kg CO
2/MWh,
SEC is specific electricity consumption, and emissions are expressed in kg CO
2 per functional unit.
2.5. Statistical Treatment and Sensitivity Analysis
Percentage differences were calculated relative to the former-line month and are reported as descriptive contrasts. The four red-copper laboratory results are reported as the mean, sample standard deviation, and range. No t-test, ANOVA, confidence interval for the line comparison, or other inferential test was performed because only one aggregate month was available for each configuration (n = 1 per condition). Treating reconstructed daily values or production-log entries as independent observations without verified, independent batch-level measurements would constitute pseudo-replication.
To examine sensitivity to feed composition, the emissions per tonne of recovered copper were recalculated for cable copper contents of 39%, 40%, and 42%, while recovery efficiencies were held at the plant values of 98.0% for the old line and 99.1% for the new line. This is a scenario analysis, not a confidence interval.
3. Results
3.1. Operational Performance and Product Quality
In the two observed months, average throughput was 0.60 Mg/h for the former line and 1.20 Mg/h for the new line, while nominal capacity was 0.70 and 2.25 Mg/h, respectively. The June 2024 dataset contained 288 Mg of processed cable compared with 168 Mg in June 2022, an observed difference of +71.4%, whereas recorded electricity consumption was 23,000 versus 30,000 kWh, an observed difference of −23.3%. These values describe the two monthly records and should not be interpreted as an isolated technology effect (
Table 2).
The former line produced a mixed copper granulate with a reported Cu content of 95–97%. The new line produced separate high-purity red-copper and tin-coated copper fractions. Across four red-copper samples from the new line, mean Cu content was 99.48%, with a sample standard deviation of 0.20% and a range of 99.29–99.71%. Because replicated old-line laboratory measurements were unavailable, the product-quality data do not support an inferential comparison between configurations.
3.2. Electricity Consumption and CO2 Emissions
In the observed records, specific electricity consumption was 178.57 kWh/Mg cable for the former line and 79.86 kWh/Mg cable for the new line, corresponding to a descriptive difference of −55.3%. At an assumed average cable copper content of 40%, estimated recovered copper mass was 65.86 and 114.16 Mg/month, respectively, and specific electricity consumption was 455.54 versus 201.47 kWh/Mg recovered Cu, a descriptive difference of −55.8%.
Using the constant KOBiZE factor of 0.685 kg CO
2/kWh, electricity-related emission intensity was 122.32 versus 54.70 kg CO
2/Mg cable and 312.04 versus 138.00 kg CO
2/Mg recovered Cu for the former- and new-line months, respectively. The percentage differences are identical to those for specific electricity consumption because the same emission factor was applied to both datasets (
Table 3).
3.3. Sensitivity to Cable Copper Content
The scenario analysis showed that the assumed average copper content of the cable feed changes the absolute emission intensity per tonne of recovered copper but not the direction of the descriptive contrast. Across the 39–42% range, the former-line result was 297–320 kg CO
2/Mg Cu and the new-line result was 131–142 kg CO
2/Mg Cu; the calculated difference remained approximately −55.8%. This analysis addresses only uncertainty in the assumed copper content and does not resolve confounding by other feedstock, environmental, or operational variables (
Table 4).
3.4. Costs and Sustainability Co-Benefits
The reported unit operating cost was 1300 PLN/Mg of processed cable for the former line and 1050 PLN/Mg for the new line, an observed difference of −19.2%. Total monthly operating cost was calculated by multiplying unit cost by processed mass: 168 Mg × 1300 PLN/Mg = 218,400 PLN for the former-line month and 288 Mg × 1050 PLN/Mg = 302,400 PLN for the new-line month. The higher monthly total in June 2024 reflects the larger processed mass; the relevant efficiency indicator is the lower unit cost.
The company records list five operators for the former-line month and two for the new-line month. The measured hall noise value was 86.6 dB for both configurations after acoustic enclosure of the new mills; therefore, the available data indicate maintenance of the recorded noise level rather than a reduction. The former-line dust measurement was 0.008 mg/m3, but no directly comparable new-line measurement was available. Although the enclosed conveying and ventilation system may reduce fugitive dust, the present dataset does not support a quantitative dust-reduction claim.
4. Discussion
The principal observation is a large descriptive difference between the two monthly datasets: the June 2024 configuration processed more material while using less electricity in absolute terms and per functional unit. The calculated −55.8% difference per tonne of recovered copper reflects the combined values for monthly electricity consumption, processed mass, assumed copper content, and recovery efficiency. Because each line is represented by one non-contemporaneous aggregate month, this contrast cannot be attributed definitively to the technology and may partly reflect uncontrolled differences in feedstock and operating conditions.
The distinction between nominal capacity and observed throughput is important. Nominal capacity was more than three times higher for the new line, whereas the observed monthly average was twice as high; the latter is the more relevant descriptor of the analyzed month and should not be conflated with design capacity. Likewise, the lower unit operating cost does not imply a lower total monthly cost because production volume was substantially higher in June 2024.
The line replacement also coincided with a change in product architecture. The former process generated a mixed copper product, whereas the new process separates high-purity red copper from tin-coated copper and is designed to reduce residual copper in the polymer fraction. The four new-line laboratory samples document consistently high Cu purity, but the absence of replicated old-line laboratory data prevents a formal statistical comparison of product quality.
The calculated 0.138 kg CO
2/kg recovered Cu for the new-line month is below the 0.2–1.9 kg CO
2-eq/kg Cu range reported for broader secondary-copper systems and far below the 1.1–8.5 kg CO
2-eq/kg Cu range reported for primary copper [
8]. Giurco and Petrie reported an illustrative value of approximately 7 kg CO
2-eq/kg Cu for ore-based production and 0.65 kg CO
2-eq/kg Cu for a mixed-scrap route [
10]. These values provide context only and are not directly comparable with the present gate-to-gate indicator because published systems may include collection, transport, thermal treatment, smelting, refining, and other life-cycle stages excluded here.
The comparison should therefore be interpreted as a plant-specific sustainability benchmark of measured operational electricity intensity rather than proof of the life-cycle or causal superiority of the equipment. A complete carbon footprint would require Scope 1 data, upstream and downstream Scope 3 data, embodied emissions of the new line, transport distances, treatment of polymer outputs, and downstream metallurgical processing. The present boundary remains useful for sustainability-oriented decision-making because purchased electricity was measured consistently for both monthly records.
4.1. Methodological Limitations and Interpretation
The most important limitation is the use of a single aggregate month for each line, observed in different years. Thus, the design cannot establish statistical significance, causal attribution, or generalizability beyond the studied plant and months. Seasonal conditions, cable composition, ambient temperature and humidity, maintenance status, operator experience, downtime, production scheduling, and the day-of-week distribution may confound the comparison. The 39–42% copper-content scenarios demonstrate robustness only to this selected assumption and do not control the remaining confounders.
The assumed 40% cable copper content and the recovery efficiencies are plant values rather than repeated batch-level measurements. The location-based KOBiZE factor represents the average Polish end-user electricity mix rather than the exact supplier mix at the site. In addition, no comparable new-line dust measurement and no capital-cost, equipment-lifetime, or embodied-carbon data were available. Accordingly, occupational-exposure improvements, investment payback, and whole-life sustainability performance remain outside the scope of the evidence presented.
4.2. Future Research and Validation Plan
A confirmatory follow-up should collect multiple independent months for each configuration or, where operation of the former line is no longer possible, multiple comparable batches under a predefined protocol. For every observation, the dataset should include feed copper content and cable type, batch mass, ambient temperature and humidity, operating hours, electricity use, throughput, recovery efficiency, product purity, operator/team, downtime, maintenance events, and production schedule. Primary outcomes and exclusion criteria should be specified before analysis.
With replicated independent observations, simple two-group comparisons could use a Welch t-test when distributional assumptions are reasonable, accompanied by effect sizes and confidence intervals. Analysis of covariance or multivariable regression should then be used to adjust for feed composition, ambient conditions, operating hours, maintenance, and workforce variables; mixed-effects models would be appropriate if batches or days are nested within months. The expanded inventory should also support uncertainty propagation, a market-based Scope 2 comparison, and a cradle-to-gate life-cycle assessment including equipment manufacture, transport, polymer outputs, and downstream copper refining.
5. Conclusions
This report is based on one aggregate month for each line, observed two years apart. Consequently, the data do not establish statistical significance or a causal effect of the line replacement, and the results should not be generalized beyond the studied plant and operating periods. Uncontrolled differences in feedstock, ambient conditions, operators, maintenance, downtime, and production scheduling may explain part of the observed contrast.
Within this limitation, the records provide a transparent gate-to-gate sustainability-relevant benchmark. The June 2024 dataset contained 55.3% lower specific electricity consumption per tonne of cable and 55.8% lower specific electricity consumption per tonne of recovered copper than the June 2022 dataset; the corresponding location-based electricity-related emission intensity was 312.04 versus 138.00 kg CO2/Mg recovered Cu. Observed throughput was 0.60 versus 1.20 Mg/h, and nominal capacity was 0.70 versus 2.25 Mg/h.
The new-line month was also associated with lower operator demand and unit operating cost, and four samples of the separated red-copper fraction had a mean purity of 99.48 ± 0.20% Cu. The recorded hall noise level was sustained, while the available data did not support a quantitative claim concerning dust reduction. These values are preliminary, plant-specific benchmark data rather than conclusive evidence of sustainability performance.
Future validation should use replicated monthly or batch-level observations and apply inferential methods, including an appropriate two-group test and analysis of covariance or regression to control for confounding variables. Such work is also required before the operational findings can be generalized or incorporated into a complete life-cycle assessment.
Author Contributions
Conceptualization, P.M. and J.Ł.; methodology, J.Z.; software, J.Z. and P.M.; validation, J.Z., P.M. and J.Ł.; formal analysis, A.S.-P., M.M. and M.H.; investigation, M.M., M.H. and A.S.-P.; resources, P.M. and J.Z.; data curation, J.Z., J.Ł., M.H., A.S.-P. and M.M.; writing—original draft preparation, A.S.-P., M.H. and M.M.; writing—review and editing, M.H., M.M. and A.S.-P.; visualization, P.M., J.Z. and M.H.; supervision, J.Ł., M.M. and A.S.-P.; project administration, P.M. and J.Ł.; funding acquisition, J.Ł. All authors have read and agreed to the published version of the manuscript.
Funding
This research was funded by POIR “Fast Track”, within which the project entitled “Development of an innovative technology for separating recycled copper cable granulates into pure copper (Cu) and tin-coated copper (CuSn) using hybrid mechanical separation methods” was implemented (competition no. POIR.01.01.01-00-0216/21).
Institutional Review Board Statement
Not applicable.
Informed Consent Statement
Not applicable.
Data Availability Statement
The original contributions presented in this study are included in the article. Further inquiries can be directed to the corresponding author.
Conflicts of Interest
Author Jacek Zatoński was employed by the company EKO-BHP Jacek Zatoński. The remaining authors declare that the research was conducted in the absence of any commercial or financial relationships that could be construed as a potential conflict of interest.
References
- Lu, Y.; Liu, G.; Yue, Q.; Fu, Y.; Wang, H.; Dou, Z.; Wang, Y.; Du, T. Research on copper flow and environmental load in China’s new infrastructure industry for carbon neutrality. J. Clean. Prod. 2024, 466, 142857. [Google Scholar] [CrossRef]
- Li, X.; Ma, B.; Wang, C.; Chen, Y. Sustainable recovery and recycling of scrap copper and alloy resources: A review. Sustain. Mater. Technol. 2024, 41, e01026. [Google Scholar] [CrossRef]
- Ciacci, L.; Fishman, T.; Elshkaki, A.; Graedel, T.E.; Vassura, I.; Passarini, F. Exploring future copper demand, recycling and associated greenhouse gas emissions in the EU-28. Glob. Environ. Change 2020, 63, 102093. [Google Scholar] [CrossRef]
- Li, L.; Liu, G.; Pan, D.; Wang, W.; Wu, Y.; Zuo, T. Overview of the recycling technology for copper-containing cables. Resour. Conserv. Recycl. 2017, 126, 132–140. [Google Scholar] [CrossRef]
- Wędrychowicz, M.; Kurowiak, J.; Skrzekut, T.; Noga, P. Recycling of electrical cables—Current challenges and future prospects. Materials 2023, 16, 6632. [Google Scholar] [CrossRef] [PubMed]
- Janajreh, I.; Alshrah, M.; Zamzam, S. Mechanical recycling of PVC plastic waste streams from cable industry: A case study. Sustain. Cities Soc. 2015, 18, 13–20. [Google Scholar] [CrossRef]
- Suresh, S.S.; Mohanty, S.; Nayak, S.K. Composition analysis and characterization of waste polyvinyl chloride recovered from data cables. Waste Manag. 2017, 60, 100–111. [Google Scholar] [CrossRef] [PubMed]
- Ekman Nilsson, A.; Macias Aragonés, M.; Arroyo Torralvo, F.; Dunon, V.; Angel, H.; Komnitsas, K.; Willquist, K. A review of the carbon footprint of Cu and Zn production from primary and secondary sources. Minerals 2017, 7, 168. [Google Scholar] [CrossRef]
- Chen, J.; Wang, Z.; Wu, Y.; Li, L.; Li, B.; Pan, D.; Zuo, T. Environmental benefits of secondary copper from primary copper based on life cycle assessment in China. Resour. Conserv. Recycl. 2019, 146, 35–44. [Google Scholar] [CrossRef]
- Giurco, D.; Petrie, J.G. Strategies for reducing the carbon footprint of copper: New technologies, more recycling or demand management? Miner. Eng. 2007, 20, 842–853. [Google Scholar] [CrossRef]
- EN 16247-1:2022; Energy Audits—Part 1: General Requirements. European Committee for Standardization (CEN): Brussels, Belgium, 2022.
- Greenhouse Gas Protocol. Product Life Cycle Accounting and Reporting Standard; World Resources Institute and World Business Council for Sustainable Development: Washington, DC, USA; Geneva, Switzerland, 2011. [Google Scholar]
- ISO 14067:2018; Greenhouse Gases—Carbon Footprint of Products—Requirements and Guidelines for Quantification. International Organization for Standardization (ISO): Geneva, Switzerland, 2018.
- KOBiZE. Wskaźniki Emisyjności CO2, SO2, NOx, CO i Pyłu Całkowitego dla Energii Elektrycznej na Podstawie Informacji Zawartych w Krajowej Bazie o Emisjach Gazów Cieplarnianych i Innych Substancji za 2022 Rok; KOBiZE: Warszawa, Poland, 2023. [Google Scholar]
- Greenhouse Gas Protocol. Scope 2 Guidance: An Amendment to the GHG Protocol Corporate Standard; World Resources Institute: Washington, DC, USA, 2015. [Google Scholar]
- Lewandowska, A.; Joachimiak-Lechman, K.; Baran, J.; Kulczycka, J. Electricity-related emissions factors in carbon footprinting—The case of Poland. Energies 2025, 18, 4092. [Google Scholar] [CrossRef]
| Disclaimer/Publisher’s Note: The statements, opinions and data contained in all publications are solely those of the individual author(s) and contributor(s) and not of MDPI and/or the editor(s). MDPI and/or the editor(s) disclaim responsibility for any injury to people or property resulting from any ideas, methods, instructions or products referred to in the content. |




 ,
,