Article

How Does the Carbon Emission Trading Scheme Reshape Corporate Green Innovation? Evidence from China’s Pilot Policy


1
School of International Economics, China Foreign Affairs University, Beijing 100037, China
2
School of Humanities and Social Science (School of Public Administration), Beihang University, Beijing 100083, China
*
Author to whom correspondence should be addressed.
Sustainability 2026, 18(15), 7955; https://doi.org/10.3390/su18157955
Submission received: 4 July 2026 / Revised: 1 August 2026 / Accepted: 4 August 2026 / Published: 5 August 2026

Abstract

Market-based instruments for environmental governance have emerged as a central pillar of China’s climate policy architecture, though their capacity to drive corporate green innovation continues to be the subject of active scholarly debate. Drawing on a staggered difference-in-differences identification strategy and a panel of Chinese A-share listed firms covering 2008 to 2023, this study evaluates the impact of China’s carbon emission trading scheme (CETS) pilot policy on firm-level green innovation. Our estimates indicate that the CETS pilot policy significantly increases green patent applications, a finding that proves robust for an extensive set of checks: parallel trends assessment, placebo exercises, PSM-DID estimation, alternative estimation strategies, and varied sample constructions. Heterogeneity analyses show that the innovation-enhancing effect is concentrated among firms operating in non-regulated industries and located in the western region, and that enterprises and regions endowed with stronger baseline carbon performance and higher pollution control investment display amplified responses. Mechanism analysis shows that the CETS pilot policy increases both operating costs and debt financing costs, yet these two cost channels exert opposite effects on green innovation. Operating costs drive innovation through cost-induced pressure, while financing costs inhibit innovation through a crowding-out effect. The net-positive effect suggests that the innovation-inducing effect of operating costs outweighs the innovation-inhibiting effect of financing costs. This study recommends maintaining stable carbon price signals, implementing complementary green finance policies, providing differentiated support for low-capability firms and regions, and accounting for spillover effects in policy evaluation.

1. Introduction

A considerable distance remains between present climate pledges and the temperature objectives set forth in the Paris Agreement. Recent analyses suggest that the nationally determined contributions submitted to date fall short of the reductions needed to keep global warming below 2 °C, underscoring the pressing demand for more potent mitigation tools. Realizing deep decarbonization calls for not only stronger policy frameworks but also instruments capable of spurring technological change within individual firms. As the globe’s foremost carbon emitter, China occupies a critical position in international climate governance. In working toward its “Dual Carbon” targets, the country must navigate the twin imperatives of maintaining economic momentum while cutting emissions more rapidly. Yet recent statistics indicate that the rate at which carbon intensity is declining may be insufficient: a 3.4% drop was recorded in 2024 [1], a pace that likely trails the trajectory required for a 1.5 °C-compatible pathway. Under these circumstances, conventional command-and-control approaches appear increasingly inadequate, and market-oriented mechanisms—most notably the carbon emission trading scheme (CETS)—have moved to the center of China’s climate policy architecture.
China’s CETS has undergone a swift transition from subnational pilot programs to a unified national framework. From 2013 to 2023, the pilot markets registered cumulative transactions of roughly 440 million tons of carbon allowances, amounting to a total trading value of 12.65 billion yuan. After the inauguration of the national carbon market in 2021, the mean carbon price rose from 42.85 yuan per ton that year to 68.15 yuan in 2023 [2]. Notwithstanding these advances, carbon prices continue to lag behind those observed in more established regimes such as the EU ETS, and the dominance of free allowance distribution could attenuate the incentive for enterprises to pursue meaningful technological upgrading. These conditions raise a fundamental concern: is the CETS genuinely capable of fostering green technological innovation (GTI) among firms?
The empirical record on China’s CETS and green innovation is far from uniform and has grown increasingly subtle. Several investigations report that the introduction of the CETS pilot policy markedly boosts green patent filings, an outcome attributed to cost-prompted technological transformation and heightened competitive pressures in product markets [3,4,5]. Other contributions, however, call attention to the possible displacement of R&D expenditure or only modest gains in the efficiency of innovation, especially for enterprises facing tighter financial constraints [6,7,8]. Beyond this, the policy’s efficacy has been found to vary substantially across firms and locations, depending on dimensions such as enterprise scale, ownership configuration, and the quality of local institutions [9,10]. An additional layer of complexity involves the distinction between the volume and the caliber of innovation. Although the CETS has generally expanded the volume of green patent applications, the evidence on innovation quality is less definitive: some research points to simultaneous improvements in both quantity and quality, while other work detects a stronger impetus toward quantity expansion relative to quality upgrading [11,12].
Set against this landscape, the present study empirically investigates the influence of China’s CETS pilot policy on firms’ green technological innovation. Drawing on a panel dataset covering Chinese A-share listed companies from 2008 to 2023, we deploy a staggered difference-in-differences (DID) identification strategy coupled with a comprehensive suite of robustness procedures. Our analysis extends beyond the aggregate effect to unpack the heterogeneity of the policy impact across industrial sectors, geographic regions, and dimensions of firm and regional capability, and further probes the cost-related channels through which the policy operates.
This paper contributes to the existing body of knowledge along several dimensions. First, it identifies a noteworthy spillover effect of the CETS pilot policy, showing that green innovation is stimulated not only in the directly regulated sectors but also—and indeed more prominently—in firms outside those sectors. Second, it documents an unconventional regional pattern: the policy effect is most pronounced in the western region rather than in the more developed eastern provinces, thereby challenging the received assumption that innovation effects of environmental regulation concentrate in technologically advanced areas. Third, it develops a dual-cost mechanism framework, demonstrating that the CETS pilot policy influences green innovation through two competing cost channels—operating costs and debt financing costs—which act in opposite directions. This framework extends prior research by distinguishing between different cost channels, most of which have treated the innovation effects of carbon pricing as stemming from a single mechanism. Our findings suggest that the net effect of carbon pricing depends on the relative strength of these two channels, which is shaped by the financial and institutional conditions under which firms operate.
The remainder of the article is organized as follows. Section 2 surveys the relevant strands of the literature and formulates the research hypotheses. Section 3 describes the data sources, variable construction, and empirical methodology. Section 4 reports the empirical findings, encompassing baseline estimates, robustness checks, heterogeneity analyses, and mechanism tests. Section 5 discusses the results in depth, and Section 6 concludes with policy implications and an acknowledgment of the study’s limitations.

2. Literature Review and Research Hypotheses

2.1. Determinants of Enterprises’ GTI

The scholarship on the drivers of enterprises’ green technological innovation has coalesced around three broad categories: the macro-level institutional setting, firm-internal capabilities, and the external pressures exerted by stakeholders and market forces. These three dimensions, while conceptually distinct, interact in shaping the innovation decisions of firms.
At the macro level, environmental regulation and public policy are widely acknowledged as principal exogenous catalysts of green innovation. Evidence from earlier work indicates that appropriately crafted environmental policies can spur eco-innovation by establishing regulatory expectations and creating market incentives for cleaner production technologies [13,14,15]. Government subsidies for R&D and tax benefits targeted at green activities further reinforce these incentives [16,17]. The design features of regulatory instruments—including their stringency, flexibility, and predictability—matter considerably for their innovation impact.
At the firm level, internal governance capacity and organizational resources also play critical roles. Empirical evidence indicates that the adoption of environmental management systems can enhance firms’ intrinsic motivation for green innovation through improved internal governance mechanisms [18], while green supply chain management promotes technological innovation by enhancing resource integration and increasing the value of green innovation [19]. Corporate governance quality has also been positively associated with green innovation [20].
At the external level, stakeholder pressure and market competition further shape firms’ green innovation behavior. Stakeholder demands can directly influence innovation decisions [21], while public scrutiny and environmental risk may incentivize firms to adopt cleaner production technologies [22]. Competitive pressure within industries can stimulate firms to increase green R&D investment in response to technological advancements by rivals [23], and knowledge spillovers through collaborative networks contribute to enhancing innovation performance [24,25].

2.2. Relationship Between Environmental Regulations and Enterprises’ GTI

The nature of the link between environmental regulation and firm-level technological innovation remains an open empirical question, with two rival theoretical perspectives framing the scholarly debate.
The first perspective, rooted in the cost crowding-out logic, maintains that environmental regulation inflates compliance expenditures and consequently displaces resources that would otherwise be directed toward innovation. A sizable empirical literature lends support to this viewpoint. Palmer et al. [26] argued that regulatory mandates raise the cost of doing business, compressing profit margins and thereby shrinking the funds available for R&D. Copeland and Taylor [27] demonstrated that regulatory stringency can induce an industrial relocation effect, potentially shifting polluting activities toward jurisdictions with more lenient standards rather than stimulating local innovation. Ben Kheder and Zugravu [28] and Peng and Zhang [29] provided evidence that more exacting environmental rules are associated with reduced attractiveness for industrial investment, further corroborating the crowding-out narrative.
The second perspective, articulated in the Porter Hypothesis, contends that well-designed environmental regulation can act as a catalyst for technological innovation, generating what is termed an innovation compensation effect that ultimately enhances business competitiveness [30]. Under this logic, regulation signals inefficiencies in current production methods and motivates firms to explore cleaner, more efficient alternatives that reduce both environmental impact and long-term costs. This view has garnered empirical backing as well. Cainelli et al. [31] showed that environmental innovation calls for distinct resource endowments, and Petroni et al. [32] underscored that the Porter mechanism is contingent on firms’ ability to appropriate the value generated by innovation. Generally, more studies have found that market-based instruments—by affording firms greater flexibility in compliance strategies—tend to outperform rigid command-and-control measures in stimulating innovative activity [33,34,35,36].
More recent scholarship suggests that the regulatory–innovation relationship is neither uniform nor monotonic. Several studies document a U-shaped relationship between the intensity of regulation and green innovation, whereby moderate regulatory pressure may initially suppress innovation before reaching a threshold beyond which the effect turns positive [37,38]. The contextual conditions under which regulation encourages or discourages innovation—including factors such as firm size, industry characteristics, and the broader institutional environment—continue to attract active research interest [39,40,41].

2.3. Effect of CETS on GTI

An expanding body of research has investigated the influence of CETS on enterprise green technological innovation, with the focus progressively shifting from conceptual discussions to firm-level empirical analysis.
Tang et al. [3] show that carbon trading induces technological change by altering firms’ cost structures and innovation incentives. Similarly, Wang et al. [2] find that the CETS intensifies competitive pressure and stimulates green R&D investment. Cheng and Wang [5] further demonstrate that the policy operates through both pressure and incentive effects. However, these positive findings are not universal. Several studies report insignificant or even negative effects, particularly in the short term or among firms with limited financial resources. For instance, Ren and Zhu [8] find that while carbon trading promotes the quantity of green innovation, it fails to improve innovation quality, suggesting that the policy may encourage strategic patenting rather than substantive technological breakthroughs. More critically, Zhong et al. [7] document that certain policy mixes, particularly the combination of carbon trading and smart city pilots, may trigger a “green innovation bubble”—a phenomenon in which firms increase patent filings without corresponding improvements in environmental performance or technological capability. Xu et al. [6] further show that carbon trading generates negative spatial spillovers on neighboring cities.
The policy impact also appears to be markedly heterogeneous across regions, although the evidence on regional patterns is far from settled. Some studies report that the policy effect peaks in the eastern region, attributing this to deeper financial markets, more robust institutional frameworks, and superior technological infrastructure [9,42]. Others, however, find that the strongest innovation responses emerge in the central and western regions, explaining that these areas possess larger untapped emission reduction potential and lower marginal abatement costs [43,44]. Adding to the complexity, the magnitude and even the direction of the effect have been found to differ across industries, ownership categories, and firm size classes [45,46].
A further important distinction drawn in the recent literature is that between innovation quantity and innovation quality. Lv et al. [11] furnished evidence that the CETS pilot policy promotes both the volume and the quality of green innovation, though the impact on quantity is relatively more pronounced. Zhong et al. [7] cautioned, however, that some of the observed increase in green patenting may represent “false booms” that are not matched by commensurate improvements in underlying technological capability, raising concerns about the substantive value of policy-induced innovation.
Despite the richness of the existing literature, several gaps remain. First, the predominant focus on the direct impact of the CETS pilot policy on firms within regulated sectors has largely overlooked the potential spillover effects on firms that are not directly covered by the scheme. Second, while cost mechanisms have been discussed in theoretical terms, the empirical literature has yet to disentangle the potentially countervailing effects of different types of costs—namely, operating costs versus financing costs—on green innovation. Third, the manner in which firms’ pre-existing capabilities and regional conditions moderate the policy impact remains underexplored. This study seeks to address these gaps by examining the CETS pilot policy through the lenses of spillovers, dual-cost mechanisms, and capability-dependent heterogeneity.
To address these gaps, this study proposes four hypotheses:
H1. 
The CETS pilot policy significantly promotes corporate green innovation.
H2. 
The CETS pilot policy generates positive spillover effects on firms in non-regulated sectors.
H3. 
The policy effect is stronger among firms and regions with higher baseline carbon performance and greater pollution control investment.
H4. 
The policy affects innovation through a dual-cost mechanism, wherein rising debt financing costs crowd out innovation, while rising operating costs induce innovation through cost-induced pressure.

3. Data and Methodology

3.1. Data

The initial sample comprises all Chinese A-share listed companies from 2008 to 2023, but excludes financial enterprises, ST/PT enterprises and enterprises with missing data on key variables. Therefore, the sample has a total of 47,698 firm-year observations.

3.2. Methodology

A staggered DID is adopted to identify the causal effect of the CETS pilot policy on GTI. This approach is preferred in our setting because the policy was implemented across different provinces at different times, which naturally fits this framework and allows us to exploit the variation in policy timing across regions for causal identification. The equation is as follows:
G T I i t = β 0 + β 1 D I D i t + β 2 X i t + μ i + λ t + ε i t
where i represents enterprises, t refers to time. G T I i t is measured by the level of green technological innovation of enterprise i in year t . D I D i t is the core independent variable, indicating whether enterprise i is located in the pilot area in year t . X i t represents the control variables. In addition, μ i , λ t and ε i t capture firm fixed effects, year fixed effects, and random error, respectively. The coefficient of interest is β 1 , which captures the causal effect of the policy on corporate green technological innovation.

3.3. Variables and Data Sources

3.3.1. Dependent Variable

Consistent with the literature [47], we measure GTI using the number of green patent applications filed by firms. Patent data are retrieved from the China National Intellectual Property Administration (CNIPA). To identify green patents, we adopt the International Patent Classification (IPC) codes defined in the World Intellectual Property Organization (WIPO) Green Inventory, specifically the Y02 and Y04 categories, which cover technologies related to energy conservation, emission reduction, and clean energy.

3.3.2. Independent Variable

The core independent variable, DID, is a dummy variable indicating whether a firm is subject to the CETS pilot policy in a given year. Specifically, for firms located in Beijing, Tianjin, Shanghai, and Guangdong, DID takes the value of 1 for years from 2013 onward. For firms in Hubei and Chongqing, DID takes the value of 1 for years from 2014 onward. It takes the value of 0 otherwise. Fujian province is excluded from the treatment group because its pilot was not launched until the end of 2016, and its market design and institutional environment differ considerably from the earlier pilots, which may introduce heterogeneous treatment effects that could obscure the estimation of the average policy effect. This approach is consistent with He [48] and Cong et al. [49]. We also perform robustness checks by excluding Fujian from the sample to confirm that our results are not driven by this sample choice.

3.3.3. Control Variables

To mitigate omitted variable bias and improve the precision of our estimates, we include several control variables. Specifically, we control for human capital (HC), energy structure (ES), and industrial added value (IAV) to absorb regional-level confounding factors. The choice of these variables is grounded in the existing literature.
Human capital is included because regions with higher human capital accumulation possess greater knowledge absorption and innovation capacity, which are conducive to green technological innovation [42,43]. Energy structure captures regional differences in energy mix, and regions with more optimized energy structures tend to face stronger low-carbon transition pressures, which may stimulate green innovation [44]. Industrial added value accounts for regional differences in industrialization and economic scale, as regions with higher industrial added value tend to have more concentrated industrial activities and greater pressure for green transition, which may influence firms’ innovation behavior [45].
In addition, all regressions also incorporate firm and year fixed effects to absorb time-invariant firm heterogeneity and common time trends. Several variables that potentially lie on the transmission path between the CETS pilot policy and firm innovation are deliberately excluded from the baseline specification. These variables include corporate carbon performance (CCP), investment in industrial pollution control (IPC), corporate operating cost (COC), and corporate debt financing costs (DFC). Instead, they are reserved for further analysis in the mechanism and heterogeneity sections. Table 1 summarizes detailed definitions of variables.

4. Empirical Results

4.1. Descriptive Statistics

According to Table 2, the mean value of GTI is 1.798, with a standard deviation of 13.107 and a maximum of 941, indicating a highly right-skewed distribution. This pattern is consistent with typical patent data in the literature, where most firms have few or no green patents while a small number of firms hold a large stock of green patents. To better understand the distribution, we examine its percentiles. The 25th, 50th, and 75th percentiles of GTI are all zero, while the 90th, 95th, and 99th percentiles are 3, 7, and 32, respectively, confirming the highly right-skewed nature of the dependent variable with a large proportion of zero values. When comparing GTI across treatment status, the mean values for the 2013 and 2014 treatment cohorts are 2.542 and 1.885, respectively, compared to 1.388 for the control group. This preliminary comparison suggests a positive association between the CETS pilot policy and green innovation.
Regarding the control variables, the mean of human capital is 0.020, suggesting that college students account for about 2% of the regional population on average. Energy structure has a mean of 0.267, measured as the province’s electricity consumption share of the national total. Industrial added value averages 1.831 (in 100 million yuan), with substantial variation across regions. Corporate carbon performance has a mean of 0.399 and a standard deviation of 0.627 and has been winsorized at the 1st and 99th percentiles to mitigate the influence of outliers. Investment in industrial pollution control averages 26.375 (in 100 million yuan), also exhibiting considerable regional disparities. For the cost-related variables, the natural logarithm of operating costs has a mean of 11.980, based on 34,597 observations after excluding cases with zero or missing operating costs. The debt financing cost has a mean of 0.003, with a minimum of −2.455, reflecting that some firms have negative financial expenses due to interest income exceeding interest expenses.
Overall, the descriptive statistics reveal substantial variation in green innovation and firm characteristics across the sample, supporting the empirical strategy employed in this study.

4.2. Empirical Results of the Baseline Model

Table 3 shows the baseline results. Column (1) is a simple OLS regression without any controls and fixed effects, and the coefficient of DID is positive and significant. Column (2) adds control variables, and the coefficient of DID drops to 1.137, but it is still statistically significant at the level of 1%. Column (3) introduces both enterprise fixed effects and year fixed effects without control variables, and the coefficient further drops to 0.877 (p < 0.05).
Column (4) represents our preferred specification, incorporating both the full set of control variables and two-way fixed effects. The coefficient of DID is 0.916 (p < 0.05), suggesting that the CETS pilot policy increases green patent applications by approximately 0.916 per firm-year on average. In terms of economic significance, relative to the sample mean of GTI (1.798), this effect corresponds to an increase of about 51%. Statistical significance is robust to the inclusion of firm fixed effects, which absorb all time-invariant firm-specific characteristics (such as industry affiliation, ownership structure, and geographic location), and year fixed effects, which absorb common macroeconomic trends. The R-squared increases substantially from 0.003 in Column (2) to 0.599 in Column (4), confirming the strong explanatory power of the fixed effects.
Regarding the control variables, in Column (2), human capital and industrial added value show positive and statistically significant coefficients, suggesting that regions with higher education levels and greater industrial output tend to exhibit higher levels of green innovation. However, once firm and year fixed effects are controlled for in Column (4), none of the control variables remain statistically significant. This is not surprising, as the fixed effects absorb a substantial portion of the variation in these regional-level variables. In other words, the explanatory power of regional characteristics is largely captured by the firm fixed effects, which account for time-invariant heterogeneity at the firm level. Therefore, the insignificance of these control variables in our preferred specification does not undermine their relevance.
Overall, the results provide robust evidence that the CETS pilot policy significantly promotes green technological innovation among Chinese listed firms, supporting Hypothesis 1.

4.3. Robustness Tests

4.3.1. Parallel Trends Test

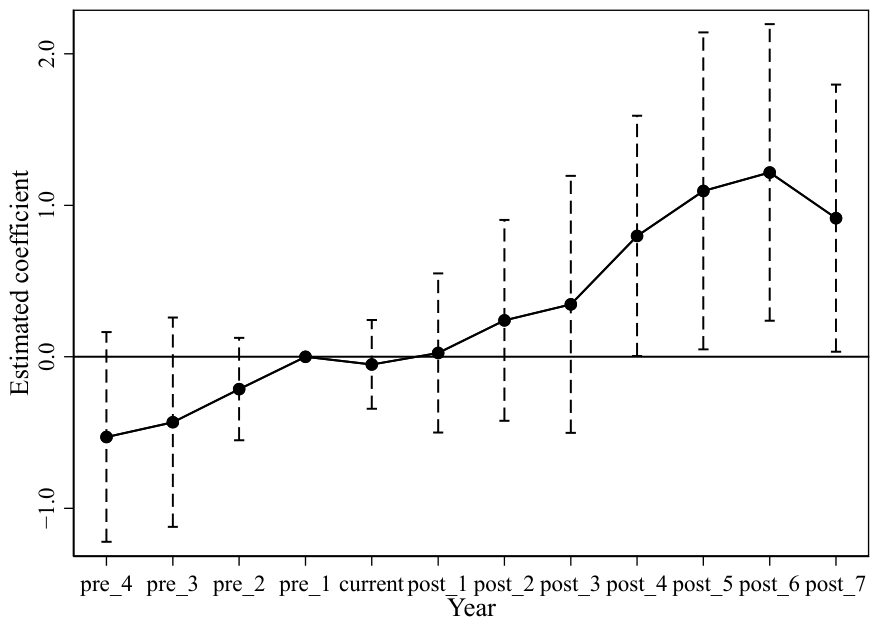
The credibility of the staggered DID design hinges on the parallel trends assumption, which stipulates that, in the absence of the policy intervention, the treatment and control groups would have followed comparable trajectories in green technological innovation. To evaluate this assumption empirically, we adopt an event-study specification:
G T I i t = β 0 + k = 4 7 β k D c u r r e n t + k + β 2 X i t + μ i + λ t + ε i t
where D c u r r e n t + k denotes the temporal dynamics of the pilot policy for CETS. The variable k represents the relative time to policy implementation, defined as the difference between the year of observation and the policy adoption year. To mitigate the influence of extreme leads and lags, values of k below −4 are set to −4, and values above 7 are set to 7. We set the period immediately prior to the policy implementation as the baseline category and omit it from the regression to avoid perfect multicollinearity. The remaining variables are defined in the same manner as in the baseline specification. The parallel trends assumption is considered to hold if the estimated coefficients on the lead terms ( β k , for k <   0 ) are statistically insignificant, indicating no systematic differences between the control and treatment groups prior to the implementation of the CETS pilot policy.
Figure 1 displays the outcomes of the parallel trends test. Prior to the policy intervention, the coefficient estimates are not statistically distinguishable from zero, and their confidence bands cover zero, suggesting that there were no meaningful pre-existing differences in trends between the treated and control groups. This result lends empirical support to the parallel trends assumption.
Meanwhile, the post-treatment coefficients exhibit a clear lagged pattern. In the first three years following the policy, the coefficients remain positive but statistically insignificant, suggesting that the innovation response requires time to materialize. From the fourth year onward, the coefficients become positive and gradually increase in magnitude. This pattern supports the Porter Hypothesis, indicating that the innovation compensation effect takes several years to emerge after policy implementation and becomes more pronounced over time as firms adapt to the regulatory pressure and accumulate technological capabilities.

4.3.2. Placebo Test

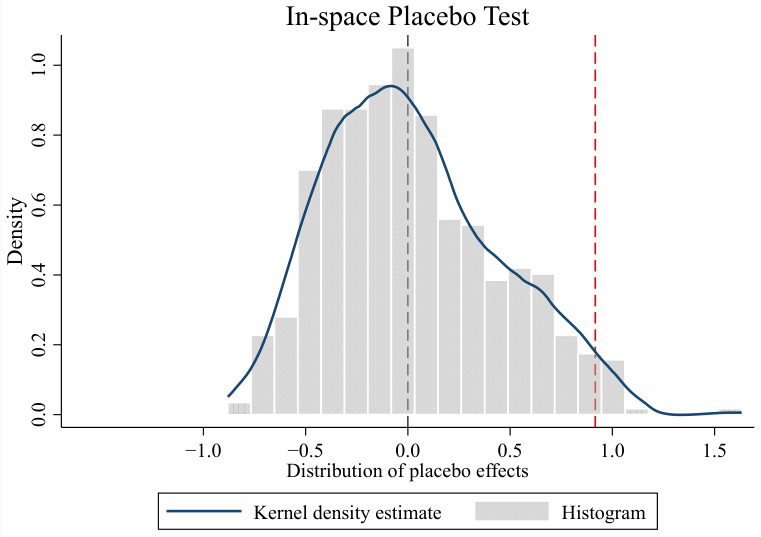
To exclude the possibility that our estimates reflect the influence of unobserved confounders or stochastic fluctuations rather than a genuine policy effect, we perform an in-space placebo exercise (Figure 2). Specifically, we randomly assign the treatment indicator across firms and re-estimate the baseline specification, repeating this procedure 500 times. If the estimated policy impact is spurious, we would expect the placebo coefficients to be centered around zero with no systematic departure.
The placebo coefficients are centered around zero, indicating that randomly assigned treatments produce no systematic effect. Our true estimate (0.916) lies in the right tail of this distribution. The two-sided p-value is 0.026, implying that only 2.6% of the random assignments produce placebo estimates larger in absolute magnitude than our true estimate. This provides strong evidence that our baseline results are unlikely to be driven by unobserved confounders.

4.3.3. PSM-DID

To address the issue of self-selection and to ensure that firms in the treatment and control groups are more comparable, we employ the propensity score matching technique in conjunction with the DID identification strategy (i.e., the PSM-DID estimator). Specifically, propensity score matching is first conducted to pair enterprises in the CETS pilot policy regions (treatment group) with similar enterprises in non-pilot regions (control group) based on observable characteristics, thereby reducing bias arising from sample heterogeneity. Subsequently, the DID model is applied to the matched sample to identify the net policy effect.
Adopting a one-to-one nearest neighbor matching protocol, we re-estimate the baseline model on the matched sample. As reported in Table 4, the coefficient on DID remains positive and statistically significant, consistent with the baseline findings, indicating that the documented policy effect is not driven by systematic differences in observable firm attributes across the treatment and control groups.

4.3.4. Alternative Estimation Strategy

To address the potential bias arising from heterogeneous treatment effects under staggered policy adoption, we complement our baseline two-way fixed effects estimates with the approach developed by Callaway and Sant’Anna [50]. This estimator constructs group-time average treatment effects and then aggregates them into an overall average treatment effect, thereby offering a more robust inference framework in settings with variation in treatment timing.
The estimated average treatment effect on the treated is 1.063 with a standard error of 0.621, yielding a z-statistic of 1.71 and a p-value of 0.087. The coefficient is positive and statistically significant at the 10% level, confirming the robustness of our baseline conclusion to the use of an estimator designed to handle staggered treatment adoption with heterogeneous treatment effects.

4.3.5. Excluding Controversial Samples

As an additional check on the sensitivity of our benchmark results, we re-estimate the model after removing certain observations that could blur the treatment effect (Table 5). First, we drop observations from Fujian province, as its pilot was initiated later than the others and differed in policy design. Second, we remove firms headquartered in municipalities directly under the central government (Beijing, Tianjin, Shanghai, and Chongqing), given their distinct institutional and economic characteristics. Third, we exclude observations from the year 2021, when the launch of the national carbon market may have generated anticipatory behavioral responses that could contaminate the pilot policy estimate.

4.4. Heterogeneity Analysis

4.4.1. Industrial Heterogeneity

To assess whether the policy effect differs across industries, we partition the sample into two groups according to firms’ direct exposure to the CETS pilot policy. The first group comprises firms in the eight high-emission sectors formally designated under the pilot scheme (petrochemicals, chemicals, building materials, iron and steel, non-ferrous metals, paper, power generation, and aviation). The second group contains all remaining firms operating in sectors not directly covered by the pilot regulations.
Columns (1) and (2) in Table 6 summarize the empirical findings for each of the two subgroup samples. A positive and statistically significant treatment effect (coefficient = 1.096, p < 0.05) is observed for firms outside the targeted sectors. For the eight high-emission sectors, however, the estimated coefficient is negative (−0.332) and statistically indistinguishable from zero (p = 0.777). The contrast between these two groups is striking: the positive innovation effect of the CETS pilot policy is entirely driven by firms in non-targeted sectors, while the directly targeted high-emission sectors show no significant response.
This finding suggests that the innovation-enhancing effect of the CETS pilot policy does not operate primarily through direct compliance pressure on regulated firms. Instead, it appears to work through indirect channels, such as capital market signals, shifts in investor preferences toward low-carbon firms, and supply chain transmission, which generate positive spillover effects on firms outside the directly regulated sectors. The insignificant coefficient for the high-emission sectors may reflect the crowding-out effect of compliance costs, which could offset innovation gains [51]. This interpretation is consistent with the lagged dynamic effects we observed in the event study, where the policy effect only became significant several years after implementation.

4.4.2. Regional Heterogeneity

As a check for regional heterogeneity, we conducted separate estimations of the baseline model for the eastern, central, and western regional subsamples, and report the findings in Columns (3)–(5) of Table 6.
The treatment effect varies markedly across regions. For the eastern region, the coefficient is 0.874 but insignificant at conventional levels (p = 0.140). The central region yields an estimate of −0.311, which is also not statistically significant (p = 0.664). In sharp contrast, the western region exhibits a pronounced and statistically significant positive impact, with an estimated coefficient of 1.022 (p < 0.01). Several potential explanations underlie this regional heterogeneity.
A heavier industrial structure with a predominance of energy-intensive and high-emission sectors is more typical of western regions. This pattern points to greater emission reduction potential and lower marginal abatement costs in the west, which in turn leaves more room for firms to adopt low-cost innovation strategies under carbon constraints. This line of reasoning aligns with the empirical finding that the impact of carbon trading on emissions reduction is most pronounced in the west, followed by the central region, while the eastern region exhibits the least effect [45].
Eastern regions, despite having more developed financial markets, stronger institutional environments, and higher technological capabilities, may already operate closer to the technological frontier, implying that the marginal innovation gains from additional regulatory pressure are smaller than in regions with greater catching-up potential [52]. In addition, eastern regions benefit from more mature green finance ecosystems and better access to external capital, which may have already facilitated green innovation even in the absence of the carbon market policy [53].
The insignificant result in the central region may reflect its institutional and economic position in China’s regional development landscape. Central China does not possess the institutional and financial advantages characteristic of the eastern regions, nor does it share the heavy industrial structure and targeted policy support received by the western regions. As a result, the central region may lack the combination of industrial pressure and institutional capacity necessary to generate a significant innovation response to the carbon market policy.

4.4.3. Capability-Dependent Heterogeneity

To examine whether firms’ innovation response to the CETS pilot policy depends on their baseline capabilities and the pre-existing conditions of their regions, we employ a triple differences (DDD) framework. We examine two heterogeneity dimensions: firm-level carbon performance (CCP) and region-level pollution control investment (IPC). To avoid post-treatment contamination, we use the 2012 values of these variables to construct the grouping indicators. For each dimension, a binary indicator marking high capability (above the sample mean) is created and interacted with the DID term. The coefficient on the triple interaction captures the differential policy impact between high- and low-capability groups.
Two moderating factors are examined in Table 7. In Column (1), which considers the moderating role of firm-level carbon performance, the interaction term DID×CCP_high is estimated to be positive and significant, suggesting that the positive innovation response to the CETS pilot is disproportionately driven by firms with higher initial environmental performance. Column (2) turns to regional pollution control investment. Here the interaction coefficient DID×IPC_high is positive and marginally significant, indicating that regions with more intensive past investment in pollution control experience a stronger policy effect. Viewed together, these findings point to a clear pattern: the innovation stimulus of the CETS pilot is substantially amplified where regulated entities already possess stronger baseline capabilities. This highlights that the effectiveness of market-based environmental instruments is strongly conditioned by the absorptive capacity and institutional maturity of the regulated actors.

4.5. Mechanism Analysis

To uncover the mechanisms linking the CETS pilot policy to green innovation, we investigate the distinct roles played by two categories of costs: operating costs and debt financing costs. We first estimate the policy’s effect on each cost variable individually, and then examine how these costs, in turn, shape green innovation when included together with the DID indicator in the outcome equation.
The impacts of the CETS pilot policy on two cost-related outcomes are reported in Table 8. Column (1) shows that the policy raises operating costs significantly, with a coefficient of 0.084 (p < 0.05). Column (2) demonstrates that financing costs also rise in response to the policy, as reflected by a coefficient of 0.013 (p < 0.01). These estimates jointly indicate that the pilot imposes significant cost burdens on firms, operating through both real operational channels and financial channels.
Column (3) presents the results when both cost variables are included alongside the DID indicator in the green innovation regression. The coefficient on operating costs (COC) is 0.446 (p < 0.05), which is positive and statistically significant, suggesting that rising operating costs induce innovation through cost-induced pressure. In contrast, the coefficient on debt financing costs (DFC) is −0.909 (p < 0.1), negative and marginally significant, indicating that rising financing costs crowd out innovation by constraining firms’ access to external capital. The coefficient on DID remains positive at 1.193 (p < 0.1), suggesting that the policy also operates through other channels beyond these two cost mechanisms.
Taken together, these results point to a dual-cost mechanism at work. The CETS pilot policy concurrently increases both operating costs and debt financing costs, but the two cost channels push green innovation in opposite directions: operating costs stimulate innovation through cost-induced pressure, whereas financing costs suppress innovation through a crowding-out channel. The overall positive net effect suggests that the innovation-promoting force of operating costs dominates the innovation-restraining force of financing costs.

5. Discussion

The divergent effects of operating costs and financing costs on innovation arise from their fundamentally different economic characteristics. Operating costs reflect the expenditures required to sustain prevailing production processes. When these costs escalate—driven by carbon allowance purchases, rising energy prices, or investments in emissions abatement equipment—firms encounter an immediate threat to their profit margins. This generates a powerful incentive to pursue efficiency gains, upgrade production technologies, and transition toward cleaner alternatives. Such is the core logic of the cost-induced innovation channel, consistent with the Porter Hypothesis [30]. Financing costs, on the other hand, represent the price of obtaining external capital. An increase in these costs constrains firms’ access to outside funding and raises debt servicing obligations. Innovation, and green innovation in particular, tend to be long-horizon, high-risk, and dependent on sustained R&D commitments, placing it among the most postponable categories of corporate expenditure. When capital grows scarcer or more expensive, R&D allocations are typically among the first to face reductions. This crowding-out pattern is well established in the corporate finance literature [54,55].
The innovation benefits of market-based regulation depend not only on regulatory design but also on the financial architecture within which firms operate. The net effect of carbon pricing is determined by whether the cost-induced pressure or the crowding-out channel dominates. This insight advances the Porter Hypothesis by specifying a boundary condition. The innovation compensation effect is more likely to materialize when firms have access to affordable external capital. Where financing constraints are severe, the crowding-out effect may partially or fully offset the innovation-inducing effect. The effectiveness of market-based environmental regulation is therefore co-determined by the financial system, suggesting that the Porter Hypothesis operates under specific institutional conditions.
The finding that the CETS pilot policy raises debt financing costs contrasts with several contemporary studies reporting a decline following CETS implementation [56,57]. This discrepancy likely reflects compositional heterogeneity in the policy’s effects. Research documenting lower financing costs generally concentrates on large, established enterprises with robust environmental credentials, or on firms operating in economically advanced regions with deep financial markets. For these entities, participation in CETS sends a favorable signal: it communicates environmental commitment, draws green investors, and narrows information asymmetries, thereby reducing the cost of borrowing. Our full-sample estimates, in contrast, capture the average outcome over a more diverse cross-section of firms, including small and medium-sized enterprises, firms in less developed regions, and those with limited capacity to convey their carbon performance to financial stakeholders. For these types of firms, CETS participation introduces regulatory uncertainty, imposes compliance burdens, and heightens perceived transition risks. Financial institutions may view CETS involvement as an incremental risk factor [58,59], particularly during the initial pilot period when carbon pricing mechanisms were still maturing and policy uncertainty remained elevated.
The structure of China’s financial system adds a further layer of complexity. Chinese banks exhibit a pronounced preference for lending to state-owned enterprises and firms with political connections [60], which are regarded as carrying lower default exposure and enjoying stronger government backing during periods of financial stress. Private enterprises, especially those of small and medium scale, confront tighter credit rationing and are more responsive to shifts in perceived risk. When CETS participation introduces regulatory uncertainty, banks may tighten credit conditions for these firms to a greater degree than for state-owned enterprises, thereby magnifying the financing cost effect.
The nonlinear relationship between carbon prices and firm-level outcomes finds additional corroboration in evidence drawn from the EU ETS. Ferreras [61] demonstrates that while moderate carbon prices enhance the valuation benefits of corporate environmental performance, excessively high prices erode and, under extreme conditions, reverse these gains through investment postponement, displacement of productive resources, and heightened investor uncertainty. This suggests that irrespective of the specific institutional setting, when carbon prices impose disproportionate financial strain, the crowding-out dynamic can overwhelm the innovation-promoting mechanism, thereby defeating the fundamental objective of the carbon market.

6. Conclusions

This study investigates the effect of China’s carbon emission trading scheme pilot policy on corporate green innovation, leveraging a panel dataset of Chinese listed firms. Applying a staggered DID strategy, we find that the CETS pilot policy significantly advances green innovation. This conclusion withstands an extensive battery of robustness tests, including parallel trends verification, placebo experiments, PSM-DID estimation, the Callaway and Sant’Anna estimator, and the removal of potentially problematic sample segments.
The principal findings can be distilled as follows. First, the policy effect displays a marked spillover pattern: the positive innovation response is concentrated among enterprises in non-regulated industries, while firms in the directly targeted high-emission sectors show no statistically significant reaction. Second, the analysis of regional heterogeneity indicates that the policy effect is most substantial and precisely estimated in the western region, and statistically indistinguishable from zero in the eastern and central regions. Third, the policy effect is capability-dependent: firms and regions endowed with superior baseline carbon performance and greater investments in pollution control exhibit amplified innovation responses. Fourth, we identify a dual-cost mechanism through which the policy operates. The CETS pilot policy concurrently raises operating costs and debt financing costs, yet these two cost channels push green innovation in opposing directions. Operating costs stimulate innovation via cost-induced pressure, whereas financing costs deter innovation through a crowding-out channel. The overall positive net effect implies that the innovation-encouraging force of operating costs dominates the innovation-discouraging force of financing costs.
These results carry a number of actionable implications for policy formulation. First, in light of the lagged dynamics, policymakers should prioritize policy continuity and deliver clear, forward-looking price trajectories so that the innovation compensation effect has sufficient time to emerge. Second, supplementary measures that lower the cost of green finance—such as subsidized green credit lines, guarantees for green bonds, and directed lending facilities for low-carbon projects—can reinforce the innovation dividends of the CETS. Third, differentiated support strategies are warranted: firms and regions with weaker baseline capabilities require greater access to technical assistance and institutional capacity-building. Fourth, the design of policy evaluation frameworks should incorporate spillover effects propagated through supply chain linkages and capital market channels, rather than being confined to the directly regulated segments.
Several caveats should be noted. First, our measure of green technological innovation relies exclusively on the count of green patent applications, which captures the volume rather than the quality or economic significance of innovation. Subsequent research could augment patent-count metrics with citation-weighted indicators, granted patent data, or firm-level innovation surveys. Second, the scope of our analysis is limited to the pilot phase of China’s CETS; the longer-run consequences of the nationwide carbon market remain to be assessed as additional post-2021 data accumulate. Third, although we document the dual-cost mechanism as an important transmission pathway, we are unable to observe firms’ financing decisions or innovation choices at a granular level, and the mechanism analysis should accordingly be regarded as yielding suggestive rather than definitively causal evidence. Fourth, our empirical analysis and conclusions are confined to the context of China’s CETS pilot. While we draw on evidence from the EU ETS in Section 5 to highlight similarities in the underlying mechanisms, we do not conduct formal cross-market comparisons. Future research could incorporate more comprehensive data from multiple carbon markets to assess the generalizability across different institutional contexts.

Author Contributions

Conceptualization, Y.X. and Z.Y.; methodology, Y.X., X.Z. and Z.Y.; validation, X.Z. and Z.Y.; formal analysis, X.Z., Z.Y. and Y.Z.; investigation, X.Z., Z.Y. and Y.Z.; writing—original draft preparation, Y.X., X.Z. and Z.Y.; funding acquisition, Y.X. All authors have read and agreed to the published version of the manuscript.

Funding

This research was funded by the Fundamental Research Funds for the Central Universities (KG16445501).

Institutional Review Board Statement

Not applicable.

Informed Consent Statement

Not applicable.

Data Availability Statement

The data are available from the Wind database.

Conflicts of Interest

The authors declare no conflicts of interest.

Abbreviations

The following abbreviations are used in this manuscript:
CETSCarbon emission trading scheme
GTIGreen technological innovation
DIDDifference-in-differences
PSM-DIDPropensity score matching combined with the difference-in-differences
DDDDifference-in-difference-in-differences

References

  1. National Bureau of Statistics of China. Statistical Communiqué of the People‘s Republic of China on the 2024 National Economic and Social Development. Available online: https://www.stats.gov.cn/english/PressRelease/202502/t20250228_1958822.html (accessed on 9 May 2026).
  2. Wang, J.X.; Xia, Q.; Liu, T.H.; Sun, G.C. Implementation status of China’s carbon market and its optimization suggestions. Environ. Monit. China 2025, 41, 8–14. [Google Scholar] [CrossRef]
  3. Tang, M.; Ma, W.; Shao, S. Carbon Emission Trading Scheme, Induced Technological Change, and Green Innovation: Evidence from Listed Companies in China. Energy Policy 2026, 215, 115335. [Google Scholar] [CrossRef]
  4. Wang, Y.; Zhou, R. Can Carbon Emission Trading Policies Promote the Withdrawal of Government Subsidies and the Green Development of Enterprises? Empirical Evidence from China’s a-Share Market. Humanit. Soc. Sci. Commun. 2024, 11, 1723. [Google Scholar] [CrossRef]
  5. Cheng, Z.; Wang, L. The Impact of Carbon Emission Trading Schemes on Corporate Green Innovation. J. Clean. Prod. 2025, 514, 145792. [Google Scholar] [CrossRef]
  6. Xu, J.R.; Tong, X.J.; Yang, B.C. The Spatial Spillover Effect of Carbon Emission Trading Scheme on Green Innovation in China’s Cities. Ann. Reg. Sci. 2024, 73, 639–669. [Google Scholar] [CrossRef]
  7. Zhong, W.W.; Yan, Z.; Xu, W.J. False Booms in Green Innovation: Evidence from China’s Carbon Emissions Trading and Smart City Dual-Pilot Policy. Appl. Econ. Lett. 2026; in press. [CrossRef]
  8. Ren, Z.; Zhu, Y. Research on the Impact of Carbon Trading System on Green Innovation of Enterprises: A Quasi-Natural Experiment Based on China’s Carbon Emission Trading Pilot. J. Chongqing Jiaotong Univ. (Soc. Sci. Ed.) 2026, 26, 96–113. [Google Scholar] [CrossRef]
  9. Jiang, X.; Xu, J.; Ma, R.; Akbar, A.; Sokolova, M. Carbon Emission Trading Policy and Green Technological Innovation in Chinese Listed Companies: A Corporate Reputation Perspective. E&M Econ. Manag. 2025, 28, 49–66. [Google Scholar] [CrossRef]
  10. Zhao, T.; Ke, H.; Zhang, N. Comparing the Innovation Impacts on Firms: Pilot vs. National Carbon. Emission Trading Schemes in China. Appl. Energy 2025, 377, 124414. [Google Scholar] [CrossRef]
  11. Lv, J.; Lv, Y.Q.; Yang, P.; Chen, J. Whether carbon emissions trading policy promotes “quantity and quality upgrading” of green technological innovations by firms? Ecol. Econ. 2025, 41, 75–85. [Google Scholar] [CrossRef]
  12. Jiang, H.; Liu, Z.; Chen, Z. The Effects of Carbon Emission Rights Trading Pilot Policy on Corporate Green Innovation: Evidence from PSM-DID and Policy Insights. Sustainability 2026, 18, 1207. [Google Scholar] [CrossRef]
  13. Wang, L.; Long, Y.; Li, C. Research on the Impact Mechanism of Heterogeneous Environmental Regulation on Enterprise Green Technology Innovation. J. Environ. Manag. 2022, 322, 116127. [Google Scholar] [CrossRef] [PubMed]
  14. Liu, J.; Zhao, M.; Zhang, C.; Ren, F. Analysis of the Influence of Heterogeneous Environmental Regulation on Green Technology Innovation. Sustainability 2023, 15, 3649. [Google Scholar] [CrossRef]
  15. Borsatto, J.M.L.S.; Amui, L.B.L. Green Innovation: Unfolding the Relation with Environmental Regulations and Competitiveness. Resour. Conserv. Recycl. 2019, 149, 445–454. [Google Scholar] [CrossRef]
  16. Kesidou, E.; Wu, L. Stringency of Environmental Regulation and Eco-Innovation: Evidence from the Eleventh Five-Year Plan and Green Patents. Econ. Lett. 2020, 190, 109090. [Google Scholar] [CrossRef]
  17. Shen, C.; Li, S.; Wang, X.; Liao, Z. The Effect of Environmental Policy Tools on Regional Green Innovation: Evidence from China. J. Clean. Prod. 2020, 254, 120122. [Google Scholar] [CrossRef]
  18. Li, D.; Tang, F.; Jiang, J. Does Environmental Management System Foster Corporate Green Innovation? The Moderating Effect of Environmental Regulation. Technol. Anal. Strateg. Manag. 2019, 31, 1242–1256. [Google Scholar] [CrossRef]
  19. Abu Seman, N.A.; Govindan, K.; Mardani, A.; Zakuan, N.; Mat Saman, M.Z.; Hooker, R.E.; Ozkul, S. The Mediating Effect of Green Innovation on the Relationship between Green Supply Chain Management and Environmental Performance. J. Clean. Prod. 2019, 229, 115–127. [Google Scholar] [CrossRef]
  20. Amore, M.D.; Bennedsen, M. Corporate Governance and Green Innovation. J. Environ. Econ. Manag. 2016, 75, 54–72. [Google Scholar] [CrossRef]
  21. Song, M.; Yang, M.X.; Zeng, K.J.; Feng, W. Green Knowledge Sharing, Stakeholder Pressure, Absorptive Capacity, and Green Innovation: Evidence from Chinese Manufacturing Firms. Bus. Strategy Environ. 2020, 29, 1517–1531. [Google Scholar] [CrossRef]
  22. Zhao, L.; Zhang, L.; Sun, J.; He, P. Can Public Participation Constraints Promote Green Technological Innovation of Chinese Enterprises? The Moderating Role of Government Environmental Regulatory Enforcement. Technol. Forecast. Soc. Change 2022, 174, 121198. [Google Scholar] [CrossRef]
  23. Dai, J.; Cantor, D.E.; Montabon, F.L. How Environmental Management Competitive Pressure Affects a Focal Firm’s Environmental Innovation Activities: A Green Supply Chain Perspective. J. Bus. Logist. 2015, 36, 242–259. [Google Scholar] [CrossRef]
  24. Zhou, M.; Govindan, K.; Xie, X. How Fairness Perceptions, Embeddedness, and Knowledge Sharing Drive Green Innovation in Sustainable Supply Chains: An Equity Theory and Network Perspective to Achieve Sustainable Development Goals. J. Clean. Prod. 2020, 260, 120950. [Google Scholar] [CrossRef]
  25. Yang, Z.; Lin, Y. The Effects of Supply Chain Collaboration on Green Innovation Performance:An Interpretive Structural Modeling Analysis. Sustain. Prod. Consum. 2020, 23, 1–10. [Google Scholar] [CrossRef]
  26. Palmer, K.; Oates, W.E.; Portney, P.R. Tightening Environmental Standards: The Benefit-Cost or the No-Cost Paradigm? J. Econ. Perspect. 1995, 9, 119–132. [Google Scholar] [CrossRef]
  27. Copeland, B.R.; Taylor, M.S. Trade, Growth, and the Environment. J. Econ. Lit. 2004, 42, 7–71. [Google Scholar] [CrossRef]
  28. Ben Kheder, S.; Zugravu, N. Environmental Regulation and French Firms Location Abroad: An Economic Geography Model in an International Comparative Study. Ecol. Econ. 2012, 77, 48–61. [Google Scholar] [CrossRef]
  29. Peng, N.; Zhang, X. The Impact of Environmental Regulations on the Location Choice of Newly Built Polluting Firms: Based on the Perspective of New Economic Geography. Environ. Sci. Pollut. Res. 2022, 29, 59802–59815. [Google Scholar] [CrossRef] [PubMed]
  30. Porter, M.E.; van der Linde, C. Toward a New Conception of the Environment-Competitiveness Relationship. J. Econ. Perspect. 1995, 9, 97–118. [Google Scholar] [CrossRef]
  31. Cainelli, G.; De Marchi, V.; Grandinetti, R. Does the Development of Environmental Innovation Require Different Resources? Evidence from Spanish Manufacturing Firms. J. Clean. Prod. 2015, 94, 211–220. [Google Scholar] [CrossRef]
  32. Petroni, G.; Bigliardi, B.; Galati, F. Rethinking the Porter Hypothesis: The Underappreciated Importance of Value Appropriation and Pollution Intensity. Rev. Policy Res. 2019, 36, 121–140. [Google Scholar] [CrossRef]
  33. Jiang, Y.; Zhang, Z.; Xie, G. Emission Reduction Effects of Vertical Environmental Regulation: Capacity Transfer or Energy Intensity Reduction? Evidence from a Quasi-Natural Experiment in China. J. Environ. Manag. 2022, 323, 116180. [Google Scholar] [CrossRef] [PubMed]
  34. Zhang, B.; Wang, N.; Yan, Z.; Sun, C. Does a Mandatory Cleaner Production Audit Have a Synergistic Effect on Reducing Pollution and Carbon Emissions? Energy Policy 2023, 182, 113766. [Google Scholar] [CrossRef]
  35. Zhu, X.; Zuo, X.; Li, H. The Dual Effects of Heterogeneous Environmental Regulation on the Technological Innovation of Chinese Steel Enterprises—Based on a High-Dimensional Fixed Effects Model. Ecol. Econ. 2021, 188, 107113. [Google Scholar] [CrossRef]
  36. Lodi, C.; Bertarelli, S. Eco-Innovation and Exports in Heterogeneous Firms: Pollution Haven Effect and Porter Hypothesis as Competing Theories. Econ. Innov. New Technol. 2023, 32, 923–952. [Google Scholar] [CrossRef]
  37. Gebhardt, S.; Hou, Y.; Yarime, M. Directing Environmental Innovation toward Radical Clean Technologies for Sustainable Transitions: Market-Based vs. Command-and-Control Policies. Res. Policy 2026, 55, 105446. [Google Scholar] [CrossRef]
  38. Song, M.; Wang, S.; Zhang, H. Could Environmental Regulation and R&D Tax Incentives Affect Green Product Innovation? J. Clean. Prod. 2020, 258, 120849. [Google Scholar] [CrossRef]
  39. Guo, L.; Du, C.; Tan, W. Research on the Impact of Environmental Regulation on Green Technology Innovation from the Perspective of Innovation Investment. SAGE Open 2025, 15, 21582440251337327. [Google Scholar] [CrossRef]
  40. Jiang, Z.; Wang, Z.; Lan, X. How Environmental Regulations Affect Corporate Innovation? The Coupling Mechanism of Mandatory Rules and Voluntary Management. Technol. Soc. 2021, 65, 101575. [Google Scholar] [CrossRef]
  41. Liu, B.; Cifuentes-Faura, J.; Ding, C.J.; Liu, X. Toward Carbon Neutrality: How Will Environmental Regulatory Policies Affect Corporate Green Innovation? Econ. Anal. Policy 2023, 80, 1006–1020. [Google Scholar] [CrossRef]
  42. Zhang, J.; Li, S. The Impact of Human Capital on Green Technology Innovation—Moderating Role of Environmental Regulations. Int. J. Environ. Res. Public Health 2023, 20, 4803. [Google Scholar] [CrossRef] [PubMed]
  43. Xu, P.Q.; Fang, S. Advanced Human Capital, Credit Resource Misallocation, and Corporate Sustainable Development Performance. Financ. Res. Lett. 2026, 92, 109342. [Google Scholar] [CrossRef]
  44. Zhao, S.; Boubaker, S.; Hunjra, A.I.; Yang, P. Impact of Energy Restructuring on Green Technology Innovation in the Context of Climate Policy Uncertainty. Emerg. Mark. Rev. 2025, 69, 101377. [Google Scholar] [CrossRef]
  45. Chen, Y.; Ding, Z.; Cai, X.; Tang, Y.; Wang, J. Study on the synergistic governance effect of carbon emission trading policy on pollution reduction and carbon reduction. China Resour. Compr. Util. 2025, 43, 194–200. [Google Scholar] [CrossRef]
  46. Wang, D.; Sun, M.; Meng, B.; An, Y.; Cheng, W.; Ye, B. Can Carbon Market Efficiency Promote Green Technology Innovation for Chinese Companies? Energy 2024, 309, 133157. [Google Scholar] [CrossRef]
  47. Fang, L.; Li, Z. Corporate Digitalization and Green Innovation: Evidence from Textual Analysis of Firm Annual Reports and Corporate Green Patent Data in China. Bus. Strategy Environ. 2024, 33, 3936–3964. [Google Scholar] [CrossRef]
  48. He, Y. Impact and mechanism of carbon trading market on firms’ innovation strategies. China Popul. Resour. Environ. 2022, 32, 37–48. [Google Scholar] [CrossRef]
  49. Cong, J.H.; Zhang, W.Q.; Guo, H.J.; Zhao, Y.B. Possible Green-Technology Innovation Motivated by China’s Pilot Carbon Market: New Evidence from City Panel Data. Clim. Policy 2024, 24, 558–571. [Google Scholar] [CrossRef]
  50. Callaway, B.; Sant’Anna, P.H.C. Difference-in-Differences with Multiple Time Periods. J. Econom. 2021, 225, 200–230. [Google Scholar] [CrossRef]
  51. Li, T.; Meng, X.; Wang, L.; Gong, Y. Will China’s Carbon Emission Trading Regulation Really Decrease the Green Investment of Firms? A Microperspective on Corporate Governance. Bus. Strategy Environ. 2025, 34, 2222–2238. [Google Scholar] [CrossRef]
  52. Yin, X.; Xu, B.; Li, J.; Wu, J. Environmental Technology’s Diminishing Marginal Returns: A Study of Green Patents and Emission Reductions in China. Front. Environ. Sci. 2025, 13, 1524824. [Google Scholar] [CrossRef]
  53. Wu, Y.; Sun, H.; Zhang, L.; Cui, C. Green Investment and Quality of Economic Development: Evidence from China. Int. Rev. Financ. Anal. 2025, 103, 104147. [Google Scholar] [CrossRef]
  54. Hall, B.H. The Financing of Research and Development. Oxf. Rev. Econ. Policy 2002, 18, 35–51. [Google Scholar] [CrossRef]
  55. Liu, S.; Liu, H.M.; Chen, X.Y. Does Environmental Regulation Promote Corporate Green Investment? Evidence from China’s New Environmental Protection Law. Environ. Dev. Sustain. 2024, 26, 12589–12618. [Google Scholar] [CrossRef]
  56. Wei, X.; Sun, C. Carbon emissions trading scheme, administrative intervention and carbon reduction financing gains for carbon-intensive firms. Financ. Trade Econ. 2025, 46, 149–164. [Google Scholar] [CrossRef]
  57. Tan, Z.; Liu, F.; Du, J.; Yu, T. Do Carbon Trading Policies Affect Bond Financing Costs for High-Polluting Firms? Evidence from China. Emerg. Mark. Financ. Trade 2026, 62, 1605–1622. [Google Scholar] [CrossRef]
  58. Huang, N.; He, R.; Luo, L.; Shen, H.T. Carbon Emission Trading Scheme and Firm Debt Financing. J. Contemp. Account. Econ. 2024, 20, 100384. [Google Scholar] [CrossRef]
  59. Ma, Y.N.; Wang, S.; Zhang, N.; Choi, Y. Does China’s Carbon Emission Trading Scheme Policy Exacerbate Financing Costs for Enterprises? Energy Econ. 2025, 149, 108789. [Google Scholar] [CrossRef]
  60. Li, C.; Huang, Y.; Li, Y. Can state-owned enterprise reform and interest rate marketization improve non-state-owned enterprises’ financing difficulties? J. Financ. Econ. Res. 2014, 29, 97–106. [Google Scholar]
  61. Ferreras, A. When the Remedy Is Worse than the Illness: Carbon Performance and Growth Opportunities under the EU ETS. Bus. Strategy Environ. 2026; in press. [CrossRef]
Figure 1. Parallel trends test results.
Sustainability 18 07955 g001
Figure 2. Placebo test results.
Sustainability 18 07955 g002
Table 1. Variable definitions.
TypeVariableSignDefinitions
Dependent variableGreen technological innovationGTIThe number of green patent applications
Independent variableThe CETS pilot policyDIDFirms located in pilot areas are defined as 1, and otherwise as 0
Control variablesHuman capitalHCThe number of students enrolled in institutions of higher education/The total population in the region
Energy structureESProportion of electricity consumption in the national total
Industrial added valueIAVTotal industrial added value of the region (in 100 million yuan)
Other variablesCorporate carbon performanceCCPReciprocal of total carbon emissions per million yuan of net sales
Investment in industrial pollution controlIPCCompleted investment in industrial pollution control (in 100 million yuan)
Corporate operating costCOCLog of total operating cost of the enterprise
Corporate debt financing costDFCFinancial expenses/Total liabilities at year-end
Table 2. Descriptive statistics of the sample characteristics.
VariablesNMeanSDMinMax
GTI47,6981.80413.1070941
DID47,6980.3110.46301
HC47,6980.0200.00700.044
ES47,6980.2670.42703.927
IAV47,6981.8311.3580.0034.924
CCP33,1030.3990.62703.915
IPC33,10326.37522.7840141.646
COC34,59711.9801.6120.10619.651
DFC46,1490.0030.054−2.4550.947
Table 3. Baseline results.
Variables(1)(2)(3)(4)
GTIGTIGTIGTI
DID1.350 ***1.137 ***0.877 **0.916 **
(0.129)(0.136)(0.426)(0.411)
HC 30.770 *** 47.656
(8.705) (36.897)
ES −0.094 0.055
(0.143) (0.117)
IAV 0.222 *** 0.146
(0.045) (0.208)
Constant1.384 ***0.449 **1.531 ***0.278
(0.072)(0.204)(0.123)(0.822)
Observations47,69847,69847,69847,698
R-squared0.0020.0030.5990.599
Year fixed effectsNONOYesYes
Firm fixed effectsNONOYesYes
Note: ** and *** represent the significance levels of 5%, and 1%, respectively.
Table 4. PSM-DID results.
Variables(1)
GTI
DID1.011 **
(0.452)
HC60.732
(42.151)
ES−0.223
(0.990)
IAV0.110
(0.197)
Constant0.125
(0.930)
Observations40,574
R-squared0.609
Year fixed effectsYes
Firm fixed effectsYes
Note: ** represents the significance levels of 5%.
Table 5. The results of excluding the controversial samples.
Variables(1)(2)(3)
Excluding Fujian SamplesExcluding Municipal SamplesRestricting the Samples Before 2021
DID0.904 **1.220 ***0.832 *
(0.418)(0.361)(0.454)
Constant0.3761.505 *−0.294
(0.817)(0.816)(1.254)
Observations46,01438,26433,299
R-squared0.5950.5810.572
Control variablesYesYesYes
Year fixed effectsYesYesYes
Firm fixed effectsYesYesYes
Note: *, ** and *** represent the significance levels of 10%, 5%, and 1%, respectively.
Table 6. Industrial and regional heterogeneity analysis results.
Variables(1)(2)(3)(4)(5)
Targeted IndustriesNon-Targeted IndustriesEast AreaCentral AreaWest Area
DID1.096 **−0.3320.874−0.3111.022 ***
(0.440)(1.160)(0.545)(0.686)(0.261)
Constant−0.1511.794−0.490−1.1380.866
(1.118)(2.410)(1.505)(1.549)(1.175)
Observations39,885778733,79976076275
R-squared0.6100.3790.6100.5270.443
Control variablesYesYesYesYesYes
Year fixed effectsYesYesYesYesYes
Individual fixed effectsYesYesYesYesYes
Note: ** and *** represent the significance levels of 5%, and 1%, respectively.
Table 7. Capability-dependent heterogeneity analysis results.
Variables(1)(2)
GTIGTI
DID×CCP_high1.762 **
(0.665)
DID×IPC_high 0.853 *
(0.497)
Constant0.3560.497
(0.859)(0.790)
R-squared0.5760.576
Control variablesYesYes
Year fixed effectsYesYes
Individual fixed effectsYesYes
Note: * and ** represent the significance levels of 10%, and 5%, respectively.
Table 8. Mechanism analysis results.
Variables(1)(2)(3)
COCDFCGTI
DID0.084 **0.013 ***1.193 *
(0.041)(0.004)(0.597)
COC 0.446 **
(0.165)
DFC −0.909 *
(0.513)
Constant11.943 ***0.007−4.707 *
(0.100)(0.012)(2.335)
Observations34,59746,14934,334
R-squared0.8960.4260.600
Control variablesYesYesYes
Year fixed effectsYesYesYes
Individual fixed effectsYesYesYes
Note: *, ** and *** represent the significance levels of 10%, 5%, and 1%, respectively.
Disclaimer/Publisher’s Note: The statements, opinions and data contained in all publications are solely those of the individual author(s) and contributor(s) and not of MDPI and/or the editor(s). MDPI and/or the editor(s) disclaim responsibility for any injury to people or property resulting from any ideas, methods, instructions or products referred to in the content.