Article

Spatiotemporal Patterns of Soil Moisture Drought Across Different Soil Layers and Their Relationships with Ecosystem Water Use Efficiency and Resilience in the Three-North Shelterbelt Forest Program Region

1
Key Laboratory of National Forestry and Grassland Administration on Sandy Biological Resources Conservation, Cultivation and Utilization, Inner Mongolia Academy of Forestry Sciences, Hohhot 010010, China
2
School of Geography and Tourism, Shaanxi Normal University, Xi’an 710119, China
*
Author to whom correspondence should be addressed.
Sustainability 2026, 18(15), 7771; https://doi.org/10.3390/su18157771
Submission received: 25 April 2026 / Revised: 9 June 2026 / Accepted: 23 July 2026 / Published: 31 July 2026
(This article belongs to the Special Issue Sustainability in Hydrology and Water Resources Management)

Abstract

Ecosystem water use efficiency (WUE) is a key indicator of carbon–water coupling in ecosystems under climate change. While WUE responses to meteorological droughts are well-documented, the influence of different soil layers on WUE across vegetation types in water-limited regions remains unclear. Based on ERA5-Land soil moisture and MODIS vegetation products, this study investigates the spatiotemporal variations in soil moisture indices (SSMI) across three soil layers and their synchronous, lagged, and cumulative associations with WUE and resilience in the Three-North Shelterbelt Forest Program (TNSFP) region from 2001 to 2022. Our results showed that while the shallow and middle layers exhibited general wetting trends, the deep soil layer (100–289 cm) underwent continuous depletion in 56.01% of the study area. WUE showed weak synchronous responses to soil moisture drought across all layers, with no significant threshold effect. However, the lag and cumulative associations increased with soil depth, from 3–6 months in shallow layers to 9–12 months in deep layers, suggesting that deep-layer soil moisture may reflect longer-term ecohydrological stress and delayed ecosystem responses. Ecological resilience (Rd) differed by vegetation type. Grasslands were resilient to shallow drought but vulnerable to deep moisture deficits, while forests maintained stability under deep stress. These findings emphasize the importance of aligning vegetation configuration with soil water availability in restoration efforts, providing critical insights for sustainable water resource management and forest rehabilitation.

1. Introduction

Ecosystem water use efficiency (WUE), defined as the ratio of gross primary productivity (GPP) to evapotranspiration (ET), serves as a pivotal indicator of the coupling between carbon and water cycles in terrestrial ecosystems [1]. It reflects the trade-off between photosynthetic carbon uptake and water loss, thereby encapsulating the integrated responses of vegetation to environmental changes [2,3]. Under the background of global climate change, drought events have become more frequent and intense [4], posing severe threats to the stability of terrestrial ecosystems and the coupling of carbon–water cycles [5]. Drought directly alters soil moisture availability and atmospheric water demand, subsequently influencing plant physiological processes such as stomatal conductance, photosynthesis, and transpiration [6]. Therefore, understanding how WUE responds to drought is necessary for predicting ecosystem resilience, guiding sustainable water resource management, and supporting the sustainability of ecological restoration under changing climates.
Atmospheric vapor pressure deficit and soil moisture are extensively reported as the most significant environmental factors driving water movement and affecting photosynthesis and WUE [7,8]. Drought is a common hydrometeorological phenomenon [9], which can be broadly classified into meteorological drought, soil moisture drought, hydrological drought, and ecological drought [10]. In recent years, the responses of WUE to meteorological drought have been comprehensively explored. Yu et al. [11] integrated global-scale WUE data with the multi-temporal SPEI to systematically quantify the lagged and cumulative associations between drought and WUE. Liu et al. [12] utilized the SPEI at different scales to examine the temporal relationships between meteorological drought and WUE across three climate zones in the Yellow River Basin. Meanwhile, recent increasing evidence suggests that soil moisture drought is strongly associated with ecosystem productivity and water use [13,14]. Stocker et al. [15] found that a decline in soil moisture has the potential to reduce GPP by as much as 40% in water-constrained regions. In tropical rainforests, soil moisture drought shows a stronger association with ET than with photosynthesis, and WUE exhibits an increase under drought conditions [16]. However, most studies have focused on shallow soil moisture drought, while the comparison in dynamics of soil moisture drought across different soil layers and their long-term cumulative and lagged effects on ecosystem WUE remains unclear.
The influence of soil moisture on WUE may differ markedly between different soil layers [17]. Unlike shallow soil moisture, which fluctuates drastically with short-term precipitation pulses and evaporation, deep soil moisture maintains relatively stable content due to weak vertical migration and slow exchange with the atmosphere [18]. Vegetation with deep root systems, such as forests and woody shrubs, relies heavily on deep soil moisture to maintain photosynthetic capacity and transpiration balance [19]. Given the slower depletion and replenishment of deep soil moisture, drought signals in this layer may be associated with longer lagged and cumulative responses of WUE [20,21]. Furthermore, vegetation types differ in their stomatal regulation and carbon–water trade-off strategies [11]. Therefore, it is essential to systematically investigate the long-term cumulative and lagged associations between soil moisture drought and ecosystem WUE under different vegetation types.
The Three-North Shelterbelt Forest Program (TNSFP) represents one of the world’s largest ecological restoration projects, spanning arid, semi-arid, and semi-humid regions across northern China. As an important ecological barrier, the region’s ecosystem stability is closely related to regional water security and ecological balance [22]. Previous studies have shown that the TNSFP region has experienced significant vegetation greening in recent decades, which may be associated with changes in soil moisture consumption and ecosystem resilience [23]. However, how soil moisture drought across different layers is associated with variations in carbon–water cycle components (ET, GPP and WUE) through lagged and cumulative effects, and whether different vegetation types exhibit divergent resilience patterns are still lacking.
To address these knowledge gaps and provide scientific support for sustainable ecological restoration, this study explores the spatiotemporal patterns of soil moisture drought across three distinct layers, including shallow (0–28 cm), middle (28–100 cm), and deep (100–289 cm) layers in the TNSFP region from 2001 to 2022. The Standardized Soil Moisture Index (SSMI) was used to characterize soil moisture drought in this study. Compared with meteorological drought indices, SSMI directly reflects soil moisture anomalies relative to long-term normal conditions and can be calculated for different soil layers. Therefore, it is suitable for examining vertical differences in soil moisture drought and their relationships with ecosystem WUE. The specific objectives are to: (1) compare the relationships between WUE and soil moisture drought across multiple soil layers; (2) identify the soil layer most strongly associated with WUE in different vegetation types; (3) characterize the spatiotemporal patterns, lagged and cumulative associations of drought in these layers; and (4) assess the resilience of ecosystems to soil moisture drought stresses. To direct these objectives, we formulated four testable hypotheses: (1) soil moisture drought trends differ among shallow, middle, and deep soil layers; (2) the relationship between WUE and SSMI becomes more delayed and cumulative with increasing soil depth; (3) woody vegetation may show longer lagged and cumulative associations with deep soil moisture drought than herbaceous vegetation; (4) ecosystem resilience may differ among vegetation types and drought severities.

2. Materials and Methods

2.1. Study Area

The TNSFP region encompasses 13 provincial-level administrative divisions in the northeastern, northern, and northwestern parts of China (33°30′ N–50°12′ N, 73°26′ E–127°50′ E), covering approximately 4,069,000 km2. The terrain in this region decreases from west to east with relatively complex topography. Most of the region has an annual mean air temperature ranging from 2 °C to 11 °C and annual precipitation ranging from 50 mm to 800 mm. It is characterized by an arid and semi-arid monsoon climate, limited water resources, and frequent sand and dust storms [24]. Since the project was launched, good results have been achieved in the construction of forest and grassland vegetation and the control of desertification. According to the MODIS Land Cover Type Product (MCD12Q1), the vegetated area accounts for 59.392% of the TNSFP region (Figure 1). The study area consists of various predominant vegetation types, including needleleaf forests (NF, 0.384%), broadleaf forests (BF, 4.672%), mixed forests (MF, 0.461%), shrublands (SHR, 0.078%), savannas (SAV, 4.013%), grasslands (GRA, 36.073%), and croplands (CRO, 13.711%).

2.2. Data and Processing

2.2.1. Soil Moisture Drought Index

Soil moisture data from 2001 to 2022 were obtained from the ERA5-Land reanalysis dataset (https://apps.ecmwf.int/datasets/, accessed on 10 December 2025). The ERA5-Land soil moisture data have a spatial resolution of 0.1° and include four soil layers: 0–7 cm, 7–28 cm, 28–100 cm, and 100–289 cm. Daily data were averaged to derive monthly soil moisture. ERA5-Land was selected because it provides long-term, spatially continuous, and vertically stratified soil moisture data, which are suitable for analyzing soil moisture drought across different soil layers at regional scale [25]. ERA5-Land dataset has been widely used to investigate soil water dynamics across shallow, intermediate, and deep soil layers, and its reliability in China has been supported by previous studies [18]. In the dry zone of Central Asia, these datasets were validated against ISMN in situ observations, showing a significant relationship between ERA5-Land soil moisture and field measurements [19].
This study divided the soil profiles into three layers to investigate soil moisture droughts, including the shallow soil layer (0–28 cm), the middle soil layer (28–100 cm), and the deep soil layer (100–289 cm). The original ERA5-Land 0–7 cm and 7–28 cm layers were combined into the shallow layer (0–28 cm) using the thickness-weighted averaging method. The Standardized Soil Moisture Index (SSMI) provides valuable information about soil moisture droughts that might not be apparent through other drought indices [26]. The corresponding SSMI values were denoted as SSMI-1 for 0–28 cm, SSMI-2 for 28–100 cm, and SSMI-3 for 100–289 cm, and were calculated as follows:
S S M I   =   S M i j S M ¯ i σ
where SMij is the monthly soil moisture value for the ith month in j year, and SMi is the mean soil moisture value for the ith month of the multiyear period from 2001 to 2022. According to previous studies [27], SSMI < 0 was used in this study to identify below-normal soil moisture conditions.

2.2.2. Vegetation Characteristics

Vegetation water use efficiency (WUE) is defined as the ratio of gross primary productivity (GPP) to actual evapotranspiration (ET). The monthly NDVI dataset from 2001 to 2022 was derived from the MOD13A3 Version 6.1 product. Monthly GPP and ET were generated from the 8-day composite MOD17A2H Version 6.1 and MOD16A2 Version 6.1 products, respectively, both of which are available at a 500 m spatial resolution. MOD17A2H provides 8-day gross primary productivity, while MOD16A2 provides 8-day actual evapotranspiration estimates based on the Penman-Monteith framework. To obtain monthly totals, the 8-day composite values overlapping with a given month were first converted to daily rates and then weighed by the exact number of calendar days falling within that month. This procedure ensured temporal consistency with the monthly SSMI data and the subsequent monthly lagged and cumulative analyses. ET was retained and reported as a water-depth variable in mm. For the calculation of WUE, 1 mm ET was treated as equivalent to 1 kg H2O m−2; therefore, WUE was calculated as the ratio of monthly GPP to monthly ET and expressed as g C kg−1 H2O−1. It should be noted that WUE is a derived indicator rather than an independently observed variable. Both MODIS-derived GPP and ET are algorithm-based products and may be affected by meteorological inputs, vegetation parameters, land-cover classification, and model assumptions. Therefore, uncertainties in GPP and ET may propagate into MODIS-derived WUE, especially in areas with low ET. These datasets are available from the US Geological Survey (https://ladsweb.modaps.eosdis.nasa.gov/, accessed on 15 December 2025).
All datasets were first projected to the WGS84 geographic coordinate system and clipped to the boundary of the TNSFP region. To ensure spatial consistency, ERA5-Land soil moisture data were resampled to 0.05° using bilinear interpolation to match the spatial resolution of the MODIS-derived vegetation datasets. For categorical land-cover data, the nearest-neighbor method was used. Non-vegetated areas, water bodies, urban lands, barren lands, and permanent snow/ice were masked using the MCD12Q1 Version 6.1 land-cover product. Only vegetated pixels, including needleleaf forests, broadleaf forests, mixed forests, shrublands, savannas, grasslands, and croplands, were retained for subsequent analysis.
MODIS quality assurance layers were used to remove low-quality observations. Missing values caused by cloud contamination or low-quality retrievals were filled only when the missing period was shorter than two consecutive months using linear interpolation; otherwise, the pixel was excluded from the corresponding temporal analysis. All variables were aggregated or resampled to monthly time steps from 2001 to 2022. GPP and ET were converted to consistent monthly units before calculating WUE.

2.3. Methods

2.3.1. Trend Analysis

To quantify temporal trends in SSMI, NDVI, GPP, and WUE from 2001 to 2022, the Theil-Sen slope method is employed in our study. The Theil-Sen slope method computes the median of all possible pairwise slopes between distinct time steps using the formula:
β   =   median x j x i j i   ( j   >   i )
where β is the slope of the variables, j and i represent time steps in the time series, xj and xi represent the variable values at the time steps j and i, respectively. Subsequently, the Mann–Kendall (MK) test is applied to evaluate the statistical significance of the trends estimated by the Theil-Sen slope. The MK test quantifies the rank correlation between the time series values and their corresponding time indices. By applying the Theil-Sen slope and MK test at the pixel scale, we also identify the spatial heterogeneities in trend patterns across vegetation types. The involved formulas are calculated as follows:
S = i = 1 n 1 j = i + 1 n s g n x j x i
where sgn(xj − xi) equals 1, 0, or −1 when (xj − xi) is greater than, equal to, or less than zero, respectively. The statistic S is standardized into Z, and trends are considered significant when Z > 1.96 at the 0.05 significance level.

2.3.2. Lagged and Cumulative Associations Between Drought and Vegetation

Before correlation analyses, all monthly variables, including SSMI, NDVI, GPP, ET, and WUE, were converted into anomalies to remove seasonal cycles. For each pixel and each variable, the long-term mean of each calendar month during 2001–2022 was subtracted from the original monthly value. The anomaly series were then detrended using linear regression to reduce the influence of long-term co-trending patterns. The lagged and cumulative correlation analyses were conducted using the deseasonalized and detrended anomaly series.
The normality of the deseasonalized and detrended anomaly series was examined using the Shapiro–Wilk test for regional and vegetation-type time series. Because many monthly anomaly series did not strictly satisfy the normality assumption, Spearman rank correlation was used to quantify the relationships between SSMI and vegetation indicators. To reduce the influence of temporal autocorrelation, the effective degrees of freedom were estimated according to the lag-1 autocorrelation coefficients of the two time series, and the significance of correlation coefficients was tested using the adjusted effective sample size. To reduce the risk of inflated Type I error caused by repeated scanning, false discovery rate (FDR) correction was applied separately across the 0–12-month lag windows and the 1–12-month cumulative windows. The Rmaxlag and Rmaxcum were extracted only from time windows that passed both the autocorrelation-adjusted significance test and FDR correction; otherwise, the corresponding pixels were treated as non-significant.
The lagged association between soil moisture drought and vegetation indicators was characterized by Spearman rank correlation analysis. Spearman rank correlation analyses were conducted between monthly NDVI, GPP, and WUE data and the SSMI from 1- to 12-month scales. Among the significant lag windows, the correlation coefficient with the maximum absolute value was selected as the maximum lagged correlation coefficient (Rmaxlag). The involved formulas were calculated as follows:
R i   =   c o r r ( V I ,   S S M I i )   with   p FDR   <   0.05 ,   1     i     12
R m a x l a g = R k   where   R k = max i Ω R i
where VI is the monthly vegetation indices of NDVI, GPP, and WUE, and Ri is the Spearman correlation coefficient between vegetation and drought with a lagged time of i months. Ω represents the subset of lag months (1 to 12 months) that successfully passed both the temporal autocorrelation-adjusted significance test and the FDR correction (pFDR < 0.05). Among this significant subset Ω, the specific month k exhibiting the peak absolute correlation magnitude ( R k ) was identified. Rmaxlag retained its original directional sign to preserve its distinct ecohydrological implications.
For the cumulative association analysis, Spearman rank correlation was conducted between monthly vegetation indicators and cumulative SSMI values across 1–12-month accumulation windows. The j-month cumulative SSMI was calculated as the arithmetic mean of the SSMI from the current month back to month j. Consistent with the lagged analysis, the correlation coefficients (Rj) were strictly regulated by temporal autocorrelation adjustments and throttled via FDR correction (pFDR < 0.05) across the 1–12-month cumulative windows. The greatest correlation coefficient was identified as the maximum cumulative correlation coefficient (Rmaxcum). The involved equations were calculated as follows:
R j   =   c o r r ( V I ,   S S M I j )   with   p FDR <   0.05 ,   1     j     12
R m a x c u m =   R m   where   R m = max j Λ R j  
Here, Rj was the correlation coefficient between vegetation and drought at accumulated j months. Λ denoted the specific subset of cumulative months (1 to 12 months) that exhibited statistically significant relationships after passing the dual criteria of autocorrelation correction and FDR thresholding (pFDR < 0.05). Rmaxcum was identified as the native coefficient at month m that achieved the absolute maximum value within the set Λ, keeping its original positive or negative directional sign intact to accurately reflect the directional feedback of cumulative drought stress.

2.3.3. Ecosystem Resilience Analysis

According to Sharma and Goyal [28], the ratio of the mean WUE during drought periods to that during non-drought periods, presented by the index of Rd, was employed to evaluate the ecosystem resilience. This study uses this index to quantify the resilience of ecosystems across different vegetation types to deep soil moisture drought. The following equation is used:
R d   =   W U E d W U E m
where Rd is the WUE-based ecosystem resilience index, WUEd is the mean value of the WUE during soil moisture deficit periods (SSMI ≤ 0), and WUEm is the mean value of the WUE during non-deficit periods (SSMI > 0). The value of Rd can be classified into four categories: (1) resilient (Rd ≥ 1); (2) slightly non-resilient (1 > Rd ≥ 0.9); (3) moderately non-resilient (0.9 > Rd ≥ 0.8); (4) severely non-resilient (Rd < 0.8).

2.3.4. Uncertainty Quantification

To quantify the uncertainty of the main statistical results, we quantified the uncertainty by calculating the 95% confidence intervals (CIs) for all primary trend slopes, correlation coefficients, and resilience indices. The CIs for Theil-Sen trend slopes (β) were derived using the non-parametric method, ensuring the statistical reliability of the temporal trends in SSMI, GPP, and WUE. For the ecological resilience index (Rd), we implemented a bootstrapping approach with 1000 iterations to estimate the 95% CIs for each vegetation type, providing a rigorous assessment of the stability patterns under drought stress.

3. Results

3.1. Variations in Soil Moisture Drought and Ecosystem Carbon–Water Cycle Components

3.1.1. Spatiotemporal Coupling and Divergence of Soil Moisture Drought Across Layers

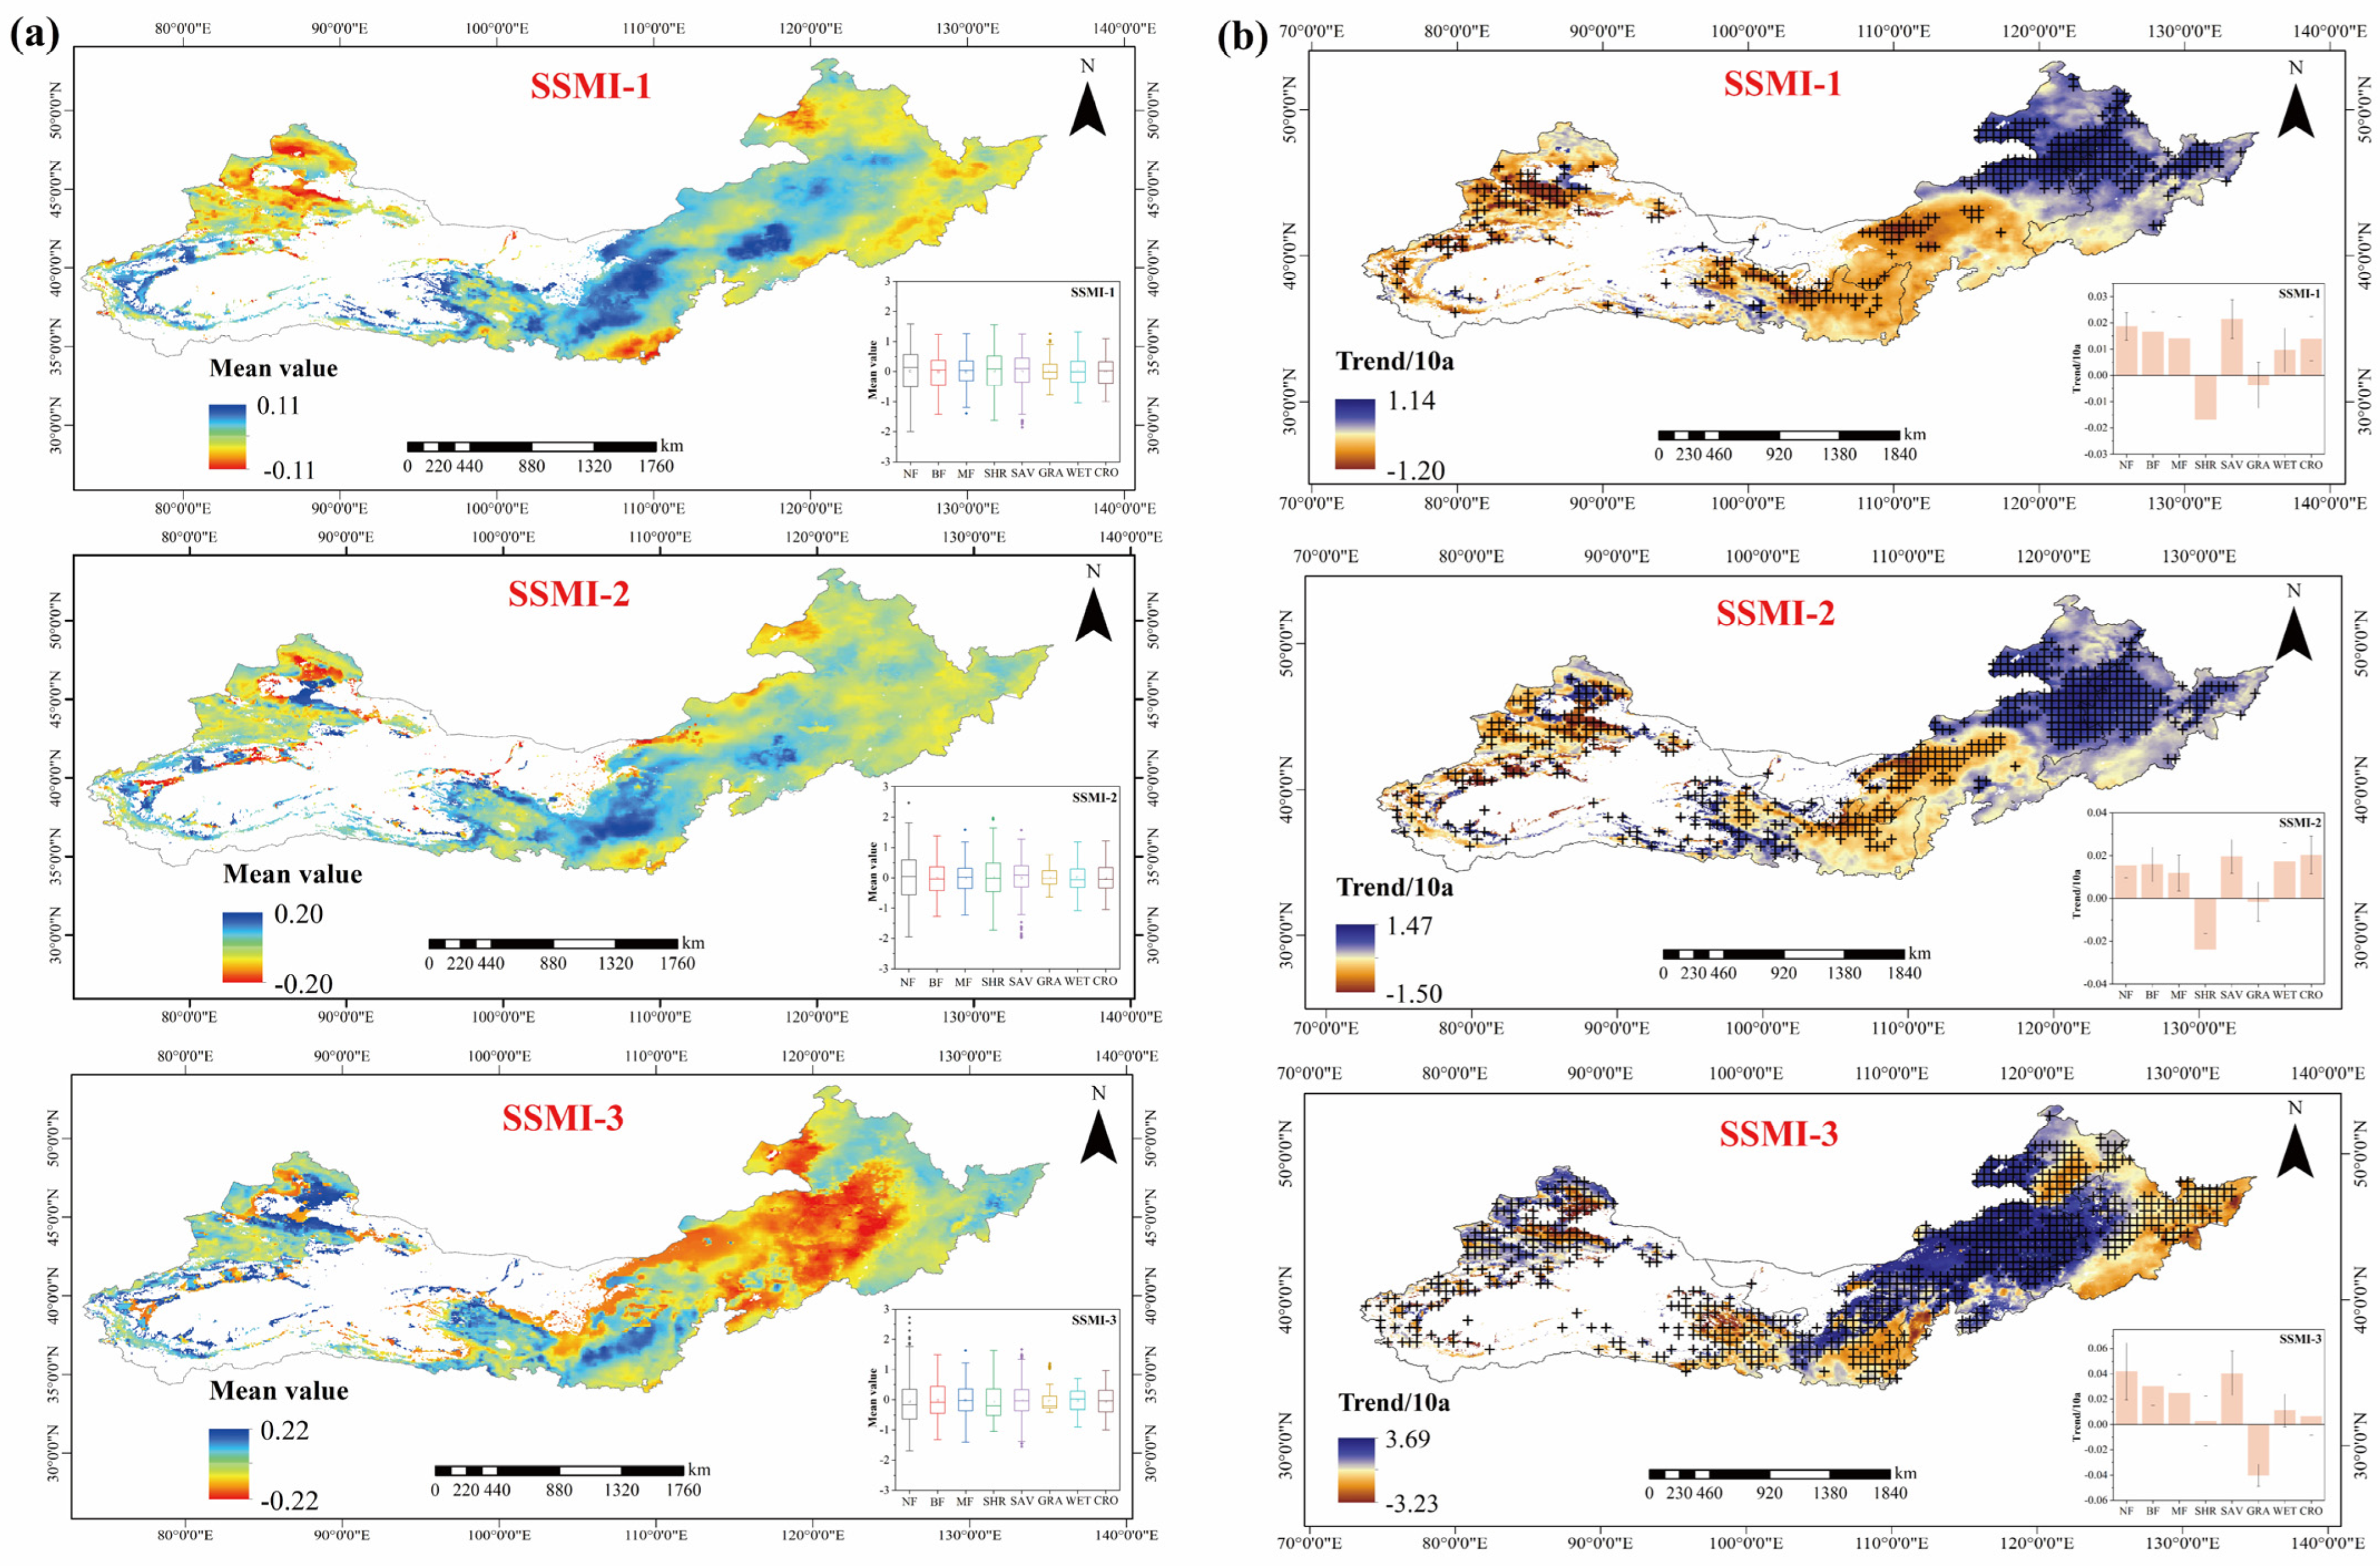
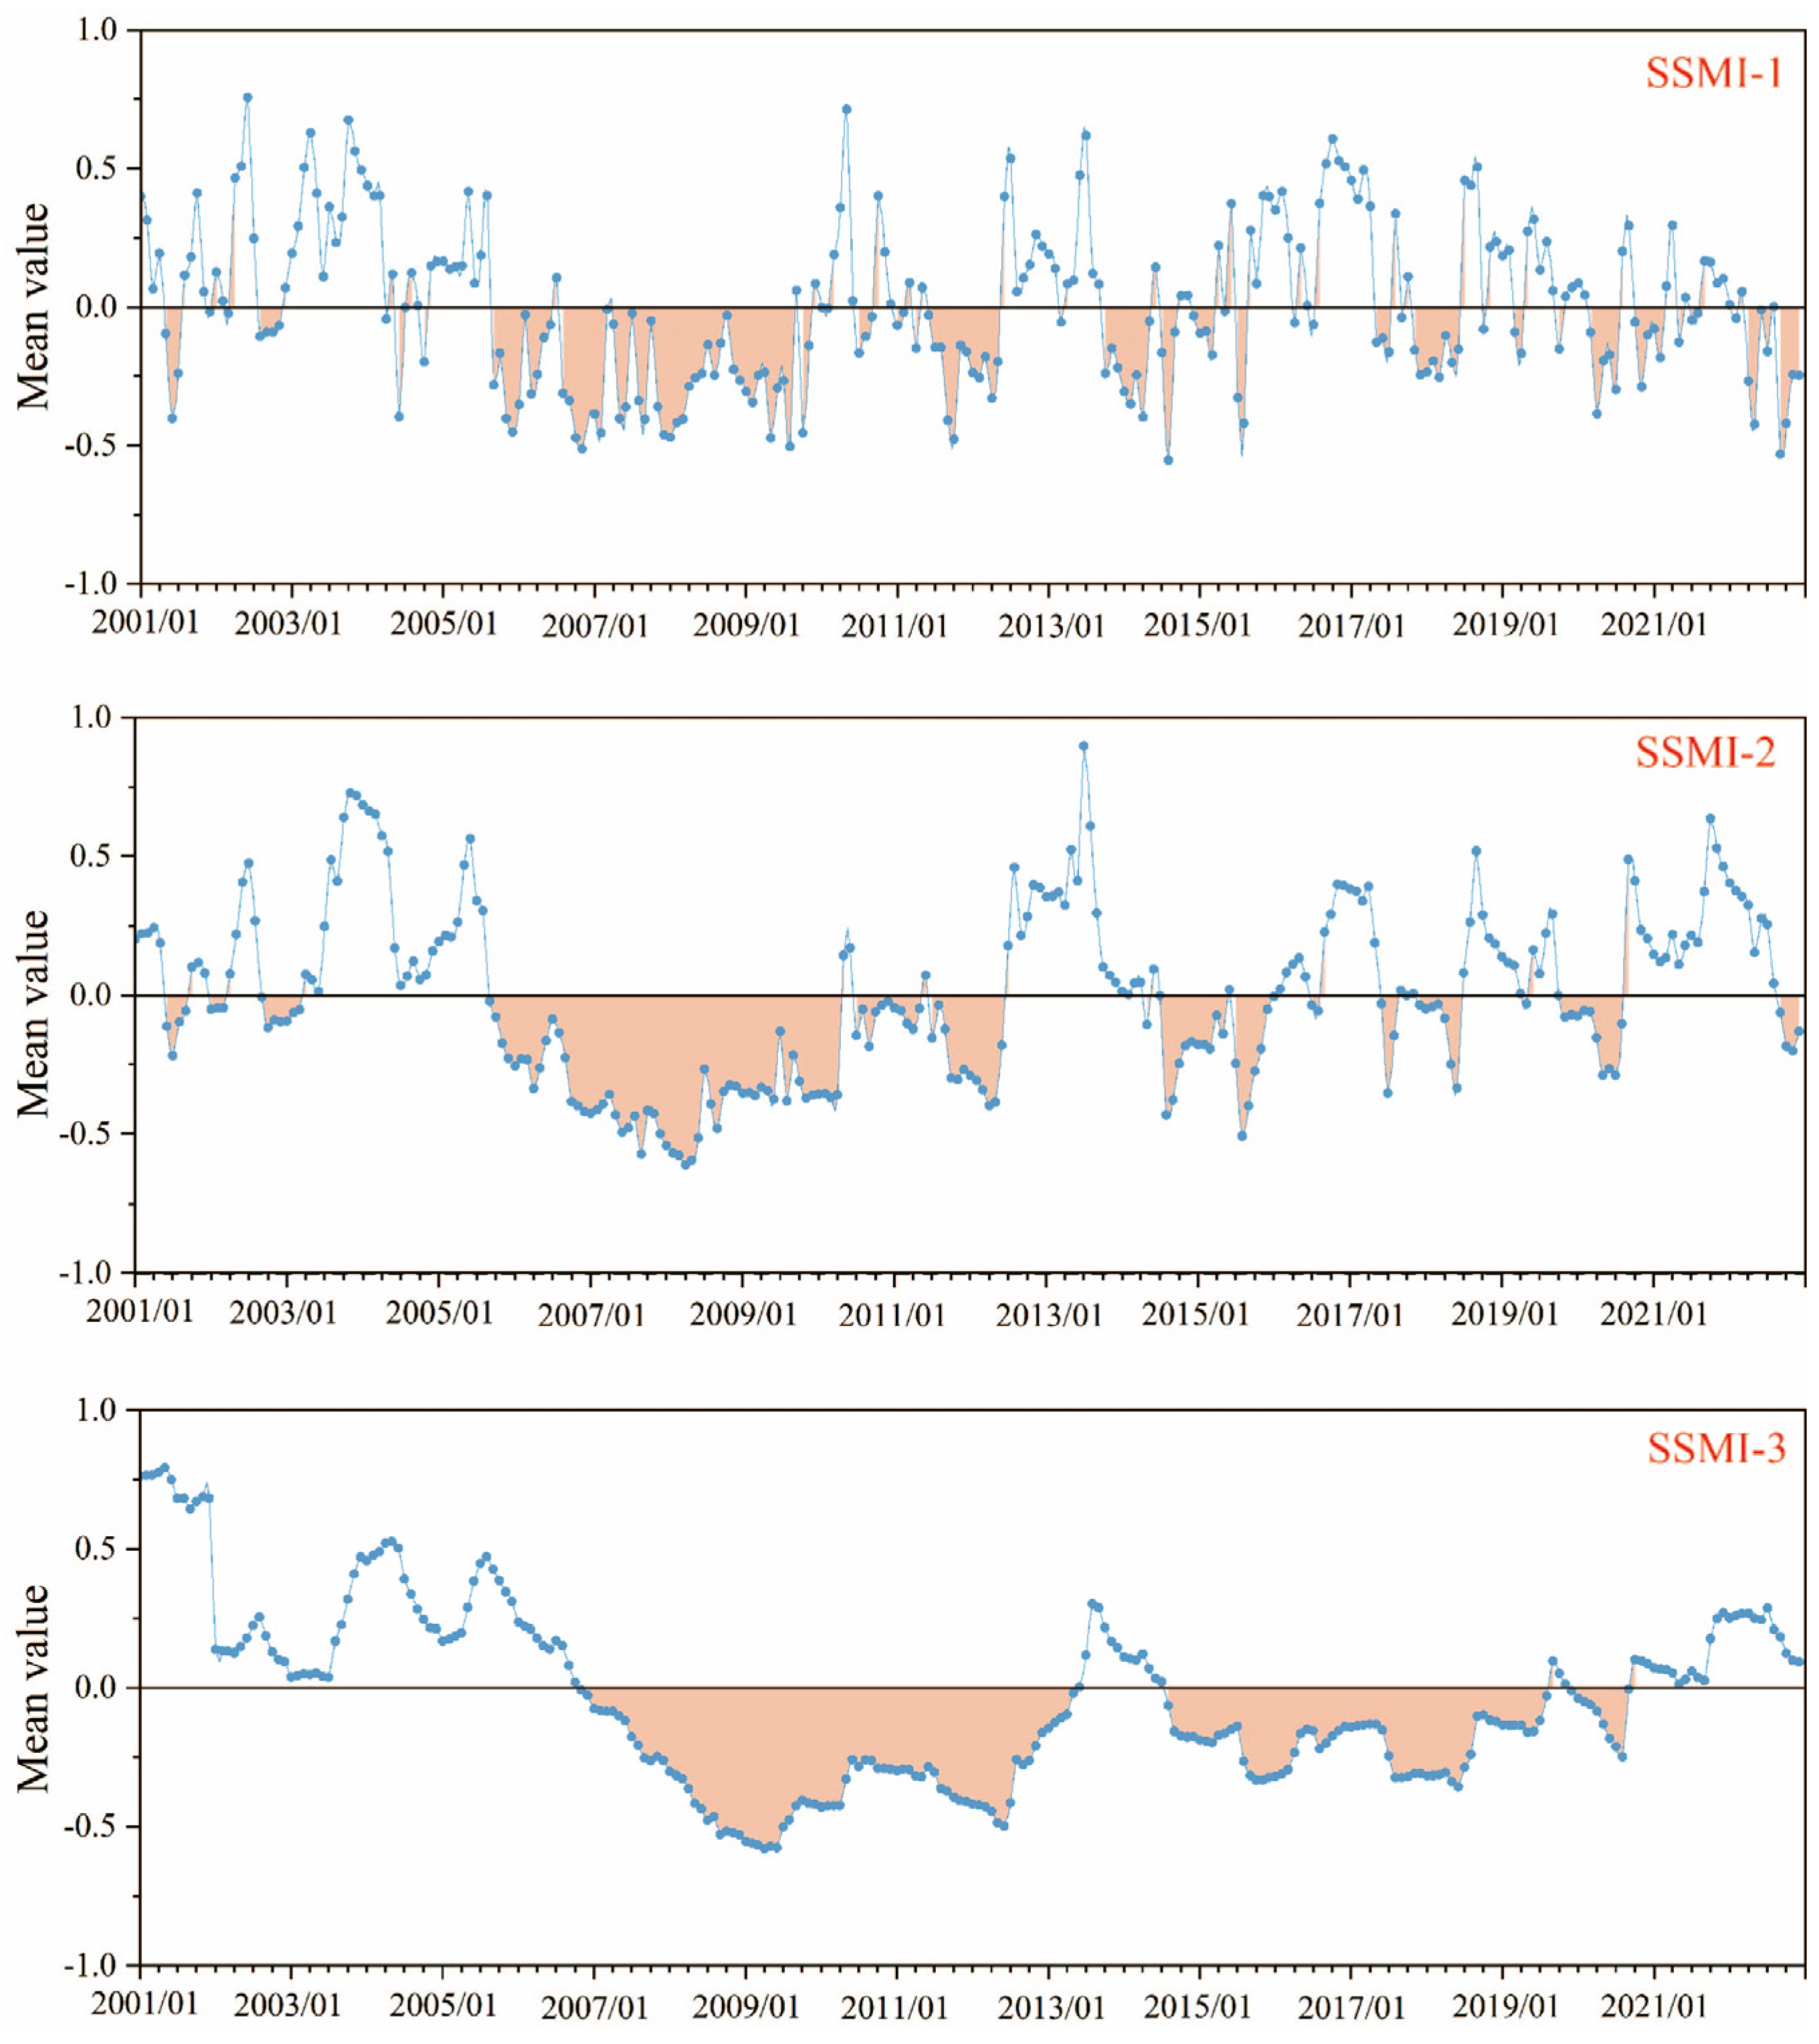
The soil moisture droughts occurred uniformly among seasons (Figure 2). The soil moisture drought in the shallow soil layer (0–28 cm) persisted throughout 2001–2022, whereas the drought in the middle layer (28–100 cm) and deep layer (100–289 cm) were predominantly observed after 2005 and 2007, respectively. The monthly SSMI-1 of 2007–2008, SSMI-2 of 2006–2009 and 2014–2015, and SSMI-3 of 2008–2012, 2015–2018, and 2020 were less than 0, indicating the soil moisture deficit duration tended to be longer with increasing soil depth. As shown in Figure 3a, the mean annual SSMI-1, SSMI-2 and SSMI-3 during 2001–2022 exhibited significant spatial variability across the TNSFP region, with an average of 0.00 ± 0.03, 0.00 ± 0.05 and −0.04 ± 0.09, respectively. Overall, SSMI-1 and SSMI-2 displayed upward trends, with positive pixels constituting 51.28% and 55.91%, respectively, predominantly concentrated in the northeastern region (Figure 3b). Conversely, the SSMI-3 showed a downward trend, with negative pixels making up 56.01%, distributed across the northern part of the Loess Plateau, the Jungger Basin, and the northeastern area.

3.1.2. Spatial–Temporal Variations in Annual ET, GPP, and WUE

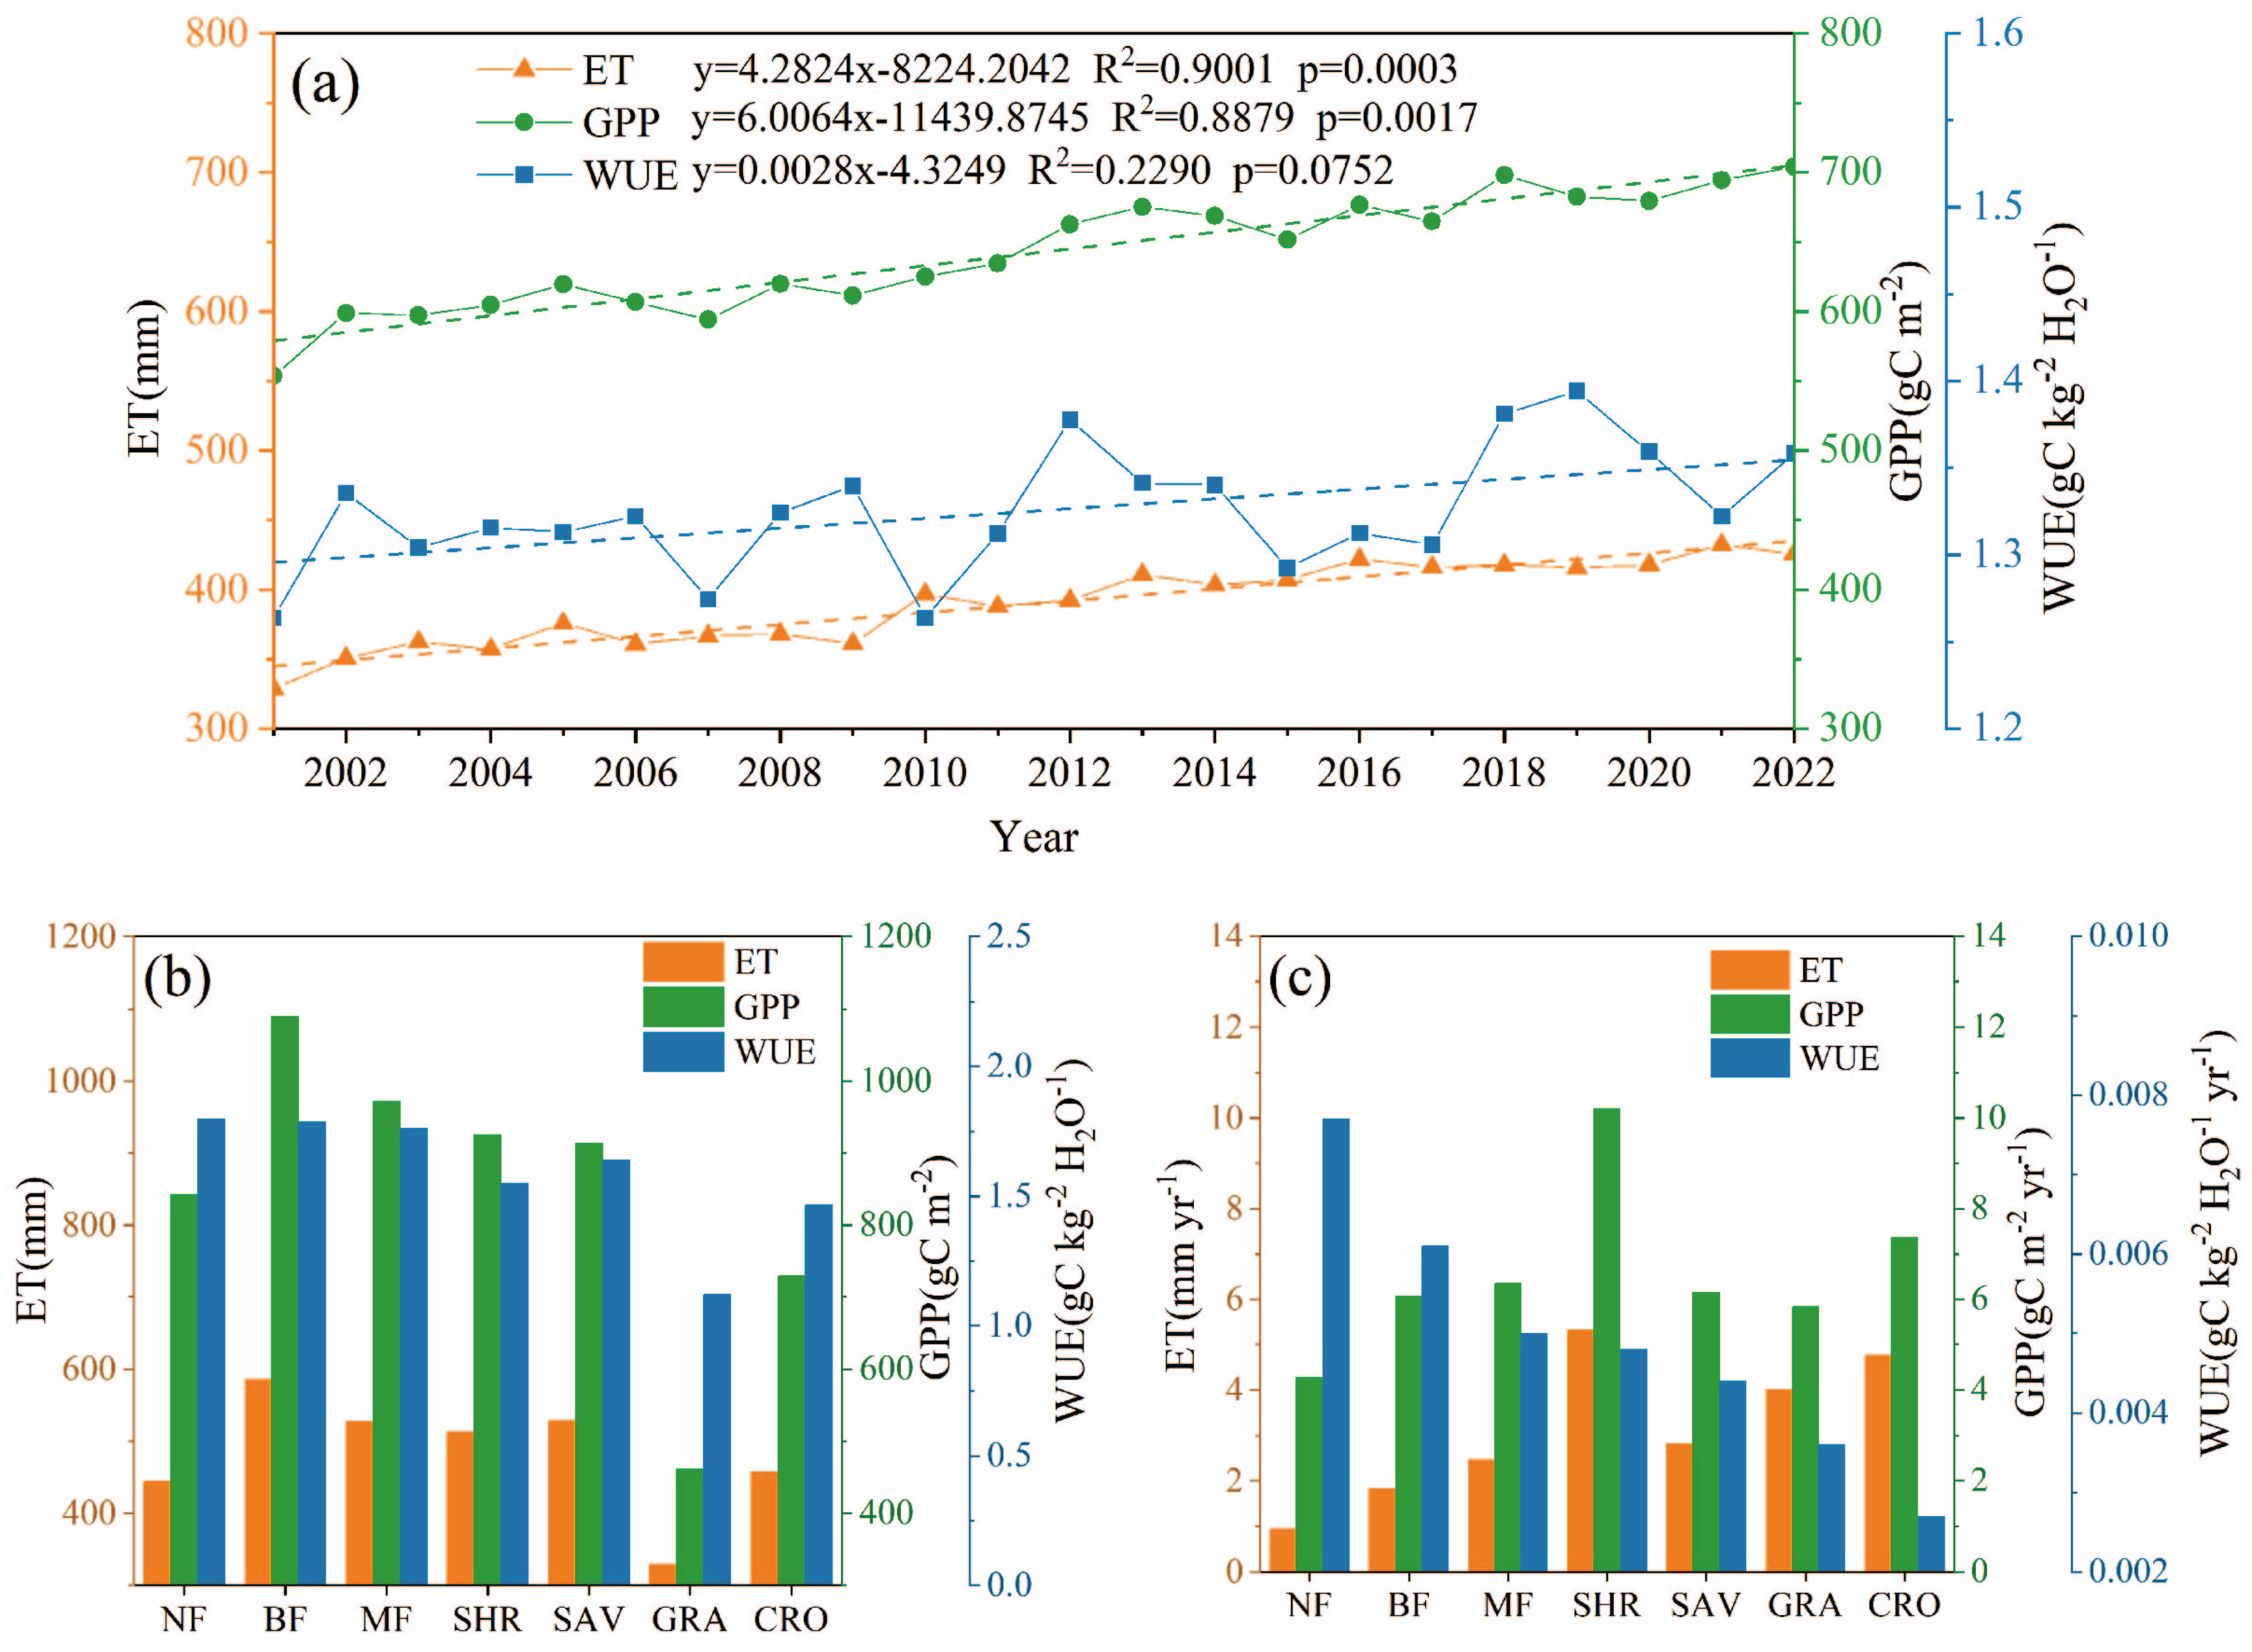
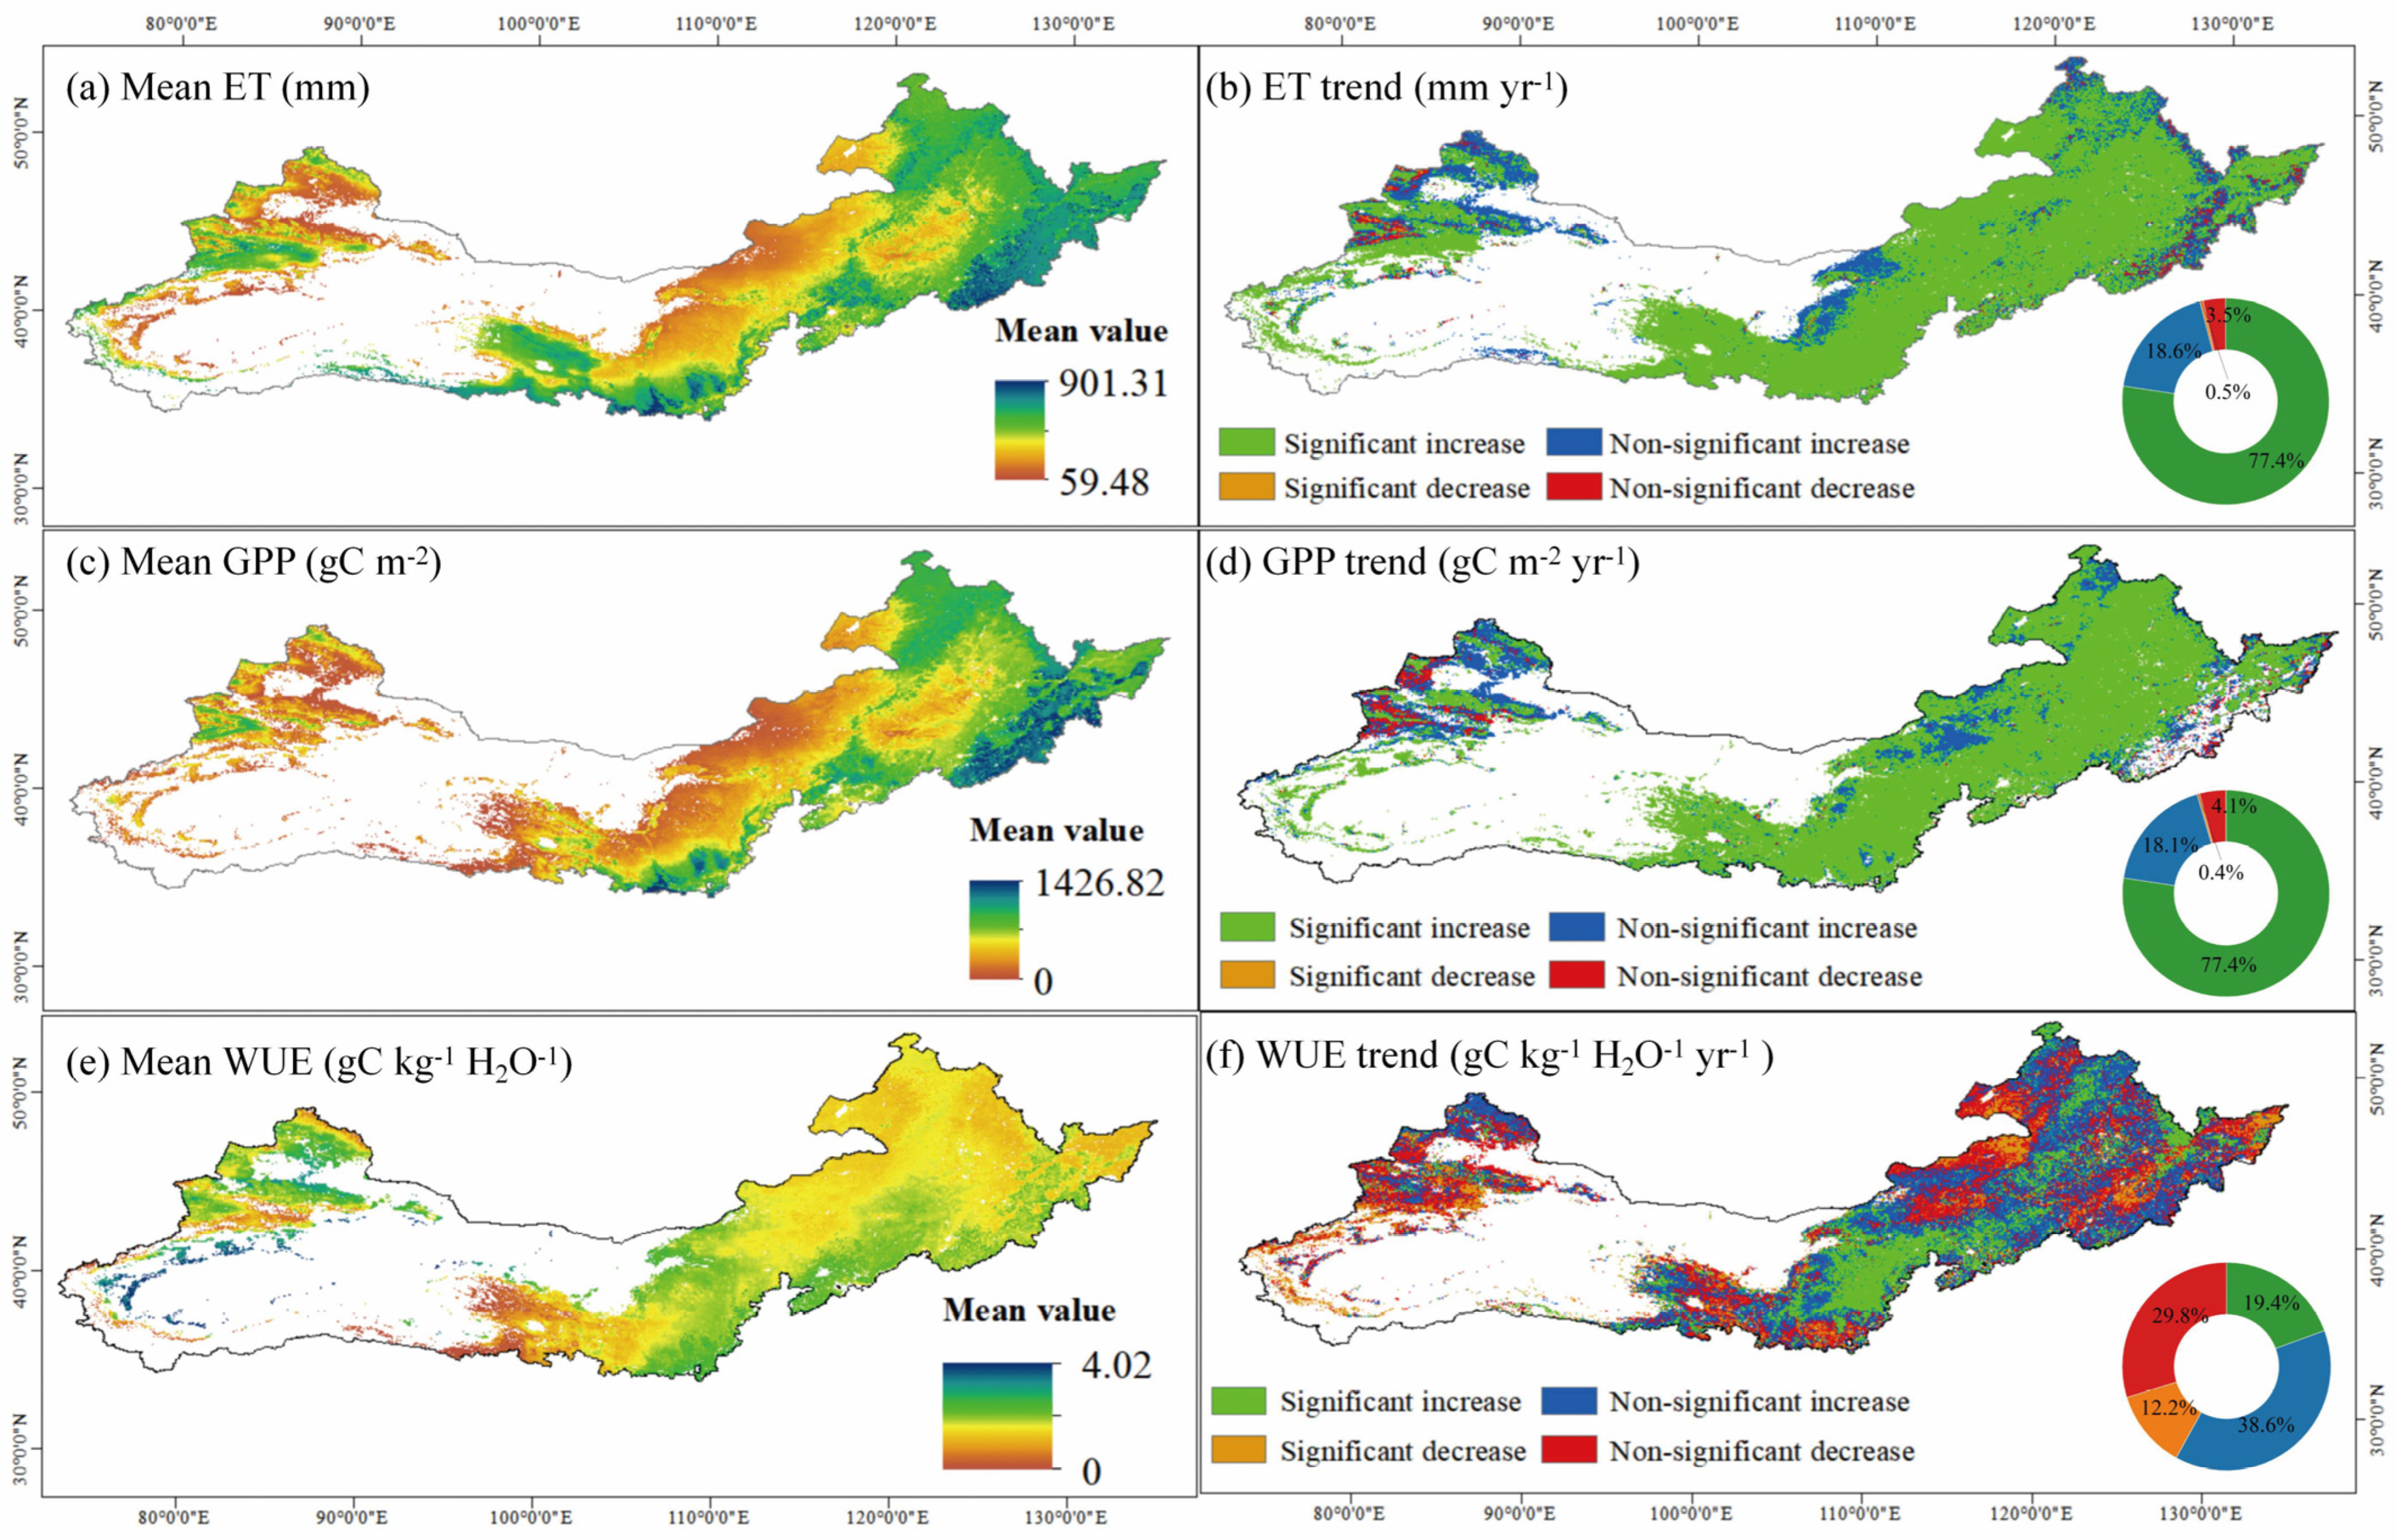
The spatial distribution of the mean annual ET, GPP, and WUE during the period of 2001–2022 in the TNSFP region was shown in Figure 4a,c,e. The spatial distribution of mean annual ET and GPP exhibited similar patterns, with greater values distributed in southeastern areas and lower values in northern and western areas. The WUE across the region showed spatial variability, ranging from 0 to 4.02 g C kg−1 H2O−1 with a mean value of 1.1 g C kg−1 H2O−1. In the northwestern and northern regions, the WUE appeared to be inversely correlated with the distribution of ET and GPP, whereas WUE showed a similar distribution pattern to ET and GPP in the southeastern region. From 2001 to 2022, the vegetation ET, GPP, and WUE exhibited upward trends with changing rate of 4.28 ± 0.45 mm yr−1 (95% CI: 3.83–4.73), 6.01 ± 0.62 g C m−2 yr−1 (95% CI: 5.39–6.63), and 0.0028 ± 0.0003 g C kg−1 H2O−1 yr−1 (95% CI: 0.0025–0.0031) (Figure 4a). As shown in Figure 4b,d, the area proportions showing significant increasing trends of ET and GPP were 77.4% and 77.5% (p < 0.05), respectively, while 0.5% and 0.4% of the area experienced significant decreasing trends. The WUE showed increasing trends in 58.0% of the area, with 19.4% in a significant upward trend (p < 0.05), distributed primarily in central areas.
Among different vegetation types, forests including NF, BF, and MF demonstrated the greatest WUE of 1.80, 1.79, and 1.76 g C kg−1 H2O−1, respectively, whereas GRA showed the lowest WUE of 1.12 g C kg−1 H2O−1 (Figure 5b). The SHR showed the greatest increasing rates in ET and GPP at 5.32 mm yr−1 and 10.20 gC m−2 yr−1, respectively. The CRO exhibited the lowest increasing rates in WUE at 0.0024 g C kg−1 H2O−1 yr−1. The NF had the lowest increasing rates in ET (0.94 mm yr−1) and GPP(4.29 gC m−2 yr−1), but the greatest rate in WUE (0.0077 g C kg−1 H2O−1 yr−1).

3.2. Divergent Responses of Ecosystem WUE to Soil Moisture Droughts

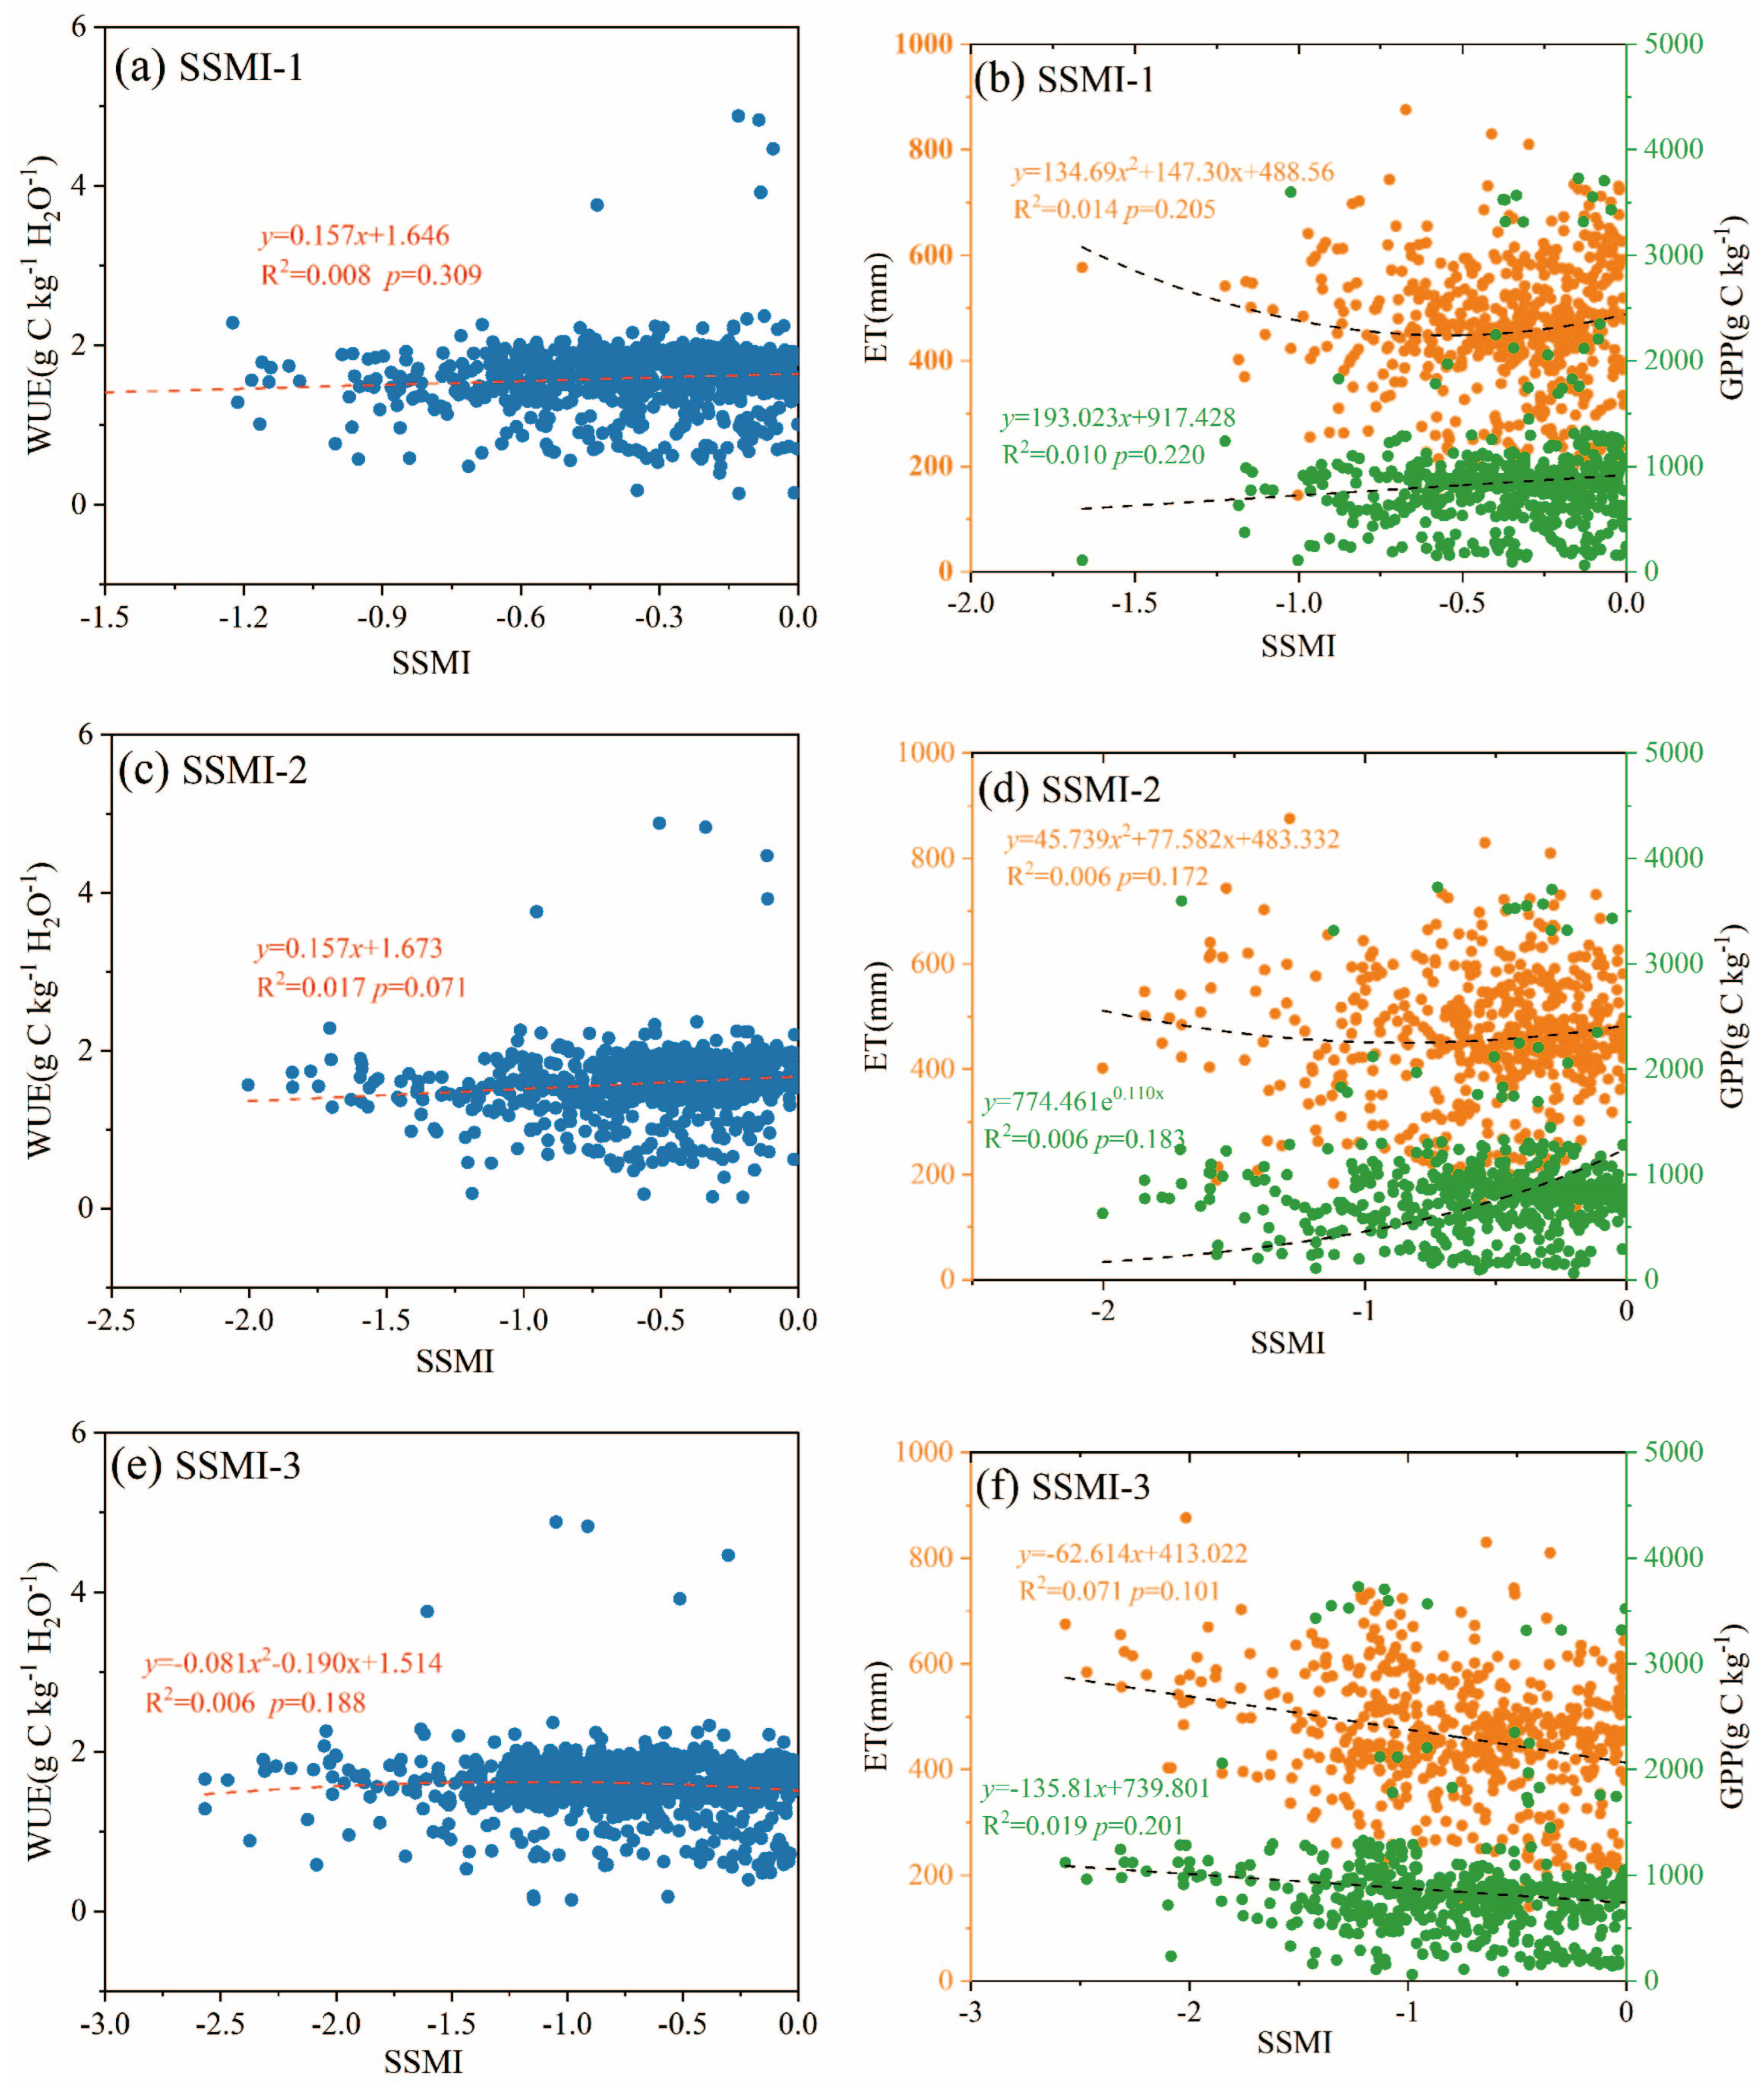
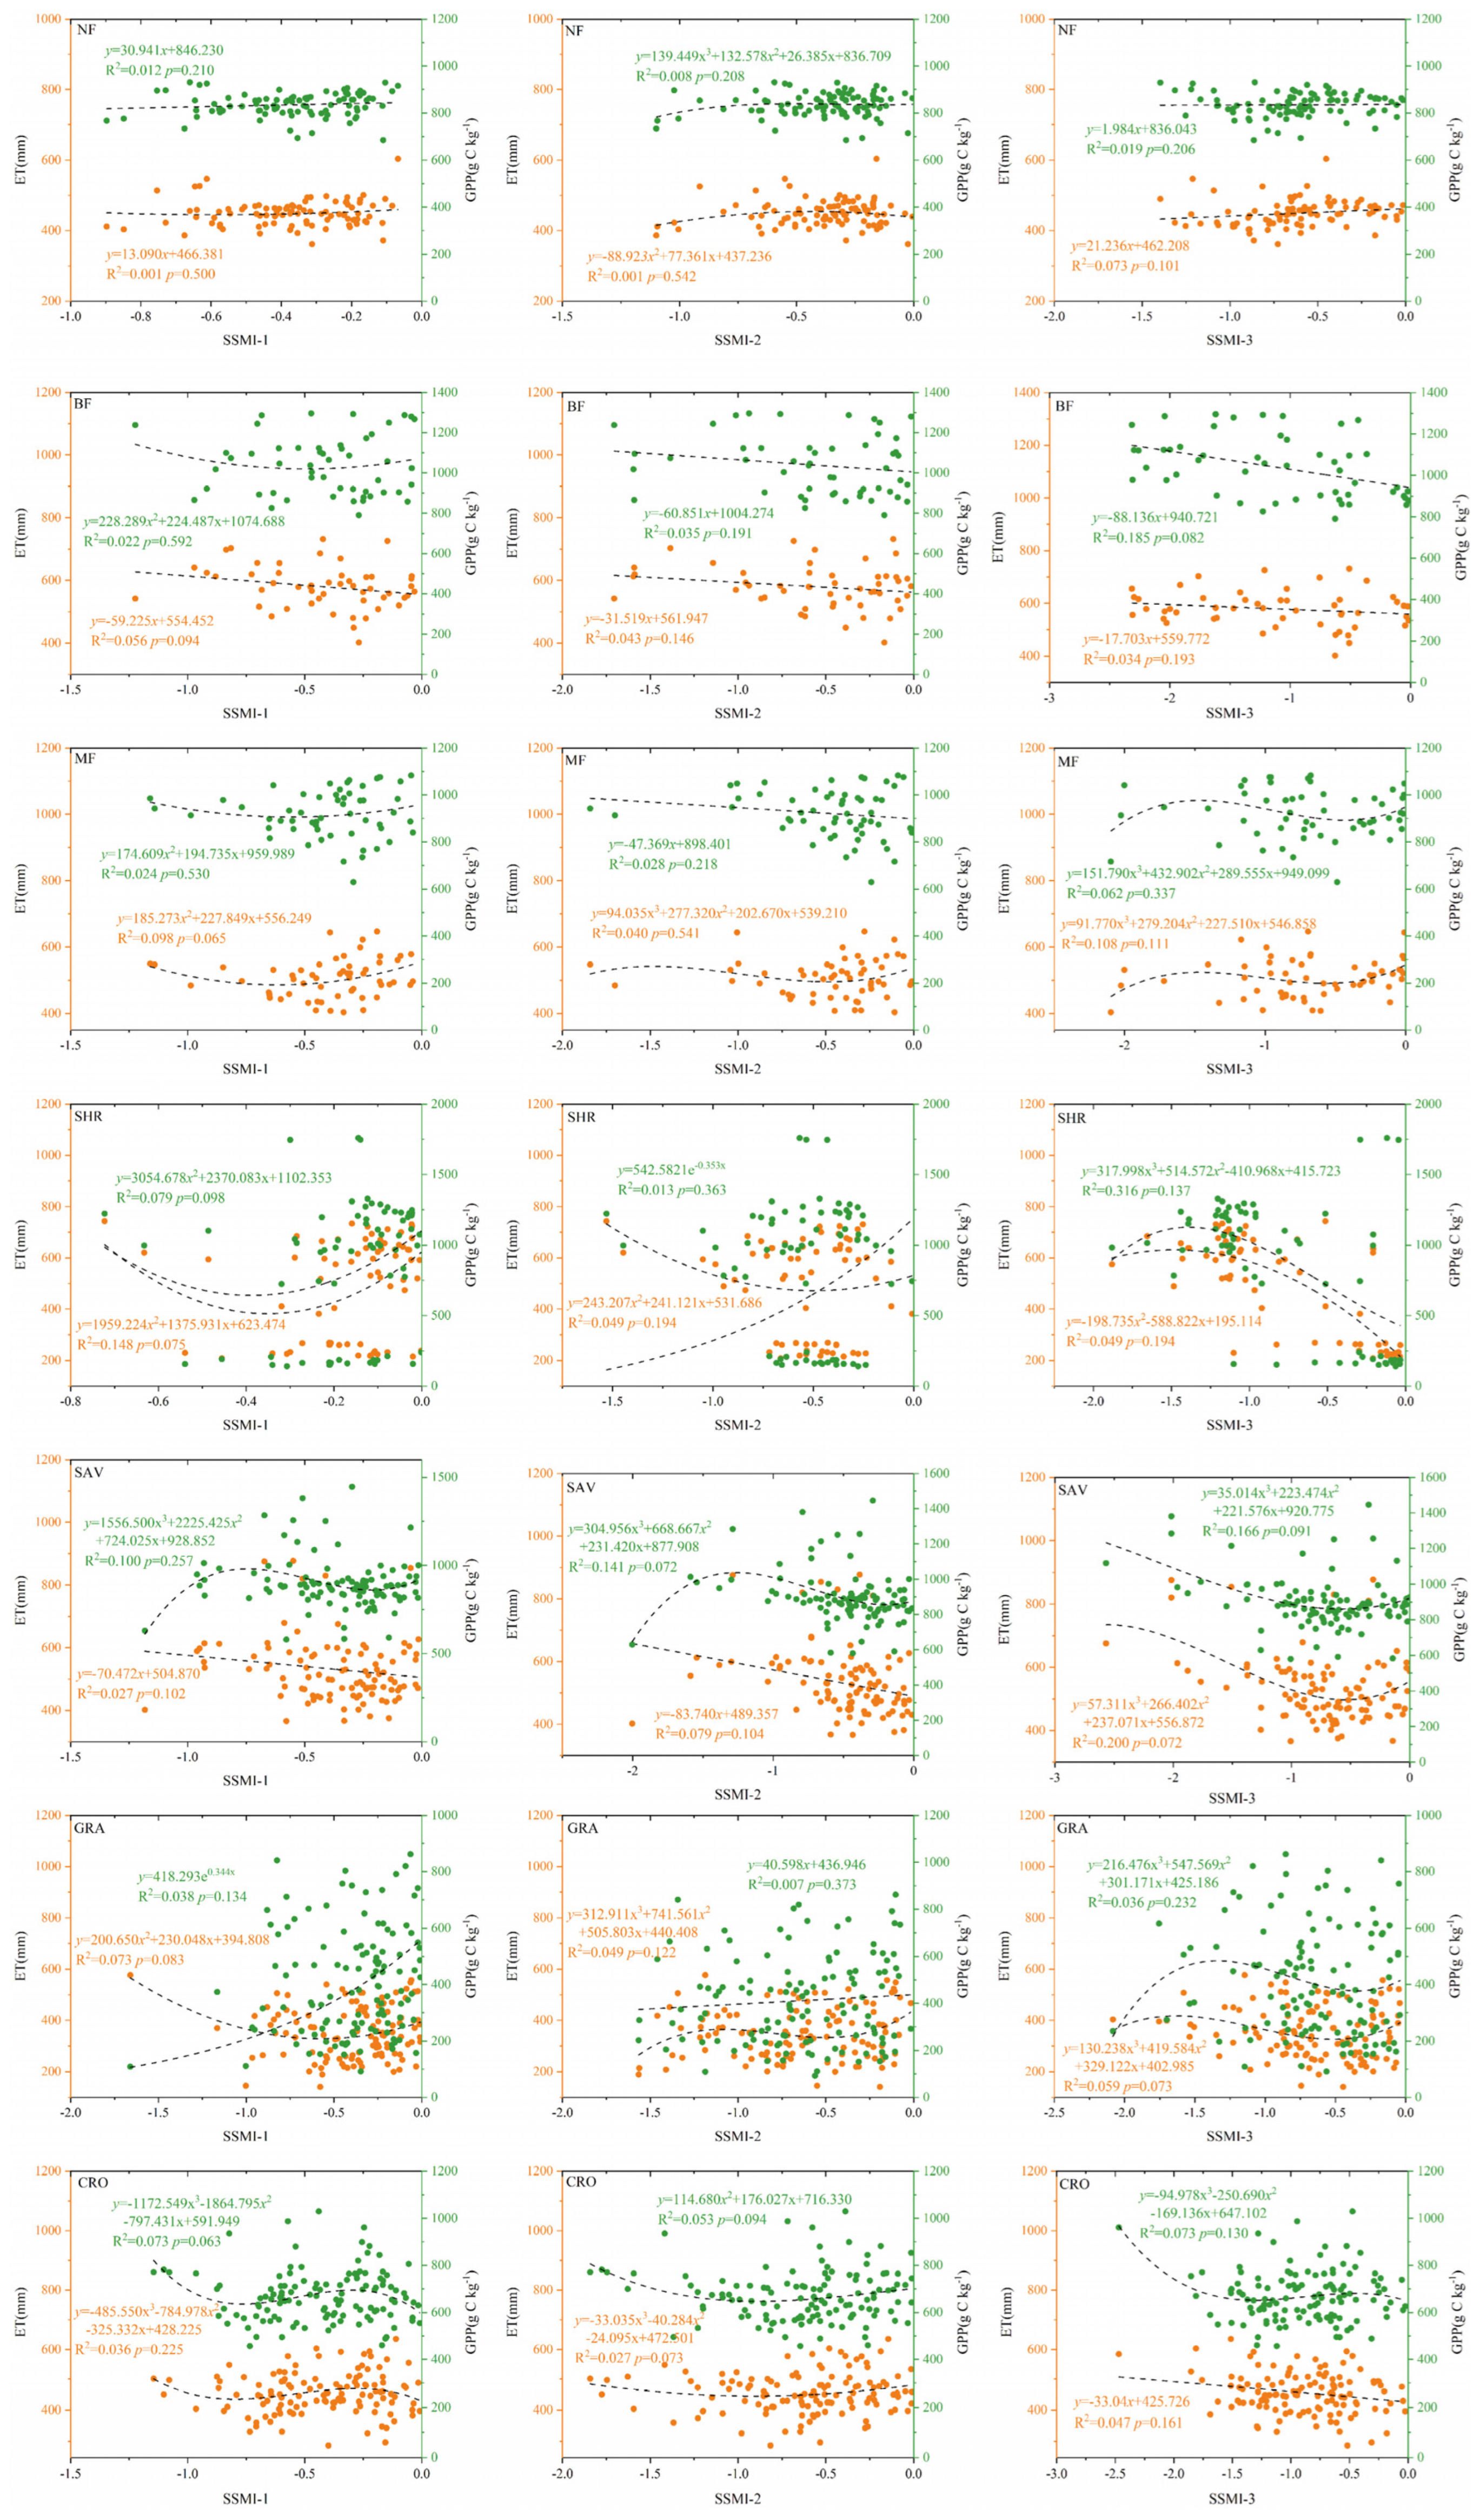
Figure 6 shows that the fitted relationships between WUE at the 1-month scale and SSMI-1, SSMI-2, and SSMI-3 were all statistically non-significant (p > 0.05). Specifically, WUE exhibited weak positive linear relationships with SSMI-1 and SSMI-2, whereas a weak quadratic relationship was observed for SSMI-3. Compared with WUE, ET and GPP exhibited relatively clearer but still non-significant responses to soil moisture drought. ET generally showed a decreasing tendency with increasing drought severity, and this decline became more evident under deeper soil drought conditions. In contrast, GPP varied only slightly under shallow and middle soil drought, but tended to decrease under deep soil drought.
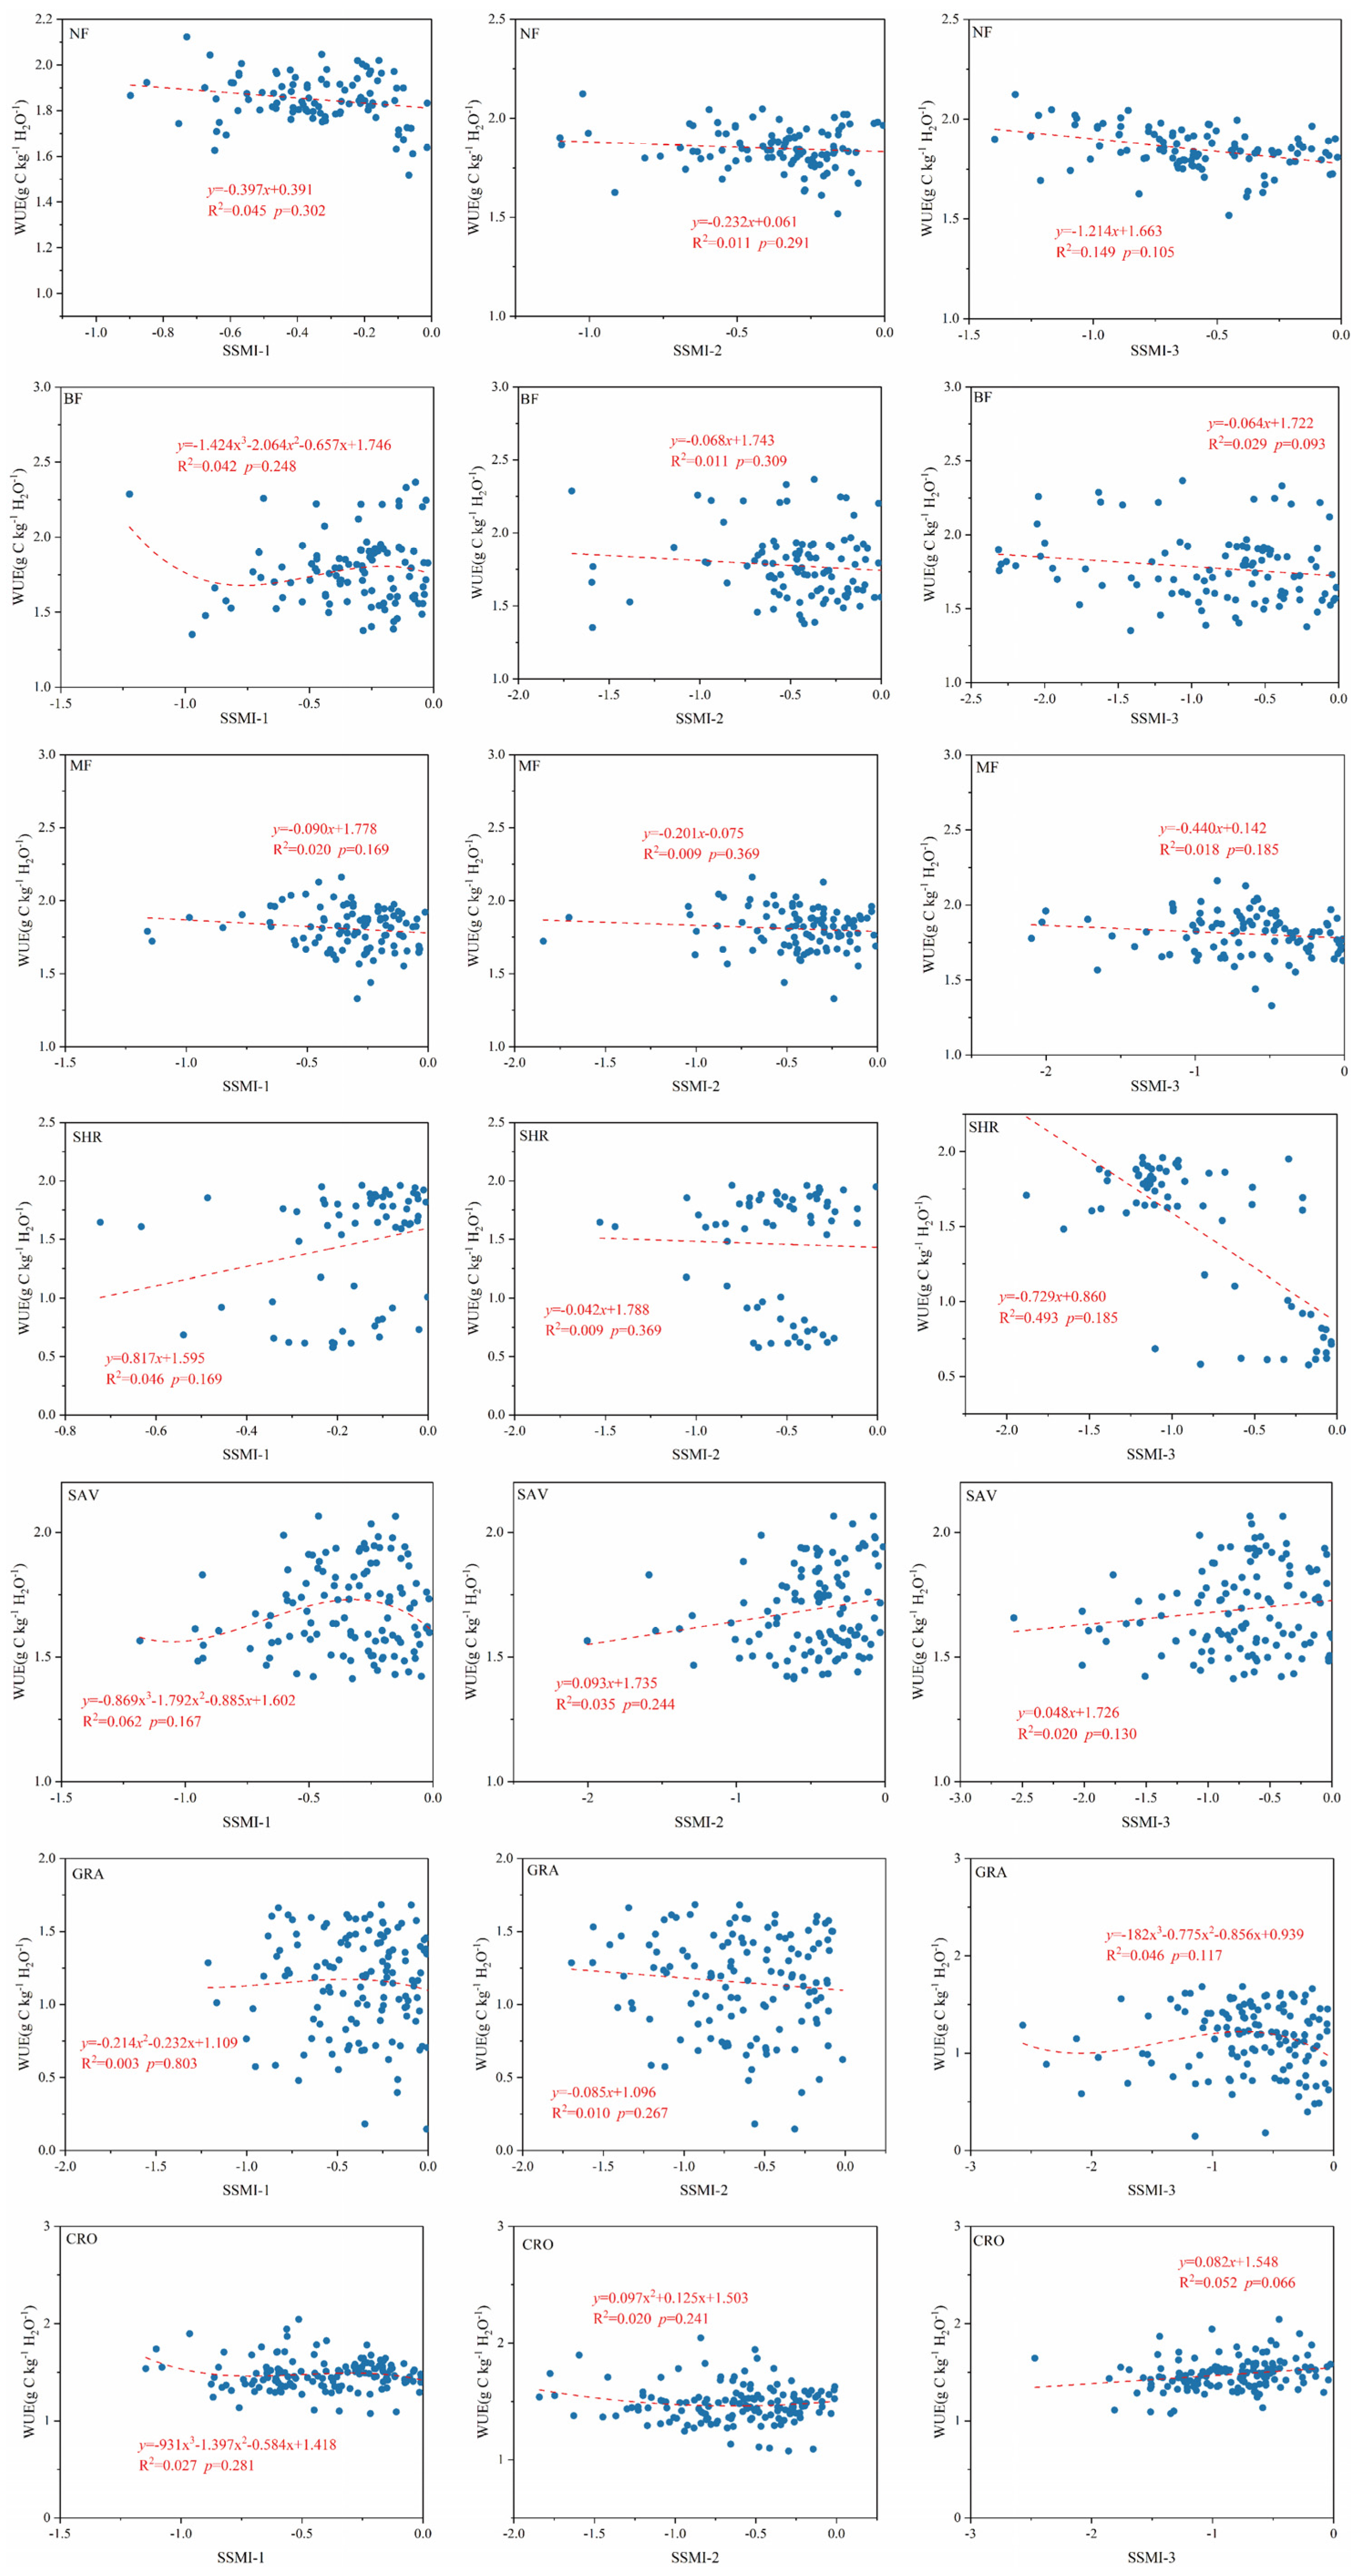
Moreover, the responses of WUE to soil moisture drought varied across different vegetation types (Figure A1 and Figure A2). However, these fitted relationships were generally weak and showed large scatter, suggesting that short-term soil moisture is not the sole driver. Since the synchronous analysis only captures the immediate response of WUE, whereas ecosystem WUE may show delayed and cumulative associations with drought conditions, further analyses were conducted to examine the temporal associations between WUE and soil moisture drought across different soil layers.

3.3. Lagged and Cumulative Associations Between Soil Moisture Drought and WUE

3.3.1. Lagged Associations Between Soil Moisture Drought and WUE

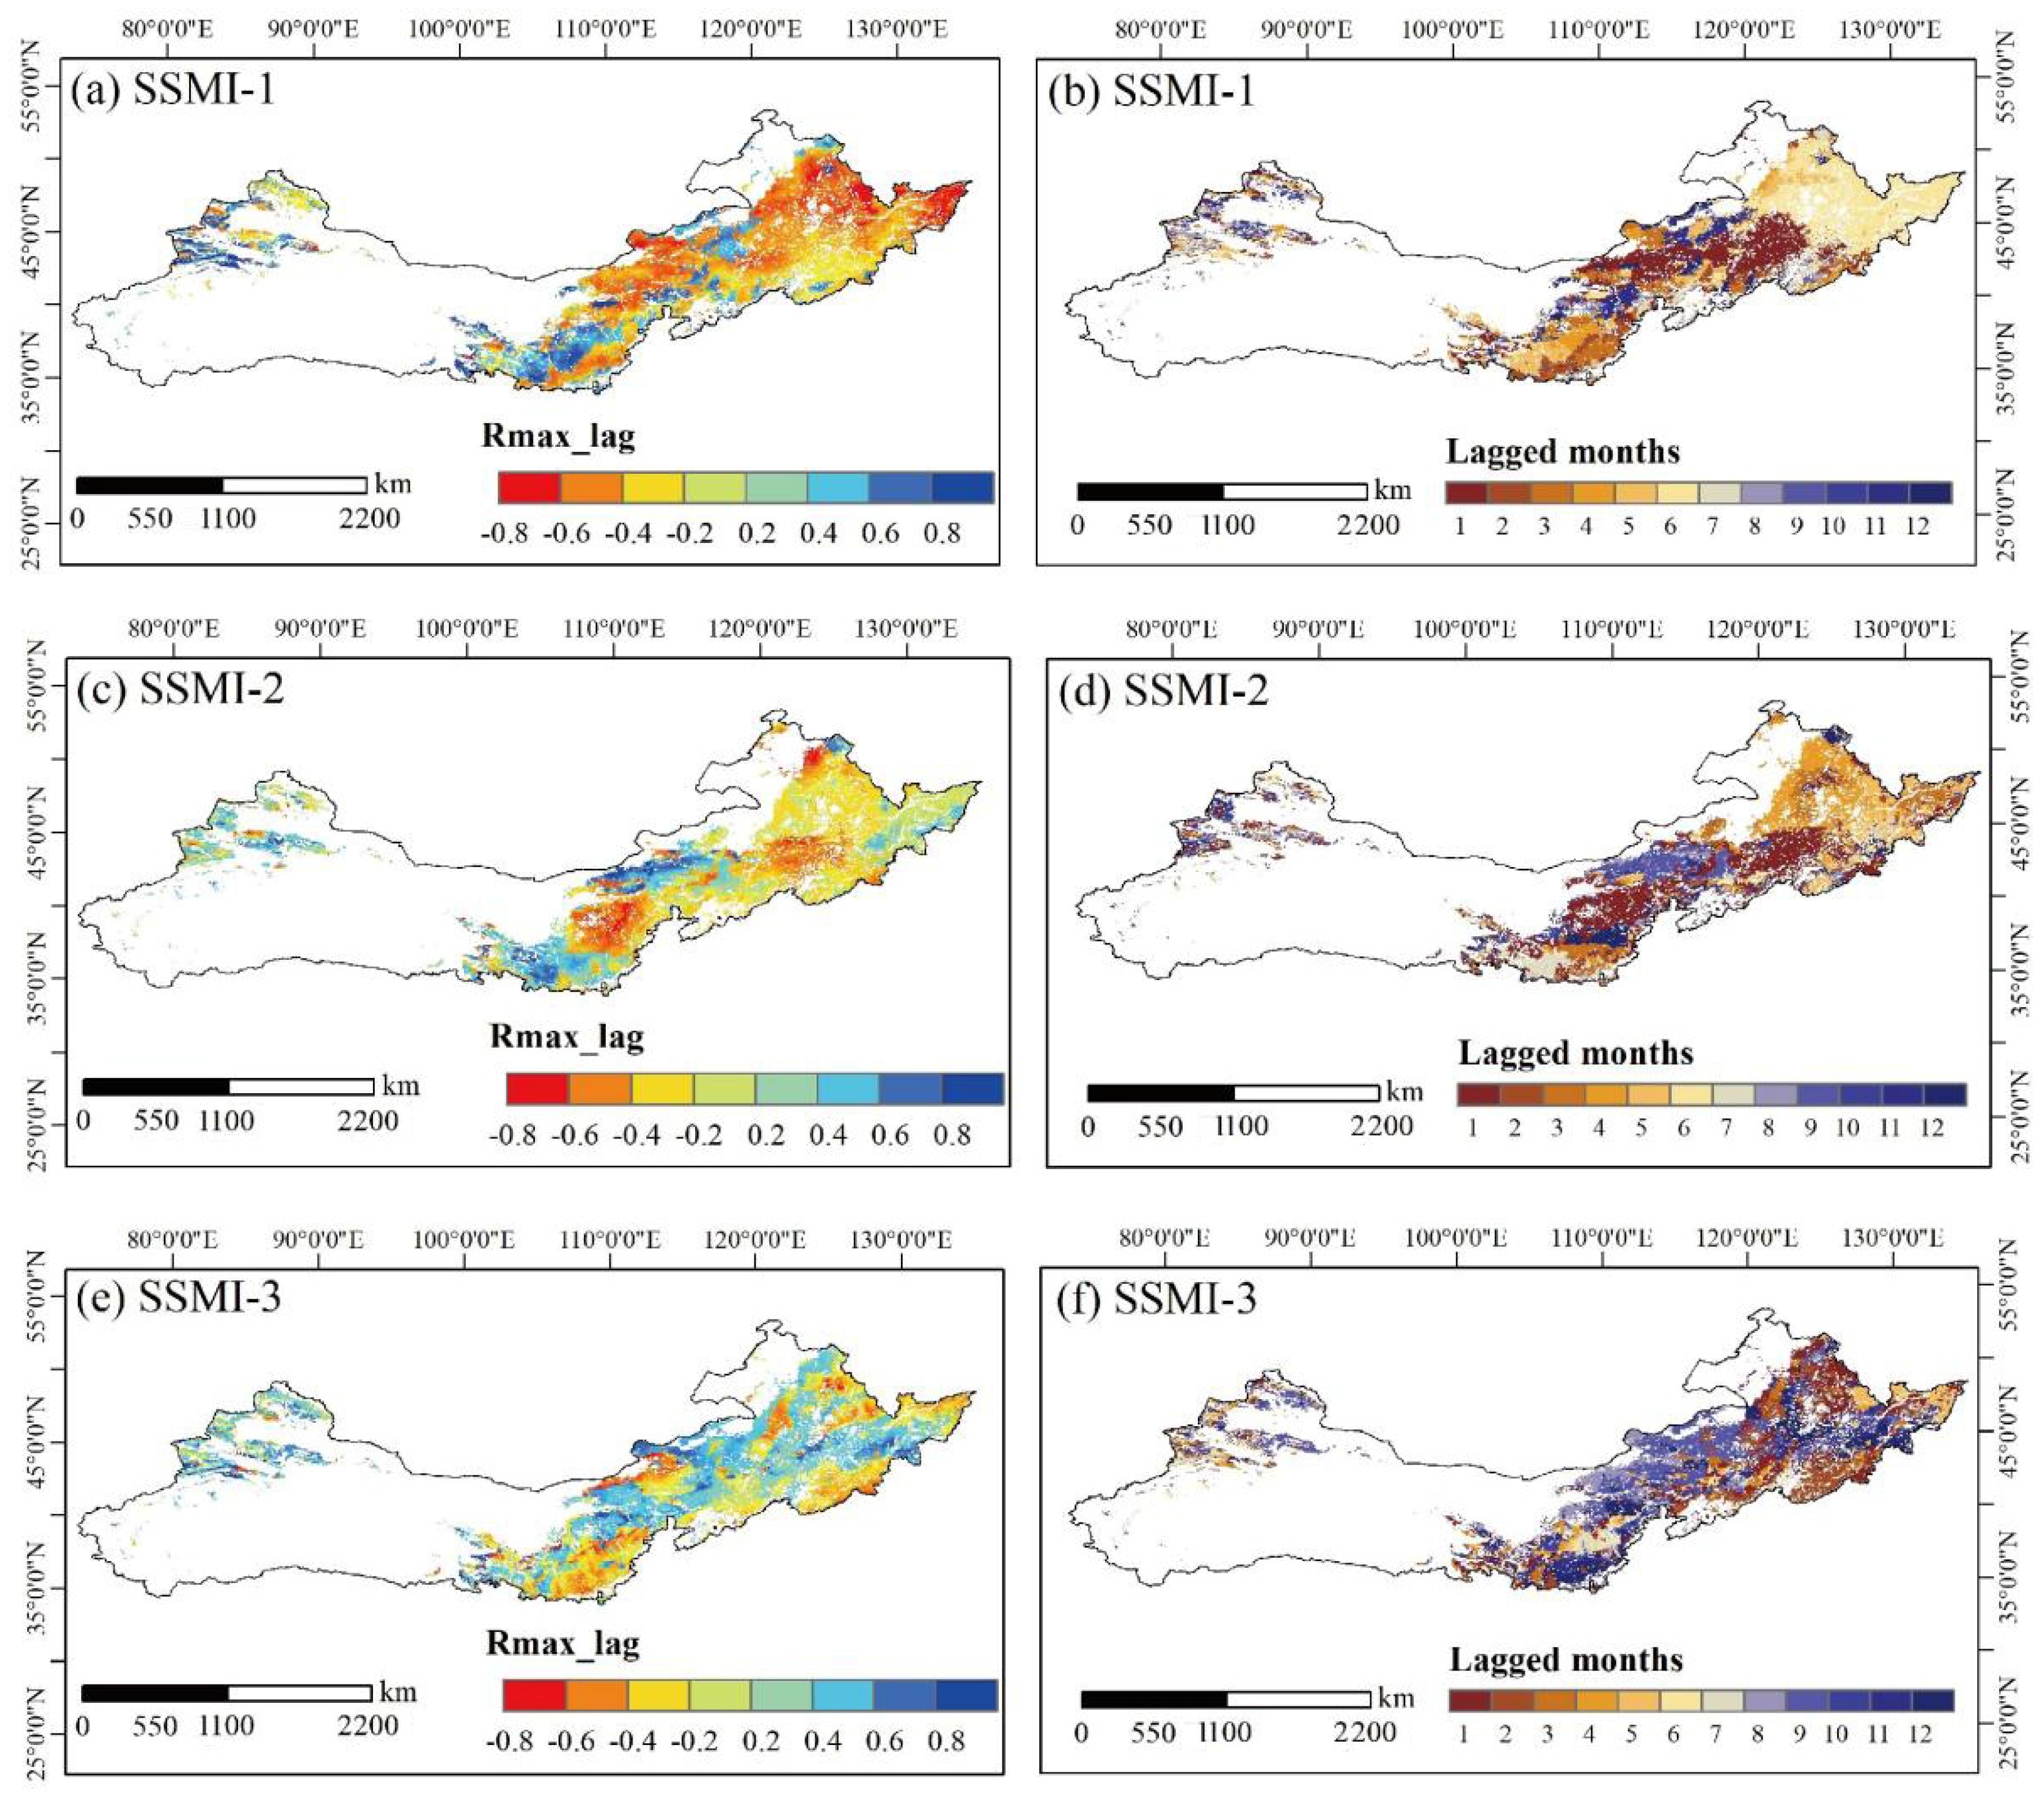
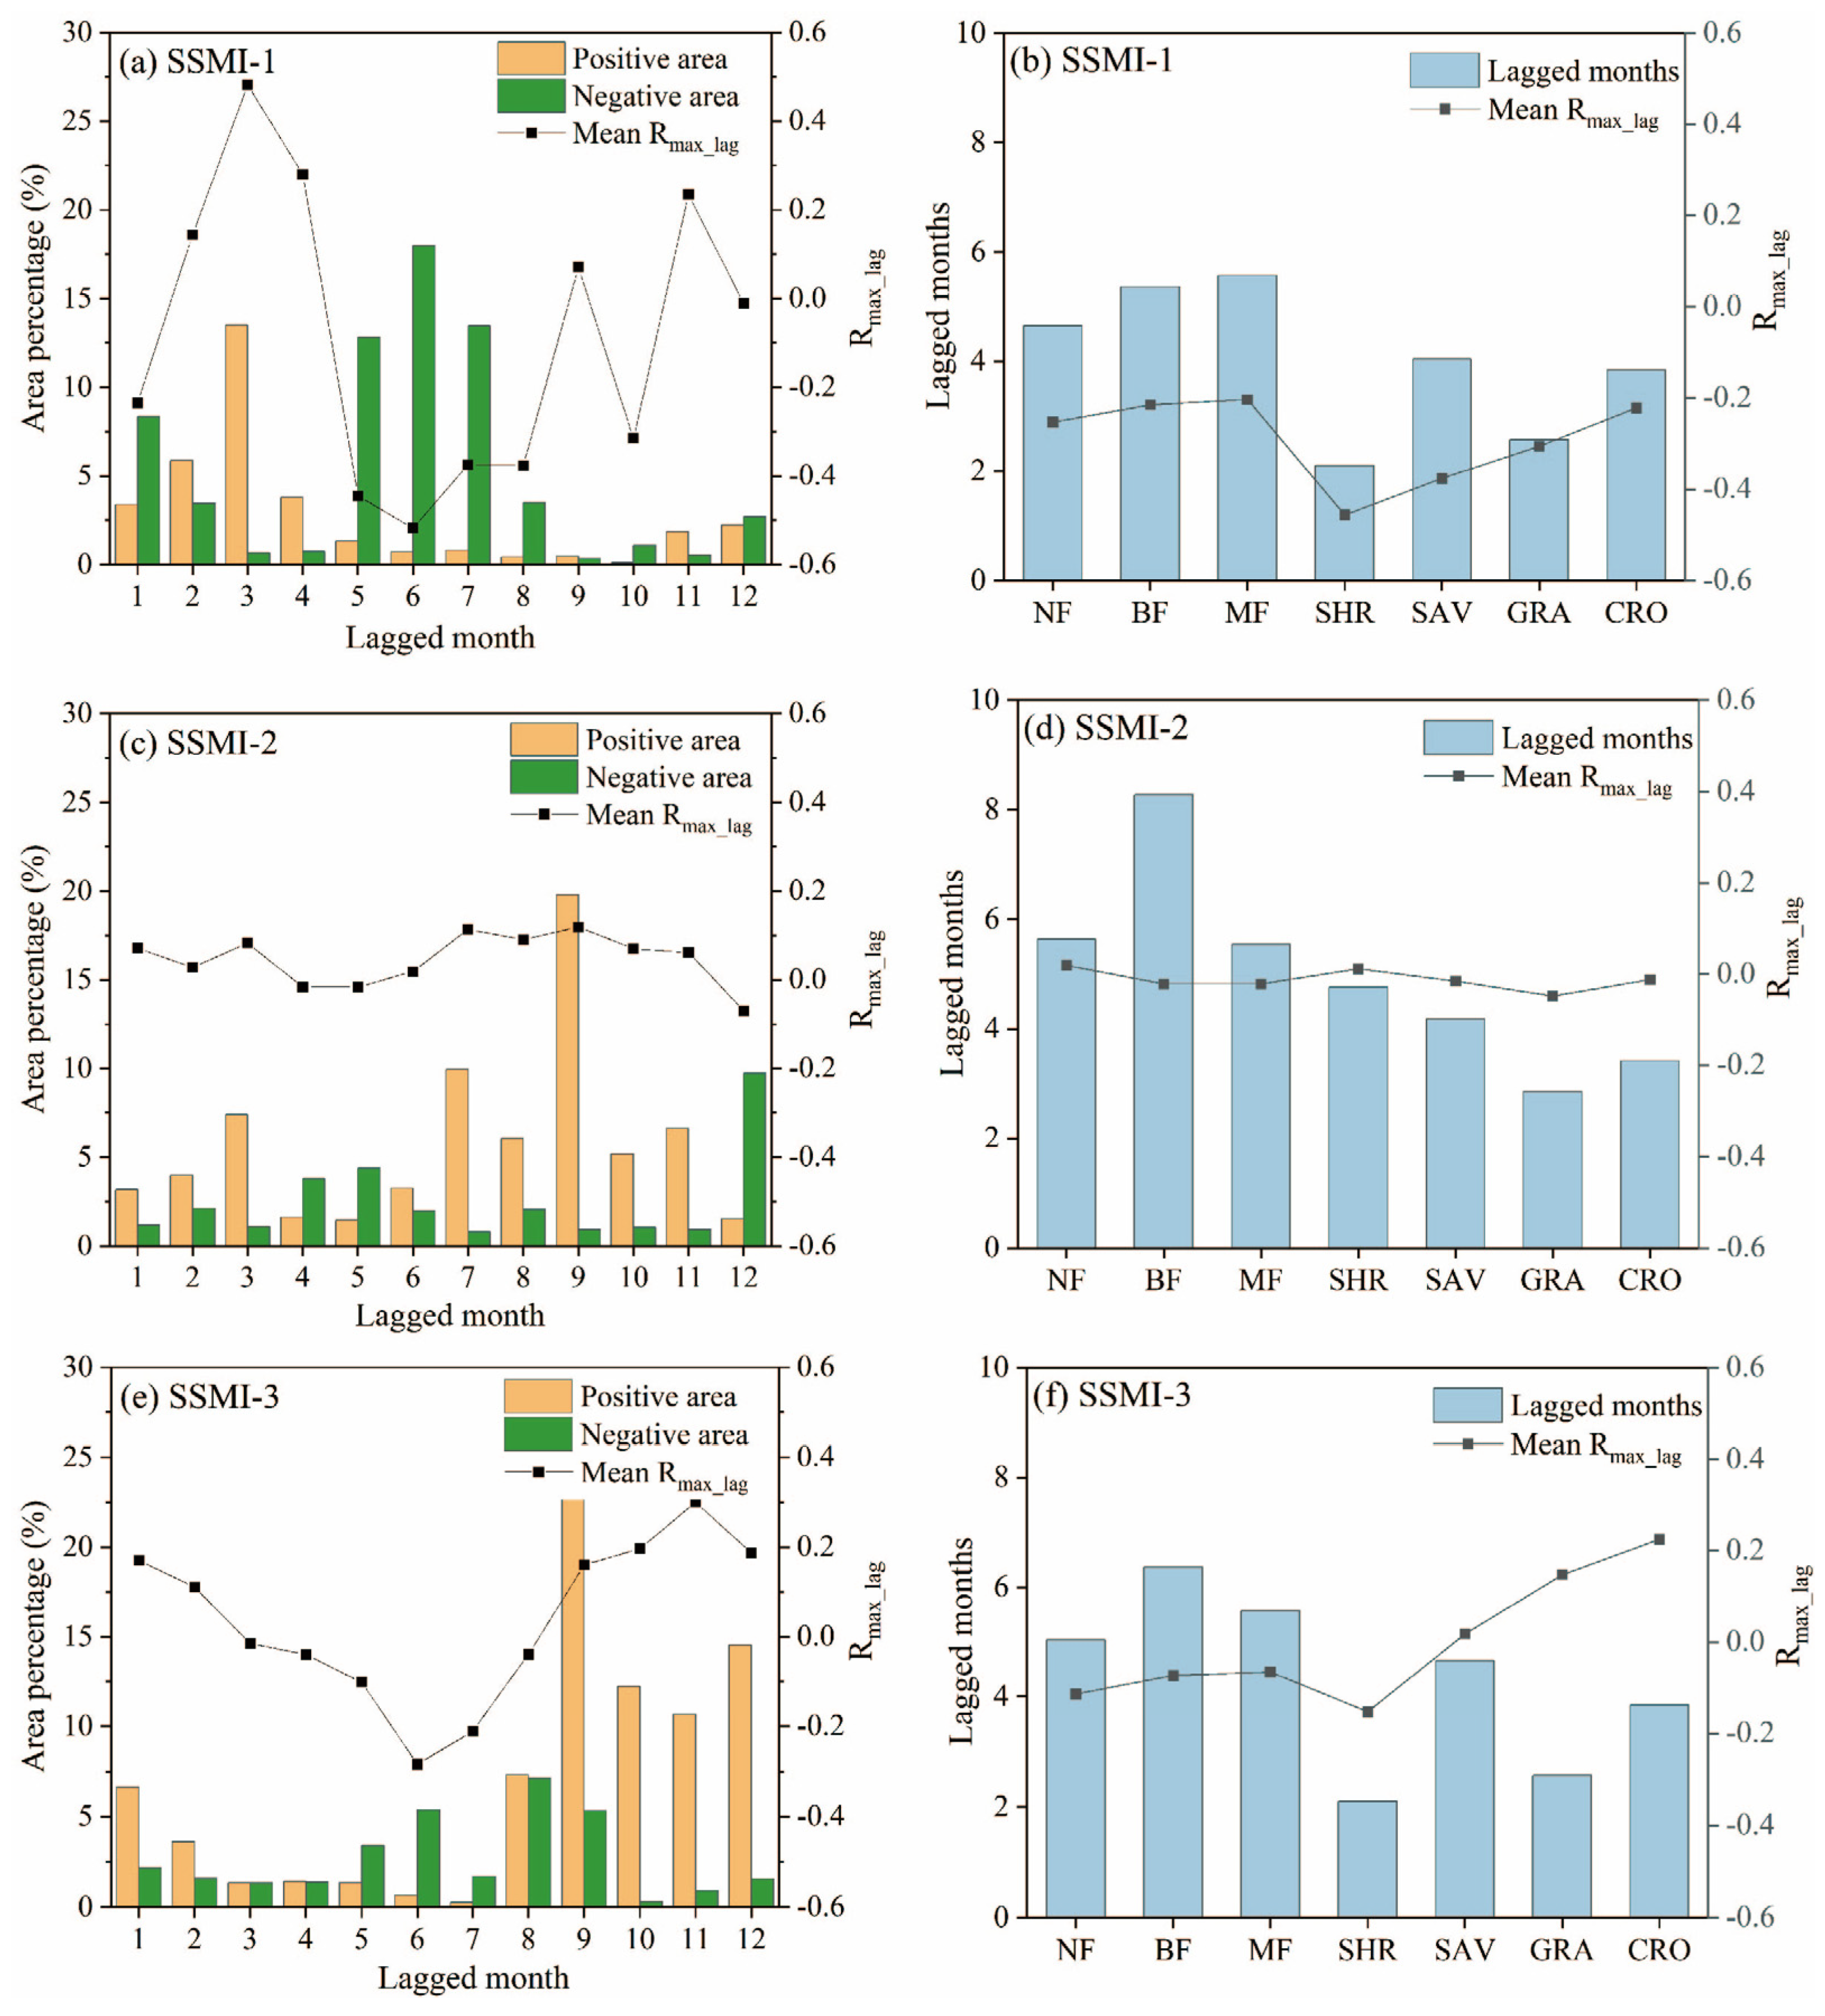
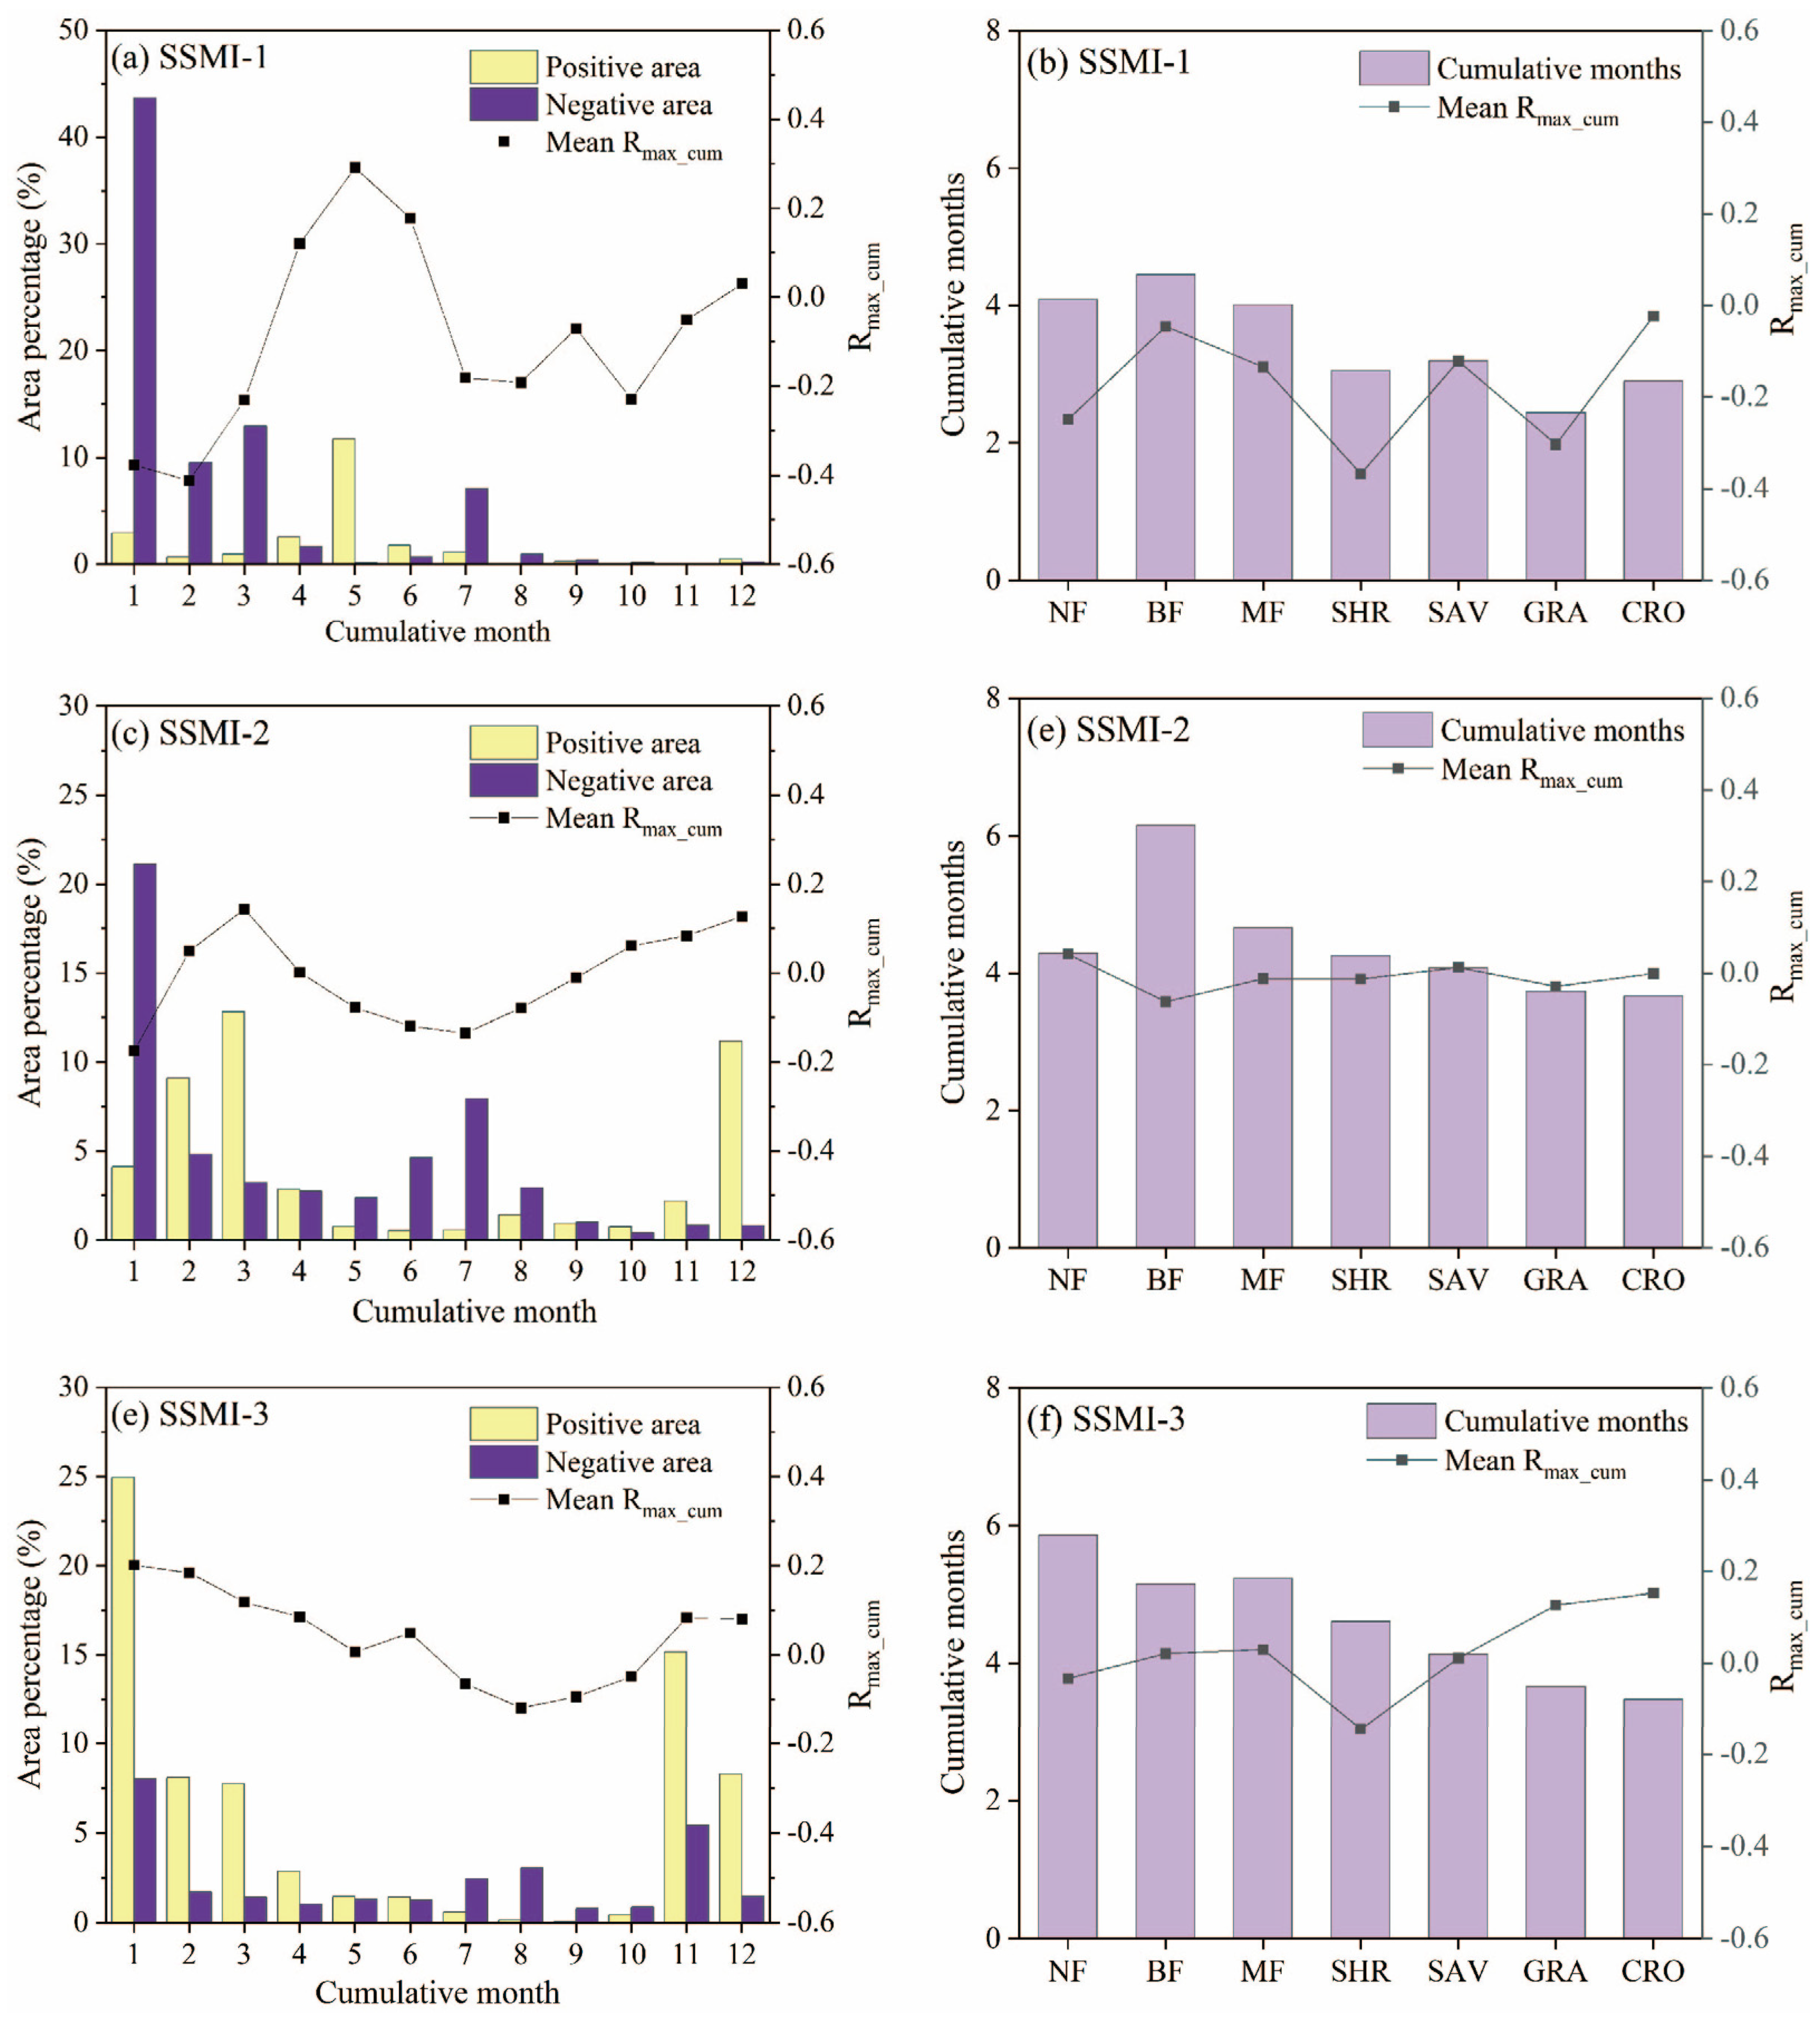
As shown in Figure 7 and Figure 8, the lagged associations between soil moisture drought and ecosystem WUE exhibited pronounced spatial heterogeneity and clear differences in dominant lagged months across the three soil layers in the TNSFP region. For SSMI-1, lagged associations were mainly distributed in the central-eastern and parts of the northeastern region, where negative correlations were more extensive than positive ones (Figure 7a). The corresponding lagged months were mainly concentrated in short- to medium-term scales, with relatively shorter lagged durations in the central-southern areas and longer lagged durations occurring locally in the northeastern region (Figure 7b). Positive lagged associations under SSMI-1 peaked at 3 months (Figure 8a), whereas negative lagged associations reached the greatest proportion at 6 months, indicating that WUE was primarily negatively associated with shallow soil moisture drought at medium-term lagged scales.
For SSMI-2, the spatial pattern of Rmax_lag became more heterogeneous, with positive and negative correlations interwoven across the central-eastern areas (Figure 8c). Meanwhile, the lagged months expanded from short-term to medium- and long-term scales, especially in the northeastern and eastern parts of the study area (Figure 8d). Figure 8b showed that positive lagged associations were most evident at 9 months, whereas negative associations were relatively weak and dispersed among different lagged months. These results suggested that the associations between WUE and middle-layer soil moisture drought were more delayed and temporally dispersed than those observed for shallow-layer soil moisture drought.
For SSMI-3, positive lagged associations became more extensive than in the shallower layers, particularly in the northeastern and eastern regions, whereas negative associations were mainly distributed in the central and southwestern margins (Figure 7e). At the same time, the corresponding lagged months shifted further toward medium- and long-term scales (Figure 7f). Positive lagged associations became markedly stronger at 9–12 months, while negative associations were mainly concentrated at 6–8 months (Figure 8c). These patterns indicate that deep-layer soil moisture drought was associated with a stronger delayed legacy signal than shallow- and middle-layer soil moisture drought.
Under the different vegetation types, the NF, BF, and MF exhibited longer lagged durations than others for the SSMI at all three soil layers, while GRA and CRO showed the shortest duration (Figure 8d,f). As shown in Table A1, all vegetation types for SSMI-1 were dominated by negative lagged associations, with negative area proportions ranging from 72.570% in MF to 93.207% in SHR. For SSMI-2, NF was the only vegetation type dominated by positive lagged associations, while the other vegetation types still showed larger negative lagged areas. For SSMI-3, positive lagged associations exceeded negative ones in SAV, GRA, and CRO.

3.3.2. Cumulative Associations Between Soil Moisture Drought and WUE

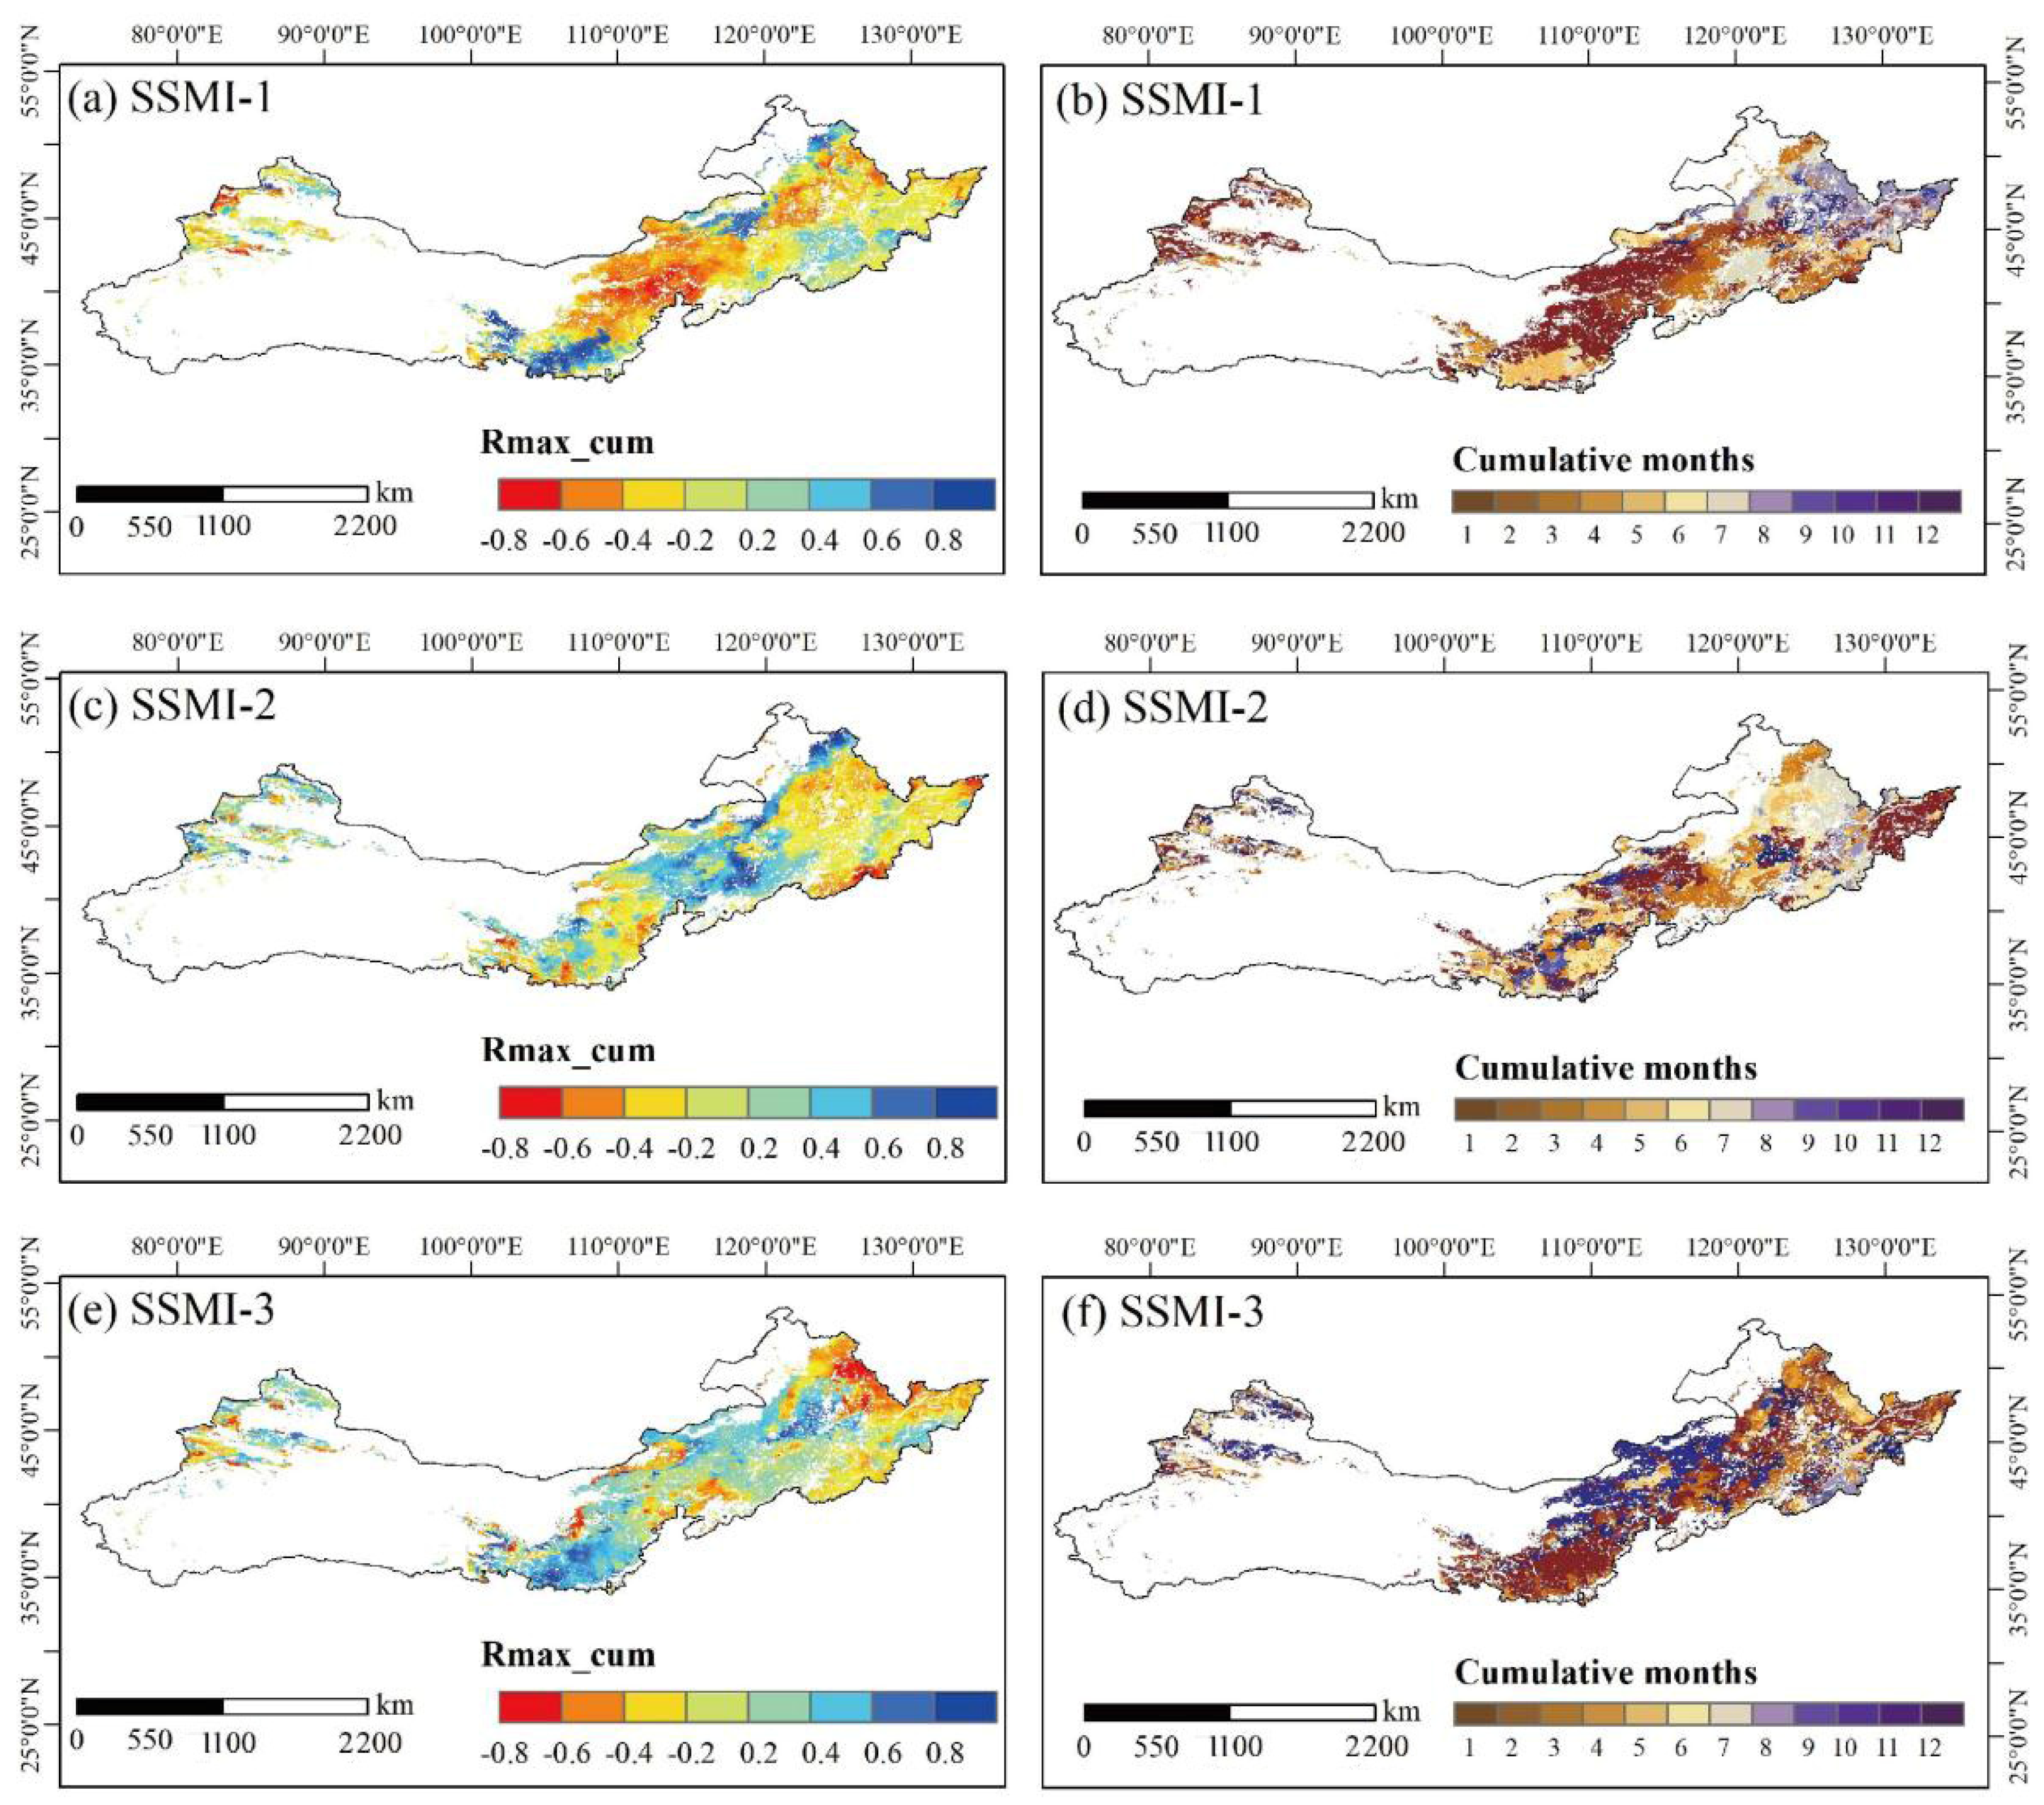
For SSMI-1, negative cumulative correlations were widely distributed in the central-eastern areas, whereas positive cumulative correlations only occurred in scattered patches, mainly in the northeastern and marginal areas (Figure 9a). The corresponding cumulative months were predominantly concentrated at short-term scales, especially in the central and southwestern parts of the region (Figure 9d). Figure 10a showed that negative cumulative associations reached the greatest area proportion at the 1-month scale, while positive cumulative associations mainly peaked at 4 months.
For SSMI-2, the spatial pattern of Rmax_cum became more heterogeneous (Figure 9c). The cumulative months expanded from short-term dominance to a mixture of short-, medium-, and long-term scales, especially in the northeastern and eastern regions (Figure 9d). Correspondingly, Figure 10b showed that positive cumulative associations became more evident at 3 and 12 months, whereas negative associations were mainly concentrated at 1, 7, and 8 months.
For SSMI-3, positive cumulative associations became more extensive than in the shallower layers, particularly in the central-western and northern parts of the TNSFP region, whereas negative cumulative associations were mainly retained in localized areas of the northeast and southwest (Figure 9e). At the same time, the corresponding cumulative months shifted further toward medium- and long-term scales, indicating a longer-term cumulative association between deep soil drought and WUE (Figure 9f). Figure 10c showed that positive cumulative associations became markedly stronger at 1, 11, and 12 months, while negative cumulative associations were relatively weaker and mainly concentrated at short cumulative scales.
Similar to the lagged duration among the vegetation types, the NF, BF, and MF showed a longer lagged duration than others for SSMI-1, SSMI-2, and SSMI-3, while GRA and CRO presented a shorter duration (Figure 10d,f). All vegetation types for SSMI-1 were dominated by negative cumulative associations (Table A2). For SSMI-2, cumulative responses became more balanced between positive and negative signs. For SSMI-3, positive cumulative associations became dominant in MF, GRA, and CRO, accounting for 53.243%, 74.501%, and 77.099% of area with significant correlations, respectively.

3.4. Ecosystem Resilience Under Soil Drought Stresses

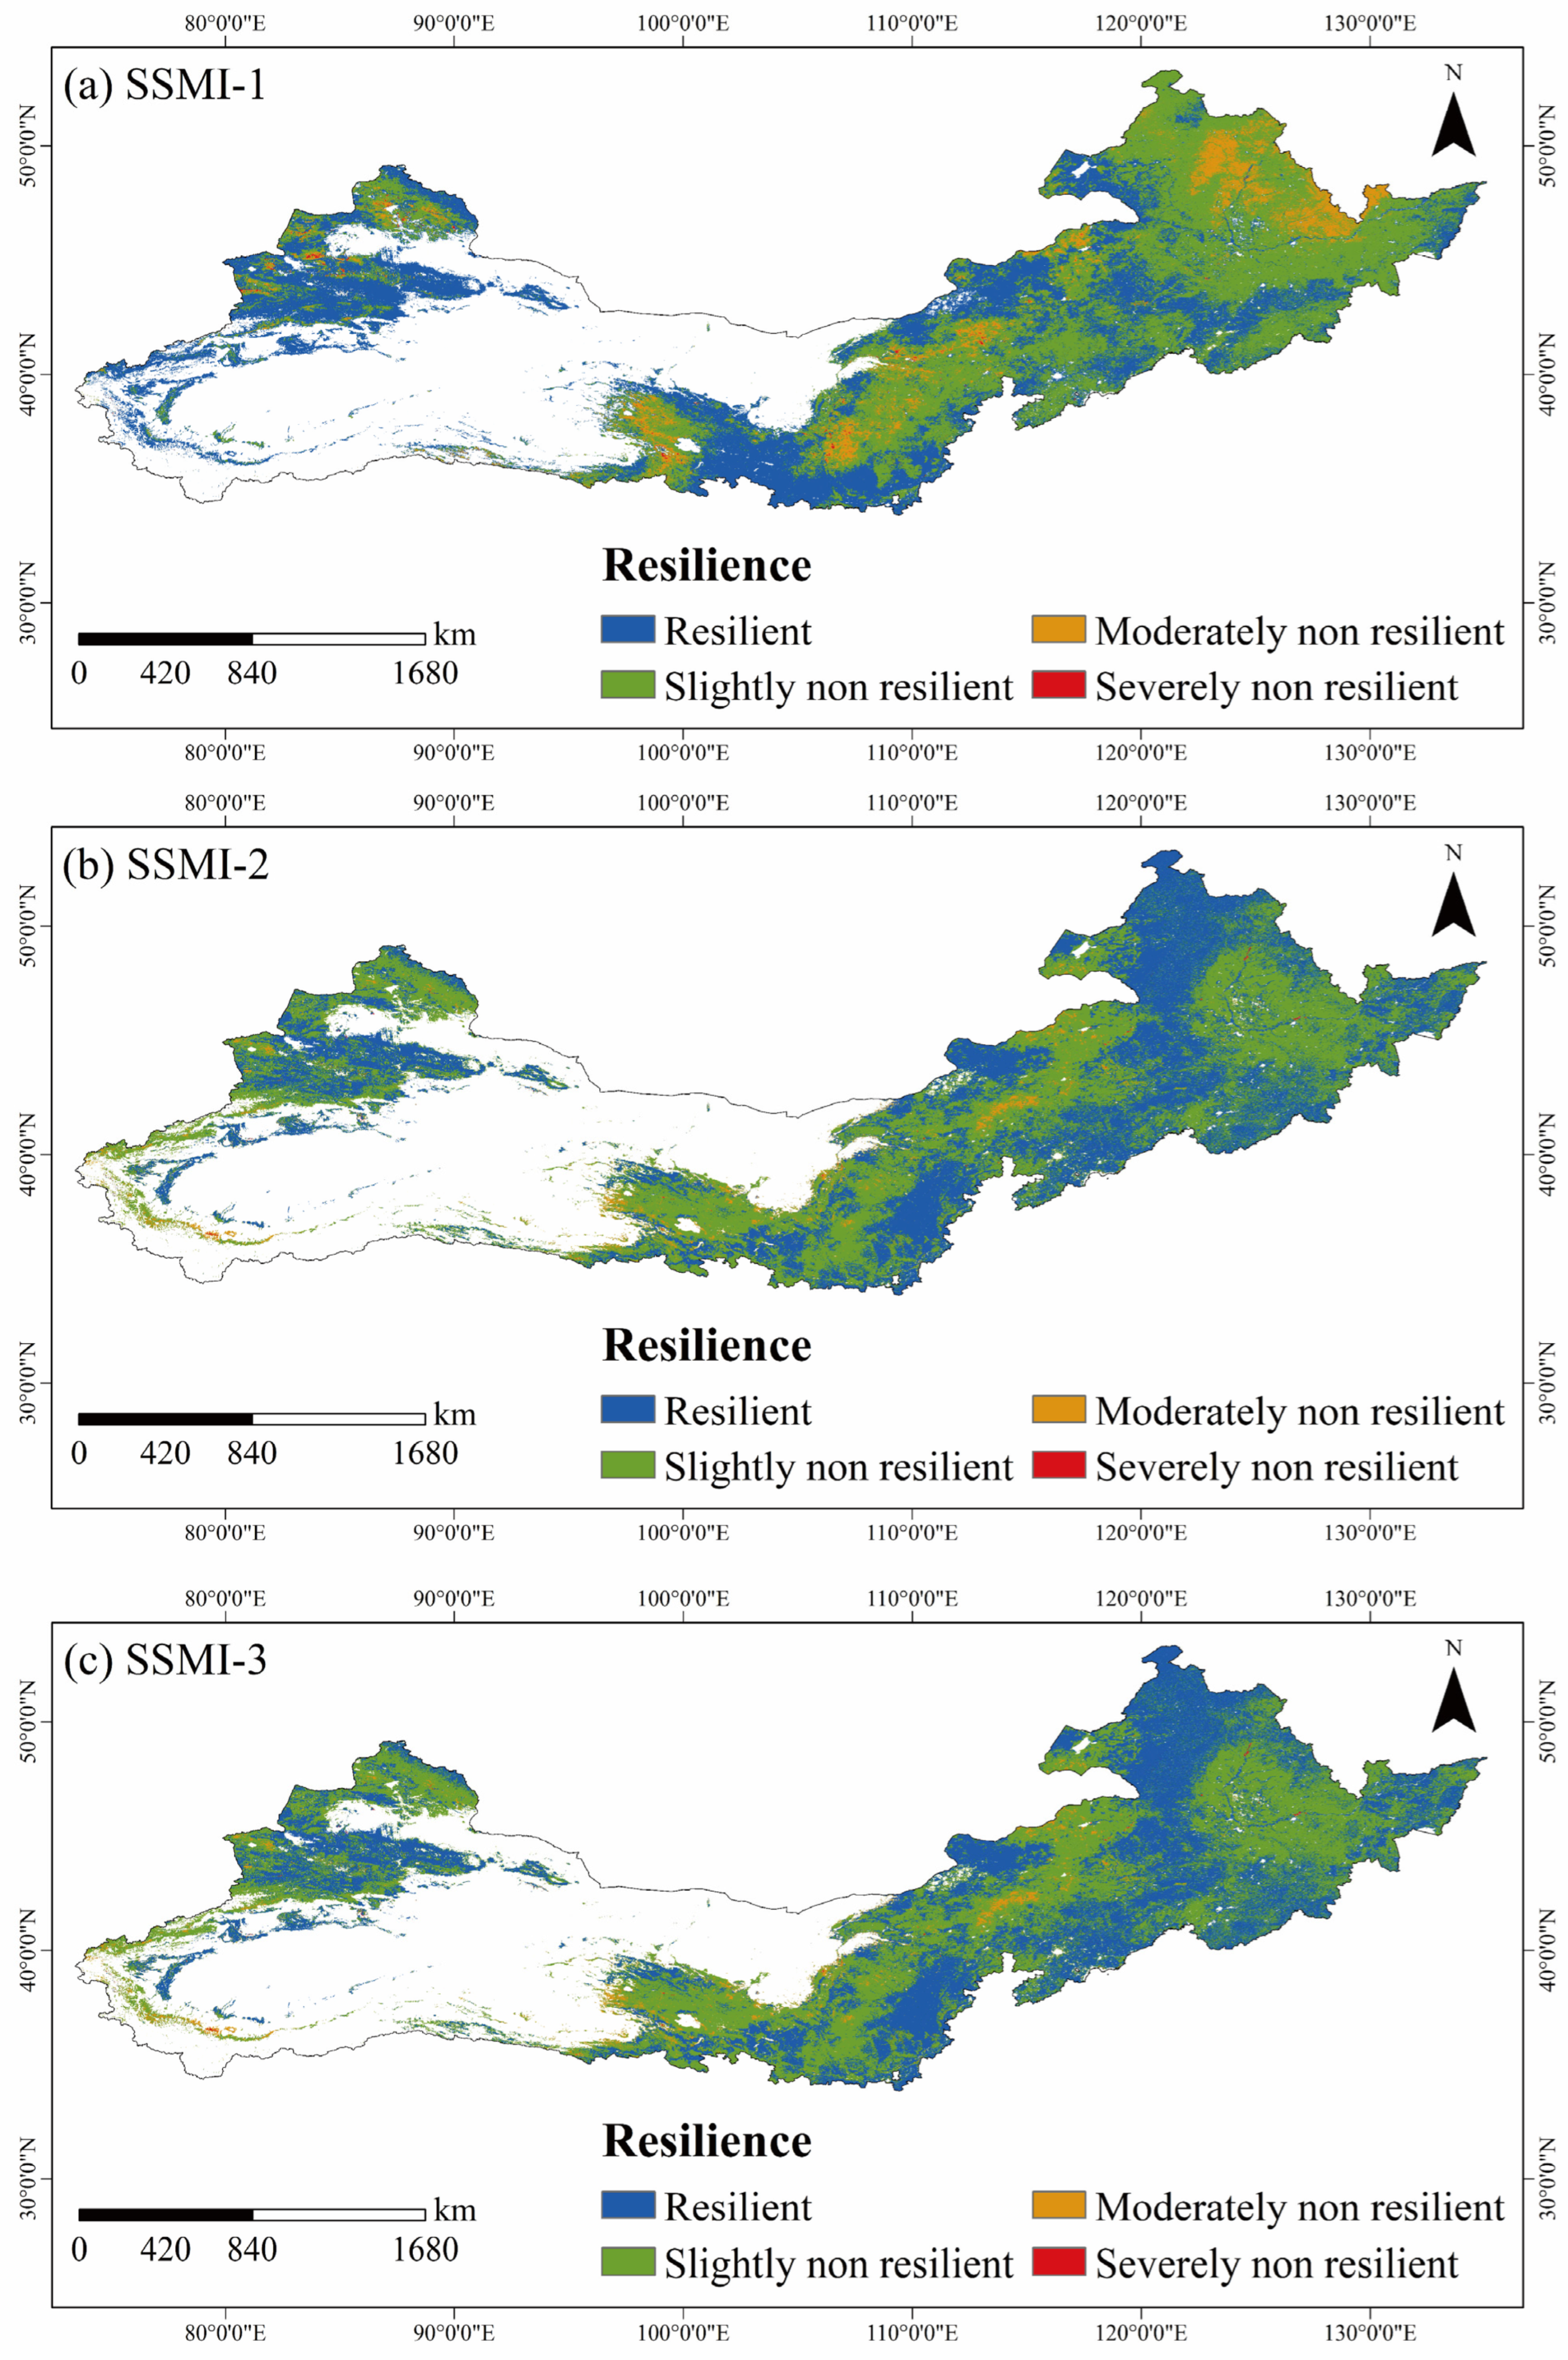
The spatial distribution of ecosystem resilience under vertical soil moisture deficit conditions is presented in Figure 11. In general, resilient and slightly non-resilient ecosystems dominated the TNSFP region under all three soil layers, while moderately and severely non-resilient areas were relatively limited and mainly distributed in scattered patches of the central and western parts of the study region. For SSMI-1, slightly non-resilient areas were widely distributed in the central-eastern areas, whereas resilient areas mainly appeared in the northeastern and northwestern margins (Figure 11a). For SSMI-2, resilient areas became more widespread and continuous than under SSMI-1, especially in the northeastern region (Figure 11b). For SSMI-3, the resilient areas further expanded in the northeastern and northwestern parts of the TNSFP region, while moderately non-resilient areas remained mainly scattered in the central transition zone (Figure 11c). These spatial patterns indicate that ecosystem resilience generally exhibited stronger expression under middle-layer and deep-layer soil moisture deficit than under shallow-layer soil moisture deficit in many vegetated areas.
Table 1 further showed that the resilience of different vegetation types varied distinctly with soil depth. For SSMI-1, only SHR and GRA were classified as resilient, with Rd values of 1.006 and 1.029, respectively, while the other vegetation types were slightly non-resilient. Among them, NF showed the lowest Rd value (0.951), followed by BF (0.955), SAV (0.964), MF (0.968), and CRO (0.988). For SSMI-2, the resilience pattern shifted toward woody vegetation. MF, SHR, and SAV were classified as resilient, with Rd values of 1.004, 1.013, and 1.006, respectively, whereas NF, BF, GRA, and CRO remained slightly non-resilient. SHR exhibited the strongest resilience under SSMI-2, while GRA showed the weakest resilience with an Rd value of 0.977. For SSMI-3, NF, MF, and SAV were resilient, with Rd values of 1.018, 1.007, and 1.008, respectively, whereas BF, SHR, GRA, and CRO were slightly non-resilient. NF showed the highest resilience under deep-layer soil moisture deficit conditions, while SHR and GRA both declined to an Rd value of 0.982. Overall, the resilience pattern indicated that the shallow-rooted vegetation such as GRA showed stronger resilience under shallow soil drought, whereas woody vegetation such as NF, MF, and SAV exhibited stronger resilience under middle-layer and deep-layer soil drought conditions.

4. Discussion

4.1. Spatiotemporal Coupling Relationship Between Soil Drought and Ecosystem WUE

This study revealed that ecosystem WUE exhibits pronounced spatial heterogeneity in response to soil moisture drought in the TNSFP region, with notable differences across the three soil layers, including 0–28 cm (SSMI-1), 28–100 cm (SSMI-2), and 100–289 cm (SSMI-3). Shallow soil moisture (0–28 cm) is highly sensitive to short-term precipitation and evaporation, leading to frequent fluctuations (Figure 2). In contrast, the middle (28–100 cm) and deep soil layers (100–289 cm) generally show slower temporal variations than shallow soil moisture. Therefore, they may provide information on longer-term soil water availability during dry periods [18,19]. While SSMI-1 and SSMI-2 generally showed upward trends with positive pixels covering 51.28% and 55.91% of the area, SSMI-3 exhibited a distinct downward trend with negative pixels making up 56.01% of the region. It was suggested that while shallow and middle soil layers may be recovering due to precipitation or management, the deep soil layer is experiencing a continuous deficit.
The spatial distribution shows that higher soil moisture levels are concentrated in central areas, while lower values are found in the northern and western arid zones. These patterns are closely linked to the different sensitivities of GPP and ET to water shortages across the region [29]. In the arid western parts of the TNSFP region, vegetation exhibits strong adaptation to drought conditions. These plants respond quickly to water limits by reducing transpiration (ET) more significantly than photosynthetic capacity (GPP), which leads to an increase in WUE [6]. In the central region where deep soil moisture is persistently depleted, the buffering effect of subsoil water weakens, and prolonged water limitation may eventually constrain both GPP and ET, thereby reducing the stability of WUE [30]. This suggests that the sustainability of vegetation restoration in these areas depends not only on increases in vegetation productivity or coverage, but also on whether deep soil water reserves can support long-term carbon–water coupling. In contrast, dense forests in the southeastern region utilize stable deep soil moisture to support high levels of both transpiration and carbon fixation, resulting in higher observed WUE [14].
Consistent with the global pattern of WUE enhancement [11,13], the ET, GPP, and WUE showed increasing trends in the TNSFP region from 2001 to 2022. Such asynchronous changes in ET and GPP may offset each other in the calculation of WUE, thereby weakening the overall synchronous response of WUE to soil moisture drought. In this study, ET generally declined with increasing drought severity, and the decline became more evident with increasing soil depth, whereas GPP remained relatively stable under shallow-layer and middle-layer soil moisture deficit but decreased more clearly under deep-layer soil drought. This suggested that under shallow drought, reduced water loss may partly offset the impact of drought on carbon uptake, thereby weakening the immediate response of WUE. By contrast, under deep drought, prolonged water limitation may constrain photosynthetic carbon assimilation more strongly, leading to a different WUE response pattern [30]. Figure 3 suggests that differences in WUE among diverse vegetation types were closely related to their utilization capacity of deep soil moisture. The higher observed WUE in forest ecosystems may be partly related to their greater capacity to access deep soil water, which is consistent with their deeper rooting systems [31], maintaining stable GPP during droughts. In contrast, croplands and grasslands with shallow roots rely more on shallow soil moisture [32], resulting in lower WUE and weaker coupling with deep soil moisture.
The response of WUE to soil moisture drought in the TNSFP region differs from the threshold effect reported by Zhang et al. [20], who found that the WUE of most vegetation types peaked at moderate soil drought (SSMI = −0.5). However, our study revealed that the relationships between WUE and SSMI were nonlinear and non-significant and also did not detect a threshold. This discrepancy may be attributed to the distinct characteristics of vegetation adaptation strategies [33]. The shallow soil moisture fluctuates drastically with short-term precipitation and evaporation, leading to a clear threshold in the trade-off between GPP and ET [34]. In contrast, the deep soil layer maintains relatively stable moisture content [18] and serves as a buffering water reservoir for vegetation.
Unlike some previous studies that identified a threshold effect where WUE peaks at moderate drought levels [12], our study found that the synchronous responses of WUE to soil moisture were weak and non-significant across all three soil layers (Figure 6). No clear threshold effect was detected for SSMI-1, SSMI-2, and SSMI-3. This lack of a threshold response can be attributed to the asynchronous changes in ET and GPP under drought stress within the TNSFP region. As drought severity increases, the simultaneous decline in ET and the relative stability of GPP may offset each other in the WUE calculation, thereby weakening the immediate coupling between WUE and soil moisture status at the monthly scale [19]. This suggests that the TNSFP ecosystems may rely more on longer-term cumulative and lagged adjustments rather than immediate threshold-based physiological responses to manage water stress.

4.2. Lagged and Cumulative Associations Between Soil Moisture Drought and WUE

Previous studies have provided evidence that ecosystem WUE not only responded instantaneously to meteorological and soil moisture drought but also exhibited a lagged and cumulative response following the occurrence of droughts [20]. This study systematically examined these effects across three distinct soil layers, revealing a clear vertical shift in the timing of drought associations. In the shallow soil layer (0–28 cm), the lagged associations were primarily negative and concentrated in short- to medium-term scales, typically peaking at 3–6 months. These findings aligned with previous studies that suggested that shallow moisture deficits quickly force plants to adjust their water use strategies to prevent dehydration, primarily through stomatal closure to reduce water loss, thereby increasing WUE in the short term [35]. However, this adaptive response is often temporary and can be overwhelmed when drought conditions persist for longer periods [36]. As drought stress moves into the middle (28–100 cm) and deep (100–289 cm) layers, the lagged duration significantly increases, with impacts often reaching 9–12 months. This delayed transmission of drought signals may be related to the slower response of deep soil moisture to short-term climate fluctuations [18]. Unlike shallow soil moisture, which is more responsive to rapid changes in precipitation and evaporation, the deep soil moisture exhibits a more gradual depletion, with longer-term physiological effects on vegetation, including root development and stomatal regulation [33].
The negative lagged associations are dominant in the shallow layer, indicating that drought is often associated with a temporary increase in WUE as plants close their stomata to reduce water loss [7]. As shown in Figure 2, our study area predominantly experienced light and moderate drought (−1 < SSMI < 0). Under light and moderate drought, plants responded to drought via stomatal closure to reduce water loss at the expense of carbon assimilation and consequently increased WUE and negative lagged associations [35]. Moreover, abundant precipitation during the growing season was likely to offset legacy effects of previous droughts [37]. However, positive lagged associations became more widespread in the deep soil layer. These positive associations suggested that deep moisture deficits may be associated with a decline in WUE by overcoming the adaptive limits of the ecosystem [5]. This finding highlighted the widespread sensitivity of even shallow-rooted vegetation to deep soil moisture, especially when surface layers became dry. It also underscored the potential importance of deep soil moisture for WUE stability during prolonged drought conditions, particularly for vegetation types with deep root systems [17].
The cumulative association analysis further confirms that most vegetated areas experienced cumulative associations, and deeper-layer soil moisture deficit showed a more persistent and longer-lasting association with WUE than shallow-layer soil moisture deficit (Figure 7). Shallow soil drought (SSMI-1) generally was associated with WUE through short-term cumulative responses (1–4 months), which was consistent with that in the Yellow River Basin (4.50 months) [12], and the duration was longer than that in the Ziya River Basin (2.11 months) [14]. In the TNSFP and Yellow River Basins, which were characterized by arid and semi-arid conditions, moderate water limitations and dominance of soil moisture drought led to relatively longer cumulative associations. In contrast, the Ziya River Basin, with extensive cropland and intensive irrigation, exhibited shorter cumulative durations, which may be related to continuous moisture replenishment from irrigation, which interrupted deep soil moisture depletion [38]. In the TNSFP region, deeper soil drought influenced WUE over much longer cumulative time scales, where long-term cumulative associations accounted for a large portion of the affected area. This suggested that deep soil moisture depletion may be associated with persistent water stress and longer-term changes in the balance between GPP and ET [39]. Such long-lasting cumulative associations imply that sustainable vegetation management in the TNSFP region should account for delayed ecosystem responses rather than relying solely on short-term drought indicators.
Among different vegetation types in the TNSFP region, forests (NF, BF and MF) exhibited the longer average lagged and cumulative duration, while CRO had the shorter duration (Figure 7 and Figure 9). This pattern was closely related to the structural and functional characteristics of vegetation. Forests with deep and extensive root systems can access deep soil moisture to buffer immediate drought stress [31], leading to a delayed lagged response. Meanwhile, their high-water demand and long growth cycle mean that continuous deep soil moisture deficit accumulates over time, resulting in longer cumulative duration [40]. The short lagged and cumulative durations of CRO were primarily due to anthropogenic management (e.g., irrigation) that supplements soil moisture, reducing the persistence of drought stress [41]. Additionally, crops had a short growth cycle and rapid physiological turnover, leading to faster responses to drought and weaker cumulative associations compared to natural vegetation [32].

4.3. Vertical Variations in Ecological Resilience to Soil Moisture Drought

Ecological resilience to soil drought refers to the ability of ecosystems to maintain or recover their structure and function under water stress, which was a key indicator of ecosystem stability [42]. Our analysis shows that while resilient and slightly non-resilient areas dominate the region, the specific ability of different vegetation types to maintain WUE stability depends on the depth at which drought occurs. Under shallow soil moisture drought (SSMI-1), only SHR and GRA were classified as resilient, with Rd values of 1.006 and 1.029, respectively (Table 1). This high resilience in shallow layers is likely due to the rapid physiological adjustment of shallow-rooted species, which allows them to effectively capture pulse precipitation and recover quickly from short-term moisture deficits [19]. In contrast, forest ecosystems showed lower resilience in the shallow layer, with needleleaf forests exhibiting the lowest Rd value of 0.951. As drought stress moves into the middle and deep soil layers, the pattern of resilience shifts significantly in favor of woody vegetation. For deep soil drought, NF, MF, and SAV were classified as resilient, with NF reaching its highest Rd value of 1.018. This higher resilience in deeper layers may be partly related to the greater ability of woody plants to access stable subsoil moisture through deeper rooting systems [21].
This vertical shift suggested that the long-term stability of the TNSFP region depends on the ability of its diverse vegetation types to utilize water from different soil depths based on their specific rooting strategies. However, the resilience of GRA and SHR declined to 0.982 under deep-layer soil moisture deficit conditions. This decline supports the growing evidence that even though grasslands are primarily shallow-rooted, their ecosystem functions are increasingly sensitive to the status of deep soil moisture reserves [17]. When deep soil water is exhausted due to prolonged drought or excessive consumption by surrounding forests, the protective buffering capacity for grasslands is lost, leading to a state of non-resilience [43]. These findings have significant implications for the sustainable management of the TNSFP project. The vertical bifurcation of resilience emphasizes the necessity of matching vegetation types with the water availability of specific soil layers [6]. To prevent the unsustainable depletion of deep soil water, which we identified as a growing concern in the Loess Plateau and other key regions, forest management must consider stand characteristics such as planting density and species composition [44]. Promoting a balanced distribution of shallow-rooted and deep-rooted species can enhance the overall ecological resilience of the region to multi-layer soil moisture drought. Such strategies are essential for improving the sustainability of large-scale ecological restoration in water-limited regions.

4.4. Limitations

Although this study provided a comprehensive perspective on the vertical responses of WUE to soil moisture drought, several limitations should be acknowledged. First, WUE responses to soil moisture drought may be confounded by atmospheric and climatic drivers. In northern China, strengthened land–atmosphere coupling and high VPD may intensify soil moisture stress by promoting earlier stomatal closure and altering both GPP and ET [6]. Therefore, future investigations should combine soil moisture, atmospheric aridity, radiation, flux observations, and vegetation structural information to better disentangle their individual and interactive effects on ecosystem carbon–water coupling.
Second, although SSMI is useful for representing soil moisture anomalies across different soil layers, it depends on the accuracy of the soil moisture dataset. ERA5-Land provides continuous multi-layer soil moisture information, but its deep-layer estimates (100–289 cm) are model-derived and less directly constrained by satellite and in situ observations than surface soil moisture [19]. GLDAS/Noah, GLEAM root-zone soil moisture, and GRACE-based terrestrial water storage can provide useful references, but they are not directly equivalent to ERA5-Land deep-layer soil moisture because they differ in soil-depth definition, water-storage components, model structure, and spatial resolution [25]. Therefore, the deep-layer depletion identified in this study should be interpreted as reanalysis-based evidence and requires further validation using in situ deep soil moisture observations.

5. Conclusions

This study evaluated the spatiotemporal evolution of multi-layer soil moisture drought and its associations with ecosystem WUE and resilience in the TNSFP region from 2001 to 2022. The main conclusions are as follows: (1) while the shallow (0 to 28 cm) and middle (28 to 100 cm) soil layers generally showed upward trends, the deep soil moisture (100 to 289 cm) exhibited a continuous deficit in 56.01% of the study area, particularly in the northern Loess Plateau and the Jungger Basin; (2) the synchronous relationship between ecosystem WUE and soil moisture drought was generally weak across all three soil layers, and no significant threshold effects were detected. However, the dominant lagged and cumulative associations shifted toward longer time scales with increasing soil depth, from 3 to 6 months in the shallow layer to 9–12 months in the deep layer. These results suggest that deep-layer soil moisture was associated with longer-term variations in WUE and may provide information on delayed ecohydrological responses; (3) ecosystem resilience showed vertical differences among vegetation types. Grasslands showed higher resilience under surface moisture fluctuations but lower resilience under deep-layer soil moisture deficits. Conversely, forest ecosystems showed higher stability under deep-layer stress, which may be partly related to their deeper rooting systems and greater access to subsoil water. These findings suggest that restoration management should optimize stand structure and species composition according to soil water availability across different soil layers for ecosystem sustainability.

Author Contributions

Writing—original draft preparation, E.H.; Conceptualization, methodology, R.W.; Methodology, software, L.Y.; Writing—review and editing, H.Z. All authors have read and agreed to the published version of the manuscript.

Funding

This study was funded by the Inner Mongolia Academy of Forestry Sciences Open Research Project, Hohhot 010010, China (Project No. KF2024ZD04, KF2025ZD07), Inner Mongolia Autonomous Region Natural Science Foundation Project (No. 2024LHMS03026).

Institutional Review Board Statement

Not applicable.

Informed Consent Statement

Not applicable.

Data Availability Statement

The primary datasets analyzed in this study are publicly available and long-term monitored open-access products. ERA5-Land monthly reanalysis dataset (2001–2022) was sourced from the European Centre for Medium-Range Weather Forecasts (ECMWF) Copernicus Climate Change Service (C3S) (https://apps.ecmwf.int/datasets/, accessed on 1 December 2025). MODIS Version 6.1 datasets (2001–2022), including MOD13A3 (NDVI), MOD17A2H (GPP), MOD16A2 (ET), and MCD12Q1 (Land Cover Type), were obtained from the US Geological Survey (USGS) Land Processes Distributed Active Archive Center (LP DAAC) (https://ladsweb.modaps.eosdis.nasa.gov/, accessed on 15 December 2025). The complete data-processing schematic diagram and methodological workflow are detailed in Section 2.2 and Section 2.3 of this manuscript. The source codes used to extract data can be made available by the corresponding author upon reasonable request.

Conflicts of Interest

The authors declare no conflicts of interest.

Appendix A

Table A1. Area percentages of positive and negative Rmax_lag and lagged time scales under different vegetation types.
Vegetation TypesType of SSMIArea Percentage (%)
Rmax_LagLagged Months
PositiveNegativeShort TermMedium TermLong Term
(1–4 Months)(5–8 Months)(9–12 Months)
NFSSMI-110.028 89.972 19.767 78.682 1.550
SSMI-263.225 36.775 35.112 34.730 30.158
SSMI-332.033 67.967 21.846 48.923 29.231
BFSSMI-125.977 74.023 34.318 65.617 0.065
SSMI-230.016 69.984 34.673 47.528 17.799
SSMI-344.155 55.845 23.645 44.819 31.536
MFSSMI-127.430 72.570 30.139 69.453 0.408
SSMI-234.118 65.882 25.272 37.012 37.716
SSMI-349.808 50.192 24.301 48.534 27.164
SHRSSMI-16.793 93.207 88.449 11.394 0.157
SSMI-216.564 83.436 37.683 31.126 31.190
SSMI-318.750 81.250 51.940 15.476 32.584
SAVSSMI-121.347 78.653 40.838 57.630 1.533
SSMI-226.821 73.179 37.683 31.126 31.190
SSMI-356.293 43.707 31.002 22.116 46.882
GRASSMI-121.107 78.893 44.388 42.288 13.324
SSMI-239.808 60.192 26.834 54.816 18.351
SSMI-375.952 24.048 15.388 23.693 60.919
CROSSMI-126.435 73.565 31.939 60.705 7.356
SSMI-229.490 70.510 54.153 34.235 11.612
SSMI-387.143 12.857 14.900 11.379 73.721
Table A2. Area percentages of positive and negative Rmax_cum and cumulative time scales under different vegetation types.
Vegetation TypesType of SSMIArea Percentage (%)
Rmax_CumCumulative Months
PositiveNegativeShort TermMedium TermLong Term
(1–4 Months)(5–8 Months)(9–12 Months)
NFSSMI-17.521 92.479 73.538 19.499 6.964
SSMI-255.292 44.708 52.939 34.433 12.628
SSMI-340.947 59.053 69.638 19.499 10.864
BFSSMI-136.641 63.359 68.467 30.913 0.620
SSMI-252.416 47.584 51.968 34.475 13.557
SSMI-344.332 55.668 55.736 30.636 13.628
MFSSMI-121.077 78.923 74.846 23.103 2.051
SSMI-240.136 59.864 56.403 28.699 14.898
SSMI-353.243 46.757 52.059 40.479 7.462
SHRSSMI-13.321 96.679 93.297 5.888 0.815
SSMI-236.814 63.186 59.905 21.065 19.030
SSMI-316.033 83.967 91.214 0.483 8.303
SAVSSMI-126.614 73.386 79.595 19.070 1.335
SSMI-246.178 53.822 64.401 13.129 22.469
SSMI-345.543 54.457 59.801 19.253 20.946
GRASSMI-114.570 85.430 81.809 16.695 1.496
SSMI-249.982 50.018 60.052 20.645 19.303
SSMI-374.501 25.499 51.918 9.868 38.215
CROSSMI-145.775 54.225 50.608 46.543 2.849
SSMI-248.379 51.621 64.082 27.637 8.280
SSMI-377.099 22.901 69.320 7.634 23.046
Figure A1. Fitting relationships between WUE and SSMI across different soil layers at the 1-month time scale under different vegetation types.
Sustainability 18 07771 g0a1
Figure A2. Fitting relationships between ET, GPP, and SSMI across different soil layers at the 1-month time scale under different vegetation types.
Sustainability 18 07771 g0a2

References

  1. Sinclair, T.R.; Tanner, C.B.; Bennett, J.M. Water-use efficiency in crop production. Bioscience 1984, 34, 36–40. [Google Scholar] [CrossRef]
  2. Li, F.; Xiao, J.; Chen, J.; Ballantyne, A.; Jin, K.; Li, B.; Abraha, M.; John, R. Global water use efficiency saturation due to increased vapor pressure deficit. Science 2023, 381, 672–677. [Google Scholar] [CrossRef] [PubMed]
  3. Yuan, X.; Jiao, L.; Li, Q.; Xue, R.; Wang, X.; Guo, Z.; Zhang, K. The response of water-carbon coupling to drought stress in terrestrial ecosystems in China. J. Arid Environ. 2026, 232, 105474. [Google Scholar] [CrossRef]
  4. Christian, J.I.; Basara, J.B.; Hunt, E.D.; Otkin, J.A.; Furtado, J.C.; Mishra, V.; Xiao, X.; Randall, R.M. Global distribution, trends, and drivers of flash drought occurrence. Nat. Commun. 2021, 12, 6330. [Google Scholar] [CrossRef] [PubMed]
  5. Gao, Y.; Markkanen, T.; Aurela, M.; Mammarella, I.; Thum, T.; Tsuruta, A.; Yang, H.; Aalto, T. Response of water use efficiency to summer drought in a boreal Scots pine forest in Finland. Biogeosciences 2017, 14, 4409–4422. [Google Scholar] [CrossRef]
  6. Zhao, J.; Feng, H.; Xu, T.; Xiao, J.; Guerrieri, R.; Liu, S.; Wu, X.; He, X.; He, X. Physiological and environmental control on ecosystem water use efficiency in response to drought across the northern hemisphere. Sci. Total Environ. 2021, 758, 143599. [Google Scholar] [CrossRef] [PubMed]
  7. Li, Q.; Wei, M.; Li, Y.; Feng, G.; Wang, Y.; Li, S.; Zhang, D. Effects of soil moisture on water transport, photosynthetic carbon gain and water use efficiency in tomato are influenced by evaporative demand. Agric. Water Manag. 2019, 226, 105818. [Google Scholar] [CrossRef]
  8. Guo, X.; Zhang, Z.; Zhang, X.; Feng, S. The inclusion of time-lag response reveals contrasting effects of meteorological and agricultural drought on agroecosystem water use efficiency in Africa. J. Hydrol. 2025, 650, 134346. [Google Scholar] [CrossRef]
  9. Allen, C.D.; Macalady, A.K.; Chenchouni, H.; Bachelet, D.; McDowell, N.; Vennetier, M.; Kitzberger, T.; Rigling, A.; Breshears, D.D. A global overview of drought and heat-induced tree mortality reveals emerging climate change risks for forests. For. Ecol. Manag. 2010, 259, 660–684. [Google Scholar] [CrossRef]
  10. Cao, S.P.; Zhang, L.F.; He, Y.; Zhang, Y.L.; Chen, Y.; Yao, S.; Yang, W.; Sun, Q. Effects and contributions of meteorological drought on agricultural drought under different climatic zones and vegetation types in Northwest China. Sci. Total Environ. 2022, 821, 153270. [Google Scholar] [CrossRef] [PubMed]
  11. Yu, X.; Yin, Q.; Zhao, T.; Chen, K.; Qian, L.; Wang, W.E.; Hu, X.; Zhang, B. Detecting ecosystem water use efficiency responses to drought from long-term remote sensing data. Ecol. Indic. 2025, 177, 113734. [Google Scholar] [CrossRef]
  12. Liu, S.; Xue, L.; Xiao, Y.; Yang, M.; Liu, Y.; Han, Q.; Ma, J. Dynamic process of ecosystem water use efficiency and response to drought in the Yellow River Basin, China. Sci. Total Environ. 2024, 934, 173339. [Google Scholar] [CrossRef] [PubMed]
  13. Liu, X.; Feng, X.; Fu, B. Changes in global terrestrial ecosystem water use efficiency are closely related to soil moisture. Sci. Total Environ. 2020, 698, 134165. [Google Scholar] [CrossRef] [PubMed]
  14. Zhang, T.; Quan, W.; Tian, J.; Li, J.; Feng, P. Spatial and temporal variations of ecosystem water use efficiency and its response to soil moisture drought in a water-limited watershed of northern China. J. Environ. Manag. 2024, 355, 120251. [Google Scholar] [CrossRef]
  15. Stocker, B.D.; Zscheischler, J.; Keenan, T.F.; Prentice, I.C.; Peñuelas, J.; Seneviratne, S.I. Quantifying soil moisture impacts on light use efficiency across biomes. New Phytol. 2018, 218, 1430–1449. [Google Scholar] [CrossRef] [PubMed]
  16. AghaKouchak, A. A baseline probabilistic drought forecasting framework using standardized soil moisture index: Application to the 2012 United States drought. Hydrol. Earth Syst. Sci. 2014, 18, 2485–2492. [Google Scholar] [CrossRef]
  17. Liu, Y.; Chen, C.; Chen, Q.; Zhang, J.; Cui, Z.; Zeng, Z. Widespread sensitivity of grassland water use efficiency to deep soil moisture on the Tibetan Plateau. Water Resour. Res. 2025, 61, e2024WR038645. [Google Scholar] [CrossRef]
  18. He, L.; Guo, J.; Liu, X.; Yang, W.; Chen, L.; Jiang, Q.; Bai, M. Exploring the multifaceted reason for deficits in soil water within different soil layers in China’s drylands. J. Environ. Manag. 2025, 373, 123634. [Google Scholar] [CrossRef]
  19. Tian, R.; Li, J.; Zheng, J.; Liu, L.; Han, W.; Liu, Y. Changes in vegetation phenology and its response to different layers of soil moisture in the dry zone of Central Asia, 1982–2022. J. Hydrol. 2025, 646, 132314. [Google Scholar] [CrossRef]
  20. Zhang, L.; Jia, X.; Zhao, Y.; Shan, L.; Zhang, Y.; Sun, Z.; Zhang, P.; Si, S. Lagged and cumulative effects of drought on global vegetation greenness, coverage, and productivity. Environ. Impact Assess. Rev. 2025, 115, 108019. [Google Scholar] [CrossRef]
  21. Ji, Y.; Li, Y.; Yao, N.; Biswas, A.; Zou, Y.; Meng, Q.; Liu, F. The lagged effect and impact of soil moisture drought on terrestrial ecosystem water use efficiency. Ecol. Indic. 2021, 133, 108349. [Google Scholar] [CrossRef]
  22. Wang, L.; Gao, J.; Shen, W.; Cai, M.; Chen, Y.; Xiao, T.; Zhang, X.; Tai, W. Vegetation quality and its change in the Three North Shelterbelt Forest region in China. Arid Land Res. Manag. 2024, 38, 285–298. [Google Scholar]
  23. Pang, J.; Xu, H.; Zhang, Q.; Zhang, Y.; Zhang, Z. Stand characteristics regulate forest water use efficiency in the Three-North Shelterbelt Forest Program region of China. Environ. Res. Lett. 2024, 19, 114028. [Google Scholar] [CrossRef]
  24. Shao, Y.; Liu, Y.; Ma, T.; Sun, L.; Yang, X.; Li, X.; Wang, A.; Wang, Z. Conservation Effectiveness Assessment of the Three Northern Protection Forest Project Area. Forests 2023, 14, 2121. [Google Scholar] [CrossRef]
  25. Lal, P.; Singh, G.; Das, N.N.; Colloander, A.; Entekhabi, D. Assessment of ERA5-Land Volumetric Soil Water Layer Product Using In Situ and SMAP Soil Moisture Observations. IEEE Geosci. Remote Sens. Lett. 2022, 19, 2508305. [Google Scholar] [CrossRef]
  26. Afshar, M.; Bulut, B.; Duzenli, E.; Amjad, M.; Yilmaz, M. Global spatiotemporal consistency between meteorological and soil moisture drought indices. Agric. For. Meteorol. 2022, 316, 108848. [Google Scholar] [CrossRef]
  27. Wu, X.; Xu, H.; He, H.; Wu, Z.; Lu, G.; Liao, T. Agricultural drought monitoring using an enhanced soil water deficit index derived from remote sensing and model data merging. Remote Sens. 2024, 16, 2156. [Google Scholar] [CrossRef]
  28. Sharma, A.; Goyal, M.K. Assessment of ecosystem resilience to hydroclimatic disturbances in India. Glob. Change Biol. 2018, 24, e432–e441. [Google Scholar]
  29. Chen, G.; Liu, T.; Wang, S.; Wu, Y.; Zhang, C. Responses to the impact of drought on carbon and water use efficiency in Inner Mongolia. Land 2023, 12, 583. [Google Scholar] [CrossRef]
  30. Liu, Y.; Xiao, J.; Ju, W.; Zhou, Y.; Wang, S.; Wu, X. Water use efficiency of China’s terrestrial ecosystems and responses to drought. Sci. Rep. 2015, 5, 13799. [Google Scholar] [CrossRef] [PubMed]
  31. Green, T.; Salvucci, G.; Friedl, M.A. Climate change is altering ecosystem water use efficiency in water-limited ecosystems. Glob. Change Biol. 2025, 31, e70459. [Google Scholar] [CrossRef]
  32. Chen, Q.; Timmermans, J.; Wen, W.; van Bodegom, P.M. Ecosystems threatened by intensified drought with divergent vulnerability. Remote Sens. Environ. 2023, 289, 113512. [Google Scholar] [CrossRef]
  33. Tian, F.; Wigneron, J.P.; Ciais, P.; Chave, J.; Ogée, J.; Peñuelas, J.; Ræbild, A.; Domec, J.C.; Tong, X.; Brandt, M.; et al. Coupling of ecosystem-scale plant water storage and leaf phenology observed by satellite. Nat. Ecol. Evol. 2018, 2, 1428–1435. [Google Scholar] [CrossRef] [PubMed]
  34. Xu, H.; Wang, X.; Zhao, C.; Zhang, X. Responses of ecosystem water use efficiency to meteorological drought under different biomes and drought magnitudes in northern China. Agric. For. Meteorol. 2019, 278, 107660. [Google Scholar] [CrossRef]
  35. Wen, Y.; Liu, X.; Xin, Q.; Wu, J.; Xu, X.; Pei, F.; Li, X.; Du, G.; Cai, Y.; Lin, K.; et al. Cumulative effects of climatic factors on terrestrial vegetation growth. J. Geophys. Res. Biogeosciences 2019, 124, 789–806. [Google Scholar] [CrossRef]
  36. Song, L.B.; Jin, J.M.; He, J.Q. Effects of severe water stress on maize growth processes in the field. Sustainability 2019, 11, 5086. [Google Scholar] [CrossRef]
  37. Griffin-Nolan, R.J.; Carroll, C.J.W.; Denton, E.M.; Johnston, M.K.; Collins, S.L.; Smith, M.D.; Knapp, A.K. Legacy effects of a regional drought on aboveground net primary production in six central US grasslands. Plant Ecol. 2018, 219, 505–515. [Google Scholar] [CrossRef]
  38. Shao, M.A.; Wang, Y.; Xia, Y.; Jia, X. Soil drought and water carrying capacity for vegetation in the critical zone of the Loess Plateau: A review. Vadose Zone J. 2018, 17, 1–8. [Google Scholar] [CrossRef]
  39. Fathi, T.; Shafizadeh, H.; Kouchakzadeh, M. MODIS-based evaluation of agricultural drought, water use efficiency and post-drought in Iran; considering the influence of heterogeneous climatic regions. J. Clean. Prod. 2022, 374, 133836. [Google Scholar] [CrossRef]
  40. Zhu, X.J.; Yu, G.R.; Wang, Q.F.; Hu, Z.M.; Zheng, H.; Li, S.G.; Sun, X.M.; Zhang, Y.P.; Yan, J.H.; Wang, H.M.; et al. Spatial variability of water use efficiency in China’s terrestrial ecosystems. Glob. Planet. Change 2015, 129, 37–44. [Google Scholar] [CrossRef]
  41. Kong, J.; Zan, M.; Chen, Z.; Xue, C.; Yang, S. Study on the response of vegetation water use efficiency to drought in the Manas River Basin, Xinjiang, China. Forests 2024, 15, 114. [Google Scholar] [CrossRef]
  42. Khoury, S.; Coomes, D. Resilience of Spanish forests to recent droughts and climate change. Glob. Change Biol. 2020, 26, 7079–7098. [Google Scholar] [CrossRef]
  43. Laudon, H.; Lidberg, W.; Sponseller, R.A.; Hasselquist, E.M.; Westphal, F.; Östlund, L.; Sandström, C.; Järveoja, J.; Peichl, M.; Ågren, A.M. Emerging technology can guide ecosystem restoration for future water security. Hydrol. Process. 2022, 36, e14729. [Google Scholar] [CrossRef]
  44. Di, N.; Yang, S.J.; Liu, Y.; Fan, 42X.Y.; Duan, J.; Nadezhdina, N.; Li, X.M.; Xi, B.Y. Soil-moisture-dependent nocturnal water use strategy and its responses to meteorological factors in a seasonal-arid poplar plantation. Agric. Water Manag. 2022, 274, 107984. [Google Scholar] [CrossRef]
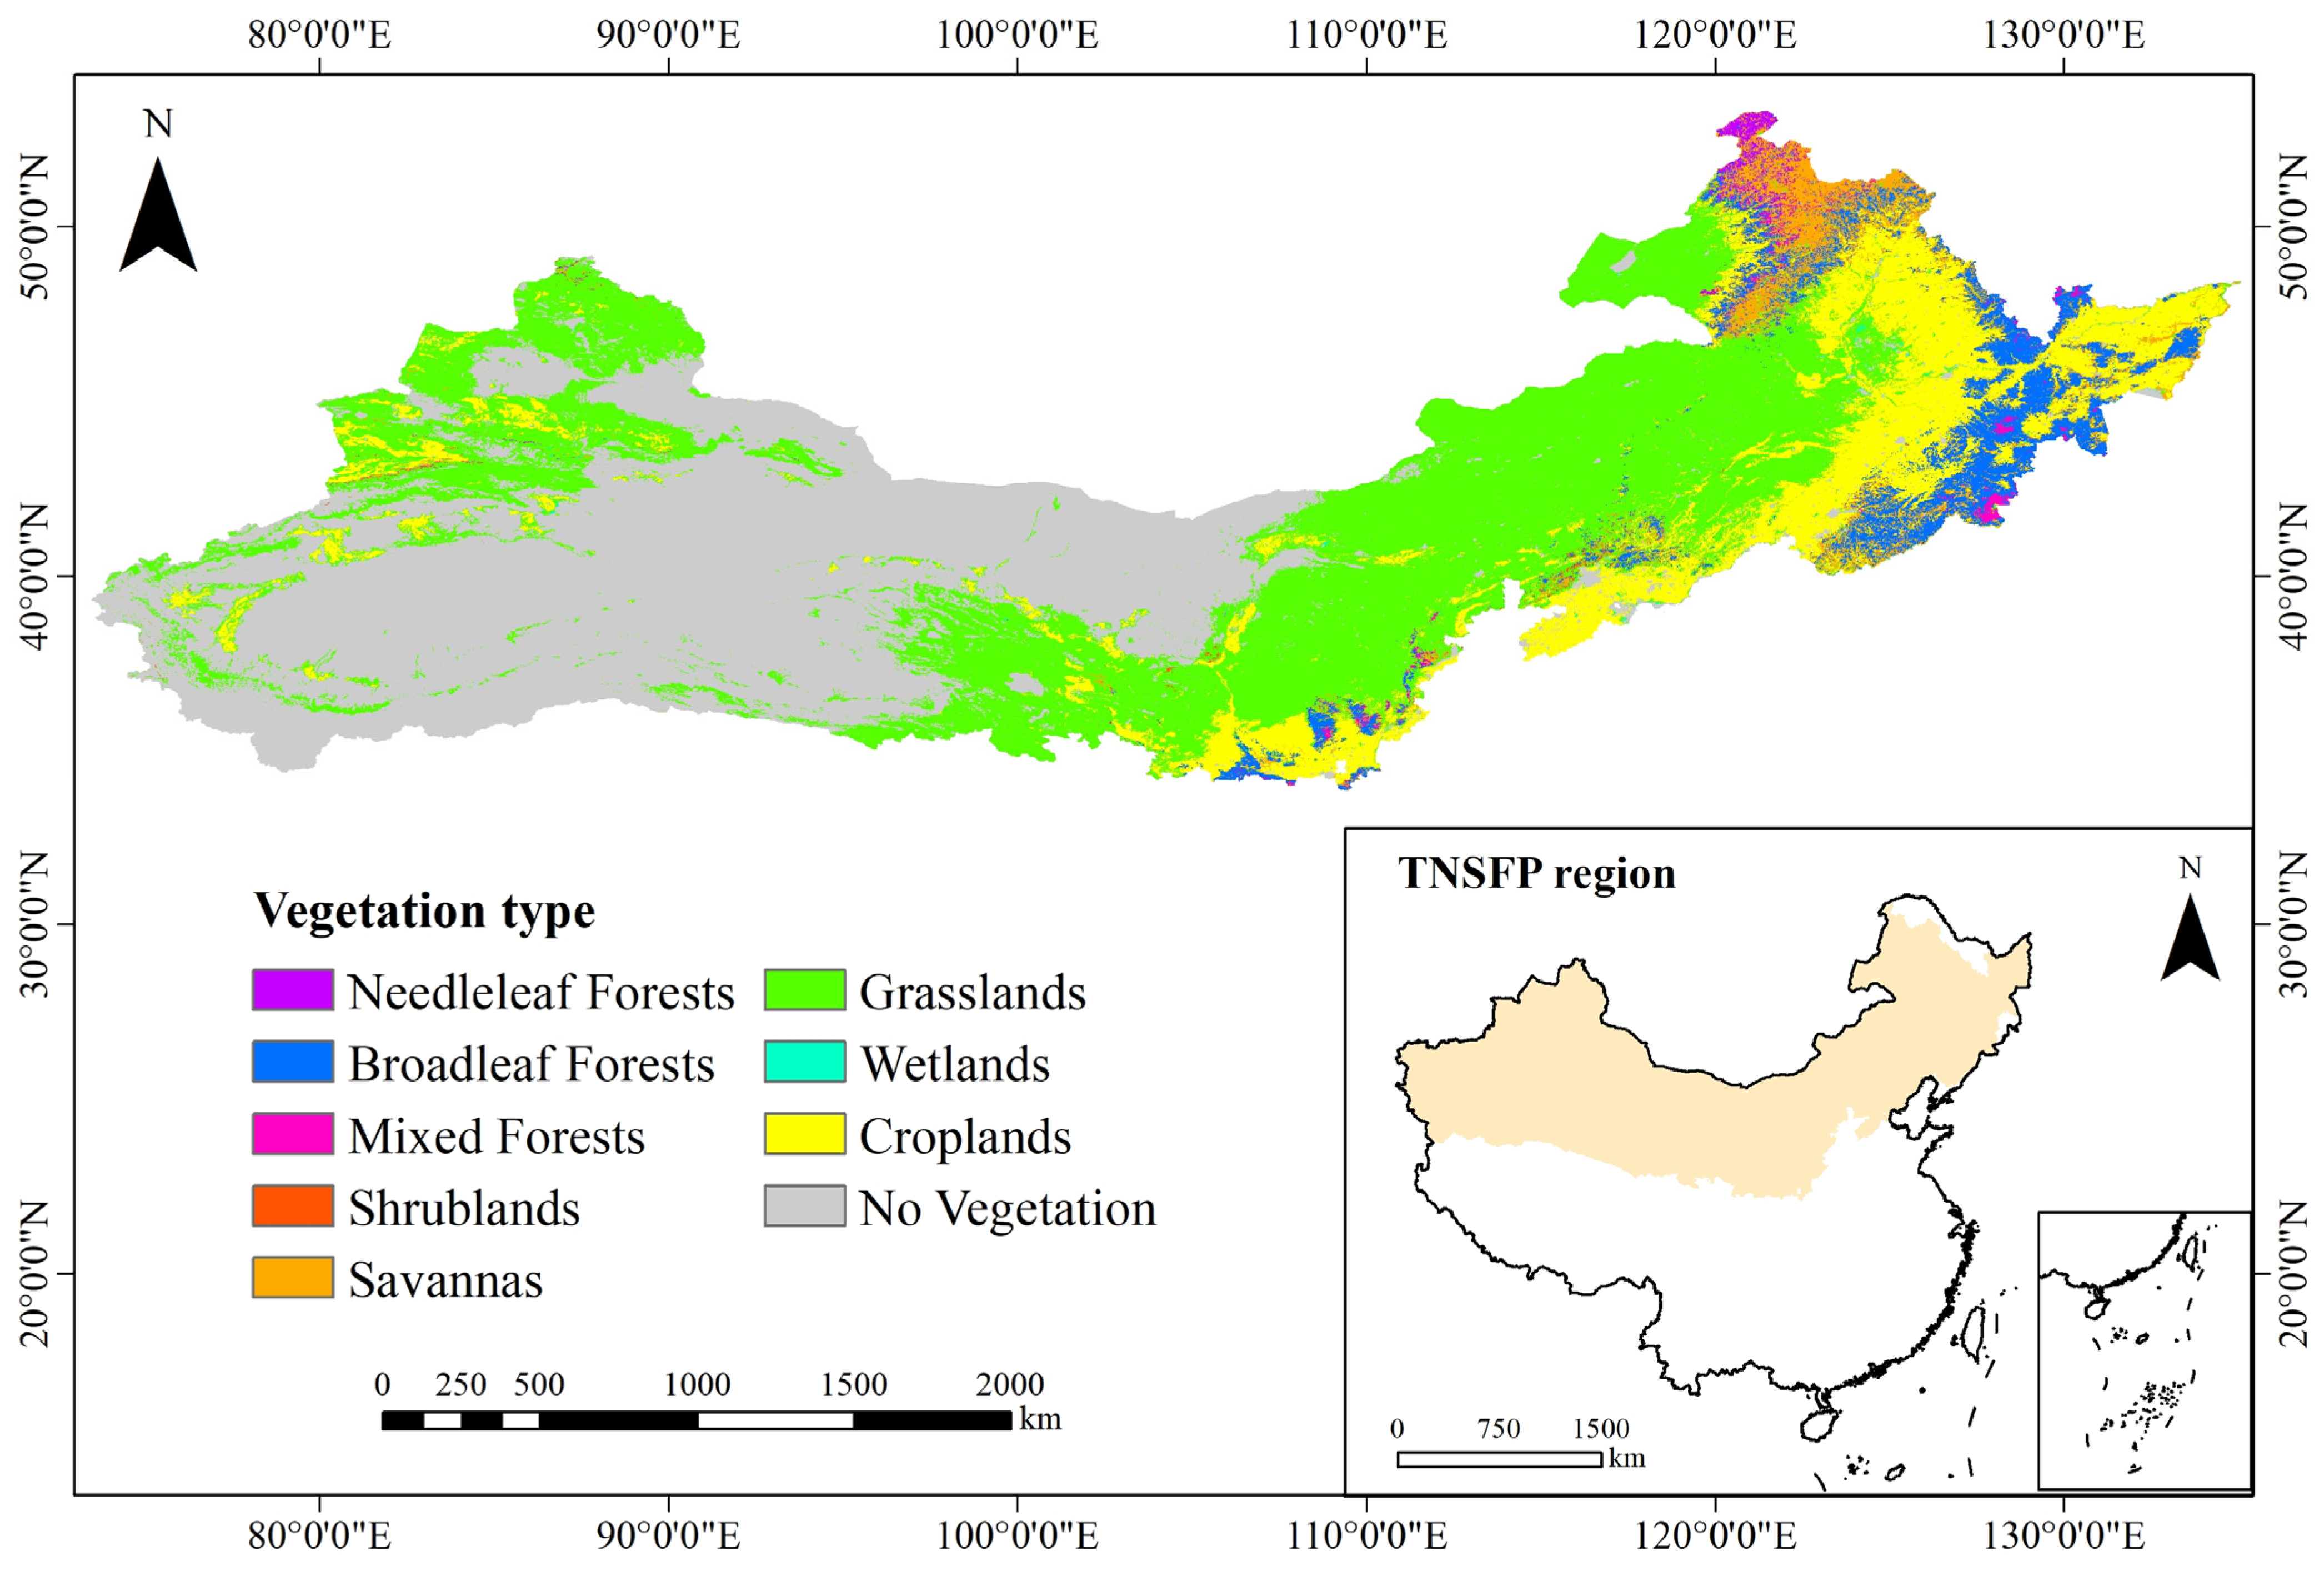
Figure 1. The vegetation types in the TNSFP region.
Sustainability 18 07771 g001
Figure 2. The time series of monthly SSMI-1, SSMI-2 and SSMI-3 from 2001 to 2022. The blue dots represents monthly variations in SSMI, and the orange shadowing represents the duration of the drought.
Sustainability 18 07771 g002
Figure 3. The spatial distribution of mean annual SSMI (a) and the change trend of SSMI (b) from 2001 to 2022. Note: the cross in (b) represents the change rate passing the significance less than 0.05.
Sustainability 18 07771 g003
Figure 4. Spatial distribution of the mean ET (a), GPP (c), and WUE (e), and spatial variation pattern of ET (b), GPP (d), and WUE (f) from 2001 to 2022 in the TNSFP region.
Sustainability 18 07771 g004
Figure 5. Interannual variations in the ET, GPP, and WUE (a), mean values (b), and trends (c) of the ET, GPP, and WUE for different vegetation types from 2001 to 2022 in the TNSFP region.
Sustainability 18 07771 g005
Figure 6. Fitting relationships between WUE, ET, GPP, and SSMI across different soil layers at the 1-month time scale.
Sustainability 18 07771 g006
Figure 7. Spatial patterns of the Rmax_lag (p < 0.05) and the lagged association time scale.
Sustainability 18 07771 g007
Figure 8. Area percentage of positive and negative Rmax_lag at 1–12 lagged months and mean lagged month under different vegetation types.
Sustainability 18 07771 g008
Figure 9. Spatial patterns of the Rmax_cum (p < 0.05) and the cumulative association time scale.
Sustainability 18 07771 g009
Figure 10. Area percentage of positive and negative Rmax_cum at 1–12 cumulative months and the mean cumulative month under different vegetation types.
Sustainability 18 07771 g010
Figure 11. Spatial patterns of the ecological resilience to soil moisture drought at different layers in the TNSFP region during 2001–2022.
Sustainability 18 07771 g011
Table 1. Ecosystem resilience analysis for different vegetation types.
Vegetation TypesType of SSMILowest-SSMI YearMean SSMI for the Lowest-SSMI YearWUEdWUEmRd
(Mean ± 95% CI)
Ecosystem Resilience
NFSSMI-12007−0.843 1.814 1.906 0.951
(0.942–0.960)
Slight non-resilience
SSMI-22008−1.267 1.866 1.885 0.990
(0.981–0.999)
Slight non-resilience
SSMI-32008−1.506 1.918 1.884 1.018
(1.002–1.034)
Resilience
BFSSMI-12008−0.523 1.780 1.863 0.955
(0.945–0.965)
Slight non-resilience
SSMI-22008−0.731 1.840 1.857 0.991
(0.982–1.000)
Slight non-resilience
SSMI-32008−0.957 1.850 1.860 0.995
(0.986–1.004)
Slight non-resilience
MFSSMI-12007−0.614 1.785 1.844 0.968
(0.958–0.978)
Slight non-resilience
SSMI-22008−0.829 1.834 1.827 1.004
(0.958–0.978)
Resilience
SSMI-32008−1.152 1.846 1.833 1.007
(0.998–1.016)
Resilience
SHRSSMI-12009−0.534 1.852 1.841 1.006
(0.996–1.016)
Resilience
SSMI-22007−0.584 1.560 1.540 1.013
(1.003–1.023)
Resilience
SSMI-32010−0.943 1.822 1.856 0.982
(0.973–0.991)
Slight non-resilience
SAVSSMI-12007−0.938 1.677 1.740 0.964
(0.954–0.974)
Slight non-resilience
SSMI-22008−1.066 1.722 1.712 1.006
(0.996–1.016)
Resilience
SSMI-32008−1.354 1.743 1.728 1.008
(0.998–1.018)
Resilience
GRASSMI-12006−0.387 1.570 1.526 1.029
(1.019–1.039)
Resilience
SSMI-22007−0.382 1.482 1.517 0.977
(0.967–0.987)
Slight non-resilience
SSMI-32011−0.337 1.513 1.541 0.982
(0.972–0.992)
Slight non-resilience
CROSSMI-12008−0.522 1.599 1.619 0.988
(0.978–0.998)
Slight non-resilience
SSMI-22008−0.758 1.115 1.141 0.992
(0.982–1.002)
Slight non-resilience
SSMI-32009−0.905 1.613 1.621 0.995
(0.985–1.005)
Slight non-resilience
Note: WUEd and WUEm indicate mean WUE during soil moisture deficit periods and non-deficit periods, respectively. Rd = WUEd/WUEm. The 95% CI of Rd was estimated using bootstrap resampling with 1000 iterations.
Disclaimer/Publisher’s Note: The statements, opinions and data contained in all publications are solely those of the individual author(s) and contributor(s) and not of MDPI and/or the editor(s). MDPI and/or the editor(s) disclaim responsibility for any injury to people or property resulting from any ideas, methods, instructions or products referred to in the content.