Article

Perceived Policy Instruments, Multidimensional Cognition, and Smallholder Tea Farmers’ Adoption Intensity of Pesticide-Reduction Practices: Evidence from Jian’ou City, Fujian Province, China

1
College of Rural Revitalization, Fujian Agriculture and Forestry University, Fuzhou 350002, China
2
Multifunctional Agricultural Application Research Institute, Fujian Agriculture and Forestry University, Fuzhou 350002, China
*
Author to whom correspondence should be addressed.
Sustainability 2026, 18(14), 7218; https://doi.org/10.3390/su18147218
Submission received: 28 May 2026 / Revised: 12 July 2026 / Accepted: 13 July 2026 / Published: 15 July 2026

Abstract

Encouraging smallholder tea farmers to reduce their reliance on chemical pesticides requires attention not only to adoption status but also to adoption intensity. Yet evidence remains limited on how perceived policy instruments are associated with adoption intensity and whether these associations exhibit the same cognition-related pattern. This study examines the associations of three perceived policy instruments—subsidy support, capacity-building support, and information provision—with adoption intensity, measured as the number of five predefined pesticide-reduction practice categories adopted by each farmer. Using survey data from 282 smallholder tea farmers in Jian’ou City, Fujian Province, China, we estimate ordered probit models and apply Karlson–Holm–Breen decomposition within an ordered logit framework. The results show that all three perceived policy instruments are positively associated with adoption intensity. The KHB results reveal different cognition-related patterns across the three instruments. Multidimensional cognition partially accounts for the association between subsidy support and adoption intensity. By contrast, no corresponding indirect association is identified for capacity-building support or information provision. These findings highlight the value of distinguishing among perceived policy instruments when explaining smallholder tea farmers’ adoption intensity. The cognition-related pattern identified for one instrument may not extend to others.

1. Introduction

Reducing dependence on chemical pesticides is a central challenge for sustainable crop protection in tea production. Tea plants face persistent pest and disease pressures [1,2], and chemical pesticide use remains an important production decision for tea farmers [3]. However, continued reliance on chemical control may exacerbate pesticide resistance [4] and adversely affect non-target organisms and regional ecosystems [5,6]. Pesticide reduction should therefore not be understood simply as replacing conventional pesticides with a single alternative input. Rather, it should follow integrated pest management (IPM) principles of prevention, monitoring, targeted intervention, and the coordinated use of multiple control measures [7,8] and be viewed as part of a systemic transition in crop protection [9,10]. In tea production, this transition encompasses need-based and precision pesticide application, use of low-risk pest-control inputs, biological control, cultural and ecological management, and mechanical or physical control.
This multi-practice character means that research on tea-farmer behavior should go beyond whether farmers adopt any pesticide-reduction practice. Binary indicators distinguish farmers who adopt no practices from those who adopt at least one but cannot distinguish farmers who adopt only one practice from those who adopt multiple practices. They thus mask variation in adoption intensity, as reflected in the number of practice categories adopted. Accordingly, prior studies have distinguished adoption intensity from simple adoption status [11,12,13], while recent research on tea farmers’ green-control technologies has further distinguished adoption breadth and depth [14].
Explaining differences in adoption intensity requires attention to the external support conditions that farmers face in pest and disease management. In smallholder adoption of sustainable practices, economic incentives, capacity building, and information provision are common policy instruments. They can address, respectively, economic constraints, gaps in technical knowledge and operational capacity, and limited information about pesticide risks and alternative options [15,16,17,18,19,20]. Subsidy support, capacity-building support, and information provision can therefore be treated as three policy instrument categories directly relevant to the adoption of pesticide-reduction practices, corresponding to economic incentives, capacity building, and information delivery. Because they address different constraints and allocate resources through different channels, they should not be collapsed into a generic measure of “policy support.” More importantly, formal policy arrangements do not automatically enter farmers’ production decisions. Whether they become usable decision resources also depends on whether farmers encounter or receive relevant support and perceive it as closely related to their own production. Studies of farmer-level green production behavior should therefore consider perceived policy instruments alongside institutional provision, because they capture how external support is experienced in farmers’ decision environments [21,22].
However, perceived policy instruments describe the external support environment but do not fully explain specific behavioral choices. Even under similar support conditions, farmers may make different choices because they evaluate the costs, benefits, risks, environmental consequences, and their own capacity to implement practices differently. Reviews and meta-analyses identify these cognitive and socio-psychological factors as important correlates of sustainable-practice adoption [23,24,25]. Agricultural extension services have been associated with greater willingness to use organic fertilizer, with ecological cognition playing a partial mediating role [26]. Information interventions have also been found to affect green technology adoption through changes in farmers’ perceptions of income, safety, and health risks [20]. In addition, perceived benefits and perceived risks have been associated with green production technology adoption, while policy subsidies and market incentives moderate some of these relationships [27]. Existing tea-farmer research has separately examined behavioral antecedents [28,29], government and organizational conditions [30], cognition-linked normative pathways [31], and adoption breadth and depth [14]. Yet evidence remains limited on treating subsidy support, capacity-building support, and information provision as distinct perceived policy instruments, comparing their associations with adoption intensity of pesticide-reduction practices, and assessing whether multidimensional cognition statistically accounts for part of those associations within the same tea-farmer sample.
Using survey data from 282 tea farmers in Jian’ou City, Fujian Province, China, this study addresses these questions. First, it examines the associations of subsidy support, capacity-building support, and information provision with adoption intensity of pesticide-reduction practices. Second, it assesses whether multidimensional cognition statistically accounts for part of the association between each perceived policy instrument and adoption intensity. By comparing the three perceived policy instruments and defining adoption intensity as the number of pesticide-reduction practice categories reported as adopted by each farmer, this study provides empirical evidence on differentiated policy instrument–cognition–adoption relationships in tea production. Given the cross-sectional, self-reported design, the estimates represent associations conditional on observed covariates rather than causal effects of formal policy implementation.

2. Theoretical Framework and Hypotheses

2.1. Extended S-O-R Framework and Social Cognitive Theory

The S-O-R model argues that individual behavior is not directly or mechanically determined by external stimuli. Instead, external stimuli influence behavioral responses through individuals’ internal psychological states or cognitive processing [32]. Compared with the traditional S-R logic, the S-O-R framework is better suited to explaining how external environmental factors are transformed into behavioral choices through internal states. In recent years, the extended S-O-R model has been widely used to explain the associations among policy perception, environmental stimuli, technology adoption, and green behavior. In this framework, the “organism” is not limited to emotional responses, but can also refer to cognitive evaluation processes [33,34].
In this study, perceived policy instruments are regarded as external stimuli, farmers’ multidimensional cognition is treated as the organism-level cognitive mechanism, and adoption intensity of pesticide-reduction practices is considered the behavioral response. Specifically, perceived policy instruments include subsidy support, capacity-building support, and information provision. Adoption intensity is measured by the number of pesticide-reduction practices adopted by tea farmers.
To further clarify the theoretical meaning of the organism component, this study introduces social cognitive theory. Social cognitive theory emphasizes that individual behavior is shaped through the interaction between external environment, personal cognition, and behavioral outcomes. Individuals do not passively receive external stimuli; rather, they evaluate behavioral choices based on outcome expectations and self-efficacy [35,36]. Outcome expectations refer to individuals’ judgments about the potential costs, benefits, and consequences of a behavior, while self-efficacy reflects their perceived ability to perform that behavior. In the context of pesticide-reduction practices, this study conceptualizes tea farmers’ multidimensional cognition as a comprehensive cognitive evaluation involving perceived application-cost advantage, perceived expected benefits, environmental cognition, and self-efficacy.

2.2. Policy Instruments and Adoption Intensity of Pesticide-Reduction Practices

Pesticide-reduction practices are usually characterized by technical complexity and uncertainty. Compared with conventional chemical pest control, practices such as need-based and precision pesticide application, use of low-risk pest-control inputs, biological control, cultural and ecological management, and mechanical and physical control often require farmers to invest more learning effort, management attention and initial resources. For smallholders, financial constraints, insufficient information and limited technical capacity may restrict their transition from single-practice adoption to higher adoption intensity across multiple practices. Therefore, external policy instruments may influence farmers’ adoption intensity by lowering adoption barriers, improving the information environment, and strengthening implementation capacity.
Subsidy support mainly works through economic incentives. When farmers adopt low-risk pest-control inputs, biological control materials, or related pesticide-reduction services, they often face additional costs and trial-and-error risks. Subsidies can reduce initial investment pressure and concerns about potential losses, thereby increasing farmers’ likelihood of trying and expanding pesticide-reduction practices. Previous studies have also shown that subsidies and incentive mechanisms can affect the adoption of sustainable agricultural practices, although their effects depend on target groups, institutional design, and specific technological contexts [15]. Therefore, this study proposes:
H1a. 
Subsidy support is positively associated with tea farmers’ adoption intensity of pesticide-reduction practices.
Capacity-building support mainly operates through the enhancement of farmers’ technical capabilities. Pesticide reduction is not simply a matter of input substitution; it involves pest identification, decisions on application timing, selection of alternative pest-control measures, and coordination among multiple practices. Capacity-building support can help farmers understand pesticide-related risks, acquire knowledge of alternative pest-control methods, and improve their ability to implement integrated pest management. Existing studies have found that farmer training can improve farmers’ understanding of pesticide health risks, toxicity labels, and exposure risks, and that capacity-building support and peer effects can influence farmers’ pesticide-use behavior [16,17,18]. Therefore, this study proposes:
H1b. 
Capacity-building support is positively associated with tea farmers’ adoption intensity of pesticide-reduction practices.
Information provision mainly works through information supply and awareness raising. Compared with subsidies and capacity-building support, information provision may not directly change farmers’ resource conditions or operational capacity, but it can improve farmers’ awareness of pesticide residues, environmental pollution, food safety, and the value of green production. Mass media campaigns and information dissemination have been shown to improve smallholders’ knowledge of pesticide risks and alternative pest management strategies, thereby promoting safer pest-control behavior [19]. Therefore, this study proposes:
H1c. 
Information provision is positively associated with tea farmers’ adoption intensity of pesticide-reduction practices.

2.3. The Mediating Role of Multidimensional Cognition

The extended S-O-R framework emphasizes that the effect of external stimuli on behavioral responses may not occur directly, but may operate through individuals’ internal psychological states or cognitive processes. For tea farmers, whether policy instruments can promote the adoption of pesticide-reduction practices depends not only on the existence of such instruments, but also on how farmers understand, evaluate, and internalize external support. In other words, subsidy support, capacity-building support, and information provision do not automatically translate into adoption behavior; rather, their effects depend on farmers’ comprehensive judgments about costs, benefits, ecological consequences, and their own implementation capacity.
Social cognitive theory provides a theoretical basis for explaining this cognitive transformation process. It argues that individual behavior is formed through the interaction among the external environment, personal cognition, and behavioral choices, and that outcome expectations and self-efficacy are key cognitive mechanisms shaping behavior [35,36]. Outcome expectations reflect individuals’ judgments about the costs, benefits, and external consequences of a behavior, while self-efficacy reflects their perceived ability to perform the behavior. In the context of pesticide-reduction practices, this study defines tea farmers’ multidimensional cognition as a comprehensive cognitive evaluation composed of outcome expectations and self-efficacy.
Specifically, subsidy support may reduce farmers’ concerns about adoption costs and trial-and-error risks, thereby improving their judgment of the economic feasibility of pesticide-reduction practices. Capacity-building support may enhance farmers’ perceptions of technical operability and implementation capacity by providing knowledge about pest identification, precision pesticide application, alternative pest-control measures, and integrated management. Information provision may strengthen farmers’ understanding of the ecological consequences and long-term benefits of pesticide reduction by disseminating information on pesticide residues, environmental pollution, food safety, and the value of green production. Although different policy instruments operate in different ways, they may share a common logic: shaping farmers’ cognitive evaluations and thereby influencing adoption intensity.
From the perspective of adoption behavior, if tea farmers perceive pesticide-reduction practices as too costly, uncertain in benefits, limited in ecological value, or beyond their own implementation capacity, they are more likely to maintain existing pesticide-use patterns or adopt only low-threshold alternatives. Conversely, if farmers recognize the value of pesticide-reduction practices in cost control, quality improvement, ecological improvement, and long-term returns, and believe that they have the ability to implement such practices, they are more likely to adopt a greater number of pesticide-reduction practices. Therefore, multidimensional cognition may mediate the association between policy instruments and adoption intensity of pesticide-reduction practices.
Based on the above analysis, this study proposes the following hypothesis:
H2. 
Tea farmers’ multidimensional cognition mediates the association between perceived policy instruments and adoption intensity of pesticide-reduction practices.
Considering that this study distinguishes among three types of perceived policy instruments, namely subsidy support, capacity-building support, and information provision, each type of policy instrument may influence adoption intensity through tea farmers’ multidimensional cognition. Accordingly, the following sub-hypotheses are proposed:
H2a. 
Tea farmers’ multidimensional cognition mediates the association between subsidy support and adoption intensity of pesticide-reduction practices.
H2b. 
Tea farmers’ multidimensional cognition mediates the association between capacity-building support and adoption intensity of pesticide-reduction practices.
H2c. 
Tea farmers’ multidimensional cognition mediates the association between information provision and adoption intensity of pesticide-reduction practices.

2.4. Theoretical Mechanism Framework

Based on the extended S-O-R framework and social cognitive theory, this study constructs a theoretical mechanism framework linking policy instruments, multidimensional cognition, and adoption intensity of pesticide-reduction practices, as shown in Figure 1. In this framework, subsidy support, capacity-building support, and information provision constitute perceived policy instruments and serve as external stimuli affecting farmers’ behavior. Perceived application-cost advantage, perceived expected benefits, environmental cognition, and self-efficacy jointly form tea farmers’ multidimensional cognition, which represents the cognitive mechanism at the organism level. Adoption intensity of pesticide-reduction practices is the final behavioral response.
This framework contains two types of pathways. First, perceived policy instruments may directly affect tea farmers’ adoption intensity of pesticide-reduction practices. That is, subsidy support, capacity-building support, and information provision may increase farmers’ likelihood of adopting more pesticide-reduction practices by reducing costs, enhancing capacity, and improving the information environment. Second, perceived policy instruments may also exert indirect effects through multidimensional cognition. In this pathway, policy instruments affect farmers’ judgments about costs, benefits, ecological consequences, and their own capacity, which in turn influence their adoption intensity. Therefore, this study focuses on the coexistence of direct policy effects and cognition-mediated effects.

3. Materials and Methods

3.1. Study Area and Data Source

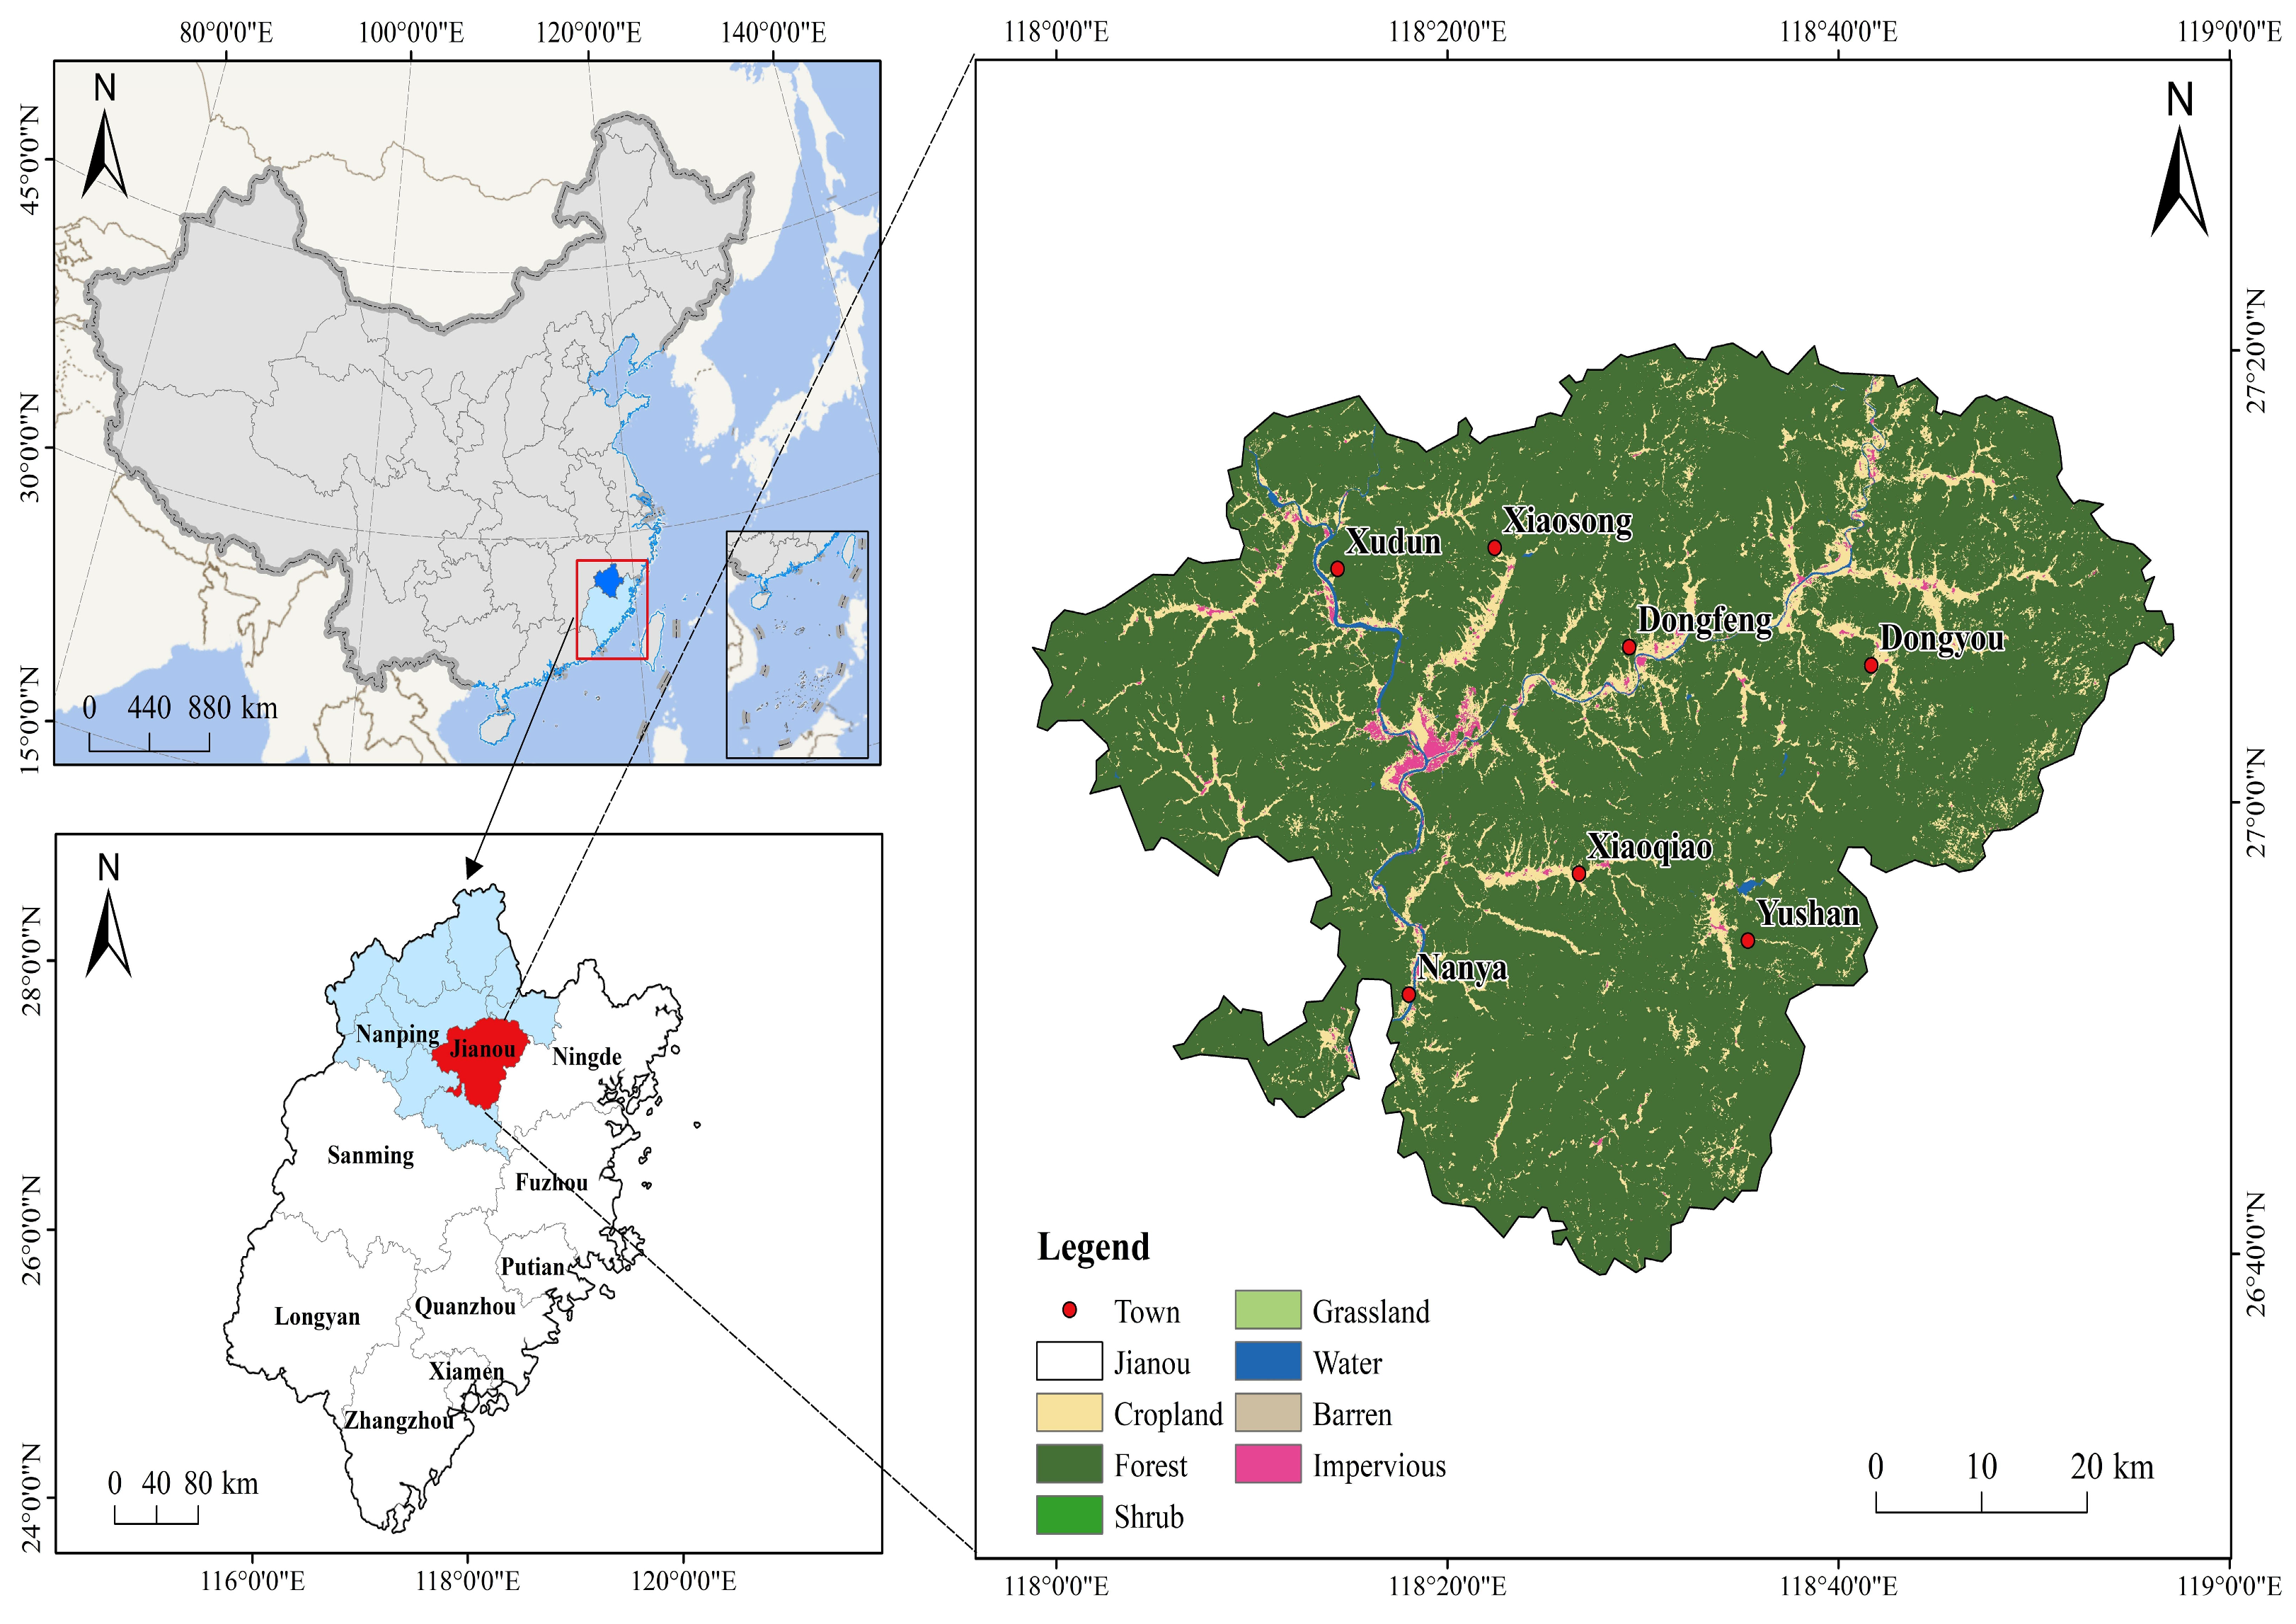
This study was conducted in Jian’ou City, Fujian Province, China. Located in northern Fujian, Jian’ou is a tea-producing county-level area within the Wuyi Mountain region. The study focuses on smallholder tea farmers’ adoption of pesticide-reduction practices in a local tea-production setting.
The survey covered seven tea-producing towns in Jian’ou City: Xudun, Xiaosong, Dongfeng, Dongyou, Xiaoqiao, Yushan, and Nanya. These towns were selected to cover geographically dispersed tea-producing areas within the city. The location of the study area and surveyed towns is shown in Figure 2.
Data were collected through a household questionnaire survey conducted from July to August 2025. Before the formal survey, a pre-test was conducted in June 2025 in tea-producing areas of Jian’ou. The wording of the questionnaire and response options were subsequently revised based on farmers’ feedback. The questionnaire covered farmers’ individual and household characteristics, tea-garden operation characteristics, adoption of pesticide-reduction practices, perceived policy instruments, and cognition of pesticide-reduction practices.
A three-stage stratified sampling strategy was used. First, seven tea-producing towns were selected. Second, villages were selected within each sampled town according to their geographical distribution, with at least three villages selected from each town. Third, 10–15 tea-farming households were selected from each sampled village. Respondents were household members directly involved in tea production and familiar with production and pest-management decisions.
The survey was conducted through face-to-face interviews by trained investigators using structured questionnaires. After the survey, all questionnaires were checked for completeness and logical consistency. Questionnaires with missing key information or obvious logical contradictions were excluded. In total, 300 questionnaires were distributed, of which 282 valid questionnaires were retained for empirical analysis, yielding an effective response rate of 94.0%.

3.2. Variable Measurement

3.2.1. Dependent Variable: Adoption Intensity of Pesticide-Reduction Practices

The dependent variable in this study is the adoption intensity of pesticide-reduction practices (AI). Rather than treating pesticide-reduction behavior as a simple binary choice of adoption or non-adoption, this study focuses on whether tea farmers expand from a single or low-threshold practice to the adoption of multiple pesticide-reduction practices. Therefore, adoption intensity is measured by the number of pesticide-reduction practice types adopted by tea farmers during the past three years.
Based on the logic of integrated pest management and green pest-control practices in tea production, pesticide-reduction practices are classified into five categories: (1) need-based and precision pesticide application, referring to pesticide application based on pest monitoring, pest occurrence thresholds, or actual production needs; (2) use of low-risk pest-control inputs, including botanical preparations, insect growth regulators, microbial pesticides, and other lower-risk alternatives; (3) biological control, such as the use of biopesticides and the release of natural enemies; (4) cultural and ecological management, including intercropping, crop rotation, vegetation optimization, green manure, and the return of crop residues to improve the ecological environment of tea gardens; and (5) mechanical and physical control, including insecticidal lamps, sticky traps, and insect-proof nets.
Each practice type is coded as 1 if adopted and 0 otherwise. The five practice types are then summed to generate the adoption intensity variable, ranging from 0 to 5. A higher value indicates that the farmer adopted more types of pesticide-reduction practices and therefore had a higher level of combined adoption.

3.2.2. Core Explanatory Variables: Perceived Policy Instruments

The core explanatory variables are tea farmers’ perceived policy instruments, including subsidy support, capacity-building support, and information provision. It should be noted that this study measures farmers’ perceived access to, receipt of, or evaluation of relevant policy instruments rather than objective government-level policy inputs.
Subsidy support (SUB) reflects whether tea farmers perceived or received subsidy-related support for pesticide-reduction technologies, inputs, or services. This variable is coded as a binary variable. It takes the value of 1 if the farmer reported receiving relevant subsidy support or obtaining related technologies, inputs, or services at a reduced cost, and 0 otherwise.
Capacity-building support (CBS) reflects tea farmers’ perceived usefulness or intensity of capacity-building support related to pesticide reduction, green pest control, safe pesticide application, or related technologies. This variable is measured using a five-point Likert scale. A higher value indicates greater perceived capacity-building support.
Information provision (INF) reflects tea farmers’ perceived exposure to information dissemination and educational activities related to pesticide reduction, green production, and ecological safety provided by governments, agricultural extension agencies, village collectives, or relevant organizations. This variable is also measured using a five-point Likert scale. A higher value indicates greater perceived exposure to information provision.

3.2.3. Mediating Variable: Multidimensional Cognition

The mediating variable is tea farmers’ multidimensional cognition (MC). According to social cognitive theory, farmers’ adoption of pesticide-reduction practices is shaped not only by external policy instruments but also by their evaluations of behavioral outcomes and their perceived capacity to implement the practices. Based on the questionnaire design, multidimensional cognition comprises four dimensions: perceived application-cost advantage, perceived expected benefits, environmental cognition, and self-efficacy.
Perceived application-cost advantage (PAC) is measured using two items assessing whether pesticide-reduction practices require additional monetary and time costs. Perceived expected benefit (PEB) is measured using two items concerning the expected improvements in tea quality and selling prices. Environmental cognition (EC) is measured using two items assessing the perceived contributions of pesticide reduction to environmental protection and product safety. Self-efficacy (SE) is measured using two items concerning farmers’ knowledge of and ability to implement pesticide-reduction practices.
All eight items were measured on five-point Likert scales, with higher scores indicating more positive cognitive evaluations. For the main mediation analysis, the entropy-weight method is used to aggregate the eight items into a composite MC index. This data-driven method assigns weights according to the variation in the information provided by each item, thereby avoiding the ex ante assignment of subjective weights. A higher composite score indicates a more favorable overall evaluation of the cost controllability, expected benefits, environmental value, and implementation feasibility of pesticide-reduction practices.
To further examine whether different policy instruments operate through distinct cognitive mechanisms, an exploratory analysis disaggregates MC into its four dimensions. Each dimension is calculated as the arithmetic mean of its two corresponding items, and the four dimension scores are entered simultaneously into the KHB decomposition. The Spearman–Brown reliability coefficients are 0.818 for PAC, 0.838 for PEB, 0.817 for EC, and 0.927 for SE, indicating satisfactory internal consistency. The maximum variance inflation factor among the four dimensions is 1.67, suggesting that multicollinearity does not pose a serious concern.

3.2.4. Control Variables

To reduce potential omitted-variable bias, this study controls for individual characteristics, household characteristics, and production characteristics of tea farmers. Individual characteristics include gender, age, education level, and cooperative membership. Household characteristics include household agricultural labor force and household income. Production characteristics include tea planting area, the number of land plots, and tea-growing experience. Table 1 provides detailed information on the definitions and measurement approaches of the variables used in the empirical analysis.
These variables may simultaneously affect farmers’ perceptions of policy instruments and their adoption of pesticide-reduction practices. For example, farmers with higher education levels may be better able to understand pesticide-reduction technologies and policy information. Farmers who are members of tea cooperatives or associations may have better access to training, information, and subsidies. Farmers with larger tea planting areas may be more able to spread the costs of green pest-control facilities and technology learning; whereas, a larger number of land plots may increase the difficulty of unified management and technology implementation.

3.3. Model Specification

3.3.1. Baseline Ordered Probit Model and Marginal Effects

Because the dependent variable AI is an ordered discrete variable ranging from 0 to 5, this study uses an ordered probit model to estimate the effects of perceived policy instruments on the adoption intensity of pesticide-reduction practices. The baseline model is specified as follows:
A I i * = β 1 S U B i + β 2 C B S i + β 3 I N F i + γ T X i + ε i
A I i = 0 , A I i * τ 1 , j , τ j < A I i * τ j + 1 , j = 1,2 , 3,4 , 5 , A I i * > τ 5 .
where A I i * denotes the latent adoption intensity of farmer i, and A I i is the observed ordered adoption intensity. S U B i ,   C B S i ,   a n d   I N F i represent subsidy support, capacity-building support, and information provision, respectively. X i denotes the vector of control variables, including individual, household, and production characteristics, and γ is the corresponding coefficient vector. The error term ε i follows a standard normal distribution. The ordered thresholds satisfy τ 1 < τ 2 < τ 3 < τ 4 < τ 5 .
Since the coefficients of the Ordered Probit model indicate the direction and statistical significance of the effects but cannot be directly interpreted as changes in probabilities, this study further calculates average marginal effects. The marginal effects show how each policy instrument changes the probability that a farmer falls into each adoption intensity category from AI = 0 to AI = 5.

3.3.2. KHB Mediation Analysis Approach

To examine whether multidimensional cognition mediates the associations between perceived policy instruments and adoption intensity, this study employs the Karlson–Holm–Breen (KHB) method within an ordered logit framework [37,38]. The KHB decomposes the total association of each policy instrument with adoption intensity into direct and indirect components while correcting for the rescaling problem that arises when coefficients from nested nonlinear probability models are compared. Simulation evidence further supports the suitability of the KHB method for estimating mediation effects and their standard errors in ordinal logistic regression models [39]. The reduced and full models are specified as follows:
A I i * ( R ) = θ 1 S U B i + θ 2 C B S i + θ 3 I N F i + δ T X i + ε i ( R )
A I i * ( F ) = ϕ 1 S U B i + ϕ 2 C B S i + ϕ 3 I N F i + ϕ 4 M C i + λ T X i + ε i ( F )
where A I i * ( R )   a n d   A I i * ( F ) denote the latent adoption intensity indices in the reduced and full ordered logit models, respectively. S U B i ,   C B S i ,   a n d   I N F i denote subsidy support, capacity-building support, and information provision; M C i denotes multidimensional cognition; and X i is the vector of control variables. δ and λ are the corresponding coefficient vectors. In the ordered-logit specification, the latent disturbance follows a standard logistic distribution.
In the KHB decomposition, the reduced model is rescaled before its coefficients are compared with those from the full model. The KHB method addresses this problem by rescaling the reduced model and decomposing the association of each policy instrument with adoption intensity into a total association, a direct association, and an indirect association through multidimensional cognition on a common scale. All three policy instruments are entered simultaneously, and the same control variables used in the baseline model are included as concomitant variables.
The indirect association is considered statistically significant when the KHB difference between the rescaled reduced model coefficient and the full model coefficient is statistically different from zero. Statistically significant direct and indirect associations are consistent with a partial mediation pattern; whereas, a statistically significant indirect association accompanied by a statistically insignificant direct association is consistent with a full mediation pattern. The mediated percentage is also reported as a descriptive estimate of the share of the total association attributable to the cognition-mediated pathway.

3.3.3. Robustness, Common Method Bias, and Heterogeneity Analyses

Several additional analyses are conducted to assess the robustness of the baseline results. First, the ordered probit model is replaced with an ordered logit model. Consistent signs and statistical significance of the main policy variables across the two specifications are regarded as evidence that the results are not driven by the choice of the nonlinear probability model.
Second, entropy balancing is applied to subsidy support, which is measured as a binary indicator. The non-recipient group is reweighted to match the subsidy-recipient group with respect to observed individual, household, and production characteristics, including gender, age, education level, cooperative membership, household agricultural labor force, household income, tea planting area, number of land plots, and tea-growing experience. The entropy-balanced weights are then used to re-estimate the ordered logit model. This procedure assesses whether the association between subsidy support and adoption intensity remains robust after balancing observed covariates. Because capacity-building support and information provision are measured as ordinal perceived-support variables, they are not dichotomized for matching, as doing so would discard information and introduce arbitrary thresholds. Entropy balancing can reduce selection bias associated with observed characteristics but cannot eliminate bias arising from unobserved factors or reverse causality.
Because capacity-building support, information provision, and multidimensional cognition are based on responses from the same questionnaire, potential common method bias is further assessed using Harman’s single-factor test. An unrotated principal component analysis is performed using capacity-building support, information provision, and the eight cognition items. The absence of a single factor accounting for the majority of the total variance is interpreted as diagnostic evidence that no dominant common method factor is present. However, this test cannot completely rule out common method bias.
Finally, exploratory heterogeneity analyses are conducted according to cooperative membership and education level. Farmers are classified as cooperative members or non-members and as belonging to lower- or higher-education groups. The lower-education group includes respondents with junior high school education or below; whereas, the higher-education group includes those with senior high school, technical secondary school, college, or higher education.
Rather than inferring heterogeneity solely from differences in significance across separate subgroup regressions, full-sample ordered probit models are estimated with interaction terms between each policy instrument and the corresponding grouping variable. Formal interaction tests are then used to determine whether the associations between policy instruments and adoption intensity differ statistically across groups. Separate subgroup regressions are retained only as supplementary descriptive evidence. Given the relatively small size of the higher-education subgroup, the heterogeneity results are interpreted as exploratory rather than conclusive.

4. Results

4.1. Descriptive Statistics and Distribution of Adoption Intensity

As shown in Table 2, the mean value of adoption intensity is 2.021, with a standard deviation of 1.150. This indicates that surveyed farmers adopted approximately two types of pesticide-reduction practices on average, while considerable variation existed across farmers. Among the three perceived policy instruments, the mean value of subsidy support is 0.149, suggesting that about 14.9% of the respondents perceived or received subsidy-related support. The mean values of capacity-building support and information provision are 2.826 and 3.340, respectively, indicating that farmers perceived information provision more strongly than capacity-building support. The mean value of multidimensional cognition is 0.597, with a standard deviation of 0.186, showing that farmers differed in their cognitive evaluations of pesticide-reduction practices.
Most respondents were male, with an average age of 51.28 years. The mean education level is 1.904. About 55.3% of the respondents were members of tea cooperatives or associations.
In terms of specific practice types, the use of low-risk pest-control inputs was the most widely adopted pesticide-reduction practice, with an adoption rate of 84.75%. The adoption rates of need-based and precision pesticide application, biological control, cultural and ecological management, and mechanical and physical control were 43.26%, 30.14%, 26.60%, and 16.67%, respectively.
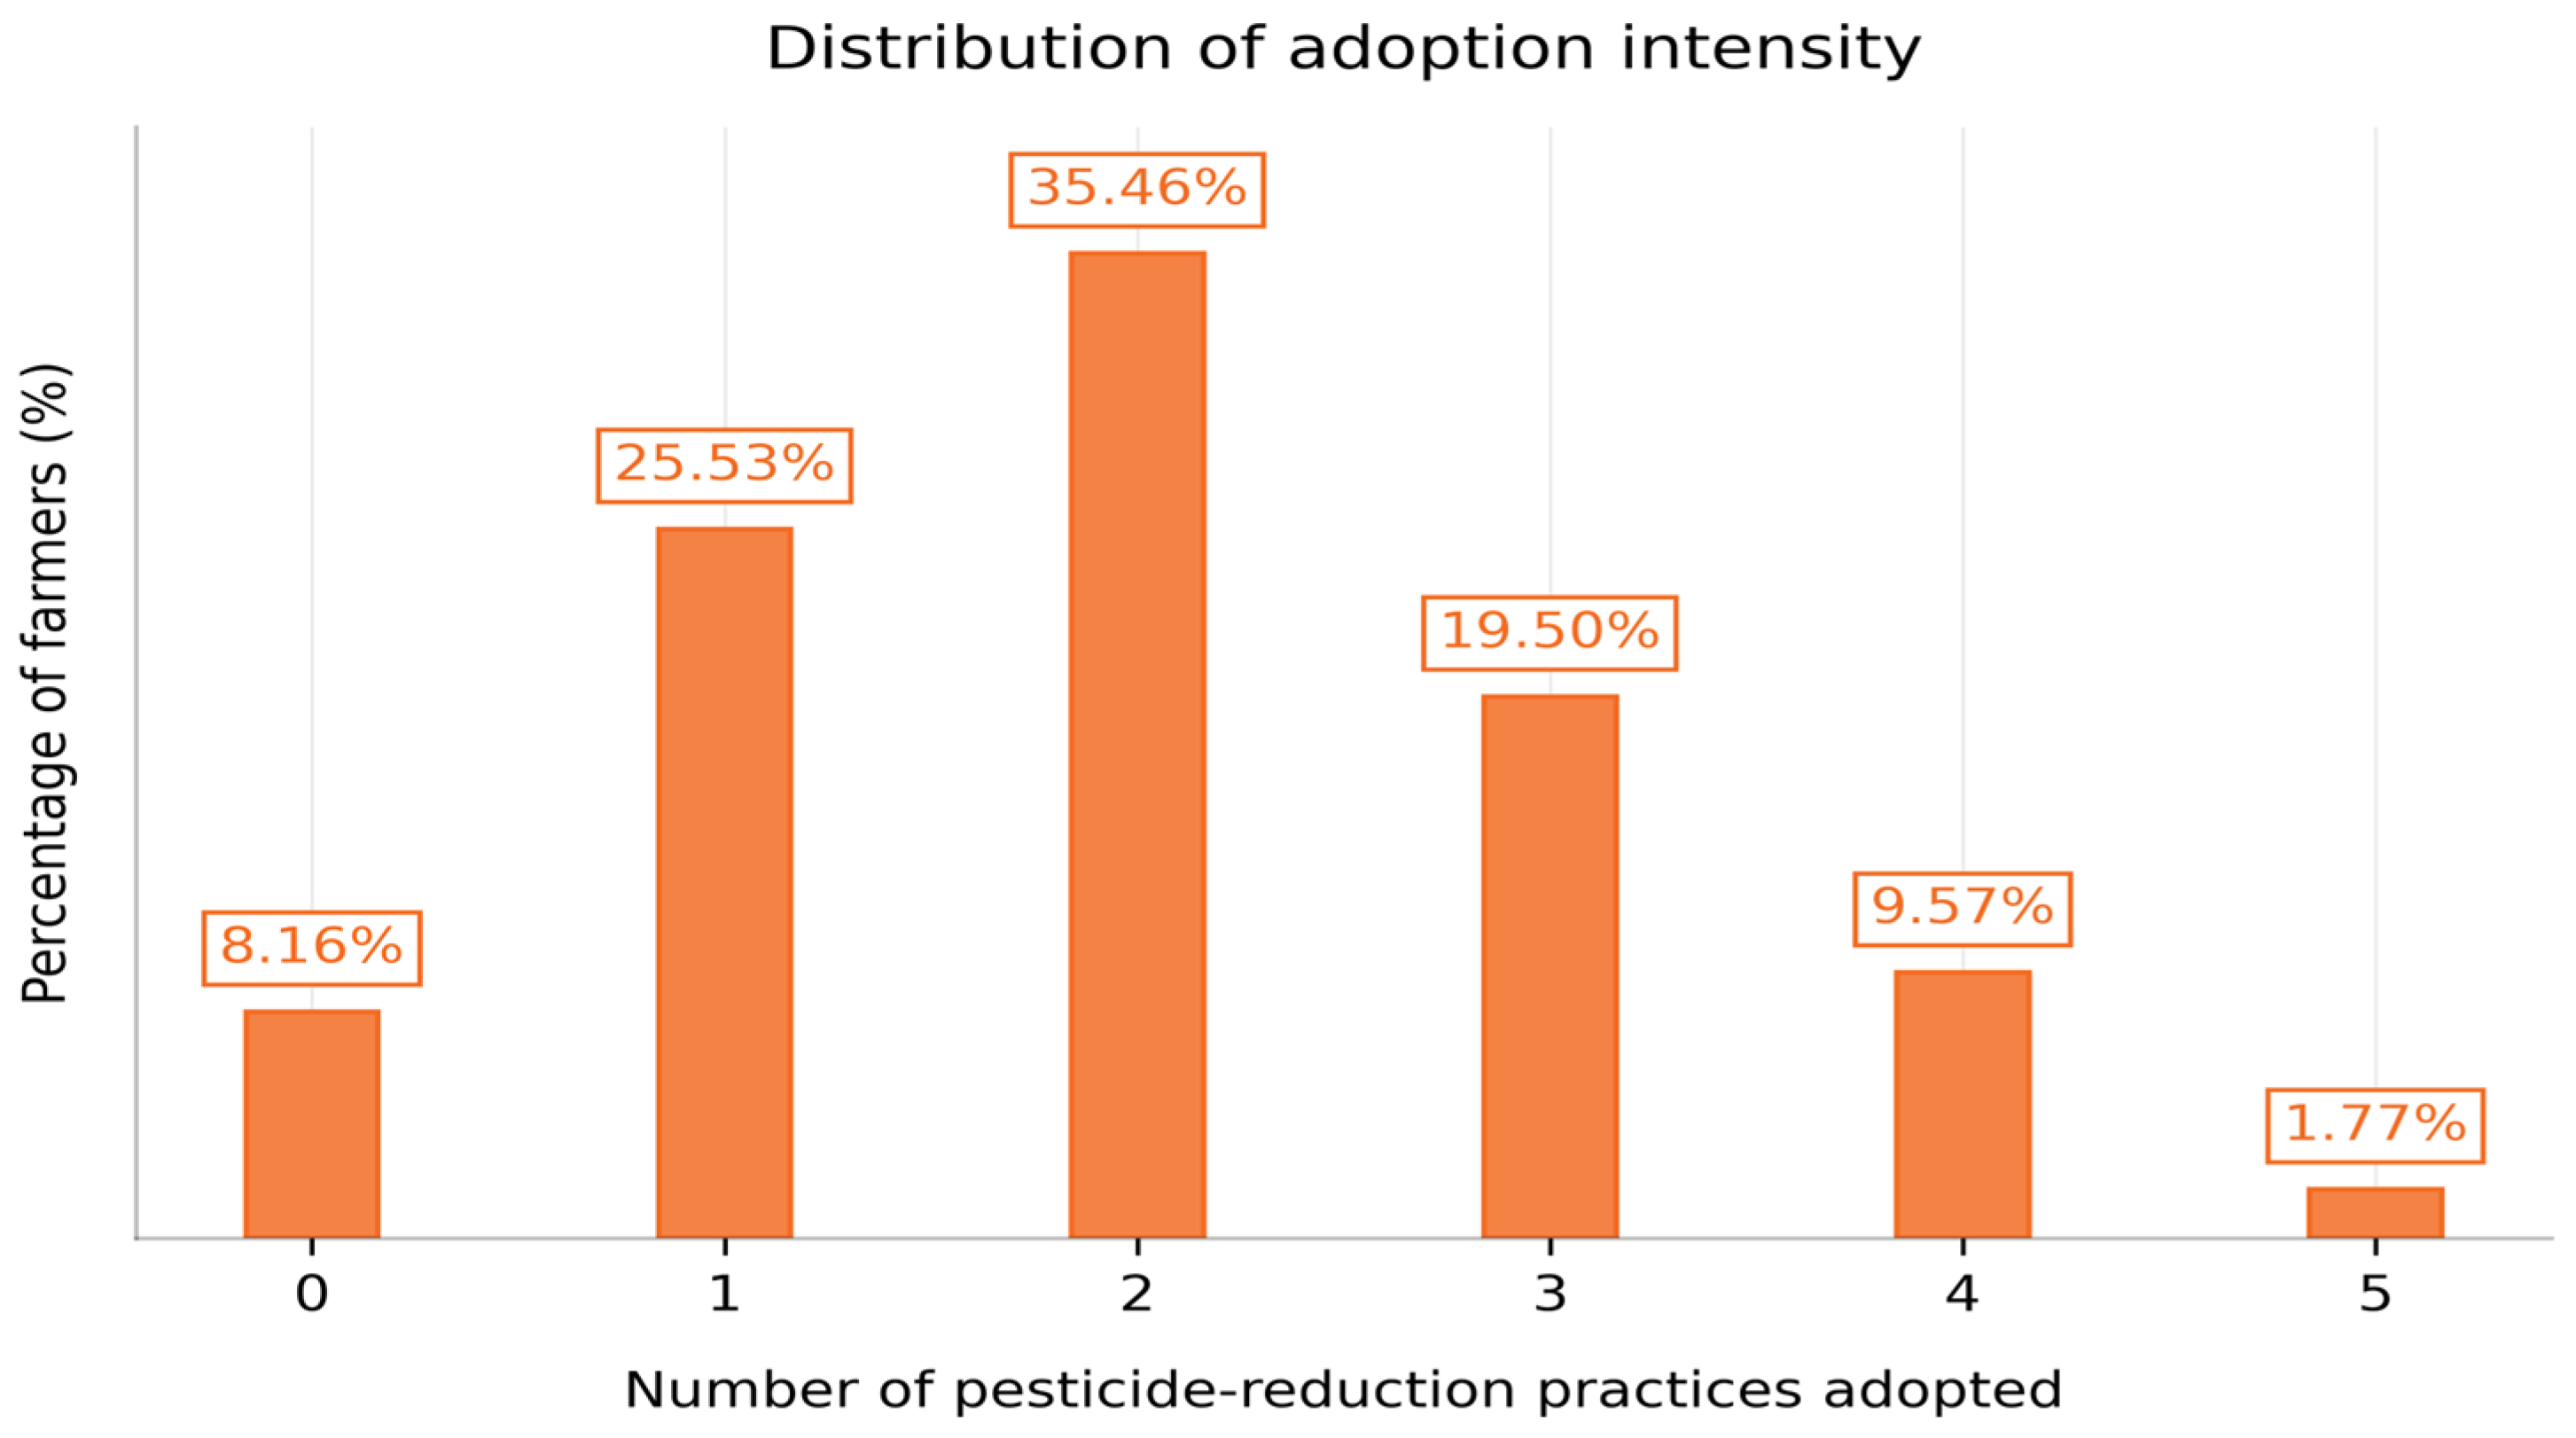
Figure 3 presents the distribution of adoption intensity. The results show that 8.16% of farmers did not adopt any pesticide-reduction practices. Farmers adopting one, two, and three types of practices accounted for 25.53%, 35.46%, and 19.50%, respectively, while only 9.57% and 1.77% adopted four and five types of practices.
This distribution indicates that most farmers had already adopted at least one pesticide-reduction practice, but adoption intensity was mainly concentrated at low to medium levels. High-intensity adoption involving four or more practices remained relatively limited.

4.2. Baseline Regression Results

As shown in Table 3, the estimated coefficients of subsidy support, capacity-building support, and information provision are all positive and significant at the 1% level, regardless of whether control variables are included. This indicates that all three types of perceived policy instruments are positively associated with the adoption intensity of pesticide-reduction practices.
After controlling for individual characteristics, household resource endowments, and production characteristics in Model 2, the coefficients of subsidy support, capacity-building support, and information provision are 0.661, 0.205, and 0.196, respectively, and all are significant at the 1% level. Therefore, H1a, H1b, and H1c are supported.

4.3. Marginal Effects

As shown in Table 4, all three policy instruments significantly reduce the probability of farmers being in the lowest adoption-intensity categories and significantly increase the probability of being in higher adoption-intensity categories, especially AI = 3, AI = 4, and AI = 5.
Specifically, subsidy support reduces the probability of adopting no practices and adopting only one practice by 5.7 and 11.9 percentage points, respectively. At the same time, it increases the probability of adopting three, four, and five practices by 8.1, 9.8, and 3.0 percentage points, respectively. Capacity-building support and information provision show similar patterns: both significantly reduce the probabilities of AI = 0 and AI = 1, and significantly increase the probabilities of AI = 3, AI = 4, and AI = 5.

4.4. Robustness Checks

To test the robustness of the baseline results, this study replaces the ordered probit model with an ordered logit model. As shown in Table 5, the coefficients of subsidy support, capacity-building support, and information provision remain positive and significant at the 1% level. In the ordered logit model, the coefficients of subsidy support, capacity-building support, and information provision are 1.156, 0.360, and 0.343. The signs and statistical significance of these estimates are consistent with the Baseline Ordered Probit results.
To further assess whether the estimated association of subsidy support with adoption intensity reflects observable differences between farmers reporting subsidy support and those not reporting such support, this study applies entropy balancing. As reported in Table 5, the coefficient of subsidy support remains positive and statistically significant in the entropy-balanced ordered logit model (coefficient = 1.011, p = 0.006). The effective sample size of the weighted non-recipient group is 112.64, and the maximum weight is 0.929. This result indicates that the association remains positive and statistically significant after reweighting on observed covariates.
Because capacity-building support, information provision, and multidimensional cognition were measured using the same questionnaire, potential common method bias was further assessed using Harman’s single-factor test. An unrotated principal component analysis of capacity-building support, information provision, and the eight cognition items extracted four components with eigenvalues greater than one. The first component accounted for 36.69% of the total variance, indicating that no single factor explained the majority of the covariance among the variables.

4.5. KHB Mediation Analysis

To assess the mediating role of multidimensional cognition in the associations between perceived policy instruments and adoption intensity, this study applies the Karlson–Holm–Breen (KHB) method within an ordered logit framework. The KHB method decomposes the association between each policy instrument and adoption intensity into total, direct, and indirect components while accounting for the rescaling problem that arises when coefficients from nested nonlinear models are compared.
As shown in Table 6, subsidy support has a significant positive total association with adoption intensity (coefficient = 1.194, p = 0.001). After multidimensional cognition is included, the direct association remains positive and statistically significant (coefficient = 0.746, p = 0.048). The indirect association through multidimensional cognition is also statistically significant (coefficient = 0.448, p = 0.001), accounting for 37.49% of the total association. These results support a partial mediation pattern in the association between subsidy support and adoption intensity.
Capacity-building support and information provision also show significant positive total and direct associations with adoption intensity. However, their indirect associations through multidimensional cognition are not statistically significant. Specifically, the indirect association is 0.027 for capacity-building support (p = 0.779) and 0.044 for information provision (p = 0.651). Although the corresponding mediated proportions are 7.43% and 11.89%, respectively, these proportions should not be interpreted as evidence of mediation because the indirect associations are not statistically different from zero.
Accordingly, H2a is supported; whereas, H2b and H2c are not supported. Overall, the results provide statistical support for a partial mediation pattern only in the association between subsidy support and adoption intensity. The KHB results do not provide statistical evidence that it mediates the associations of capacity-building support or information provision with adoption intensity in the present sample.
An exploratory disaggregation of multidimensional cognition into perceived application-cost advantage, perceived expected benefits, environmental cognition, and self-efficacy is reported in Table S1. When the four dimensions are entered simultaneously, their joint indirect association remains significant for subsidy support (coefficient = 0.444, p = 0.008). However, none of the dimension-specific indirect associations reach statistical significance at the 5% level. Self-efficacy accounts for the largest share of the subsidy-related joint indirect association (37.28%) and is marginally significant at the 10% level (coefficient = 0.166, p = 0.061). By contrast, the joint indirect associations remain statistically insignificant for capacity-building support (p = 0.693) and information provision (p = 0.591).

4.6. Heterogeneity Analysis

This study further examines whether the associations between perceived policy instruments and adoption intensity vary according to cooperative membership and education level. The sample includes 126 farmers who are not cooperative members and 156 cooperative members. The lower-education group contains 214 farmers with junior high school education or below; whereas, the higher-education group contains 68 farmers with senior high school, technical secondary school, or higher education.
Rather than inferring heterogeneity from differences in statistical significance across separate subgroup regressions, this study estimates full-sample ordered probit models containing interaction terms between each policy instrument and the corresponding grouping variable. As shown in Table 7, none of the interactions between the three policy instruments and cooperative membership are statistically significant. The interaction coefficients are 0.561 for subsidy support, 0.087 for capacity-building support, and −0.142 for information provision, with p-values of 0.186, 0.492, and 0.284, respectively. Therefore, although the separate subgroup estimates display different patterns, the formal tests do not provide conclusive evidence that the associations of the three policy instruments differ between cooperative members and non-members.
For education level, the interactions of subsidy support and information provision with the higher-education group are not statistically significant. The interaction between capacity-building support and higher education is positive and marginally significant at the 10% level (coefficient = 0.229, p = 0.065).
The original subgroup regression results are reported in Supplementary Table S2 to illustrate the observed patterns within each group. Overall, the formal interaction tests provide limited evidence of systematic heterogeneity.

5. Discussion

5.1. Perceived Policy Instruments and Adoption Intensity

The results show that perceived subsidy support, capacity-building support, and information provision were each positively associated with tea farmers’ adoption intensity of pesticide-reduction practices. This pattern is consistent with research that treats the adoption of sustainable practices as a portfolio decision rather than a single yes-or-no choice [11,13], and it complements recent tea-specific work on the breadth and depth of green-control technology adoption [14]. The present findings add a different comparison: they consider whether three forms of farmer-perceived policy support are associated with the number of pesticide-reduction practices adopted within the same tea-farmer sample.
The positive association of subsidy support with adoption intensity is broadly consistent with evidence that incentives linked to short-term economic benefits are more likely to be associated with the adoption of sustainable agricultural practices [15]. However, it contrasts with Tambo and Liverpool-Tasie [40], who found that farm-input subsidies in Zambia could discourage integrated pest-management adoption. The contrast suggests that the relevant question is not simply whether farmers receive subsidies, but what the subsidy supports. Subsidies for conventional inputs may reinforce existing pesticide-dependent production paths; whereas, support perceived as related to pesticide-reduction practices may be associated with the addition of alternative practices. This interpretation remains tentative because the present survey did not identify the specific design, amount, or delivery mechanism of subsidy support.
The capacity-building result also requires a qualified interpretation. Training studies have reported improvements in pesticide-related knowledge [16], although such gains do not necessarily translate into uniform changes in pesticide-safety practices. For example, a recent cluster-randomized trial among Ugandan smallholders improved knowledge and some attitudes but found no significant improvement in general pesticide-safety practices [18]. Similarly, training among vegetable farmers in Bangladesh improved some pesticide-handling practices while pesticide use increased [41]. Against this evidence, the positive association between perceived capacity-building support and adoption intensity should not be interpreted as showing that training necessarily reduces pesticide use. Rather, it indicates that farmers reporting stronger capacity-building support were also more likely to report a broader portfolio of pesticide-reduction practices.
A similar distinction applies to information provision. Mass-media campaigns in East Africa were associated with improved knowledge of pesticide risks and increased adoption of safer alternatives, while not necessarily discouraging synthetic pesticide use [19]. This is closely related to the present outcome measure: adoption intensity captures the number of pesticide-reduction practice categories adopted, not the quantity of chemical pesticides applied. Thus, the positive association between perceived information provision and adoption intensity may reflect the addition of alternative or complementary practices, but it does not demonstrate a reduction in overall pesticide use. Across the three instruments, the findings therefore point to the relevance of financial, capacity-related, and informational support for multi-practice adoption, while leaving open how different forms of support affect actual pesticide-use levels.

5.2. Multidimensional Cognition and Differentiated Policy Mechanisms

The KHB results reveal a more specific pattern than the baseline associations. Multidimensional cognition provides statistical support for a partial mediation pattern only in the association between subsidy support and adoption intensity: the indirect association accounts for 37.49% of the total association, while the direct association remains statistically significant. The exploratory disaggregation further shows that the four cognitive dimensions are jointly significant; whereas, none of the individual indirect associations reaches the 5% level. Although self-efficacy accounts for the largest share and is marginally significant, the results do not identify a dominant single mediator. The subsidy-related pattern is therefore better understood as a combined cognitive-evaluation pathway rather than a single-channel mechanism.
Previous studies provide several related but distinct cognitive pathways. Liu and Liu [27] show that policy subsidies can encourage green-technology adoption while weakening the negative association between perceived risks and adoption. Guo et al. [34] found that technical cognition mediated the association between environmental regulation and farmers’ adoption of safety agro-utilization technology cognition-to-adoption pathway. Other studies identify different cognitive structures: ecological cognition partially mediates the association between agricultural extension services and willingness to use organic fertilizer [26]; whereas, tea farmers’ cognition has been linked to green production behavior through social and personal norms [31]. Compared with these findings, the present study identifies a narrower pattern. Perceived subsidy support is associated with pesticide-reduction adoption intensity partly through farmers’ combined evaluations of application costs, expected benefits, environmental consequences, and implementation capability. At the same time, the persistence of a significant direct association and the absence of a significant single-dimension pathway indicate that subsidy-related cognition should not be reduced to one isolated perception. Given the cross-sectional and perception-based design, this result represents a statistical mediation pattern rather than a causal mechanism.
The nonsignificant indirect associations for capacity-building support and information provision should likewise be interpreted against the specific cognitive constructs used in earlier studies. Liu et al. [42] found that cooperative technical training promoted organic-fertilizer adoption mainly through farmers’ technical ability, while perception played a comparatively smaller mediating role. This differs from the present result for capacity-building support, but the two studies measure different forms of support and different mechanisms: participation in a specific training program and technical ability in the former, versus perceived capacity-building support and a broader cognition index in the present study. For information provision, Chen et al. [20] found that information intervention affected green-technology adoption through income, safety, and health risk perceptions; whereas, environmental risk perception did not form a significant mediation pathway. This differentiated evidence is consistent with the present finding that information provision was positively associated with adoption intensity but did not show a significant indirect association through the four cognitive dimensions measured here. Accordingly, the results do not indicate that capacity-building support or information provision lacks cognitive relevance; they indicate only that the present cognitive measures did not jointly provide statistical support for mediation in these associations.

5.3. Limited and Exploratory Heterogeneity by Cooperative Membership and Education

The formal interaction tests provide limited evidence of systematic heterogeneity in the associations between perceived policy instruments and adoption intensity. None of the interactions between subsidy support, capacity-building support, or information provision and cooperative membership are statistically significant. For education, the interactions involving subsidy support and information provision are also statistically insignificant. Only the interaction between capacity-building support and higher education is positive and marginally significant at the 10% level. Accordingly, differences in coefficients across the separate subgroup regressions should not be interpreted as evidence that the policy-support associations differ systematically across farmer groups.
Previous tea-farmer research suggests that organizational support and participation can be associated with green production behavior [30]. However, this does not imply that cooperative membership necessarily changes the associations between perceived policy instruments and adoption intensity. The present analysis tests the latter question and finds no statistically significant membership-based differences. This result should not be interpreted as evidence that cooperatives are unimportant. Cooperative membership is only a binary indicator and does not capture the frequency, quality, or content of services that members receive.
The marginally positive education interaction for capacity-building support should also be interpreted cautiously. The higher-education subgroup includes only 68 farmers, and the interaction does not reach the 5% significance level. It therefore provides, at most, exploratory evidence that the association between perceived capacity-building support and adoption intensity may vary by education level. The results do not support strong policy differentiation by cooperative membership or education. Instead, they suggest that support should remain broadly accessible, while future research with larger and more diverse samples should examine whether service intensity and educational differences shape these associations.

5.4. Policy Implications

Policy implementation should pay attention to whether financial, capacity-building, and informational support are perceived by farmers as accessible and relevant to their production decisions. In the present sample, all three forms of perceived support were positively associated with the adoption of a broader portfolio of pesticide-reduction practices. This suggests that the practical reach of existing support depends not only on its formal provision, but also on how it is communicated and experienced by smallholder tea farmers.
Subsidy-related support should be communicated in ways that help farmers assess the practical feasibility of supported pesticide-reduction practices. The partial mediation pattern for subsidy support indicates that farmers’ evaluations of application costs, expected benefits, environmental consequences, and implementation capability are relevant to its association with practice adoption. Clear information about the scope of support and its relevance to feasible practices may therefore help farmers judge whether particular options fit their own tea-garden conditions.
Access to relevant support should not be made contingent solely on cooperative membership or education level. The formal interaction tests provided no robust evidence that the associations between perceived policy support and adoption intensity differed systematically across these groups. Support should therefore remain accessible to farmers with different organizational connections and educational backgrounds, rather than being based on assumptions that particular groups are consistently more responsive to a given form of support.

5.5. Limitations and Future Research

This study is based on cross-sectional survey data from 282 tea farmers in Jian’ou City, Fujian Province. The design does not establish temporal ordering or causal effects, and the empirical checks cannot fully eliminate reverse causality or bias from unobserved factors. In addition, the core variables rely on farmers’ self-reports. Perceived policy support, cognition, and reported practice adoption may be affected by recall bias, social-desirability bias, prior experience, or local governance perceptions. Although Harman’s single-factor test did not indicate a dominant common-method factor, common-method bias cannot be fully excluded.
The findings should also be interpreted within the specific regional and sample context. The Jian’ou sample does not represent all tea-producing regions or other crop systems, and the exploratory education-related result is based on a relatively small higher-education subgroup (n = 68). Accordingly, neither the observed associations nor the limited heterogeneity pattern should be generalized without caution. Larger and multi-regional samples are needed to assess whether these patterns remain stable across different tea-production settings.
Finally, adoption intensity is measured as the number of pesticide-reduction practice categories adopted. It does not capture differences in implementation area, frequency, technical quality, pesticide-input reduction, or ecological performance. Likewise, the four cognitive dimensions do not encompass all mechanisms potentially linking perceived support with adoption behavior. Future research could combine longitudinal household surveys with policy-implementation records and direct measures of pesticide inputs, pest-management performance, and production outcomes.

6. Conclusions

Using survey data from 282 smallholder tea farmers in Jian’ou City, Fujian Province, this study examined the associations between perceived policy support and the adoption intensity of pesticide-reduction practices. Adoption intensity was measured as the number of five practice categories adopted, rather than as a binary adoption decision. The results show that perceived subsidy support, capacity-building support, and information provision were each positively associated with the adoption of a broader pesticide-reduction practice portfolio. In the full ordered probit model, the corresponding coefficients were 0.661, 0.205, and 0.196, respectively, and all were statistically significant at the 1% level. The marginal-effect estimates further indicated lower predicted probabilities of remaining at the lowest adoption levels and higher predicted probabilities of adopting multiple practices.
The central contribution of the study lies in showing that the cognitive pattern was not uniform across the three perceived support channels. Multidimensional cognition provided statistical support for a partial mediation pattern only in the association between subsidy support and adoption intensity: the indirect association was 0.448 and accounted for 37.49% of the total association. By contrast, the indirect associations for capacity-building support and information provision were not statistically significant. The four-dimension analysis further showed that the subsidy-related indirect association was jointly significant, while no individual cognitive dimension reached the 5% significance level. Thus, the findings do not identify a single dominant cognitive mechanism. In addition, formal interaction tests provided only limited evidence that these associations differed systematically by cooperative membership or education level.
These findings suggest that the implementation of pesticide-reduction support should attend to whether farmers perceive available support as accessible and relevant to their production decisions. They also indicate that subsidy-related support may be more closely associated with farmers’ combined evaluations of costs, benefits, environmental consequences, and implementation capability than are the other two perceived support channels. However, the study is limited by its cross-sectional design, single regional sample, self-reported measures, and practice-count outcome. The results therefore describe statistical associations rather than causal policy impacts, and they do not measure actual pesticide-input reductions or ecological outcomes. Future research should use larger multi-regional and longitudinal datasets, combine household surveys with objective policy-implementation records, and link adoption measures to pesticide use, pest-management performance, and production outcomes.

Supplementary Materials

The following supporting information can be downloaded at: https://www.mdpi.com/article/10.3390/su18147218/s1, Table S1: Exploratory Disaggregation of KHB Indirect Associations by Cognitive Dimension; Table S2: Exploratory Subgroup Regressions by Cooperative Membership and Education Level.

Author Contributions

Conceptualization, B.S. and J.C.; Methodology, B.S. and J.C.; Validation, W.Y.; Formal Analysis, C.L.; Investigation, C.L., W.Y. and J.C.; Data Curation, C.L., W.Y. and J.C.; Writing—Original Draft Preparation, C.L.; Writing—Review and Editing, B.S., W.Y. and J.C.; Visualization, C.L. and W.Y.; Supervision, B.S.; Project Administration, B.S. and J.C.; Funding Acquisition, B.S. All authors have read and agreed to the published version of the manuscript.

Funding

This research was funded by the Natural Science Foundation of Fujian Province, grant number 2023J01467. The APC was funded by the authors.

Institutional Review Board Statement

Ethical review and approval were waived for this study by the College of Rural Revitalization, Fujian Agriculture and Forestry University. The exemption was granted because the study consisted of a non-interventional, non-invasive, and strictly anonymous socioeconomic questionnaire survey involving voluntary participation by tea farmers. No biological samples, medical interventions, or personally identifiable information were involved, and the study was considered to pose no more than minimal risk to participants.

Informed Consent Statement

Informed consent was obtained from all subjects involved in the study.

Data Availability Statement

The data presented in this study are available from the corresponding author upon reasonable request. The data are not publicly available because participants were informed that their responses would be used only for academic research and would not be disclosed to unauthorized third parties.

Acknowledgments

The authors gratefully acknowledge the tea farmers who voluntarily participated in the survey. We also thank the relevant local government departments in Jian’ou City for their support during the fieldwork.

Conflicts of Interest

The authors declare no conflicts of interest. The funder had no role in the design, execution, interpretation, or writing of the study.

Abbreviations

The following abbreviations are used in this manuscript:
S-O-RStimulus–Organism–Response
AIAdoption intensity
SUBSubsidy support
CBSCapacity-building support
INFInformation provision
MCMultidimensional cognition
PACPerceived application-cost advantage
PEBPerceived expected benefits
ECEnvironmental cognition
SESelf-efficacy
GENGender
AGEAge
EDUEducation level
COOPCooperative membership
LABORHousehold agricultural labor force
INCHousehold income level
AREATea planting area
PLOTSNumber of land plots
EXPTea-growing experience
KHBKarlson–Holm–Breen
ESSEffective sample size

References

  1. Hazarika, L.K.; Bhuyan, M.; Hazarika, B.N. Insect Pests of Tea and Their Management. Annu. Rev. Entomol. 2009, 54, 267–284. [Google Scholar] [CrossRef] [PubMed]
  2. Pandey, A.K.; Sinniah, G.D.; Babu, A.; Tanti, A. How the Global Tea Industry Copes With Fungal Diseases—Challenges and Opportunities. Plant Dis. 2021, 105, 1868–1879. [Google Scholar] [CrossRef] [PubMed]
  3. Ding, X.; Lu, Q.; Li, L.; Li, H.; Sarkar, A. Measuring the Impact of Relative Deprivation on Tea Farmers’ Pesticide Application Behavior: The Case of Shaanxi, Sichuan, Zhejiang, and Anhui Province, China. Horticulturae 2023, 9, 342. [Google Scholar] [CrossRef]
  4. Gould, F.; Brown, Z.S.; Kuzma, J. Wicked Evolution: Can We Address the Sociobiological Dilemma of Pesticide Resistance? Science 2018, 360, 728–732. [Google Scholar] [CrossRef] [PubMed]
  5. Wan, N.-F.; Fu, L.; Dainese, M.; Kiær, L.P.; Hu, Y.-Q.; Xin, F.; Goulson, D.; Woodcock, B.A.; Vanbergen, A.J.; Spurgeon, D.J.; et al. Pesticides Have Negative Effects on Non-Target Organisms. Nat. Commun. 2025, 16, 1360. [Google Scholar] [CrossRef] [PubMed]
  6. Tang, F.H.M.; Wyckhuys, K.A.G.; Li, Z.; Maggi, F.; Silva, V. Transboundary Impacts of Pesticide Use in Food Production. Nat. Rev. Earth Environ. 2025, 6, 383–400. [Google Scholar] [CrossRef]
  7. Zhou, W.; Arcot, Y.; Medina, R.F.; Bernal, J.; Cisneros-Zevallos, L.; Akbulut, M.E.S. Integrated Pest Management: An Update on the Sustainability Approach to Crop Protection. ACS Omega 2024, 9, 41130–41147. [Google Scholar] [CrossRef] [PubMed]
  8. Barzman, M.; Bàrberi, P.; Birch, A.N.E.; Boonekamp, P.; Dachbrodt-Saaydeh, S.; Graf, B.; Hommel, B.; Jensen, J.E.; Kiss, J.; Kudsk, P.; et al. Eight Principles of Integrated Pest Management. Agron. Sustain. Dev. 2015, 35, 1199–1215. [Google Scholar] [CrossRef]
  9. Brunelle, T.; Chakir, R.; Carpentier, A.; Dorin, B.; Goll, D.; Guilpart, N.; Maggi, F.; Makowski, D.; Nesme, T.; Roosen, J.; et al. Reducing Chemical Inputs in Agriculture Requires a System Change. Commun. Earth Environ. 2024, 5, 369. [Google Scholar] [CrossRef]
  10. Finger, R.; Sok, J.; Ahovi, E.; Akter, S.; Bremmer, J.; Dachbrodt-Saaydeh, S.; de Lauwere, C.; Kreft, C.; Kudsk, P.; Lambarraa-Lehnhardt, F.; et al. Towards Sustainable Crop Protection in Agriculture: A Framework for Research and Policy. Agric. Syst. 2024, 219, 104037. [Google Scholar] [CrossRef]
  11. Thompson, B.; Barnes, A.P.; Toma, L. Increasing the Adoption Intensity of Sustainable Agricultural Practices in Europe: Farm and Practice Level Insights. J. Environ. Manag. 2022, 320, 115663. [Google Scholar] [CrossRef] [PubMed]
  12. Kolady, D.E.; van der Sluis, E.; Uddin, M.M.; Deutz, A.P. Determinants of Adoption and Adoption Intensity of Precision Agriculture Technologies: Evidence from South Dakota. Precis. Agric. 2021, 22, 689–710. [Google Scholar] [CrossRef]
  13. Oyetunde-Usman, Z.; Olagunju, K.O.; Ogunpaimo, O.R. Determinants of Adoption of Multiple Sustainable Agricultural Practices among Smallholder Farmers in Nigeria. Int. Soil Water Conserv. Res. 2021, 9, 241–248. [Google Scholar] [CrossRef]
  14. Shan, T.C.; Li, L.P.; Wu, X.Q.; Li, H. The Impact of Agricultural Input Dealers on Tea Farmers’ Adoption of Green Prevention and Control Technologies and the Moderating Role of Government Regulation. Res. Agric. Mod. 2025, 46, 966–980. [Google Scholar] [CrossRef]
  15. Piñeiro, V.; Arias, J.; Dürr, J.; Elverdin, P.; Ibáñez, A.M.; Kinengyere, A.; Opazo, C.M.; Owoo, N.; Page, J.R.; Prager, S.D.; et al. A Scoping Review on Incentives for Adoption of Sustainable Agricultural Practices and Their Outcomes. Nat. Sustain. 2020, 3, 809–820. [Google Scholar] [CrossRef]
  16. Goeb, J.; Lupi, F. Showing Pesticides’ True Colors: The Effects of a Farmer-to-Farmer Training Program on Pesticide Knowledge. J. Environ. Manag. 2021, 279, 111821. [Google Scholar] [CrossRef] [PubMed]
  17. Zhou, L.; Zhang, F.; Zhou, S.; Turvey, C.G. The Peer Effect of Training on Farmers’ Pesticide Application: A Spatial Econometric Approach. China Agric. Econ. Rev. 2020, 12, 481–505. [Google Scholar] [CrossRef]
  18. Ssekkadde, P.; Tomberge, V.M.J.; Brugger, C.; Atuhaire, A.; Dalvie, M.A.; Rother, H.-A.; Röösli, M.; Inauen, J.; Winkler, M.S.; Fuhrimann, S. Educational Intervention Effects on Pesticide-Related Knowledge, Attitudes, Practices, Exposure, and Health among Ugandan Smallholder Farmers: A Cluster Randomized Controlled Trial. Int. J. Public Health 2025, 70, 1608952. [Google Scholar] [CrossRef] [PubMed]
  19. Tambo, J.A.; Mugambi, I.; Onyango, D.O.; Uzayisenga, B.; Romney, D. Using Mass Media Campaigns to Change Pesticide Use Behaviour among Smallholder Farmers in East Africa. J. Rural Stud. 2023, 99, 79–91. [Google Scholar] [CrossRef]
  20. Chen, S.; Zhu, X.; Bi, W.; Li, Z.; Ma, H. Information Intervention and Farmers’ Green Technology Adoption: Evidence from the Perspective of Risk Perception. Front. Sustain. Food Syst. 2025, 9, 1534476. [Google Scholar] [CrossRef]
  21. Lei, S.; Qiao, Q.; Gao, X.; Feng, J.; Wen, Y.; Han, Y. Ecological Awareness, Policy Perception, and Green Production Behaviors of Farmers Living in or near Protected Areas. Forests 2023, 14, 1339. [Google Scholar] [CrossRef]
  22. Guo, Z.; Chen, X.; Zhang, Y. Impact of Environmental Regulation Perception on Farmers’ Agricultural Green Production Technology Adoption: A New Perspective of Social Capital. Technol. Soc. 2022, 71, 102085. [Google Scholar] [CrossRef]
  23. Dessart, F.J.; Barreiro-Hurlé, J.; van Bavel, R. Behavioural Factors Affecting the Adoption of Sustainable Farming Practices: A Policy-Oriented Review. Eur. Rev. Agric. Econ. 2019, 46, 417–471. [Google Scholar] [CrossRef]
  24. Swart, R.; Levers, C.; Davis, J.T.M.; Verburg, P.H. Meta-Analyses Reveal the Importance of Socio-Psychological Factors for Farmers’ Adoption of Sustainable Agricultural Practices. One Earth 2023, 6, 1771–1783. [Google Scholar] [CrossRef]
  25. Meunier, E.; Smith, P.; Griessinger, T.; Robert, C. Understanding Changes in Reducing Pesticide Use by Farmers: Contribution of the Behavioural Sciences. Agric. Syst. 2024, 214, 103818. [Google Scholar] [CrossRef]
  26. Qiao, D.; Li, N.; Cao, L.; Zhang, D.; Zheng, Y.; Xu, T. How Agricultural Extension Services Improve Farmers’ Organic Fertilizer Use in China? The Perspective of Neighborhood Effect and Ecological Cognition. Sustainability 2022, 14, 7166. [Google Scholar] [CrossRef]
  27. Liu, M.; Liu, H. Farmers’ Adoption of Agriculture Green Production Technologies: Perceived Value or Policy-Driven? Heliyon 2024, 10, e23925. [Google Scholar] [CrossRef] [PubMed]
  28. Lou, S.; Zhang, B.; Zhang, D. Foresight from the Hometown of Green Tea in China: Tea Farmers’ Adoption of Pro-Green Control Technology for Tea Plant Pests. J. Clean. Prod. 2021, 320, 128817. [Google Scholar] [CrossRef]
  29. Hu, H.; Cao, A.; Chen, S.; Li, H. Effects of Risk Perception of Pests and Diseases on Tea Farmers’ Green Control Techniques Adoption. Int. J. Environ. Res. Public Health 2022, 19, 8465. [Google Scholar] [CrossRef] [PubMed]
  30. Hu, X.; Zhao, Q.; Gao, Q.; Zhang, O. Government Support, Organization and Farmers’ Green Production Behavior: Based on the Survey Data of 470 Tea Farmers in Anhui Province. J. Yunnan Agric. Univ. (Soc. Sci.) 2023, 17, 63–72. [Google Scholar] [CrossRef]
  31. Xianyu, Y.; Long, H.; Wang, Z.; Meng, L.; Duan, F. The Impact of Tea Farmers’ Cognition on Green Production Behavior in Jingmai Mountain: Chain Mediation by Social and Personal Norms and the Moderating Role of Government Regulation. Sustainability 2024, 16, 8885. [Google Scholar] [CrossRef]
  32. Jacoby, J. Stimulus–Organism–Response Reconsidered: An Evolutionary Step in Modeling (Consumer) Behavior. J. Consum. Psychol. 2002, 12, 51–57. [Google Scholar] [CrossRef] [PubMed]
  33. Song, Y.; Zhang, L.; Zhang, M. Research on the Impact of Public Climate Policy Cognition on Low-Carbon Travel Based on SOR Theory—Evidence from China. Energy 2022, 261, 125192. [Google Scholar] [CrossRef]
  34. Guo, X.; Li, J.; Lin, Z.; Ma, L. The Impact of Environmental Regulation and Technical Cognition on Farmers’ Adoption of Safety Agro-Utilization of Heavy Metal-Contaminated Farmland Soil. Sustainability 2024, 16, 3343. [Google Scholar] [CrossRef]
  35. Bandura, A. Human Agency in Social Cognitive Theory. Am. Psychol. 1989, 44, 1175–1184. [Google Scholar] [CrossRef] [PubMed]
  36. Bandura, A. Social Cognitive Theory: An Agentic Perspective. Annu. Rev. Psychol. 2001, 52, 1–26. [Google Scholar] [CrossRef] [PubMed]
  37. Kohler, U.; Karlson, K.B.; Holm, A. Comparing Coefficients of Nested Nonlinear Probability Models. Stata J. 2011, 11, 420–438. [Google Scholar] [CrossRef]
  38. Karlson, K.B.; Holm, A.; Breen, R. Comparing Regression Coefficients between Same-Sample Nested Models Using Logit and Probit: A New Method. Sociol. Methodol. 2012, 42, 286–313. [Google Scholar] [CrossRef]
  39. Smith, E.K.; Lacy, M.G.; Mayer, A. Performance Simulations for Categorical Mediation: Analyzing KHB Estimates of Mediation in Ordinal Regression Models. Stata J. 2019, 19, 913–930. [Google Scholar] [CrossRef]
  40. Tambo, J.A.; Liverpool-Tasie, L.S.O. Are Farm Input Subsidies a Disincentive for Integrated Pest Management Adoption? Evidence from Zambia. J. Agric. Econ. 2024, 75, 740–763. [Google Scholar] [CrossRef]
  41. Schreinemachers, P.; Wu, M.-H.; Uddin, M.N.; Ahmad, S.; Hanson, P. Farmer Training in Off-Season Vegetables: Effects on Income and Pesticide Use in Bangladesh. Food Policy 2016, 61, 132–140. [Google Scholar] [CrossRef]
  42. Liu, Y.; Shi, K.; Liu, Z.; Qiu, L.; Wang, Y.; Liu, H.; Fu, X. The Effect of Technical Training Provided by Agricultural Cooperatives on Farmers’ Adoption of Organic Fertilizers in China: Based on the Mediation Role of Ability and Perception. Int. J. Environ. Res. Public Health 2022, 19, 14277. [Google Scholar] [CrossRef] [PubMed]
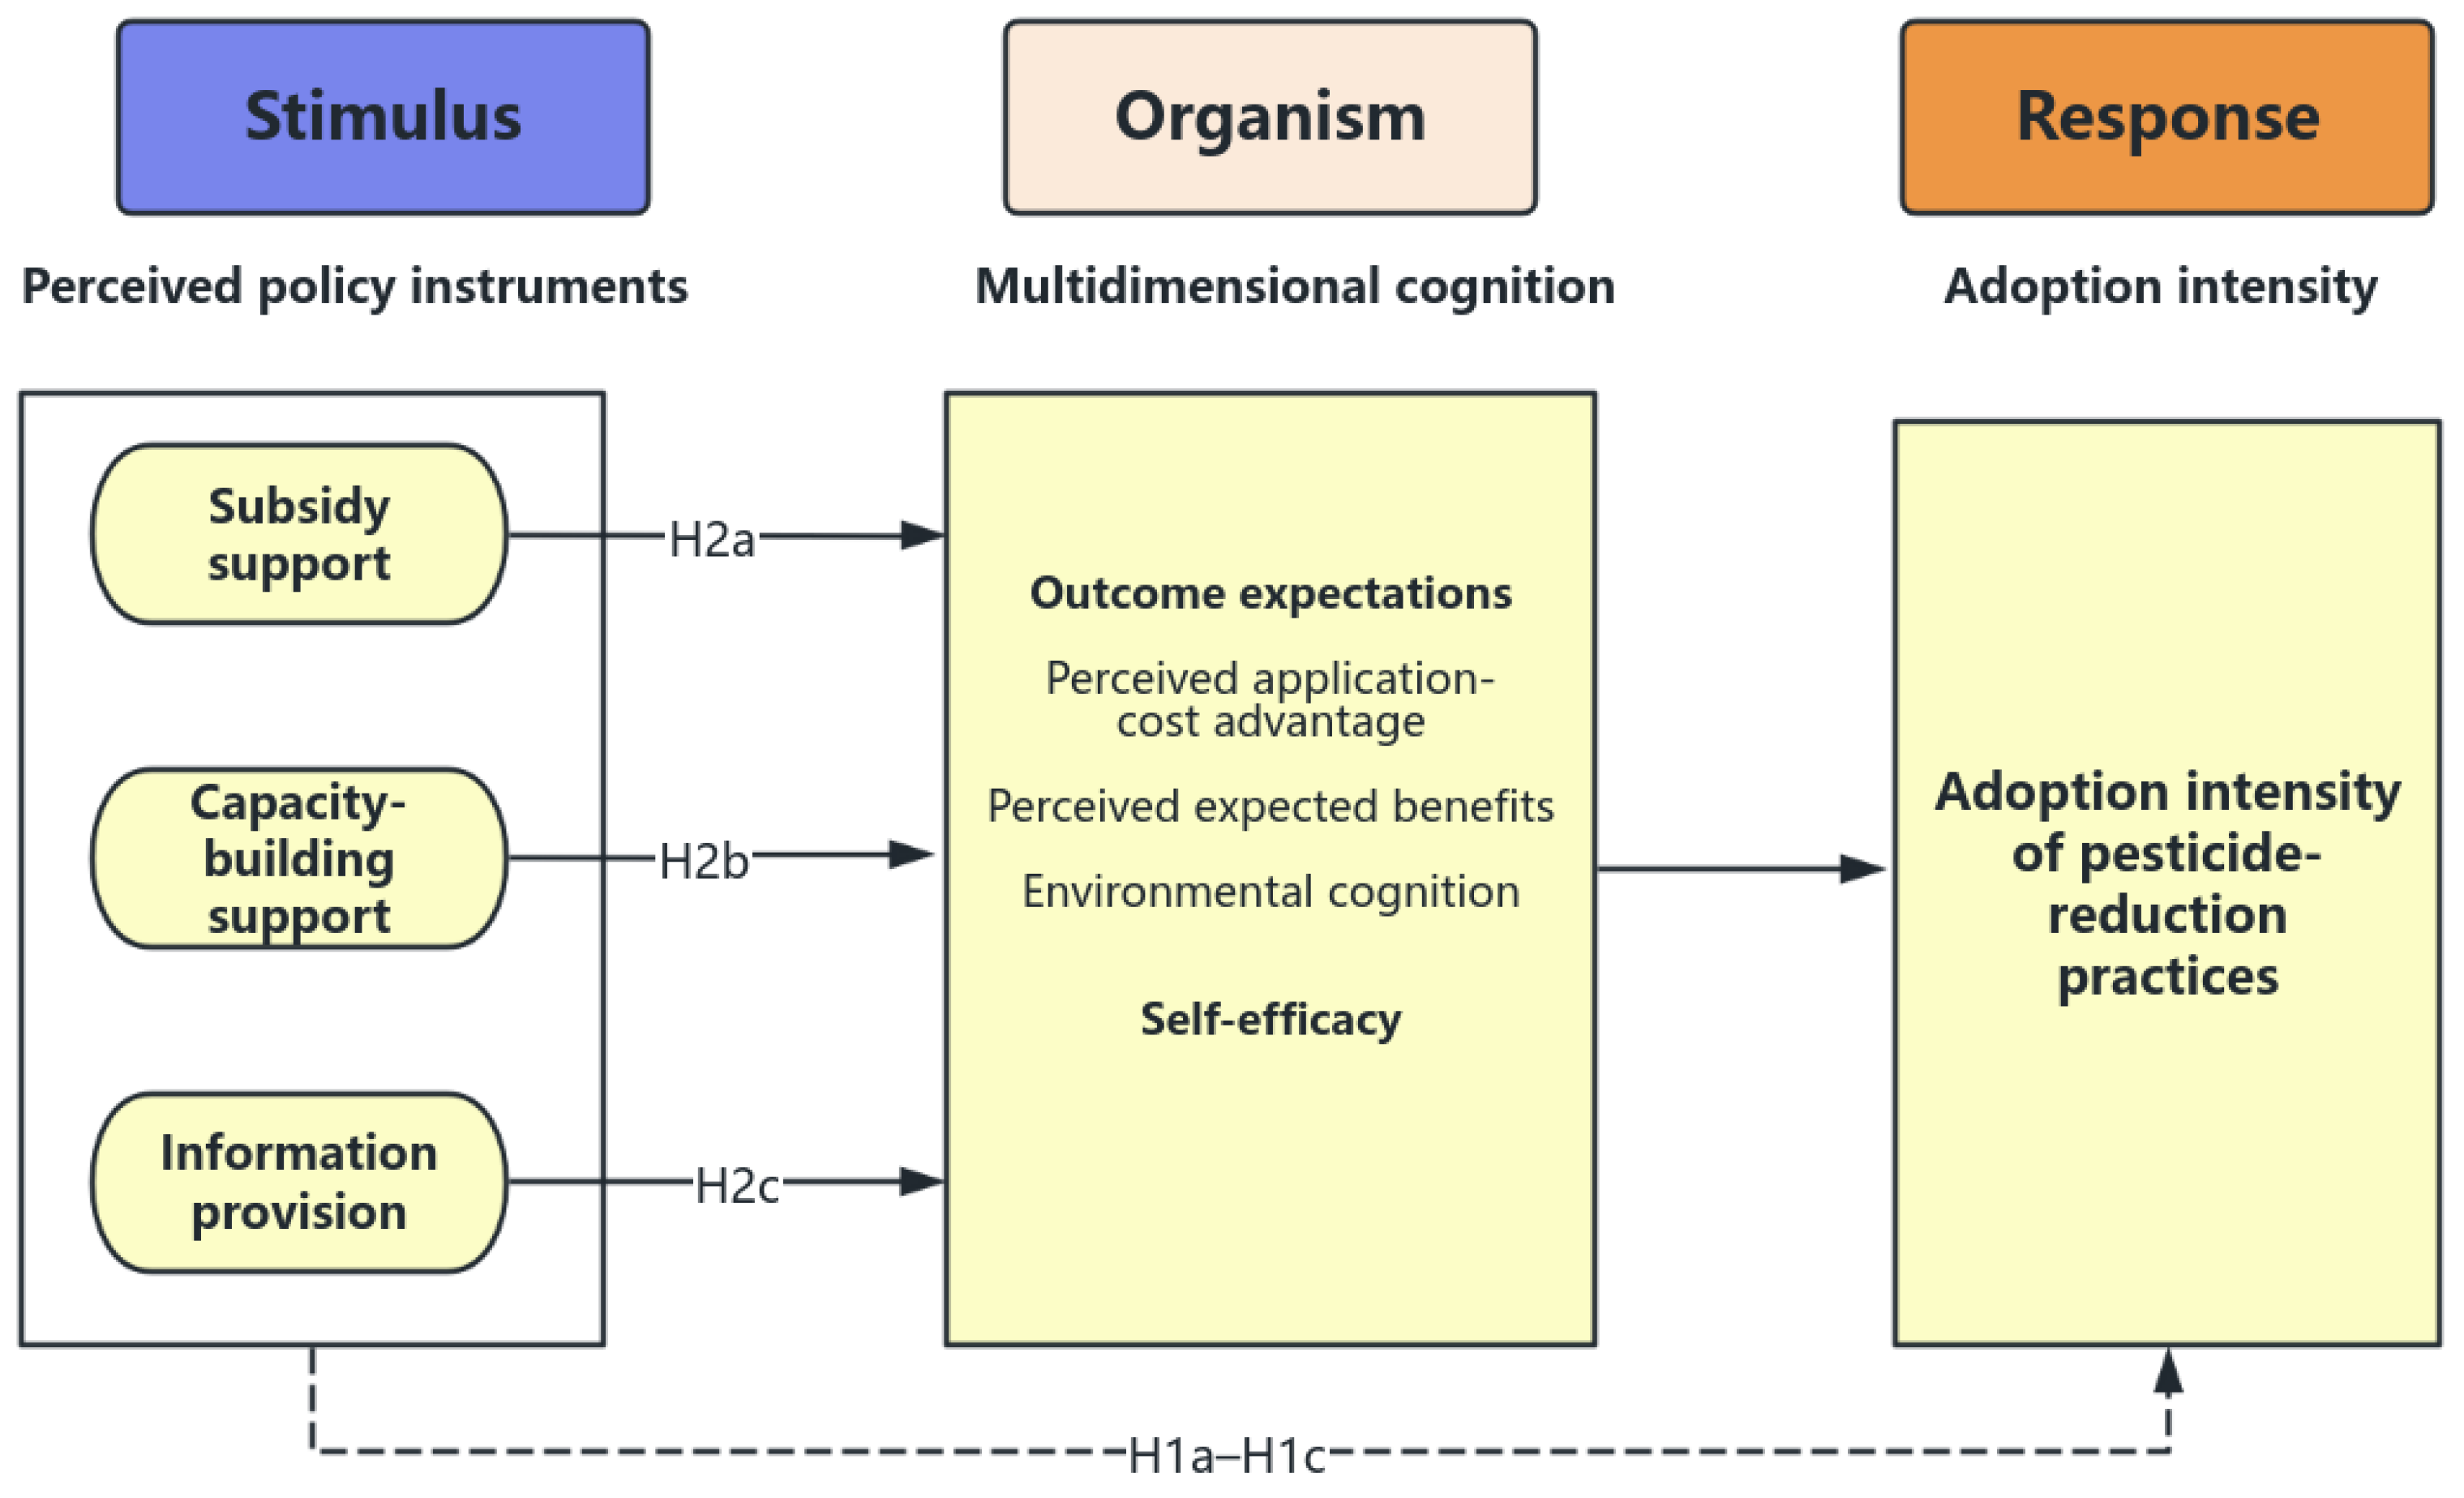
Figure 1. Theoretical mechanism framework of policy instruments, multidimensional cognition, and adoption intensity of pesticide-reduction practices.
Sustainability 18 07218 g001
Figure 2. Location of the study area and surveyed towns in Jian’ou City, Fujian Province, China.
Sustainability 18 07218 g002
Figure 3. Distribution of adoption intensity.
Sustainability 18 07218 g003
Table 1. Variable definitions and measurement.
Variable (Abbreviation)Measurement and Coding
Adoption intensity (AI)Count of pesticide-reduction practice categories adopted in the past three years: (1) need-based and precision application; (2) low-risk pest-control inputs; (3) biological control; (4) cultural and ecological management; and (5) mechanical and physical control. Each category is coded 1 if adopted and 0 otherwise; total = 0–5.
Subsidy support (SUB)0 = no perceived or received subsidy support; 1 = perceived or received subsidy-related support for pesticide-reduction practices, inputs, technologies, or services.
Capacity-building support (CBS)Five-point Likert scale of perceived usefulness or intensity of support related to pesticide reduction, green pest control, or safe pesticide application; higher = stronger perceived support.
Information provision (INF)Five-point Likert scale of perceived exposure to publicity, information, or education on pesticide reduction, green production, and ecological safety; higher = stronger perceived information provision.
Multidimensional cognition (MC)Entropy-weighted composite of eight items on application-cost advantage, expected benefits, environmental cognition, and self-efficacy; higher = more favorable cognition.
Gender (GEN)0 = female; 1 = male.
Age (AGE)Respondent age (years).
Education level (EDU)1 = primary school or below; 2 = junior high school; 3 = senior high school or technical secondary school; 4 = college degree or above.
Cooperative membership (COOP)0 = non-member; 1 = member of a tea cooperative or association.
Household agricultural labor force (LABOR)1 = ≤3 persons; 2 = 4–6 persons; 3 = >6 persons.
Household income level (INC)1 = ≤30,000 yuan; 2 = 30,000–50,000 yuan; 3 = 50,000–100,000 yuan; 4 = >100,000 yuan.
Tea planting area (AREA)1 = <5 mu; 2 = 5–10 mu; 3 = >10 mu.
Number of land plots (PLOTS)1 = 1–3 plots; 2 = 4–6 plots; 3 = >6 plots.
Tea-growing experience (EXP)1 = ≤5 years; 2 = 6–15 years; 3 = 16–25 years; 4 = >25 years.
Table 2. Descriptive statistics.
VariableMeanStd. Dev.MinMax
Adoption intensity (AI)2.0211.1500.0005.000
Subsidy support (SUB)0.1490.3570.0001.000
Capacity-building support (CBS)2.8261.3641.0005.000
Information provision (INF)3.3401.3011.0005.000
Multidimensional cognition (MC)0.5970.1860.0851.000
Gender (GEN)0.8620.3460.0001.000
Age (AGE)51.2809.85928.00075.000
Education level (EDU)1.9040.9171.0004.000
Cooperative membership (COOP)0.5530.4980.0001.000
Household agricultural labor force (LABOR)1.2060.4991.0003.000
Household income level (INC)3.4650.8441.0004.000
Tea planting area (AREA)2.5430.6531.0003.000
Number of land plots (PLOTS)1.5600.6681.0003.000
Tea-growing experience (EXP)3.1280.8591.0004.000
Perceived application-cost advantage (PAC)2.9111.0641.0005.000
Perceived expected benefits (PEB)3.6791.0741.0005.000
Environmental cognition (EC)4.1420.7681.5005.000
Self-efficacy (SE)3.9540.8951.0005.000
Table 3. Baseline Ordered Probit estimates.
VariableModel 1: Policy OnlyModel 2: Full Model
Subsidy support0.730 ***
(0.190)
0.661 ***
(0.188)
Capacity-building support0.221 ***
(0.058)
0.205 ***
(0.062)
Information provision0.179 ***
(0.062)
0.196 ***
(0.064)
Gender 0.160
(0.178)
Age −0.007
(0.008)
Education level 0.006
(0.083)
Cooperative membership 0.152
(0.158)
Household agricultural labor force −0.159
(0.120)
Household income level 0.233 **
(0.092)
Tea planting area 0.238 *
(0.126)
Number of land plots −0.357 ***
(0.124)
Tea-growing experience −0.138
(0.085)
Observations282282
Log likelihood−393.522−376.382
Wald chi259.523126.238
Pseudo R20.0910.131
Notes: Model 1 includes the three perceived policy instruments only. Model 2 additionally includes the control variables listed in Table 1. Robust standard errors are reported in parentheses. * p < 0.10, ** p < 0.05, *** p < 0.01.
Table 4. Average marginal effects of policy instruments.
VariableAI = 0AI = 1AI = 2AI = 3AI = 4AI = 5
Subsidy support−0.057 ***
(0.014)
−0.119 ***
(0.035)
−0.033
(0.021)
0.081 ***
(0.023)
0.098 ***
(0.035)
0.030 **
(0.015)
Capacity-building support−0.025 ***
(0.008)
−0.035 ***
(0.011)
0.002
(0.003)
0.026 ***
(0.008)
0.025 ***
(0.008)
0.007 **
(0.003)
Information provision−0.024 ***
(0.008)
−0.033 ***
(0.010)
0.001
(0.003)
0.025 ***
(0.008)
0.024 ***
(0.008)
0.007 **
(0.003)
Notes: Entries are average marginal effects from Model 2, averaged over the estimation sample. For subsidy support, effects are discrete changes in predicted probabilities when the variable changes from 0 to 1. For capacity-building support and information provision, effects are average partial derivatives of predicted probabilities with respect to their respective five-point scores. Robust standard errors are reported in parentheses. ** p < 0.05, *** p < 0.01.
Table 5. Robustness checks using an alternative model specification and entropy balancing.
Robustness CheckPolicy InstrumentCoefficientRobust Std. Err.p-ValueNSpecification/Diagnostic
Alternative ordered-logit modelSubsidy support1.156 ***0.3450.001282Full controls included
Capacity-building support0.360 ***0.1160.002282Full controls included
Information provision0.343 ***0.1190.004282Full controls included
Entropy-balanced ordered-logit modelSubsidy support1.011 ***0.3690.006282Control-group ESS = 112.64
Notes: Alternative ordered-logit and entropy-balanced ordered-logit estimates are reported. All models include the three perceived policy instruments and the control variables listed in Table 1. Robust standard errors are reported in the “Robust Std. Err.” column. ESS denotes effective sample size. For the entropy-balanced model, the non-recipient group is reweighted to match the subsidy-recipient group on observed covariates. *** p < 0.01.
Table 6. KHB decomposition of the mediating role of multidimensional cognition.
Policy InstrumentTotal Association (Rescaled Reduced Model)Direct Association (Full Model)Indirect Association via Multidimensional Cognition (Difference)Mediated Proportion (%)
Subsidy support1.194 *** (0.367)0.746 ** (0.378)0.448 *** (0.132)37.49
Capacity-building support0.370 *** (0.114)0.343 *** (0.114)0.027 (0.098)7.43
Information provision0.374 *** (0.118)0.330 *** (0.118)0.044 (0.098)11.89
Notes: Ordered-logit KHB estimates. The table reports total associations from the rescaled reduced model, direct associations from the full model, and indirect associations calculated as their KHB difference. Robust standard errors are reported in parentheses. N = 282. Mediated proportions are descriptive when the corresponding indirect association is not statistically significant. ** p < 0.05, *** p < 0.01.
Table 7. Formal tests of heterogeneity by cooperative membership and education level.
Grouping VariableInteraction TermCoefficientRobust
Std. Err.
p-Value
Cooperative membershipSubsidy support × Cooperative membership0.5610.4240.186
Capacity-building support × Cooperative membership0.0870.1260.492
Information provision × Cooperative membership−0.1420.1330.284
Education levelSubsidy support × Higher education−0.3350.4070.411
Capacity-building support × Higher education0.229 *0.1240.065
Information provision × Higher education0.1760.1450.224
Notes: Entries are interaction coefficients from full-sample ordered probit models. In each model, the three perceived policy instruments, the main effect of the relevant grouping variable, and the three corresponding interaction terms are entered simultaneously, together with all remaining control variables listed in Table 1. Non-members and lower-education farmers are the reference groups. Higher education denotes senior high school, technical secondary school, or above. N = 282 in each model. Robust standard errors are reported in the Robust Std. Err. column. * p < 0.10.
Disclaimer/Publisher’s Note: The statements, opinions and data contained in all publications are solely those of the individual author(s) and contributor(s) and not of MDPI and/or the editor(s). MDPI and/or the editor(s) disclaim responsibility for any injury to people or property resulting from any ideas, methods, instructions or products referred to in the content.