1. Introduction
The decarbonisation of maritime transport stands among the most critical challenges in the global transition toward a low-carbon economy. The shipping sector is presently responsible for approximately 3% of global greenhouse gas (GHG) emissions. Without timely and coordinated intervention, this contribution is projected to increase significantly by mid-century, driven by the anticipated growth in international trade volumes. Beyond the climate dimension, the sector’s near-total dependence upon fossil fuels exposes it to acute geopolitical vulnerabilities: a large fraction of the global oil supply transits through critical chokepoints, such as the Strait of Hormuz, where tensions have disrupted fuel supply chains and introduced significant price volatility for ship operators worldwide. The convergence of environmental and energy security pressures makes the transition toward alternative, low-carbon propulsion solutions a strategic necessity for the long-term resilience of global maritime trade.
Indeed, the International Maritime Organization (IMO) adopted a revised GHG Strategy in 2023, targeting at least a 40% reduction in carbon intensity by 2030 relative to 2008 levels and net-zero emissions by or around 2050, while the European Union has extended its Monitoring, Reporting and Verification (MRV) framework and Emissions Trading System (ETS) to cover maritime operators. The stimulus deriving from this regulatory action has catalysed the development and implementation of various decarbonisation technologies ranging from air lubrication systems [
1,
2,
3], and wind-assisted propulsion [
4,
5] to electrification [
6,
7,
8], use of hydrogen [
9], ammonia [
10], alternative bio-derived fuels and hybrid energy architectures across all shipping segments [
11,
12]. On the port side, Regulation (EU) 2023/1804 requires the availability of cold ironing in major Trans-European Networks—Transport (TEN-T) ports for at least 90% of port calls of seagoing ships above 5000 gross tonnes by the end of 2029 [
13].
Within this broad landscape, decarbonisation technologies are strongly route- and vessel-dependent. A growing consensus in the literature holds that battery-electric and hybrid propulsion systems are already viable and cost-competitive for short-to-medium range routes, particularly for applications to coastal passenger ferries, river vessels and interregional container feeders, while e-fuels (power-to-X), green hydrogen and ammonia that instead appear necessary, though considerably costlier and operationally more complex, for deep-sea segments, where energy density requirements exceed the practical limits of current battery technology [
14,
15,
16,
17].
Given the decarbonization technology segmentation, defining the use profile and realising techno-economic analyses and related optimisation before the actual implementation is surely a viable route to provide preliminary information to shipowners about the capital expenditure and related fuel saving.
Lithium-ion chemistries, and within them, Lithium Iron Phosphate (LiFePO4) in particular, have emerged as the dominant near-term option for marine electrification owing to their favourable cycle life, thermal stability and declining specific costs [
6,
7,
8,
18]. Kong et al. [
7] provide a review of the characteristics of the shipping environment and the effects of temperature, vibration, humidity and salt spray on Lithium-Ion battery performance with respect to land-based applications. The effects of temperature and vibration are found to act on the cycle performance of the battery, while humidity and salt spray accelerate ageing. Complementary work by Kolodziejski & Michalska-Pożoga [
6] classifies Battery Energy Storage Systems (BESS) applications by function, such as peak shaving, spinning reserve, load levelling and zero-emission port operations, to map them against hybrid propulsion architectures ranging from mild-hybrid to full-electric configurations. For high-power transients, hybrid topologies pairing batteries with supercapacitors have also been proposed [
8,
19]. Medium-voltage DC architectures and fuel-cell–battery integration represent further frontiers for next-generation low-emission vessels [
20,
21,
22].
A parallel thread of research has addressed the port-ship nexus, recognising that zero-emission berthing cannot be achieved by the vessel alone but requires coordinated investment in shore-power infrastructure, also referred to as cold ironing, local renewable generation and port-side energy storage [
6,
16,
17,
22,
23]. Methodologies for co-designing Onshore Power Supply (OPS) with photovoltaic arrays and BESS substantially reduce at-berth emissions while offering economic benefits to both shipowners and port operators. However, techno-economic studies of cold ironing co-designed with photovoltaic generation indicate that, under current electricity-versus-marine-fuel price ratios, port-side electrification is often not financially self-sustaining without subsidy [
13]. The concept of the port as an active energy node, rather than a passive grid connection point, is indeed increasingly central to ambitious decarbonisation roadmaps [
8,
12,
24].
At the fleet and route level, Moon et al. [
8] and Kersey et al. [
22] demonstrate that declining battery prices are substantially expanding the economic frontier of battery-electric shipping, with emission reductions of up to 73% achievable in combination with low-carbon grid electricity. Industry-driven analyses drawing on hundreds of real BESS installations have documented more mixed operational outcomes: Bei et al. [
25] and Qazi et al. [
26] report low equivalent full-cycle utilisation in many deployed systems, modest but measurable fuel savings, and a persistent need for improved energy management strategies and standardised power interfaces. These findings underline the gap between theoretical potential and current operational practice. Aksöz et al. [
27] further examine long-term energy management strategies for electrified vessels, emphasising that storage sizing and dispatch logic are at least as important as hardware selection for achieving design-intent performance.
The role of policy consistency in enabling maritime energy transitions has also been documented, as by Bach et al. [
9], who identify public procurement stability and actor coordination as critical success factors in the Norwegian context.
Despite this growing body of knowledge, several methodological gaps remain. Notwithstanding the valuable qualitative mappings of BESS applications in the marine sector by Kong et al. [
7] and Kolodziejski & Michalska-Pożoga [
6], they do not develop dynamic simulation models. Moon et al. [
8] and Kersey et al. [
22] offer compelling fleet-level techno-economic evidence of the viability of battery electrification, yet their analyses rely on simplified energy balance models without cell-level experimental validation and do not address the physical constraints of onboard installation. Bei et al. [
25] draw on data from real installed systems, documenting mixed operational outcomes and modest fuel savings, but restrict their economic assessment to simple payback metrics without modelling battery degradation over a multi-decade horizon. Kanchiralla et al. [
28] present a rigorous life-cycle assessment for a battery-electric ferry in the Swedish archipelago, demonstrating the environmental and economic superiority of LiFePO4 chemistry, yet their framework does not encompass alternative energy management strategies nor the gravimetric and spatial constraints that govern retrofit feasibility on existing vessels.
Across these contributions, to the authors’ knowledge, two main gaps remain. First, physical feasibility constraints, such as cargo deck area, deadweight budget and stability margins, are rarely integrated into the optimisation loop, leaving unanswered an important practical question about the real-world viability of retrofitting. Second, the combined assessment of environmental performance, battery degradation, 20-year financial viability and spatial compatibility within a single validated simulation framework has not yet been published for the class of Mediterranean short-sea passenger ferries that face the most immediate regulatory pressure from the EU MRV and ETS extension.
This paper addresses precisely these gaps. Model-based system engineering [
29] is applied to the case study of a hybrid regional ferry operating the Naples-Ischia route. Building on experimental characterisation of a commercial LiFePO4 cell, a full-vessel dynamic model is developed in AVL Cruise M [
30] and used to evaluate two contrasting BESS energy management strategies against a conventional diesel-electric baseline. A 20-year techno-economic assessment, including battery degradation, replacement scheduling, and investment metrics, is combined with a MATLAB (R2025a) multi-objective optimisation that verifies spatial and gravimetric feasibility.
The methodological originality of the present work resides in the simultaneous integration of four elements that have not previously been combined in the published literature for the class of Mediterranean short-sea passenger ferries. First, experimental characterisation of a commercial LiFePO4 cell manufactured in Italy, conducted through HPPC tests at three representative operating temperatures (10 °C, 25 °C, 40 °C), provides a temperature-resolved ECM whose parameters are identified by curve fitting rather than assumed from generic datasheets. Second, an Extended Kalman Filter SOC estimator, validated against the HPPC dataset with a maximum absolute error below 1.5%, is embedded in the ECM and carried forward into the system-level simulation without simplification. Third, the validated ECM is integrated into a full-vessel, multi-domain dynamic model in AVL Cruise M (2025 R2) that simultaneously resolves hull kinematics, propulsion, power generation and BESS subsystems under a real mission profile, enabling assessment of energy management strategies under realistic transient loading. Fourth, a MATLAB multi-objective optimisation that enforces spatial (garage deck area) and gravimetric (deadweight and Load Line Convention) constraints is coupled with a 20-year discounted cash-flow model that accounts for battery degradation and replacement scheduling. This four-element integration, actually spanning electrochemical engineering, naval architecture, control engineering and applied economics, constitutes the distinctive multidisciplinary methodological contribution of the paper.
The text of the paper is organised as follows.
Section 2 describes the ferry case study and its hybrid powertrain.
Section 3 presents the LiFePO
4 cell model and its experimental validation.
Section 4 details the full-vessel dynamic model in AVL Cruise M.
Section 5 defines the BESS sizing criteria, energy management strategies and economic assessment framework.
Section 6 discusses simulation results, environmental findings and financial indicators.
Section 7 concludes with implications for sustainable short-sea shipping.
2. Case Study: Naples–Ischia Regional Ferry
Vessel Description and Route Profile
The considered vessel is a 1900 GT fast passenger ferry operating the Naples Molo Beverello-Ischia route in the Gulf of Naples. Its principal characteristics are summarised in
Table 1. The ship accommodates up to 620 passengers, 45 vehicles and 15 crew members, and is equipped with bar service and full air conditioning. It sails at a service speed of 25 knots over a route of approximately 19 nautical miles (35 km), with a nominal navigation time of 1 h 10 min per leg, performing multiple daily round-trips.
Propulsion and Power Generation Architecture
The vessel adopts a full series electric propulsion architecture: four MTU (MTU—Rolls-Royce Power Systems AG, Friedrichshafen, Germany) 16V 4000 M70 high-speed diesel engines mechanically coupled to MAN (Maschinenfabrik Augsburg-Nürnberg, Munich, Germany) Energy Solutions synchronous alternator-generator sets (nominal 700 V, 50 Hz) supply electrical power to the main switchboard of the vessel, from which it is distributed to the two propulsion electric motors and to auxiliary loads.
Table 2 reports the engine performance data at the three main operating points.
The electrical generation system consists of two 4000 kW asynchronous generators (700 V, 1500 rpm, power factor 0.88), providing a total installed generation capacity of 8000 kW. Propulsion is achieved via two asynchronous electric motors coupled to fixed-pitch propellers through reduction gear shafts. Auxiliary consumers, including HVAC, hotel loads, and navigation systems, are supplied from the same 700 V switchboard.
The hybrid modification introduces a BESS module connected to the DC bus via a bidirectional DC/DC converter, enabling the battery to supply power to the AC bus through a dedicated inverter. This architecture allows the Diesel Engine Generators (DEGs) to be shut down entirely during port operations when load demand falls below the battery’s discharge capability, achieving fully zero-emission port calls.
3. Cell Equivalent Circuit Model and Experimental Validation
Cell Selection and Equivalent Circuit Topology
The battery cells used in this study are commercial-grade LiFePO4 (LFP) prismatic cells produced by FIB FAAM S.p.A. at the Teverola plant (Caserta, Italy). LFP chemistry was selected for its low thermal runaway risk, flat open-circuit voltage (OCV) plateau, long cycle life (>3000 cycles to 80% State-of-Health) and chemical stability in the temperature range relevant to Mediterranean maritime operations.
A holistic cradle-to-grave comparison of NMC and LFP battery types for battery electric ferries (BEFs) was recently presented by Kanchiralla et al. [
28], who evaluated the environmental impact and life cycle cost of different battery chemistries and charging strategies for a passenger ferry operating in the Swedish archipelago. Their study, combining life cycle assessment and life cycle costing, demonstrated that fully electric ferries can achieve more than 90% reduction in global warming potential relative to conventional marine gas oil-powered vessels, and that LFP batteries are preferable over NMC (specifically NMC622|graphite cells) both in terms of life cycle environmental impact and cost competitiveness. Notably, the authors showed that extending opportunity charging intervals reduces the required installed battery capacity, thereby lowering both environmental impact and total cost, an operational insight directly relevant to the energy management strategy optimisation pursued in the present work.
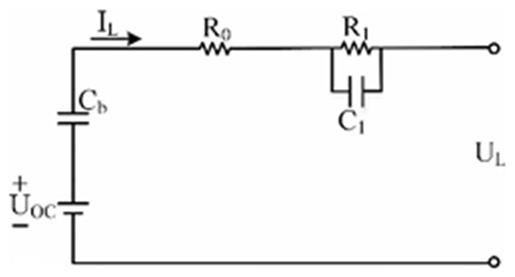
A preliminary study by the authors concerned the possible schematization of the Equivalent Circuit Model (ECM) [
32] among those represented in
Table 3. Among them, the Thevenin model (one RC pair) was finally selected as the optimal trade-off between accuracy and computational efficiency for the present application.
The Rint model, while computationally straightforward, cannot capture the polarisation dynamics of the cell, resulting in poor accuracy under transient loading conditions typical of hybrid marine propulsion. Higher-order models such as PNGV, DP and GNL offer improved fidelity, but at the cost of significantly increased parameter identification complexity, higher computational burden, and reduced numerical stability when embedded into a full-vessel dynamic simulation environment such as AVL Cruise M. The Thevenin model, by contrast, captures the dominant first-order relaxation behaviour of the LFP cell with a single RC branch, whose parameters (R0, R1, C1) can be reliably extracted from HPPC test data through straightforward curve fitting. This level of accuracy is sufficient for energy management and sizing purposes, where the primary outputs of interest are SOC change, energy throughput and terminal voltage under realistic operation, rather than sub-second electrochemical dynamics.
The Thevenin equivalent circuit model was indeed selected for the present study, as the optimal trade-off between accuracy and computational efficiency for the considered application. It is described by the following equations:
where:
: is the cell SOC.
: is the Coulombic efficiency.
: is the cell’s charge/discharge current [A].
: is the cell’s overall capacity [Ah].
: is the cell’s internal resistance.
: is the polarisation resistance representing dispersion at the elctrolyte/electrode interface.
: is the polarisation capacitance.
The parameters
R0,
R1 and
C1 for the considered cell were identified at nine SOC breakpoints (15–90%) and three temperatures (10 °C, 25 °C, 40 °C) from the HPPC test data using the AVL CRUISE M Battery Wizard curve-fitting tool. The quality of the fit is confirmed by the error metrics that are all well below the 5% threshold considered acceptable for system-level transport simulations in the literature [
29,
32]. Higher-order topologies such as PNGV and DP were not pursued mainly because the improvement in fitting accuracy they offer is marginal for LFP cells operating within a moderate SOC window, as documented by Wang et al. [
32], who report that a single RC branch achieves approximately 95% of the accuracy of higher-order models in transport applications. This choice, on the other hand, is consistent with comparable marine hybrid propulsion studies, such as Barone et al. [
19], employing the Thevenin topology for a shipboard BESS.
HPPC Characterisation Protocol
Hybrid Pulse Power Characterisation (HPPC) tests were conducted at three temperatures (10 °C, 25 °C, and 40 °C) using a programmable battery cycling tester. The adopted protocol consisted of a series of 10-s discharge pulses (1C rate) followed by 40-s rest periods, applied at 10% SOC intervals from 90% to 10% SOC. The voltage transient response to each pulse provided the data necessary to extract R0 (from the instantaneous ohmic drop), and R1 and C1 (from the exponential relaxation fitted using the AVL Battery Wizard curve-fitting tool). OCV was measured during the 40-s rest periods at each SOC breakpoint. The raw voltage signals were pre-processed with a low-pass Butterworth filter to remove high-frequency noise before parameter extraction. Fitted ECM parameters (R0, R1, C1, OCV) were tabulated at each SOC-temperature operating point, forming a three-dimensional lookup table that is queried at runtime during the full-vessel simulation.
Extended Kalman Filter State-of-Charge Estimation
To estimate battery SOC in real time during simulation, an Extended Kalman Filter (EKF) was implemented in MATLAB/Simulink, exploiting the nonlinear OCV-SOC relationship of LFP cells. The EKF state vector is [SOC, V_C1], with the ECM equations as the process model and terminal voltage as the observable. The algorithm was validated against the HPPC test dataset: the estimated SOC tracked the reference Coulomb-counting SOC with a maximum absolute error of less than 1.5% across all three temperature conditions, confirming model accuracy.
MATLAB/Simulink Validation
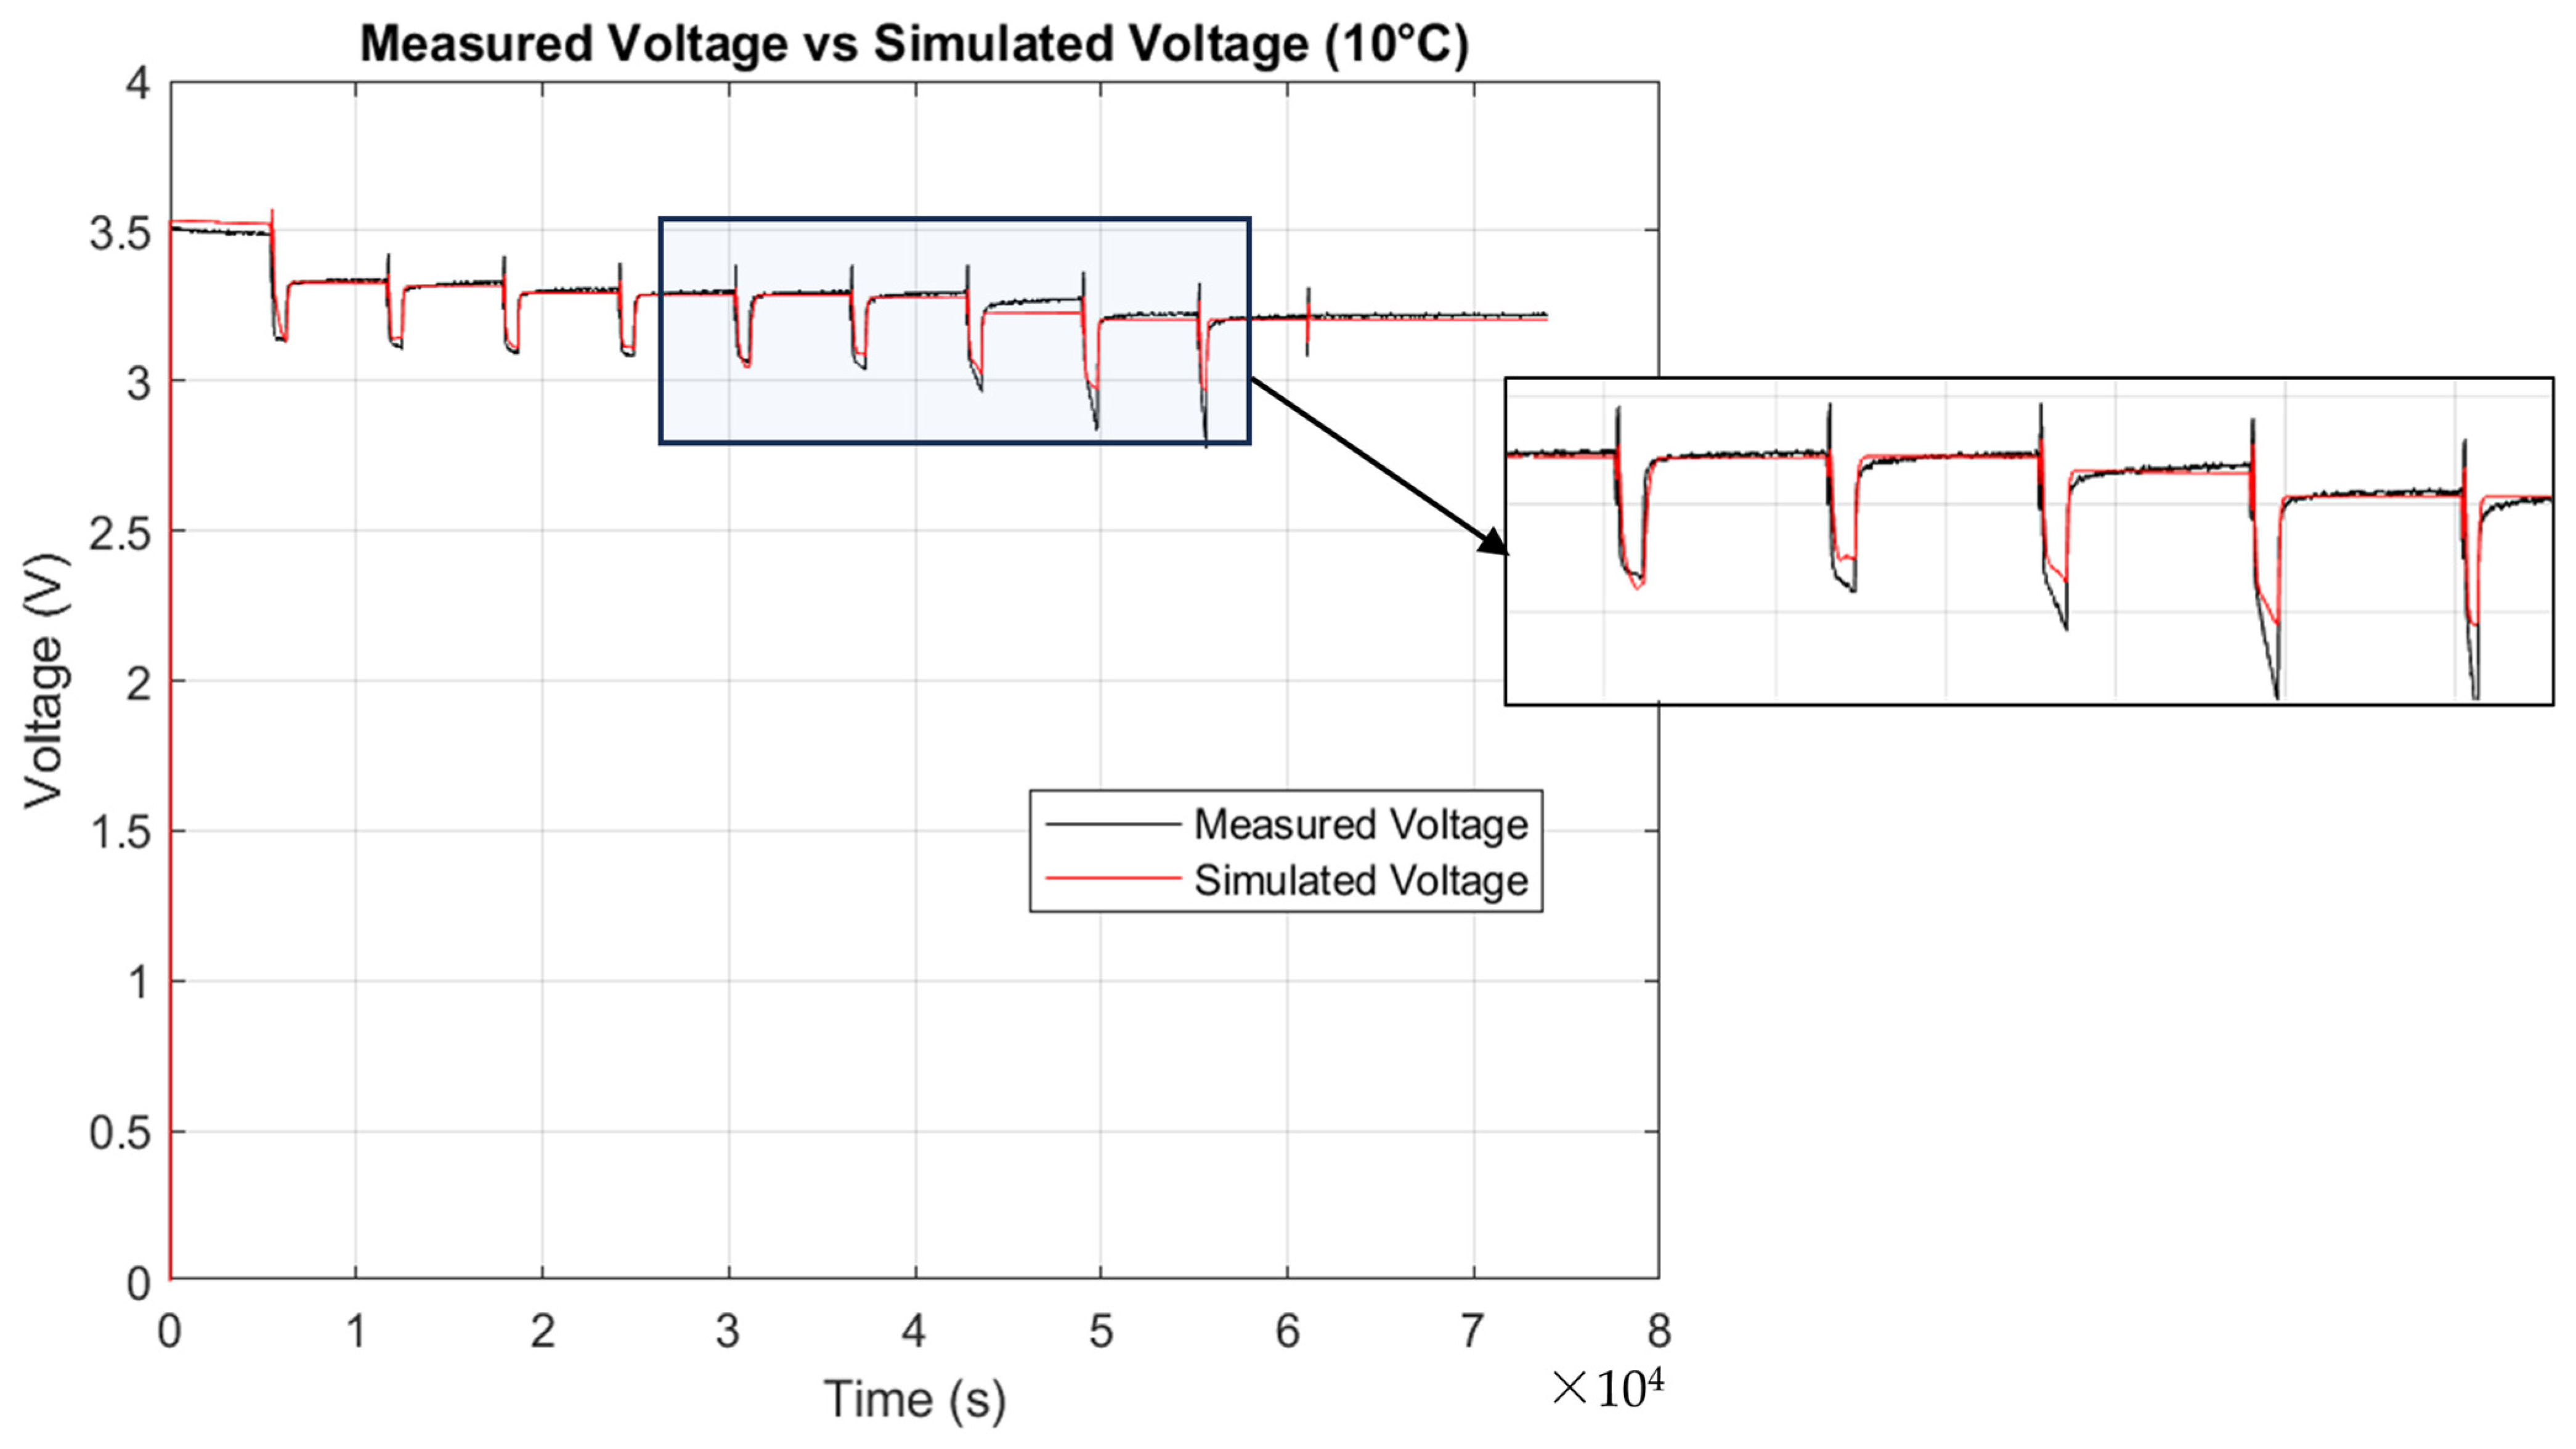
The complete ECM, including the EKF, was validated by replaying the measured current profile from the HPPC test and comparing the simulated terminal voltage with the measured signal.
Figure 1 represents the experimental-numerical comparison.
Three performance indicators were chosen to assess the prediction capability by the ECM model:
RMSE–Root Mean Squared Error:
The RMSE measures the square root of the mean of the squared differences between the actual and predicted values. A lower RMSE indicates a better-performing model. It retains the same units as the target variable and heavily penalises larger errors.
where
V_mod,
i and
V_exp,
i are the simulated and measured terminal voltages at sample
i, and
N is the total number of samples.
MAPE–Mean Absolute Percentage Error:
The MAPE measures the mean absolute percentage error, useful for understanding on average how much forecasts differ from actual values in percentage terms.
Normalised RMSE:
It is a relative version of the RMSE that takes into account the scale of the quantity being evaluated.
The calculated values are reported in
Table 4 for all three temperatures, confirming the quality of fit required for integration into the full-vessel model.
4. Full-Vessel Dynamic Model
The full-vessel dynamic model was implemented in AVL Cruise M, a multi-domain system simulation tool widely used in vehicle engineering for powertrain integration studies and recently being extended to marine applications. The model integrates five main subsystems: (i) vessel kinematics, (ii) hull resistance, (iii) propulsion (shaft line, electric motor, fixed-pitch propeller), (iv) power generation (diesel engines + asynchronous generators) and (v) battery energy storage.
Vessel Kinematics and Hull Resistance
The vessel kinematics block computes instantaneous speed and acceleration from propulsive thrust, drag and inertial forces, using embedded C functions for the equations of motion.
Ship resistance is calculated as a function of vessel speed V (knots) using a third-order polynomial R(V) = a0 + a1V + a2V2 + a3V3, fitted to experimental towing-tank data provided by the shipyard under a non-disclosure agreement. The polynomial is valid over the speed range 5–30 knots, which encompasses all operating conditions on the Naples–Ischia route. Fitting was performed by least-squares regression over 6 measured speed-resistance pairs. The coefficient of determination R2 = 0.9987 confirms agreement across the full speed range, with point-wise residuals not exceeding 2% of the measured resistance at any calibration speed. The model accounts for calm-water friction and wave-making resistance; added resistance due to sea state was not included, as the semi-enclosed Gulf of Naples presents calm-water conditions for the majority of annual sailing hours. Indeed, when the weather conditions become prohibitive, the service is even stopped.
The longitudinal equation of motion is integrated at each time step as:
where m is vessel displacement mass (kg), m
a is hydrodynamic added mass (≈5% of m for a slender fast-ferry hull),
T(
n,
V) is propeller thrust as a function of shaft speed n and vessel speed
V, and
R(
V) is total calm-water resistance. Integration uses a variable-step Runge-Kutta solver embedded in AVL Cruise M.
Propulsion System
The shaft line connects the electric motor output to the propeller through a reduction gearbox.
The electric motor is modelled using manufacturer efficiency maps (torque–speed curves), and the propeller is represented by its non-dimensional thrust coefficient
KT(
J) and torque coefficient
KQ(
J) as functions of advance ratio J, derived from open-water propeller tests. This formulation captures the nonlinear coupling between vessel speed, shaft speed, and propulsive efficiency.
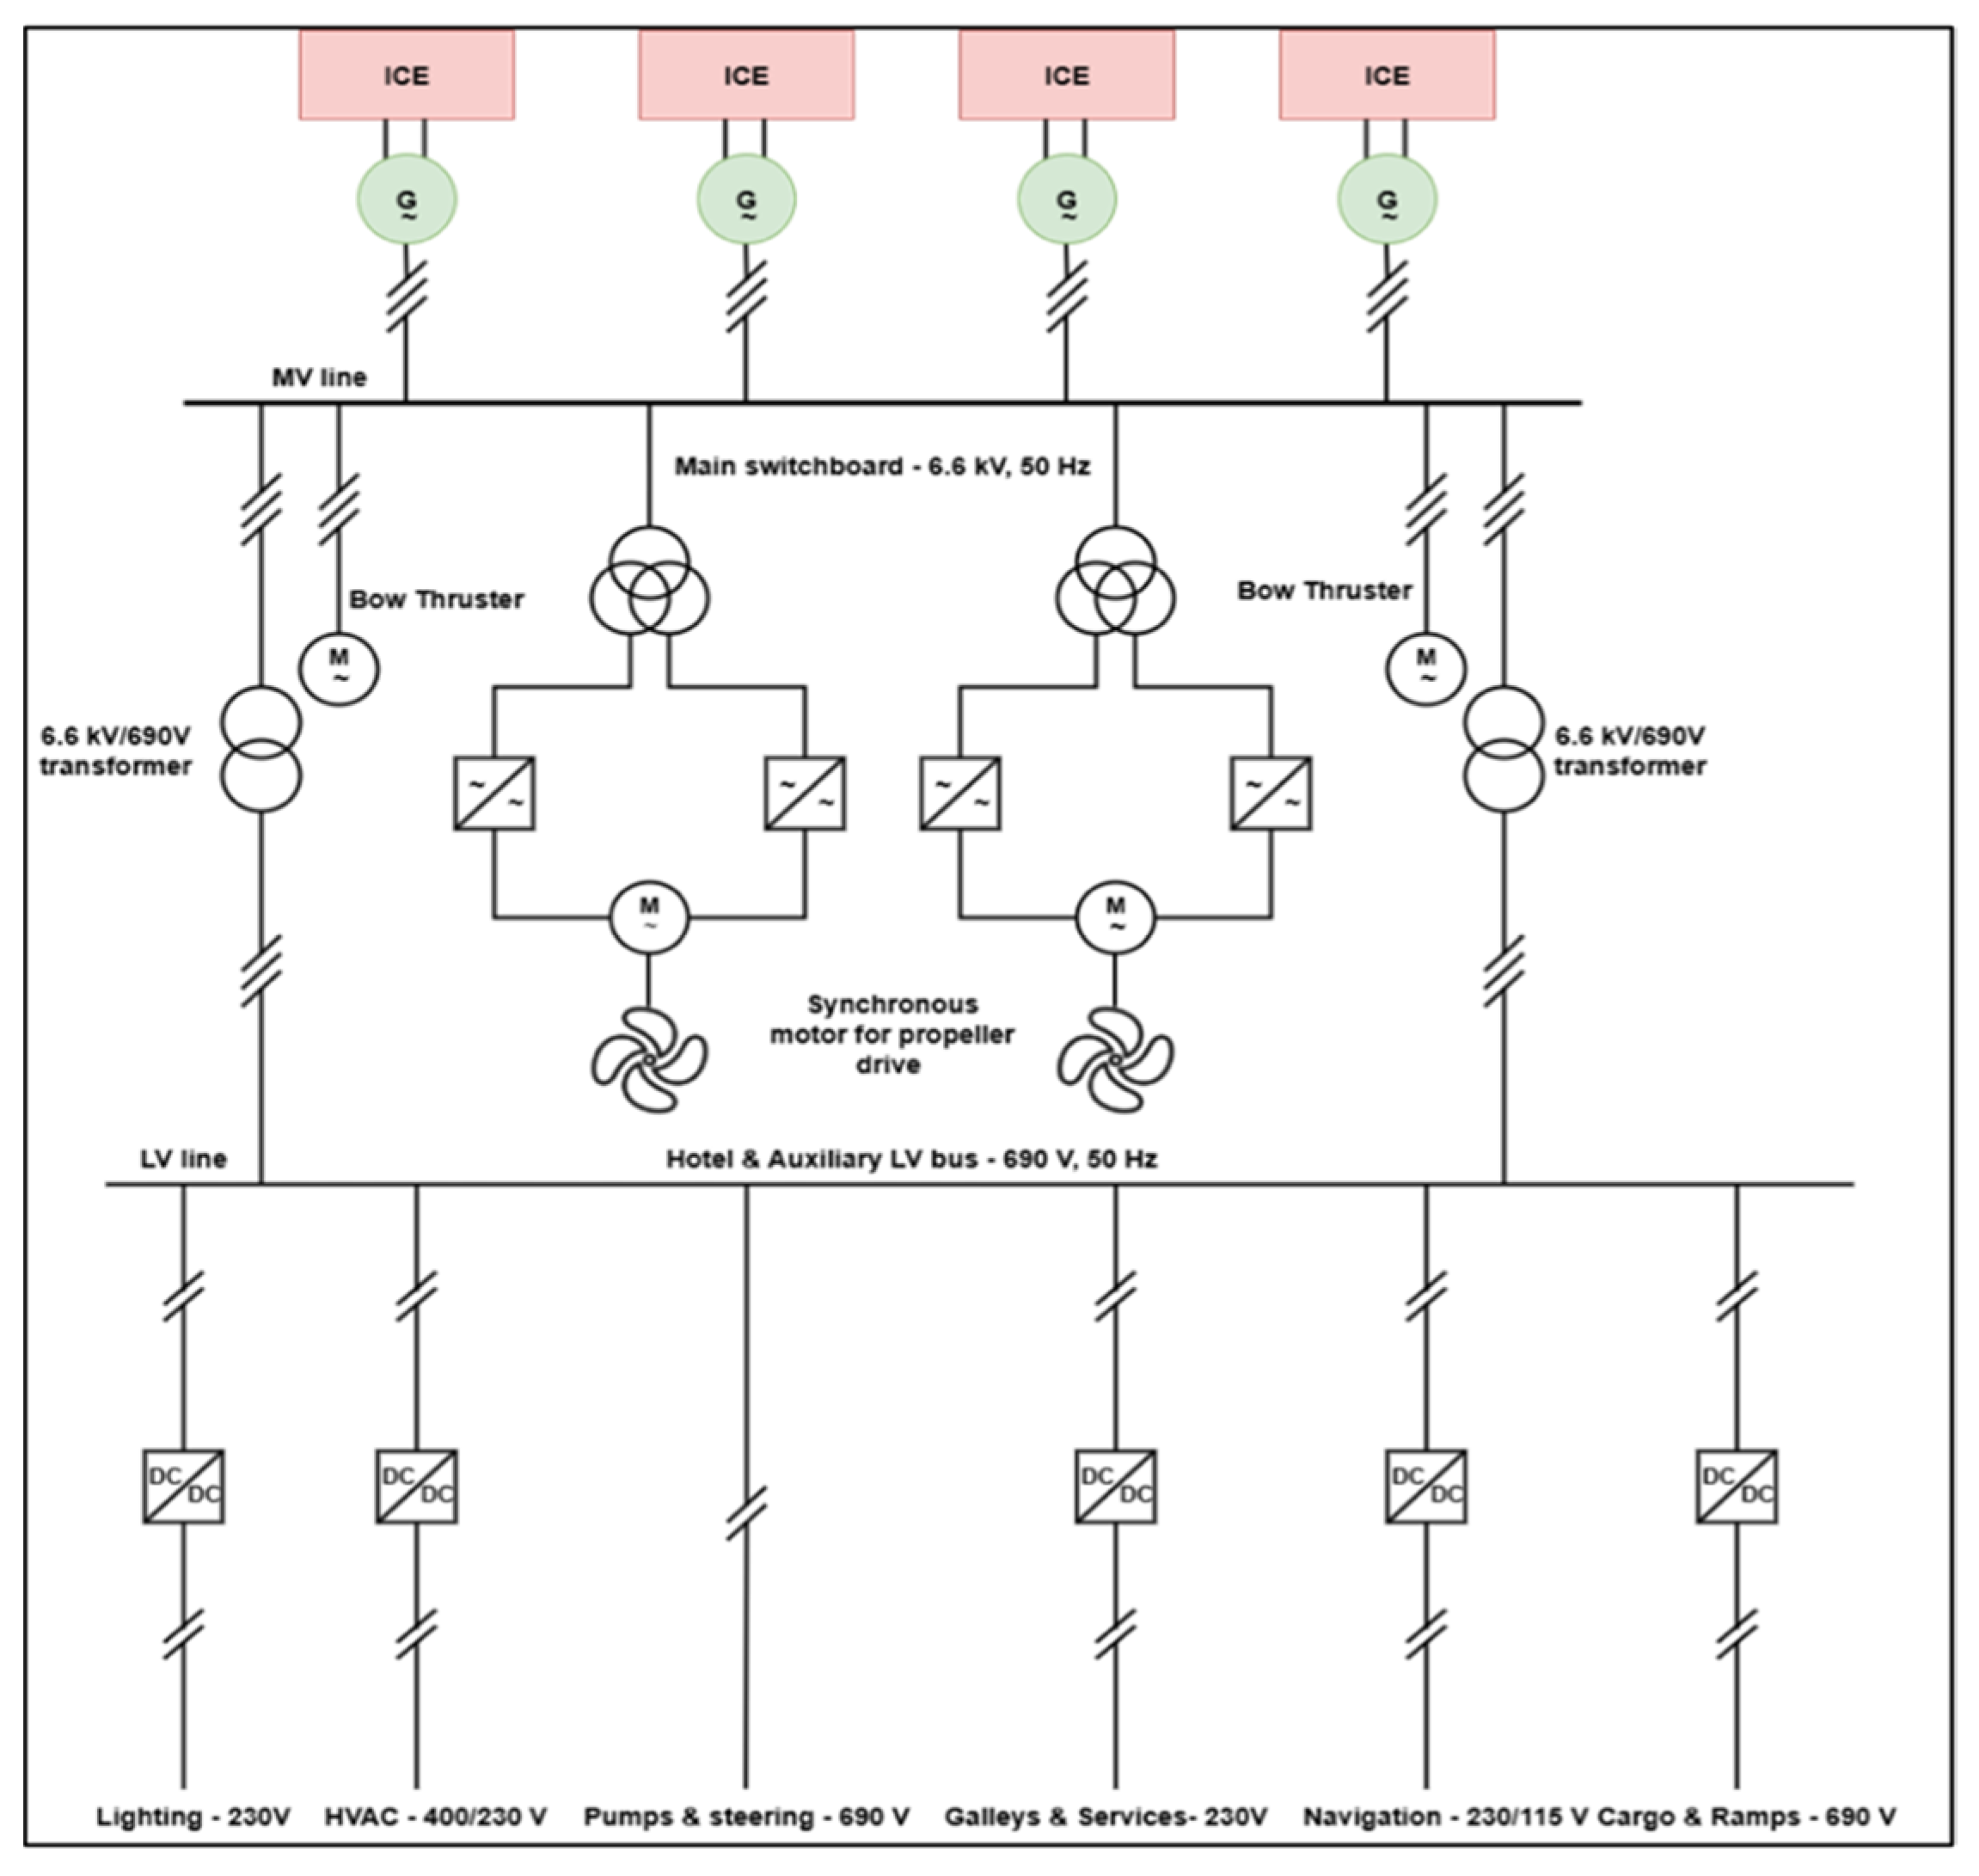
Figure 2 represents the powertrain arrangement.
Power Generation and Electrical Distribution
Each DEG is modelled by its measured specific fuel consumption map (g/kWh as a function of power output percentage), allowing instantaneous fuel flow to be computed from the simulated electrical load. The asynchronous generator block converts mechanical power to electrical power at the switchboard voltage level. Load management logic distributes electrical demand between generators and BESS according to the active control strategy.
Propeller thrust and torque are computed as:
where ρ = 1025 kg/m
3 is seawater density,
D is propeller diameter, n is shaft speed (rev/s), and
J = Va/(
n·D) is the advance ratio with
Va = V(1 −
w) corrected for wake fraction w.
KT(
J) and
KQ(
J) are tabulated from open-water propeller tests and queried at runtime.
BESS Model Integration
The ECM parameterised in
Section 3 is imported into AVL Cruise M’s battery subsystem block as a lookup-table-based electrical model. The BESS is represented at the module level (cells in series–parallel configuration), with the total pack voltage,
SOC and State-of-Health (
SOH) computed at each simulation time step. A bidirectional DC/DC converter model interfaces the battery to the AC bus via an inverter, with round-trip efficiency consistent with commercial marine converters (~96%).
Net electrical power exchanged between BESS and AC bus is:
where
ηconv = 0.96 is the round-trip efficiency of the bidirectional DC/DC converter–inverter assembly.
SOC is updated at each step by Coulomb counting corrected by the EKF estimate.
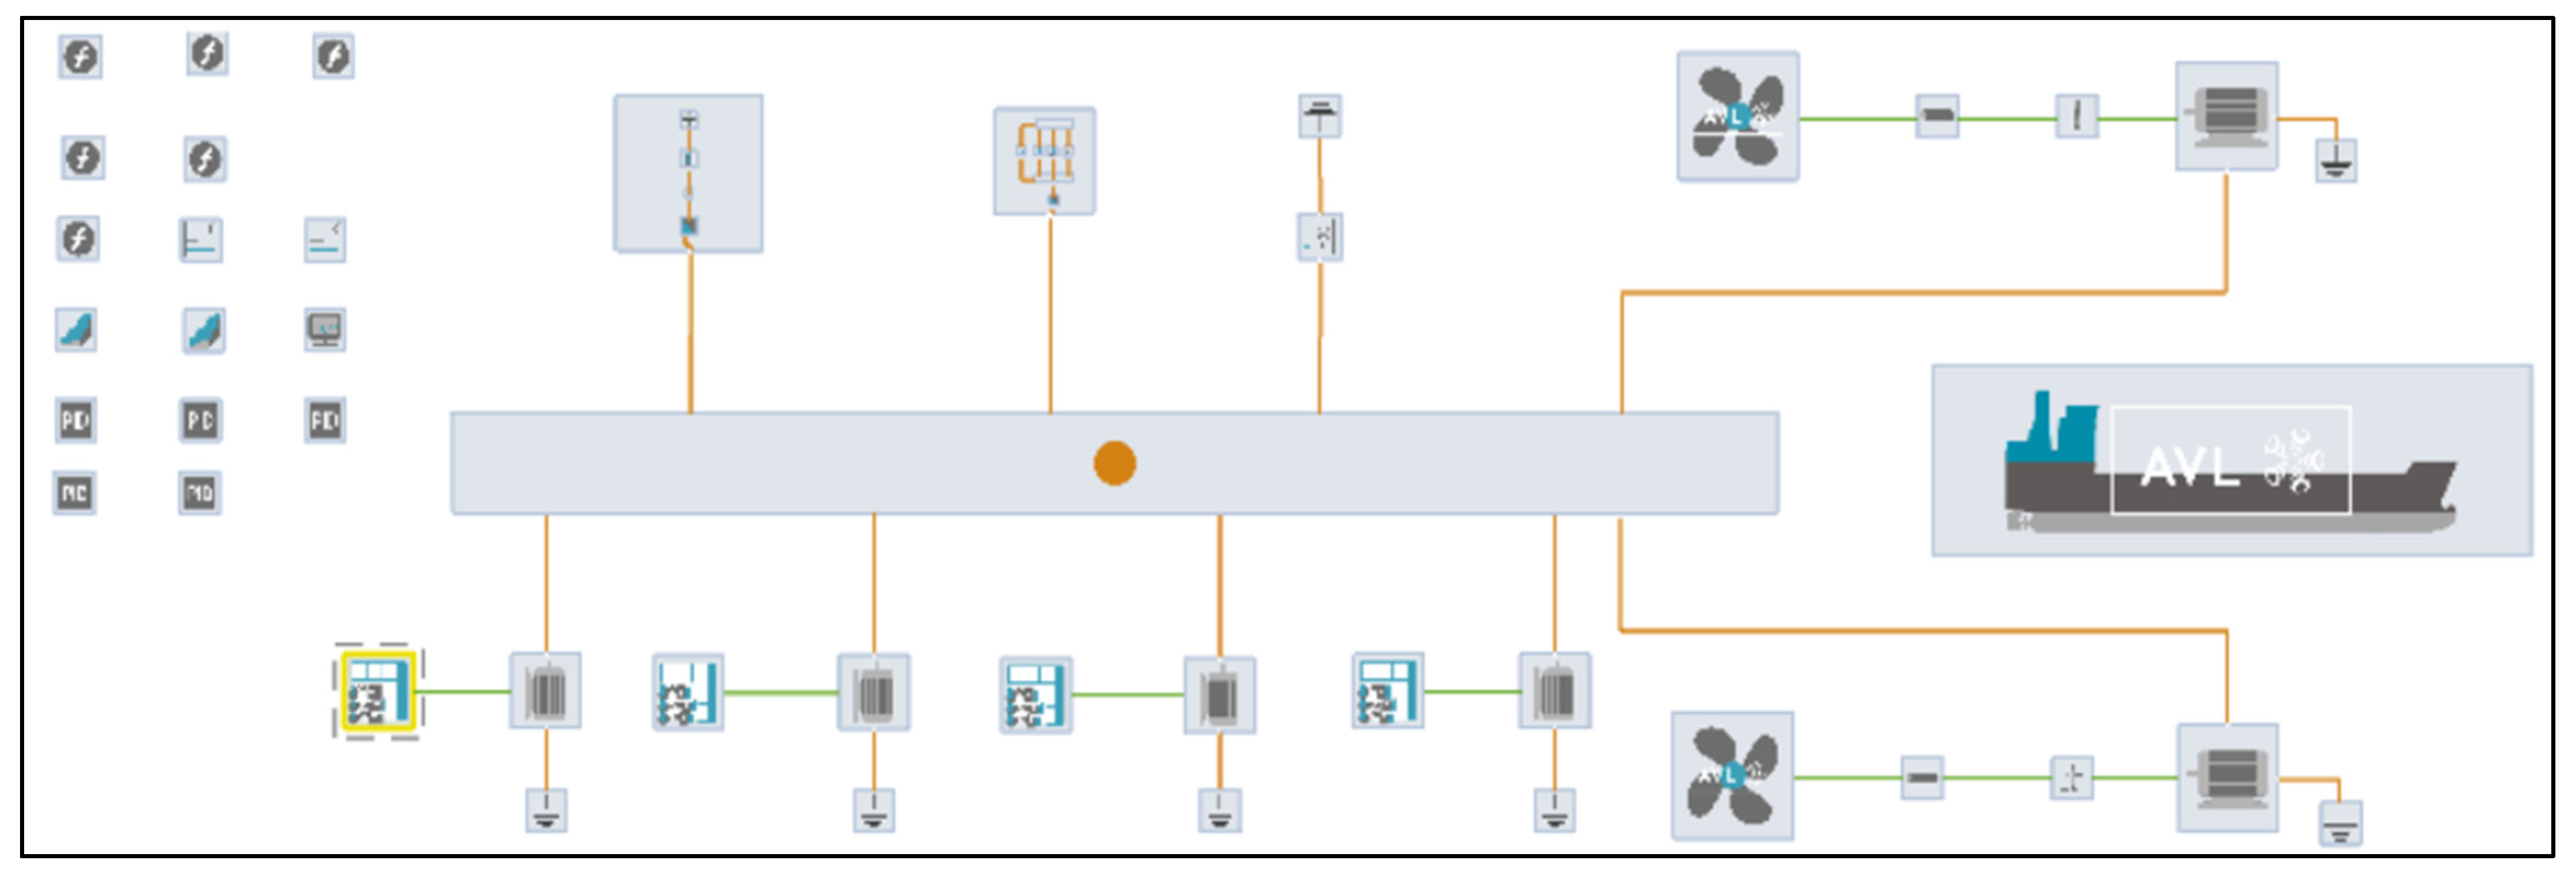
Figure 3 represents the virtual ship, as schematised in the AVL Cruise M environment. The graphical layout reproduces the conceptual powertrain architecture previously introduced in the single-line scheme of
Figure 2. Each physical component identified in
Figure 2, namely the diesel-engine generator sets, the main switchboard, the bidirectional power-electronic converters, the synchronous propulsion motors with their fixed-pitch propellers, and the low-voltage hotel and auxiliary loads, is mapped onto a corresponding simulation block. The blocks are interconnected through the central electrical bus (shown as the horizontal element at the centre of the diagram), which distributes power between the generation side, the two propulsion lines and the BESS subsystem. This block-oriented representation preserves the topology of the real vessel while exposing the signal and energy flows required for the multi-domain dynamic co-simulation, thereby providing the executable counterpart of the conceptual scheme presented in
Figure 2.
The full-vessel model was validated against the vessel’s operational logs. The simulated annual fuel consumption deviates by less than 3% from the logged value, confirming the adequacy of the model for the purposes of this study. The main sources of uncertainty are: (i) the calm-water resistance assumption, which neglects added resistance due to wave action and therefore tends to slightly overestimate fuel savings; (ii) the fixed open-water propeller efficiency curves, which do not account for wake fraction corrections and introduce an uncertainty of approximately 2–3% on propulsive power; (iii) the absence of a sea-state correction, which is considered acceptable given that the Gulf of Naples presents predominantly calm conditions and that service is suspended during prohibitive weather; (iv) the engine map use that does not fully reproduces the powertrain performance in transitory regimes. As a consequence, the fuel savings estimated for both strategies represent a conservative lower bound of the average annual benefit under real operating conditions.
5. BESS Sizing Criteria, Energy Management Strategies, and Economic Assessment Framework
The here developed sizing methodology is deliberately multidisciplinary: it couples electrochemical degradation models from battery science, energy balance equations from marine engineering and discounted cash flow analysis from financial economics into a single optimisation loop.
BESS Sizing Criteria
The BESS energy capacity is sized to cover the full hotel load during one complete port stay (mooring and docking operations), with a minimum safety margin of 20% SOC retained at the end of discharge. The hotel load profile-comprising HVAC, galley, navigation electronics, lighting, and auxiliary pumps-was characterized from the vessel’s electrical log data and is summarized by a peak demand of approximately 250 kW and an average demand of ~180 kW during berthing. The resulting minimum required energy capacity was determined as the product of average hotel power and the maximum port dwell time observed in the vessel’s yearly operating schedule.
A MATLAB multi-objective optimisation was applied to select the optimal (Ns × Np) arrangement. The decision variables are Ns and Np (both integer-valued); the objectives are to maximise Epack = Ns · Np · Ecell and minimise Mpack = Ns · Np · mcell, subject to: Apack ≤ Aavailable, Mpack ≤ ΔDWavailable, Vpack within the DC bus range, and Epack ≥ Emin. The selected configuration is the knee point of the Pareto front computed by weighted-sum scalarisation over the integer grid.
Energy Management Strategies
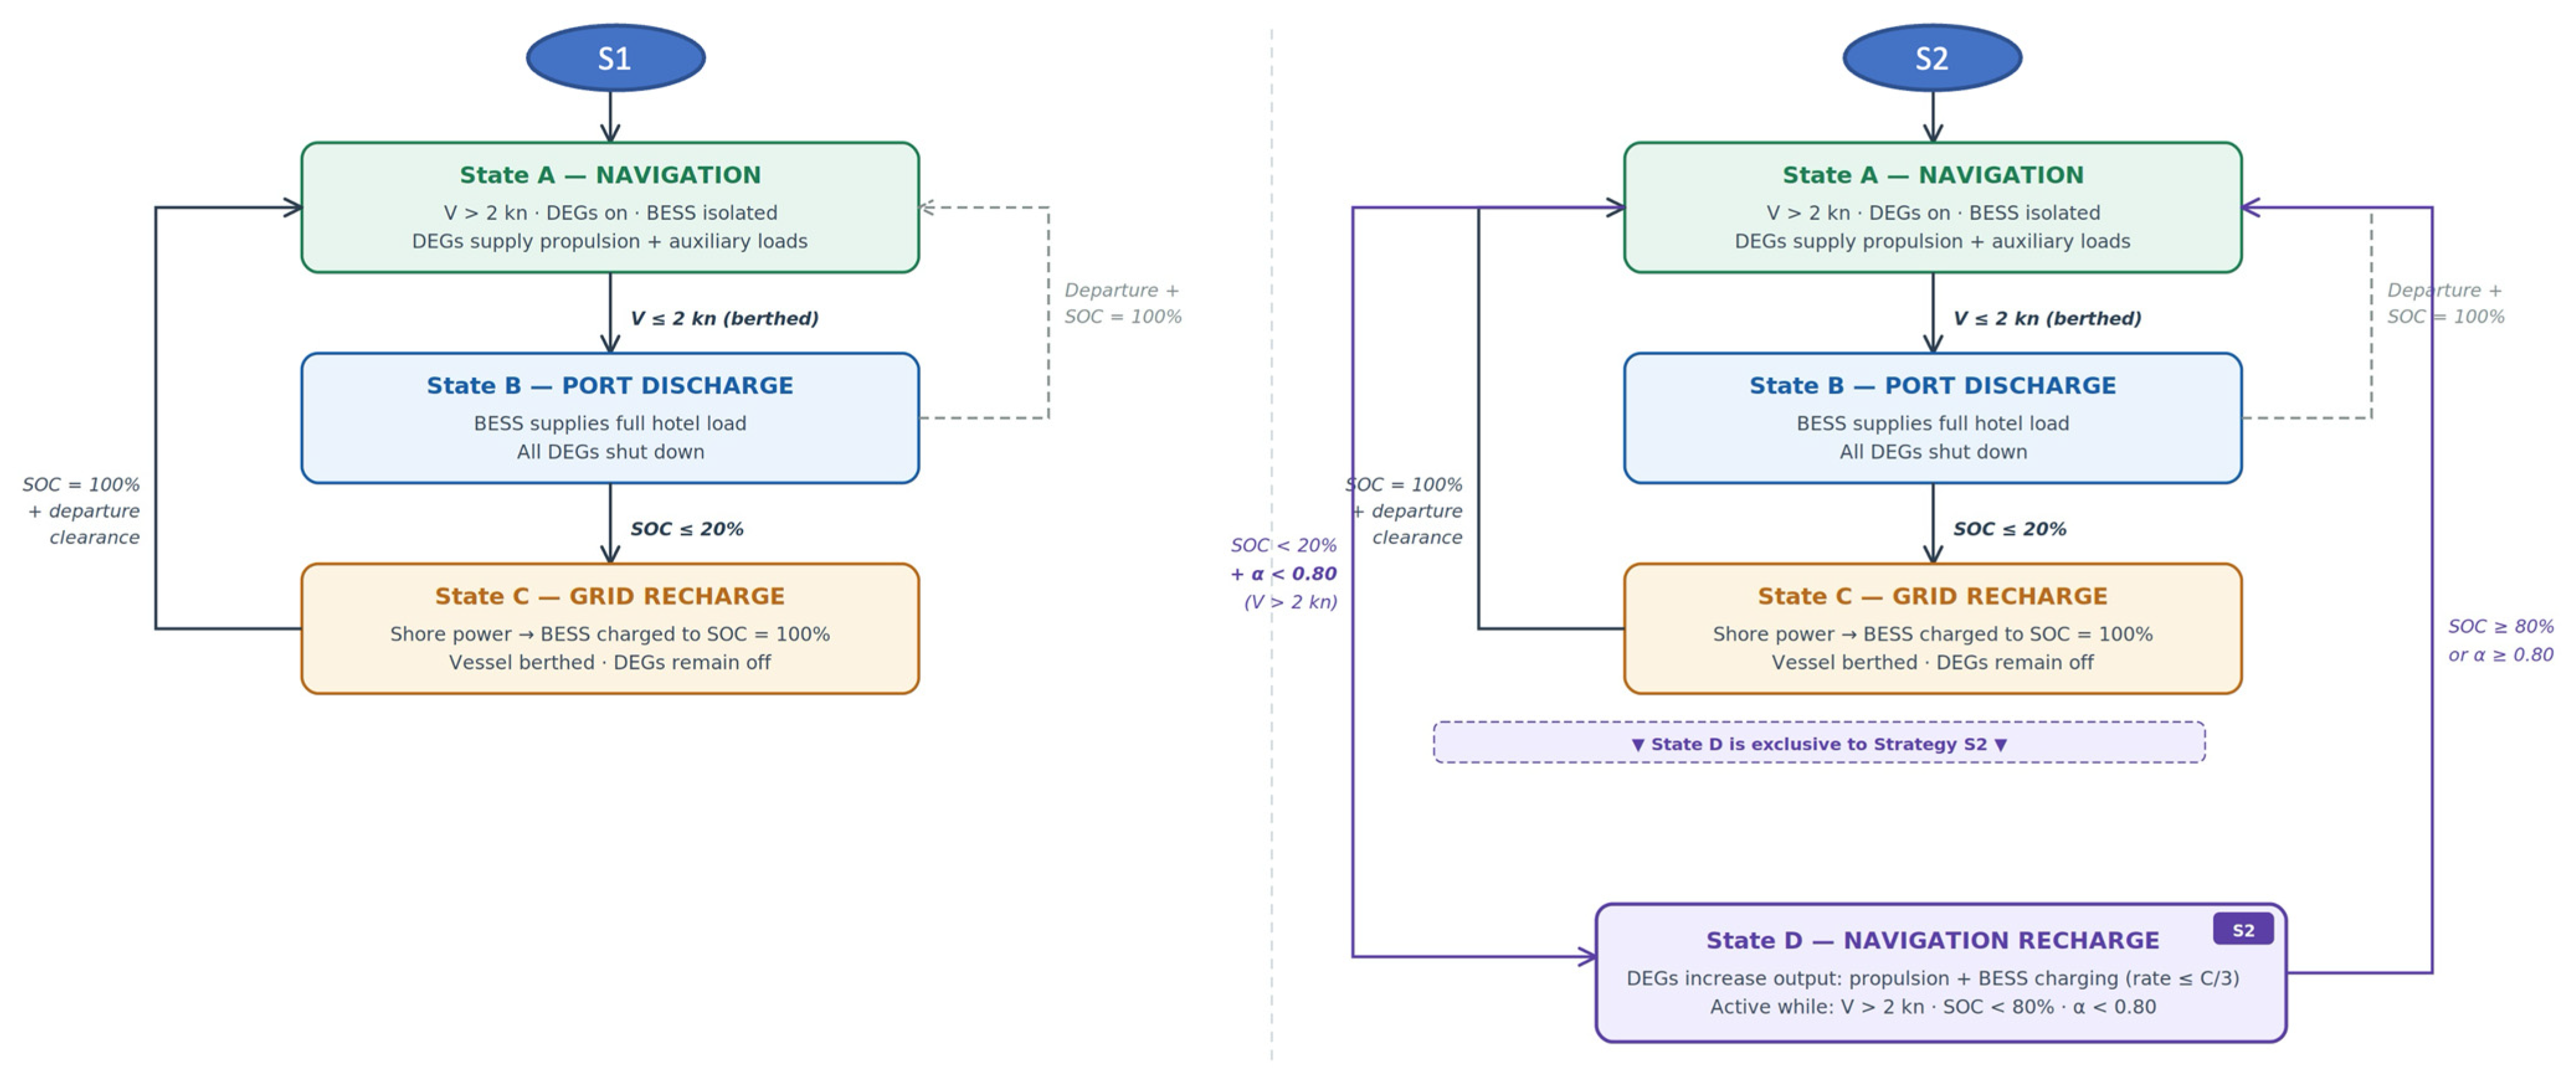
The energy management strategies are formalised as schematised in
Figure 4, as finite-state machines operating on three inputs sampled at each simulation time step: vessel speed
V (knots), BESS
SOC (%), and DEG load fraction
α = Pload/
Pinstalled.
Strategy S1: Port discharge with shore-grid recharging:
State A (NAVIGATION): V > 2 knots. DEGs supply propulsion and auxiliary loads; BESS is isolated. Transition to B: V ≤ 2 knots.
State B (PORT_DISCHARGE): V ≤ 2 knots AND SOC > 20%. BESS supplies full hotel load; all DEGs shut down. Transition to C: SOC ≤ 20%. Transition to A: departure signal AND SOC = 100%.
State C (GRID_RECHARGE): berthed AND SOC ≤ 20% or departure preparation. Shore power charges BESS to 100% SOC. Transition to A: SOC = 100% AND departur.
Strategy S2—Port discharge with in-navigation recharging:
States A, B, C identical to S1, plus:
Economic Assessment Framework
A20-year total cost of ownership (TCO) analysis was conducted, discounting all cash flows at a real discount rate of 3%. The economic model includes:
Capital expenditure (CAPEX): turnkey BESS installation cost of €1,409,760.
Operational expenditure (OPEX): fuel savings from DEG shutdown in port (both strategies) and additional fuel cost for in-navigation recharging (S2 only), computed from the simulated annual energy balance and a marine diesel price of €0.75/L.
Shore electricity cost (S1 only): estimated at €0.15/kWh for industrial port tariffs.
Battery replacement cost: €352,440 per replacement event, triggered when BESS SOH degrades below 80% of nominal capacity, as predicted by the equivalent full-cycle counting model driven by simulated annual cycling.
Key performance indicators computed: Net Present Value (NPV), Internal Rate of Return (IRR), Simple Payback Period (SPB), Profitability Index (PI).
As regards the NPV, the following formula is assumed:
where
CAPEX is the upfront capital expenditure,
CF_t is the net annual cash flow in year t (fuel savings minus shore electricity cost minus replacement expenditure, when incurred), r is the real discount rate, and T = 20 years is the analysis horizon. Future cash flows are discounted to present value using the real discount rate r, while the capital expenditure is incurred at t = 0 and is therefore not discounted.
The CO2 assessment adopted in this study is a direct (tank-to-wheel) evaluation, quantifying onboard fuel combustion emissions only, using the standard marine diesel emission factor of 3.206 kgCO2/kg fuel. Shore electricity consumption under S1 is not included in the CO2 balance, as its carbon intensity depends on the grid mix at the time of charging and evolves over the 20-year analysis horizon; attributing a fixed emission factor would introduce a time-dependent assumption outside the scope of the present work.
Battery degradation is modelled using an equivalent full-cycle (EFC) counting approach. The State-of-Health (
SOH) is decremented by 1
/Nlife for each EFC accumulated, where
Nlife is the rated cycle life at 80%
SOH for the operating Depth of Discharge (
DoD). For each mission trip, the number of equivalent full cycles is computed as:
where Δ
Ecycled is the net energy exchanged during the trip,
Epack is the nominal pack energy capacity, and
DoD is the average depth of discharge over the trip. The annual EFC count is obtained by summing
EFCtrip over all trips in the yearly operating schedule. A battery replacement event is triggered when the cumulative
SOH falls to 80% of the initial capacity. The dependence of cycle life on discharge depth follows the power-law relationship
Nlife ∝
DoD−1.5, as reported by Barone et al. [
19] for LFP cells in a comparable marine hybrid application, which implies that shallower cycling disproportionately extends battery lifetime.
Physical Feasibility Constraints
The spatial impact of the BESS was evaluated by computing the deck area occupied by BESS racks as a function of Ns × Np, and comparing it with the available garage footprint. Weight compatibility was verified against the vessel’s operational deadweight limit and Load Line Convention stability requirements, ensuring that the additional battery mass does not compromise trim, freeboard, or cargo capacity.
6. Results and Discussion
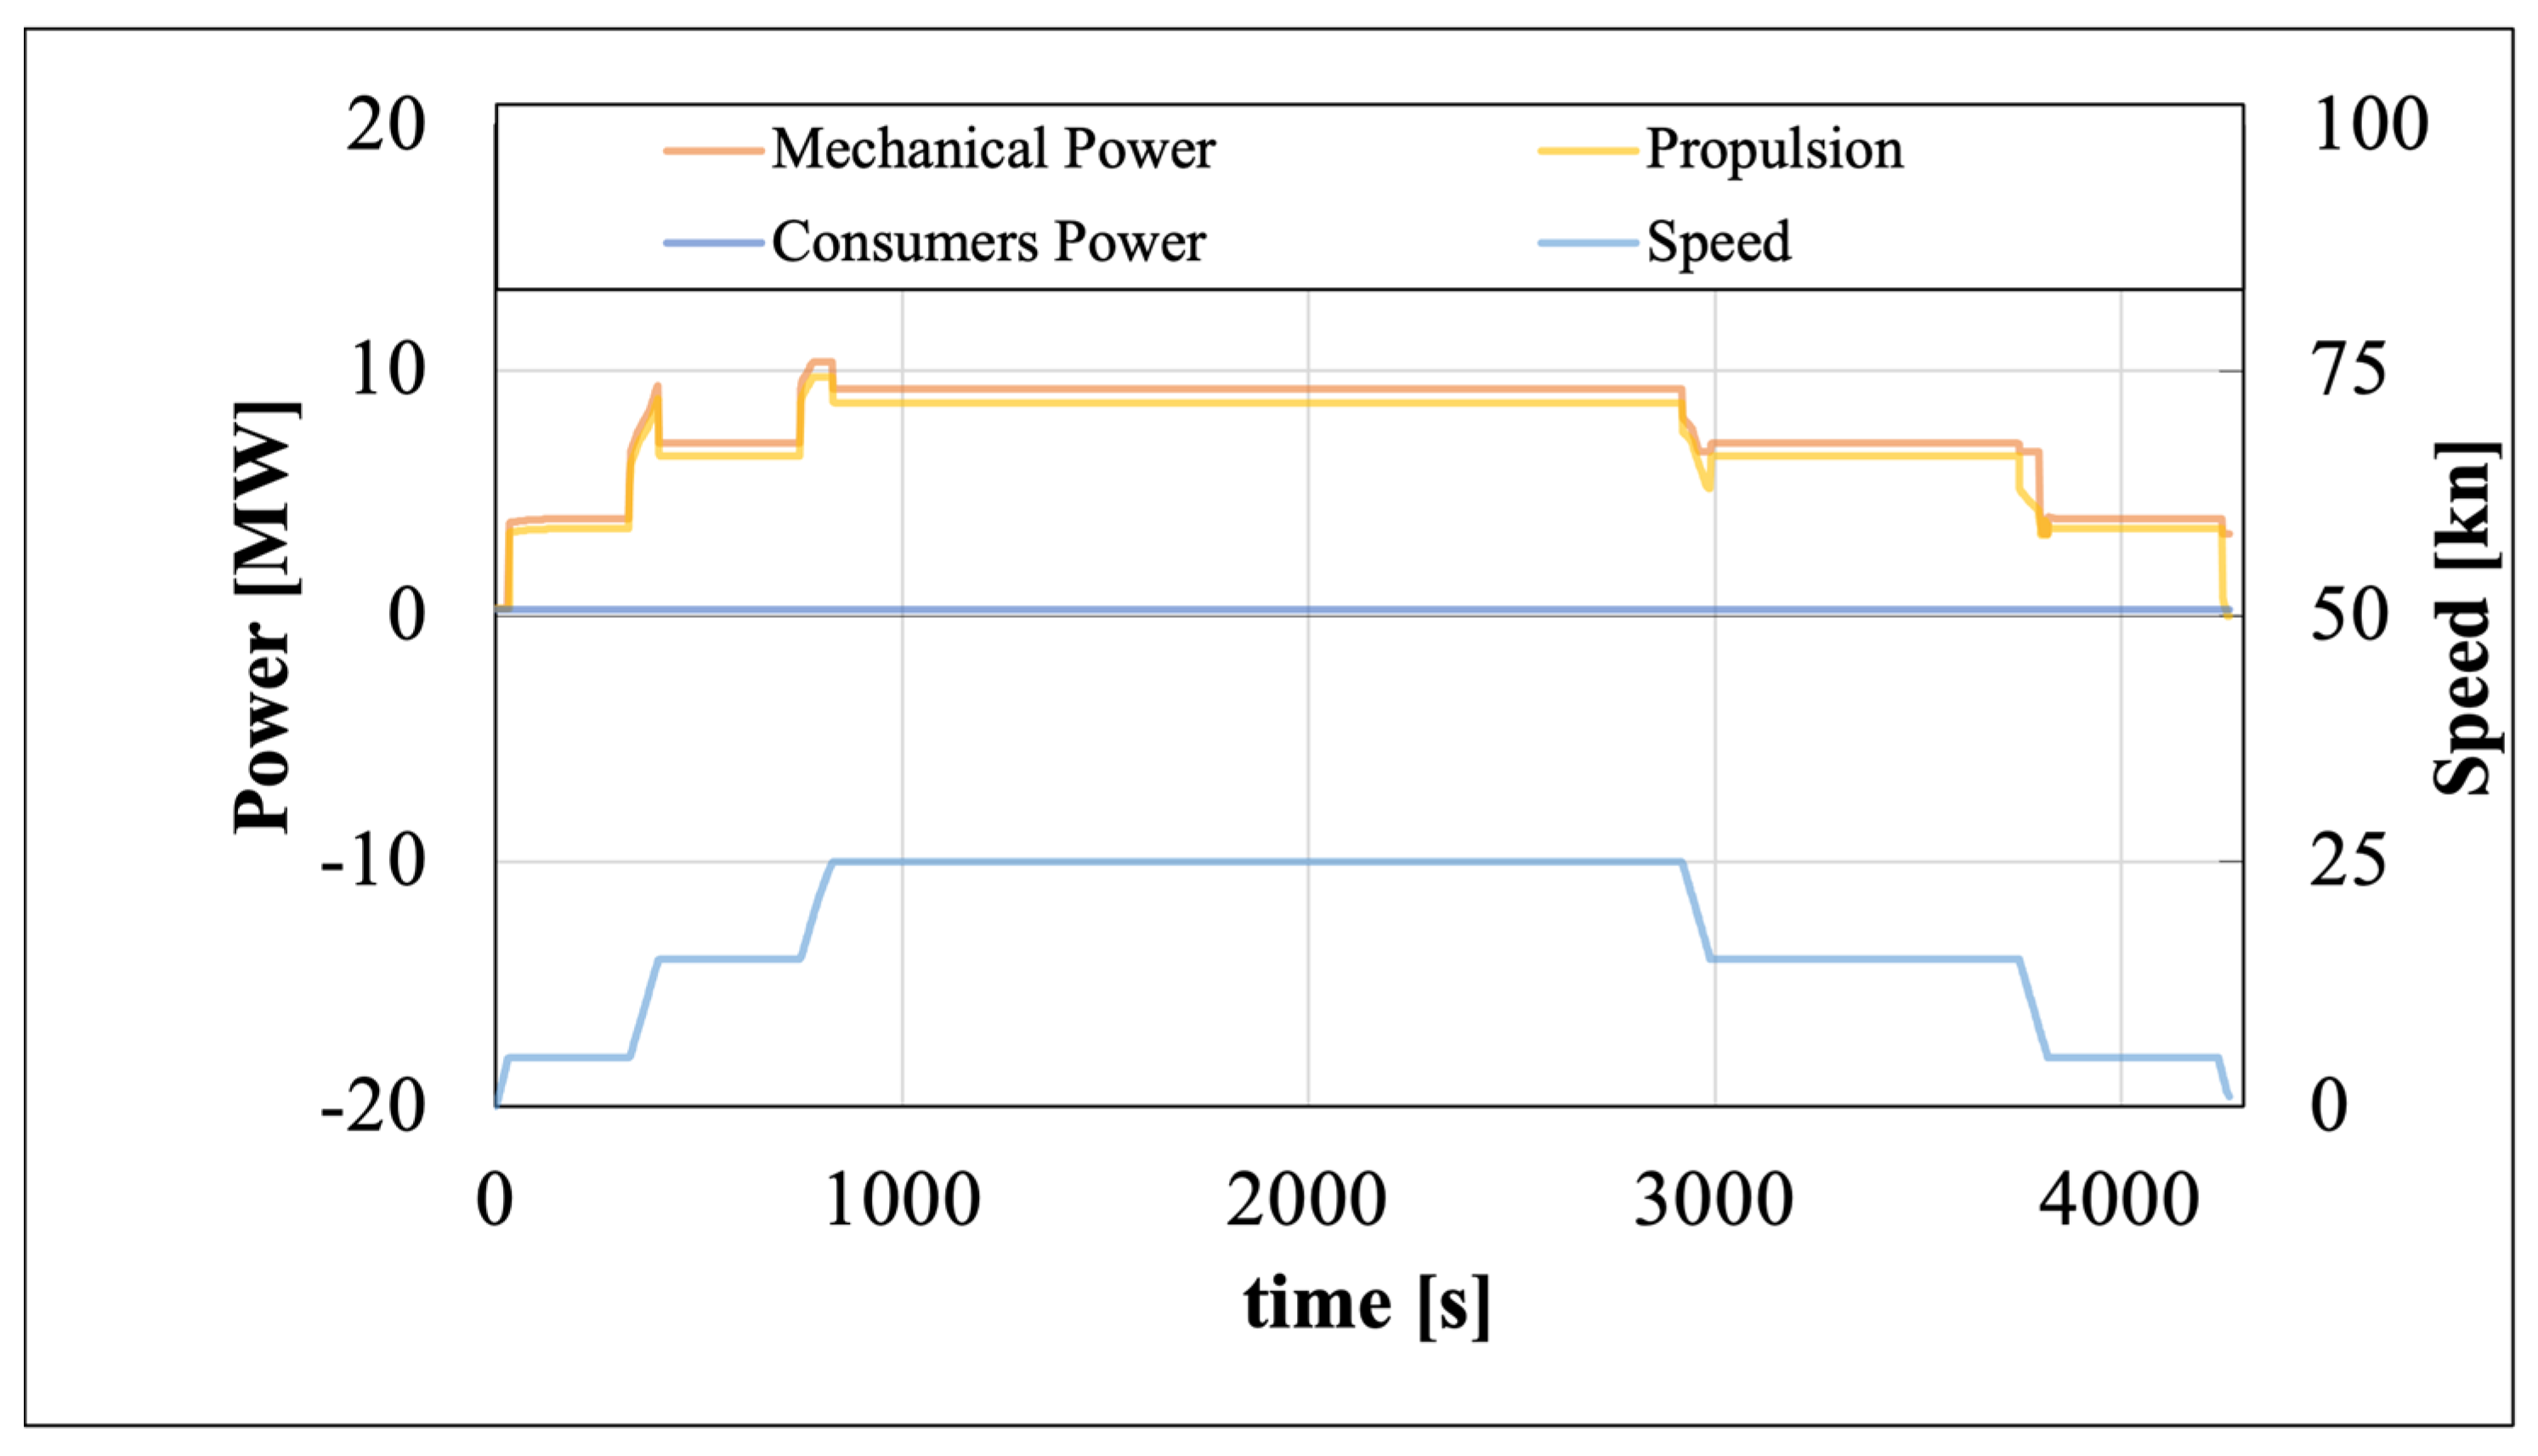
The ship’s mission consists of an itinerary of approximately 19 nautical miles (35 km), starting from the port of Naples “Molo Beverello” and arriving in the Ischia port, with a total navigation time of 1 h and 10 min, represented in
Figure 5.
The reference scenario simulation (no BESS) reproduces the vessel’s dynamic behaviour along the full Naples–Ischia round trip. During the navigation phase, all four DEGs operate at approximately 65–70% load, a point where specific fuel consumption is near-optimal but not at its minimum. During berthing, the engines continue running at low load (<30%), a highly inefficient operating regime characterised by elevated specific fuel consumption and increased NOx and particulate emissions. The total annual CO2 emissions in the reference scenario serve as the baseline for quantifying the environmental benefit of BESS integration.
Under S1, the BESS fully covers hotel load during berthing, allowing all DEGs to be shut down. The simulated battery
SOC profile shows a discharge from 100% to approximately 30% during each port stay, corresponding to a
DoD of ~70%. Grid recharging restores full capacity before each departure. This strategy achieves a 17% annual reduction in CO
2 emissions relative to the baseline-the highest environmental performance of the two strategies-because no additional onboard fuel is combusted for recharging. This figure refers to direct onboard emissions only. A well-to-wheel comparison between S1 and S2 that accounts for the carbon intensity of shore electricity would require a time-resolved grid decarbonisation scenario and is outside the scope of this study; it is identified as a direction for future work. The annual environmental and energy indicators are reported in
Table 4. S2 supplements the port discharge phase with controlled in-navigation recharging when
SOC < 20%. This maintains the BESS within a shallower cycling window (average
DoD ~40%), significantly extending the equivalent life of the battery. The additional fuel consumed for recharging reduces the direct CO
2 benefit to 11.2% per year. However, the improved generator loading profile during the recharging phase partially offsets this penalty, and the avoided grid electricity cost combined with fewer battery replacement events produces a superior economic outcome across the 20-year horizon.
Results of the calculations are shown in
Figure 5 for the reference scenario. The simulation provides valuable insights into the vessel’s dynamic behaviour. The total mechanical power produced by the DEGs is almost entirely used to meet the propulsion demand, apart from the conversion losses occurring at the generator, which represent a relatively small fraction of the total primary energy consumption.
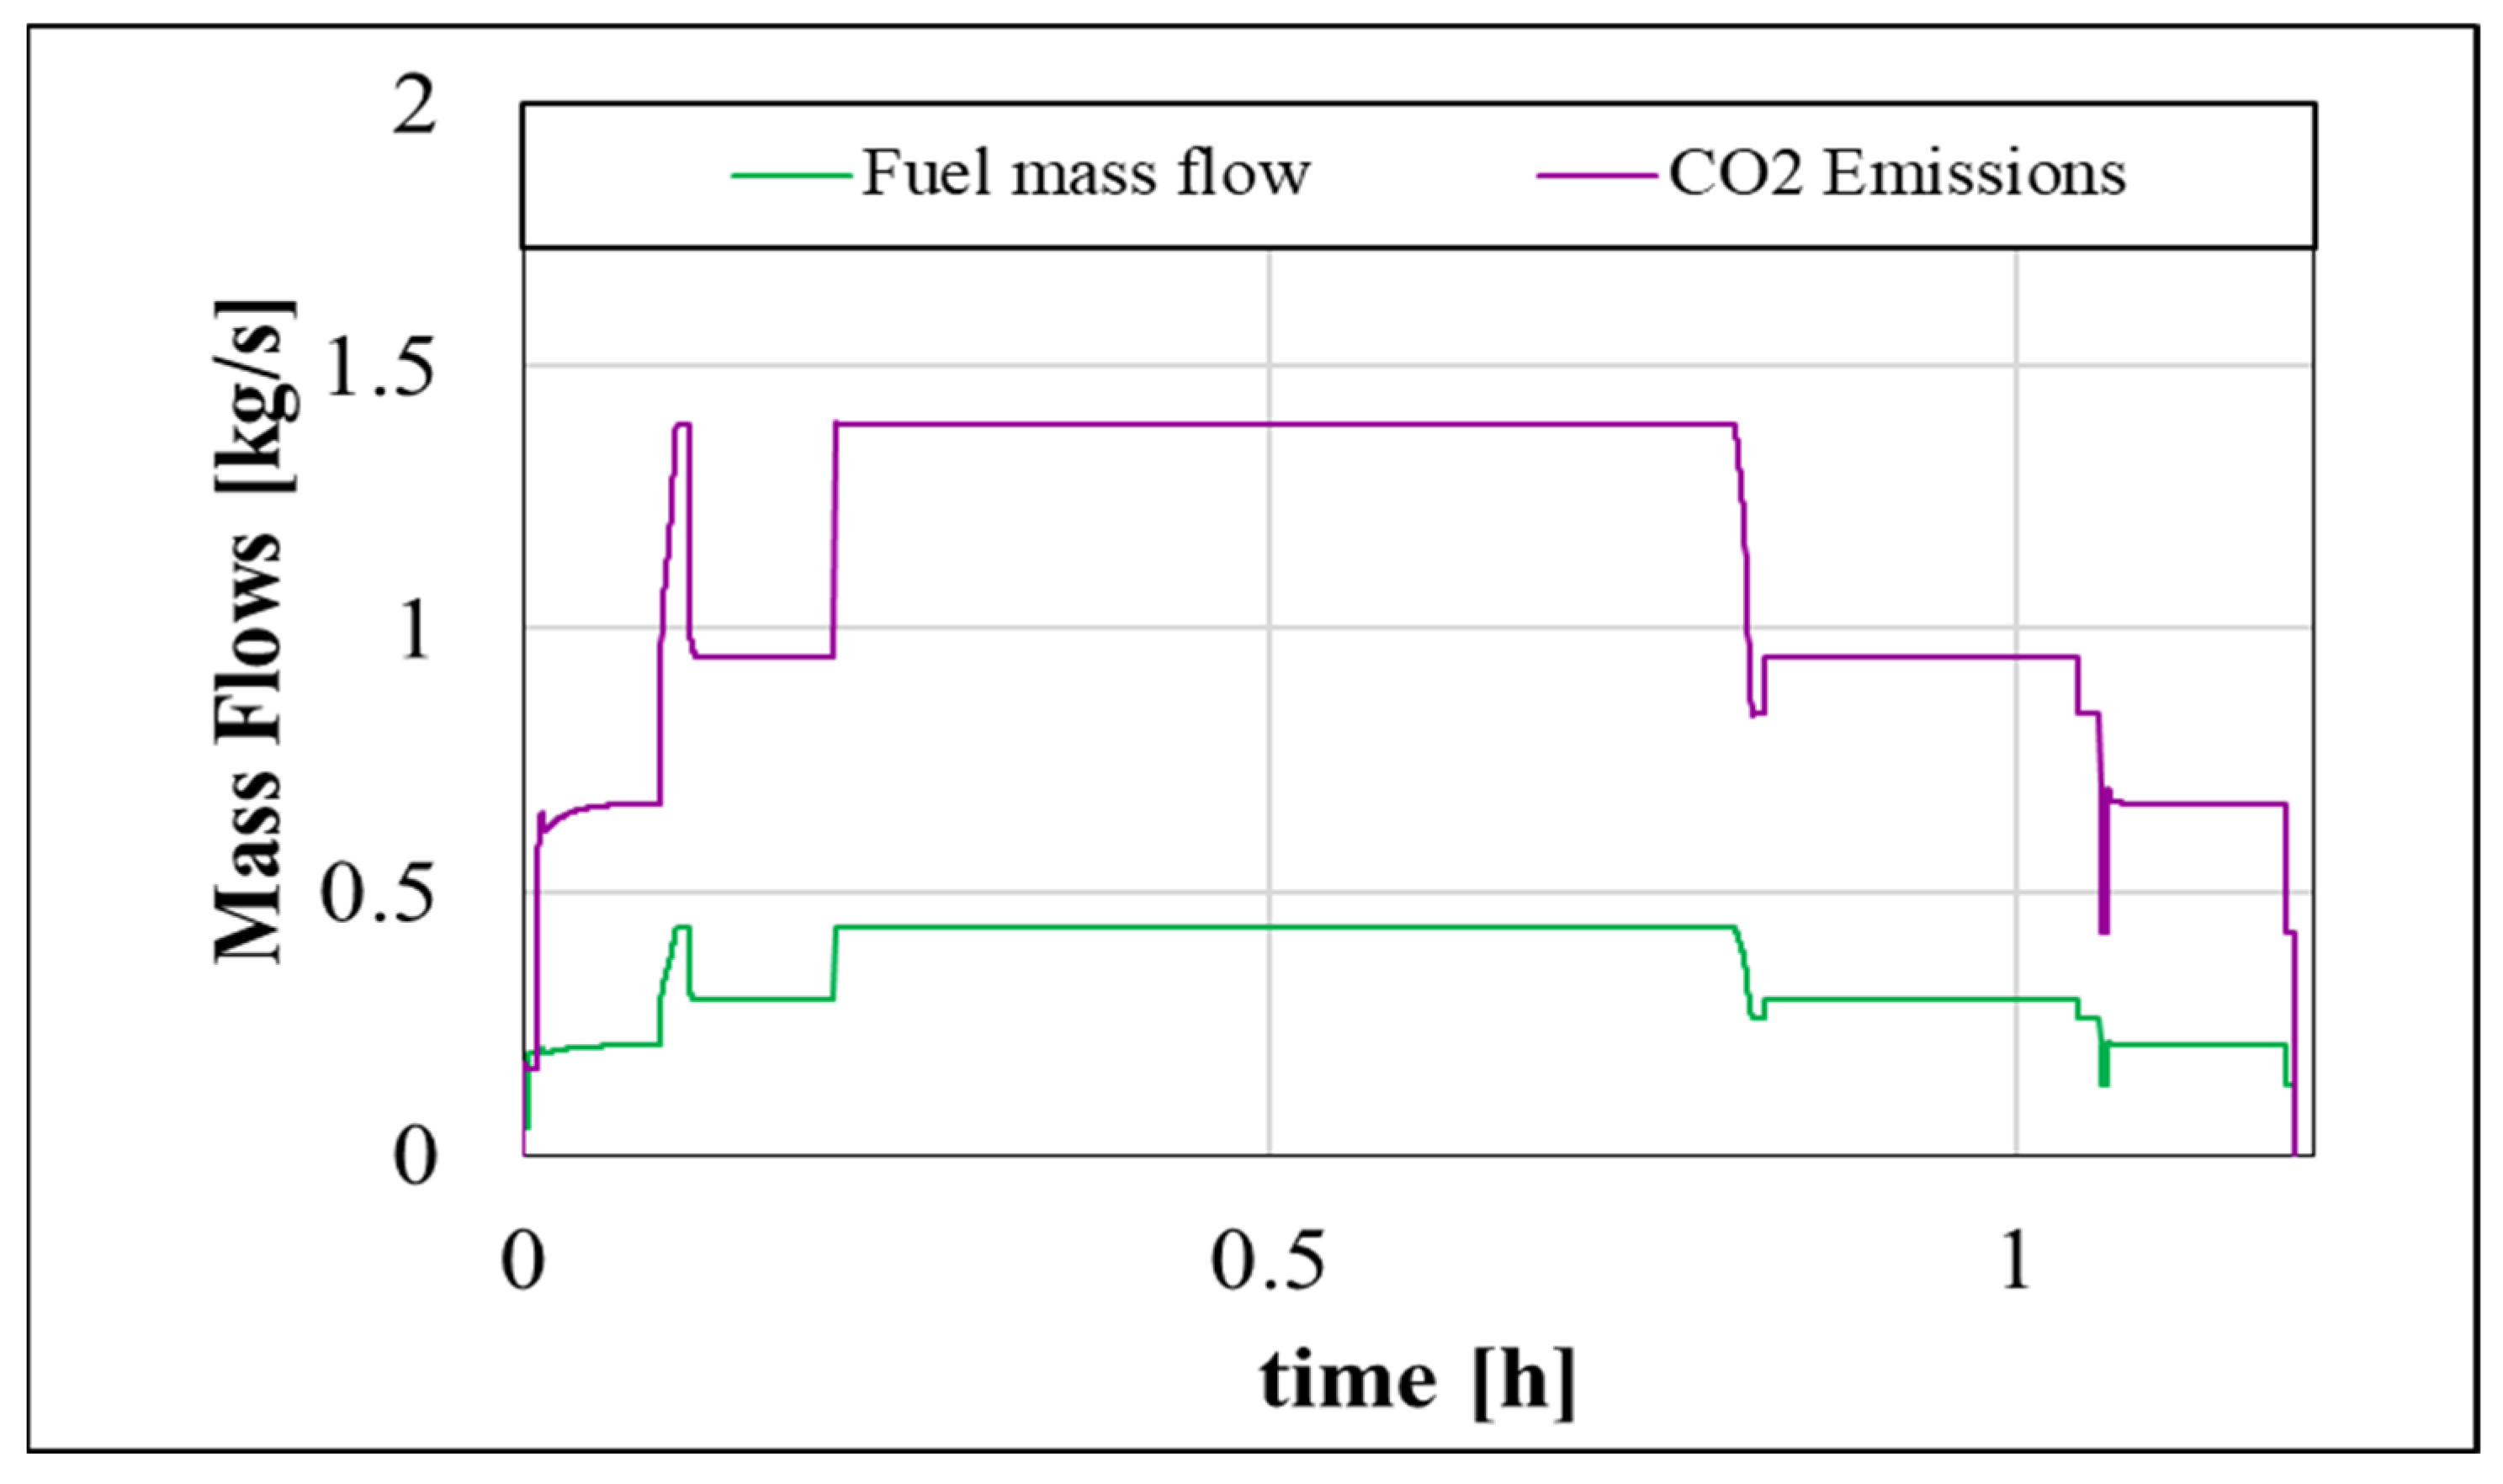
Following the dynamic simulation of the reference case, energy flows were coupled with the mission profile, allowing for a detailed mapping of the associated CO
2 emissions over time (expressed in hours), as in
Figure 6.
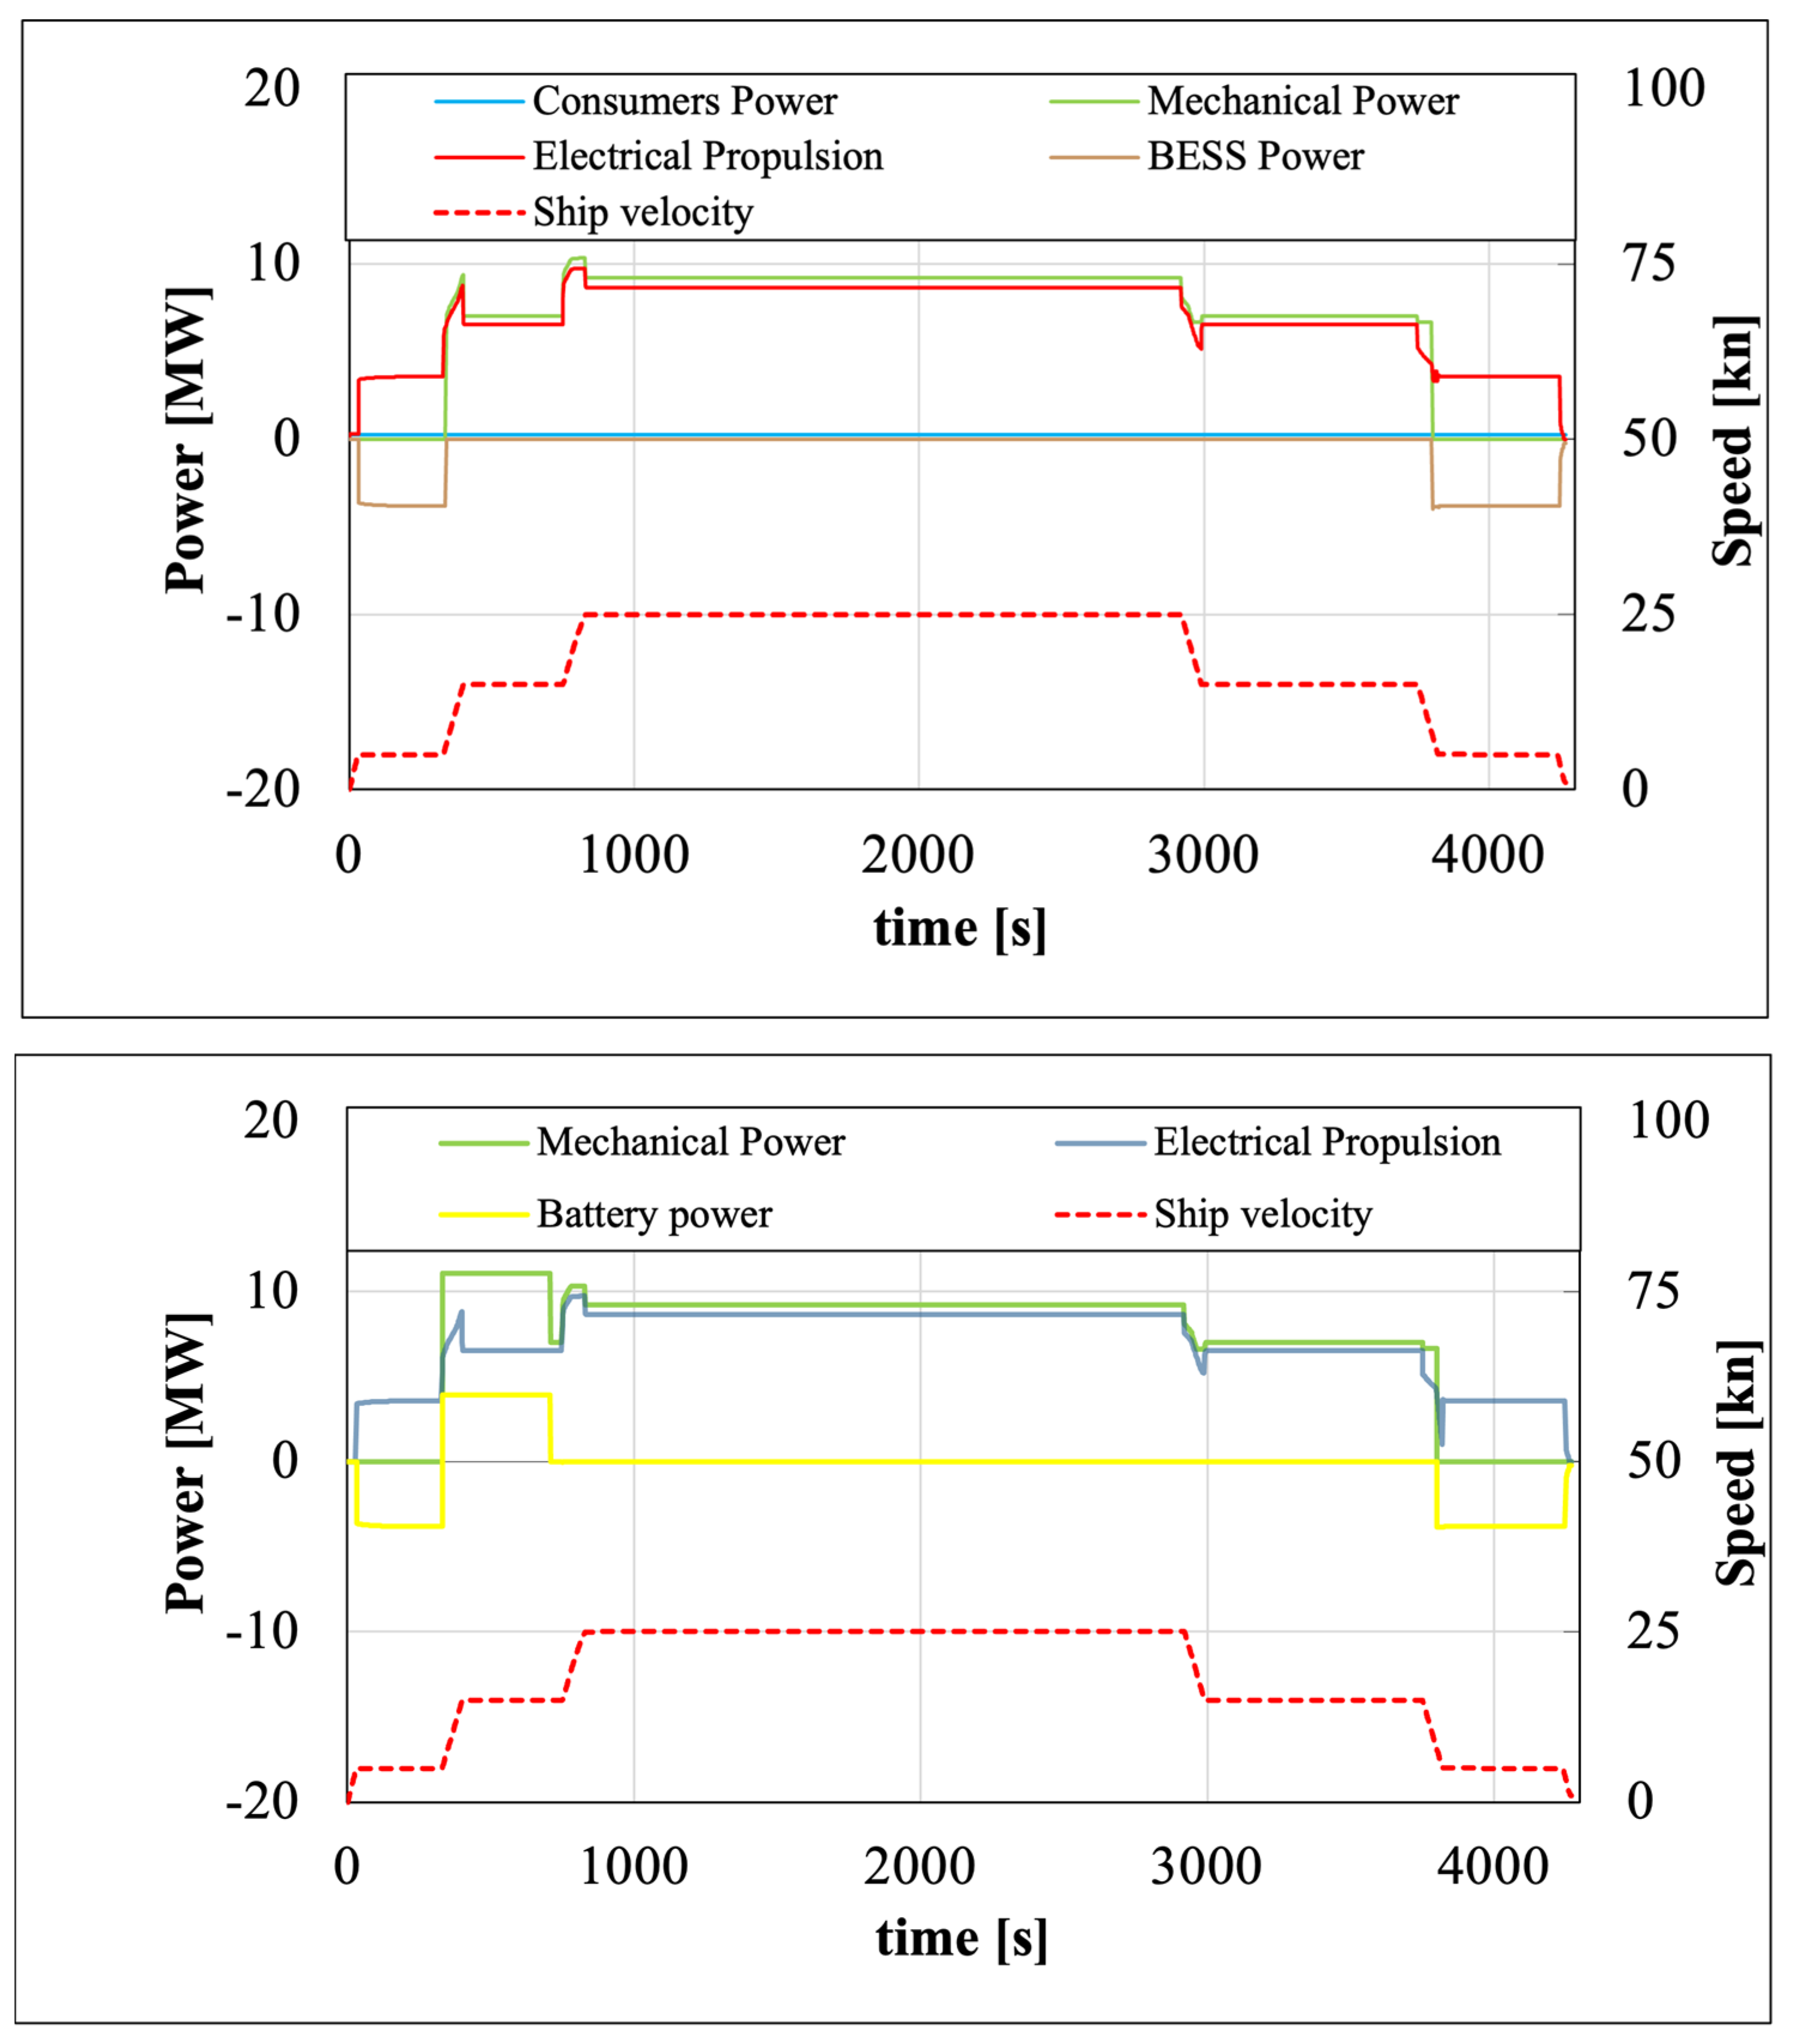
Figure 7, on the other hand, represents the calculations performed under Strategies 1 and 2.
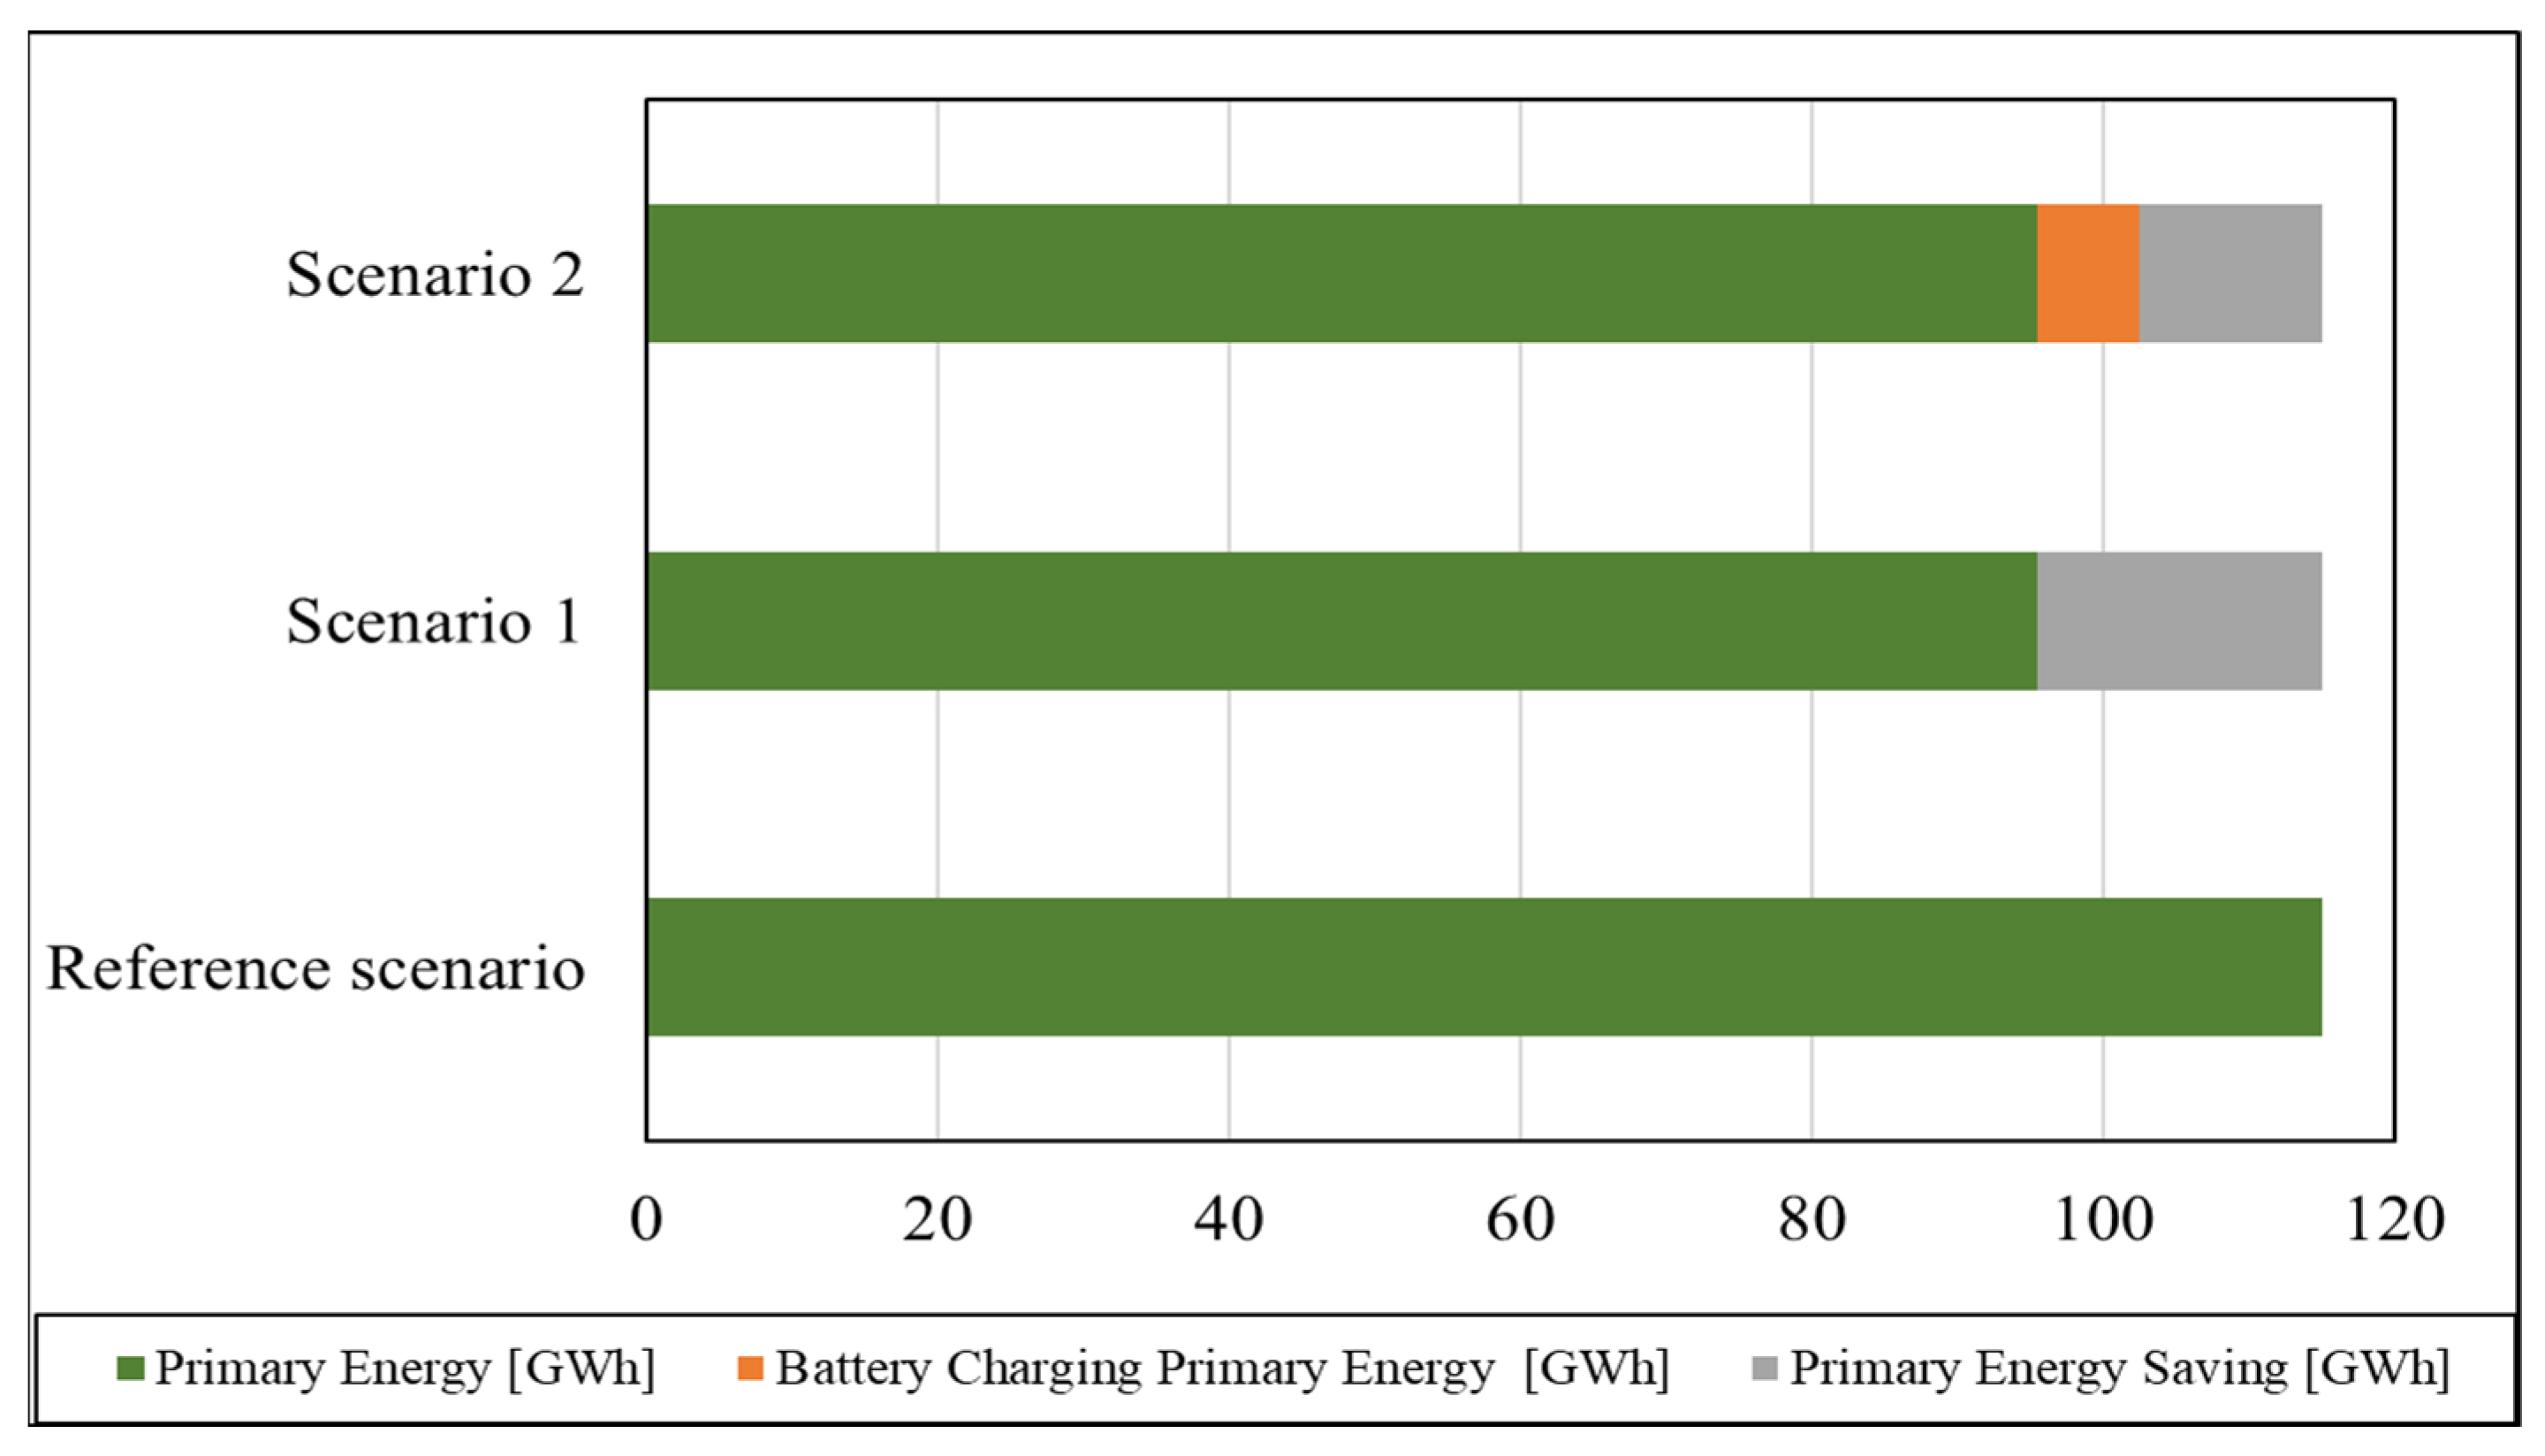
Figure 8 finally compares the primary energy demand across the reference scenario, Scenario 1, and Scenario 2. The reference scenario shows the highest primary energy consumption, set as the baseline (100%).
Strategy 1 achieves an approximate 17% reduction in primary energy demand, as represented by the green and grey segments combined, while Strategy 2 results in a slightly lower overall reduction of about 5.8%, due to the additional battery charging energy demand shown in orange. Nevertheless, Strategy 2 still yields a 11.2% net primary energy saving compared to the reference case. Other KPI are represented in
Table 5.
The equivalent full-cycle model, driven by the simulated annual SOC excursion profiles, predicts that S1 accumulates the equivalent of approximately 365 full cycles per year (corresponding to DoD ~70%), reducing battery SOH to 80% in approximately 24 months and requiring ~9 replacement events over the 20-year horizon. Under S2, the shallower DoD (~40%) reduces the equivalent annual cycling to approximately 240 full cycles, extending the replacement interval to ~36 months and reducing total replacements to ~6. The cumulative replacement expenditure over 20 years is therefore €3,171,960 for S1 and €2,114,640 for S2, a saving of over €1 million attributable to the milder cycling regime of S2.
The replacement intervals are consistent with the cycle-life behaviour of LFP cells documented by Barone et al. [
19] for a hybrid marine application directly comparable to the present case study, in which deeper cycling (higher
DoD) results in accelerated capacity fade and shorter replacement intervals.
Table 6 reports the 20-year financial indicators for both strategies. The
SPB of S1 (4.64 years) and S2 (3.72 years) both fall comfortably within the vessel’s remaining service life, confirming the economic viability of BESS integration under either management approach. The superior
NPV and
IRR of S2 reflect the combined effect of higher annual net savings (after grid electricity cost subtraction) and lower lifetime replacement expenditure. Both strategies yield Profitability Indices significantly above 1.0, indicating that the present value of benefits substantially exceeds the initial investment.
The economic superiority of S2 over S1 is not immediately obvious from the raw CO
2 figures and deserves closer examination. The key driver is the nonlinear relationship between
DoD and LiFePO
4 cycle life: at
DoD ~70% (S1), the cell chemistry undergoes approximately 365 equivalent full cycles per year, whereas at
DoD ~40% (S2), this figure drops to ~240—a reduction of ~34%. Since LFP cycle life scales roughly as
DoD−1.5 in the mid-range [
19], the switch from 70% to 40%
DoD effectively extends calendar replacement intervals from ~24 to ~36 months, eliminating three full replacement events over the 20-year horizon and saving over €1 million in
CAPEX alone.
To make this comparison explicit: under S1, the battery is assumed to operate between 20% and 90% SOC, resulting in an average DoD of approximately 70% and approximately 365 equivalent full cycles per year, with a replacement interval of approximately 24 months. Under S2, the controlled in-navigation recharging keeps the SOC window between 20% and 60%, reducing the average DoD to approximately 40% and the annual equivalent full cycles to approximately 240, which extends the replacement interval to approximately 36 months. The net effect over the 20-year horizon is a reduction from ~9 to ~6 replacement events. Although S2 accumulates a higher number of individual charge/discharge events, the nonlinear DoD-cycle life relationship (Nlife ∝ DoD−1.5) means that the shallower cycling depth more than compensates, resulting in a longer effective battery lifetime despite the more frequent but shallower cycling.
This dynamic explains why the strategy that burns more fuel (S2 recharges at sea) nonetheless delivers a higher NPV: the avoided battery replacement cost outweighs the additional fuel expenditure at any plausible diesel price above ~€0.55/L.
Sensitivity Analysis
The base-case results are clearly sensitive to two market parameters: marine diesel price and shore electricity tariff. A parametric sensitivity analysis was conducted over a grid of diesel prices (€0.55, 0.65, 0.75, 0.85, 1.00/L) and shore electricity tariffs (€0.10, 0.15, 0.20, 0.25/kWh), spanning the 2019–2024 Mediterranean bunker market range and plausible EU ETS-driven electricity price escalation scenarios, respectively. For Strategy S2, which does not rely on shore electricity, the SPB ranges from 3.0 years (diesel €1.00/L) to 5.1 years (diesel €0.55/L), and the 20-year NPV remains positive in all cases (approximately €3.2 M to €7.8 M). The robustness of S2 derives from its lower battery replacement burden, which provides a cost advantage independent of fuel price. For Strategy S1, the SPB is more sensitive to both parameters: it ranges from 3.5 years (diesel €1.00/L, electricity €0.10/kWh) to 7.8 years (diesel €0.55/L, electricity €0.25/kWh). S1 becomes marginally uneconomic only at the combined low-diesel, high-electricity extreme. Under all other parameter combinations, both strategies yield a positive 20-year NPV, confirming the robustness of the BESS investment.
These findings are broadly consistent with published experience on commercial marine BESS installations. Bei et al. [
25] and Qazi et al. [
26] both report that real-world LFP systems frequently operate at low equivalent full cycles-often below 200/year-precisely because operators empirically narrow their SOC window to preserve battery life, at the cost of underutilising installed capacity. The S2 strategy formalises this operational intuition into a controlled dispatch logic, capturing the economic benefit without sacrificing the zero-emission port call that S1 provides.
The economic performance of the present study can be further contextualised against the lifecycle cost analysis conducted by Bei et al. [
25], who evaluated five different short-to-medium-range electric vessel types operating in Chinese inland waterway and nearshore scenarios. Their analysis reports simple payback periods ranging from 5 to 14 years, depending on vessel type and operational profile. The payback periods obtained in the present study-3.72 years for S2 and 4.64 years for S1-compare favourably with even the most economically advantageous cases in that study, a result attributable to the combination of higher marine diesel prices in the Mediterranean market, the intensive daily operational profile of the Naples–Ischia route, and the deliberate optimisation of the battery cycling regime. Furthermore, Bei et al. note that the greenhouse gas emission reduction potential of electric vessels is strongly dependent on the carbon intensity of the charging electricity mix: under the current Chinese grid, dominated by coal generation, emission reductions are limited, whereas they grow substantially as the share of renewables increases. In the Italian context, the national grid carbon intensity-approximately 300 gCO
2/kWh in 2024 and projected to decline toward 150 gCO
2/kWh by 2035 in line with the national energy transition plan-is already considerably lower than the Chinese baseline, suggesting that the 17% direct CO
2 reduction reported here for S1 represents a conservative estimate of the long-term environmental benefit, which is expected to improve progressively as the electricity supply decarbonises over the ferry’s service life.
A further point of comparison can be drawn from the cradle-to-grave LCA and LCC study by Kanchiralla et al. [
29], who assessed battery electric ferries operating in the Swedish archipelago under two charging strategies differing in the duration of opportunity charging stops. Their finding that extending dock stop charging time by 10 min reduces installed battery capacity by approximately 33%-with consequent reductions in both environmental impact and life cycle cost-is conceptually aligned with the behaviour observed under S2 in the present study, where controlled in-navigation recharging achieves a comparable reduction in effective cycling depth, lowering the average DoD from ~70% to ~40% without modifying the timetable. The two studies thus identify complementary operational pathways toward the same objective of reducing installed capacity and extending battery life. Regarding economic sensitivity to financing conditions, Kanchiralla et al. demonstrate that reducing the discount rate from 10% to 5% renders all hybrid electric ferry configurations cost-competitive with conventional diesel-powered vessels, turning the carbon abatement cost negative. The present study adopts a real discount rate of 3%, consistent with public infrastructure financing in Italy, which places the economic results in an even more favourable position and reinforces the conclusion that policy instruments targeting capital cost, such as subsidised lending or investment grants, represent the most effective lever for accelerating BESS deployment in the Mediterranean ferry sector. Finally, both studies independently converge on the superiority of LFP over NMC chemistry in terms of both life cycle environmental impact and cost competitiveness, a finding that, emerging from two entirely different methodological frameworks, strengthens the robustness of the battery selection adopted in the present work.
The results of the present paper are sensitive to key economic parameters whose future trajectories carry uncertainty. First, the assumed marine diesel price of €0.75/L is representative of 2024 Mediterranean market conditions but subject to geopolitical and refinery margin volatility; a 20% decrease in fuel cost would reduce annual savings under both strategies proportionally and extend the SPB of S1 to approximately 5.6 years, while S2 would remain below 4.5 years due to its lower replacement burden. Second, the assumed industrial shore electricity tariff of €0.15/kWh directly penalises S1, which relies on grid recharging: a 50% increase in this tariff—plausible given EU ETS-driven electricity price escalation—would erode S1’s annual net savings by ~€39,000 and further widen the economic gap in favour of S2. These sensitivities suggest that, under almost all foreseeable energy price scenarios, S2 represents the more robust investment choice for a Mediterranean short-sea operator, while S1 retains value specifically in regulatory contexts that mandate zero direct emissions in port.
As regards the discount rate, the value of 3% was adopted in accordance with the European Commission’s Guide to Cost-Benefit Analysis of Investment Projects (2014 edition), which recommends a social discount rate of 3% for EU cohesion countries in transport infrastructure appraisal, consistent with the reference rate applied by the European Investment Bank to green maritime transport financing in Italy. To assess sensitivity to this parameter, the analysis was repeated at 6% (a common commercial lending rate for maritime investment in Italy), slightly higher than the value used in recent cold-ironing techno-economic studies, which apply a real discount rate of 5% to comparable maritime port investments [
13]. The relevant results are also shown in
Table 6. NPV values remain positive across the full range, confirming investment robustness under all foreseeable financing conditions.
The multi-objective optimisation identifies the Pareto-optimal BESS configuration that maximises installed energy capacity subject to the spatial constraint of the garage deck and the gravimetric constraint of the deadweight. The optimised layout occupies approximately 87 m2 of deck area, representing 5% of the available garage surface, a negligible impact on vehicle capacity that corresponds to the sacrifice of fewer than 4 standard car lanes. The additional battery mass constitutes approximately 54% of the vessel’s operational deadweight, a value well within the Load Line Convention limits and generating no detectable change in trim or metacentric height. These findings confirm that BESS retrofitting is technically feasible without structural modifications or reduction of commercial payload.
7. Conclusions
This paper demonstrates, through a multidisciplinary methodology combining experimental electrochemistry, system-level dynamic simulation and techno-economic optimisation, that integrating a properly sized LiFePO4 BESS into a hybrid diesel-electric regional ferry is both technically feasible and economically viable, yielding meaningful CO2 reductions that directly support decarbonization targets for short-sea passenger shipping.
The work presents an experimentally validated ECM of a commercial LFP cell, combined with a full-vessel dynamic model developed in AVL Cruise M, providing a reliable and replicable simulation framework for assessing hybrid marine energy systems. Energy management strategies are then compared to find the following results:
Strategy S1, namely port discharge + shore recharging, maximises annual CO2 savings (17%) and is the preferred option when environmental performance is the primary objective or when full zero-emission port calls are mandated by local regulations.
Strategy S2, with port discharge + in-navigation recharging, delivers higher cumulative net savings (~€470,000/year) and a shorter payback period (3.72 years) by exploiting shallower battery cycling, which halves the equivalent full cycles per year relative to S1 and reduces total replacement events from ~9 to ~6 over a 20-year horizon.
The optimised BESS configuration occupies only 5% of the available garage area and satisfies all Load Line Convention constraints, confirming the feasibility of retrofitting without structural reinforcement or payload sacrifice. Both strategies yield strongly positive 20-year NPV and IRR well above the assumed discount rate, confirming the economic rationality of BESS investment for this vessel class and route profile.
These results reinforce the role of BESS as a near-term, cost-competitive decarbonization lever for the Mediterranean ferry sector.
Future work should extend the methodology to incorporate higher-fidelity battery degradation models, investigate alternative chemistries (NMC, solid-state) and assess the sensitivity of economic outcomes to grid electricity tariffs and evolving carbon pricing mechanisms. The integration of onboard photovoltaic generation or green shore-power supply chains represents a natural evolution of the present framework toward the net-zero emission vessel.





 ,
,