


Abstract
Nitrogen (N) and Phosphorus (P) are essential macronutrients whose unsustainable extraction and use pose growing environmental and geopolitical challenges. In the European Union, tightening regulatory frameworks, including the Urban Waste Water Treatment Directive (EU 2024/3019) and the Farm to Fork Strategy, have positioned nutrient recovery as a fundamental pillar of the circular economy. Despite the availability of mature technologies, comprehensive techno-economic assessments applied comparatively across multiple industrial sectors remain scarce. This study addresses that gap by evaluating the economic feasibility of five nutrient recovery systems across European waste valorization case studies: ammonia stripping from digestate (Spain), sewage sludge composting (Latvia/Lithuania), whey valorization via ultrafiltration and reverse osmosis (Hungary), algae-based dairy wastewater treatment (Slovakia), and pyrolysis of sewage sludge (Denmark). A structured data collection methodology was applied to assess capital expenditures (CAPEX), operational expenditures (OPEX), mass and energy flows, and nutrient recovery yields. Results demonstrate that all five systems show technical operability and economically relevant cost structures, with unit treatment costs ranging from €0.005/kg to €1.60/kg of waste treated, supporting their further development and scale-up as viable nutrient recovery pathways. N recovery was prioritized in most configurations, while P was predominantly co-recovered in solid residues. The findings provide a cross-sectoral comparative framework to support decision-making in the transition towards sustainable nutrient management and circular economy models.
1. Introduction
Nitrogen (N) and phosphorus (P) are essential macronutrients which support critical biogeochemical processes, ensuring food security and ecosystem stability [1]. However, the extraction and actual use of these elements have become unsustainable due to increasing anthropogenic pressures. In the European Union (EU), the environmental pressure to reduce N and P emissions has positioned nutrient recovery as a fundamental pillar of sustainability strategies and the circular economy [2].
The global population is projected to reach 9.8 billion by 2050, which will intensify synthetic fertilizer demand—which, in 2025, was approximately 205 million tonnes (Mt) (broken down into 116 Mt of N, 41 Mt of K2O, and 48 Mt of P2O5) [1]. Whereas atmospheric N is abundant but requires costly and polluting industrial processes such as the Haber–Bosch process for its fixation [1], P is a non-renewable resource extracted from finite phosphate rock, whose geographic distribution is uneven, setting out geopolitical security risks [1].
Agricultural intensification, urban wastewater discharge, and livestock waste have significantly increased N and P flows to the environment. This alteration of natural nutrient cycles generates relevant environmental impacts, including eutrophication of aquatic ecosystems, harmful algal bloom, and biodiversity loss [3].
For this reason, the EU has implemented a regulatory framework, which has evolved from pollutant elimination to mandatory resource recovery. This framework is part of the European Green Deal and the strategy “Farm to Fork”, which set ambitious goals to reduce nutrient losses by 50% and the use of chemical fertilizers by 20% by 2030 [4,5].
The Nitrate Directive (91/676/CEE) has been the fundamental pillar, limiting the application of nitrogen derived from manure to a maximum of 170 kg N per hectare, called Nitrate Vulnerable Zones, to protect waters from eutrophication. This regulation is complemented by the Water Framework Directive, which requires that all bodies of water achieve a good quality status, and the Directive on the protection of groundwater against pollution and deterioration (2006/118/CE), which establishes groundwater concentration limits lower than 50 mg/L [4,6].
A major crucial legislative advance is the recent Urban Waste Water Treatment Directive (UE2024/3019), which formally promotes the adoption of nutrient recovery technologies in wastewater treatment practices [7]. In parallel, Regulation (EU) 2019/1009 establishes rules on the market availability of EU fertilizer products, operational from July 2022, and has facilitated the recovery of nutrient commercialization, permitting its free circulation in the European market and reducing dependence on imports of critical raw materials such as phosphate rock [8].
From an environmental perspective, conventional synthetic fertilizer production is associated with substantial greenhouse gas emissions and resource depletion. The Haber–Bosch process, responsible for the fixation of atmospheric nitrogen into ammonia, accounts for approximately 1% of global annual energy consumption and generates significant CO2 and N2O emissions throughout the fertilizer supply chain [9]. The production of nitrogen fertilizers alone is estimated to emit approximately 3.7 kg of CO2 per kilogram of fertilizer produced [9]. Phosphorus fertilizers, in turn, depend on the extraction of finite phosphate rock reserves, whose geographic concentration creates geopolitical supply vulnerabilities [10]. In this context, nutrient recovery from waste streams represents not only an economic opportunity but also a pathway to reduce the environmental burden associated with conventional fertilizer production by substituting fossil-based and mineral-derived inputs with bio-based recovered products [9,10].
To address this challenge, diverse technological systems of recovery have been developed with an increasingly focused approach on sustainable solutions aligned with the circular economy. Among the most notable is struvite precipitation, capable of recovering between 85 and 90% of P and 15–45% of N [11]. Ammonia stripping, followed by acid absorption to produce ammonium sulphate [4], permits recovery of between 70 and 90% of ammoniacal N [12]. Absorption and ion exchange systems using zeolites or biochar [4] have variable efficiencies between 60 and 90% for P and ammonium depending on the material used [13]. Emerging technologies include bioelectrochemical systems (BESs), that permit potential recovery of between 70 and 80% of N and P [14,15], combined with energy production [8]. Membrane-based processes (reverse osmosis (RO), ultrafiltration (UF), and nanofiltration (NF)) concentrate more than 90% of dissolved nutrients [16,17,18]. In parallel, an increasing interest in biologic approaches is observed, particularly in microalgae bio-based systems, which permit assimilation of nutrients up to 90% [19,20]. Also, more recent research articles have explored the potential of thermochemical treatments, such as pyrolysis and hydrothermal processes, which allow phosphorus recovery in stable forms up to 75–90% [21,22,23] and its incorporation into products such as biochar, contributing simultaneously to waste valorization and carbon sequestration [24].
In recent scientific literature, systematic reviews have addressed nutrient recovery from a circular economic and environmental sustainability perspective, focusing on descriptions of technical mechanisms and operational factors [25,26]. Although various techno-economic evaluations have been developed, these are usually limited to specific technologies at lab or pilot scale [27,28]. There is a lack of studies that integrate techno-economic analysis applied comparatively to different sectors of the industry, which present diverse challenges and nutrient concentrations [26,29,30]. Despite the existence of solutions with high levels of technological maturity (TRL 7–9) and operational commercial installations in diverse European countries, the literature still does not provide a comprehensive view of their economic viability in multiple industrial contexts [25,26,28,30].
The selection of the case studies was aligned with the objectives of the Horizon Europe NENUPHAR project, which addresses nutrient recovery across multiple sectors generating nutrient-rich waste streams, including livestock digestates, municipal sewage sludge, dairy by-products, agro-industrial wastewater, and other organic residues. Each demonstration site represents a different industrial context and geographical region within Europe, enabling the evaluation of nutrient recovery technologies under diverse operational and regulatory conditions. This cross-sectoral approach facilitates the identification of common techno-economic drivers and supports the transferability of successful nutrient recovery strategies across sectors and regions.
The present study addresses this gap through a techno-economic evaluation applied in diverse industrial sectors. Specifically, it compares technical performance, investment and operational costs, nutrient recovery potential, and overall economic viability under different scenarios of waste stream composition and treatment scales. In this way, the study contributes to generating a cross-cutting vision applicable to decision-making in the context of the transition towards circular economy models and sustainable resource management. The novelty of this study lies in four key dimensions: (i) a multi-sector comparative approach simultaneously evaluating five technologies across five different industrial sectors, whereas most existing techno-economic studies are limited to a single technology or sector; (ii) the use of primary data provided directly by demonstration site partners from already-installed or planned demonstrators, rather than literature-based or modelled cost estimates; (iii) a cross-regional European perspective covering five geographically and regulatorily diverse contexts, providing transferable insights applicable across EU member states; and (iv) a cross-TRL comparative framework simultaneously assessing technologies ranging from TRL 4–5 to TRL 9, enabling an evaluation of nutrient recovery pathways at different stages of technological maturity within a single comparative study.
2. Materials and Methods
2.1. Methodology and Data Collection Instrument
To better understand the scope of the Case of Study (CoS) technologies, the participation of all the involved CoS partners was needed to determine the specifications and collect the data for techno-economic analysis. For this purpose, the following methodology was executed:
- Elaboration of data collection instrument. The data collection instrument considered all the technical aspects of the technologies that will be deployed during the project.
- First interviewing stage. In this step, the first internal meeting with each CoS partner was set to explain the template and scope of the required data. It was important that each involved partner (per case) contributed with their feedback to understand the availability of the data.
- Data collection campaign. A fixed time was established for the CoS partners to fill out technology description templates. After the deadline, the data was checked and analyzed to better understand each technology.
- Second interviewing stage. A second round of interviews was conducted with the goal of understanding the information provided by each CoS partner and the availability of the data. In some cases, intellectual property was a limitation on data availability.
- Techno-economic analysis. The analysis was carried out with the information provided by each CoS site.
Figure 1 provides a visual summary of the five-step methodology applied for data collection and techno-economic analysis across the five case studies.
Figure 1.
Methodology workflow for data collection and techno-economic analysis.
2.1.1. Data Collection Instrument
The data collection instrument was developed as a structured tool to systematically gather the technical and economic information required for the techno-economic assessment, ensuring consistency and comparability across the five case studies. The template was organized into three main sections (see Appendix A), collectively addressing four key aspects: (i) goal and TRL of the technology, covering both the scope and maturity of each demonstration (Figure A1); (ii) process scheme and mass and energy flows (Figure A2); and (iii) materials and economics (Figure A3). Two rounds of interviews were conducted with CoS partners. The first round aimed to present the instrument, explain its scope, and clarify data requirements. The second round served to validate the information submitted, address data gaps, and identify any limitations related to intellectual property restrictions that constrained data availability.
The CoS leaders were asked to define and specify with the maximum detail possible the process scheme for their technology, defining any step/sub-step/material and energy flow entering any of the process blocks.
At this point, it was not needed to quantify the energy balance or mass flow, but just to indicate which type of feedstock, additives, reagents, or energy products were employed in every scheme block as the products obtained from each technology.
Goal and TRL of the Technology
The first section (Figure A1) had, as its objective, to provide detailed information of the technology to understand key points, such as (a) how the process works, (b) maturity of the technology, (c) comparison with other technologies from the perception of the CoS leader, (d) location, and (e) scale of the CoS.
Process Scheme
Industry technology representatives from different sectors were asked to define and specify with the maximum detail possible the process scheme for their technology, defining any step/sub-step/material and energy flow entering any of the process blocks, with the aim of obtaining a clear picture on how the CoS will work during the project.
Mass and Energy Flows and Materials
The third section was focused on documenting the materials and equipment that were part of the CoS sites (Figure A2). This section details the components of each technology, including its function and capabilities, as well as a preliminary list of materials required for each process. As a result, the input/output flows (energy and material) for each process block were systematically requested from the respective CoS sites. To enable a consistent comparison of the different technologies involved, a common processing basis (e.g., tonne/hour or kg of N recovered per tonne of feedstock) was applied, regardless of the TRL of each system.
In the case that specific data were not provided by CoS partners, a set of standardized assumptions was established to ensure consistent estimation and facilitate energy and mass balance calculations. First, it was assumed that the feedstock was pre-sorted and adequately prepared for introduction into the processing sequence; this included any necessary pretreatment such as shredding, digestion, preheating, or mixing. For operational time estimations of each processing step, a standard base of 7200 h per year was considered for reactor-type units, while equipment-specific operation percentages were assigned based on estimated cycle durations. For example, shredding that operates for approximately 10 min per hour was assigned a 17% utilization rate.
Heating operations were assumed to be powered by electricity, with an efficiency of 80% applied across thermal units, and a baseline efficiency of 75% used for mechanical or auxiliary systems such as pumps or mixers.
These assumptions provide a uniform framework for estimating missing data and allow for a fair comparative analysis across all technological demonstrations, regardless of their stage of development or available detail in the initial reporting.
Economics
The goal of this section was to collect all the relevant information available at this stage to estimate the CAPEX and OPEX of the technologies presented. It is important to highlight that not all technologies are implemented at the same scale. For that reason, in the analysis, the results were later normalized to be able to compare all involved technologies (Figure A3). Furthermore, all CAPEX and OPEX figures reported in this study were derived from primary data provided directly by the demonstration site partners, reflecting actual procurement, installation, and commissioning costs at current market prices in euros. No cost index corrections, currency conversions, inflation adjustments, or scaling procedures were applied, as all figures were reported by the partners at current price levels and in the applicable local currency (euro) for their respective regions.
Data collection for the five case studies was carried out between May 2024 and May 2025, meaning that all reported CAPEX and OPEX figures reflect prevailing local market prices within this common data collection window, rather than a single fixed reference date. Consequently, the harmonized metrics presented later in this study (€/kg N recovered, €/kg P recovered, normalized CAPEX per tonne/year capacity) are considered directly comparable across the five case studies, as all underlying cost data were collected within the same approximate timeframe and no inflation or cost index adjustment was required. This approach is considered appropriate given the short (12-month) collection window relative to typical inflation and cost index cycles.
The economic boundary for each CoS was defined as the nutrient recovery technology unit itself, as specified by the respective demonstration site partner. Upstream processes (such as feedstock production, collection, and transport to the demonstration site) and downstream processes (such as recovered product distribution, certification, and end-use application) were consistently not included within the economic boundary across all five case studies. Where pre-existing infrastructure was already in place at the demonstration site (such as the biogas plant in CoS 1 or the dairy processing facility in CoS 3), only the costs associated with the nutrient recovery technology add-on were included within the boundary.
2.2. CoS 1: Stripping
This CoS is located in the Ebro river basin, located in northeastern Spain, and occupies two adjacent regions, Aragon and Cataluña. The main objective of this demo is the valorization of pig slurry digestate through the generation of 290 tonnes of N as biofertilizer and 60 tonnes of P as a digestate solid. This activity will be conducted at a facility in the Zaragoza region, operated by a local waste management company. The company will install a stripping unit which consists of two phases: (i) ammonia release, where the liquid digestate goes into a set of reactors against an air stream at high speed, obtaining, as a result, an air stream rich in ammonia and a treated digestate, which can be returned to the digestors or used for fertigation, and (ii) ammonia recovery, where the stream rich in ammonia is mixed with sulfuric acid in a scrubber (Figure 2). A 35% sulphate ammonia liquid is obtained as an end product, which can be used as a fertilizer.
Figure 2.
CoS 1 process diagram: ammonia stripping of pig slurry digestate. Purple arrows: process steps; Green arrows: energy, side materials and products.
The ammonia stripping process returns, as a result, mainly ammonium sulphate ((NH4)2SO4). This technology works under elevated pH and temperature, and it produces the reaction between NH3 and an acid solution, which is usually sulfuric acid, to produce ammonium sulphate. The chemical reaction governing this transformation is:
2 NH3 + H2SO4 → (NH4)2SO4.
This process can be seen in the waste generation company. The main goal is the production of ammonium sulphate as a stable, concentrated N fertilizer. However, the use of this technology involves some considerations, including problems in storage, labelling, and regulation. On the other hand, it has some advantages, such as a reduction in N losses to air and water, its market economic value, or its use in supplying energy demand for heating and air/gas circulation in the stripper. Some of the goals for this demo are related to the recovery of N in the form of bio-based fertilizers, developing knowledge and understanding about the recovery of nutrients and bio-based fertilizers.
2.3. CoS 2: Composting
High levels of N and P can be identified through the presence of algae, which are closely associated with human activities. The Lielupe river basin in Latvia includes 162 biological wastewater treatment plants (WWTPs) of different sizes that discharge treated wastewater into the environment. Each treatment plant generates excess sludge containing N and P. However, the tools currently available for nutrient monitoring are still insufficient, since the main focus remains on heavy metals due to regulatory constraints. In this context, this CoS pursues several objectives, including reduction in mineral fertilizer use, enhancement of knowledge related to the circular economy, and promotion of nutrient recovery.
Therefore, this CoS is located in the Lielupe river basin, which extends across Latvia and Lithuania. The main goal is to recover nutrients (N and P) from sewage sludge through composting. The process consists of transforming municipal wastewater sludge into a bio-based fertilizer using tree leaves, wood chips (712.1 tonnes/year), reed stalks (142.4 tonnes/year), and dewatered biological excess wastewater sludge (569.7 tonnes/year) as raw materials. From these materials, the process is expected to produce 1424.7 tonnes/year of compost, from which most of the nutrients are obtained. In addition, green waste is readily available for the compost producer, which facilitates the implementation of the process.
The composting process comprises several stages. First, the sludge undergoes a dewatering stage, the main purpose of which is to reduce the moisture content. Second, static piles are formed in order to create the aerobic and anaerobic conditions required to initiate the composting process. Third, the piles are aerated for 21 to 30 days, while ensuring that the temperature does not exceed 60 °C. During this stage, between 5% and 15% of the total gas volume is obtained. Fourth, the stabilization phase consists of moving the piles to a maturation area for an additional 30 days. Finally, the compost is sifted in order to recover the bulking agent (Figure 3).
Figure 3.
CoS 2 process diagram: composting of sewage sludge. Red arrows: process steps; Green arrows: energy material inputs; Purple arrows: waste water produced; Gray arrows: complementary biomass-additives.
The final compost is not completely stabilized at the end of the process. Therefore, before being converted into the final product, it undergoes an additional stabilization step, which is indicated by a decrease in temperature to between 45 and 50 °C.
2.4. CoS 3: UF–Ozone Treatment
The CoS is situated in Győr, Hungary, a dynamic industrial and innovation hub with a strategic position near the Austrian and Slovak borders. Its proximity to a local university with a strong academic profile in agricultural and food sciences further promotes synergies between industry and academia.
The system represents an innovative approach for the treatment of dairy wastewater, combining membrane filtration with ozone pretreatment to enable ricotta production. This integrated process ensures a safe and sustainable production of ricotta with high functional and nutritional value. The final product is characterized by an elevated protein content (10–12%), low fat levels, and the preservation of the bioactivity of native whey proteins (Figure 4).
Figure 4.
CoS 3 process diagram: nutrient recovery via UF–ozone treatment.
The CoS is designed to treat 1000 L of whey generated from the production of 100 kg of semi-hard cheese, which is subsequently valorized for ricotta manufacturing. The whey produced exhibits suitable characteristics for membrane processing. It is collected in stainless steel storage tanks, cooled to low temperatures to limit microbial activity, and handled under controlled conditions to preserve protein functionality and minimize degradation.
Subsequently, the whey undergoes ozone pretreatment, which enhances both process efficiency and safety. Ozone is introduced via a gas-injection reactor equipped with microbubble diffusers, promoting the oxidation of organic matter and the disruption of microbial cell walls. Ozone exposure is carefully controlled to avoid alterations in protein structure, and residual ozone is removed using an activated carbon destruction unit to prevent oxidative damage prior to ultrafiltration.
Following pretreatment, the whey is processed through an ultrafiltration membrane system operating at low transmembrane pressure and temperatures between 50 and 55 °C. During filtration, high-molecular-weight proteins are retained, while lactose, minerals, and water permeate through the membrane and are directed to further treatment. This selective separation increases protein concentration in the retentate by a factor of five to six, rendering it suitable for ricotta production.
The protein-rich retentate is then subjected to thermal treatment to induce coagulation, followed by acidification with nitric acid to optimize curd formation. The resulting coagulum is drained, moulded, and cooled to obtain fresh ricotta.
The technology has an annual treatment capacity of 500 tonnes of whey, yielding approximately 25 tonnes of ricotta, 100 tonnes of lactose concentrate intended for biofertilizer production, and 400 tonnes of permeate for reuse as cleaning water. Additionally, the system recovers approximately 718 kg of nitrogen and 497 kg of phosphorus per year, demonstrating a high recovery efficiency of valuable nutrients from dairy by-products.
2.5. CoS 4: Algae Absorption
The CoS is located in western Slovakia, specifically within the regions of Nitra, Trnava, and Trenčín. The collaborating institution is the country’s only agricultural university, situated in the central part of this area, thereby reinforcing the link between technological development and academic expertise.
This CoS focuses on the development of an innovative algae-based technology for nutrient recovery from dairy wastewater. In addition, the process enables the production of nutrient-enriched biomass, which is intended for use as a bio-based fertilizer (Figure 5).
Figure 5.
CoS 4 process diagram: nutrient recovery from diary waste water via algae absorption.
The process begins with untreated dairy wastewater, which undergoes a series of physical pretreatment steps aimed at transforming the raw effluent into a clarified and conditioned medium. This initial stage is essential to release and make bioavailable the nutrients contained within organic compounds. The organic matter separated during this phase is collected for potential reuse.
The subsequent stage represents the core of the process: the biological phase of nutrient recovery. The pretreated wastewater is directed to specially designed cultivation tanks, where selected microalgae species are grown under controlled conditions. To maintain optimal growth conditions and ensure culture viability, supplementary nutrients are added to the cultivation medium alongside the algae inoculum, both of which contribute additional nitrogen and phosphorus to the system beyond the dairy wastewater input. These microorganisms act as highly efficient natural purifiers, assimilating dissolved N and P as essential nutrients for their growth and photosynthetic activity. As nutrient concentrations decrease in the aqueous phase, they are progressively incorporated and concentrated within the algal biomass. Process efficiency is enhanced through continuous monitoring and control of key operational parameters, including temperature, light availability, and water quality. Moreover, the algae assimilate a broad range of micro- and macronutrients present in the wastewater, resulting in a high-value, nutrient-rich biomass particularly suitable for application as a biofertilizer.
The final stage of the process involves biomass recovery and conditioning. Separation techniques are employed to isolate the nutrient-rich algal biomass from the treated water. The harvested biomass is subsequently stabilized through moisture reduction, yielding a stable product suitable for agricultural use. Overall, the technology achieves a reduction of approximately 74.6% in nitrogen and 65.7% in phosphorus concentrations in the dairy wastewater fraction treated, enabling its safe discharge.
The annual mass balance for CoS 4 is based on 52 m3/year of dairy wastewater treated, combined with 52 m3/year of process water and 52 m3/year of growing substrate for algae cultivation, with approximately 56 m3/year of algae biomass recovered. The dairy wastewater contains an average of 167 mg/L of nitrogen and 29.9 mg/L of phosphorus, corresponding to annual inputs of 8684 g N/year and 1554.8 g P/year, respectively. Following pretreatment (ultrasound, centrifugation, and filtration) and biological cultivation, the final effluent (approximately 100,000 L/year) presents average concentrations of 22.05 mg/L of N and 5.325 mg/L of P, corresponding to 2205 g N/year and 532.5 g P/year remaining in the aqueous phase.
It should be noted that additional nitrogen and phosphorus inputs are introduced during the cultivation stage, corresponding to the nutrient content of the algae inoculum and the supplementary nutrients added to maintain optimal growth conditions. Removal efficiencies, calculated relative to the dairy wastewater input fraction only, are approximately 74.6% for nitrogen and 65.7% for phosphorus.
2.6. CoS 5: Pyrolysis
CoS 5 is located on the island of Bornholm, Denmark. Its main objective is to revalorize wastewater sludge and sludge from private septic tanks generated by local companies through pyrolysis, thereby promoting circularity and resource reutilization. This process enables the production of thermal energy for local district uses, as well as biochar for potential application as a fertilizer.
The system includes a stage in which the dried sludge is subjected to pyrolysis, generating both biochar and pyrolysis gas. The gas can potentially be reused as a heat source within the pyrolysis process itself, thus improving overall process efficiency. The main product obtained is biochar, which retains 60–80% of the original carbon content, is rich in nutrients such as N and P, and is free from many contaminants and organic micropollutants. The system can process up to 1000 tonnes of dry matter per year, allowing an estimated reduction of approximately 1800 tonnes of CO2 emissions, while producing around 2000 MWh of sustainable energy and about 500 tonnes of biochar annually (Figure 6).
Figure 6.
CoS 5 process diagram: pyrolysis of sewage sludge. Purple arrows: process steps; Green arrows: energy materials.
Biochar represents a promising route for obtaining stable carbon-rich material. In agricultural applications, it can be used as a soil amendment and offers several advantages, such as long-term carbon storage over thousands of years and improvements in soil structure. Accordingly, some of the objectives of this CoS are related to improving the understanding of nutrient recovery from wastewater and the technologies required to enable this recovery.
3. Results
3.1. Analysis of CoS 1: Stripping
The technology from CoS 1 in the Ebro river basin has been installed at the premises of a waste management company. The demonstrator aims to recover N from digestate through chemical stripping by sulfuric acid addition. The final product of this production process is an existing commodity conventionally produced through the reformation of fossil gas by the Haber–Bosch process to produce ammonia, with the use of sulfuric acid. This technology aims to replace the conventional method with one that uses alternative feedstock that is not dependent on minerals.
The current scale of this technology is TRL9, and it is commonly used to recover N from liquid sources. The N recovery system installed at the waste management company (Figure 2) starts with the solid–liquid separation process of 33,000 tonnes/year of digestate from the AD plant. The liquid part of the digestate (27,076 tonnes/year) is directed to the stripping unit since the ammonia is found only in the liquid fraction. In the stripping tower, hot air increases the temperature of the liquid digestate up to 55 °C to volatilize the NH4+ (151 tonnes/year), which will then move to the scrubbing process. In the scrubber tower, a solution of sulfuric acid (30–40%) reacts with the ammonia gas to form ammonium sulphate (2040 tonnes/year). The ammonium sulphate produced can be used as a valuable fertilizer product with commercial market value. The stripping system can recover up to 81.2% of the N from the digestate (Table 1).
Table 1.
CoS 1: Mass flows and characteristics.
The stripping system recovers 151.5 tonnes of N per year as ammonium sulphate, representing 81.2% of the total nitrogen content of the raw digestate (186.3 tonnes N/year). This recovery efficiency is reported relative to the raw digestate as a whole, providing the most transparent basis for cross-case comparison, noting that only the liquid fraction (173.6 tonnes N/year) is directed to the stripping unit.
To ensure the successful operation of both the biochemical and thermochemical stages involved in N recovery, the facility incorporates a comprehensive set of mechanical and electrical equipment. These systems are divided between the solid–liquid separation process and the chemical stripping unit, each contributing differently to the overall energy consumption (Table 2).
Table 2.
CoS 1: List of equipment and energy consumption.
In the separation stage, the digestate is first pumped using a 2.2 kW digestate pump, which operates intermittently (10% of the time), resulting in an annual energy consumption of approximately 2112 kWh. To facilitate flocculation during the liquid–solid separation, a 1.5 kW flocculant pump is used, with a yearly consumption of 1440 kWh. The most energy-intensive device in this phase is the solid–liquid separator, operating at 48 kW and used 20% of the time, contributing around 92,160 kWh per year. Supporting this process, a polyelectrolyte preparation unit rated at 1.1 kW is also employed, although at a low duty cycle, leading to an average consumption of 528 kWh annually.
The stripping process involves more continuous and energy-demanding operations. The most significant consumer is the blower, rated at 18.5 kW, which runs continuously to maintain optimal air flow in the striping tower. This unit alone accounts for a substantial 177,600 kWh per year. The digestate circulation pump, operating at 5.5 kW, also runs continuously and contributes 52,800 kWh annually to the total energy demand.
Additional auxiliary equipment includes the antifoam agitator and pump, which, although low in power, are essential for maintaining process stability, consuming 96 kWh and 43 kWh per year, respectively. Heat necessary for ammonia volatilization is supplied by a boiler and burner unit, with an annual consumption of around 7200 kWh. Finally, the system includes acid feed and charge pumps, which together use approximately 440 kWh per year.
These components collectively support the integrated process of N stripping, ensuring efficient resource recovery while maintaining a controlled energy profile across the system.
Their specification and operational duty cycles are key to evaluating the system’s feasibility and sustainability in the context of circular economy practices.
This energy balance affirms the process as a viable and scalable solution for nutrient recovery in biogas plants, aligning with circular economy principles by reducing waste and producing valuable by-products from residual streams (Table 2).
The total energy consumption reported in Table 2 (334,419 kWh/year) covers the entire integrated system, comprising both the solid–liquid separation stage (96,240 kWh/year) and the stripping process (238,179 kWh/year).
The implementation of the stripping process at the facility site represents a strategic investment aimed at enhancing the circular management of N-rich digestate derived from AD. The total capital investment for the stripping system alone is estimated at €621,000 (Table 3). This figure encompasses the key components essential to the chemical stripping process.
Table 3.
CoS 1: Associated CAPEX.
The installation and auxiliary infrastructure required to integrate the striping line into the existing facility accounts for the largest share of the investment, amounting to 40.2%. This includes mechanical integration, electrical systems, and support structures. In addition, storage tanks for handling process fluids represent 12.1% of the total investment.
At the core of the system is the solid–liquid separator, necessary for removing solids prior to stripping, which contributes 25.8% to the total cost. The desorption (stripping) column, which enables the volatilization of ammonia from the digestate under heated and aerated conditions, accounts for 12%, while the absorption column, responsible for capturing the released ammonia in a sulfuric acid solution, represents 7.2%.
To complete the system, two pumping units, an acid pump and an acid charge pump, are required to dose and circulate the sulfuric acid reagent used in the scrubbing process. These are relatively low-cost components, priced at less than 1% of the total cost.
It is important to note that this stripping process is an add-on technology, designed to increase the value and sustainability of an already operational biogas plant. That means an additional capital investment of approximately €5.8 million, according to the site manager. Therefore, stripping technology constitutes about 10.7% of the total capital investment in the overall waste treatment system.
The electricity consumption of the entire stripping process, including pumps, blowers, and separators, is estimated at 238,179 kWh/year. This results in an annual energy expenditure of approximately €24,177.90 (Table 4). The thermal energy demand is relatively low, at just 7200 kWh/year, used to heat the digestate to 55 °C which contributes marginally to the overall energy budget. The figure of 238,179 kWh/year reported in Table 4 refers exclusively to the stripping process, consistent with the OPEX boundary defined for this CoS, which covers the stripping unit only. The energy consumption of the solid–liquid separation stage is accounted for within the baseline operational costs of the pre-existing biogas plant.
Table 4.
CoS 1: Associated OPEX.
A significant contributor to the OPEX is the chemical cost associated with the stripping process. The system requires approximately 1326 tonnes of 40% sulfuric acid per year, which is essential for reacting with volatilized ammonia to produce ammonium sulphate.
When considering the entire biogas-stripping system, it is also relevant to account for the baseline operational costs of the biogas plant (anaerobic digestion system), which may reach up to €40,000 per year due to its energy consumption and other services (estimated at 400,000 kWh/year). However, the stripping unit, while contributing additional cost, significantly increases the overall environmental and economic performance of the facility by recovering valuable N and reducing waste-related liabilities.
3.2. Analysis of CoS 2: Composting
The sludge composting process implemented in CoS 2 is a well-structured and sustainable approach to valorizing organic waste, particularly dewatered sludge from wastewater treatment plants. The process begins with the mechanical dewatering stage, where a belt press (SK-Koeistot OY) and associated conveyor system are used to extract excess water from the biological sludge. The dewatered biological excess sludge entering the composting process presents a dry solids content of 66%, achieved through a two-stage process: mechanical dewatering using a belt press system with polymer flocculation, followed by passive sun drying during storage while awaiting transport to the composting facility. This natural drying process does not involve dedicated equipment or additional energy input and is therefore not included as a separate cost item in the OPEX. The N and P concentrations reported for the dewatered sludge (61.4 g/kg and 86.0 g/kg, respectively) are expressed on a dry weight basis, making the sludge particularly suitable for composting. Supporting this stage, a washing pressure booster and a sludge feed pump are also utilized, ensuring efficient operation and sludge flow handling (Figure 3).
The raw materials used in the composting process comprise a mix of organic bulking agents and nutrient-rich sludge. Specifically, around 712.1 tonnes/year of tree leaves and wood chips and 142.4 tonnes/year of reed stalks are combined with 569.7 tonnes/year of dewatered biological excess sludge (Table 5). These materials contribute not only to the physical structure needed for aeration in windrows but also to the nutrient profile of the final compost. The sludge provides a high N and P content, 61.4 g/kg of N and 86 g/kg of P, while the lignocellulosic materials such as wood chips and reed stalks offer carbon-rich biomass that supports microbial balance during composting.
Table 5.
CoS 2: Mass flows and characteristics.
Once mixed, the materials are transferred to a composting platform using a Track MAZ truck, where they are arranged into windrows and subjected to aerobic composting. The turning of these windrows is carried out by a BACKHUS compost turner, which ensures proper oxygenation and uniform temperature distribution. This thermophilic phase is crucial, as temperatures must reach at least 55 °C for three consecutive days to ensure pathogen reduction and proper sanitation. A front loader is used throughout the process for material handling and pile reshaping, and a biomass shredder helps reduce particle size, promoting faster degradation and better microbial activity (Table 6 and Table 7). The fuel requirements associated with the mobile equipment used during the composting process are summarized in Table 8.
Table 6.
CoS 2: List of equipment needed, operation time, and energy consumption.
Table 7.
CoS 2: List of extra equipment needed. Energy consumption has not been accounted for.
Table 8.
CoS 2: List of equipment that requires fuel for its operation.
The outcome of this process is the production of approximately 1424.17 tonnes/year of high-quality compost, enriched with 26.5 tonnes of N and 37.7 tonnes of P, making it a valuable soil amendment for agriculture. This output not only helps recycle nutrients and organic matter but also reduces reliance on synthetic fertilizers and minimizes the environmental burden of sludge disposal.
The total CAPEX for the composting system amounts to approximately €1,807,431 (excluding VAT), covering both civil infrastructure and mechanical equipment required for the full operation of the sludge composting process (Table 9). This investment reflects a long-term commitment, with lifespan assumptions based on Lithuanian legislation typically amounting to 8 years for civil structures and 5 years for machinery.
Table 9.
CoS 2: Estimated reported CAPEX.
A major portion of the investment is allocated to the construction of specialized composting fields. This includes the sewage sludge field and roof, valued at approximately €637,150, followed by the composting platform (€350,188), storage areas for compost (€289,330), and amendment preparation and storage zones (€120,902). Additional infrastructure such as the yard square (€57,055) and a pressure sewer line with a pumping station (€63,716) support the overall logistical and environmental performance of the site.
On the machinery side, several key equipment items enable mechanical treatment, material handling, and operational efficiency. These include a green waste shredder with a cost of around €101,040, a mobile trommel screen (€83,121), a front loader (€79,588), and a sweeping machine for tractors (€4344). The compost turner, a critical element for aerobic composting, adds €104,118 to the CAPEX. These machines are expected to be replaced on a 5-year renewal cycle due to operational wear.
The annual operating costs (OPEX) for the composting facility are estimated at €56,172.20, covering the expenses necessary to maintain process efficiency and compliance with environmental standards (Table 10).
Table 10.
CoS 2: Estimated reported OPEX.
The largest component of the OPEX is attributed to chemical consumption, primarily used for compost quality enhancement and dewatering aids, totaling €20,196 per year. Fuel consumption is another major contributor, amounting to €16,521 annually, driven by mobile equipment operations such as the compost turner, biomass shredder, and transportation vehicles, which together consume around 12,422 L of diesel per year.
Electricity usage, although moderate, also forms part of the expenditure, with a total of €8638 per year, based on the total annual consumption of 61,701 kWh. Additionally, water resources are utilized in two specific ways: drinking water is used for cleaning and chemical preparation (€5107 per year), and drainage water treatment from composting processes costs about €5710 annually, ensuring the system remains compliant with wastewater regulations.
In general terms, the cost of treating 1 kg of sewage sludge into compost is around €0.099, calculated as the total annual OPEX (€56,172.20) divided by the annual dewatered sludge input mass (569.7 tonnes/year). This figure requires 0.108 kWh of energy per kg of dewatered sludge processed.
3.3. Analysis of CoS 3: UF–Ozone Treatment
CoS 3 using the whey valorization system is an advanced technological solution designed to optimize the use of whey generated during cheese production. Initially, the system was configured to process whey derived from the production of semi-hard cheeses such as Edam or Gouda. In this early configuration, milk was processed through standard operations including pasteurization, coagulation, curd formation, and whey separation. The whey was subsequently subjected to UF, where high-molecular-weight proteins were concentrated and directed to a ricotta production line. The remaining permeate, which was primarily composed of water, was discharged as wastewater without further treatment. While this approach yielded a quality ricotta product, it did not capitalize on the potential for recovering other valuable constituents in the whey, nor did it contribute to water reuse or circularity within the production system.
In its upgraded configuration (Figure 4), CoS 3 incorporates significant enhancements aimed at increasing resource efficiency, nutrient recovery, and internal reuse of water. After separation from the curd, the whey is transferred to an ozone-based pretreatment system housed within a 1000-litre stainless steel reactor equipped with microbubble diffusers, rotating defoamers, level sensors, and CIP cleaning systems. This ozone pretreatment step reduces microbial loads, degrades complex organic molecules, and improves the performance of subsequent membrane operations by reducing fouling.
Following oxidation, the whey is processed through a combined UF and RO membrane system. The UF stage concentrates the protein fraction, which is redirected to the cheese line for ricotta production. In parallel, the RO unit isolates lactose into a separate concentrate stream, suitable for use as animal feed additives or for the formulation of biofertilizers. The RO-permeate is treated further, if required, through a post-treatment step involving secondary ozonation and nanofiltration. This ensures the water meets microbiological and chemical standards for internal reuse as industrial cleaning water, thus closing the water loop within the facility.
The system processes 500 tonnes of mixed whey annually, primarily from cow milk (85%), with smaller contributions from goat (10%) and sheep (5%) milk. This results in several final output streams including 25 tonnes of ricotta, 100 tonnes of lactose concentrate intended as biofertilizer, and 400 tonnes of permeate to be reused as cleaning water (Table 11). The system aims to recover approximately 718 kg of N and 497 kg of P per year from lactose concentrate, indicating a notable efficiency in nutrient recovery from dairy by-products, noting that these figures are preliminary and will be determined with more accuracy during the pilot campaign in further stages of the project.
Table 11.
CoS 3: Provided list of material flows and their characteristics.
The total output mass (525 tonnes/year) slightly exceeds the primary whey input (500 tonnes/year) due to additional water introduced during the ozone pretreatment and CIP operations, which contribute approximately 25 tonnes/year of process water to the output streams. These figures are partner-provided and preliminary and will be refined during the pilot campaign.
The system relies on a range of processing and utility equipment to support thermal treatment, separation, pumping, and refrigeration. Key energy-consuming operations include heat-based processes, cooling, and fluid transfer. The total electricity demand of the plant is moderate, with notable contributions from core processing units and auxiliary systems. While specific energy values are available for internal assessment, the estimated energy intensity per tonne of material treated indicates a significant role for thermal and mechanical operations. Additional energy demand is associated with supporting equipment within the facility. The reconfigured CoS 3 system demonstrates an innovative approach for ricotta cheese production by achieving whey valorization and minimizing waste from the overall production chain. Therefore, it enhances the economic and environmental performance of cheese production by recovering proteins for ricotta, converting lactose into useful agricultural inputs, and reusing water.
The total capital investment required for the installation of the core technological components of CoS 3 amounts to €311,395. This includes the ozone generator system and the NF/RO filter system. These systems are central to the recovery of valuable protein fractions for ricotta production and the concentration of lactose and nutrients for biofertilizer or feed applications. The investment underscores the implementation of advanced process intensification technologies tailored to circular economy principles within the dairy sector.
The OPEX of CoS 3 reflects the energy and utility demands associated with the integrated whey valorization system (Table 12). The system comprises multiple processing units, notably including the UF-RO modules, which account for the largest share of electricity consumption within the plant. These membrane technologies consume electricity amounting to €7855.80 annually.
Table 12.
CoS 3: Estimated OPEX.
In addition to the membrane system, the rest of the plant, comprising pasteurization, pumping, refrigeration, curd pressing, and ancillary operations, results in an additional €2776.85 in electricity costs per year. The process also relies on thermal energy, primarily for heating during pasteurization and cleaning operations. This is supplied by natural gas, which translates into an annual expenditure of €13,233.92.
Another key operational input is freshwater, used for equipment cleaning and CIP processes. The total annual water consumption represents a cost of €5855.14 per year.
Altogether, the total OPEX for CoS 3 reaches approximately €29,721.70 per year. This demonstrates a sustainable approach to whey valorization, achieving an operating cost of approximately €1.19 per kilogram of ricotta produced, a metric that is specific to the dairy industry context of this CoS and one that is not directly comparable with treatment costs expressed per kg of waste treated in other case studies. For cross-case comparison purposes, the harmonized OPEX cost per kilogram of N recovered is approximately €41.39/kg N. In addition to generating high-quality ricotta through the recovery of proteins from whey, the process yields approximately 4 kg of nutrient-rich lactose concentrate for every kilogram of cheese. This lactose concentrate, enriched with N and P, offers significant potential for use as a biofertilizer or animal feed additive, thus adding value to what would otherwise be considered a waste stream. It is important to highlight that a potential revenue stream exists from the sale of the lactose concentrate, which is currently used as a nutrient-rich biofertilizer. According to the site manager, the concentrate could also be marketed as a feed additive. However, due to the lack of data on the annual quantity sold as a feed additive, this potential income is not included in the current techno-economic assessment.
3.4. Analysis of CoS 4: Algae Absorption
In CoS 4 (Table 13), a detailed mass balance illustrates the dynamics of dairy wastewater treatment and nutrient recovery using an algae-based system enhanced with physical and mechanical pretreatment. The entire process treats 52 m3/year of dairy wastewater, combined with 52 m3/year of process water and 52 m3/year of growing substrate for algae cultivation, generating nutrient-rich algae biomass as a final product.
Table 13.
CoS 4: Material flows.
After cultivation, the system yields a clarified effluent of approximately 100,000 L/year, having lost water through evaporation and absorption, with final nutrient concentrations of 22.05 mg/kg N and 5.325 mg/kg P. This translates into ~185 g of N and ~44.7 g of P remaining in the final aqueous stream. Compared to the dairy wastewater input fraction, and accounting for the total effluent volume after process water and growing substrate additions, the corrected removal efficiencies are approximately 74.6% for nitrogen and 65.7% for phosphorus. These figures refer specifically to the reduction achieved in the dairy wastewater fraction and do not account for the additional nitrogen and phosphorus introduced through the algae inoculum and supplementary nutrients during the cultivation stage. The process also ensures that the post-treatment purified water is significantly cleaner, supporting reuse or safe discharge in accordance with environmental standards.
This nutrient distribution is accompanied by a total energy consumption of 3372.8 kWh/year, distributed across all essential stages of the process, including the physical pretreatment of the wastewater and the systems that support the biological cultivation phase. That means that 10.8 kWh is needed to process 1 kg of dry algae from dairy wastewater. Though based on lab-scale implementation, this material and energy flow analysis provides a solid foundation for evaluating future scalability, operational optimization, and integration within broader wastewater management strategies.
The CAPEX for the installation and commission of the experimental setup amounts to €18,277. This investment is strategically allocated across the technology’s three main functional areas. The initial wastewater pretreatment stage represents the largest share, accounting for approximately 73% of the total cost, which covers all advanced equipment needed to prepare the raw wastewater for biological processing. The core biological cultivation stage, including the growth systems and environmental controls, constitutes 18% of the expenditure. The remaining 9% of the CAPEX is dedicated to process monitoring and quality control, ensuring operational efficiency and the traceability of key nutrients throughout the system.
In terms of OPEX, shown in Table 14, the annual operational cost is estimated at €1320.79, largely driven by two main categories: energy consumption and nutrient supplementation. The energy cost, calculated from the full equipment load during operation (totalling approximately 3373 kWh/year), accounts for €340.7 per year. Additionally, the cost of external nutrients needed to support optimal algae growth is estimated at €970 annually, necessary due to the limited nutrient content of the diluted wastewater feedstock.
Table 14.
CoS 4: Estimated OPEX.
Based on the current productivity of the lab-scale setup, which yields approximately 312 kg of dry algae annually (56 m3/year of wet algae), the operational cost equates to roughly €4.2 per kilogram of dry algae produced. This figure reflects the early-stage nature of the system, where limited processing volumes and relatively fixed energy and supply costs elevate unit costs. However, it provides a valuable benchmark for future scale-up assessments.
The economic profile of CoS 4 underscores its feasibility as an NBS for nutrient recovery, particularly when considering the nutrient removal efficiencies achieved (74.6% for N and 65.7% for P relative to the dairy wastewater input fraction), which are expected to improve further with scale-up and process optimization. While current figures are derived from lab-scale operation, they provide a realistic foundation for scaling analyses. With further optimization and potential integration into existing wastewater infrastructure, the process shows promise for cost-effective deployment at a larger scale, balancing innovation, environmental benefit, and economic viability.
3.5. Analysis of CoS 5: Pyrolysis
CoS 5 describes a study of the techno-economic feasibility of implementing a pyrolysis system in Bornholm, Denmark (Figure 6).
The system described as part of CoS 5 can treat up to 1000 tonnes of dry matter annually, with the potential to achieve a reduction of 1800 tonnes of CO2 emissions and to produce around 2000 MWh of sustainable energy and 500 tonnes of biochar. The innovation of this system is that it includes a compact and cost-efficient drying system for dewatered biomass, which takes advantage of the surplus steam to recover energy that can be used for local or district heating. Furthermore, the pyrolysis oven heats the biomass up to 650 °C in an oxygen-free atmosphere. A quality biochar results from the process, which can be utilized as soil amendment and/or fertilizer because of its content of bioavailable N (content of 10–14%) and P (content of 6–7%).
The proposed system also considered handling around 6011 tonnes of sewage sludge per year, with a corresponding dry matter content of 1172 tonnes (Table 15). The scope of the study covers only the pyrolysis unit, but considers that it will receive the sewage sludge either from a biogas plant or from another sludge management facility. For that reason, a biogas plant was not considered for the study.
Table 15.
CoS 5: Mass flows.
The sludge, currently applied agriculturally, will instead be processed to produce valuable products such as biochar, thermal energy, and carbon credits, contributing to a more sustainable and circular waste management strategy.
The sludge will be delivered by truck to the processing site. Approximately 8% of the total sludge volume is assumed to be contaminated with per- and polyfluoroalkyl substances (PFASs), and will require special handling or alternative treatment. The remaining 92% is considered suitable for thermal processing, such as drying and pyrolysis. Through pyrolysis, the system will convert organic matter in the sludge into biochar (42% of the dry sludge) and combustible gases (52% of the dry sludge), with the latter being used to generate thermal energy for both internal operations and external supply to a district heating network. It is estimated that 493 tonnes of biochar will be produced annually, theoretically allowing the recovery of around 77.5 and 35.5 tonnes of N and P, respectively (Table 15).
In addition, the pyrolysis unit will be supported by a liquefied petroleum gas burner system, ensuring operational stability particularly during cold starts or periods when the energy content of the sludge is insufficient for autothermal functioning. Annual liquefied petroleum gas consumption is estimated at 23.07 tonnes, which represents a moderate but manageable cost input.
A significant portion of the thermal energy produced, approximately 3280 MWh/year, will be exported to the local district’s heating system. An additional 15 MWh/year will be used on-site for space or process heating. The overall electricity consumption of the plant is projected to be 347 MWh/year, which represents a key operational expenditure. The main equipment involved in the pyrolysis system, together with their operating times and energy consumption, are summarized in Table 16.
Table 16.
CoS 5: Equipment list with operative characteristics.
The pyrolysis process will yield approximately 493 tonnes of biochar annually, which will be marketed at a base price of 0.098 euro/kg, though there is potential for significantly higher returns if the biochar is upgraded to activated carbon (up to 1.3 euro/kg). In parallel, the carbon content stabilized in the biochar will allow for the generation of 619 tonnes of carbon dioxide equivalents per year, valued at 145.21 euros/tonne (carbon credits).
Overall, the system is expected to transition sludge management from a disposal-oriented model to a revenue-generating valorization process, improving both environmental and economic performance. By reducing dependency on incineration and agricultural land spreading, it also addresses challenges associated with nutrient overload, emerging contaminants, and greenhouse gas emissions. The export of renewable thermal energy and the recovery of stable carbon in biochar further position the system as a contributor to local and national net zero emission goals.
The baseline configuration represents a traditional single-stage treatment facility without any energy recovery or thermal processing. It serves as a reference point for cost comparisons. This setup is the simplest in terms of infrastructure and does not include digesters or thermal units. However, it also incurs the highest operating expenses, estimated at approximately 0.715 million euros annually. These high costs are primarily driven by sludge disposal, which remains a major expense in the absence of volume-reducing or valorizing technologies.
Incorporating pyrolysis into the treatment system requires an investment of several million euros, reflecting the costs of sludge dryers, thermal reactors, flue gas treatment, and biochar handling infrastructure. For two-stage plants, which include AD and biogas treatment, the CAPEX increases by 7.8 million over the baseline, primarily due to digesters, gas engines, storage systems, and auxiliary energy recovery components (Table 17). When pyrolysis is also added to the two-stage configuration (AD-Pyrolysis), the total additional investment reaches 14.3 million.
Table 17.
CoS 5: Estimated capital investment.
Across all scenarios, the process plant infrastructure, including biological tanks, sludge pumps, clarifiers, digesters, dewatering units, and thermal treatment modules, is estimated to account for 50–70% of the total construction cost, depending on local conditions and ambition levels. The system boundaries for the scenarios evaluated in this pre-feasibility assessment include the following cost and revenue items: sludge disposal savings, CO2 removal credits, revenues from biochar and district heating sales, local heating costs, external sludge transport, software, and service and maintenance. The following items are excluded from the system boundary: civil works, land acquisition, financing costs, depreciation, and gate fees. These cost estimates are calculated at 2024 price levels (excluding VAT) and were provided directly by the CoS 5 partner and technology supplier.
The operational dynamics of these advanced scenarios vary considerably. Pyrolysis reduces the need for sludge disposal, resulting in lower associated costs. At the same time, it introduces increased maintenance and staff requirements. For pyrolysis, one full-time employee is generally needed due to the complexity of the system. Despite this, the overall operating expense for pyrolysis is estimated at 416,000 euros per year, lower than the baseline (Table 18).
Table 18.
CoS 5: Estimated operational expenditures.
The two-stage scenario that incorporates digestion alone (without pyrolysis) also shows a notable reduction in sludge volume and achieves a moderate energy recovery. Although its operating costs are slightly higher than the thermal options, it benefits from energy generation via gas engines.
The most cost-effective outcomes are seen in the configurations that combine digestion with pyrolysis. These achieve the lowest estimated operating costs of 299,000 euros per year by nearly eliminating sludge disposal fees and generating revenues from the sale of district heat and electricity.
4. Discussion
The techno-economic evaluation conducted in this study provides a comprehensive basis for identifying suitable combinations of waste feedstocks and nutrient recovery technologies through a techno-economic and market-oriented lens. Specifically, it provides comparative insights on capital expenditures (CAPEX), operational expenditures (OPEX), and nutrient recovery yields (N/P) across five CoSs with varied technological configurations and regional contexts. The collected data aim to inform decision-making on scaling and integrating nutrient recovery strategies adapted to the environmental and economic constraints of each region. The report met the main objective by consolidating data from five study cases—CoS 1 (Spain), CoS 2 (Latvia and Lithuania), CoSs 3 and 4 (Hungary and Slovakia, respectively), and CoS 5 (Denmark)—where various nutrient recovery technologies were piloted. A summary of the techno-economic aspects of the CoS technologies is provided in Table 19. To enable a more harmonized economic comparison across the five case studies, Table 19 also includes an additional column reporting the approximate OPEX cost per kilogram of N and P recovered for each technology. These figures should be interpreted with caution, as they reflect the current operational scale and TRL of each system and do not account for the additional value streams generated by each technology beyond nutrient recovery alone. As demonstrated by CoS 5, system integration (for example, combining pyrolysis with anaerobic digestion) can substantially reduce unit nutrient recovery costs, underscoring the importance of evaluating these technologies within their broader process and economic context.
Table 19.
Summary of the techno-economic aspects of CoS technologies.
The benchmarking analysis confirmed that the five case studies cover a wide spectrum of technological maturity, ranging from fully commercial solutions (CoS 1 and CoS 2, both at TRL 9) to advanced pilot configurations (CoS 3, TRL 7), early-stage biological systems (CoS 4, TRL 4–5), and pre-feasibility assessments (CoS 5). This diversity is consistent with the NENUPHAR project’s Innovation Action mandate under the Horizon Europe call HORIZON-CL6-2022-ZEROPOLLUTION-01-02, which targets the progression of nutrient recovery technologies from TRL 4–5 to TRL 6–8. In addition, the benchmarking analysis revealed that a wide array of nutrient recovery technologies is commercially available, ranging from BNR, stripping/absorption, membrane-based systems (UF/RO), and chemical precipitation (such as struvite) to thermal treatments such as hydrothermal processes. These technologies vary in complexity, efficiency, maturity, and cost. Technologies like struvite precipitation and stripping showed high maturity and recovery performance. For instance, commercial systems such as AirPrex® or PEARL™ deliver N recovery efficiencies of up to 90% and P recovery above 80%, with OPEX ranging between 0.2 and 0.7 €/kg of sludge treated. In contrast, emerging biological or hybrid methods (e.g., algae-based systems or advanced oxidation) present innovative pathways with potential, but currently require higher energy or material inputs and exhibit more limited scalability. Struvite precipitation emerges as a frequently adopted method in the literature for simultaneous recovery of N and P; however, none of the CoSs described in this report actually use struvite precipitation as their primary recovery method.
From a techno-economic perspective, the analysis confirmed that nutrient recovery can be achieved with reasonable investment levels and good operational feasibility in decentralized or semi-centralized setups (Table 19). CoS 3 (whey valorization via UF/RO and ozonation) exhibits one of the most balanced profiles, with a CAPEX of €311,395 and an OPEX of €29,721/year, recovering 718 kg N and 497 kg P annually. This results in a unit production cost of approximately €1.19 per kg of ricotta, a metric specific to the dairy industry context of this CoS. In contrast, CoS 4 (dairy wastewater algae system) has a lower CAPEX (€18,277) but a higher unit cost relative to its small scale, leading to a production cost of €4.2 per kg of algae. CoS 1, based on stripping, shows an OPEX of €149,352.30 for 33,000 tonnes of raw digestate, which equals around €0.005/kg liquid digestate treated, showing strong competitiveness in cost efficiency and recovery (via ammonium sulphate). Meanwhile, CoS 5’s pyrolysis system processes 6011 tonnes/year of wet sludge (1172 tonnes/year on a dry basis), with a CAPEX of €6.5 million for the pyrolysis unit alone (€14.3 million for the full AD + pyrolysis configuration) and a treatment cost of €1.60/kg, demonstrating higher upfront investment but enabling sludge minimization and resource recovery in a carbonized form. CoS 2 is an example of high initial CAPEX (€1.8 million) but low OPEX (€56 k per year), leading to a cost of €0.04 per kg of waste treated.
When assessed on a harmonized €/kg nutrient recovered basis, commercially established technologies (CoS 1 and CoS 2) demonstrate significantly lower unit costs compared to more innovative approaches (CoS 3, CoS 4, and CoS 5). However, this metric alone does not fully reflect the economic potential of the latter, whose viability is better understood when considering their multi-product value streams, avoided waste disposal costs, and the expected cost reductions associated with scale-up as they advance along the TRL scale. These findings reinforce the importance of adopting a holistic techno-economic perspective when evaluating nutrient recovery technologies at early stages of development.
Figure 7a provides a visual comparison of the normalized CAPEX across the five case studies, expressed as euros per tonne per year of waste treatment capacity. CoS 1 demonstrates by far the highest capital efficiency (€18.8/tonne/year), reflecting its large operational scale and add-on nature within an existing biogas plant, while CoS 2 shows the highest normalized CAPEX (€1264.0/tonne/year) due to the significant civil infrastructure investment required for the composting facility. Figure 7b illustrates the OPEX cost per kilogram of nitrogen recovered, further confirming the cost-competitiveness of commercially established technologies (CoS 1 and CoS 2) relative to the more innovative approaches, whose higher unit costs reflect their early stage of development and multi-product value streams rather than intrinsic economic inefficiency.
Figure 7.
(a) Normalized CAPEX (€ per tonne/year of waste treatment capacity) across the five nutrient recovery case studies (logarithmic scale). CoS 4 is expressed in €/m3/year due to the volumetric reporting basis used at lab scale. (b) OPEX cost per kg of nitrogen recovered (€/kg N) across the five case studies (logarithmic scale). Note: Values reflect the current operational scale and TRL of each system. Higher values for CoS 3, CoS 4, and CoS 5 reflect early-stage operation and multi-product value streams not fully captured by this single metric. See Table 19 for full context.
From a sustainability standpoint, the technologies assessed offer meaningful advantages over conventional fertilizer production by recovering N and P from waste streams, reducing dependence on energy-intensive industrial processes such as Haber–Bosch synthesis [9] and finite phosphate rock extraction [10]. A comprehensive life cycle assessment comparing these nutrient recovery pathways against conventional fertilizer production is planned as a subsequent task within the NENUPHAR project, building upon the techno-economic data presented in this study.
When comparing the benchmarked technologies to those implemented in the demos, it becomes evident that each site favours tailored and integrated solutions that respond to local feedstock characteristics and infrastructure availability. For instance, although membrane systems and struvite precipitation are well documented in market-ready technologies, the CoSs prioritized hybrid solutions (e.g., thermal pretreatments in CoS 1, or bioremediation and post-filtration in CoS 4) to align with resource circularity and energy integration goals. Importantly, the exclusion of struvite from real demo applications highlights potential operational or contextual barriers to its adoption (such as the need for controlled pH, magnesium dosing, or sludge compatibility) that limit its practicality despite theoretical advantages.
Furthermore, the implementation potential of nutrient recovery technologies across EU regions is strongly context-dependent, with local feedstock availability, waste disposal costs, energy prices, and the existence of markets for recovered nutrient products acting as key enabling or limiting factors. No single technology emerged as universally optimal; rather, the evidence from the five case studies supports a portfolio approach in which nutrient recovery solutions are selected and adapted to the specific operational, economic, and regulatory conditions of each region. These findings highlight the need for flexible regulatory and financial instruments at EU level that can accommodate the diversity of waste streams, technological maturities, and regional market conditions present across member states.
It should be noted that policy instruments such as subsidies, waste disposal fees, gate fees, and carbon pricing mechanisms, which vary significantly across the European regions represented in this study, were deliberately excluded from the present techno-economic assessment, which focuses exclusively on technology-level costs. The influence of these policy drivers on the economic feasibility of nutrient recovery systems in each regional context represents an important avenue for future research.
5. Conclusions
This study successfully addresses the research gap identified in the literature regarding the limited availability of comparative techno-economic assessments of nutrient recovery technologies across different industrial sectors. By analyzing five demonstration cases representing diverse waste streams, technological approaches, and geographical contexts within Europe, the study provides a cross-sectoral perspective on the economic feasibility of nutrient recovery systems. Nevertheless, further research is required to evaluate long-term operational performance, scale-up effects, market acceptance of recovered products, and the influence of evolving regulatory frameworks on the deployment of these technologies.
From a methodological standpoint, this study introduces two harmonized economic metrics that facilitate cross-case comparison: the OPEX cost per kilogram of nitrogen recovered (€/kg N) and the normalized CAPEX expressed as euros per tonne per year of waste treatment capacity. These metrics reveal that commercially established technologies (CoS 1 and CoS 2, both at TRL 9) demonstrate significantly lower unit costs (€0.99/kg N and €2.43/kg N respectively) compared to more innovative approaches (CoS 3, CoS 4, and CoS 5), whose higher unit costs reflect their early stage of development and multi-product value streams rather than intrinsic economic inefficiency. From an environmental perspective, all five technologies offer meaningful advantages over conventional fertilizer production by recovering N and P from waste streams, reducing dependence on energy-intensive industrial processes such as Haber–Bosch synthesis and finite phosphate rock extraction. The implementation potential of these technologies across EU regions is strongly context-dependent, with local feedstock availability, waste disposal costs, energy prices, and market conditions for recovered products acting as key enabling or limiting factors, underscoring the need for site-specific technology selection and flexible regulatory frameworks at EU level.
Overall, the study demonstrates that nutrient recovery systems can be both environmentally and economically viable when designed with site-specific considerations. The results indicate that N recovery is prioritized in most setups (especially CoS 1 and CoS 3), while P tends to be co-recovered or retained in solid residues (CoS 5, CoS 4). The diverse range of technological pathways reflected in the demos enriches the scope for further scale-up and cross-regional adaptation of nutrient recovery strategies.
Author Contributions
Conceptualization, C.A.-B.; methodology, C.A.-B.; validation, C.A.-B., T.D.M. and C.D.-S.; formal analysis, C.A.-B.; investigation, C.A.-B., T.D.M. and C.D.-S.; resources, B.P.-B., A.C.-M. and C.A.-B.; data curation, C.A.-B.; writing—original draft preparation, C.A.-B., T.D.M. and C.D.-S.; writing—review and editing, C.A.-B., B.P.-B. and A.C.-M.; visualization, T.D.M., C.D.-S. and C.A.-B.; supervision, C.A.-B.; project administration, B.P.-B.; funding acquisition, B.P.-B. All authors have read and agreed to the published version of the manuscript.
Funding
The authors would like to express their sincere gratitude to the representatives of all partner institutions that contributed data and expertise to this study: GESTCOM-POST (Spain), ZEMNIEKU SAEIMA (Latvia), SLOVENSKA POLNOHOSPODARSKA UNIVERZITA V NITRE (Slovakia), SZECHENYI ISTVAN EGYETEM (Hungary), and BORNHOLMS SPILDEVAND A/S (Denmark). Their collaboration and commitment were essential to the development of this work. The authors also wish to acknowledge the valuable contributions of former staff members of CIRCE who participated in earlier stages of this research. This work was supported by the European Commission under Grant Agreement No. 101082169. The views and opinions expressed are those of the authors only and do not necessarily reflect those of the European Union or the European Commission. Neither the European Union nor the granting authority can be held responsible for them.
Institutional Review Board Statement
Not applicable.
Informed Consent Statement
Not applicable.
Data Availability Statement
The original contributions presented in this study are included in the article. Further inquiries can be directed to the corresponding author.
Conflicts of Interest
The authors declare no conflicts of interest.
Abbreviations
The following abbreviations are used in this manuscript:
| AD | Anaerobic digestion |
| BBF | Bio-based fertilizer |
| BES | Bioelectrochemical system |
| CAPEX | Capital Expenditures |
| CoS | Case of Study |
| DS | Dry Solid |
| EU | European Union |
| N | Nitrogen |
| NBSs | Natural-based solutions |
| NF | Nanofiltration |
| OPEX | Operating Expenditures |
| P | Phosphorus |
| RO | Reverse Osmosis |
| TRL | Technology Readiness Levels |
| UF | Ultrafiltration |
| VAT | Value-Added Tax |
| WWTPs | Wastewater treatment plants |
Appendix A
Figure A1.
First section of the data collection instrument.
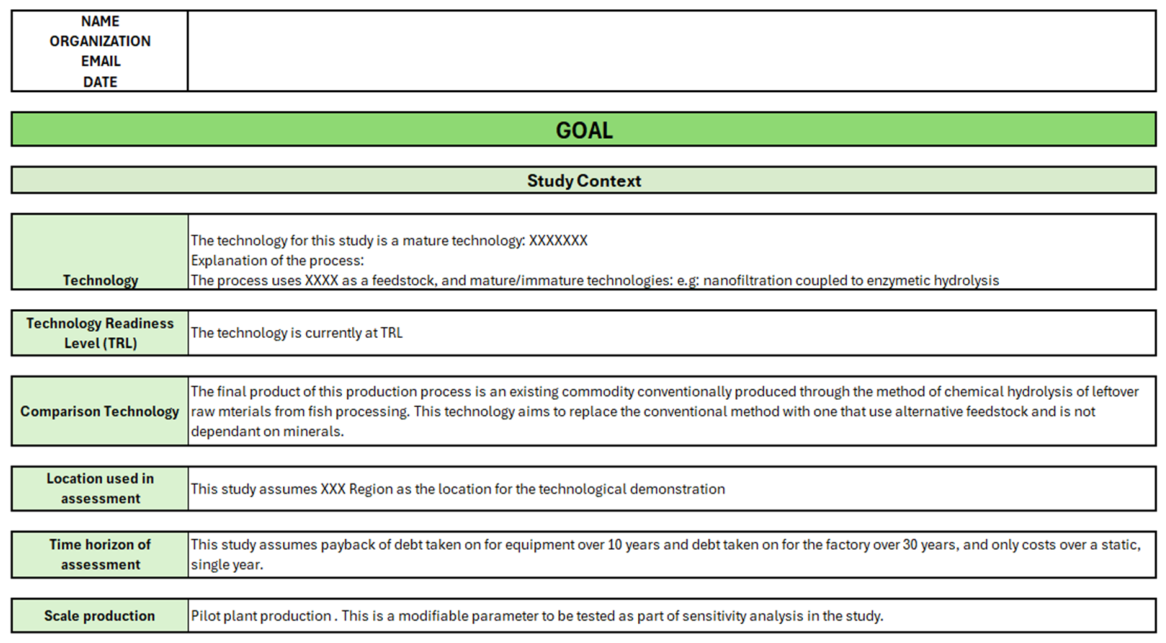
Figure A2.
Section 3 template of the data collection instrument, “Mass and Energy and Materials”.
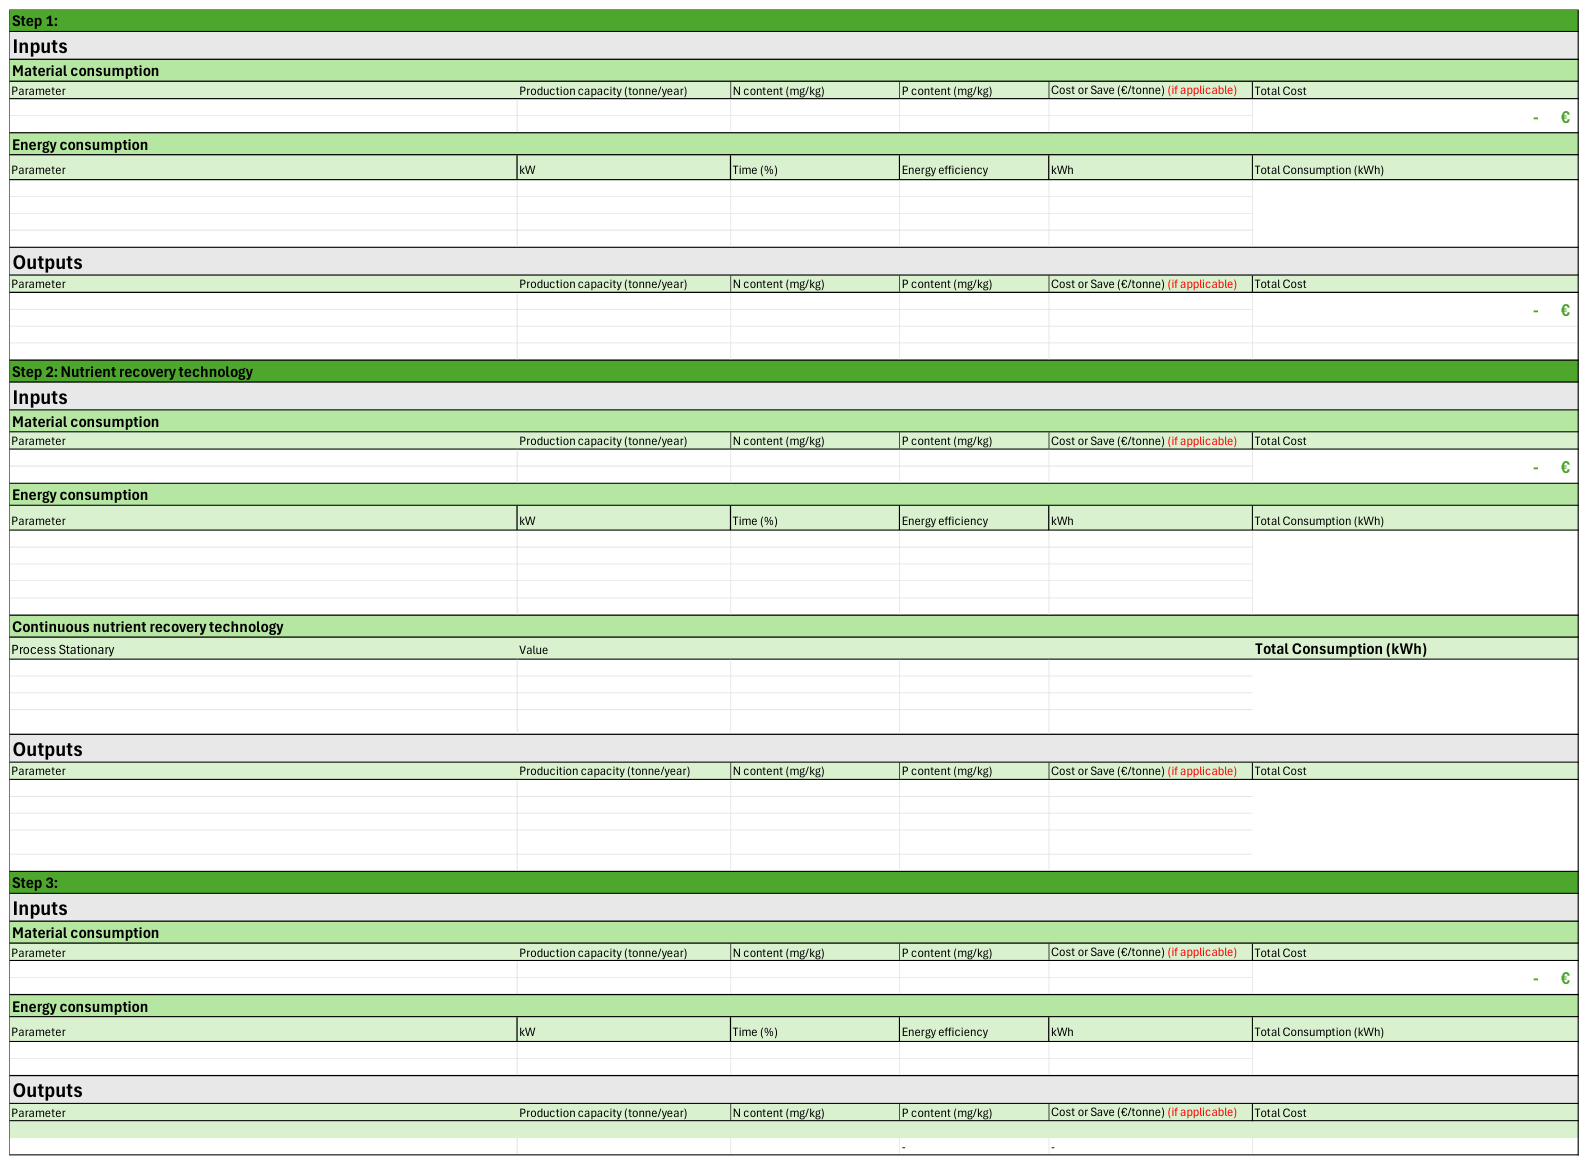
Figure A3.
Section 4 template of the data collection instrument, “Economics”.
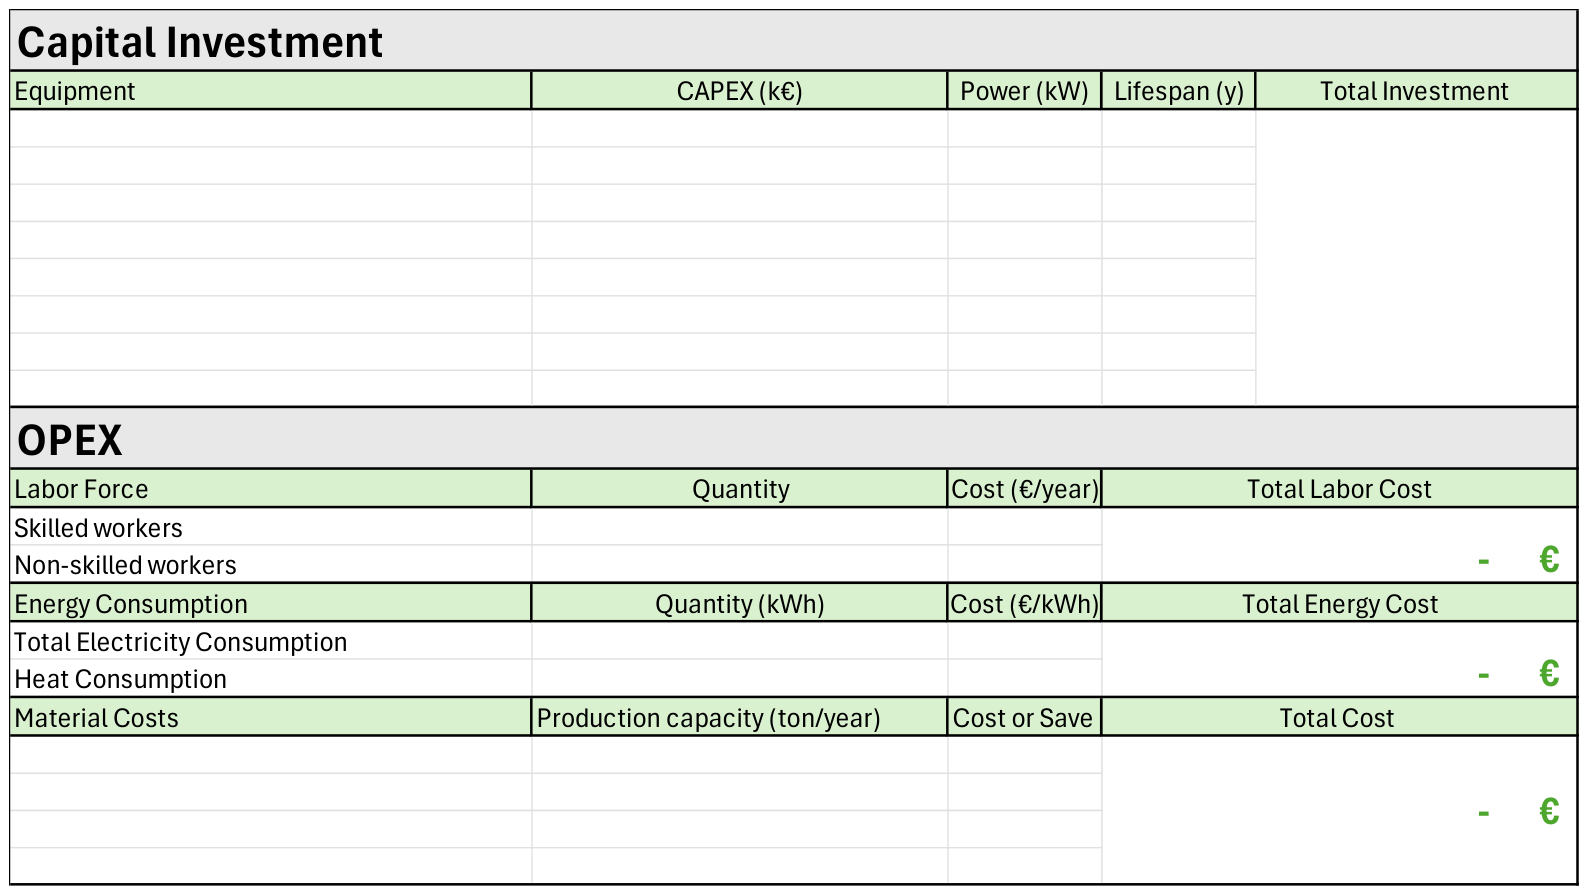
References
- Hayat, S.; Li, P.; Menhas, S.; Liu, W.; Hayat, K. Exploring the Nutrient Nexus in Environmental Systems: Nitrogen and Phosphorus Cycling, Removal, Recovery, and Management. Environ. Res. 2025, 284, 122162. [Google Scholar] [CrossRef] [Scilit] [PubMed]
- Kurniawan, T.A.; Bustos-Terrones, Y.A.; Loaiza, J.G.; Dissanayake, K.K.; Onn, C.W.; Abass, K.S.; Jumaniyozov, K.; Oktriono, K.; Wong, W.K.; Kusworo, T.D.; et al. Applying Nutrient Recovery from Unused Wastewater to Overcome Fertilizer Shortage for Global Food Security. J. Environ. Manag. 2025, 394, 127543. [Google Scholar] [CrossRef] [Scilit] [PubMed]
- Theregowda, R.B.; González-Mejía, A.M.; Ma, X.; Garland, J. Nutrient Recovery from Municipal Wastewater for Sustainable Food Production Systems: An Alternative to Traditional Fertilizers. Environ. Eng. Sci. 2019, 36, 833–842. [Google Scholar] [CrossRef] [Scilit] [PubMed]
- Rizzioli, F.; Bertasini, D.; Bolzonella, D.; Frison, N.; Battista, F. A Critical Review on the Techno-Economic Feasibility of Nutrients Recovery from Anaerobic Digestate in the Agricultural Sector. Sep. Purif. Technol. 2023, 306, 122690. [Google Scholar] [CrossRef] [Scilit]
- Frank, D. Summary of R&D Project Policy Proposals on Nutrient Circular Economy, Context Regulation and Regulatory Aspects; European Sustainable Phosphorus Platform (ESPP): Brussels, Belgium, 2024; pp. 1–5. Available online: www.phosphorusplatform.eu (accessed on 24 June 2026).
- Reichelt-Brushett, A. Marine Pollution: Monitoring, Management and Mitigation; Reichelt-Brushett, A., Ed.; Springer Nature: Cham, Switzerland, 2023. [Google Scholar]
- Śniatała, B.; Sobotka, D.; Ippolito, M.; Giannici, F.; Mannina, G.; Mąkinia, J. Integration of Struvite Precipitation and Membrane Stripping in a Single Reactor for Dual Nutrient Recovery: A Feasibility Assessment with Synthetic Wastewater. Environ. Technol. Innov. 2026, 41, 104686. [Google Scholar] [CrossRef] [Scilit]
- Motshekga, S.C. Nutrient Recovery from Wastewater Using Bioelectrochemical Systems: A Review on Nitrogen and Phosphorus Removal. J. Water Process Eng. 2025, 79, 109031. [Google Scholar] [CrossRef] [Scilit]
- Krein, D.D.C.; Rosseto, M.; Cemin, F.; Massuda, L.A.; Dettmer, A. Recent Trends and Technologies for Reduced Environmental Impacts of Fertilizers: A Review. Int. J. Environ. Sci. Technol. 2023, 20, 12903–12918. [Google Scholar] [CrossRef] [Scilit]
- Hasler, K.; Bröring, S.; Omta, S.W.F.; Olfs, H.W. Life Cycle Assessment (LCA) of Different Fertilizer Product Types. Eur. J. Agron. 2015, 69, 41–51. [Google Scholar] [CrossRef] [Scilit]
- Liu, Z.G.; Min, X.B.; Feng, F.; Tang, X.; Li, W.C.; Peng, C.; Gao, T.Y.; Chai, X.L.; Tang, C.J. Development and Simulation of a Struvite Crystallization Fluidized Bed Reactor with Enhanced External Recirculation for Phosphorous and Ammonium Recovery. Sci. Total Environ. 2021, 760, 144311. [Google Scholar] [CrossRef] [Scilit] [PubMed]
- Kim, E.J.; Kim, H.; Lee, E. Influence of Ammonia Stripping Parameters on the Efficiency and Mass Transfer Rate of Ammonia Removal. Appl. Sci. 2021, 11, 441. [Google Scholar] [CrossRef] [Scilit]
- Malovanyy, A.; Sakalova, H.; Yatchyshyn, Y.; Plaza, E.; Malovanyy, M. Concentration of Ammonium from Municipal Wastewater Using Ion Exchange Process. Desalination 2013, 329, 93–102. [Google Scholar] [CrossRef] [Scilit]
- Isabel San-Martín, M.; Mateos, R.; Carracedo, B.; Escapa, A.; Morán, A. Pilot-Scale Bioelectrochemical System for Simultaneous Nitrogen and Carbon Removal in Urban Wastewater Treatment Plants. J. Biosci. Bioeng. 2018, 126, 758–763. [Google Scholar] [CrossRef] [Scilit] [PubMed]
- Zhang, F.; Li, J.; He, Z. A New Method for Nutrients Removal and Recovery from Wastewater Using a Bioelectrochemical System. Bioresour. Technol. 2014, 166, 630–634. [Google Scholar] [CrossRef] [Scilit] [PubMed]
- Sengupta, S.; Nawaz, T.; Beaudry, J. Nitrogen and Phosphorus Recovery from Wastewater. Curr. Pollut. Rep. 2015, 1, 155–166. [Google Scholar] [CrossRef] [Scilit]
- Mishra, S.; Singh, V.; Cheng, L.; Hussain, A.; Ormeci, B. Nitrogen Removal from Wastewater: A Comprehensive Review of Biological Nitrogen Removal Processes, Critical Operation Parameters and Bioreactor Design. J. Environ. Chem. Eng. 2022, 10, 107387. [Google Scholar] [CrossRef] [Scilit]
- Ansari, A.J.; Hai, F.I.; Price, W.E.; Drewes, J.E.; Nghiem, L.D. Forward Osmosis as a Platform for Resource Recovery from Municipal Wastewater—A Critical Assessment of the Literature. J. Memb. Sci. 2017, 529, 195–206. [Google Scholar] [CrossRef] [Scilit]
- Göncü, S.; Şimşek Uygun, B.; Atakan, S. Nitrogen and Phosphorus Removal from Wastewater Using Chlorella Vulgaris and Scenedesmus Quadricauda Microalgae with a Batch Bioreactor. Int. J. Environ. Sci. Technol. 2025, 22, 11877–11892. [Google Scholar] [CrossRef] [Scilit]
- Acién Fernández, F.G.; Gómez-Serrano, C.; Fernández-Sevilla, J.M. Recovery of Nutrients From Wastewaters Using Microalgae. Front. Sustain. Food Syst. 2018, 2, 59. [Google Scholar] [CrossRef] [Scilit]
- Pimenta-Ocampo, M.; Gascó, G.; Méndez, A.; Otten, W.; Sakrabani, R. Pyrolysis or Hydrothermal Carbonisation for Anaerobic-Digested Sewage Sludge? A Comparison of Pyrochar and Hydrochar Structure and Stability. Biomass Convers. Biorefin. 2024, 14, 29303–29316. [Google Scholar] [CrossRef] [Scilit]
- Cantrell, K.B.; Hunt, P.G.; Uchimiya, M.; Novak, J.M.; Ro, K.S. Impact of Pyrolysis Temperature and Manure Source on Physicochemical Characteristics of Biochar. Bioresour. Technol. 2012, 107, 419–428. [Google Scholar] [CrossRef] [Scilit] [PubMed]
- Szkadłubowicz, K.; Mikusińska, J.; Pozarlik, A.; Wilk, M. Hydrothermal Treatment of Sewage Sludge Under Different Process Conditions with a Focus on Energy Properties and Resource Recovery. Energies 2025, 18, 6071. [Google Scholar] [CrossRef] [Scilit]
- Zhu, Y.; Zhai, Y.; Li, S.; Liu, X.; Wang, B.; Liu, X.; Fan, Y.; Shi, H.; Li, C.; Zhu, Y. Thermal treatment of sewage sludge: A comparative review of the conversion principle, recovery methods and bioavailability-predicting of phosphorus. Chemosphere 2022, 288, 132474. [Google Scholar] [CrossRef] [Scilit] [PubMed]
- Robles, Á.; Aguado, D.; Barat, R.; Borrás, L.; Bouzas, A.; Giménez, J.B.; Martí, N.; Ribes, J.; Ruano, M.V.; Serralta, J.; et al. New Frontiers from Removal to Recycling of Nitrogen and Phosphorus from Wastewater in the Circular Economy. Bioresour. Technol. 2020, 300, 122673. [Google Scholar] [CrossRef] [Scilit] [PubMed]
- Kundu, S.; Pramanik, B.K.; Halder, P.; Patel, S.; Ramezani, M.; Khairul, M.A.; Marzbali, M.H.; Paz-Ferreiro, J.; Crosher, S.; Short, G.; et al. Source and Central Level Recovery of Nutrients from Urine and Wastewater: A State-of-Art on Nutrients Mapping and Potential Technological Solutions. J. Environ. Chem. Eng. 2022, 10, 107146. [Google Scholar] [CrossRef] [Scilit]
- Ye, Y.; Ngo, H.H.; Guo, W.; Chang, S.W.; Nguyen, D.D.; Zhang, X.; Zhang, J.; Liang, S. Nutrient Recovery from Wastewater: From Technology to Economy. Bioresour. Technol. Rep. 2020, 11, 100425. [Google Scholar] [CrossRef] [Scilit]
- Mayor, Á.; Vinardell, S.; Ganesan, K.; Bacardí, C.; Cortina, J.L.; Valderrama, C. Life-Cycle Assessment and Techno-Economic Evaluation of the Value Chain in Nutrient Recovery from Wastewater Treatment Plants for Agricultural Application. Sci. Total Environ. 2023, 892, 164452. [Google Scholar] [CrossRef] [Scilit] [PubMed]
- Romero-García, J.M.; González-López, C.V.; Brindley, C.; Fernández-Sevilla, J.M.; Acién-Fernández, F.G. Simulation and Techno-Economical Evaluation of a Microalgal Biofertilizer Production Process. Biology 2022, 11, 1359. [Google Scholar] [CrossRef] [Scilit] [PubMed]
- Rey-Martínez, N.; Torres-Sallan, G.; Morales, N.; Serra, E.; Bisschops, I.; van Eekert, M.H.A.; Borràs, E.; Sanchis, S. Combination of Technologies for Nutrient Recovery from Wastewater: A Review. Clean. Waste Syst. 2024, 7, 100139. [Google Scholar] [CrossRef] [Scilit]
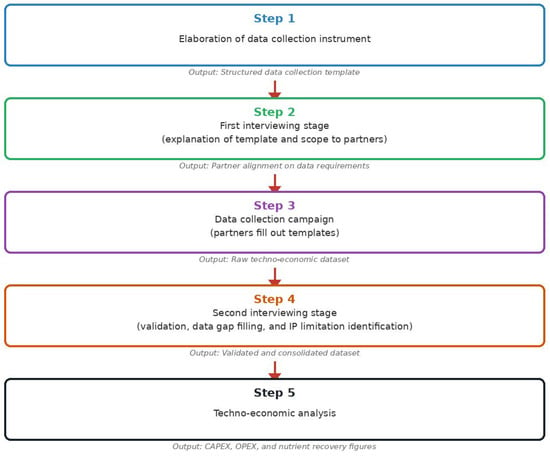
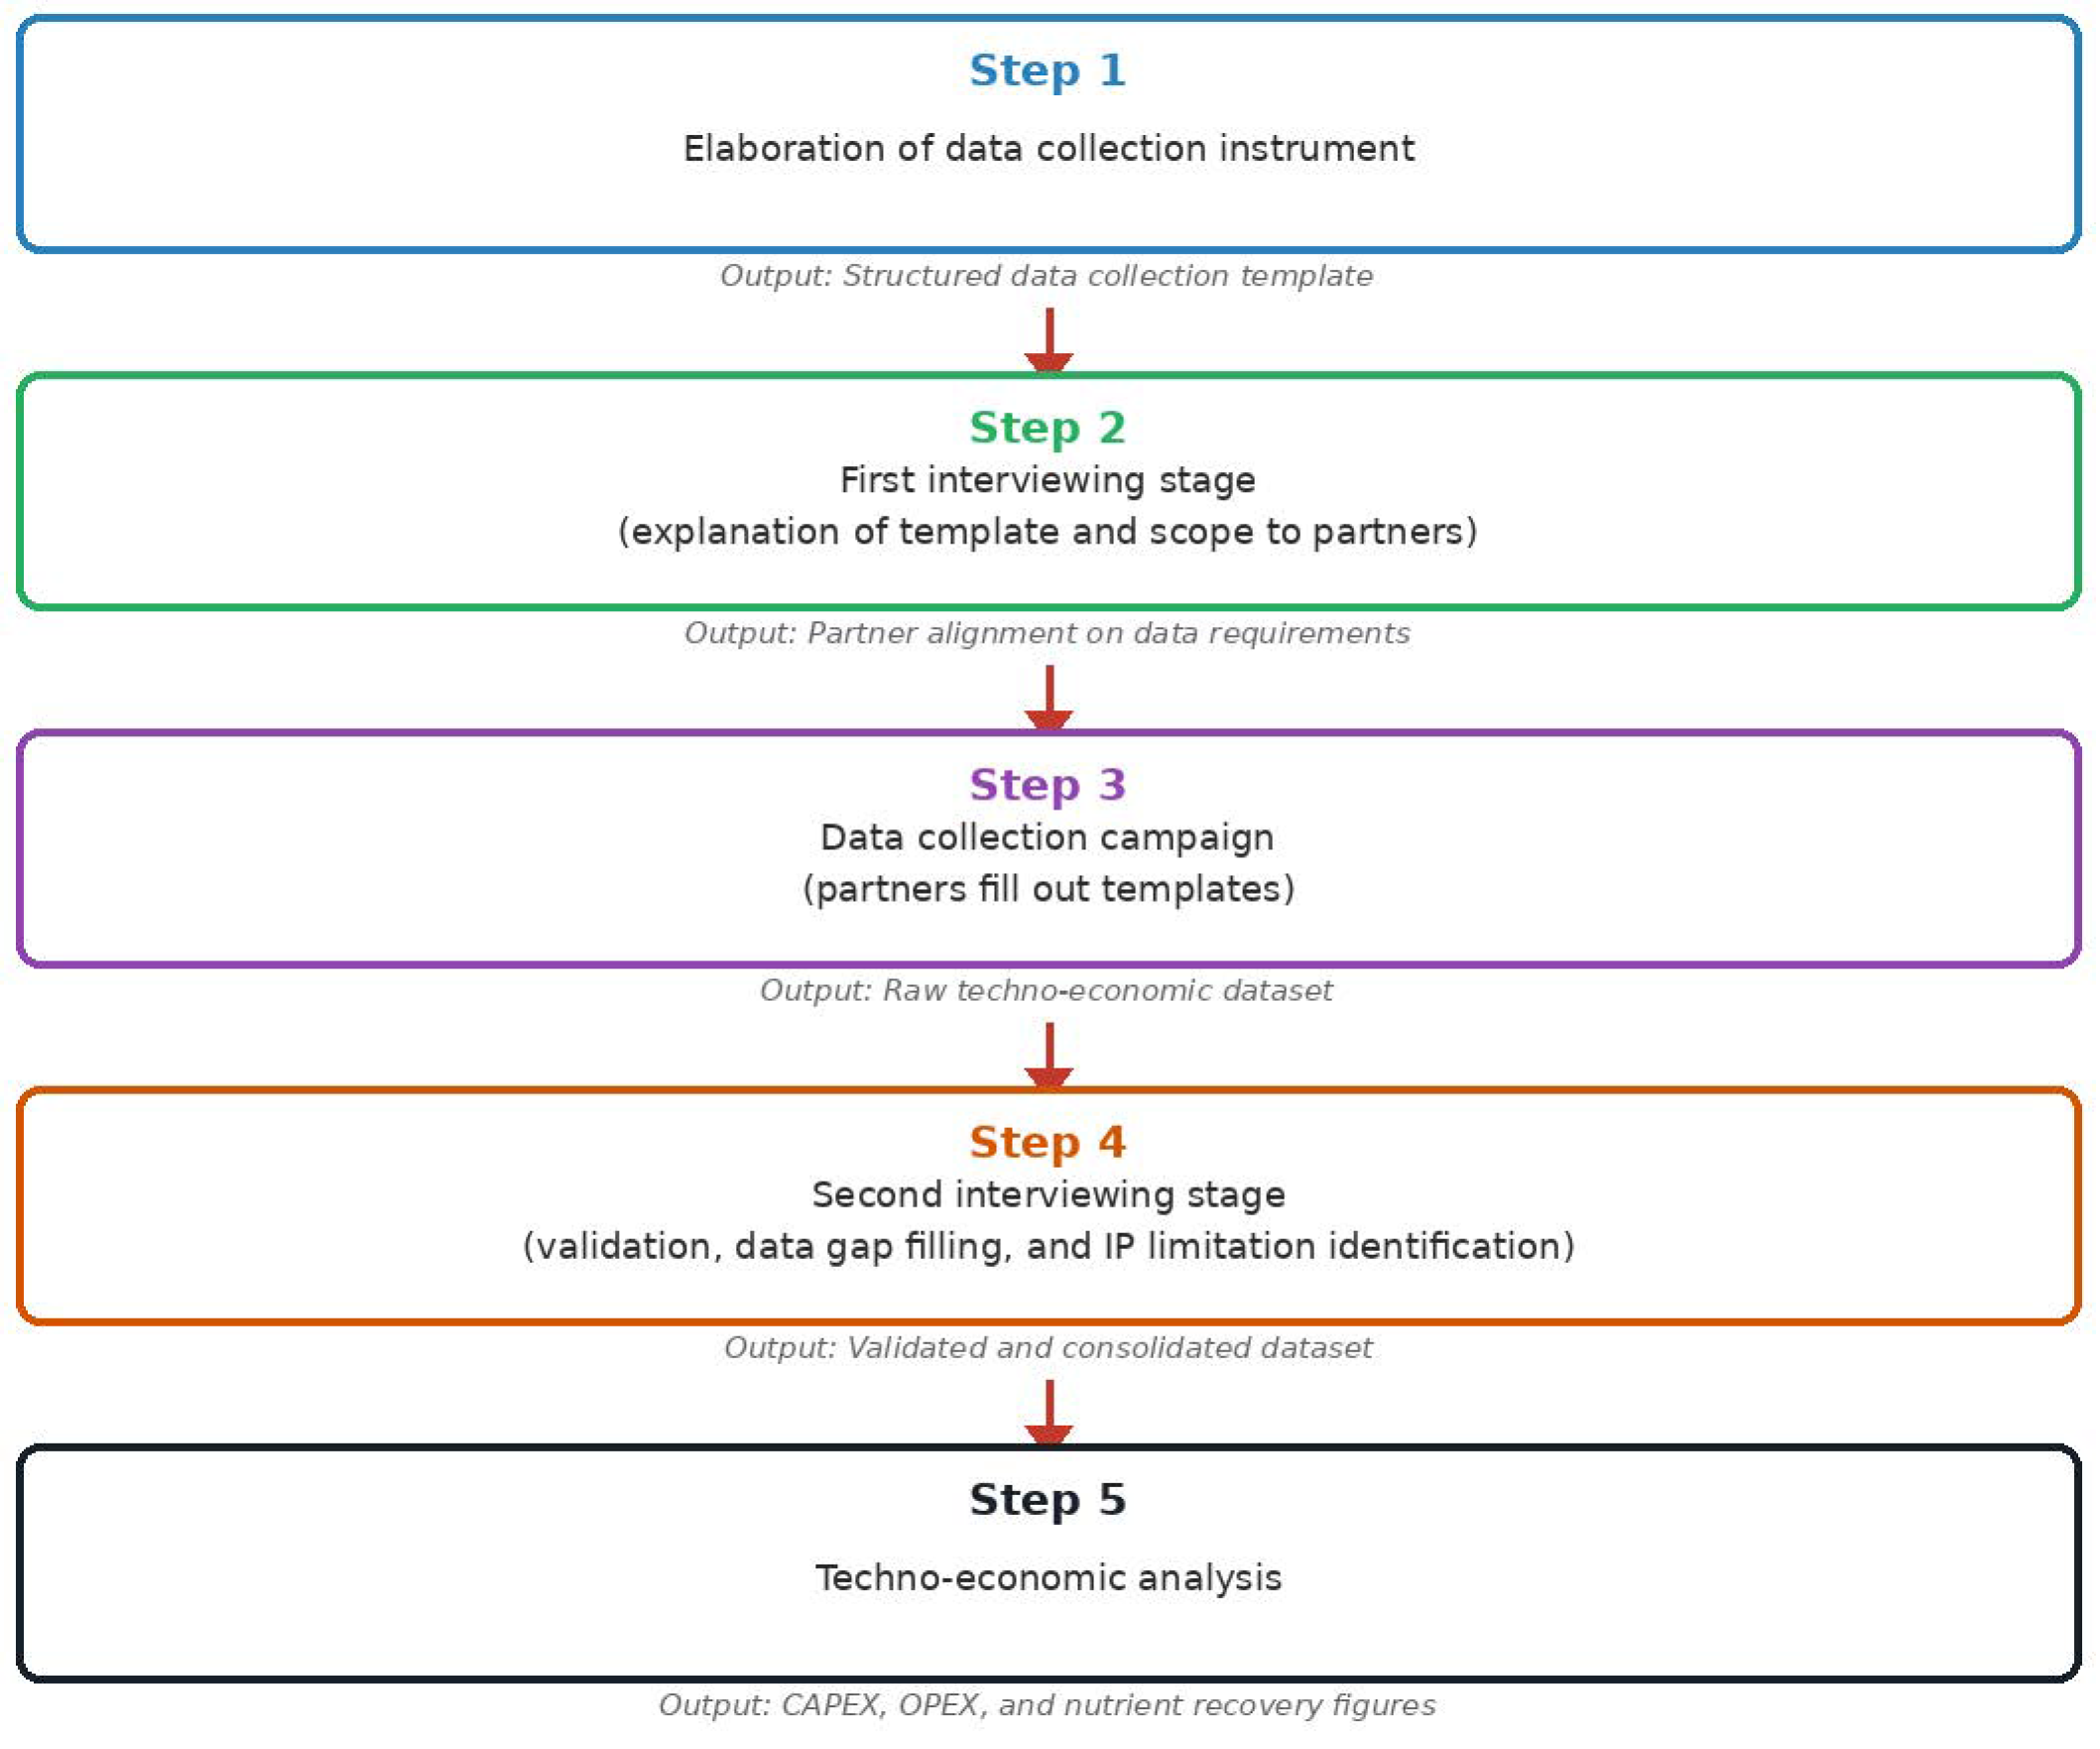
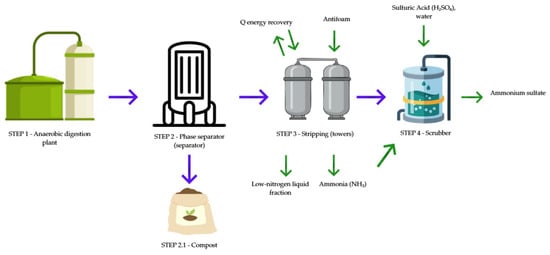
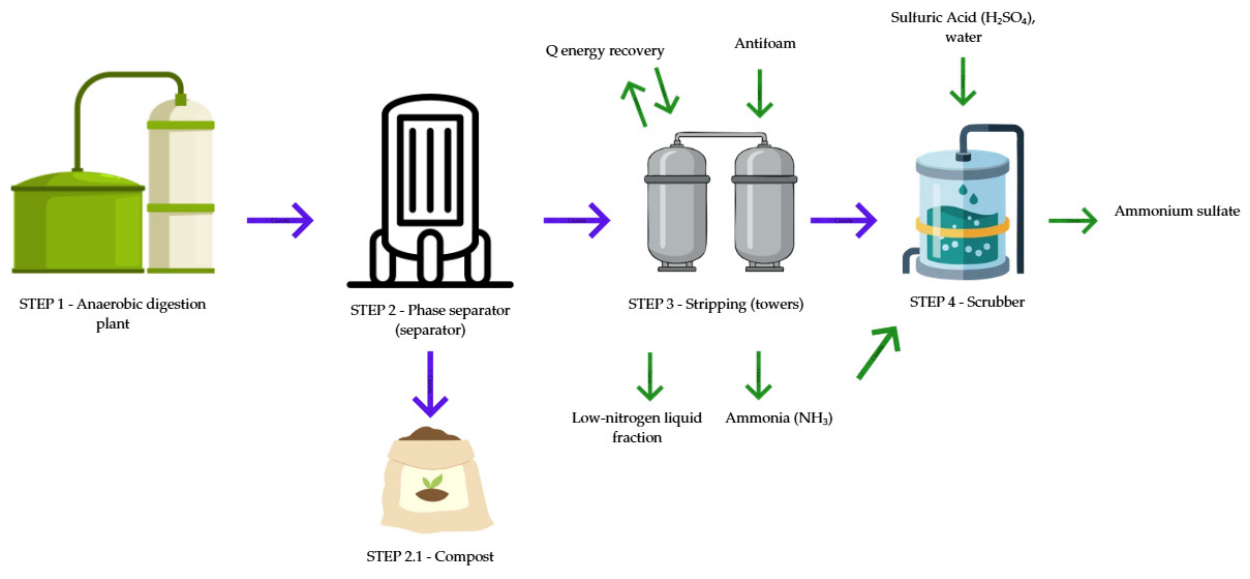
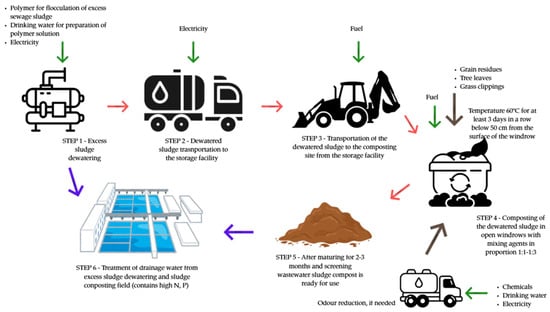
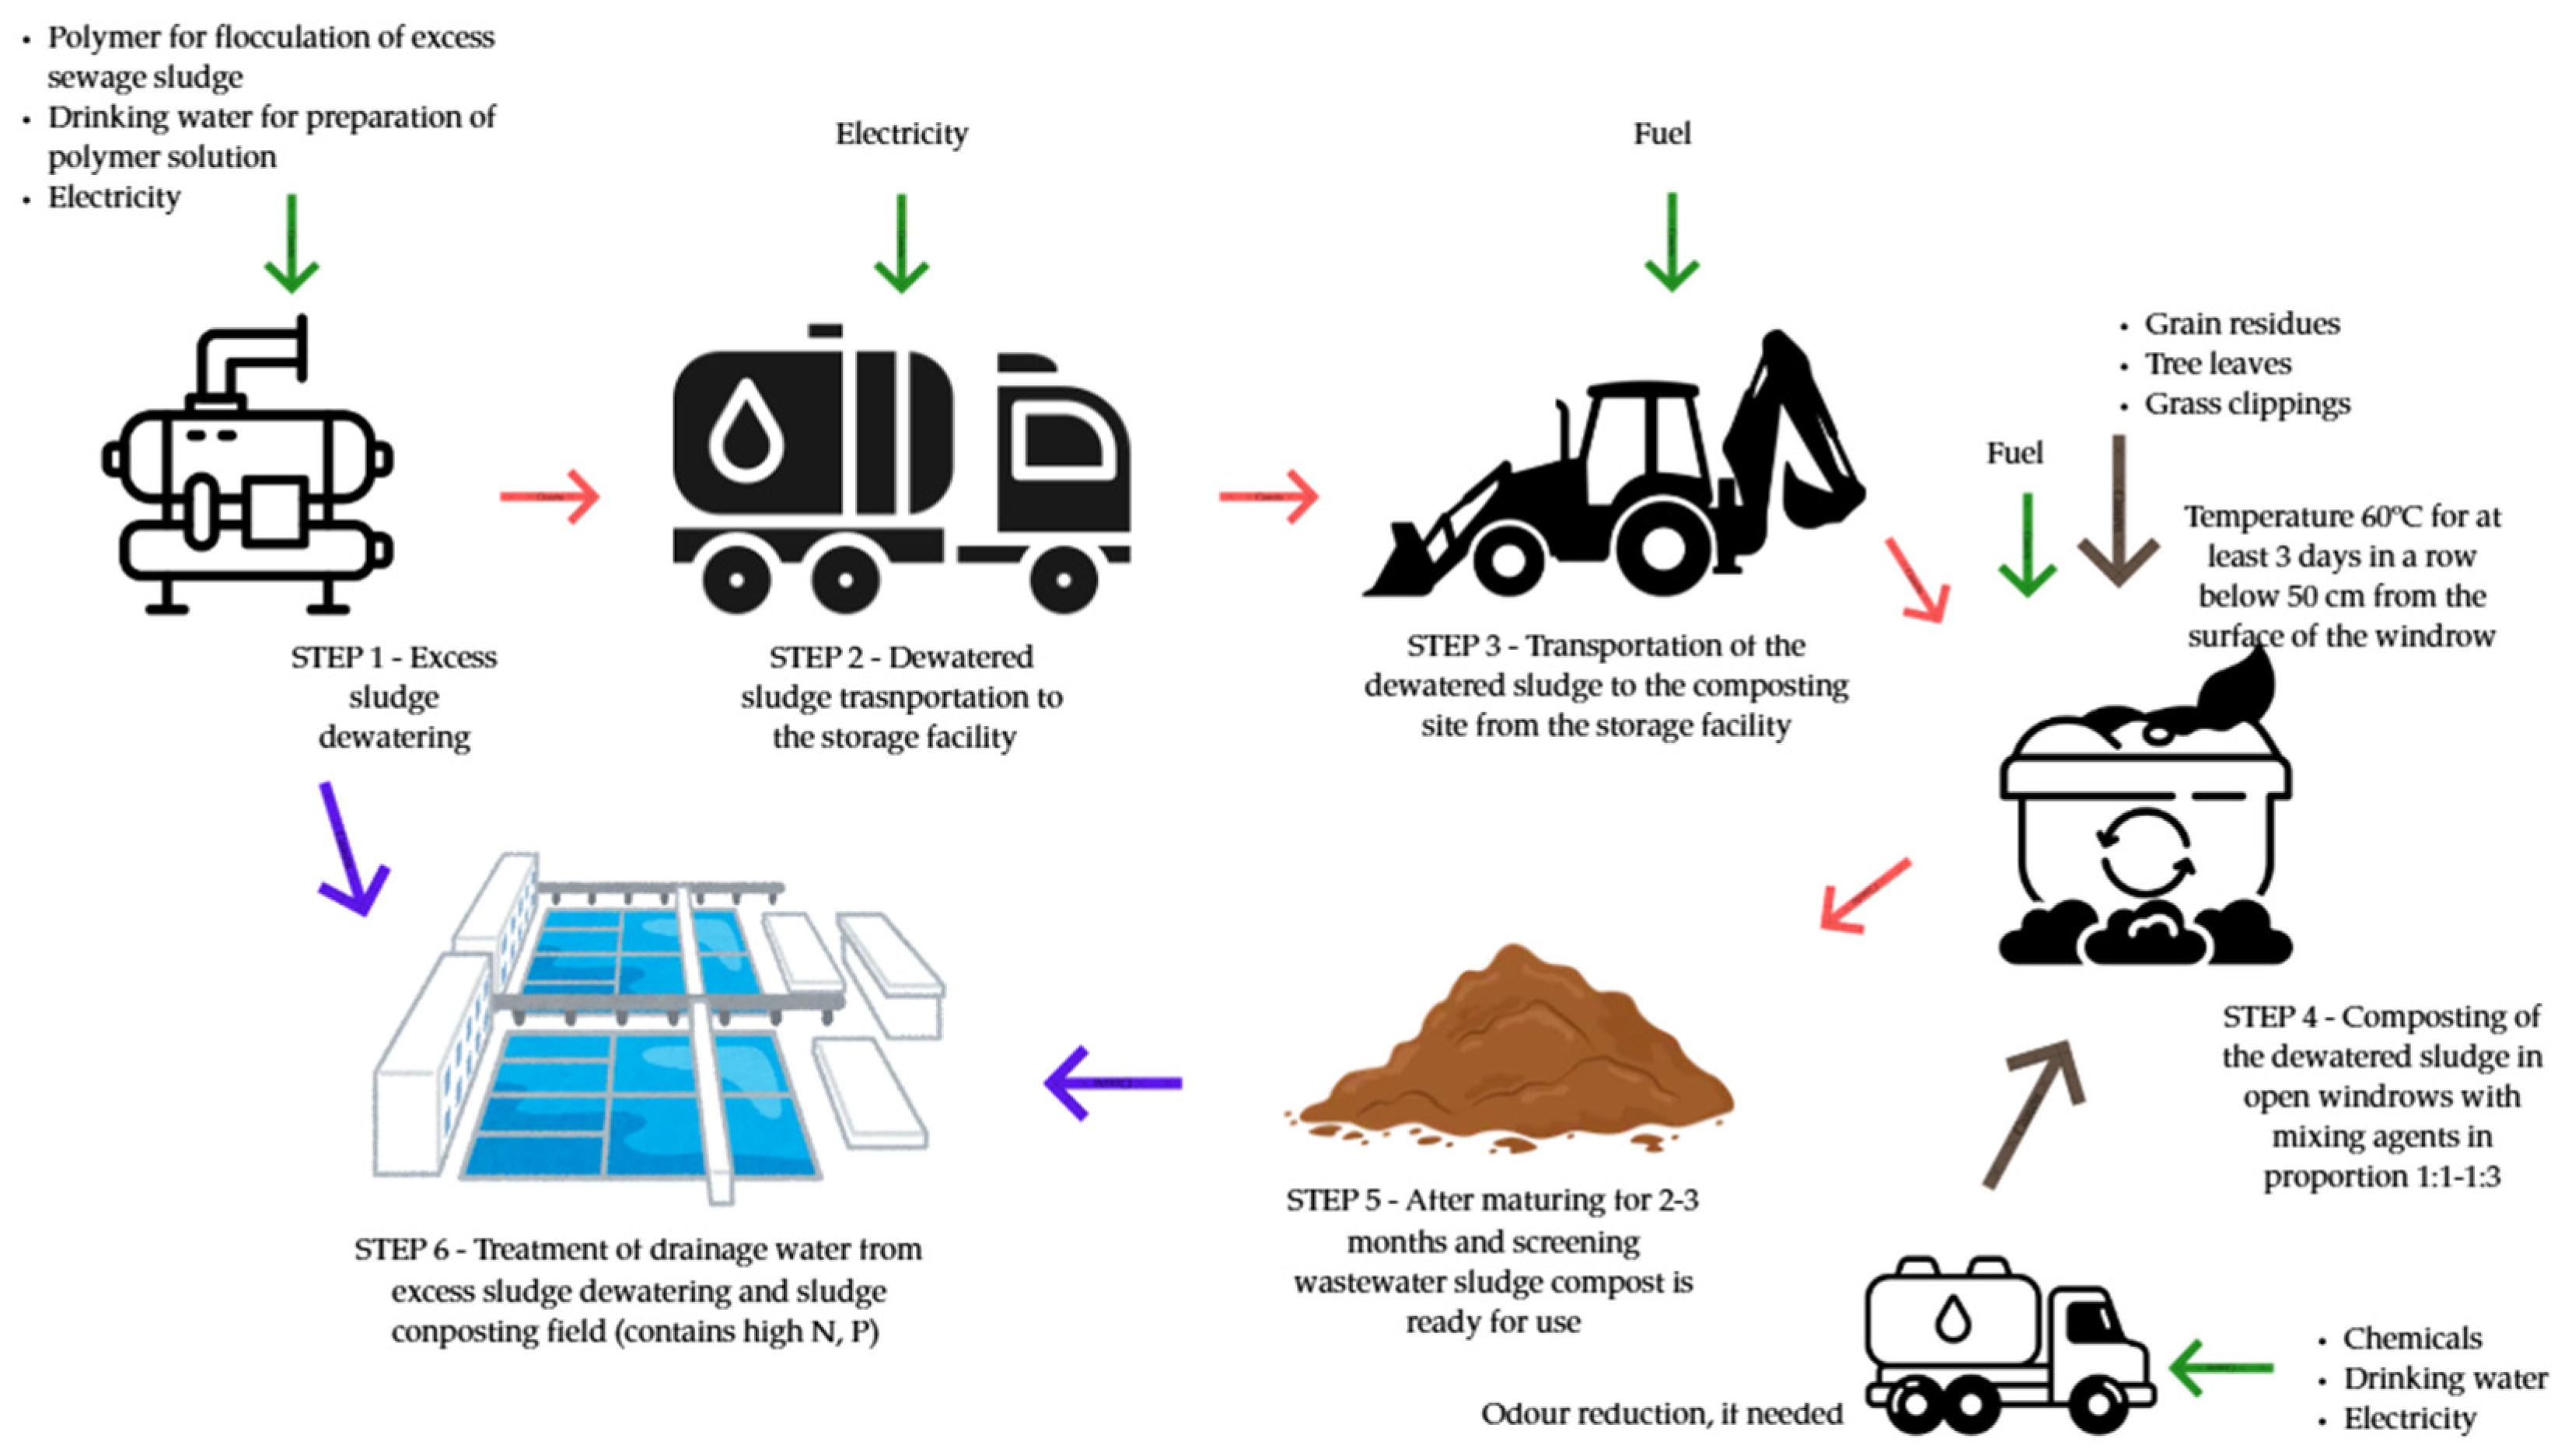
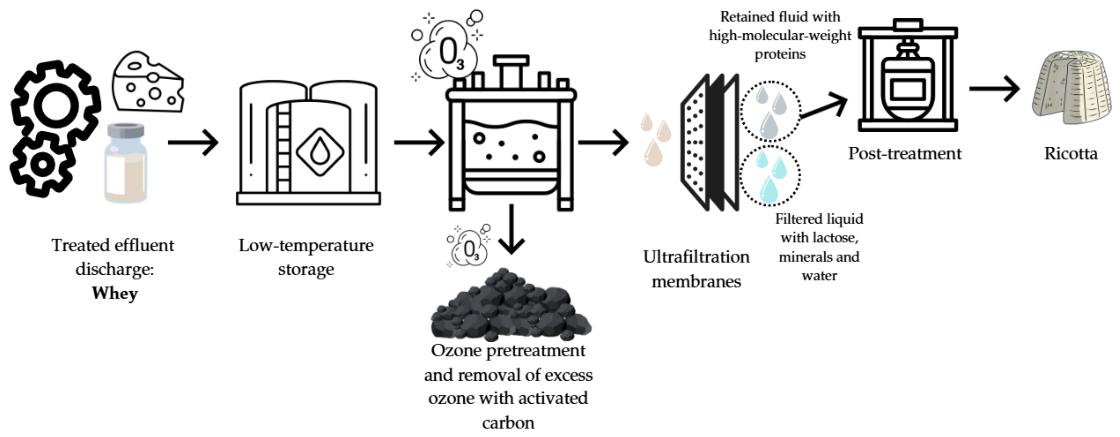
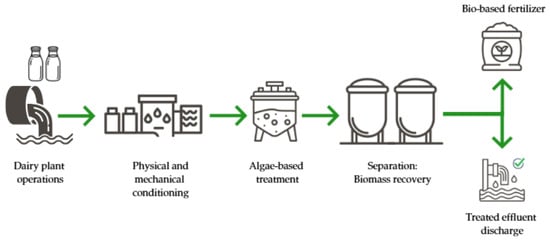
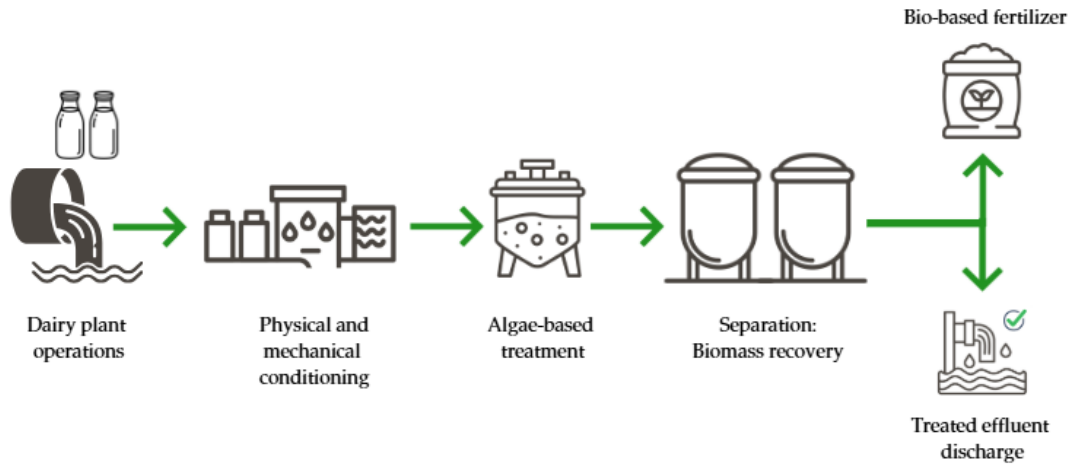
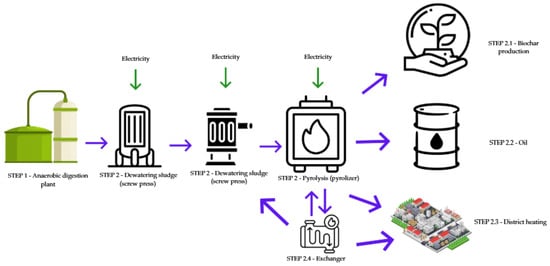
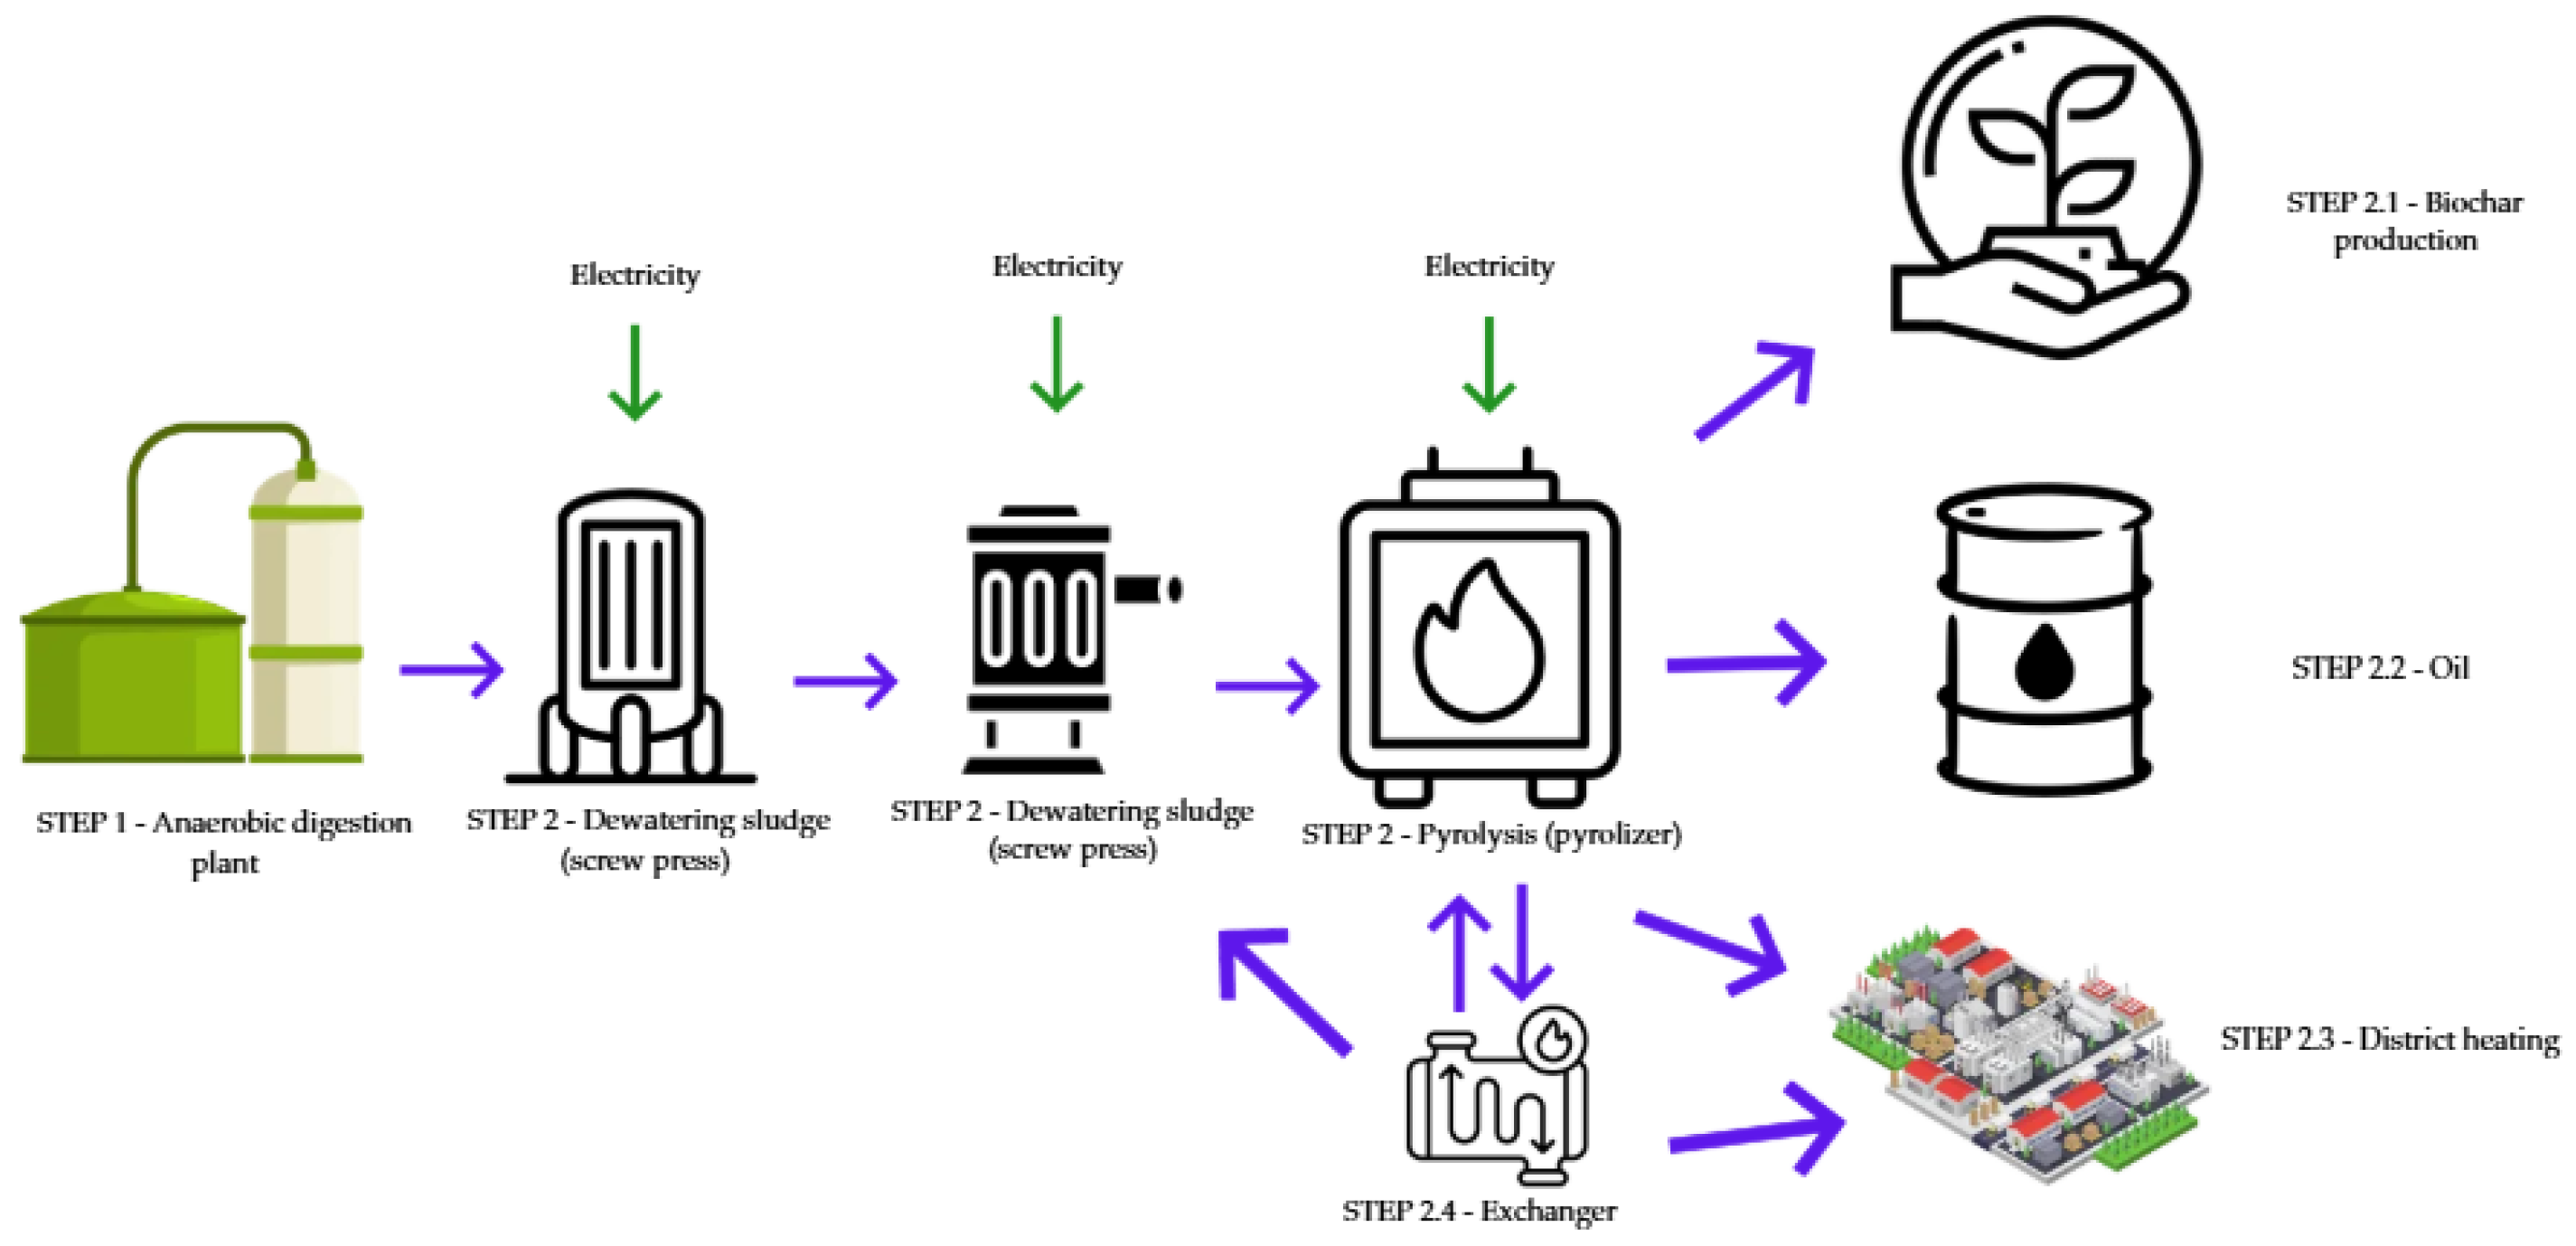
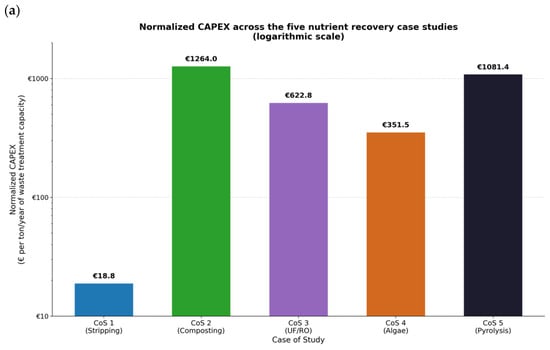
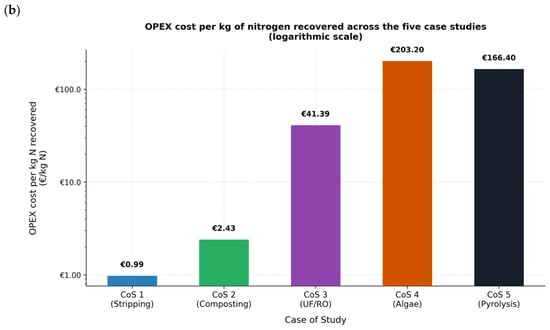
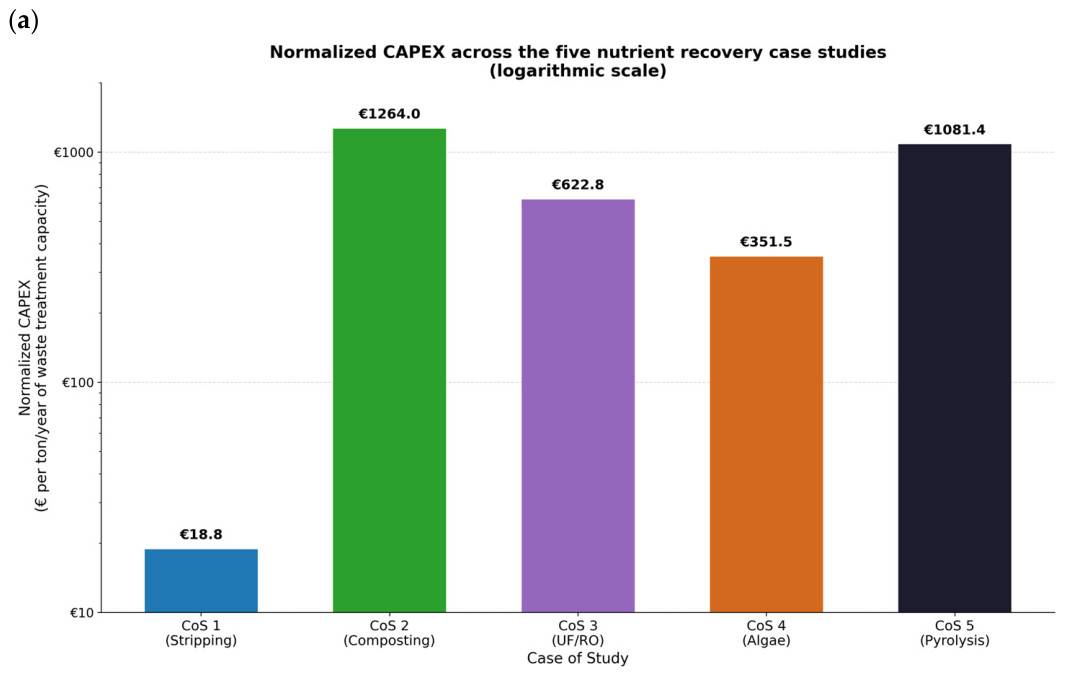
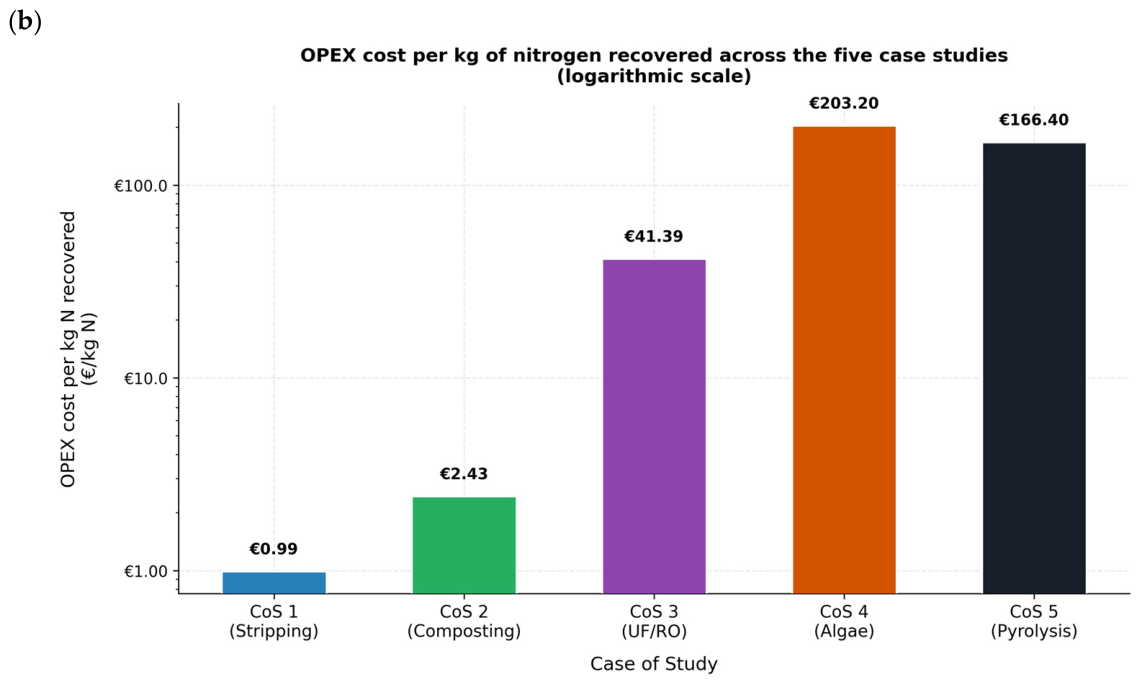

Disclaimer/Publisher’s Note: The statements, opinions and data contained in all publications are solely those of the individual author(s) and contributor(s) and not of MDPI and/or the editor(s). MDPI and/or the editor(s) disclaim responsibility for any injury to people or property resulting from any ideas, methods, instructions or products referred to in the content. |
© 2026 by the authors. Licensee MDPI, Basel, Switzerland. This article is an open access article distributed under the terms and conditions of the Creative Commons Attribution (CC BY) license.