Article

Spatiotemporal Evolution and Determinants of Tourism Efficiency in Outstanding Tourism Cities of the Yellow River Basin

1
School of Geography and Tourism, Henan Normal University, Xinxiang 453007, China
2
College of Perpignan International Polytechnic, Henan Normal University, Xinxiang 453007, China
*
Author to whom correspondence should be addressed.
Sustainability 2026, 18(14), 6981; https://doi.org/10.3390/su18146981
Submission received: 4 June 2026 / Revised: 30 June 2026 / Accepted: 3 July 2026 / Published: 8 July 2026
(This article belongs to the Section Tourism, Culture, and Heritage)

Abstract

The Yellow River Basin is a vital ecological security barrier for China, as well as a region rich in cultural and tourism resources. Tourism has emerged as a core industry underpinning both ecological conservation and sustainable, high-quality regional development within the basin. As the tourism industry transitions toward sustainable and high-quality development, tourism efficiency serves not only as a core indicator for measuring the quality of tourism development but also as a critical basis for assessing regional tourism sustainability. Taking 68 Outstanding Tourism Cities in the Yellow River Basin from 2009 to 2023 as research samples, this study employs the Super-Slack-Based Measure (Super-SBM) model to measure tourism efficiency. It depicts the spatiotemporal evolution through trend surface analysis, spatial autocorrelation analysis, hotspot analysis, and standard deviation ellipses and utilizes the Geographically and Temporally Weighted Regression (GTWR) model to identify the determinants of spatiotemporal heterogeneity. Tourism efficiency in the basin’s Outstanding Tourism Cities is generally low but has a variably increasing trend with a pronounced spatial gradient of upstream > midstream > downstream. The efficiency of tourism is highly interdependent spatially and highly clustered, as the regional high and low values are mostly situated up- and downstream, respectively. In general, the center of tourism efficiency has changed to the southwest instead of the northeast. The infrastructure, industrial structure and human capital characterize the efficiency of tourism, but the openness to the external world is the most significant factor, and the impact of these factors also varies sharply in terms of their strength. This study systematically reveals the spatiotemporal evolution patterns and heterogeneous driving mechanisms of tourism efficiency in Outstanding Tourism Cities within the Yellow River Basin. It not only expands the research perspectives and empirical analytical frameworks for sustainable tourism development at the basin scale but also provides a precise decision-making basis for the coordinated advancement of sustainable and high-quality tourism development in the region.

1. Introduction

As the “Mother River” of the Chinese nation, the Yellow River passes through various geomorphological and ecological functional zones with various unique cultural and tourism resources. It has strategic importance to the socio-economic development of China and ecological security [1]. Further ecological protection and high-quality development of the Yellow River Basin is one of the key national policies that should take into account the greater interests of the country and the revival of the Chinese nation. It has a deeper meaning in terms of territorial alignment, putting into practice the green development model, and increasing the quality of life of the people [2]. In this respect, tourism, as an industry that can positively influence other sectors and have strong positive spillover, has become one of the most important ways to foster sustainable and high-quality economic development in the Yellow River Basin [3]. The 14th Five-Year Plan of Tourism Development, which was issued by the State Council in December 2021, further indicates that the tourist industry in China has now reached a new stage of development, with a focus on high-quality tourism, which may demand an active transition from tourism promotion to quality development [4]. Tourism efficiency, as one of the primary indicators of the quality of the resource allocation and the development levels of the tourism sector, has been transformed into an inherent need and a major tool of high-quality development in the industry [5], as strategic and central stresses of China’s tourism system, Outstanding Tourism Cities, certified by the former National Tourism Administration in accordance with national standards for tourism development, contribute over 90% of the country’s total tourism economic output. Taking these cities as research subjects can not only accurately reflect the overall development status of China’s tourism economy but also provide targeted policy implications for its high-quality advancement [6]. Consequently, the systematic investigation of the spatial patterns and determinants of tourism efficiency in the Yellow River Basin’s Outstanding Tourism Cities is not only of great theoretical importance, but also of instant practical essence in the promotion of high-quality and sustainable tourism development throughout the entire basin.
With the shift of the tourism industry towards the development of high-quality tourism, the subject of tourism efficiency has emerged as a primary subject of academic research [7]. Tourism efficiency refers to the ability of an evaluation unit to achieve optimal allocation of factors and maximise output in tourism operations over a given period; it plays a key role in the scientific and sustainable development of the tourism industry [8]. Existing literature has established a multi-dimensional research framework, covering, at the content level, efficiency measurement and comparison of traditional tourism sectors [9,10,11], tourism-led poverty alleviation [12], industrial efficiency [13], and eco-efficiency [14]. Research perspectives have centered on spatiotemporal evolution [15], spatial disparities [16], spillover effects [17], influencing factors [18], and driving mechanisms [19], aiming to explore pathways for efficiency enhancement. In terms of evaluation methods, in addition to the single-ratio method [20] and the indicator system method [21], model-based approaches represented by DEA [22] and SBM models [9] have been widely applied. However, traditional DEA models fail to adequately account for slack variables, making it difficult to effectively measure input–output redundancy, which results in significant limitations in measurement accuracy [22,23,24,25,26]. In contrast, improved SBM-series models incorporate slack variables into the objective function, effectively remedying the defects of traditional models and offering superior measurement accuracy and applicability [14,27,28]. Nevertheless, some regional studies still adhere to the traditional DEA framework, leading to systematic biases in their measurement results. Studies on spatiotemporal evolution and influencing factors predominantly focus on provincial regions [29] and urban agglomerations [30], often integrating theories such as spatial spillover effects [31] and threshold effects [32]. For the identification of influencing factors, methods such as the Spatial Durbin Model [17], Geodetector [9], and Social Network Analysis [33] are widely employed. However, existing literature generally emphasizes the depiction of static spatial patterns while neglecting the exploration of long-term dynamic evolution mechanisms. Furthermore, city-level studies predominantly use full samples of all cities without distinguishing core tourism-bearing units, making their conclusions susceptible to dilution by non-key tourism cities. In terms of research-scale evolution, tourism efficiency studies have extended from traditional industrial sectors to regional tourism systems [11,34], forming a multi-level scale system encompassing national [35], provincial [15], municipal [28], and county levels [36]. However, existing research on the Yellow River Basin predominantly focuses on the measurement and analysis of tourism eco-efficiency [37,38,39]. Systematic investigations into pure tourism efficiency at the municipal level remain scarce, with a particular lack of specialized studies using Outstanding Tourist Cities as the basic unit of analysis.
Tourism efficiency, falling within the category of economic efficiency, emphasizes the input–output ratio of tourism factors and takes economic output as the core metric to gauge resource allocation quality and industrial operational efficiency; it serves as the fundamental economic pillar for sustainable tourism development. In contrast, tourism eco-efficiency incorporates environmental pollution and ecological consumption as undesirable outputs into its analytical framework, underscoring the coordinated development between the tourism economy and the ecological environment [14], thus functioning as a comprehensive indicator of sustainable tourism. This study focuses on pure tourism economic efficiency, which not only aligns with the current stage requirements of China’s tourism industry for quality improvement and transformation but also corresponds to the core criteria for evaluating Outstanding Tourist Cities. It directly addresses the practical needs for enhancing tourism quality within the river basin, while simultaneously providing a benchmark reference for future sustainable tourism efficiency research that incorporates ecological and social dimensions. Outstanding Tourist Cities, designated by the former China National Tourism Administration, account for over 90% of the national tourism economic output. With unified statistical standards and high data availability, they more accurately reflect the state of China’s tourism economy and offer greater pertinence for its enhancement. This is particularly true for cross-provincial strategic regions like the Yellow River Basin, which exhibits significant development gradients across its upper, middle, and lower reaches and where ordinary prefecture-level cities have relatively small tourism industries. In such contexts, Outstanding Tourist Cities serve as core growth poles of the tourism economy and critical nodes for policy implementation, making their efficiency levels far more representative. From the perspective of industrial agglomeration theory, Outstanding Tourist Cities serve as core carriers for the agglomeration of tourism factor endowments, having developed mature industrial systems and economies of agglomeration. Compared to broader prefecture-level samples, selecting these cities as research subjects can effectively mitigate estimation biases arising from the small scale of tourism industries in certain municipalities [6]. Based on policy transmission theory, Outstanding Tourist Cities function as pivotal fulcrums for the implementation of national tourism policies. Consequently, fluctuations in their efficiency serve as a direct barometer of policy effectiveness, rendering the research findings more valuable for policymaking.
In summary, while existing literature has established a mature analytical framework for tourism efficiency research, significant gaps remain regarding the Yellow River Basin. First, there is a misalignment in research scale and unit of analysis: prevailing studies predominantly focus on ecological efficiency at the provincial level, where aggregated data obscure urban heterogeneity. Consequently, there is a paucity of city-level research specifically targeting the tourism efficiency of outstanding tourist cities, rendering current findings insufficient to support municipal policymaking; second, the depth of spatiotemporal evolution analysis remains inadequate. Most studies focus on depicting static spatial patterns, lacking a systematic characterization of dynamic trajectories—such as efficiency, gravity center migration, and directional evolution—over extended periods. Consequently, our understanding of the evolutionary dynamics of basin-wide efficiency remains incomplete; third, the identification of driving mechanisms suffers from a homogenization bias. Traditional global regression models overlook developmental disparities across the upper, middle, and lower reaches of the basin, failing to reveal variations in the direction and magnitude of driving factors across different river segments. Consequently, this limitation renders policy recommendations prone to disconnection from regional realities. Taking 68 outstanding tourist cities in the Yellow River Basin as research subjects, this study constructs an integrated analytical framework of “efficiency measurement–spatiotemporal evolution–heterogeneous driving mechanisms.” By employing the Super-SBM model to measure tourism efficiency and combining trend surface analysis, spatial autocorrelation, standard deviation ellipses, and the Geographically and Temporally Weighted Regression (GTWR) model, this paper systematically investigates the spatiotemporal evolutionary characteristics and driving mechanisms of tourism efficiency within the basin from 2009 to 2023. The innovations of this study are primarily reflected in the following aspects. First, it achieves precision in research units by selecting Outstanding Tourist Cities in the Yellow River Basin as samples for tourism economic efficiency measurement. This approach circumvents the efficiency dilution problem inherent in generalized municipal samples and enriches the scale dimension of basin-level research. Second, it achieves systematization in spatiotemporal analysis by comprehensively depicting the dynamic evolutionary trajectory of efficiency over an extended period, thereby remedying the deficiency of existing studies that predominantly focus on static analysis; third, it achieves heterogenization in driving mechanism identification by revealing the differentiated characteristics of driving factors across various river segments, thereby providing precise empirical support for the formulation of differentiated tourism quality improvement policies.

2. Materials and Methods

2.1. Study Area

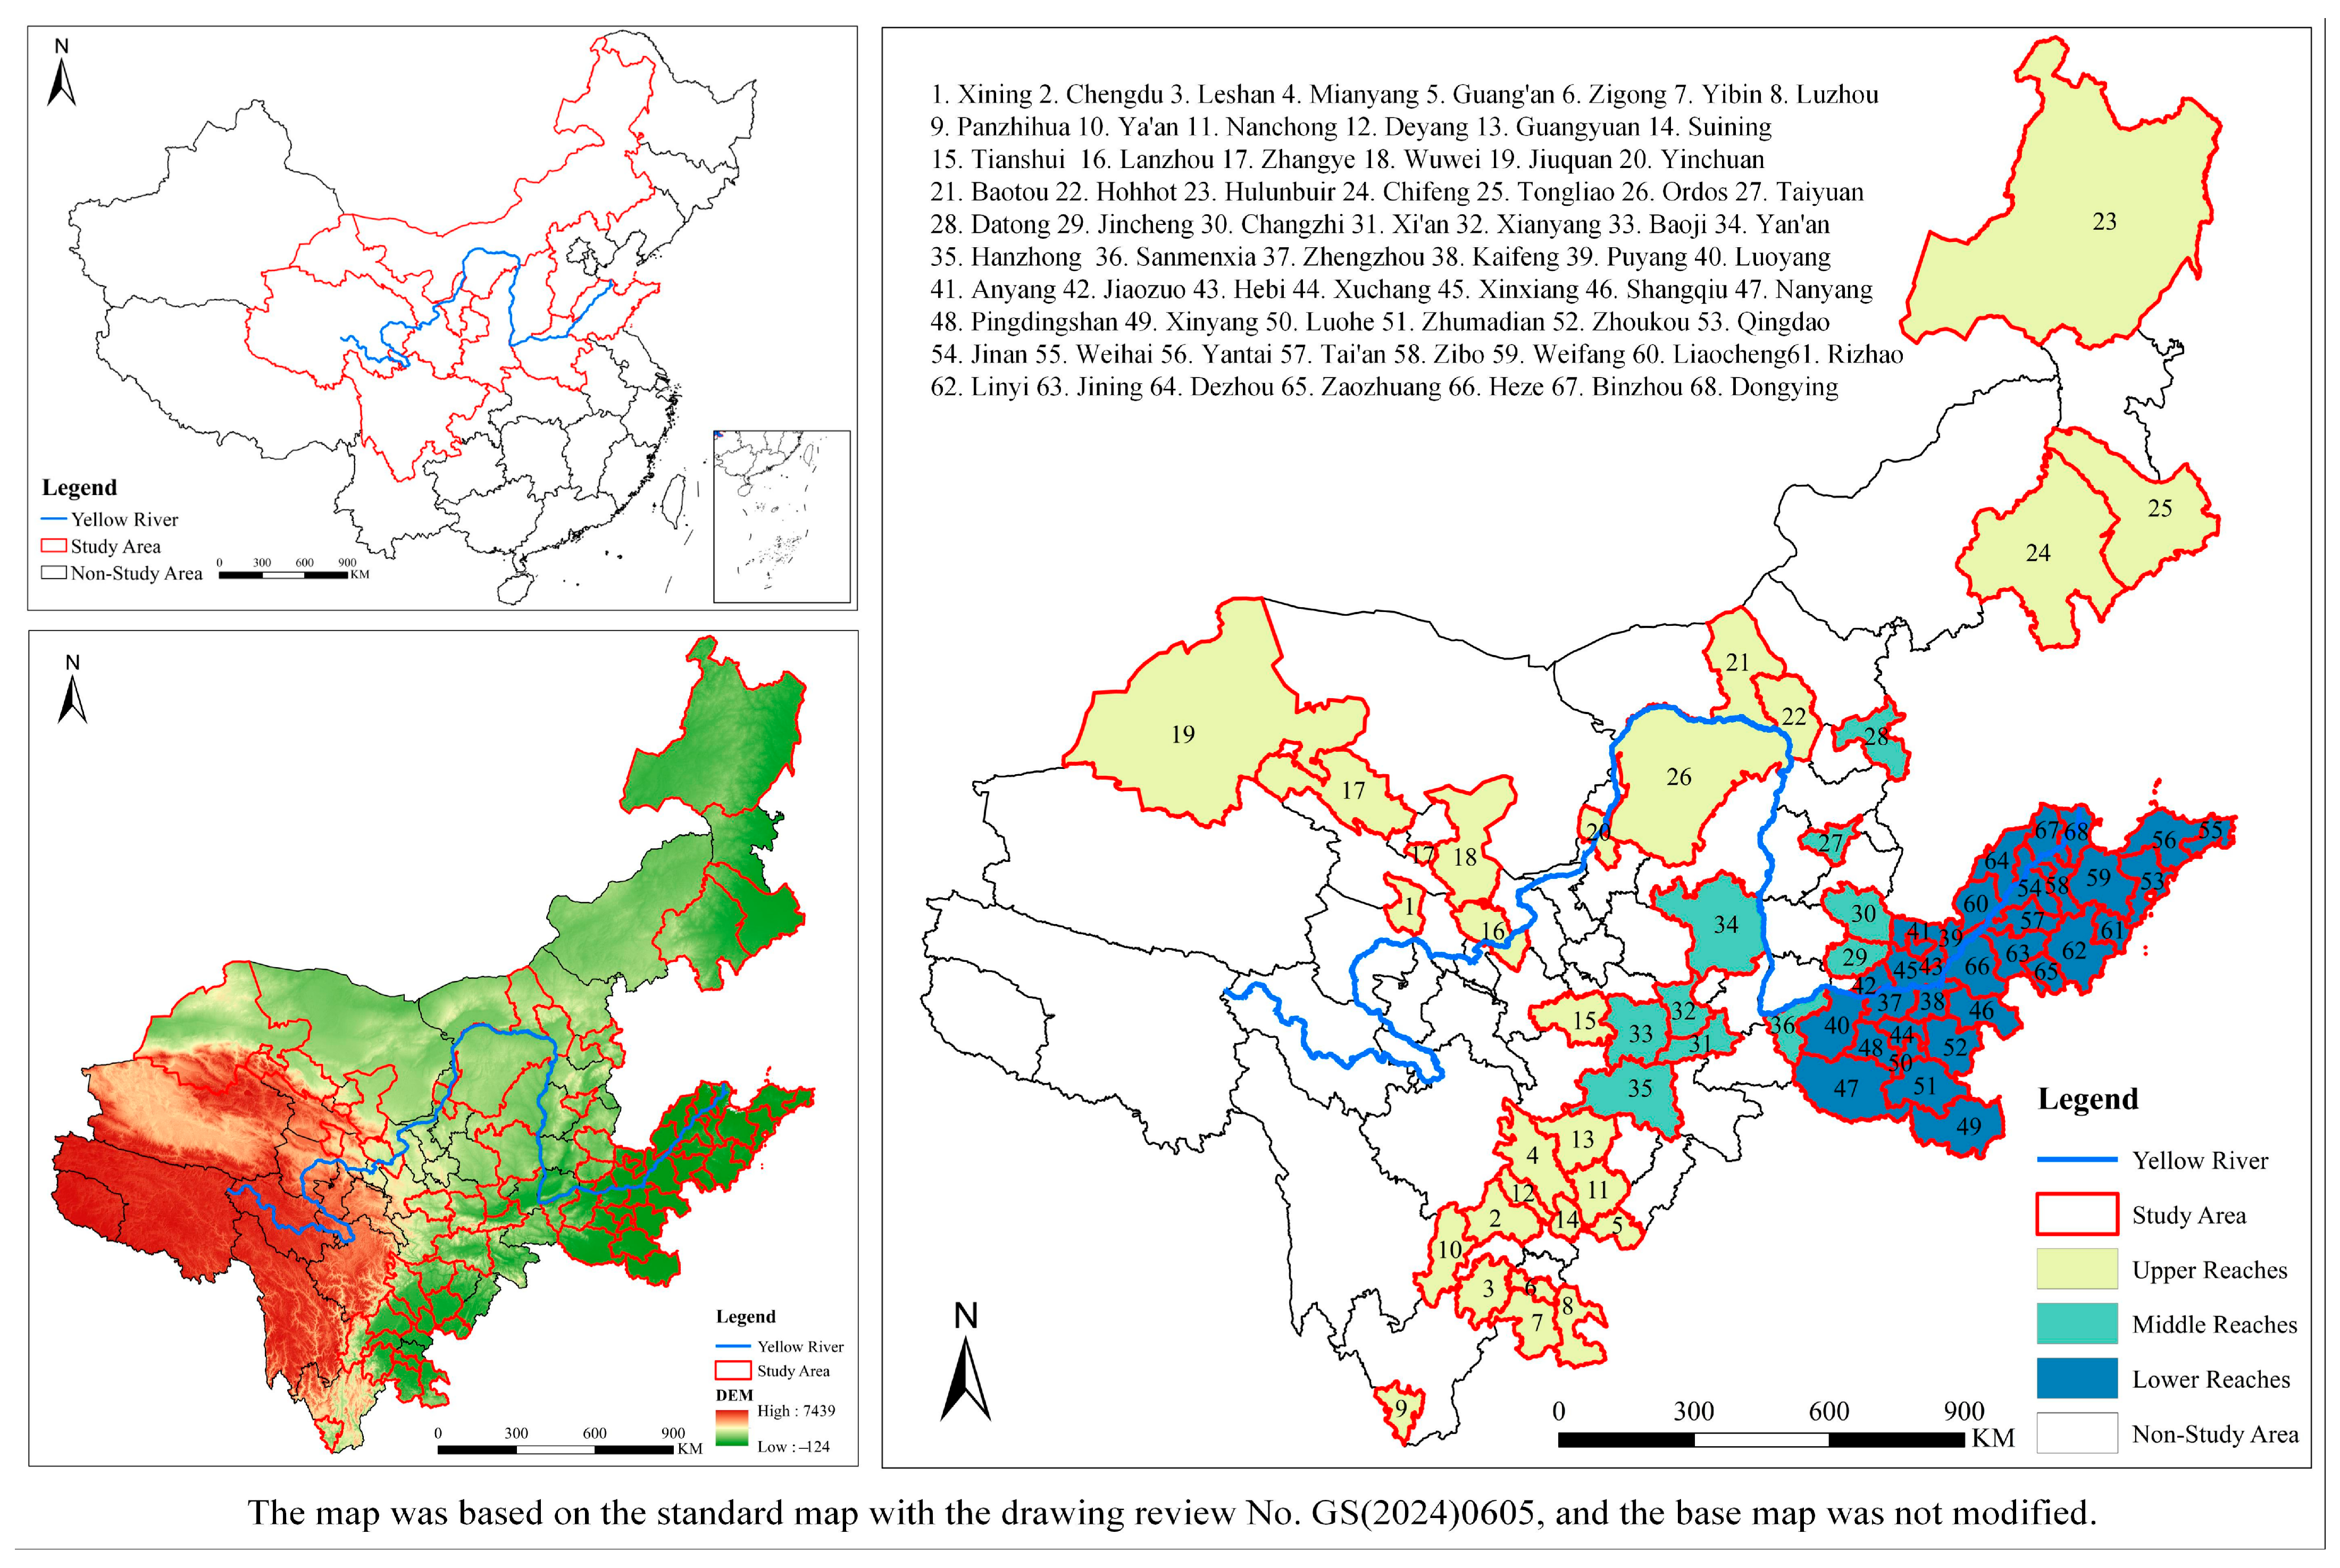
The Yellow River Basin encompasses nine administrative regions at the provincial level (Figure 1), such as Qinghai, Sichuan, and Gansu, and occupies an area of about 795,000 km2, or 8.3% of the total land area of China. The basin cuts across four large physiogeographic divisions, including the Qinghai–Tibet Plateau, the Loess Plateau, the Inner Mongolia Plateau, and the North China Plain, that have a geomorphological climate that is either dry or moist. The middle and upper areas are located in a semi-humid to semi-arid transitional region, which makes the ecological environment exceptionally susceptible. The Yellow River Basin is an important ecological security barrier to the Chinese civilization and a cradle to diverse regional cultures, rich historical heritage, varied natural landscapes and rich tourism resources. In order to better introduce the spatiotemporal changes in tourism efficiency in the Yellow River Basin, this paper chooses the 68 Outstanding Tourism Cities (prefecture-level cities) located in the basin as the research units, which avoids the masking effect of data aggregated across provinces on the heterogeneity within the basin. In addition, given the pronounced geographical and socio-cultural differences among the upper, middle, and lower reaches, a sub-regional method of analysis is used to conduct a deeper study.

2.2. Research Framework

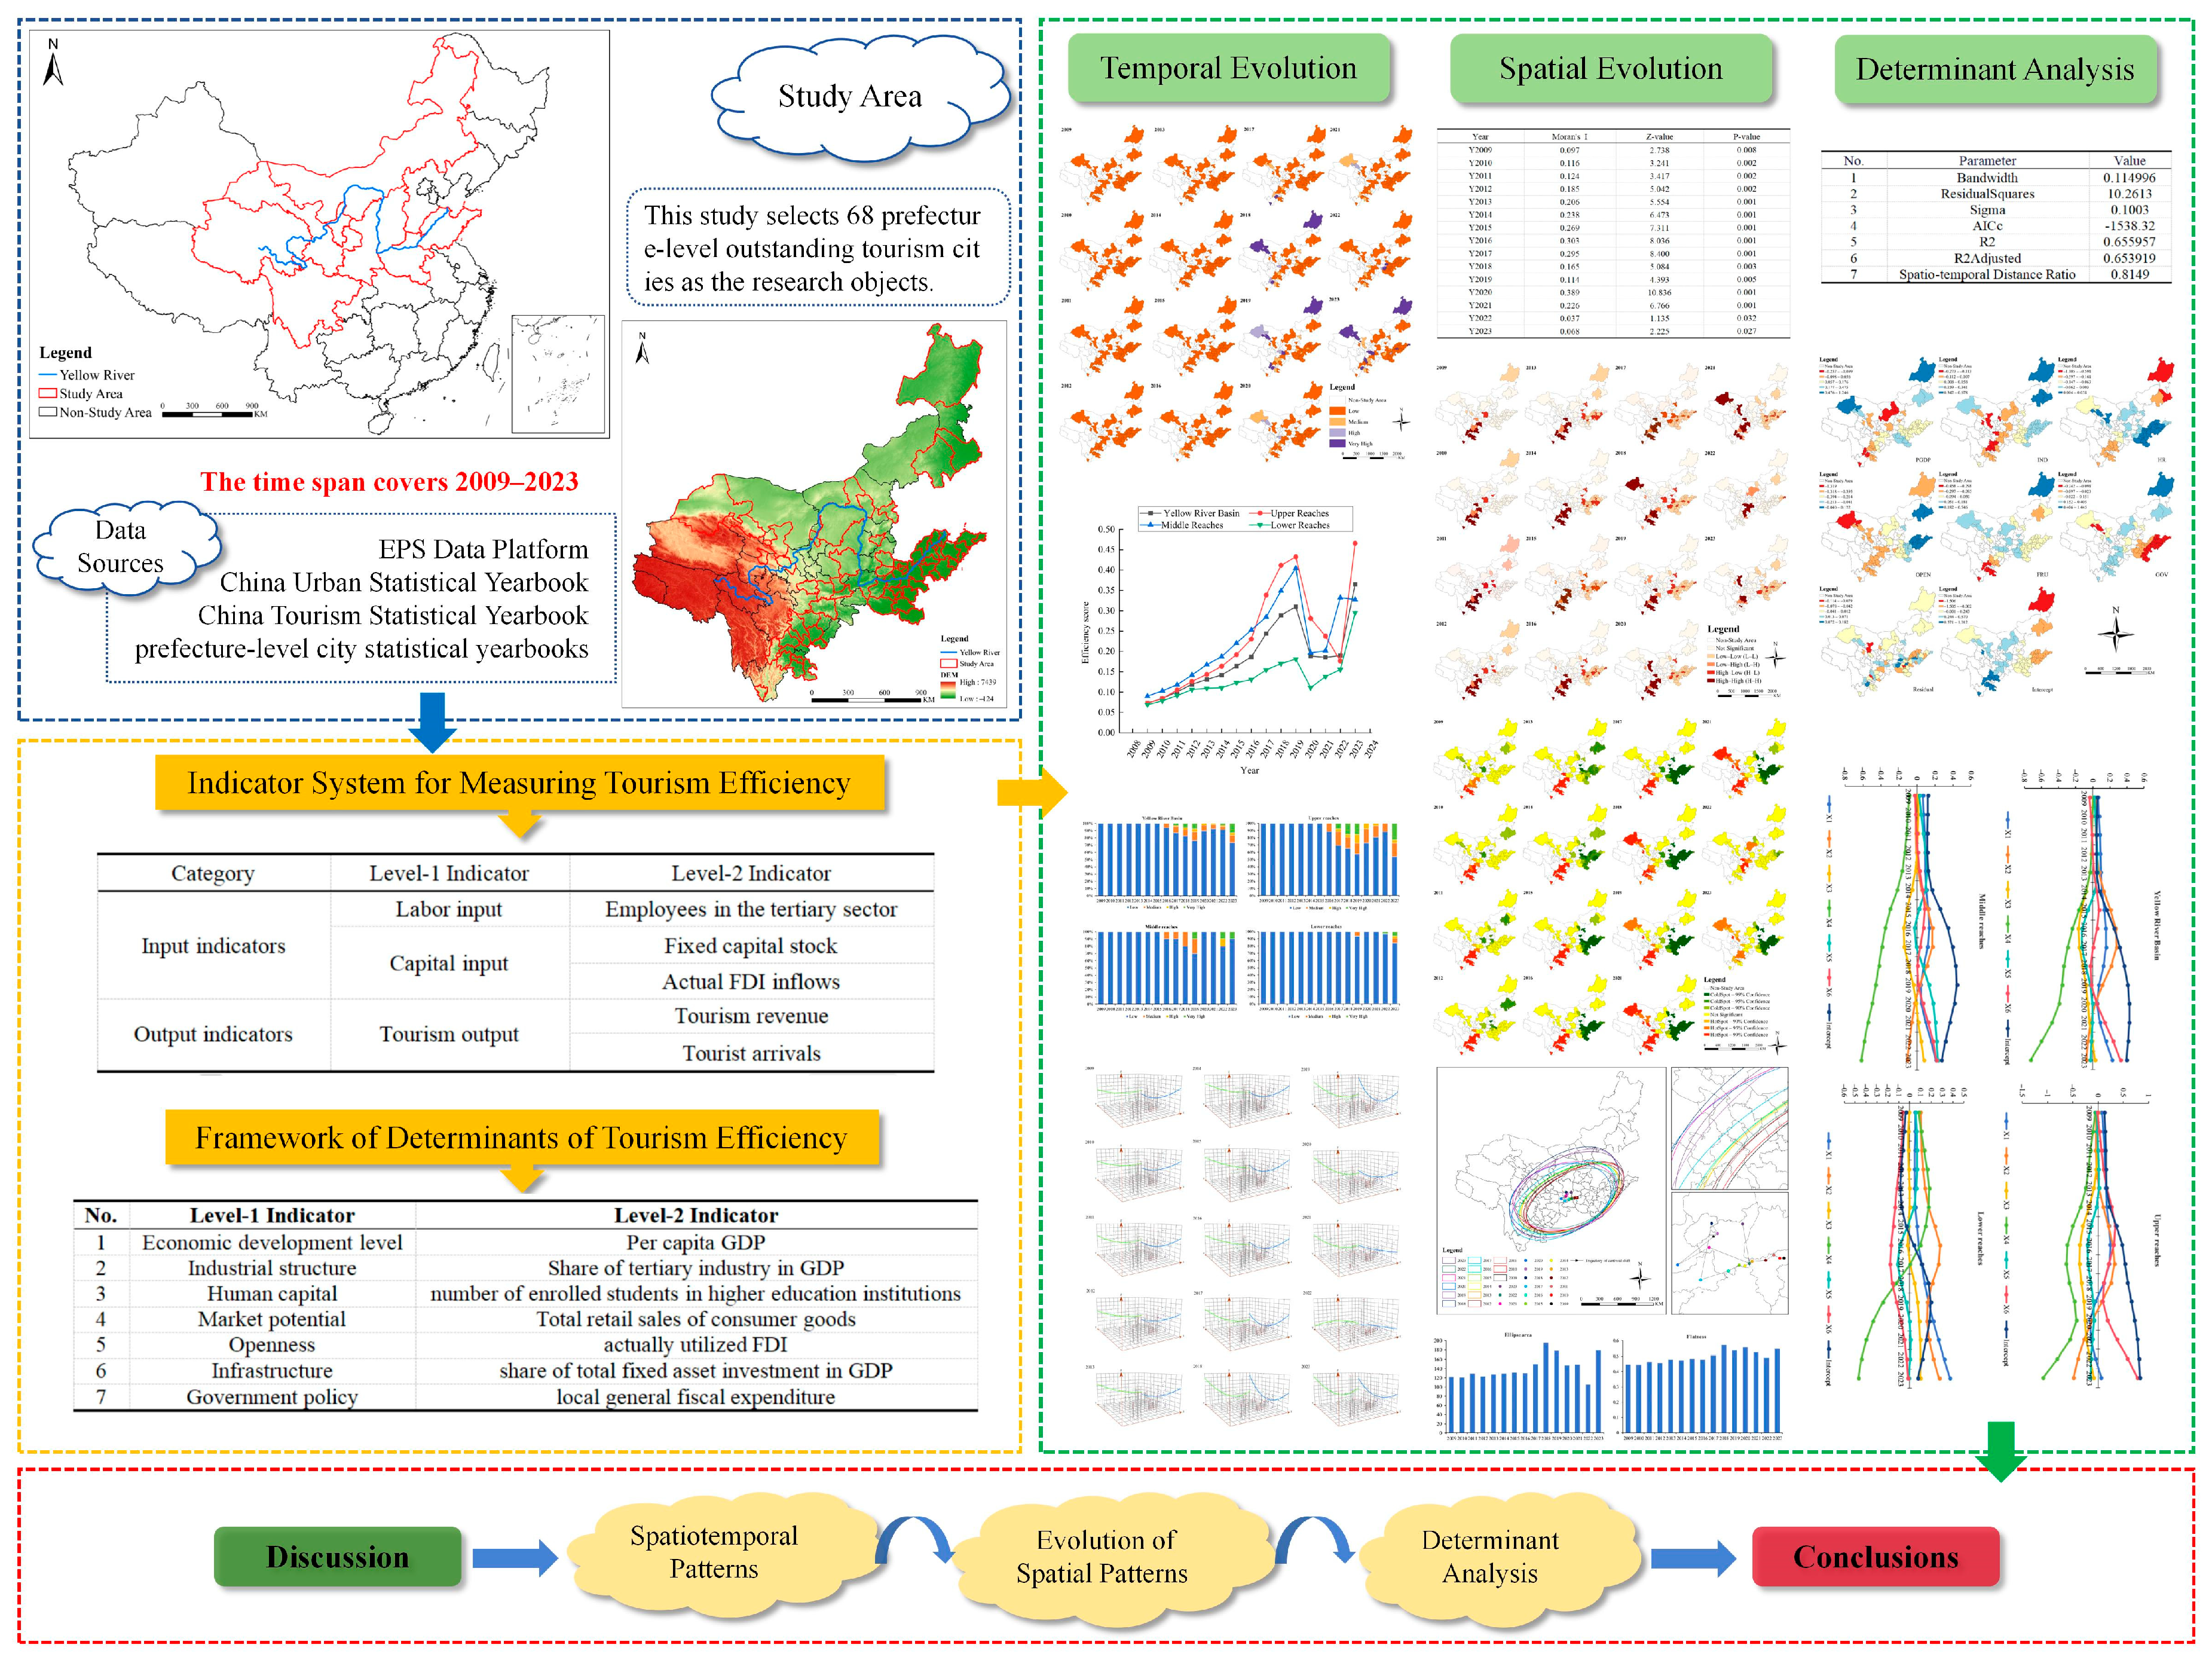
The technical workflow of this work is shown in Figure 2. The tourism efficiency of the 68 Outstanding Tourism Cities in the Yellow River Basin is first based on a comprehensive system of tourism efficiency indicators. Thereafter, a series of spatial analytical tools, such as trend surface analysis, global and local spatial autocorrelation, hot–coldspot analysis, standard deviation ellipse (SDE), and the GTWR model, are used in the systematic analysis of the temporal trends, spatial pattern development, and determiners of tourism efficiency. Then, a set of spatial analytical methods such as trend surface analysis, global and local spatial autocorrelation, hot–coldspot analysis, SDE, and the GTWR model allow analysis of the temporal changes, spatial pattern changes and influencing factors of tourism efficiency in a systematic way. Lastly, empirical findings are discussed and synthesized into conclusions.

2.3. Indicator System and Data Sources

Tourism efficiency is a core indicator for measuring the quality of tourism resource allocation and the level of industrial development, reflecting the proportional relationship between factor inputs and economic outputs in tourism development [8]. Grounded in the dual-factor (labor–capital) input theory of the Cobb–Douglas production function, this study constructs a tourism efficiency evaluation indicator system by integrating the broad industrial linkages and extensive factor coverage inherent to the tourism sector with the availability of prefecture-level city data (Table 1). The selection of labor and capital as the two core input factors aligns with both classical production function theory and the established conventions in tourism efficiency research [15,27]; labor input is measured by the number of employees in the tertiary industry. Given that tourism’s employment spillover effect encompasses multiple associated service sectors such as accommodation and catering, a narrow definition of tourism employment tends to underestimate actual labor input and suffers from inconsistent statistical standards across regions, thereby failing to fully capture the true scale of labor input. This indicator comprehensively covers both direct and indirect tourism employment, aligning with the high industrial linkage characteristics of the tourism sector; its validity has been extensively verified in numerous municipal-level tourism efficiency studies in China [27]. Capital input is measured by two indicators: fixed capital stock and actual utilized foreign capital. Fixed capital stock encompasses tourism-related fixed asset investment in cultural and tourism infrastructure, scenic area facilities, hotels, and catering services, serving as the physical foundation for industrial operation [40]; actual utilized foreign capital reflects urban capital openness and the spillover potential of foreign management expertise and tourist source channels, capturing the enabling role of open capital in tourism development, and has been widely incorporated into tourism efficiency evaluation frameworks [15]. Actual utilized foreign capital is employed as a proxy for urban capital openness to capture the potential of external capital and technology spillovers accessible to the tourism industry, rather than merely accounting for FDI directly absorbed by the tourism sector; this approach aligns with both the characteristics of municipal-level industrial integration and data availability constraints. Output indicators comprise two widely adopted core metrics: tourism revenue and tourist arrivals [9,11]. These indicators capture tourism economic output and reception market scale from value and quantity dimensions, respectively; their combination enables a comprehensive assessment of overall tourism output, thereby mitigating the limitations inherent in single-indicator measurement.
Data were primarily sourced from the China Statistical Yearbook (2010–2024), the China City Statistical Yearbook (2010–2024), the China Tourism Statistical Yearbook (2010–2018), the China Culture and Tourism Statistical Yearbook, and the China Culture, Heritage, and Tourism Statistical Yearbook (2020–2024), as well as provincial and municipal statistical yearbooks and government bulletins covering the period 2009–2024. All price-related indicators in this study are deflated to 2009 constant prices using the GDP deflator to eliminate the effects of price fluctuations. Due to the impact of the COVID-19 pandemic, some prefecture-level cities suspended the publication of tourism foreign exchange earnings and overnight inbound tourist arrivals during 2020–2023, resulting in minor annual data gaps. These missing values were addressed using linear interpolation.

2.4. Research Methods

This study establishes a comprehensive analytical framework of “efficiency measurement–pattern evolution–mechanism identification,” forming a progressive and multi-dimensional cross-validated methodological logic chain that systematically addresses the core scientific questions in tourism efficiency research.

2.4.1. Super-SBM Model

The Super-SBM model serves as the core methodological tool of this study. Grounded in a non-radial and non-oriented measurement logic, it effectively accounts for input–output slacks, thereby overcoming the precision limitations inherent in traditional DEA models. This approach enables the accurate estimation of tourism efficiency across cities, providing a robust core variable for subsequent spatiotemporal pattern analysis and driving mechanism identification. Tone (2001) created an extension of the SBM model, known as the Super-SBM model, that includes super-efficiency and thus allows the ranking of efficient decision-making units (DMUs) [41]. The technique is commonly used in measuring tourism efficiency [9,11], the efficiency values of multiple research units may be distinguished through sorting, thereby enabling precise calculation of tourism efficiency values and mapping variations in inputs or outputs at equivalent proportions. Concurrently, it effectively addresses slack variable issues, resolves input–output redundancy, and achieves greater precision in efficiency measurement. The formula is as shown:
min ρ = 1 l m i = l m   s i / x i 0 / 1 l s i = l s   s r + / y i 0 x i 0 = j = l n   Q j x j + s i ( i = l , 2 , , m ) y i 0 = j = l n   Q j y j + s r + ( r = l , 2 , , m )
where ρ denotes the tourism efficiency score; Xij is the i-th input variable of the j-th DMU; Yrj is the r-th output variable of the j-th DMU; and θj represents the weight assigned to each DMU in the reference set. Drawing on existing literature on urban tourism efficiency in China [42], this study classifies tourism efficiency values into four tiers (Table 2). This threshold system has been widely adopted in research on prefecture-level cities across China, effectively differentiating efficiency hierarchies while accommodating the sample characteristics of this study—namely, a high proportion of central and western cities with relatively low overall efficiency levels. Comparative validation using the equal-interval method confirms that the spatial patterns of efficiency derived from both classification schemes exhibit no significant differences, thereby demonstrating the robustness of the proposed grading criteria. The specific classification standards are as follows:

2.4.2. Trend Surface Analysis

Trend surface analysis models the data to provide a mathematical surface of the data by employing the statistical approaches to depict the spatial patterns and trends [43]. The study uses a second-order polynomial to obtain the fitted values of tourism efficiency and consequently examines the spatial distribution pattern of tourism efficiency among the excellent cities in the Yellow River Basin as tourism destinations. By fitting a global spatial gradient surface, this study identifies the macro-scale differentiation patterns and temporal evolution trends of tourism efficiency along the east–west and north–south axes. This approach visually delineates spatial gradient characteristics at the basin scale, effectively accommodating the research context of the Yellow River Basin, which is characterized by extensive spatial extent and pronounced regional heterogeneity. The formula has been provided below:
R i ( X i , Y i ) = T i ( X i , Y i ) + ε i
where Ri denotes the tourism efficiency of city i; Ri (Xi,Yi) is the trend function; (Xi,Yi) signifies geographic coordinates of city i; Ti (Xi,Yi) is the fitted value from the trend surface model; and εi is the random error term.

2.4.3. Spatial Autocorrelation Analysis

The spatial autocorrelation analysis adopts a progressive “global–local” analytical logic. Global Moran’s I is first employed to test the overall significance of spatial dependence in tourism efficiency, thereby establishing the presence of spatial agglomeration. Subsequently, Local Indicators of Spatial Association (LISA) are applied to identify the specific types of spatial linkages for each city, progressively uncovering the spatial association patterns of tourism efficiency. This hierarchical approach aligns well with the industrial characteristics of tourism development, which are inherently marked by spatial agglomeration. Global spatial autocorrelation is primarily used to characterize the overall spatial distribution pattern of an attribute across the entire study region, with a focus on the degree to which values of that attribute are clustered, dispersed, or randomly distributed among spatial units. Given the pronounced heterogeneity in the spatial distribution density of the 68 cities across the upper, middle, and lower reaches of the Yellow River Basin, this study employs a distance threshold spatial weight matrix based on Euclidean distances between urban geometric centroids for the baseline analysis. All weights are row-standardized to eliminate measurement bias. Furthermore, a K-nearest neighbor spatial weight matrix is adopted for robustness checks to mitigate potential imbalances in neighbor counts arising from uneven spatial distributions. The consistency of core findings under both weighting schemes validates the reliability of the empirical results. The formula is as follows:
M o r a n s I = n i = 1 n   j = 1 n   w i j ( x i x ¯ ) ( x j x ¯ ) s 2 i = 1 n   j = 1 n   w i j ( i j )
To reveal local spatial heterogeneity, this study employs the Local Moran’s I index to measure the degree and statistical significance of spatial clustering (or dispersion) of attribute values across regional units.
L o c a l M o r a n s I = n ( x i x ) j = 1 n   w i j ( x j x ) S 2 ( i = j )
where n denotes the count of study units; xi signifies the tourism efficiency value of each city; x* is the mean; S2 is the sample variance; and wij is the spatial weight matrix. Moran’s I ranges from −1 to 1. Values close to 1 demonstrate strong positive spatial autocorrelation (i.e., similar values cluster together), values close to −1 show strong negative spatial autocorrelation (i.e., dissimilar values are adjacent), and a value near 0 suggests no significant spatial autocorrelation, implying a random spatial distribution.

2.4.4. Hotspot Analysis

Hotspot analysis identifies the spatial clustering of high or low values by computing the Getis–Ord Gi∗ statistic [44,45]. This study employs hotspot analysis to identify the spatial distribution of high-value hotspots and low-value coldspots from the perspective of attribute significance in spatial agglomeration. This approach complements the association type analysis derived from local spatial autocorrelation, while cross-validating the robustness of spatial agglomeration findings. Together, they enable the precise identification of core growth poles and low-efficiency collapse zones in tourism efficiency. The formula is as follows:
G i = j = 1 n   w i j x j j = 1 n   x j n j = 1 n   w i j j 1 n   x j 2 n ( X ) 2 n j 1 n   w i j 2 ( j 1 n   w i j ) 2 n 1
where Gi∗ is interpreted as a z-score for statistical significance; xj denotes the attribute value at spatial unit j; wij is the spatial weight between units i and j; and n is the total count of spatial units. Positive Gi∗ values that exceed the critical threshold indicate hotspots; negative Gi∗ values below the critical threshold indicate coldspots; and all other areas are not statistically significant.

2.4.5. Standard Deviational Ellipse (SDE)

The SDE was originally put forward by the American sociologist Welty Lefever [46] to quantify the directional trend and spatial dispersion of data. By employing quantitative indicators—including centroid coordinates, azimuth, and oblateness—this study quantitatively characterizes the migration trajectory, directional extension, and dispersion degree of the spatial distribution of tourism efficiency. This morphological evolution perspective supplements the spatiotemporal dynamic features and cross-validates the gradient conclusions derived from trend surface analysis.

2.4.6. Geographically and Temporally Weighted Regression Model

The Geographically and Temporally Weighted Regression (GTWR) model extends the Geographically Weighted Regression (GWR) framework by incorporating a temporal dimension, enabling the simultaneous capture of spatial heterogeneity and temporal non-stationarity in variable relationships. By leveraging spatiotemporal geographic information to enhance regression estimation accuracy, GTWR serves as an effective approach for characterizing the dual spatiotemporal non-stationarity inherent in panel data [47]. Given the pronounced spatiotemporal differentiation in tourism efficiency, this study employs the GTWR model to investigate the driving factors of urban tourism efficiency in the Yellow River Basin. This model simultaneously identifies the spatial heterogeneity and temporal evolution of driving effects, overcoming the parameter homogenization inherent in traditional global regression models and addressing the inability of standard GWR to capture temporal heterogeneity. Consequently, it precisely reveals the differentiated driving mechanisms across the upper, middle, and lower reaches, making it particularly well-suited for the Yellow River Basin context characterized by significant development gradients and prominent long-term evolutionary dynamics. The model of GTWR is as follows:
y i = β 0 ( u i , v i , t i ) + k = 1 P   β k ( u i , v i , t i ) x i k + ε i
where yi denotes the tourism efficiency value of city i, (ui,vi,ti) signifies the spatiotemporal coordinates of city i, βk (ui,vi,ti) is the value of the k-th regression coefficient at the spatiotemporal location of city i; xik is the value of the k-th explanatory variable at observation i, and εi is a random error term.

3. Results and Analysis

3.1. Spatiotemporal Patterns of Tourism Efficiency

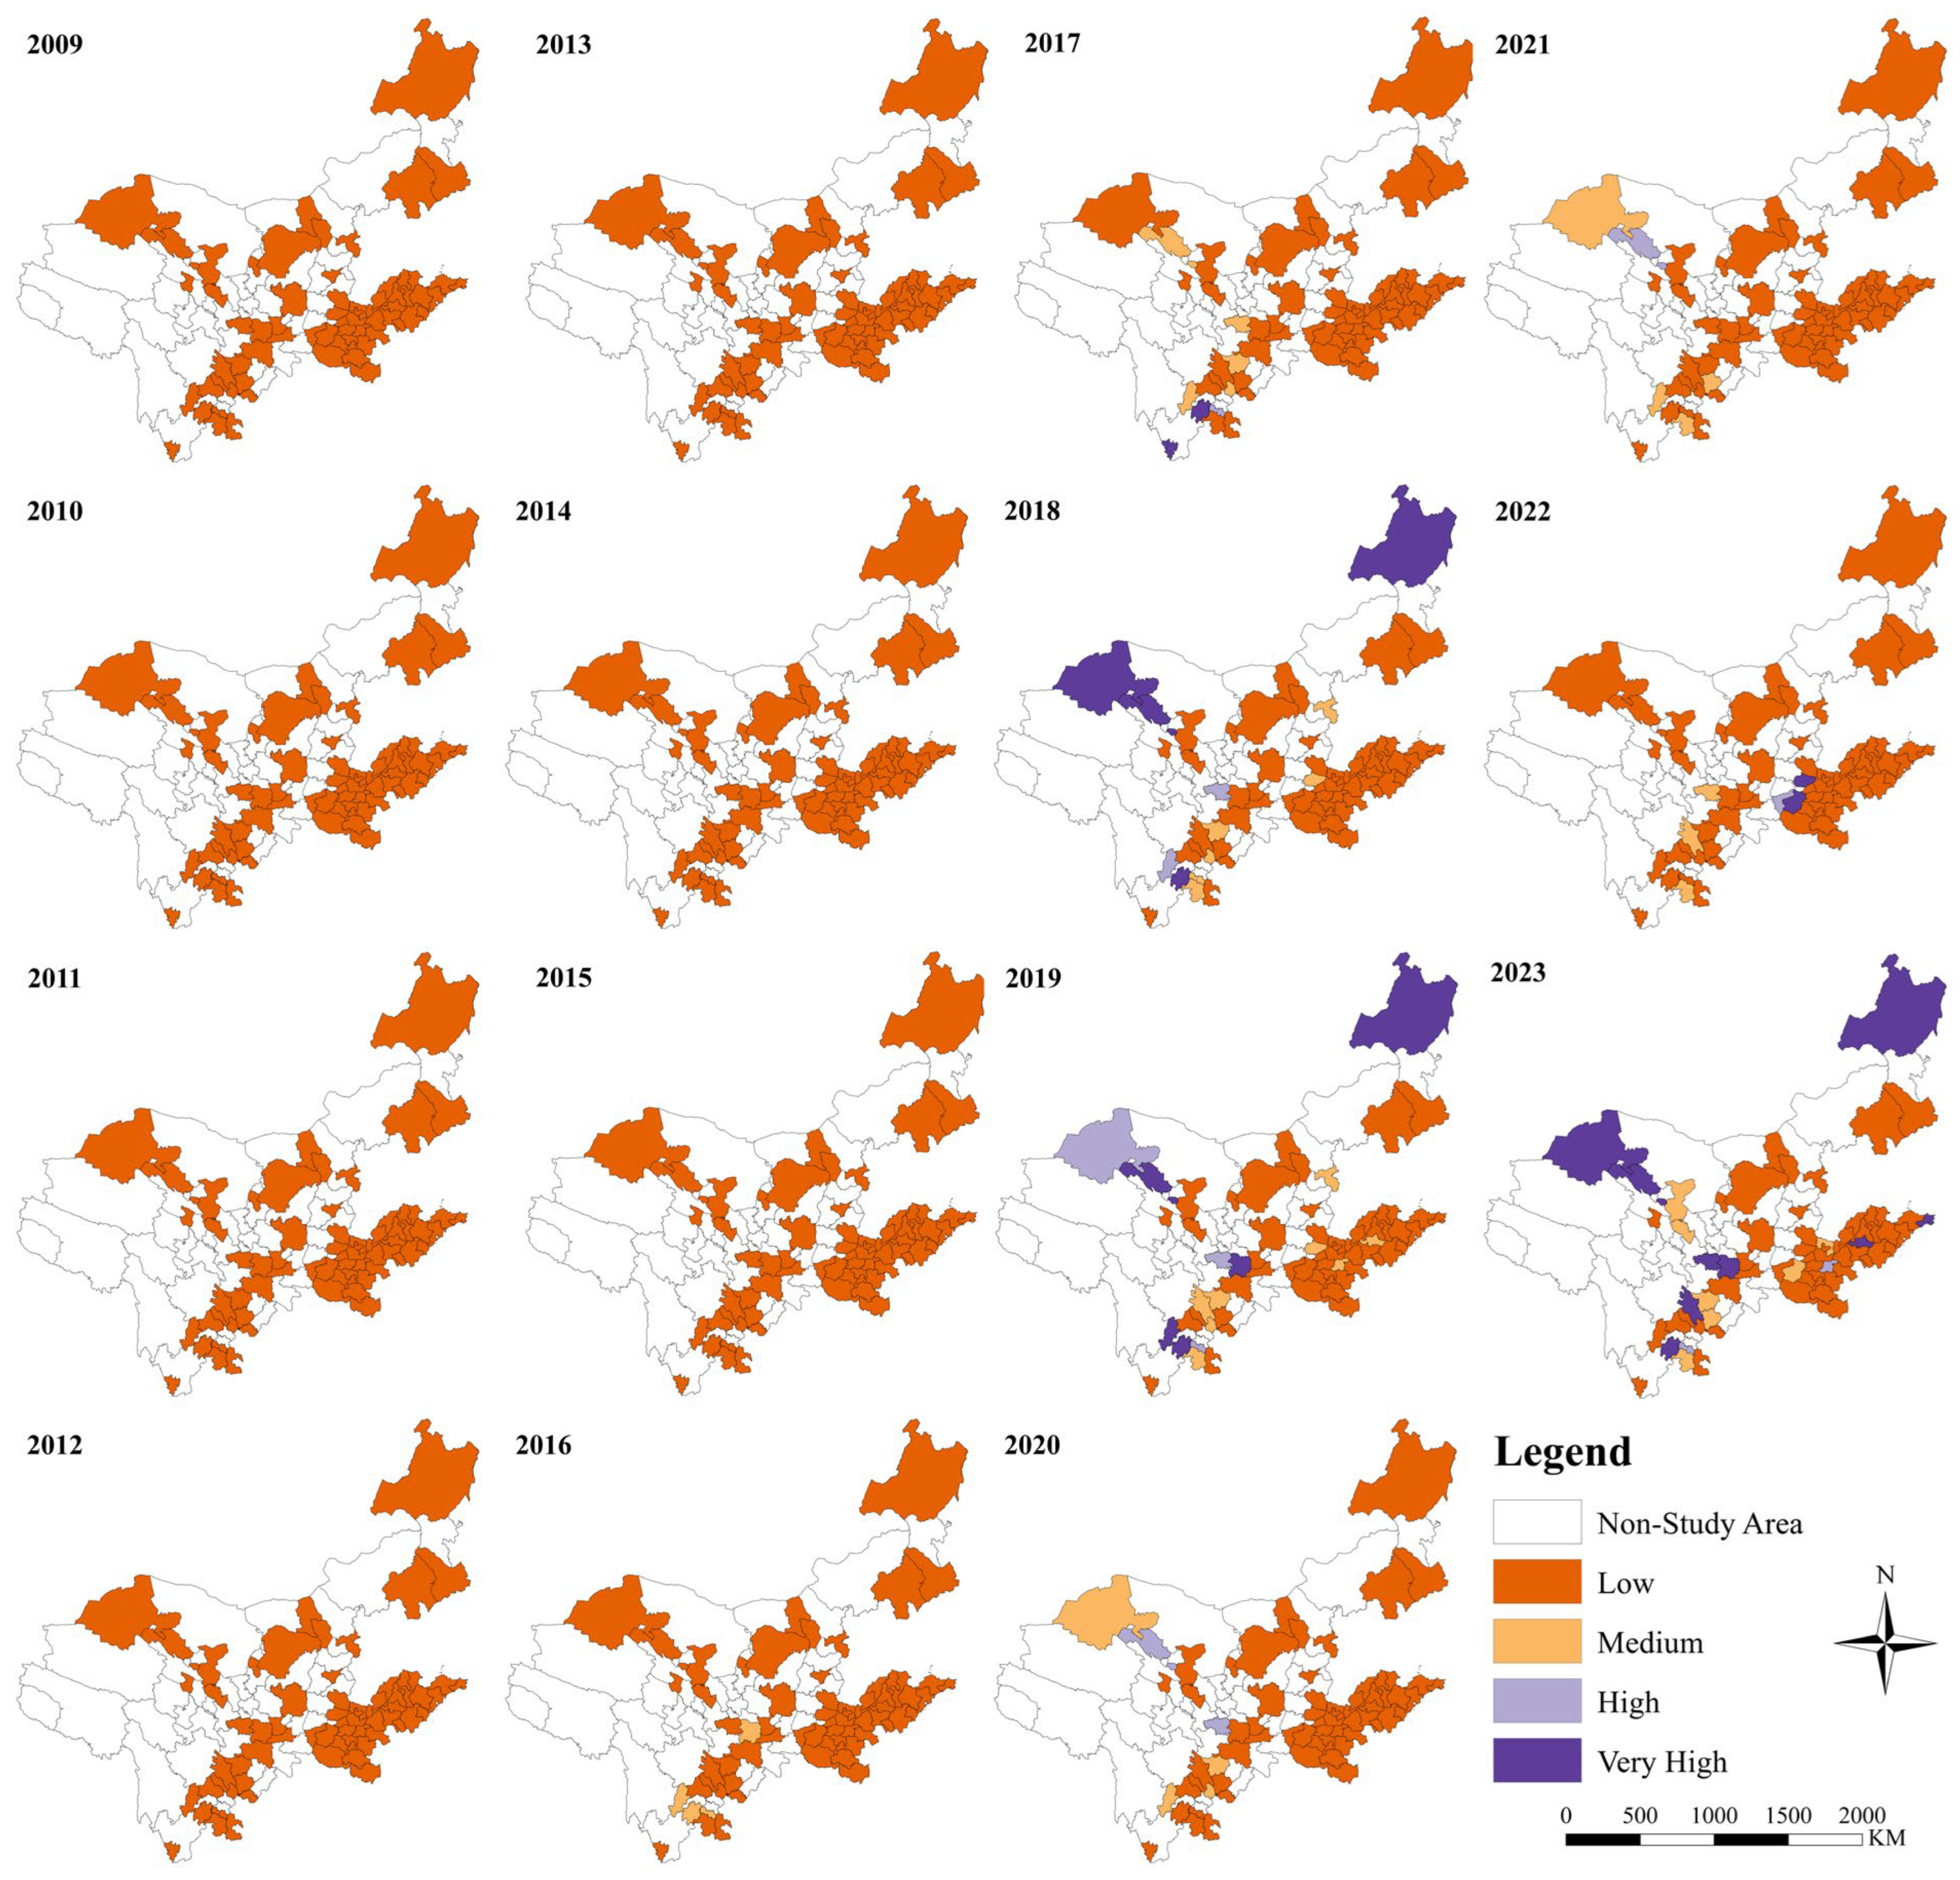
The super-efficiency SBM model (Super-SBM) was used to quantify the tourism efficiency of the Outstanding Tourist Cities in the Yellow River Basin between 2009 and 2023 and visualized in ArcGIS 10.8 (Figure 3). The findings show that there exists spatiotemporal heterogeneity in efficiency of tourism among Outstanding Tourist Cities: in general, the degree of efficiency is of a relatively low level, and the spatial pattern is “upper reaches > middle reaches > lower reaches” of the Yellow River Basin. There are only a few high-efficiency cities, which are mainly upstream and downstream provinces like Gansu, Sichuan and Shandong. There are many low-efficiency cities, which are mainly found in the middle of the Yellow River Basin and its outlets. The suggested general increasing but fluctuating pattern of tourism efficiency in the Yellow River Basin’s Outstanding Tourist Cities shows three stages of tourism efficiency: stagnant as a “bottleneck period” (2009–2015), steady as an “improvement period” (2016–2018), and volatile as an “oscillation period” (2019–2023). The proportion of low-efficiency cities declined from 100% in 2009 to 74% in 2023, and since 2015, these cities have been predominantly concentrated in middle- and lower-reach provinces such as Shaanxi, Shanxi, Henan, and Shandong. Medium-efficiency cities are spatially clustered around higher-efficiency areas, with their overall number showing an upward trend: their share increased from 0% in 2009 to 10.3% in 2023, peaking in 2019, and they are currently concentrated primarily in Gansu, Sichuan, and Henan. The share of higher-efficiency cities rose from 0% to 2.9%, primarily focused in the upper reaches of the Yellow River Basin, with a notable presence in Sichuan and Gansu in 2019. High-efficiency cities are sparsely distributed and few in number, with Sichuan Province accounting for the highest share both in terms of the count of cities as well as the quantity of years they were classified as high-efficiency.
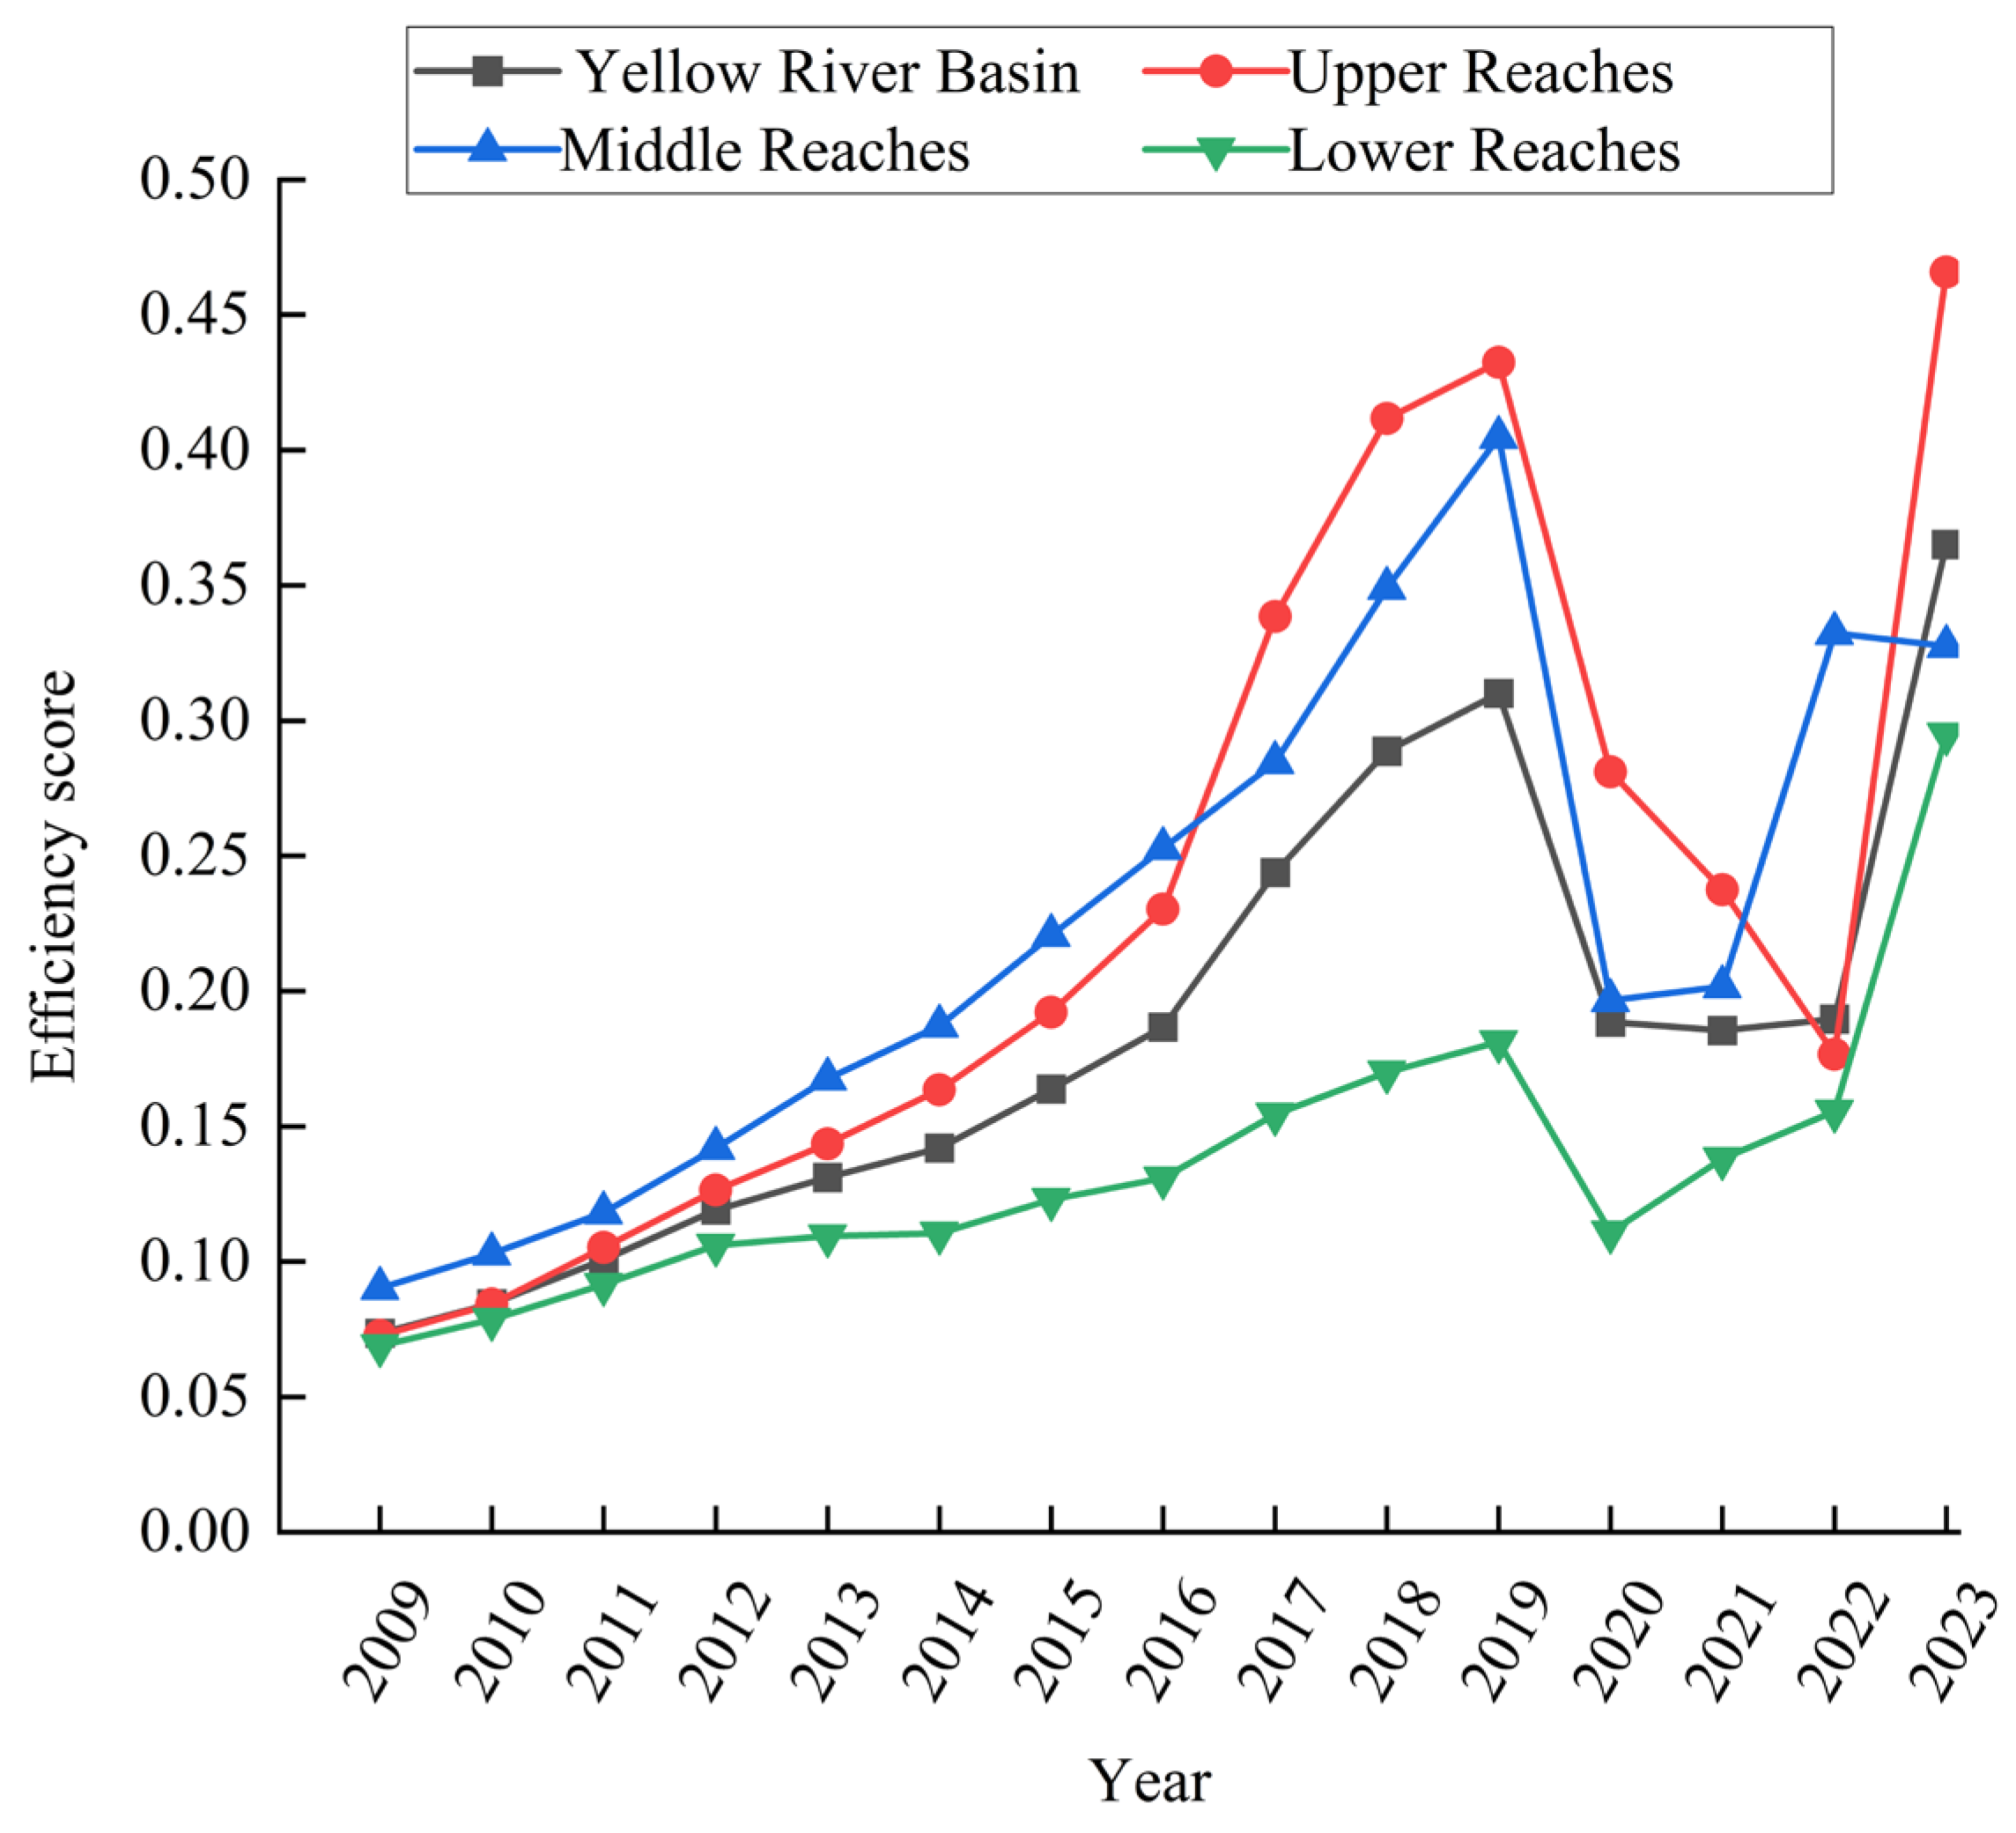
As illustrated in Figure 4, the efficiency of tourism in one of the Outstanding Tourist Cities of the Yellow River Basin has experienced great changes since 2009, and its development phase may be divided into three main periods: a “bottleneck period,” an “improvement period” and an “oscillation period.” In terms of the river segments, tourism efficiency across the Yellow River Basin generally follows an “upper reaches > middle reaches > lower reaches” pattern. According to the trend, tourism efficiency in the upper reaches of the country rose from 0.07 in 2009 to 0.19 in 2015, exhibiting an overall year-on-year upward trend. In more specific terms, it increased steadily during 2009–2015, improved rapidly in 2016–2018 and then exhibited a “V-shaped” fluctuation in 2019–2023, indicating a definite decrease and then recovery. The efficiency trends of tourism in the middle and lower reaches are the same as the general trend in the Yellow River Basin, with stronger fluctuations in the middle reaches and a more consistent trend in the lower ones.
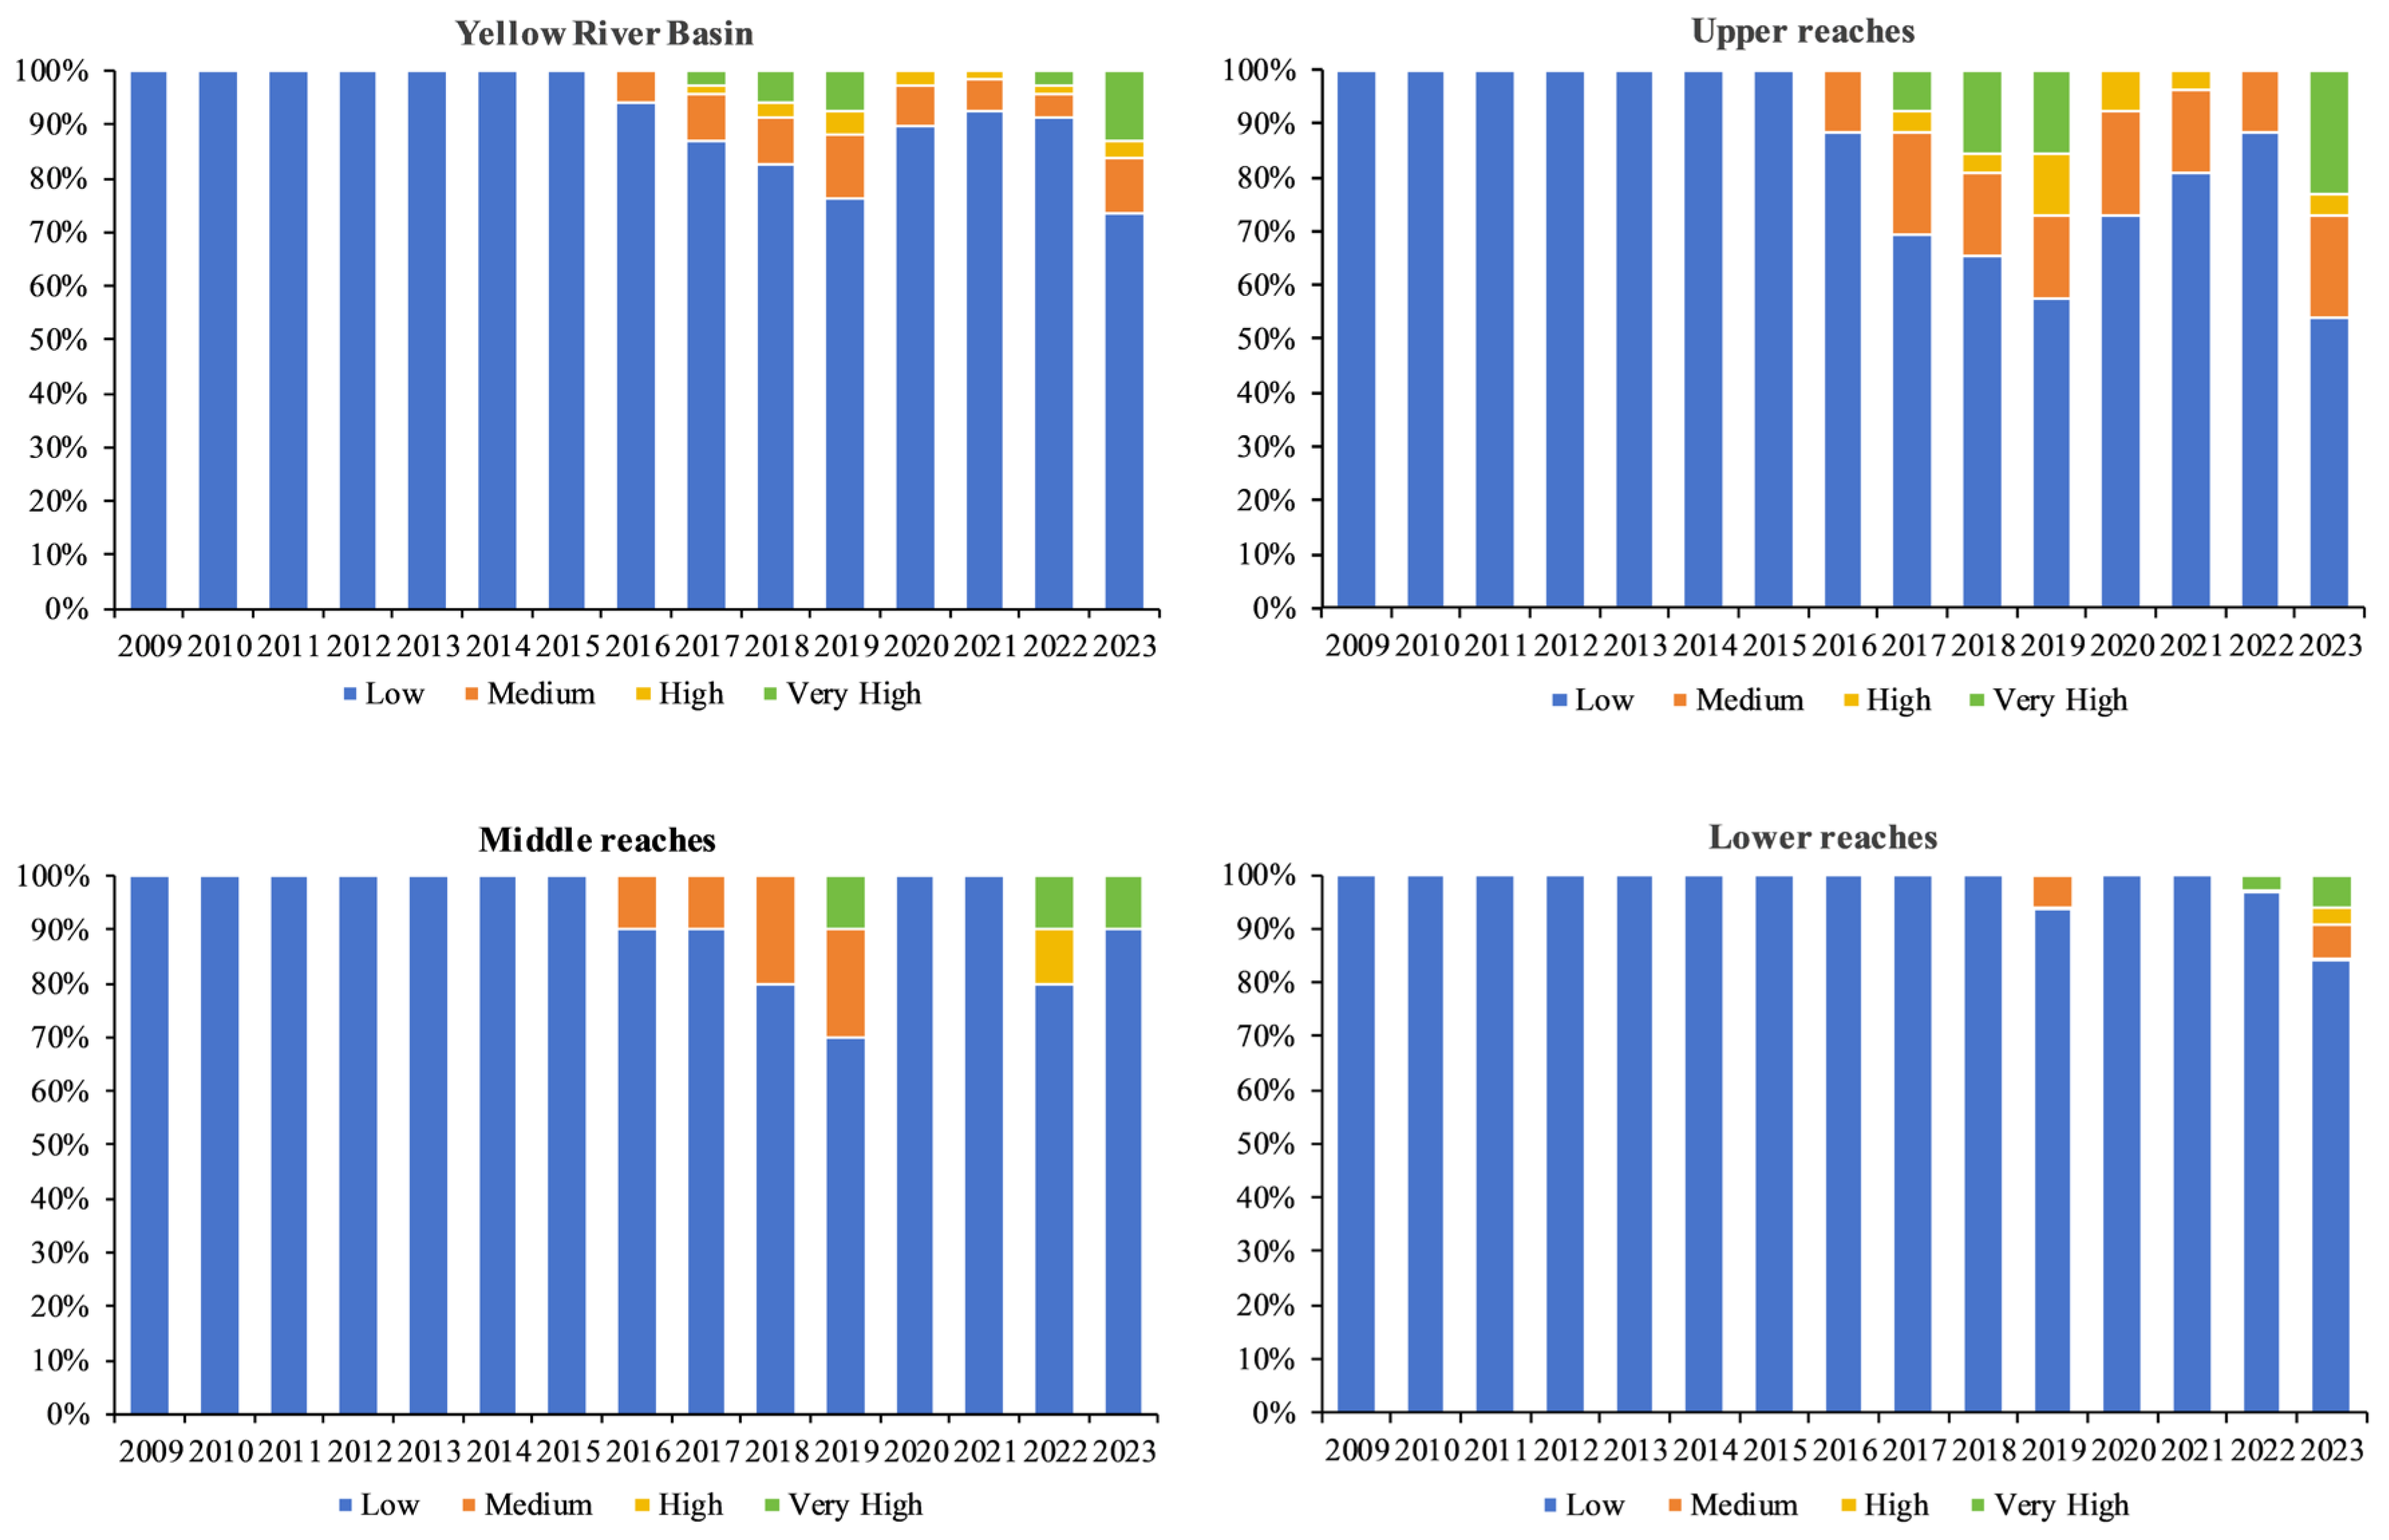
This paper is a comparison of the differences in extents between the regions in terms of the proportion of the various tourism efficiency levels across the Yellow River Basin (Figure 5), the combined share of high-, higher-, as well as medium-efficiency cities in the region has generally been on the rising curve; however, the portion of low-efficiency cities has steadily declined during the study period. Notably, the share of cities classified as high-efficiency rose steadily from 2.9% in 2017 to 13.2% in 2023. From the perspective of river segments, the upper reaches are predominantly characterized by low-efficiency cities, followed by medium- and high-efficiency cities. The middle reaches are predominantly composed of low-efficiency cities, followed by medium-efficiency cities. The lower reaches are predominantly dominated by low-efficiency cities, with other efficiency levels accounting for relatively small shares. Specifically, in the upper reaches, the share of medium-efficiency cities increased gradually from 0% in 2009 to 19.2% in 2023, while the proportion of low-efficiency cities declined from 100% in 2009 to 53.8%. In the middle and lower reaches, the share of medium-efficiency cities exhibits an oscillatory upward trend, while the proportion of low-efficiency cities shows an overall declining pattern.
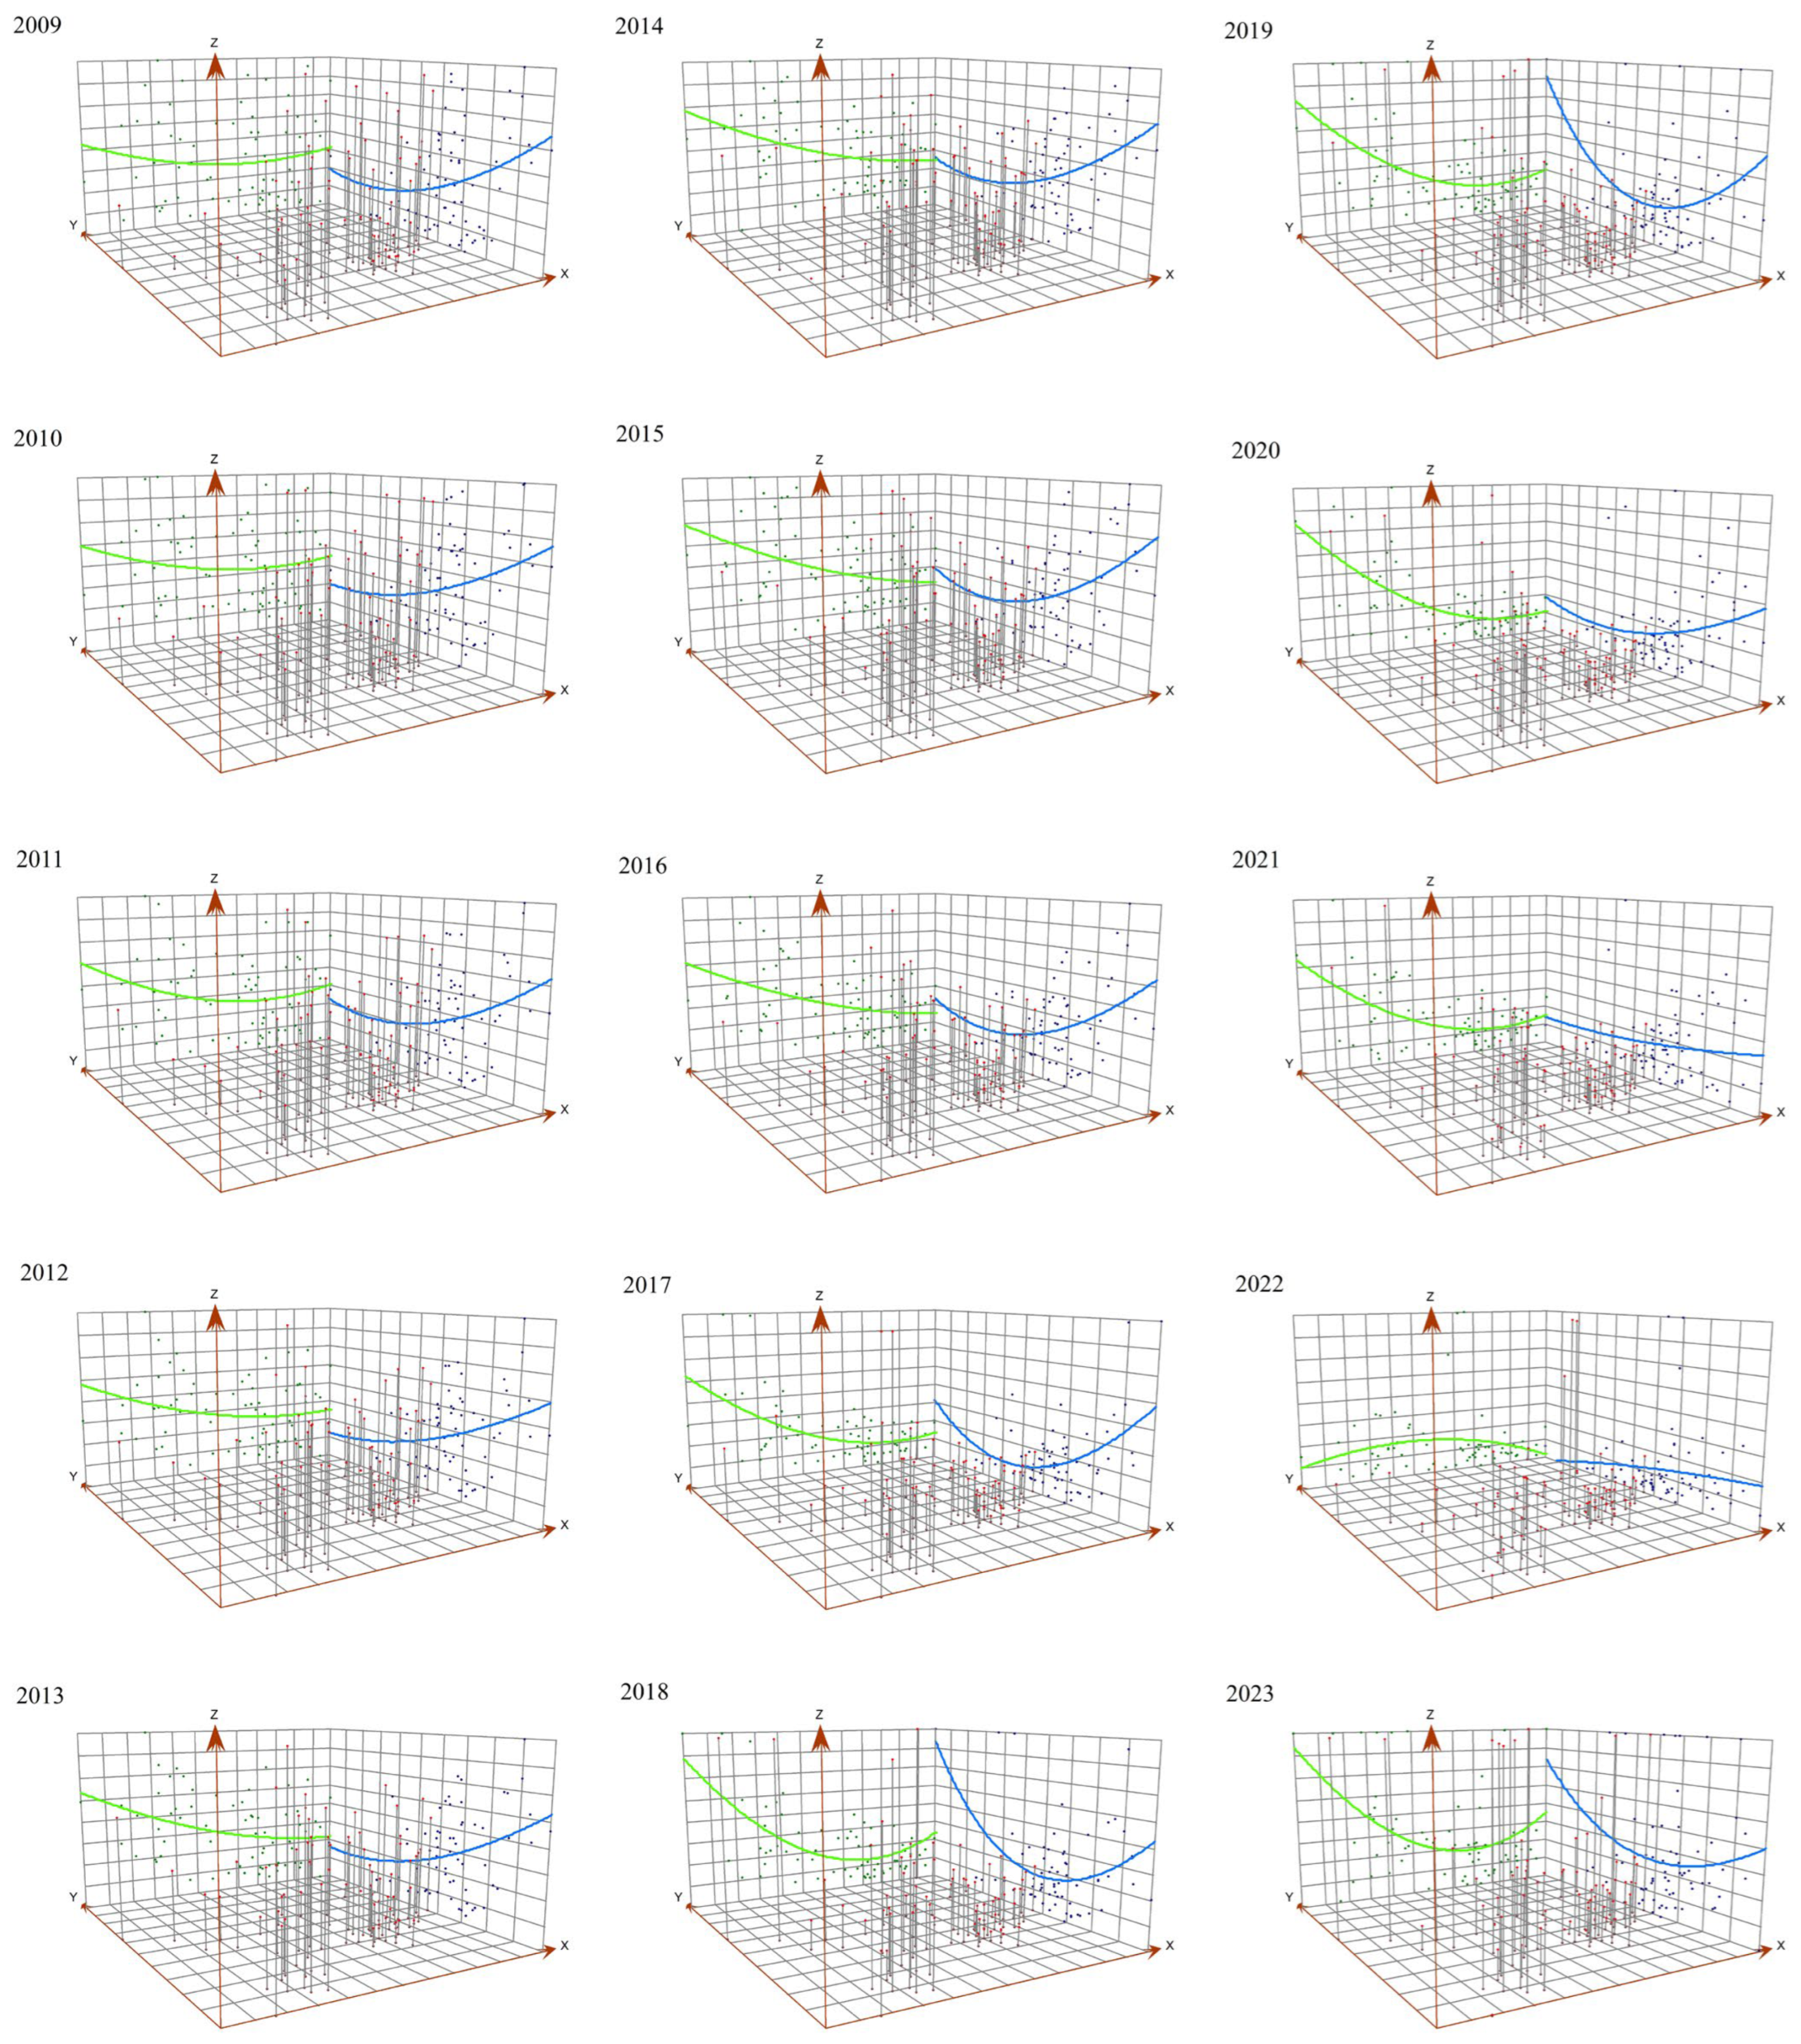
Trend surface analysis was conducted using ArcGIS to examine the spatiotemporal patterns of tourism efficiency in Outstanding Tourist Cities of the Yellow River Basin from 2009 to 2023 (Figure 6). The findings show that there is strong spatial heterogeneity of Outstanding Tourist Cities, and an overall curvilinear “west–high, east–low” distribution that runs through the eastern direction and the western direction. The slope of this curve was rather gentle during the early years, but became much steeper in later years. The spatial relation, along the north–south axis, tends to a curvilinear shape, which is “U-shaped” (concave), that is, an early depreciation followed by an increase later. In the years 2009–2017, the east–west trend curve showed a relatively gentle slope and in the years 2018–2021, the slope became very steep. In 2022, the east–west trend curve exhibited a relatively flat profile, with lower values at both eastern and western ends and slightly higher values in the central region. In 2023, the slope became steeper again, reverting to a pronounced east–west gradient. Tourism efficiency on the north–south axis shows a more pronounced curvilinear fluctuation with the characteristic trend of an overall U-shaped birth–death (decline-then-rise) trend. In 2009–2018, the curve was concave, but it became gradually flatter in 2019–2022, and concave again in 2023.
The aforementioned spatiotemporal differentiation pattern of tourism efficiency is highly coupled with the resource endowment characteristics and tourism development stages across the upper, middle, and lower reaches of the basin. In terms of spatial differentiation, the upper reaches, endowed with unique natural and cultural tourism resources, exhibit high input–output efficiency at the current development stage. This is attributed to a strong alignment between factor inputs and resource carrying capacity, with no significant factor redundancy observed thus far. Furthermore, continuous improvements in transportation infrastructure in recent years have further unlocked the region’s tourism development potential, driving a steady increase in its tourism efficiency. The middle and lower reaches are characterized by substantial tourism factor inputs and relatively sufficient industrial scale expansion. However, significantly constrained by the homogenization of tourism products, these regions exhibit diminishing marginal returns to factor inputs and insufficient momentum for intensive development, resulting in a comparatively low level of overall tourism efficiency. In terms of temporal evolution, the period from 2009 to 2015 constituted an efficiency bottleneck phase, coinciding with the extensive expansion stage of China’s tourism industry. During this period, local governments generally exhibited a scale-oriented preference for tourism investment, prioritizing industrial scale expansion over quality and profitability. This led to a development dilemma characterized by “high inputs but low outputs,” a pattern that was particularly pronounced in the input-intensive middle and lower reaches. The period from 2016 to 2018 marked an efficiency improvement phase, primarily driven by the continuous optimization of the tourism industrial structure and the in-depth advancement of supply-side structural reforms in the tourism sector. During this stage, the overall development quality of the basin’s tourism industry gradually improved, with varying degrees of efficiency gains observed across the upper, middle, and lower reaches. The period from 2019 to 2023 was characterized as an efficiency fluctuation phase, primarily driven by external shocks such as the COVID-19 pandemic. Both the supply and demand sides of the tourism industry experienced significant disruptions, with the mature tourism markets in the middle and lower reaches being more severely affected. Consequently, the overall tourism efficiency of the basin exhibited pronounced volatility.

3.2. Spatiotemporal Patterns of Tourism Efficiency

Global Moran’s I index for tourism efficiency in Outstanding Tourist Cities of the Yellow River Basin was calculated using GeoDa 1.22 software for the period 2009–2023 (Table 3), revealing significant spatial dependence among these cities. During the study period, Moran’s I values of tourism efficiency for the 68 Outstanding Tourist Cities fluctuated between 0.037 and 0.389, all significant at the 1% level, resulting in the rejection of the null hypothesis of spatial randomness. The results indicate a pronounced spatial clustering of tourism efficiency among Outstanding Tourist Cities in the Yellow River Basin, with significant positive spatial autocorrelation. Cities with higher tourism efficiency tend to be spatially proximate to one another, while those with lower efficiency also cluster in adjacent areas, exhibiting consistent positive spatial autocorrelation.
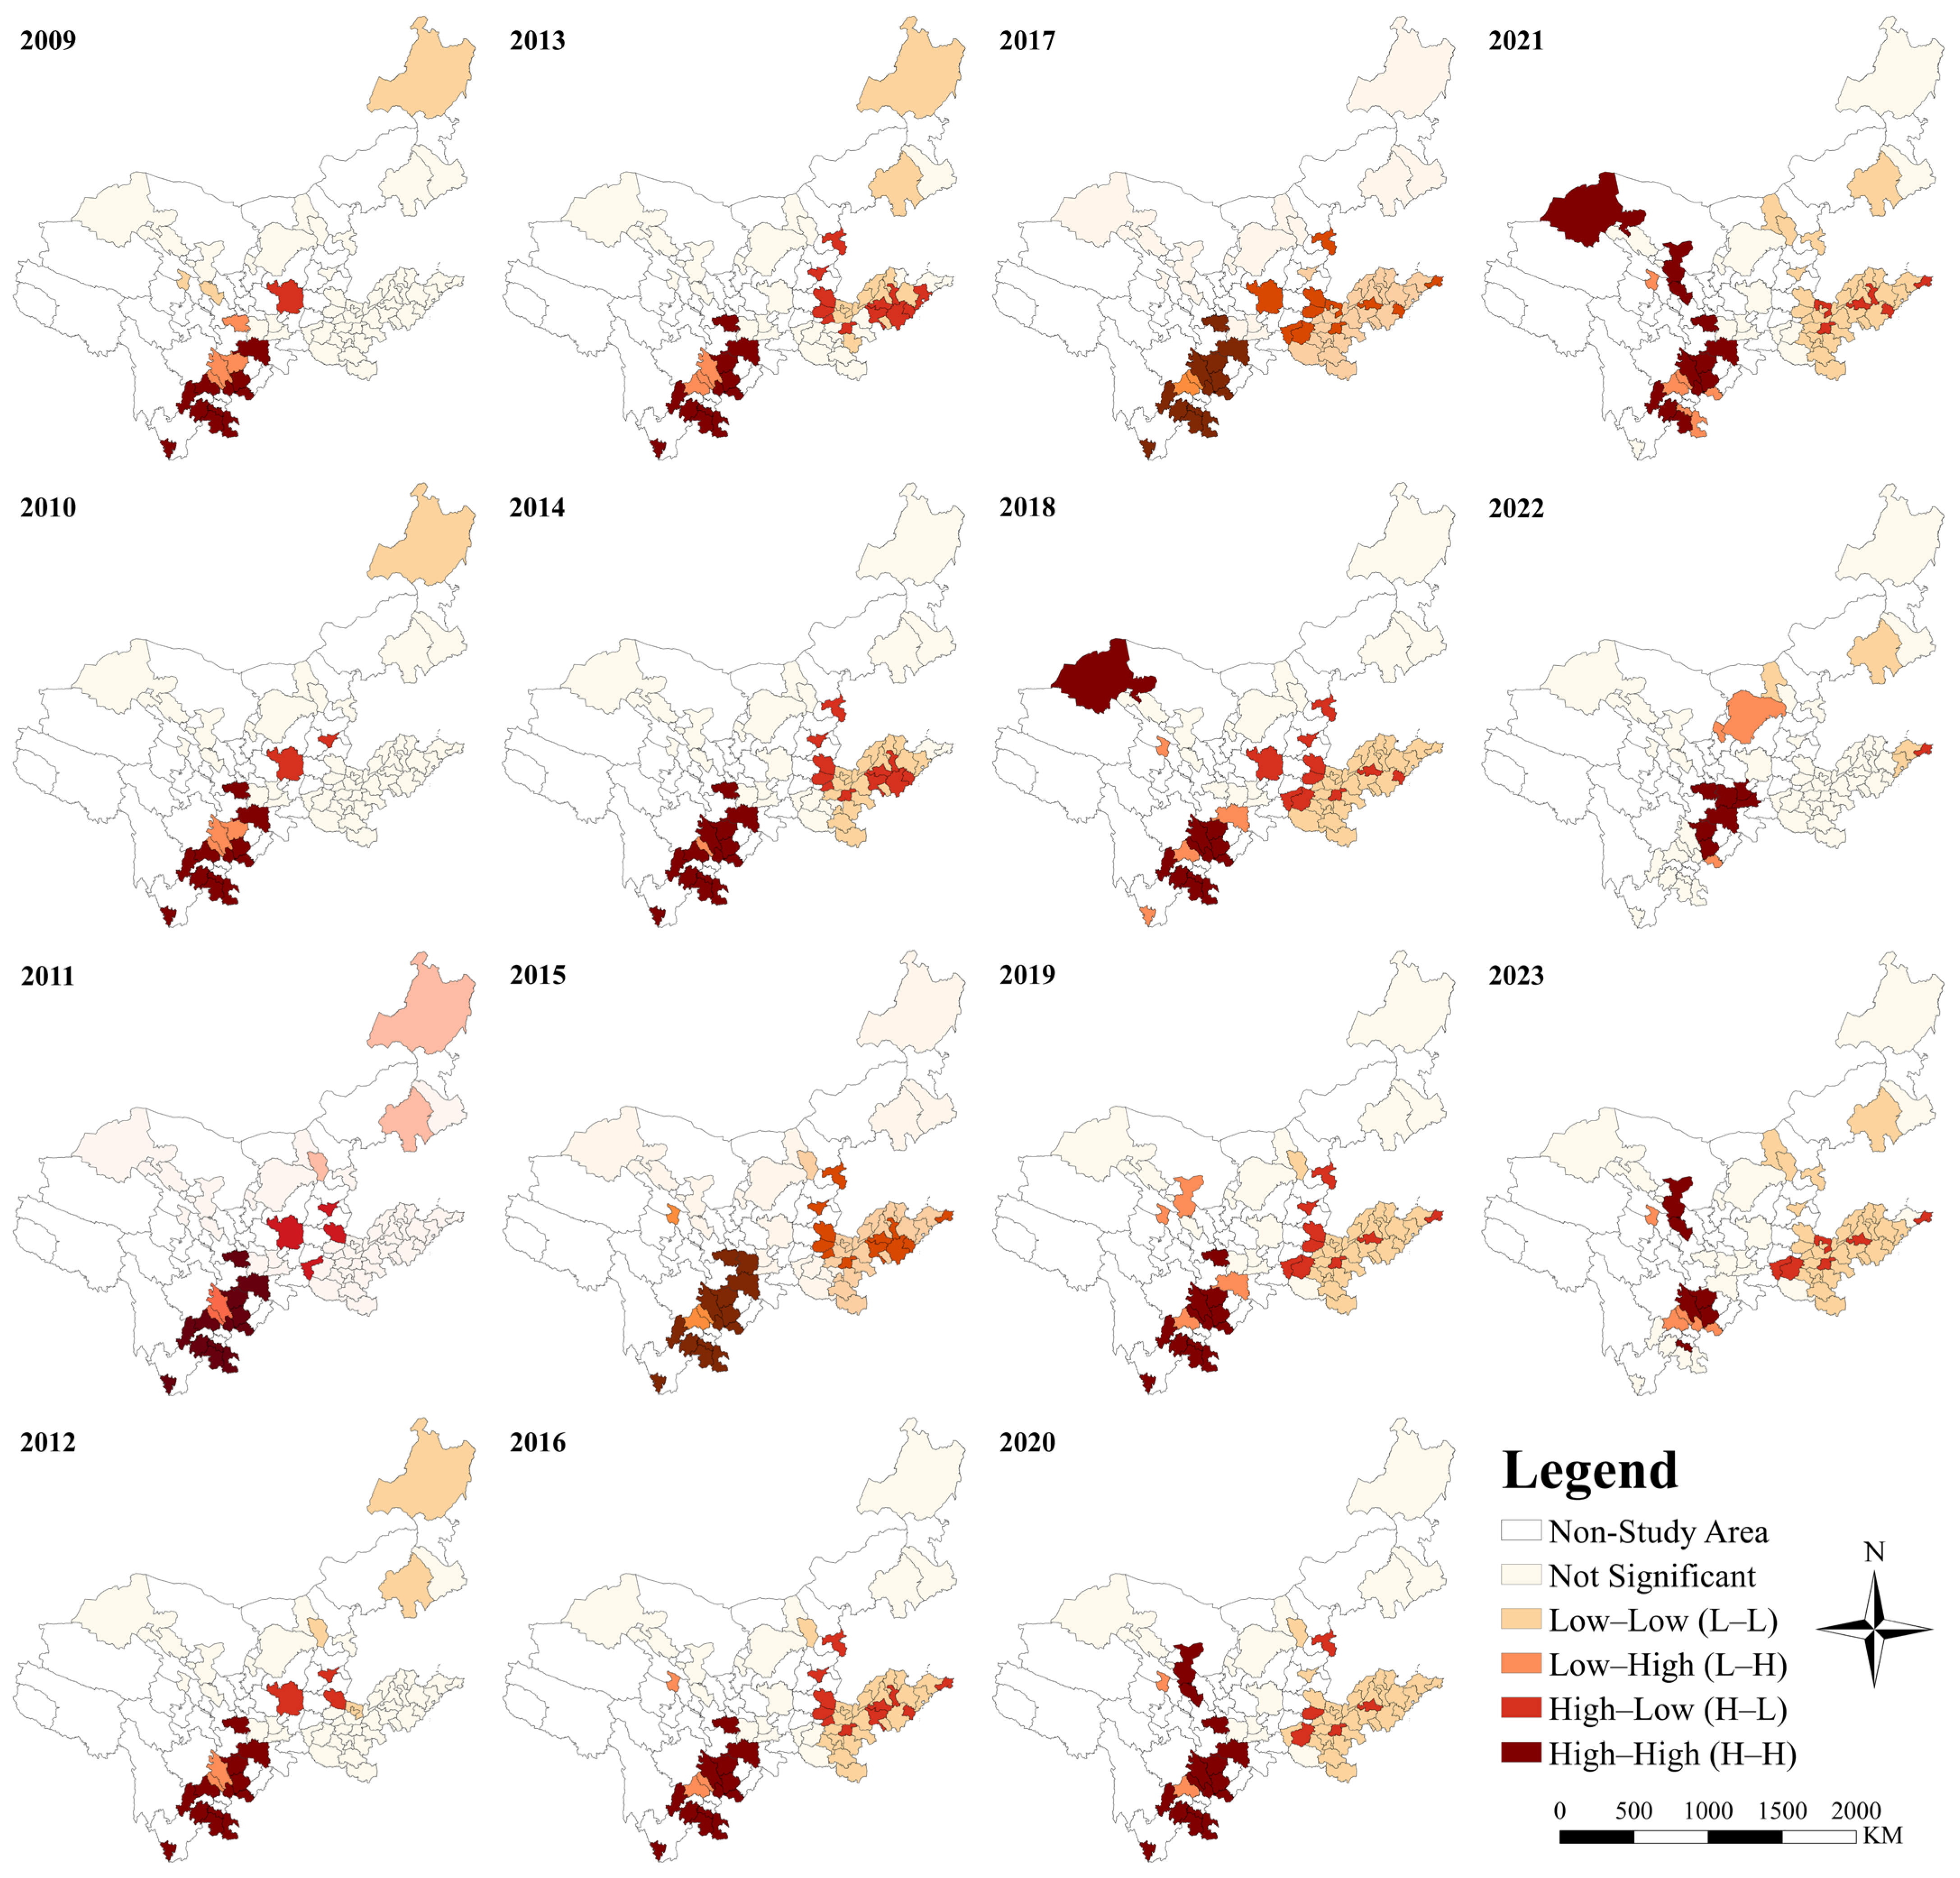
To further investigate spatial dependence characteristics of tourism efficiency in Outstanding Tourist Cities of the Yellow River Basin, using GeoDa software platform, the Local Moran’s I index of tourism efficiency was calculated for Outstanding Tourist Cities in the Yellow River Basin over the period 2009–2023, alongside the resulting local spatial association patterns, which were visualized using ArcGIS. The results are shown in Figure 7; Outstanding Tourist Cities exhibit pronounced spatial disparities in tourism efficiency, with dominant high–high (H–H) and low–low (L–L) clusters, and minor high–low (H–L) and low–high (L–H) outliers. High–high (H–H) clusters are primarily concentrated in upstream cities, including Tianshui and Zhangye in Gansu, Panzhihua, Yibin, and Leshan in Sichuan, and Hanzhong in Shaanxi. The spatial extent of these clusters exhibited a “contraction–expansion–contraction” fluctuation pattern, with the agglomeration effect peaking in 2020. Low–low (L–L) clusters were concentrated in upstream cities—including Hulunbuir, Chifeng, and Hohhot in Inner Mongolia—during 2009–2011. Between 2014 and 2018, they shifted to cities like Zhumadian, Xuchang, and Zhoukou in Henan, and Heze, Binzhou, and Dezhou in Shandong. During 2019–2021 and again in 2023, they were observed in cities including Hohhot (Inner Mongolia), Taiyuan (Shanxi), Shangqiu (Henan), and Weifang (Shandong). High–low (H–L) and low–high (L–H) outliers are sparsely distributed, primarily observed in cities such as Deyang and Chengdu (Sichuan), Hanzhong and Yan’an (Shaanxi), Kaifeng and Luoyang (Henan), and Weihai and Tai’an (Shandong). These outliers are concentrated in the middle and lower reaches of the Yellow River Basin and remain relatively few in number.
The differentiated spatial agglomeration pattern of high–high (H–H) and low–low (L–L) tourism efficiency is the joint outcome of tourism resource endowments, regional tourism cooperation levels, and industrial spatial spillover effects. The high–high (H–H) agglomeration formed in the upper reaches of the Yellow River is primarily underpinned by the contiguous concentration of high-quality tourism resources across Sichuan, southern Gansu, and southern Shaanxi. This advantage, reinforced by the sustained advancement of regional cooperation mechanisms such as the Northwest-Sichuan Tourism Loop, has further amplified the positive spatial spillover effects of tourism production factors, ultimately fostering a spatial pattern of coordinated regional development and mutual benefit. In contrast, the low–low (L–L) agglomeration in the lower reaches of the Yellow River stems primarily from the high degree of homogeneity in traditional cultural tourism resources across cities in eastern Henan and northwestern Shandong. Inter-city tourism development is characterized predominantly by competition rather than cooperative linkage, making it difficult to generate effective industrial spatial spillovers and consequently trapping the region in a development dilemma of low-value lock-in. The temporal fluctuations in tourism agglomeration scale are highly coupled with regional policy adjustments. The peak of tourism agglomeration effects observed in 2020 coincided precisely with the implementation of the major national strategy for ecological protection and high-quality development of the Yellow River Basin, corroborating that regional coordinated development policies can effectively strengthen the spatial linkages of tourism development benefits.
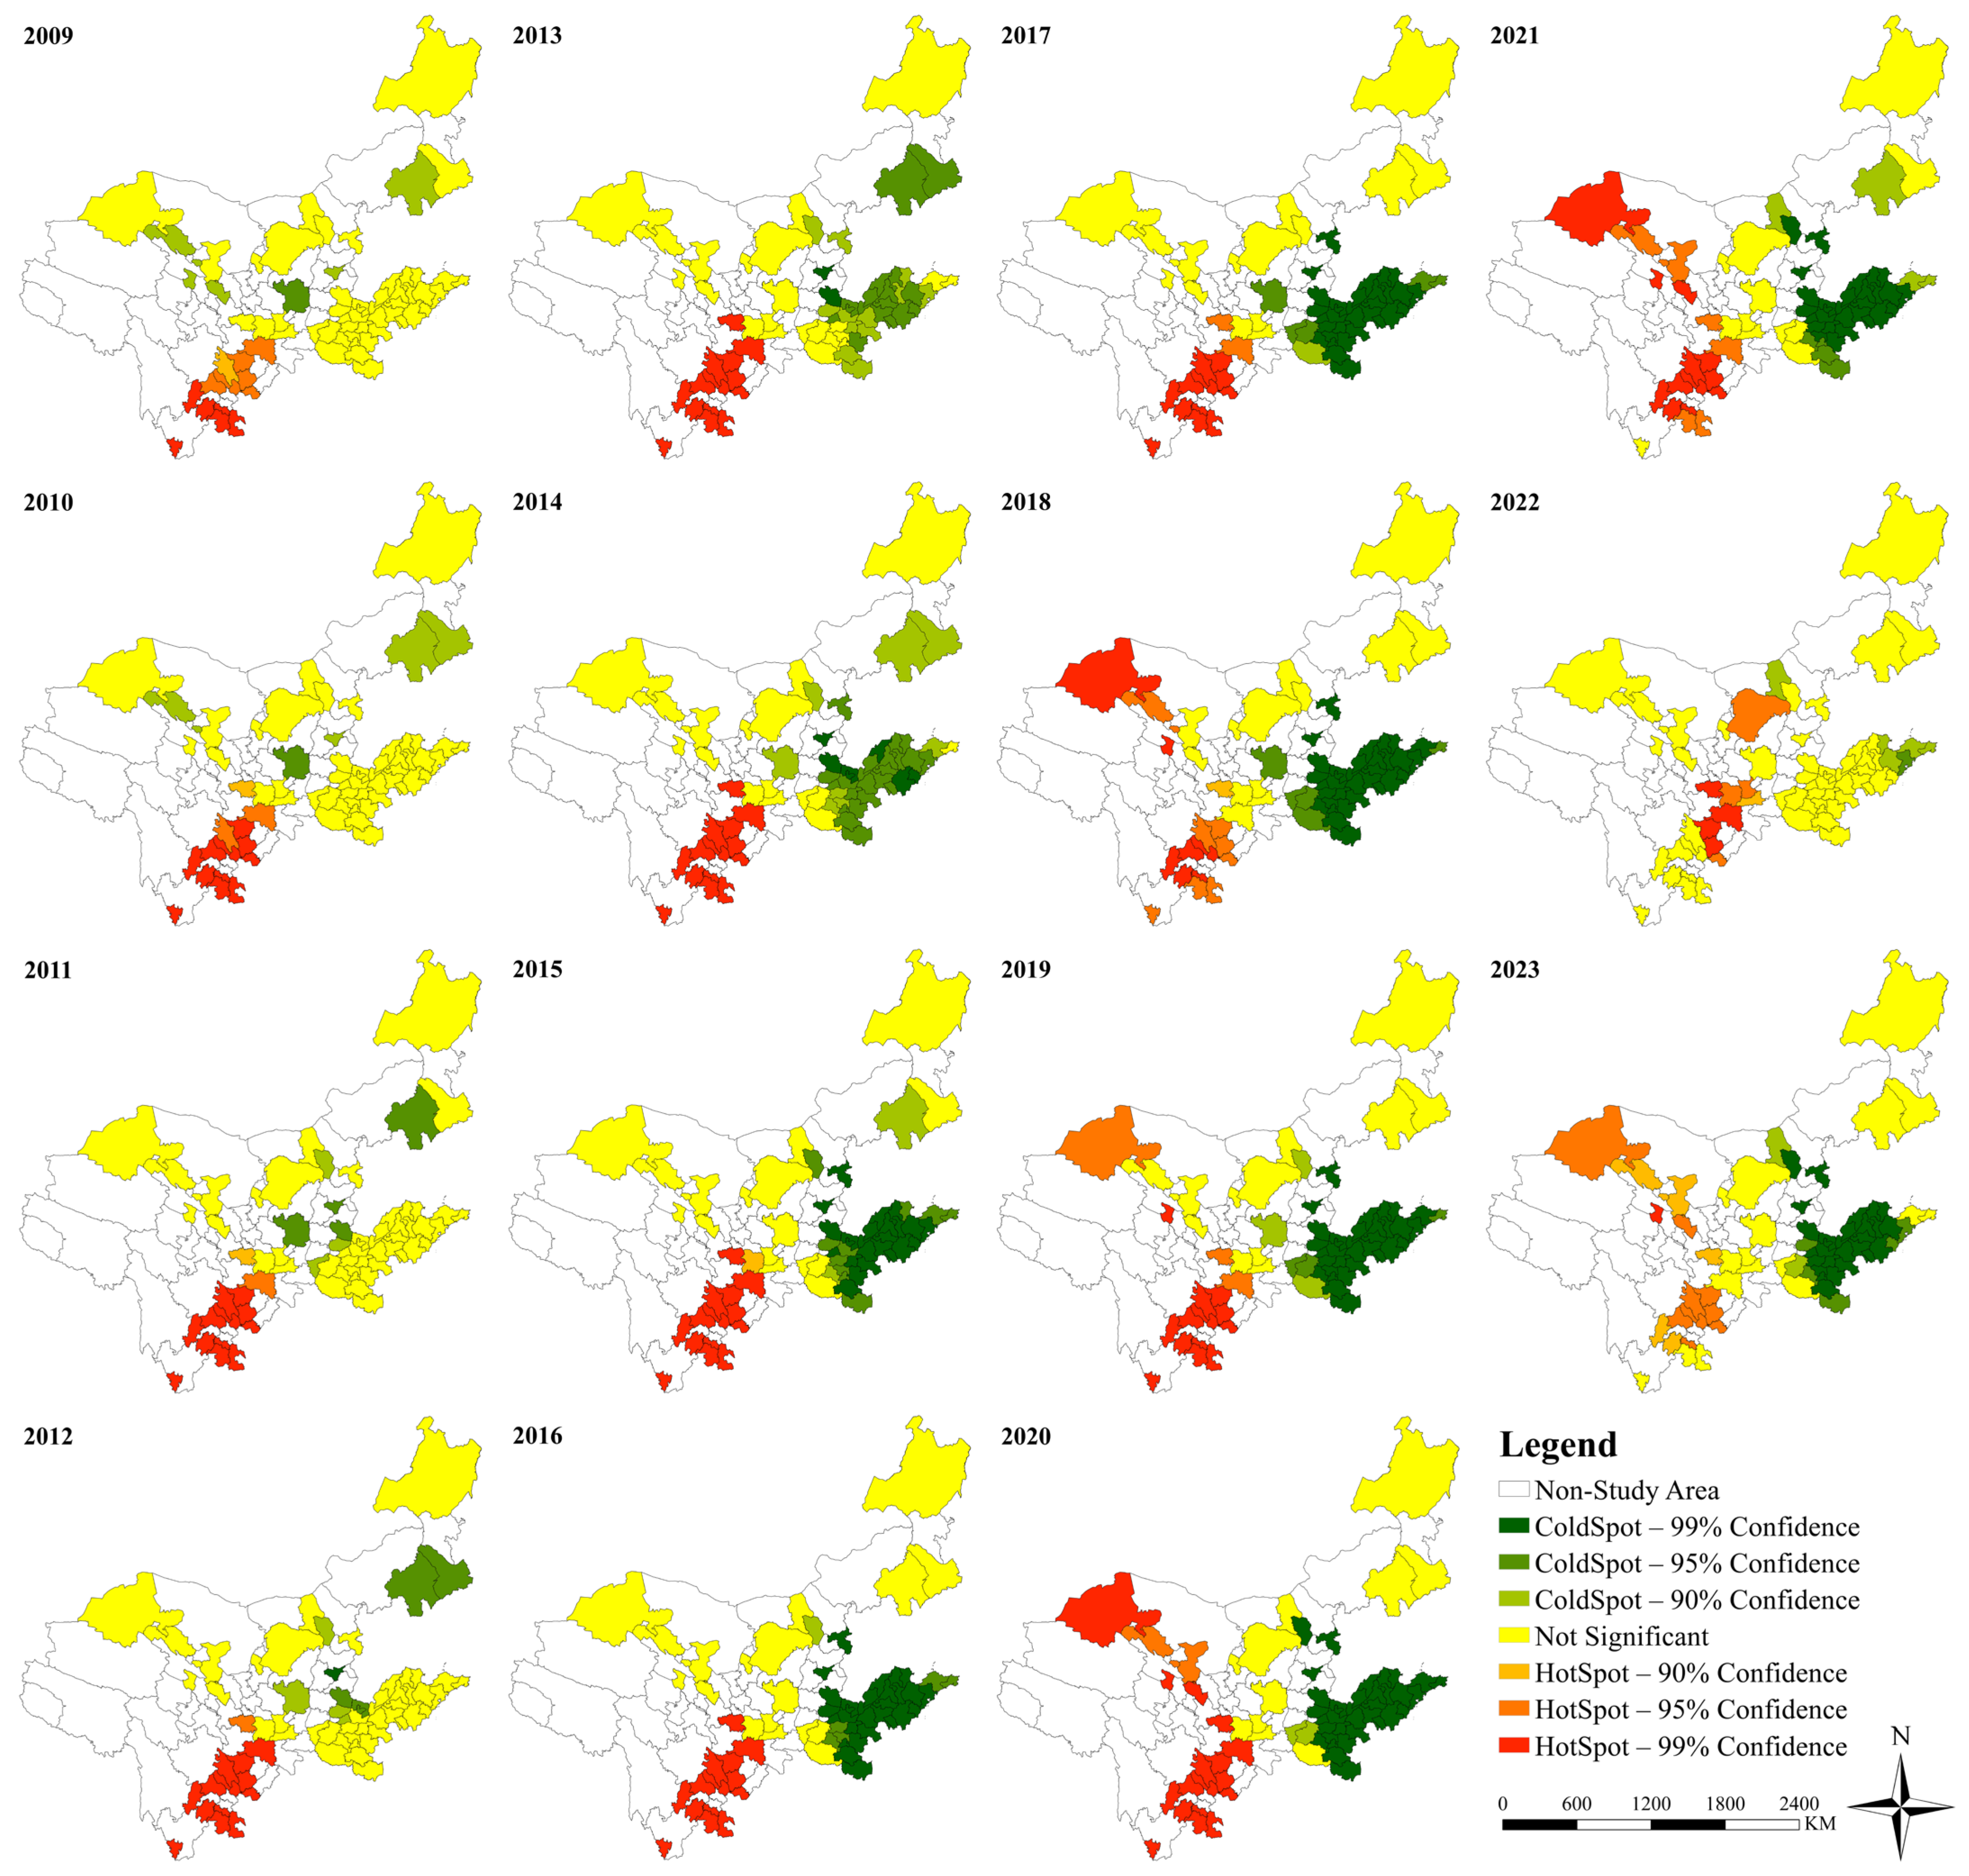
Using the Hot Spot Analysis (Getis-Ord Gi∗) tool in ArcGIS, this study analyzed tourism efficiency in Outstanding Tourist Cities of the Yellow River Basin and classified the study units into hotspots (high–high clusters) as well as coldspots (low–low clusters) at significance levels of 99%, 95%, and 90%. As shown in Figure 8, significant hotspots and coldspots in the Yellow River Basin are predominantly located in upstream and downstream cities, respectively, forming largely contiguous clusters, with only a few areas exhibiting scattered distributions. Sub-hotspots and sub-coldspots are located in the peripheral areas surrounding the significant hotspots and coldspots. From 2009 to 2017, significant hotspots were primarily concentrated in upstream cities of Sichuan Province—including Panzhihua, Luzhou, Yibin, Zigong, Leshan, and Ya’an—with sub-significant hotspots located in their surrounding areas, and the overall hotspot extent gradually expanded over time. Between 2022 and 2023, significant hotspots rapidly contracted to just four cities: Nanchong and Guangyuan in Sichuan, Tianshui in Gansu, and Hanzhong in Shaanxi. From 2009 to 2013, significant coldspots were scattered across downstream cities. Between 2014 and 2021, and again in 2023, significant coldspots were predominantly concentrated in downstream areas—particularly in cities of Henan and Shandong—with the remaining scattered across Datong, Taiyuan, and Hohhot. Sub-coldspots exhibited a spatial pattern largely consistent with that of significant coldspots, though their extent gradually diminished over time.
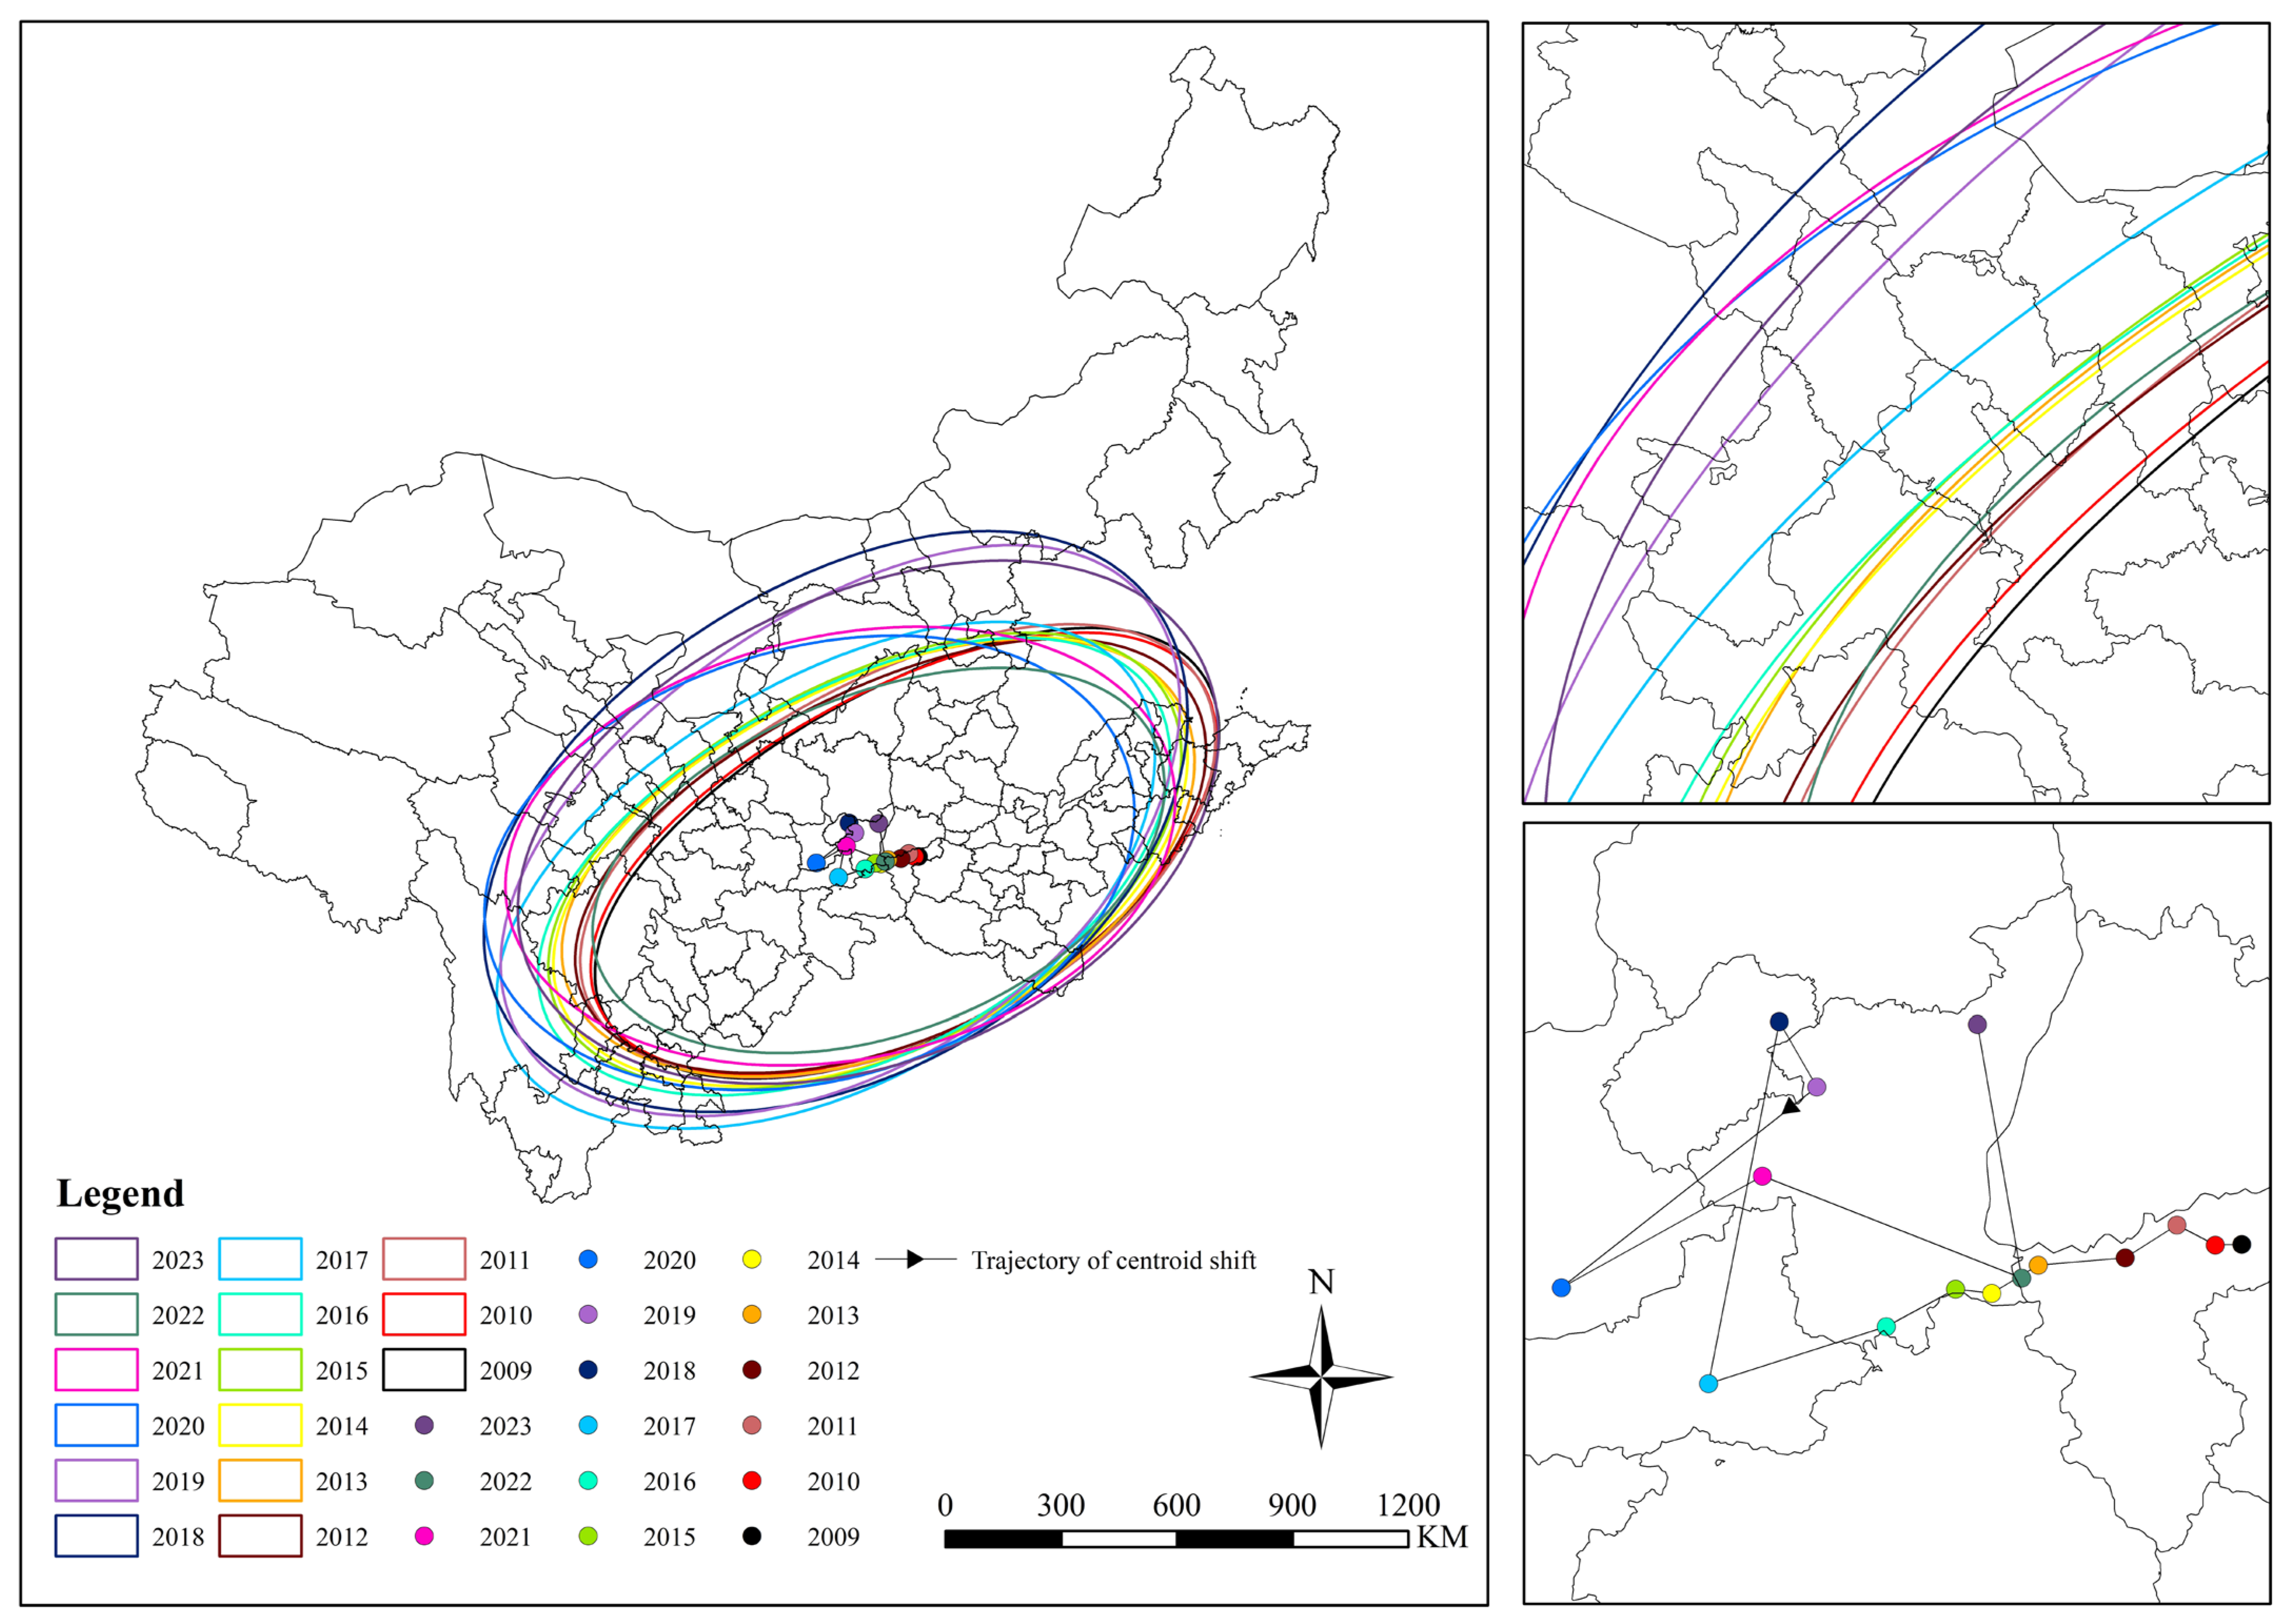
Using the SDE and Mean Center tools in ArcGIS, this study analyzed the spatial distribution of tourism efficiency in Outstanding Tourist Cities of the Yellow River Basin from 2009 to 2023 (Figure 9). The SDEs of tourism efficiency in Outstanding Tourist Cities are relatively narrow, exhibiting an east–west directional trend that shifts “from east to west and then back to east,” and a north–south trend that moves “from north to south and then back to north.” From 2009 to 2017, the westernmost extent of the SDE was located in Ya’an; from 2018 to 2020, it shifted to Yibin; and in 2021, 2022, and 2023, it was successively situated in Meishan, Ziyang, and Zigong, respectively. From 2009 to 2013, the trajectory of the mean center showed little change, remaining concentrated in the northwest of Sanmenxia City. From 2014 to 2017, the mean center shifted markedly, gradually moving from Sanmenxia toward Xi’an; it further relocated to Xianyang in 2020, and then returned to within Sanmenxia City by 2022.
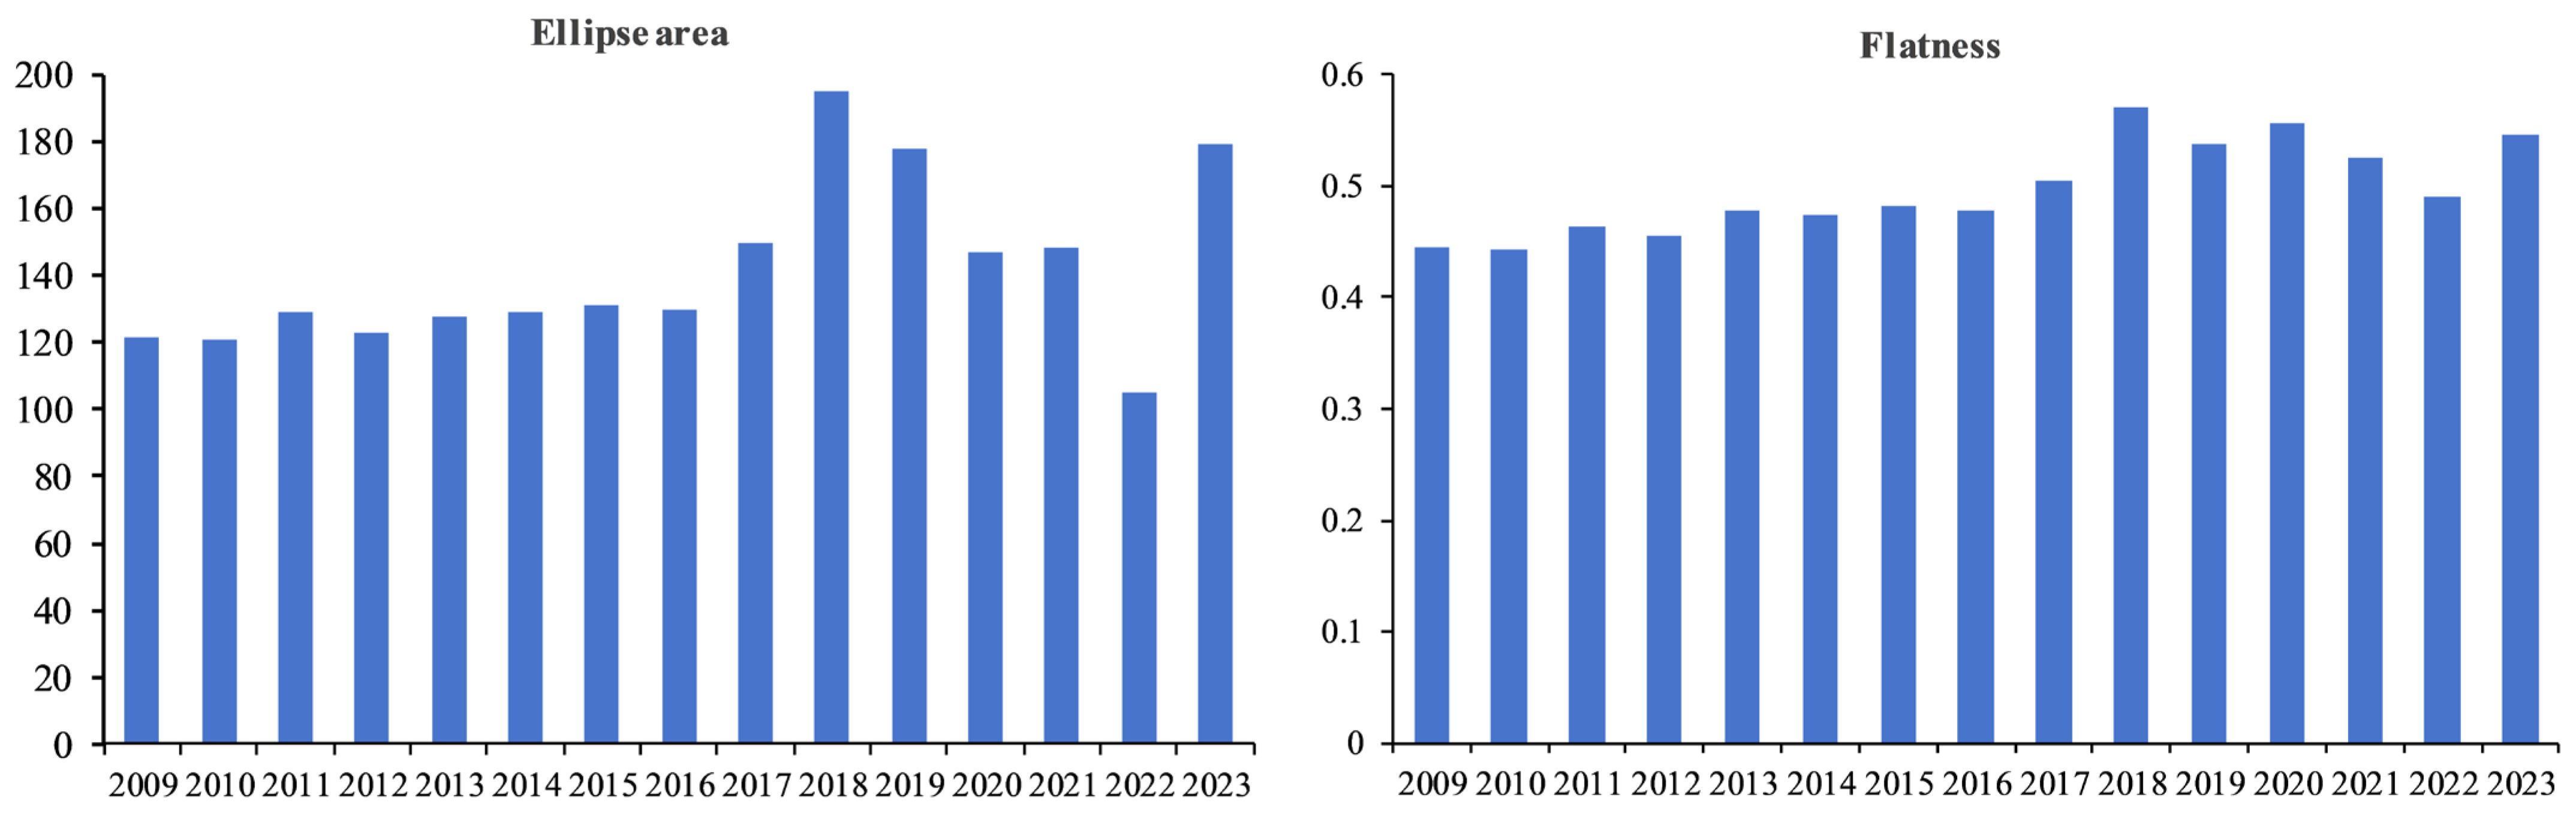
Using the semi-major and semi-minor axes of the SDE, this study calculated the ellipse area and flattening to characterize the spatial dispersion and directional anisotropy of tourism efficiency in Outstanding Tourist Cities of the Yellow River Basin from 2009 to 2023 (Figure 10). The area of the SDE for tourism efficiency in Outstanding Tourist Cities exhibited pronounced fluctuations, showing an overall upward trend with intermittent increases and decreases. From 2009 to 2016, the area of the SDE exhibited modest fluctuations with a gradual upward trend; it then surged sharply during 2017–2018, contracted dramatically between 2019 and 2022, and expanded substantially again in 2023. The flattening of the SDE initially exhibited a fluctuating upward trend, followed by a period of fluctuating decrease; nevertheless, it showed an overall increasing tendency over the study period. Flattening showed a fluctuating upward trend from 2009 to 2017, followed by a fluctuating decline between 2018 and 2022. The flattening values in 2018, 2020, and 2023 were notably higher than in other years, indicating that the spatial distribution of tourism efficiency exhibited greater directional anisotropy and more pronounced interannual variation during these periods.

3.3. Analysis of Influencing Factors on Tourism Efficiency

3.3.1. Variable Selection for the Mode

Guided by the principles of scientific rigor and systematicity in indicator selection, as well as data availability, this study adopts classical economic growth theory as its analytical framework and constructs an indicator system for the determinants of tourism efficiency by drawing on relevant literature [15,19]. The theoretical basis for each variable is as follows: Economic development level (PGDP), grounded in Maslow’s hierarchy of needs theory, enhances residents’ tourism consumption capacity, expands market demand, and provides financial support for infrastructure construction, thereby exerting a positive effect on tourism efficiency [15]. The industrial structure (IND), grounded in industrial structure upgrading theory, posits that an increased share of the tertiary sector improves supporting industrial facilities and optimizes the allocation efficiency of tourism factors [19]. Human capital (HR), grounded in endogenous growth theory, serves as a core carrier of technological and service upgrading, facilitating the diffusion of advanced management practices and thereby enhancing tourism efficiency [27]. Market potential (MARKET), grounded in new economic geography and market size theory, posits that an expanded consumer market enhances tourism operational efficiency through economies of scale [18]. Openness (OPEN), grounded in new trade theory, generates technology spillover effects through foreign direct investment, management expertise, and international tourist flows; however, excessive reliance on foreign capital may crowd out domestic enterprises, rendering its impact heterogeneous [15]. Infrastructure (FRU), grounded in public goods theory, reduces travel costs and enhances destination accessibility; however, overinvestment may lead to capital idleness and inhibit efficiency gains [33]. Government policy (GOV), grounded in government intervention theory, improves tourism public services and guides industrial development; however, excessive intervention may distort market mechanisms [19].
In this study, SPSS 30 was employed to conduct multicollinearity diagnostics (Table 4), using the Variance Inflation Factor (VIF) as the evaluation criterion. The results indicated that the VIF value for market potential exceeded five, demonstrating a high linear correlation with the economic development level. To avoid estimation bias, this variable was ultimately excluded. The final GTWR model incorporated six explanatory variables: economic development level, industrial structure, human capital, openness, infrastructure, and government policy. The model achieved an adjusted R2 of 0.656 and a negative AICc value, indicating an excellent goodness-of-fit. These results demonstrate that the model can effectively reveal the underlying mechanisms through which these factors influence tourism efficiency.

3.3.2. Analysis of Influencing Factors

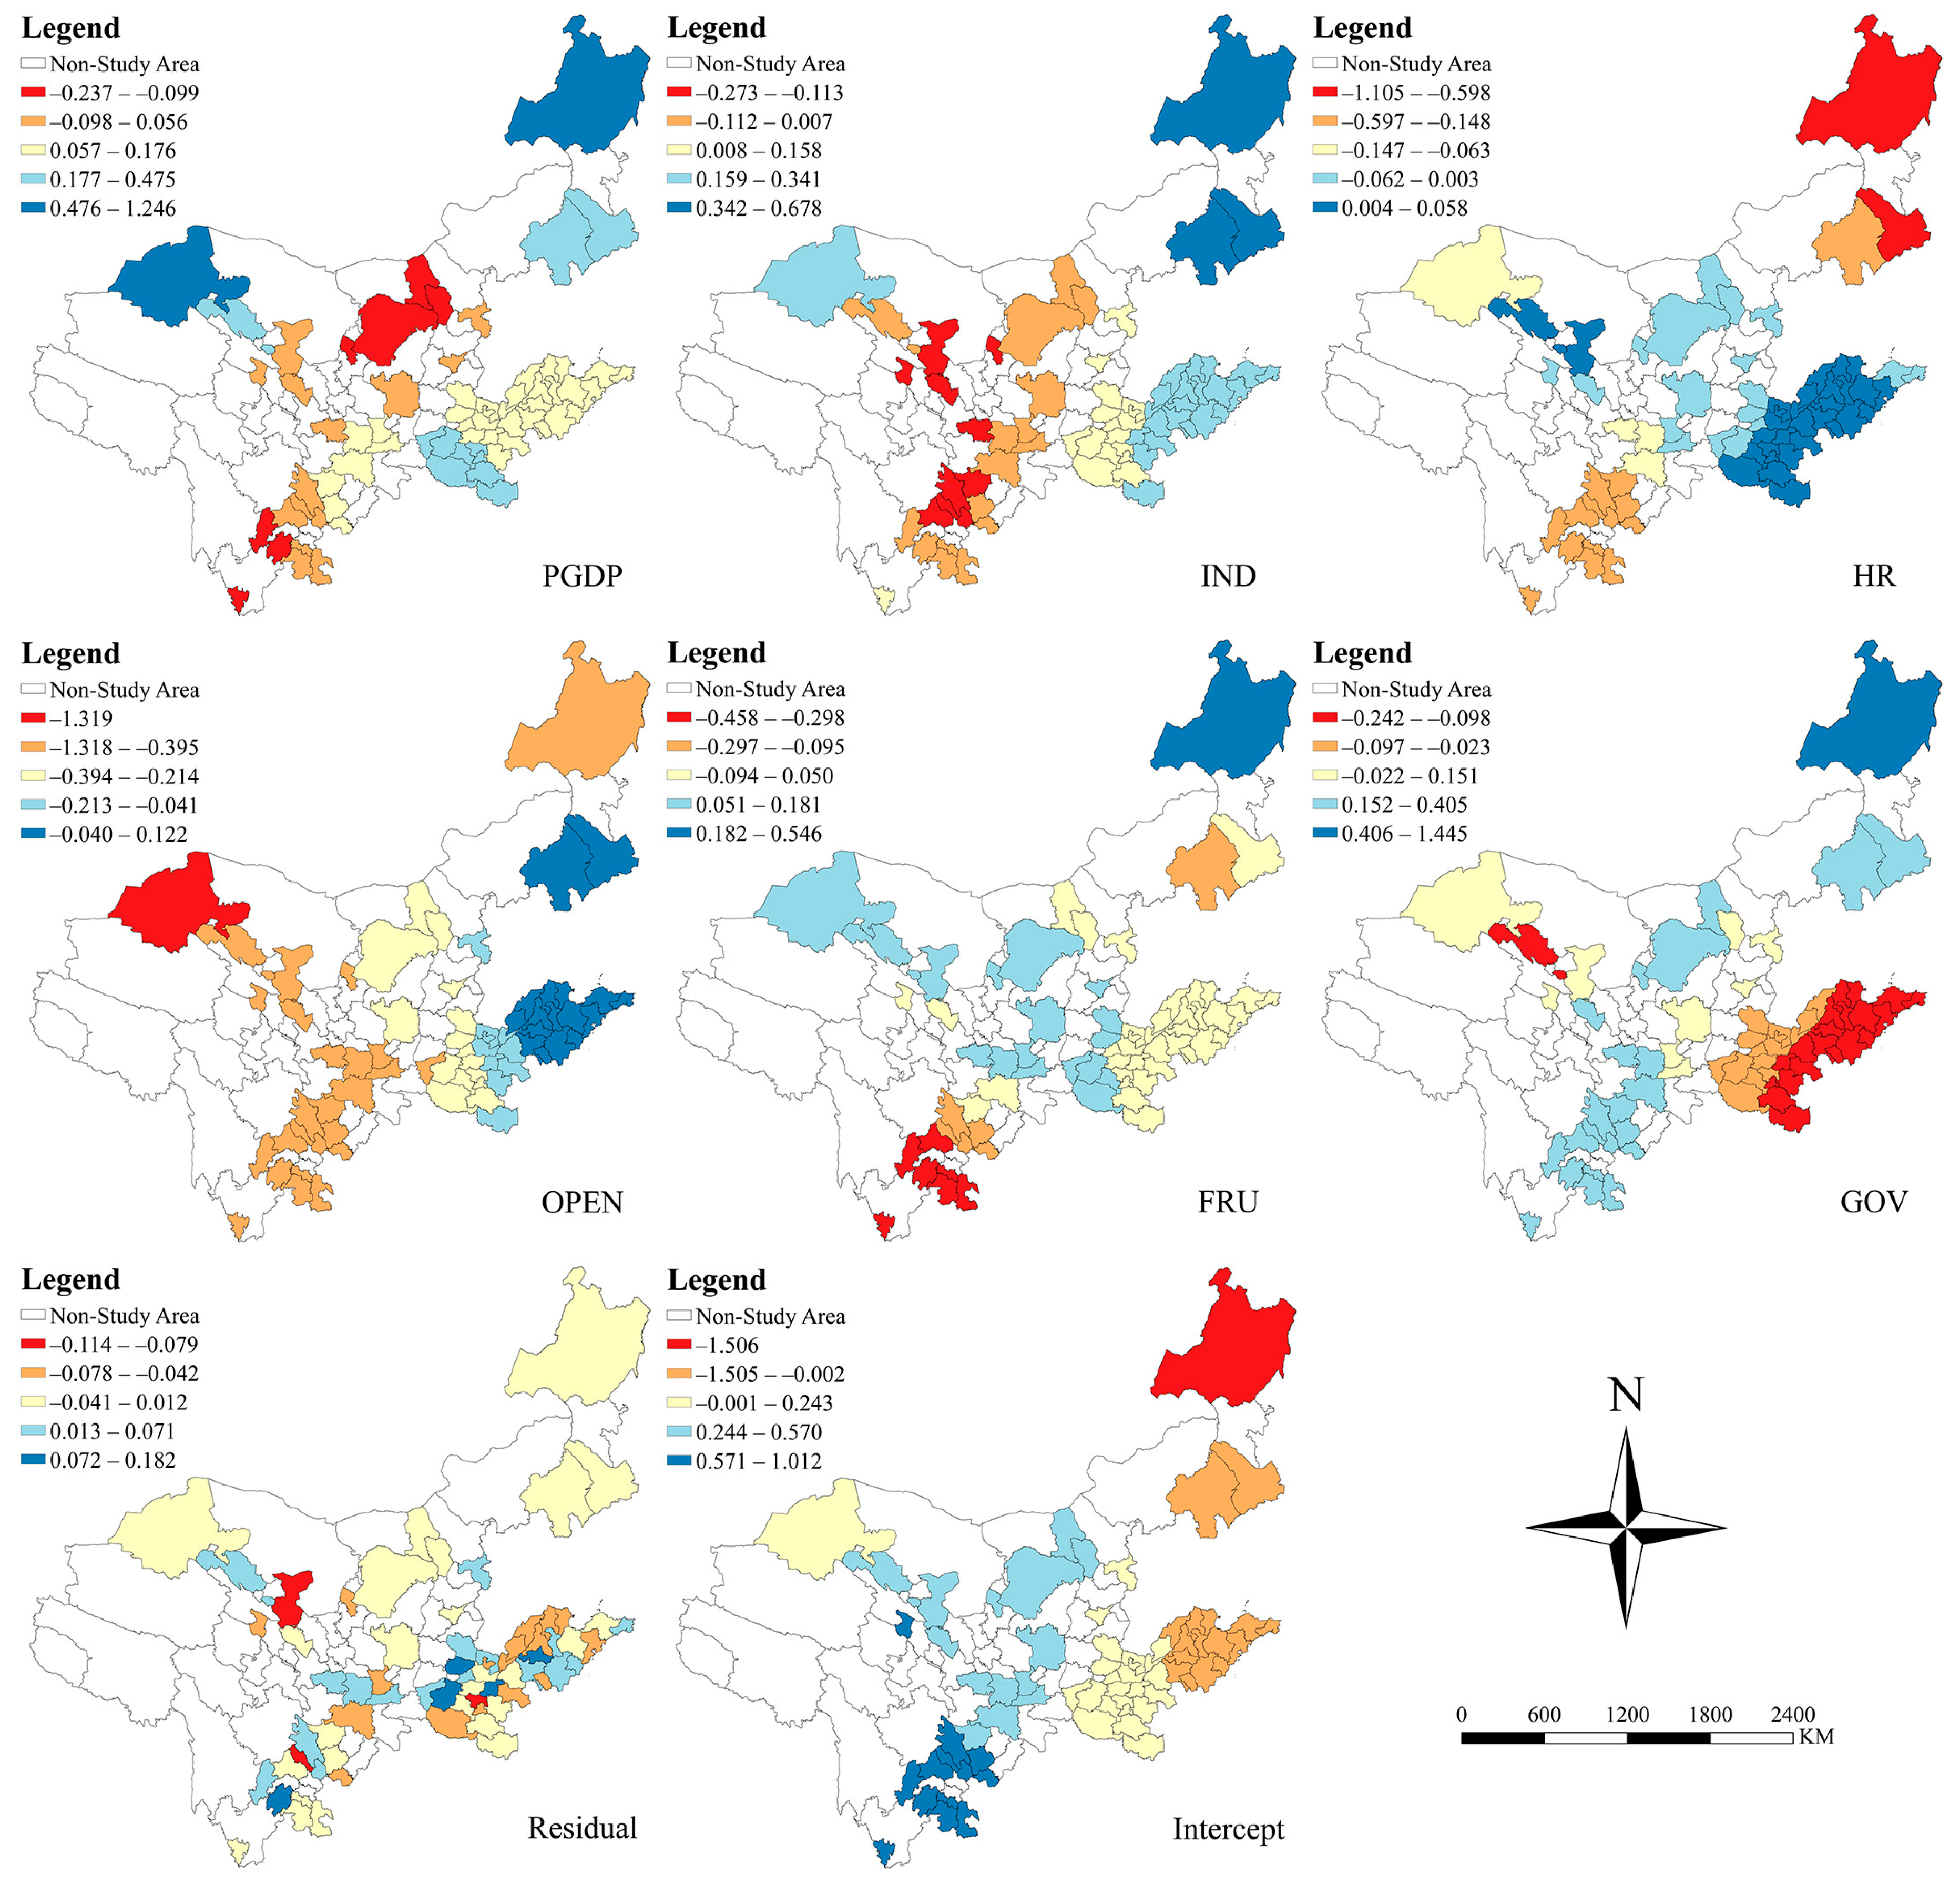
Spatial Distribution of Explanatory Factor Coefficients. Using the default Natural Breaks (Jenks) classification method in ArcGIS, the regression coefficients of tourism efficiency influencing factors for Outstanding Tourist Cities in the Yellow River Basin from 2009 to 2023 were categorized into five typological zones, and their spatial distribution patterns were visualized (Figure 11). The analysis indicates significant spatial heterogeneity in the effects of the explanatory factors on tourism efficiency. Ranked by the absolute values of their estimated effects, the influencing factors are ordered as follows: openness > industrial structure > government policy > economic development level > infrastructure > human capital. The impact of openness to the outside world on tourism efficiency is most pronounced, yet its positive effect remains at the lowest level. Among the sample of Outstanding Tourist Cities, excessive openness intensity paradoxically leads to lower tourism efficiency, with the absolute values of the correlation coefficients for such cities peaking in the upper and middle reaches of the Yellow River Basin. The crowding-out effect associated with openness has resulted in an overall low level of openness in the upper and middle reaches of the river basin. Foreign direct investment (FDI) is highly concentrated in heavy industries such as manufacturing and energy-chemical sectors, failing to embed deeply into the tourism industrial and value chains; consequently, the driving effects of technology spillovers and management demonstration on tourism efficiency remain limited. Meanwhile, foreign-funded cultural tourism projects introduced through preferential policies in certain cities leverage brand and capital advantages to squeeze out local small and medium-sized tourism enterprises. This generates a market crowding-out effect amid incomplete industrial supporting systems, leading to a negative impact of openness on tourism efficiency. In contrast, the downstream region exhibits a more optimized FDI structure and higher integration of culture and tourism, whereby positive technology spillover and industrial upgrading effects are gradually emerging. The spatial variation in the effect of industrial structure on tourism efficiency presents considerable variation in the regression coefficients ranging from −0.273 to 0.678. All coefficients in the low reaches are positive and have the biggest absolute values, pointing to a very strong positive influence on the efficiency of tourism. The scale of the impact is greater in the north than in the south in the upper reaches, with significant spatial heterogeneity. Government policy has a strong spatially heterogeneous effect on tourism efficiency, which has the characteristic of alternating in a “positive–negative–positive” pattern towards the northwest and southeast, respectively. The coefficients in the upstream regions, such as in Sichuan, Gansu (Tianshui, Lanzhou, Wuwei), Ningxia (Yinchuan), and Inner Mongolia (Baotou, Hulunbuir, Chifeng, Tongliao, Ordos), show high absolute values of the coefficients, which refer to the most significant effects of the policy; other cities show weaker ones. The effects of economic development level on tourism efficiency have a multi-core clustered spatial distribution. In the study area, there are numerous spatially dispersed cores of positive impacts and the negative-impact areas encircle and connect between the cores. The values of the regression coefficients descend slowly in the middle–lower region to the upper part of the basin with absolute values. The impact of infrastructure on tourism efficiency is positive in selected cities, encompassing Tianshui, Zhangye, Wuwei, and Jiuquan in Gansu; Ordos in Inner Mongolia; and Luoyang, Nanyang, Pingdingshan, and Xuchang in Henan, while it is negative in the remaining areas. The regression coefficients weaken from Gansu, Inner Mongolia, and Henan (Sanmenxia, Luoyang, Pingdingshan, Luohe, and Anyang) toward surrounding cities. The coefficients of the middle reaches are quite large and positive, demonstrating the great positive impact of infrastructure on the tourism efficiency in this area. The countervailing effect of preemptive investment in infrastructure and ecological cost constraints has resulted in a delicate balance in the middle reaches of the river basin. The Loess Plateau’s fragile ecological base entails high ecological and landscape disruption costs for transportation infrastructure; road construction and operation compromise the authenticity of natural tourism landscapes along the routes, thereby diminishing the attractiveness of regional tourism resources. Meanwhile, in certain cities, the scale and pace of infrastructure investment have outpaced the growth of tourist flows and industrial development needs, leading to capital idleness and declining allocation efficiency, which suppresses comprehensive tourism efficiency. In contrast, the downstream region has developed a mature infrastructure network, where the marginal benefits of investment have shifted toward enhancing operational efficiency, and the negative impact is gradually weakening. Human capital has the least power in explaining the efficiency of tourism as compared to all other variables. The coefficients are negative in the upper and middle reaches (but not in Yinchuan), and the lowest values occur in the middle reaches—especially in Hanzhong, Shaanxi, where the negative effect is most significant. At the lower reaches (except Weihai), the coefficients have positive values but are small, showing a weak positive impact on the efficiency of local tourism. The dual constraint mechanism formed by the misallocation of human capital and talent outflow has resulted in a persistent dilemma for the upper and middle reaches of the river basin, where high-quality labor continues to drain toward the eastern coastal regions. The growth of local human capital stock lags behind the demands of tourism industrial upgrading, and a structural mismatch exists between talent supply and tourism job requirements; high-quality talents are predominantly concentrated in the public sector and industrial fields, failing to translate into an endogenous driving force for tourism efficiency improvement and thus exerting a negative drag. In contrast, the downstream region demonstrates stronger employment absorption capacity and significant talent agglomeration effects, enabling the positive empowering role of human capital to be fully released.
Temporal Evolution of the Explanatory Factors. Figure 12 reveals that the determinants of tourism efficiency in Outstanding Tourist Cities of the Yellow River Basin show significant spatiotemporal heterogeneity. In general, the coefficients for economic development level (X1) and the intercept remain consistently positive throughout the study period. The coefficient for industrial structure (X2) is positive during 2009–2020 but turns negative in 2021–2023. The coefficient for human capital (X3) is positive only in 2010 and 2022. The coefficient for openness intensity (X4) is negative only in 2009 and positive in all subsequent years, entering a phase of rapid decline during 2014–2023. The coefficient for infrastructure (X5) is positive during 2009–2014 but turns negative from 2015 to 2023. The coefficient for government policy (X6) exhibits phased fluctuations, being negative during 2009–2012 and 2018–2019, and positive in all other years. By region, in the upper reaches, the coefficient for openness is negative and exhibits pronounced fluctuations; the intercept coefficient shows a sustained upward trend; the government policy coefficient follows an inverted S-shaped trajectory, while that of industrial structure fluctuates in opposition; human capital and infrastructure display relatively stable patterns over time; and the coefficient for economic development level remains positive in most years. In the middle reaches, the coefficient for openness remains consistently negative and exhibits a pronounced decline; the intercept coefficient shows an overall upward trend with fluctuations; human capital and infrastructure display an alternating “positive–negative–positive” pattern; government policy and economic development level coefficients are generally positive with minor fluctuations; and the industrial structure coefficient is positive only during certain sub-periods. In the lower reaches, the coefficient for economic development level is significantly positive and shows a continuous strengthening trend; The openness coefficient exhibits pronounced fluctuations and declines sharply after 2014, while the remaining factors exert relatively weak influences and display stable temporal patterns.

4. Discussion

4.1. Spatiotemporal Patterns of Tourism Efficiency

The empirical results indicate that the overall tourism efficiency of Outstanding Tourism Cities in the Yellow River Basin remains at a relatively low level, yet exhibits a fluctuating upward evolutionary trend and demonstrates a spatial gradient distribution pattern characterized by “upper reaches > middle reaches > lower reaches.” This spatial characteristic aligns with the findings of Yang et al. [33] based on social network analysis, further validating the latecomer advantage of underdeveloped regions within the river basin in terms of tourism efficiency. The development gap among cities in the upper and middle reaches is relatively narrower, and the marginal returns to factors and catch-up effects in underdeveloped cities are more pronounced, thereby driving an overall uplift in regional efficiency. However, this spatial pattern diverges significantly from the findings of Wang et al. [7] based on provincial-scale data. The fundamental reason lies in the fact that provincial-level data obscure the heterogeneity of city-level units. Although downstream provinces have achieved a substantial aggregate scale in the tourism industry by relying on core cities, the tourism efficiency of ordinary prefecture-level cities within these regions remains generally low. The radiation and spillover effects of high-efficiency core cities have failed to transmit effectively across the entire region, thereby dragging down the overall efficiency level of the downstream area. Based on empirical analysis at the scale of Outstanding Tourism Cities, this study precisely identifies intra-regional disparities, thereby overcoming the limitations of macro-scale research in capturing inter-city heterogeneity and providing more granular micro-level evidence for understanding the spatial differentiation of tourism efficiency within the river basin.
From the perspective of temporal evolution, the three-stage evolutionary trajectory of tourism efficiency in Outstanding Tourism Cities within the Yellow River Basin during the study period aligns closely with China’s tourism industry transition from extensive-scale expansion to high-quality upgrading. Moreover, this efficiency has maintained a fluctuating upward trend throughout the entire period. Specifically, the efficiency growth bottleneck observed from 2009 to 2015 is consistent with the findings of Liao et al. [48]: in the nascent stage of tourism development, the industry relied heavily on the extensive input of production factors such as capital and labor, resulting in a significant lag in efficiency improvement behind the pace of industrial scale expansion. The steady improvement in tourism efficiency after 2016 is primarily attributed to the continuous advancement of the supply-side structural reform in the tourism sector and the optimization and upgrading of its industrial structure. This evolutionary dynamic logic is corroborated by the research judgments of Zhang and Cheng [19] regarding the transformation and development of China’s tourism industry. Since 2019, with the gradual deployment of national strategies such as the ecological protection and high-quality development of the Yellow River Basin, coupled with the external shock of the COVID-19 pandemic starting in 2020, tourism efficiency has entered a stage of fluctuating adjustment. The intertwined effects of positive policy guidance and negative external shocks fully reflect the high sensitivity of tourism industry efficiency to macro-policy orientation and external environmental changes while still demonstrating a certain degree of upward resilience amid fluctuations.
The findings of the aforementioned study can provide direct practical guidance for the differentiated and high-quality development of the tourism industry in the Yellow River Basin. The upstream regions should focus on a path of high-quality development, leveraging their high factor conversion efficiency to create high-end eco-cultural tourism products while avoiding blindly replicating the scale-expansion model of the middle and lower reaches; the middle and lower reaches need to accelerate the transition of the tourism industry from being scale-driven to efficiency-driven, overcoming the dilemma of diminishing returns on factors through product differentiation and innovation, and enhancing the quality of the industry’s intrinsic development.

4.2. Spatial Evolution of Tourism Efficiency

The empirical results of this study indicate that tourism efficiency in Outstanding Tourism Cities within the Yellow River Basin exhibits significant positive spatial autocorrelation, which aligns with the prevailing consensus in existing literature regarding the spatial spillover effects of tourism efficiency [17,19]. Building upon this, the study further delineates the dynamic evolution patterns of spatial agglomeration, revealing that high-value clusters are predominantly distributed in the upper reaches of the basin, whereas low-value clusters are concentrated in the lower reaches. These findings enrich both the theoretical perspectives and empirical evidence concerning the spatial agglomeration of tourism efficiency at the river basin scale. Specifically, the formation of the high–high (H-H) agglomeration pattern in the upper reaches results from the synergistic interplay between resource endowment agglomeration effects and regional coordinated development. Diverging from the single resource-driven mechanism posited in the existing literature [27], this study reveals that, accompanied by the continuous advancement of regional tourism integration strategies, inter-city spatial spillover effects have emerged as one of the core driving forces behind the formation of high-value clusters. This finding supplements the explanatory dimensions regarding the mechanisms of spatial agglomeration of tourism efficiency in underdeveloped regions. In contrast, the low–low (L-L) agglomeration pattern observed in the lower reaches reflects a “beggar-thy-neighbor” effect triggered by tourism product homogenization. This conclusion aligns with the competition inhibition mechanism proposed in city-scale studies on tourism efficiency agglomeration [30], while simultaneously validating the applicability of this mechanism within the downstream plain region of the Yellow River Basin.
The aforementioned spatial agglomeration characteristics provide robust empirical support for the coordinated development of the tourism industry at the river basin level. The high-value agglomeration zones in the upper reaches should fully leverage positive spatial spillover effects to establish cross-regional tourism cooperation alliances and boutique tourism circuits, thereby reinforcing their cluster-based agglomeration advantages. Conversely, the low-value agglomeration zones in the lower reaches must dismantle inter-city administrative barriers and mitigate homogeneous competition by instituting regional coordinated tourism development mechanisms. This is essential to prevent low-level redundant construction and to optimize the overall spatial development pattern of the entire basin.

4.3. Determinants of Tourism Efficiency

The regression results from the GTWR model reveal that all core driving factors of tourism efficiency in Outstanding Tourism Cities within the Yellow River Basin exhibit significant spatiotemporal heterogeneity. This empirical finding corroborates the academic proposition regarding the spatial non-stationarity of the driving mechanisms of tourism efficiency [15]. Contrary to the positive enabling effect of openness on tourism efficiency confirmed in most of the literature [15,37], this study reveals that openness exerts a significant negative impact on tourism efficiency in the middle and upper reaches of the Yellow River Basin. This finding expands the cognitive boundaries of existing research by demonstrating that the beneficial effect of openness on tourism efficiency is not unconditionally valid; rather, the realization of its promotional effects is contingent upon a certain foundation of industrial development. In regions where foreign capital has not yet been deeply integrated into the local tourism industry system, the technology spillovers and demonstration effects brought by openness fail to materialize effectively and may instead crowd out local tourism market entities. Meanwhile, the heterogeneous effects observed in the dimensions of infrastructure and human capital further deepen the theoretical understanding of the driving mechanisms of tourism efficiency. The negative impact of infrastructure on tourism efficiency in the upper reaches indicates that the conclusion “infrastructure construction inevitably enhances industrial efficiency” lacks universal applicability; rather, infrastructure development must fully account for ecological and environmental costs and the structural alignment between tourism supply and demand. The relatively weak driving effect of HR in the central and western regions corroborates the constraining role of talent outflow on regional tourism development. This finding aligns with Xue et al.’s conclusions regarding Gansu Province [27] and extends the applicability of their findings from a single province to the entire Yellow River Basin level.
The aforementioned heterogeneous driving mechanisms provide a decision-making reference for the precise formulation of tourism development policies across various regions within the basin. For the middle and upper reaches, it is inadvisable to blindly expand the scale of openness; instead, priority should be given to promoting the deep integration of foreign capital with the local tourism industry, while simultaneously intensifying efforts to attract and cultivate specialized tourism talents, thereby alleviating the developmental constraints imposed by insufficient human capital supply. Conversely, the lower reaches should further amplify the positive enabling effects of industrial structure upgrading and human capital, propelling the tourism industry toward the high end of the value chain.

4.4. The Impact and Heterogeneous Effects of the COVID-19 Pandemic on Tourism Efficiency

The outbreak and recurrent waves of the COVID-19 pandemic from 2020 to 2023 constituted the most severe exogenous shock disrupting tourism efficiency in the Yellow River Basin during the study period. Characterized by basin-wide negative transmission, significant regional heterogeneity, and divergent recovery trajectories, the pandemic served as the primary driver of the oscillatory adjustment phase in the basin’s tourism efficiency from 2019 to 2023. From the perspective of shock transmission pathways, the pandemic suppressed tourism efficiency through dual channels on both the supply and demand sides. On the demand side, mobility restrictions and declining consumption expectations led to a sharp drop in tourist arrivals and total tourism revenue, resulting in a significant contraction of output scale. On the supply side, business closures and disruptions to industrial and supply chains caused widespread idleness of production factors; the mismatch between the rigidity of labor and capital inputs and the sudden plunge in output dragged down factor allocation efficiency. The trough of basin-wide tourism efficiency in 2020 was precisely the result of the superposition of these supply and demand shocks. In terms of regional heterogeneity, the intensity of the pandemic shock exhibited a gradient decline pattern of “lower reaches > middle reaches > upper reaches.” The downstream tourism industry is highly dependent on inter-provincial medium- and long-haul tourist sources; consequently, mobility restrictions exerted a more pronounced suppressing effect on visitor inflows. Furthermore, the middle and lower reaches are characterized by a high proportion of micro, small, and medium-sized enterprises (MSMEs) with weak risk resilience, resulting in a sharper decline in efficiency. In contrast, the upper reaches rely primarily on intra-provincial short-haul tourists and feature a smaller industrial scale with greater factor elasticity, leading to a milder impact. This dynamic shifted the center of tourism efficiency toward the southwestern upper reaches during the pandemic. Notably, this shift represents a relative change in magnitude and did not alter the overall ranking of tourism efficiency across the basin. Regarding the recovery process, tourism efficiency across the entire basin rebounded rapidly following the optimization of pandemic prevention and control policies. However, regional divergence persisted in both recovery momentum and pace: the upper reaches experienced a faster recovery, driven by the explosive growth of eco-tourism and short-haul leisure markets; conversely, the lower reaches faced a prolonged recovery cycle due to the lagged resurgence of business travel and medium- to long-haul tourist flows, further exacerbating spatial differentiation. Overall, the pandemic constituted a transient exogenous shock that neither altered the long-term fluctuating upward trend of tourism efficiency in the Yellow River Basin nor overturned the spatial pattern of “upper reaches > middle reaches > lower reaches.”

4.5. Research Limitations

Regarding the limitations, first, constrained by the availability of data at the municipal level, the number of employees in the tertiary sector was employed as a proxy variable for labor inputs. Data missing for specific cities in certain years may have exerted a certain degree of impact on sample representativeness. Future research could enhance sample completeness and indicator precision by expanding multi-source data streams and mining specialized statistical data from the culture and tourism sectors. Second, although the influencing factors selected in this study encompass multiple dimensions such as the economy, industry, and human capital, potential key factors, including tourism cultural characteristics, ecological environment quality, and digital technology application, have not yet been incorporated. Future research could further expand the variable dimensions and integrate qualitative analysis to elucidate the complex pathways through which these factors operate. Third, while this study confirms the existence of significant spatial spillover effects on tourism efficiency among Outstanding Tourism Cities in the Yellow River Basin, it has not yet clarified the specific transmission pathways and the magnitude of these effects. Future research could integrate spatial mediation effect models with multi-case comparative analysis to deeply elucidate the underlying transmission mechanisms of these spatial spillovers.

4.6. Policy Implications

Based on the empirical measurement results of tourism efficiency in Outstanding Tourism Cities across the Yellow River Basin, and taking the high-quality development of the basin-wide tourism industry as the overarching goal, this study proposes differentiated regulatory strategies tailored to the distinct developmental stages of the upper, middle, and lower reaches, guided by the principles of “adapting to local conditions and advancing in a gradient manner.”
For the upper reaches of the basin, it is imperative to fully leverage the latecomer advantage in tourism and the endowments of ecological resources. Local governments should take the lead in strengthening inter-city tourism cooperation, establishing regional integrated tourism clusters such as the “Upper Yellow River Eco-Tourism Belt” to amplify the spatial spillover effects of high-efficiency tourism. Tourism enterprises should capitalize on unique natural and cultural resources to develop high-end customized products, thereby enhancing the value-added of tourism consumption. Furthermore, industry associations should spearhead the establishment of a regional mechanism for sharing tourism talent to overcome the bottleneck of local talent supply. For the middle reaches of the basin, which is currently at a critical juncture of industrial transformation, local governments should optimize the structure of infrastructure investment. Priority must be given to enhancing the operational efficiency of existing facilities to avoid factor redundancy caused by premature construction. Concurrently, efforts should be directed toward promoting the deep integration of the tourism and cultural industries, thereby reducing reliance on traditional resource-based industries and driving the upgrading of the regional industrial structure. Meanwhile, tourism enterprises need to accelerate digital transformation and develop immersive cultural tourism products, ultimately improving comprehensive benefits by extending the length of tourist stays. For the lower reaches of the basin, where tourism development is relatively advanced but homogenization is a prominent issue, local governments should strengthen top-level design and guide cities to develop differentiated tourism products. This is essential to break free from the low-value lock-in effect. Concurrently, leveraging the locational advantage of proximity to the Beijing-Tianjin-Hebei and Yangtze River Delta regions, priority should be given to expanding the urban leisure and study tour (educational tourism) markets. Meanwhile, tourism enterprises should focus on upgrading service quality and implementing refined management, thereby driving tourism efficiency growth through quality enhancement rather than scale expansion.
To ensure the synergistic enhancement of tourism efficiency across the entire basin, it is imperative to construct a multi-stakeholder governance system characterized by “government guidance, enterprise-led operations, and industry collaboration.” “Local governments should formulate precise and differentiated policies tailored to local resource endowments and developmental stages, thereby avoiding blind investments and disorderly expansion. Furthermore, fiscal expenditure should be fully leveraged to play a guiding role in optimizing the industrial structure and promoting the high-quality development of the tourism sector. Tourism enterprises must strengthen their capabilities in technological innovation and digital operations, optimize the allocation of production factors, and facilitate a transition in the development paradigm from scale-driven to efficiency-driven. Concurrently, industry organizations should establish cross-regional tourism alliance platforms to promote the cross-regional mobility of core tourism elements, including talent, capital, and information, thus providing institutional support for the coordinated development of tourism throughout the basin.


5. Conclusions and Future Prospects

5.1. Conclusions

This study takes 68 Outstanding Tourism Cities in the Yellow River Basin from 2009 to 2023 as the sample and constructs an analytical framework of “efficiency measurement—spatiotemporal evolution—heterogeneous driving mechanisms.” By employing the Super-SBM model to measure urban tourism efficiency and integrating multiple spatial analysis methods with the Geographically and Temporally Weighted Regression model, this study systematically reveals the spatiotemporal evolutionary patterns and heterogeneous driving mechanisms of tourism efficiency in the basin, thereby providing a scientific basis for decision-making to achieve sustainable and high-quality development of the tourism industry in the Yellow River Basin. The research conclusions are as follows: First, the overall tourism efficiency is relatively low but exhibits a fluctuating upward trend over the long term. Its evolution can be divided into three distinct phases: the bottleneck phase (2009–2015), characterized by sluggish efficiency improvement and frequent fluctuations; the improvement phase (2016–2018), marked by a steady elevation in efficiency; and the oscillation phase (2019–2023), during which efficiency experienced phased declines and recoveries due to external environmental shocks. Spatially, the efficiency presents a gradient decreasing pattern of “upper reaches > middle reaches > lower reaches,” indicating prominent regional heterogeneity. Second, tourism efficiency exhibits significant positive spatial autocorrelation, forming a stable agglomeration pattern characterized by being “high in the west and low in the east.” Cities with high and relatively high levels of tourism efficiency, as well as hotspot areas, are predominantly distributed in the upper reaches of the basin. Conversely, cities with low levels of efficiency and coldspot areas are concentrated in the lower reaches. Furthermore, the spatial gravity center of tourism efficiency has shifted from the northeast to the southwest, indicating a continuous dynamic evolution of the spatial pattern. Third, the driving factors of tourism efficiency exhibit significant spatiotemporal heterogeneity. The ranking of their impact intensity is as follows: openness > industrial structure > government policy > economic development level > infrastructure > human capital. Notably, openness, infrastructure, and human capital demonstrate negative effects in certain regions, indicating that their underlying mechanisms exhibit significant regional differentiation. This study deepens the theoretical understanding of the spatiotemporal differentiation and spatiotemporally non-stationary driving mechanisms of tourism efficiency in Outstanding Tourism Cities within the Yellow River Basin. Furthermore, it provides precise decision-making support for the differentiated quality enhancement and coordinated development of the tourism industry under the national strategy for ecological protection and high-quality development of the Yellow River Basin.
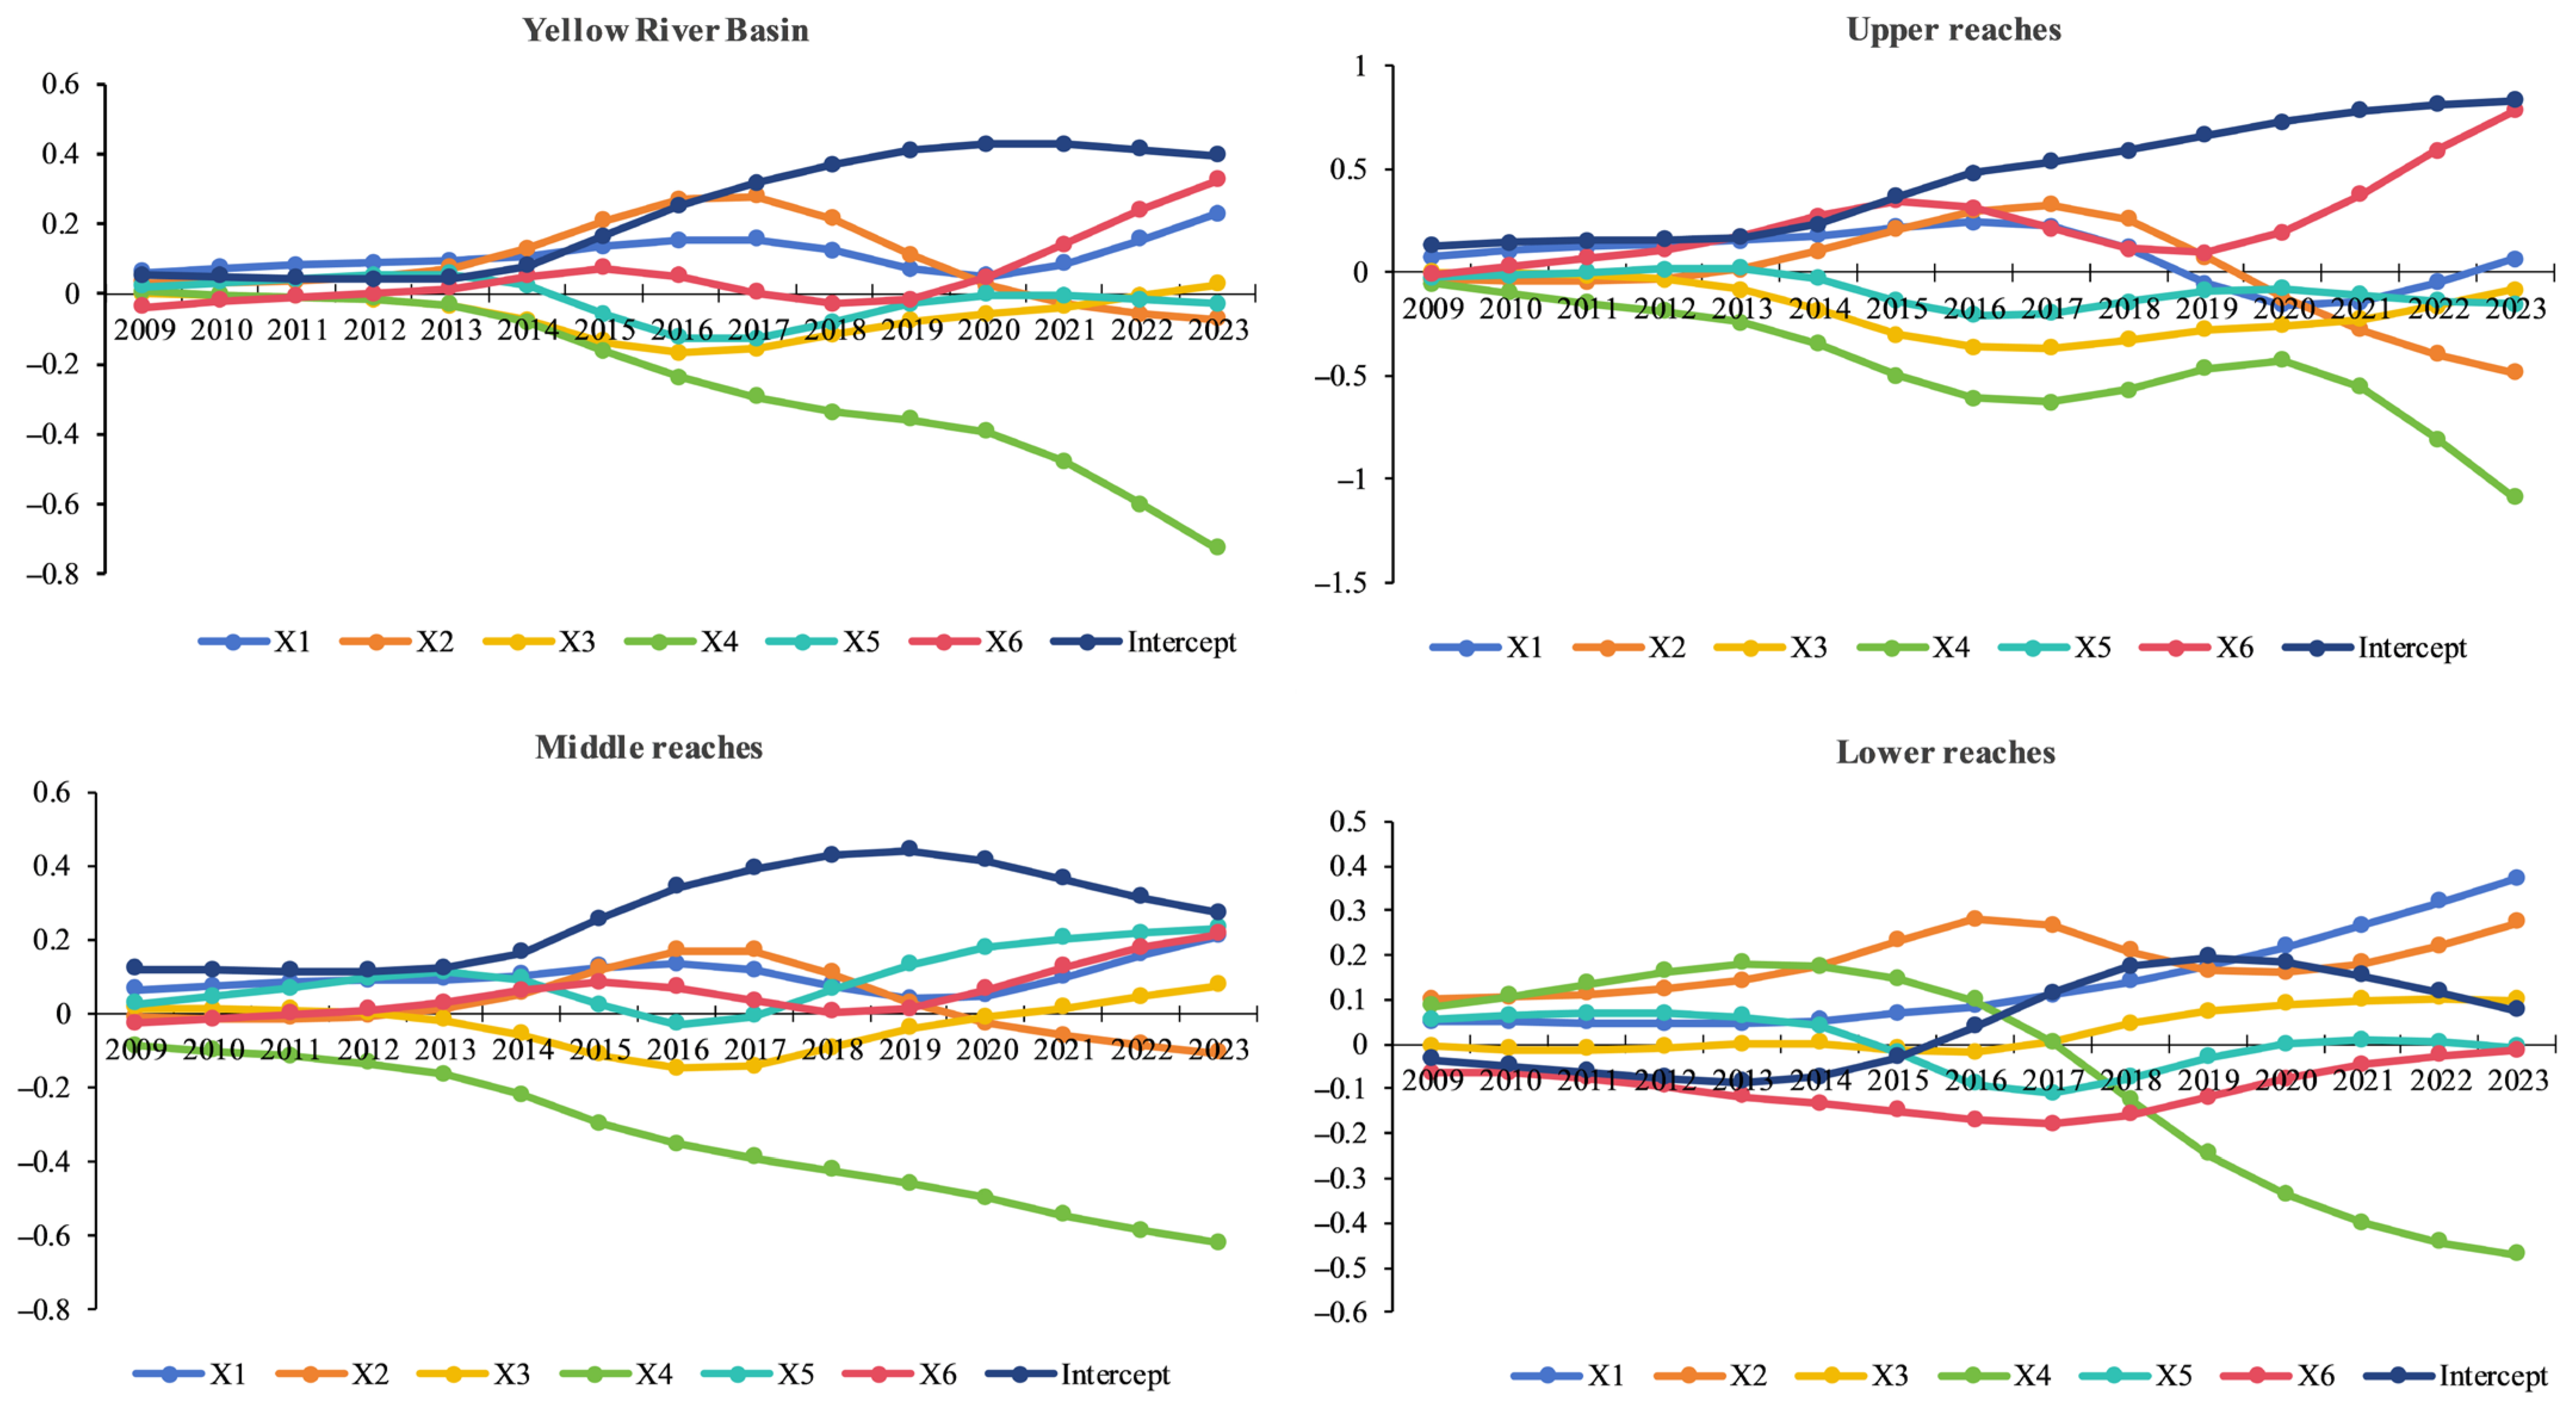
5.2. Future Prospects

Regarding future research prospects, this study proposes three main directions: First, expand the research dimensions of sustainable efficiency. Future studies should incorporate ecological environmental constraints (such as energy consumption inputs and carbon emissions as undesirable outputs) and social effects (including employment generation and resident well-being) into the efficiency measurement framework. By conducting the measurement and evaluation of sustainable eco-efficiency in tourism, researchers can further explore the synergistic evolution paths of high-quality tourism economic development, ecological protection, and social well-being within the basin. Second, integrate micro-level enterprise data with field survey data. This approach aims to analyze the intrinsic transmission mechanisms of efficiency enhancement from the perspective of market entities, thereby bridging the gap between macro-level efficiency evaluation and micro-level operational realities. Third, focus on the underlying logic of emerging business models, such as smart tourism, driven by the digital economy. Future research should clarify the impact pathways and driving effects of these innovations on tourism efficiency, thereby enriching the theoretical connotation of the driving mechanisms of efficiency under the new development paradigm.

Author Contributions

Conceptualization, Y.L. and D.Z.; methodology, C.Y. and X.K.; investigation, D.Z.; formal analysis, C.Y.; software, D.Z.; validation, S.T., X.K. and J.Z.; data curation, Y.Z. (Yuze Zhang) and X.K.; visualization, D.Z. and Y.Z. (Yinuo Zhao); writing—original draft preparation, Y.L., D.Z., S.T. and Y.Z. (Yinuo Zhao); writing—review and editing, Y.L., D.Z., J.Z. and Y.Z. (Yuze Zhang); supervision, Y.L., C.Y. and D.Z.; project administration, Y.L.; resources, C.Y.; funding acquisition, Y.L. and C.Y. All authors have read and agreed to the published version of the manuscript.

Funding

This research was funded by the National Social Science Fund of China (25BJY155), Natural Science Foundation of Henan (262300420646), General Project of the 2026 Annual, 15th Five-Year Plan of Henan Provincial Education Science (2026YB0047), Key Research Project of Higher Education Institutions of Henan Province in 2025 (25A170001), Doctoral Research Project of Henan Normal University (20240310), Postdoctoral Research Project of Henan Normal University (5101219470286).

Institutional Review Board Statement

Not applicable.

Informed Consent Statement

Not applicable.

Data Availability Statement

The datasets presented in this article are not readily available because the data belong to an ongoing research project. Requests to access the datasets should be directed to the corresponding author.

Conflicts of Interest

The authors declare no conflicts of interest.

References

  1. Zhang, Z.; Qi, J.; Wang, Q.; Wang, S.; Hu, F. Analysis and forecast of the coupled development level of socioeconomy ecological environment and tourism in China’s Yellow River Basin. Sci. Rep. 2025, 15, 5446. [Google Scholar] [CrossRef] [PubMed]
  2. Lu, F.; Liu, Q.; Wang, P. Spatiotemporal characteristics of ecological resilience and its influencing factors in the Yellow River Basin of China. Sci. Rep. 2024, 14, 16988. [Google Scholar] [CrossRef] [PubMed]
  3. Sun, Y.; Hou, G. Analysis on the Spatial-Temporal Evolution Characteristics and Spatial Network Structure of Tourism Eco-Efficiency in the Yangtze River Delta Urban Agglomeration. Int. J. Env. Res. Public Health 2021, 18, 2577. [Google Scholar]
  4. Zhang, H.; Xia, Z.; Wang, J. Spatiotemporal Changes in China’s Tourism Industry Development. Sustainability 2024, 16, 3244. [Google Scholar] [CrossRef]
  5. Gu, D.; Xu, D.; Yu, F.; Hou, B. Spatiotemporal evolution and mechanisms of tourism efficiency and its decomposition: Evidence from 63 counties in Zhejiang, China. PLoS ONE 2024, 19, 0297522. [Google Scholar] [CrossRef] [PubMed]
  6. Tian, L.; Pu, W.; Su, C.; Chen, M.; Liu, Y. Asymmetric effects of China’s tourism on the economy at the city level: A moderating role of spatial disparities in top level tourist attractions. Curr. Issues Tour. 2022, 25, 2648. [Google Scholar]
  7. Wang, Z.; Liu, Q.; Xu, J.; Fujiki, Y. Evolution characteristics of the spatial network structure of tourism efficiency in China: A province-level analysis. J. Destin. Mark. Manag. 2020, 18, 100509. [Google Scholar] [CrossRef]
  8. Guo, Y.; Cao, Z. A study on the tourism efficiency of tourism destination based on DEA model: A case of ten cities in Shaanxi province. PLoS ONE 2024, 19, 0296660. [Google Scholar] [CrossRef] [PubMed]
  9. Zhang, S.; Chi, L.; Zhang, T.; Ju, H. Spatio-temporal pattern and influencing factors of border tourism efficiency in China. J. Geogr. Sci. 2024, 34, 2288. [Google Scholar] [CrossRef]
  10. Yin, J.; Wei, D.; Qiu, Y.; Luo, X.; Zhang, T. Strategies for enhancing tourism efficiency in Guizhou, China: Based on spatiotemporal dynamic analysis and driving force decomposition. Environ. Dev. Sustain. 2024, 1, 33. [Google Scholar]
  11. Wang, H. Spatiotemporal Differences in Regional Tourism Efficiency: An Empirical Study from Guangdong Province, China. Complexity 2024, 1, 5781877. [Google Scholar]
  12. Xiao, K.; Ullah, W.; Fu, J.; Zhang, X. Poverty Alleviation Efficiency of Tourism and Its Spatiotemporal Differentiation in Jiangxi Province of China Based on the DEA Model. Sage Open 2023, 13, 1. [Google Scholar] [CrossRef]
  13. Liao, Z.; Liang, S.; Wang, X. Spatio-temporal evolution and driving factors of green innovation efficiency in the Chinese urban tourism industry based on spatial Markov chain. Sci. Rep. 2024, 14, 10671. [Google Scholar] [CrossRef] [PubMed]
  14. Guo, T.; Wang, J.; Li, C. Spatial–Temporal Evolution and Influencing Mechanism of Tourism Ecological Efficiency in China. Sustainability 2022, 14, 16880. [Google Scholar] [CrossRef]
  15. Gao, J.; Shao, C.; Chen, S. Evolution and Driving Factors of the Spatiotemporal Pattern of Tourism Efficiency at the Provincial Level in China Based on SBM–DEA Model. Int. J. Env. Res. Public Health 2022, 19, 10118. [Google Scholar] [CrossRef]
  16. Liu, Z.; Lu, C.; Mao, J.; Sun, D.; Lu, C. Spatial–Temporal Heterogeneity and the Related Influencing Factors of Tourism Efficiency in China. Sustainability 2021, 13, 5825. [Google Scholar] [CrossRef]
  17. Chen, W.; He, X.; Cai, C. Does the Digital Economy Promote Tourism Eco-Efficiency-An Empirical Study Based on Chinese Cities. Pol. J. Environ. Stud. 2025, 34, 2063. [Google Scholar]
  18. Sánchez, F.; Sánchez, A. Evaluating the efficiency and determinants of mass tourism in Spain: A tourist area perspective. Port. Econ. J. 2024, 23, 111. [Google Scholar]
  19. Zhang, F.; Cheng, Q. Spatio-temporal effects and influence mechanism of digital technology on tourism efficiency in Chinese provinces. Sci. Rep. 2024, 14, 22975. [Google Scholar] [CrossRef] [PubMed]
  20. Zhao, S.; Huang, T.; Xi, J. Understanding the Evolution of Regional Tourism Efficiency: Through the Lens of Evolutionary Economic Geography. Sustainability 2022, 14, 11042. [Google Scholar] [CrossRef]
  21. Zhang, H.; Duan, Y.; Wang, H.; Han, Z.; Wang, H. An empirical analysis of tourism eco-efficiency in ecological protection priority areas based on the DPSIR-SBM model: A case study of the Yellow River Basin, China. Ecol. Inform. 2022, 70, 101720. [Google Scholar]
  22. Huang, X.; An, R.; Yu, M.; He, F. Tourism efficiency decomposition and assessment of forest parks in China using dynamic network data envelopment analysis. J. Clean. Prod. 2022, 363, 132405. [Google Scholar] [CrossRef]
  23. Stoiljković, A.; Marcikić Horvat, A.; Tomić, S. Assessing the Tourism Efficiency of European Countries Using Data Envelopment Analysis: A Sustainability Approach. Sustainability 2025, 17, 1493. [Google Scholar] [CrossRef]
  24. Liao, Z.; Wang, L. Spatial differentiation and influencing factors of red tourism resources transformation efficiency in China based on RMP-IO analysis. Sci. Rep. 2024, 14, 10761. [Google Scholar] [CrossRef] [PubMed]
  25. Chaabouni, S. China’s regional tourism efficiency: A two-stage double bootstrap data envelopment analysis. J. Destin. Mark. Manag. 2017, 11, 183. [Google Scholar]
  26. Zhang, X.; Wu, S. Efficiency Evaluation and Spatio-Temporal Differentiation Analysis of tourism Industry in Cities Along the Beijing Hangzhou Grand Canal Based on Three-Stage DEA. Sage Open 2024, 14, 1. [Google Scholar]
  27. Xue, D.; Li, X.; Fayyaz, A.; Nabila, A.; Zulqarnain, M. Exploring Tourism Efficiency and Its Drivers to Understand the Backwardness of the Tourism Industry in Gansu, China. Int. J. Env. Res. Public Health 2022, 19, 11574. [Google Scholar] [CrossRef]
  28. An, C.; Polat, M.; Xiao, Z. Spatiotemporal Evolution of Tourism Eco-Efficiency in Major Tourist Cities in China. Sustainability 2022, 14, 13158. [Google Scholar] [CrossRef]
  29. Li, W.; Zhang, L.; Guo, R. The Measurement of Tourism Environmental Pollution and Tourism Efficiency in Western China. J. Coast. Res. 2020, 104, 660. [Google Scholar] [CrossRef]
  30. Wang, S.; Liu, R.; Li, M. A Study on the Coupled Coordination Between Tourism Efficiency and Economic Development Level in the Beijing–Tianjin–Hebei City Cluster in the Past 10 Years. Sustainability 2025, 17, 4388. [Google Scholar]
  31. Zhang, P.; Yu, H.; Shen, M.; Guo, W. Evaluation of Tourism Development Efficiency and Spatial Spillover Effect Based on EBM Model: The Case of Hainan Island, China. Int. J. Env. Res. Public Health 2022, 19, 3755. [Google Scholar] [CrossRef]
  32. Liu, J.; Song, Q.; Liu, N.; Chi, C. Threshold effects of tourism agglomeration on the green innovation efficiency of China’s tourism industry. Chin. J. Popul. Resour. 2018, 6, 277. [Google Scholar] [CrossRef]
  33. Yang, G.; Yang, Y.; Gong, G.; Gui, Q. The spatial network structure of tourism efficiency and its influencing factors in China: A social network analysis. Sustainability 2022, 14, 9921. [Google Scholar] [CrossRef]
  34. Pérez Granja, U.; Inchausti Sintes, F. On the analysis of efficiency in the hotel sector: Does tourism specialization matter. Tour. Econ. 2023, 29, 92. [Google Scholar]
  35. Cao, F.; Huang, Z.; Jin, C.; Xu, M. Chinese National Scenic Areas’ Tourism Efficiency: Multi-scale Fluctuation, Prediction and Optimization. Asia Pac. J. Tour. Res. 2015, 21, 570. [Google Scholar] [CrossRef]
  36. Yang, Y.; Zhang, C.; Qin, Z.; Cui, Y. The spatial-temporal pattern evolution and influencing factors of county-scale tourism efficiency in Xinjiang, China. Open Geosci. 2022, 14, 1547. [Google Scholar]
  37. Peng, D.; Liang, Z.; Ding, Y.; Liang, L.; Zhai, A.; Zhang, Y.; Gong, X. Spatial and temporal distribution characteristics and influencing factors of tourism eco-efficiency in the Yellow River Basin based on the geographical and temporal weighted regression model. PLoS ONE 2024, 9, 0295186. [Google Scholar]
  38. Zhao, D.; Liang, Y.; Li, L.; Ma, Y.; Xiao, G. Spatio-Temporal Differentiation and Enhancement Path of Tourism Eco-Efficiency in the Yellow River Basin Under the “Dual Carbon” Goals. Sustainability 2025, 17, 7827. [Google Scholar]
  39. Zhang, W.; Zhan, Y.; Yin, R.; Yuan, X. The Tourism Eco-Efficiency Measurement and Its Influencing Factors in the Yellow River Basin. Sustainability 2022, 14, 15654. [Google Scholar] [CrossRef]
  40. Zhang, H.; Wang, F.; Fan, W.; Jiang, H.; Ling, R.; Liu, J. Estimation of capital stock and the elasticity of capital-labor substitution in provincial industries in China. Int. Rev. Econ. Financ. 2025, 102, 104407. [Google Scholar] [CrossRef]
  41. Tone, K. A slacks-based measure of efficiency in data envelopment analysis. Eur. J. Oper. Res. 2001, 130, 498. [Google Scholar] [CrossRef]
  42. Fan, L.; Hou, Z.; Shi, Y.L.; Cao, M. Study on Spatial–temporal Evolution and Influencing Factors of Tourism Efficiency of China’s Excellent Tourism Cities. Resour. Dev. Mark. 2021, 37, 984. (In Chinese) [Google Scholar]
  43. Bao, H.; Liu, X.; Xu, Y.; Shan, L.; Ma, Y.; Qu, X.; He, X. Spatial-temporal evolution and convergence analysis of agricultural green total factor productivity—Evidence from the Yangtze River Delta Region of China. PLoS ONE 2023, 18, 0271642. [Google Scholar] [PubMed]
  44. Shi, P.; Long, H.; Yao, Y.; Li, X.; Wang, X. Study of the space–time transition and spatial spillover effects of tourism green production efficiency in the Yangtze River Delta—A reanalysis from the perspective of tourism carbon sinks. Front. Environ. Sci. 2023, 11, 1260949. [Google Scholar]
  45. Xu, S.; Zuo, Y.; Law, R.; Zhang, M.; Han, J.; Li, G.; Meng, J. Coupling Coordination and Spatiotemporal Dynamic Evolution Between Medical Services and Tourism Development in China. Front. Public Health 2022, 10, 731251. [Google Scholar] [CrossRef] [PubMed]
  46. Lefever, D. Measuring Geographic Concentration by Means of the Standard Deviational Ellipse. Am. J. Sociol. 1926, 32, 88. [Google Scholar] [CrossRef]
  47. Wang, Y.; Wu, X. The spatial pattern and influencing factors of tourism eco-efficiency in Inner Mongolia, China. Front. Public Health 2022, 10, 1072959. [Google Scholar] [CrossRef] [PubMed]
  48. Liao, Z.; Zhang, L.; Liang, S. Spatio-temporal pattern evolution of China’s provincial tourism efficiency and development level based on DEA-MI model. Sci. Rep. 2023, 13, 20227. [Google Scholar] [PubMed]
Figure 1. Study area.
Sustainability 18 06981 g001
Figure 2. Technical workflow.
Sustainability 18 06981 g002
Figure 3. Spatial distribution of tourism efficiency levels in Outstanding Tourist Cities of the Yellow River Basin, 2009–2023.
Sustainability 18 06981 g003
Figure 4. Temporal evolution of tourism efficiency in Outstanding Tourist Cities of the Yellow River Basin, 2009–2023.
Sustainability 18 06981 g004
Figure 5. Temporal changes in tourism efficiency levels of different regions in the Yellow River Basin from 2009 to 2023.
Sustainability 18 06981 g005
Figure 6. Trend surface analysis of tourism efficiency in Outstanding Tourist Cities of the Yellow River Basin, 2009–2023.
Sustainability 18 06981 g006
Figure 7. Local spatial association patterns of tourism efficiency in Outstanding Tourist Cities of the Yellow River Basin, 2009–2023.
Sustainability 18 06981 g007
Figure 8. Hotspot analysis of tourism efficiency in Outstanding Tourist Cities of the Yellow River Basin, 2009–2023.
Sustainability 18 06981 g008
Figure 9. Spatial distribution of SDEs and mean centers of tourism efficiency in Outstanding Tourist Cities of the Yellow River Basin, 2009–2023.
Sustainability 18 06981 g009
Figure 10. Temporal changes in the area and flattening of SDEs for tourism efficiency in Outstanding Tourist Cities of the Yellow River Basin, 2009–2023.
Sustainability 18 06981 g010
Figure 11. Spatial distribution of regression coefficients for influencing factors of tourism efficiency in Outstanding Tourist Cities of the Yellow River Basin, 2009–2023.
Sustainability 18 06981 g011
Figure 12. Spatiotemporal variation in regression coefficients for tourism efficiency in Outstanding Tourist Cities of the Yellow River Basin, 2009–2023.
Sustainability 18 06981 g012
Table 1. Indicator system for measuring tourism efficiency.
CategoryLevel-1 IndicatorLevel-2 Indicator
Input indicatorsLabor inputEmployees in the tertiary sector
Capital inputFixed capital stock
Actual FDI inflows
Output indicatorsTourism outputTourism revenue
Tourist arrivals
Table 2. Tourism efficiency levels.
Efficiency LevelEfficiency Score
Low0 < TE ≤ 0.4
Medium0.4 < TE ≤ 0.6
High0.6 < TE ≤ 0.8
Very high0.8 < TE ≤ 1
Table 3. Global Moran’s I index of tourism efficiency in Outstanding Tourist Cities in the Yellow River Basin from 2009 to 2023.
YearMoran’s IZ-Valuep-Value
Y20090.0972.7380.008
Y20100.1163.2410.002
Y20110.1243.4170.002
Y20120.1855.0420.002
Y20130.2065.5540.001
Y20140.2386.4730.001
Y20150.2697.3110.001
Y20160.3038.0360.001
Y20170.2958.4000.001
Y20180.1655.0840.003
Y20190.1144.3930.005
Y20200.38910.8360.001
Y20210.2266.7660.001
Y20220.0371.1350.032
Y20230.0682.2250.027
Table 4. Key parameters of the GTWR model.
No.ParameterValue
1Bandwidth0.114996
2Residual Squares10.2613
3Sigma0.1003
4AICc−1538.32
5R20.655957
6R2 Adjusted0.653919
7Spatiotemporal Distance Ratio0.8149
Disclaimer/Publisher’s Note: The statements, opinions and data contained in all publications are solely those of the individual author(s) and contributor(s) and not of MDPI and/or the editor(s). MDPI and/or the editor(s) disclaim responsibility for any injury to people or property resulting from any ideas, methods, instructions or products referred to in the content.