Article

Allocating Flood Protection Funds Based on Multi-Dimensional Vulnerability and Equity to Enhance Flood Prevention in Southern Tibet


1
Surveying and Mapping Geographic Information Center, Sichuan Institute of Metal Geology, Chengdu 611700, China
2
School of Civil Engineering and Geomatics, Southwest Petroleum University, Chengdu 610500, China
3
Tibet Hongwei Survey and Design Engineering Co., Ltd., Lhasa 850030, China
*
Author to whom correspondence should be addressed.
Sustainability 2026, 18(14), 6979; https://doi.org/10.3390/su18146979
Submission received: 4 June 2026 / Revised: 22 June 2026 / Accepted: 2 July 2026 / Published: 8 July 2026

Abstract

Establishing an equitable, evidence-based mechanism for allocating flood prevention funding is critical to mitigating the risk of flash floods. However, existing research seldom accounts for the multi-dimensional nature of vulnerability or achieves an appropriate balance between efficiency and equity. To address this gap, we propose the Multi-dimensional Vulnerability-based Flood Disaster Fund Allocation Optimization Model (MD-FAOM), which integrates the coupling effects of exposure, sensitivity, adaptive capacity, and equity into allocation strategies using the NSGA-II algorithm, TOPSIS method, and geographical detectors. The model prioritizes funding for ecologically targeted flood prevention. We apply this framework to southern Tibet to derive optimal fund allocations and quantitatively assess the resulting benefits. Our results show that areas characterized by negative vulnerability account for 25.22% of the study region, mainly concentrated in Lhasa and Shannan. Under equivalent conditions, MD-FAOM delivers benefits across an area of 85,915 km2, achieving an improvement rate of 30.11%. These findings demonstrate that integrating vulnerability science with distributive equity can optimize the allocation of limited resources, thereby enhancing both flood resilience and ecosystem conservation. This approach advances ecohydrological disaster management and supports the achievement of Sustainable Development Goals (SDGs) 13 (Climate Action) and 15 (Life on Land).

1. Introduction

Under global climate change, flash floods have become a critical concern owing to their extensive spatiotemporal coverage, high frequency, and severe socioeconomic consequences [1]. Worldwide, nearly 40% of natural disaster losses are attributed to rainstorms and flood events, affecting more than 2 billion people and highlighting their systemic risk to sustainable development [2]. Disaster mitigation is hindered by a core trade-off: limited public funds must be distributed across diverse regions while balancing structural and non-structural measures [3]. Misaligned financial allocation, stemming from fragmented governance and mismatched vulnerability evaluation, further weakens regional disaster resilience, a widely recognized bottleneck in disaster finance research [4]. Such unbalanced resource distribution also undermines the long-term socioecological sustainability of high-altitude eco-fragile zones. Accordingly, data-driven funding frameworks integrating cost–benefit analysis and dynamic vulnerability evaluation are urgently required to maximize overall systemic disaster resistance.
Research on disaster-prevention fund allocation can be categorized into post-disaster emergency scheduling and pre-disaster long-term infrastructure planning. Current relevant studies have mostly centered on emergency dispatch models and produced several representative findings: constructing infrastructure resilience evaluation indices [5], establishing early warning-fund linkage frameworks for disaster response [6], exploring multi-objective trade-offs in flood control investment optimization [7], and evaluating the rationality of government disaster relief fund distribution [8]. However, existing research shows a significant discrepancy between the focus on decision-making timeliness during the post-disaster emergency response phase [9] and the systematic fund optimization required for flood control infrastructure funding planning. As a key pathway to enhancing regional disaster resilience, the latter requires the establishment of a multi-objective, collaborative flood-prevention resource-allocation model to achieve the dual goals of maximizing disaster-prevention benefits and continuously reducing disaster losses. Precise funding planning fundamentally relies on the identification of priority support watersheds [10]. Early studies often used historical flash-flood severity to determine such areas, while contemporary research frameworks have shifted toward relying on vulnerability assessments that integrate socioeconomic, environmental, and institutional dimensions. A growing body of research confirms [11] that vulnerability assessment is crucial to rational fund allocation [12] and has thus become an integral part of the process.
Methodologically, vulnerability evaluation has advanced from single-indicator frameworks to multi-scale comprehensive assessment systems [13]. Despite ongoing methodological improvements, a critical disconnect remains between assessment outcomes and allocation parameters [14]. The current framework is constrained by three primary limitations: first, it treats exposure, sensitivity, and adaptive capacity as discrete dimensions rather than as interdependent decision variables; second, it lacks a robust mechanism for translating multi-dimensional scores into quantifiable allocation weights for funding; and third, it fails to adequately reconcile efficiency with equity considerations. Accordingly, it is urgent to build a mapping mechanism linking multi-dimensional vulnerability assessment results with funding distribution decisions. This mechanism enables Pareto-optimal resource allocation by quantifying marginal disaster-reduction benefits of each indicator across all vulnerability dimensions. In multi-objective optimization, NSGA-II excels in rapid non-dominated sorting, efficient convergence, and robustness [15], and it outperforms GA [16] and EGA [17]. However, current applications of NSGA-II remain concentrated in areas such as emergency supply and evacuation sites [18], with limited focus on funding allocation. This research gap motivates our adoption of NSGA-II to construct optimized funding schemes for flash-flood mitigation. The ultimate goal of this line of research is to develop an integrated optimization framework to rationalize pre-disaster resource distribution, strengthen regional disaster preparedness, and reduce flash-flood risks.
Southern Tibet is located in the southeastern part of the Qinghai–Tibet Plateau. As a typical high-altitude, ecologically fragile region, it serves as the core of the Qinghai–Tibet Plateau’s ecological security barrier and is also a critical water source conservation area for multiple downstream regions, supporting ecological balance and socioeconomic development across a wide area [19]. The region features complex geological structures and significant topographical variations, encompassing diverse landscapes such as plateaus, mountains, and river valleys. Under the combined influence of monsoon and plateau climates, flash floods exhibit characteristics of high frequency, sudden onset, and complex disaster mechanisms, posing a severe threat to regional ecological stability and public welfare. Currently, there is a lack of multi-dimensional vulnerability assessments and funding allocation studies for flash floods in this region, leading to an insufficient understanding of disaster-prevention resource allocation in high-altitude vulnerable areas, which constrains the enhancement of regional disaster resilience and the achievement of sustainable development goals.
The aim of this study is to propose a multi-objective flash-flood funding allocation framework based on multi-dimensional vulnerability assessment results, to provide more precise and effective funding allocation strategies for the pre-disaster defense phase. Firstly, we construct a small watershed-scale evaluation index system and map the multi-dimensional vulnerability of flash floods. We then develop a funding allocation framework based on multi-dimensional vulnerability assessment (MD-FAOM) and solve the Pareto-optimal solution set using the NSGA-II algorithm combined with the TOPSIS method. Finally, we compare the funding allocation results obtained from the flash flood intensity scenario with those derived from the MD-FAOM approach. This framework holds significant implications for enhancing the precision and effectiveness of funding allocation in pre-disaster defense across flood-prone regions and facilitating sustainable disaster risk reduction under global climate change.

2. Materials and Methods

2.1. Study Area

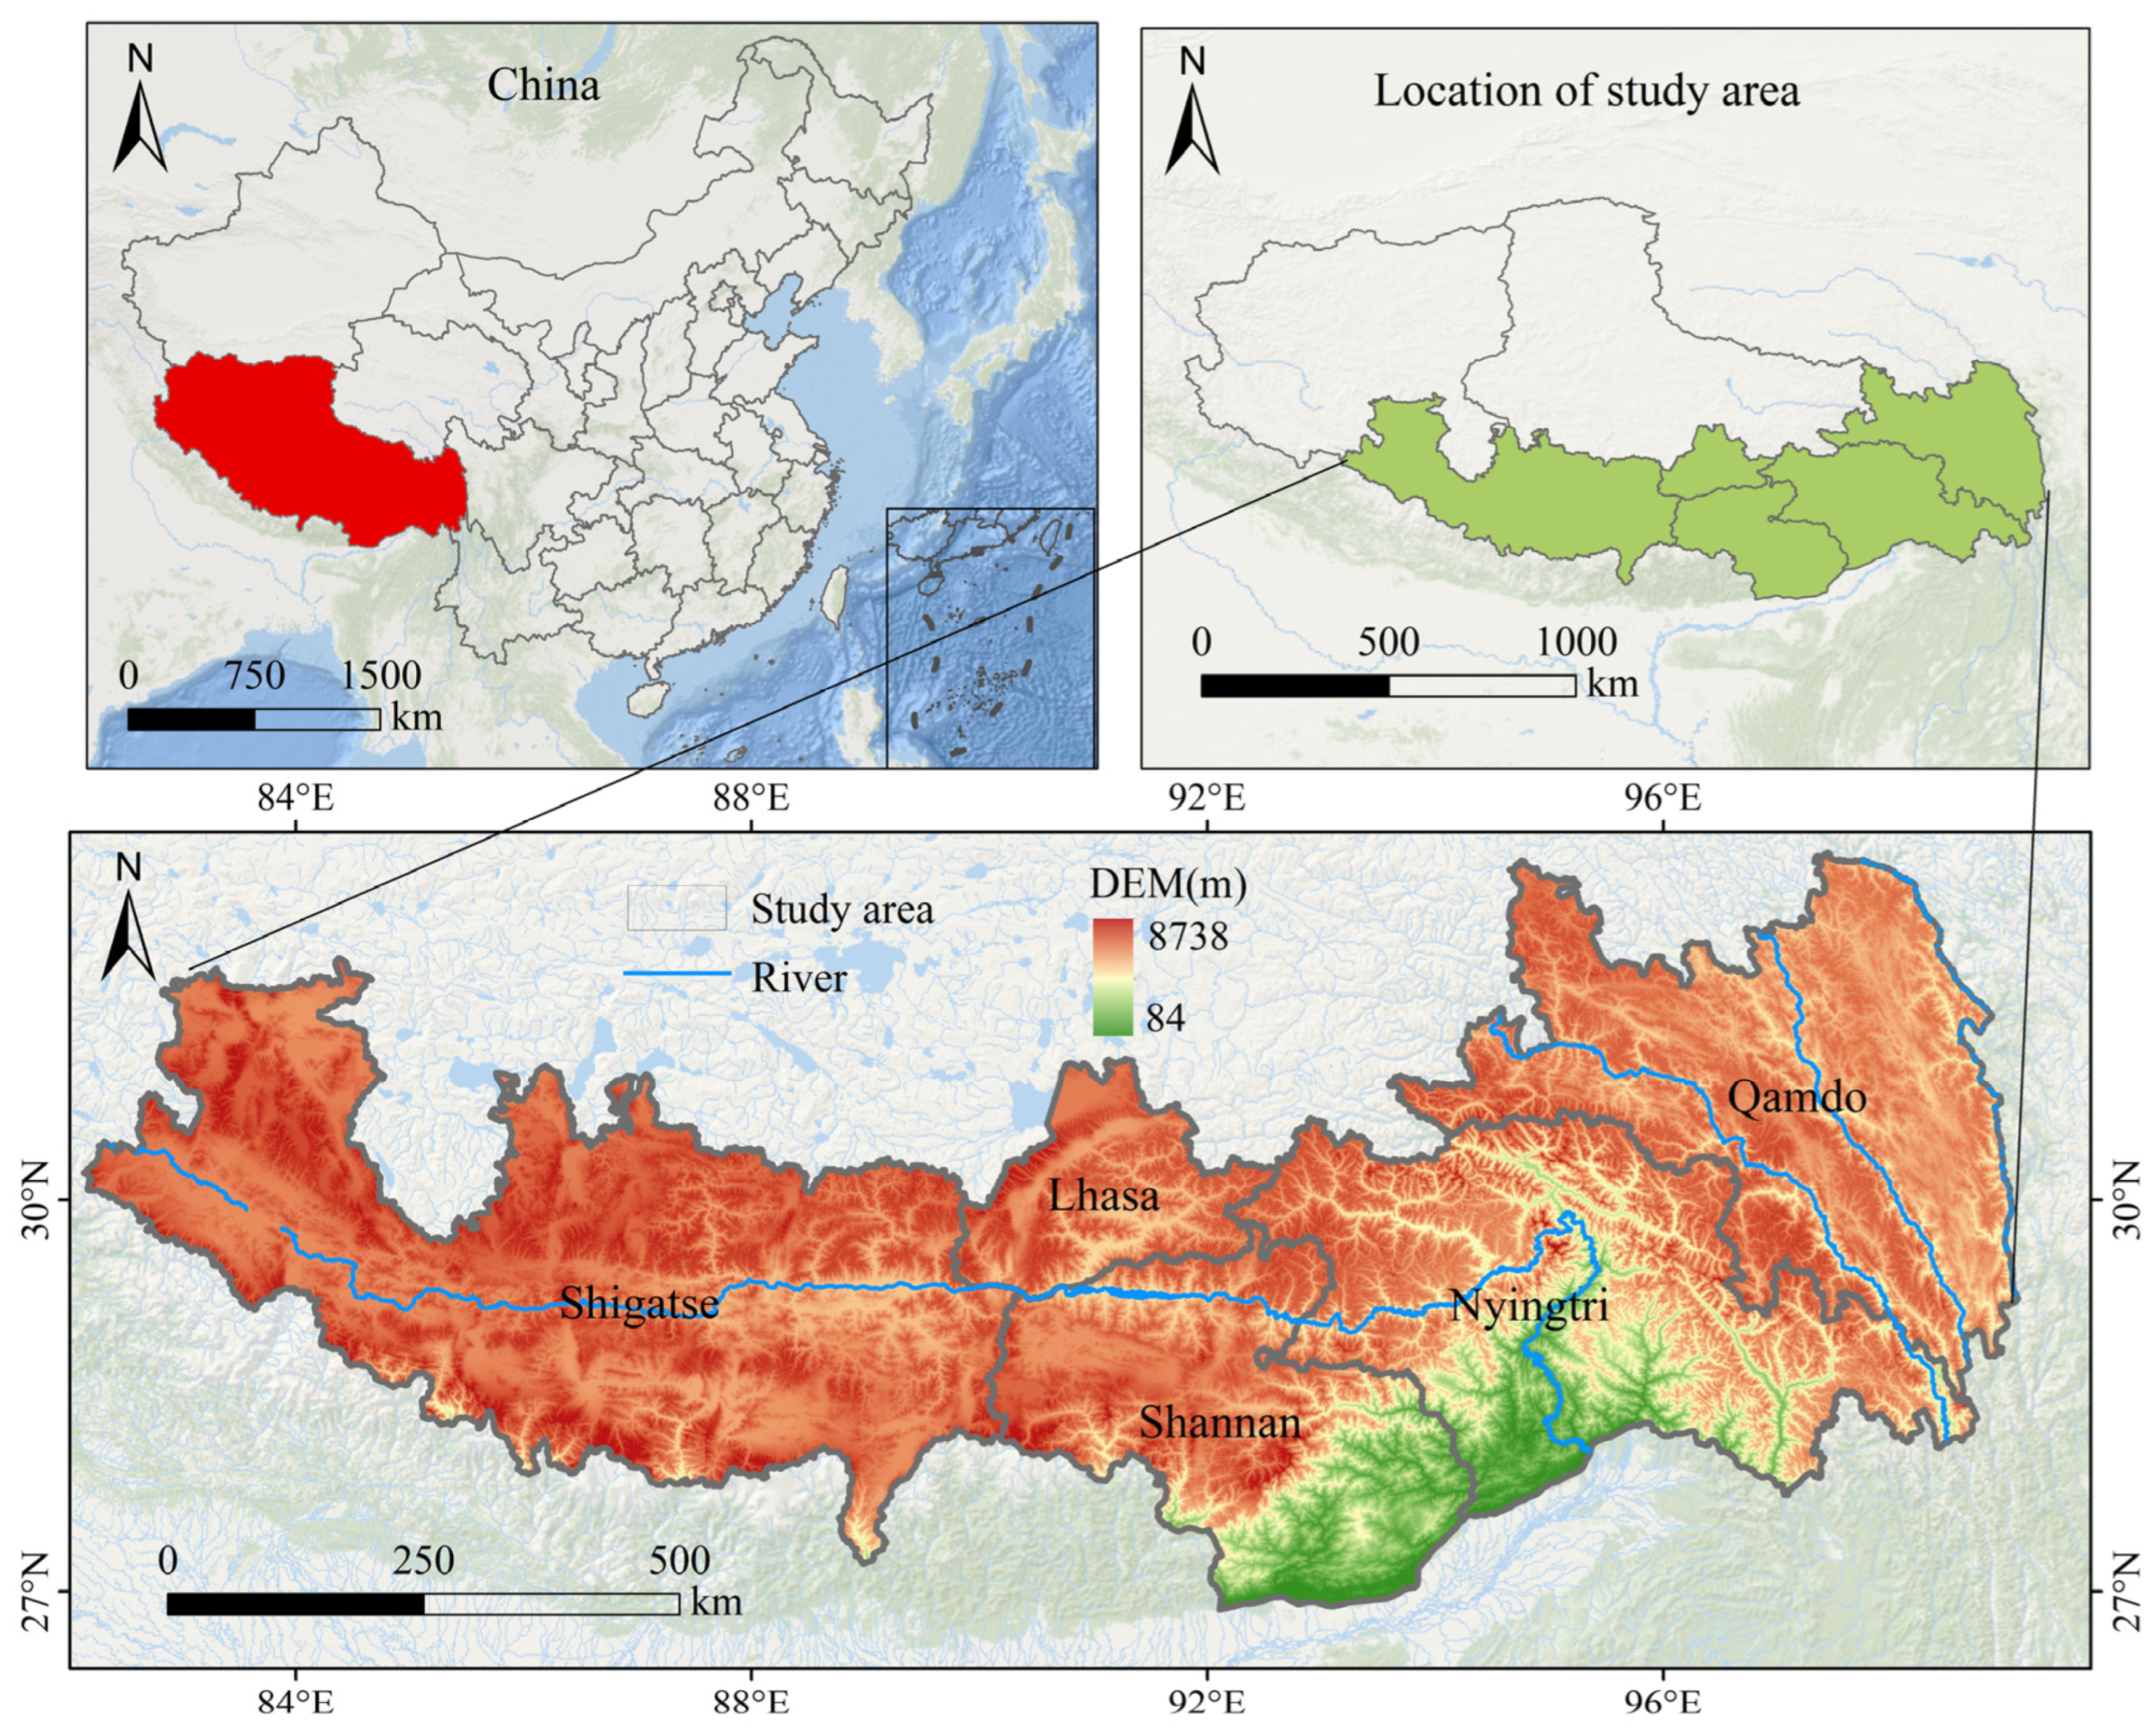
The study area is located in southern Tibet, China, encompassing five prefectures: Shigatse City, Lhasa City, Shannan City, Nyingchi City, and Qamdo City (26°51′–32°35′ N, 82°08′–99°06′ E). The total area is approximately 510,000 km2, with an average elevation of over 4000 m, and it features high mountains and deep valleys. It possesses rivers such as the Yarlung Zangbo River, the Nu River, and the Lancang River. Summer glacial melt combined with monsoonal precipitation, exacerbated by global warming [20], frequently generates flash-flood peaks. The annual rainfall averages about 500 mm, 70% of which occurs from June to September [21]. The maximum hourly rainfall can reach 50 mm and may trigger flash floods and mudslides. Accordingly, 60% of the cultivated land lies in valley lowlands, which are prone to flooding [20]. Flash floods primarily occur near the Yarlung Zangbo River, Lhasa River, and Nianchu River. Lhasa, Shannan, and Shigatse are the core disaster areas, with the direction of disaster migration primarily towards the southeast. In the southern part of Tibet, a total of 729 mountain flood disasters of varying magnitudes occurred between 2000 and 2015, most of which happened during the peak summer rainfall season in July and August (Table 1), and were predominantly short-duration, high-flow-rate sudden flash floods. Southern Tibet is the region with the highest frequency of flash-flood disasters and the most severe casualties in Tibet, and it is also relatively developed in terms of economy and population. As of the beginning of 2024, the permanent population of this area reached 3.02 million people, with a gross domestic product (GDP) of 208.436 billion yuan, accounting for more than 87% of the Tibet Autonomous Region. The study area schematic diagram is shown in Figure 1.

2.2. Research Framework

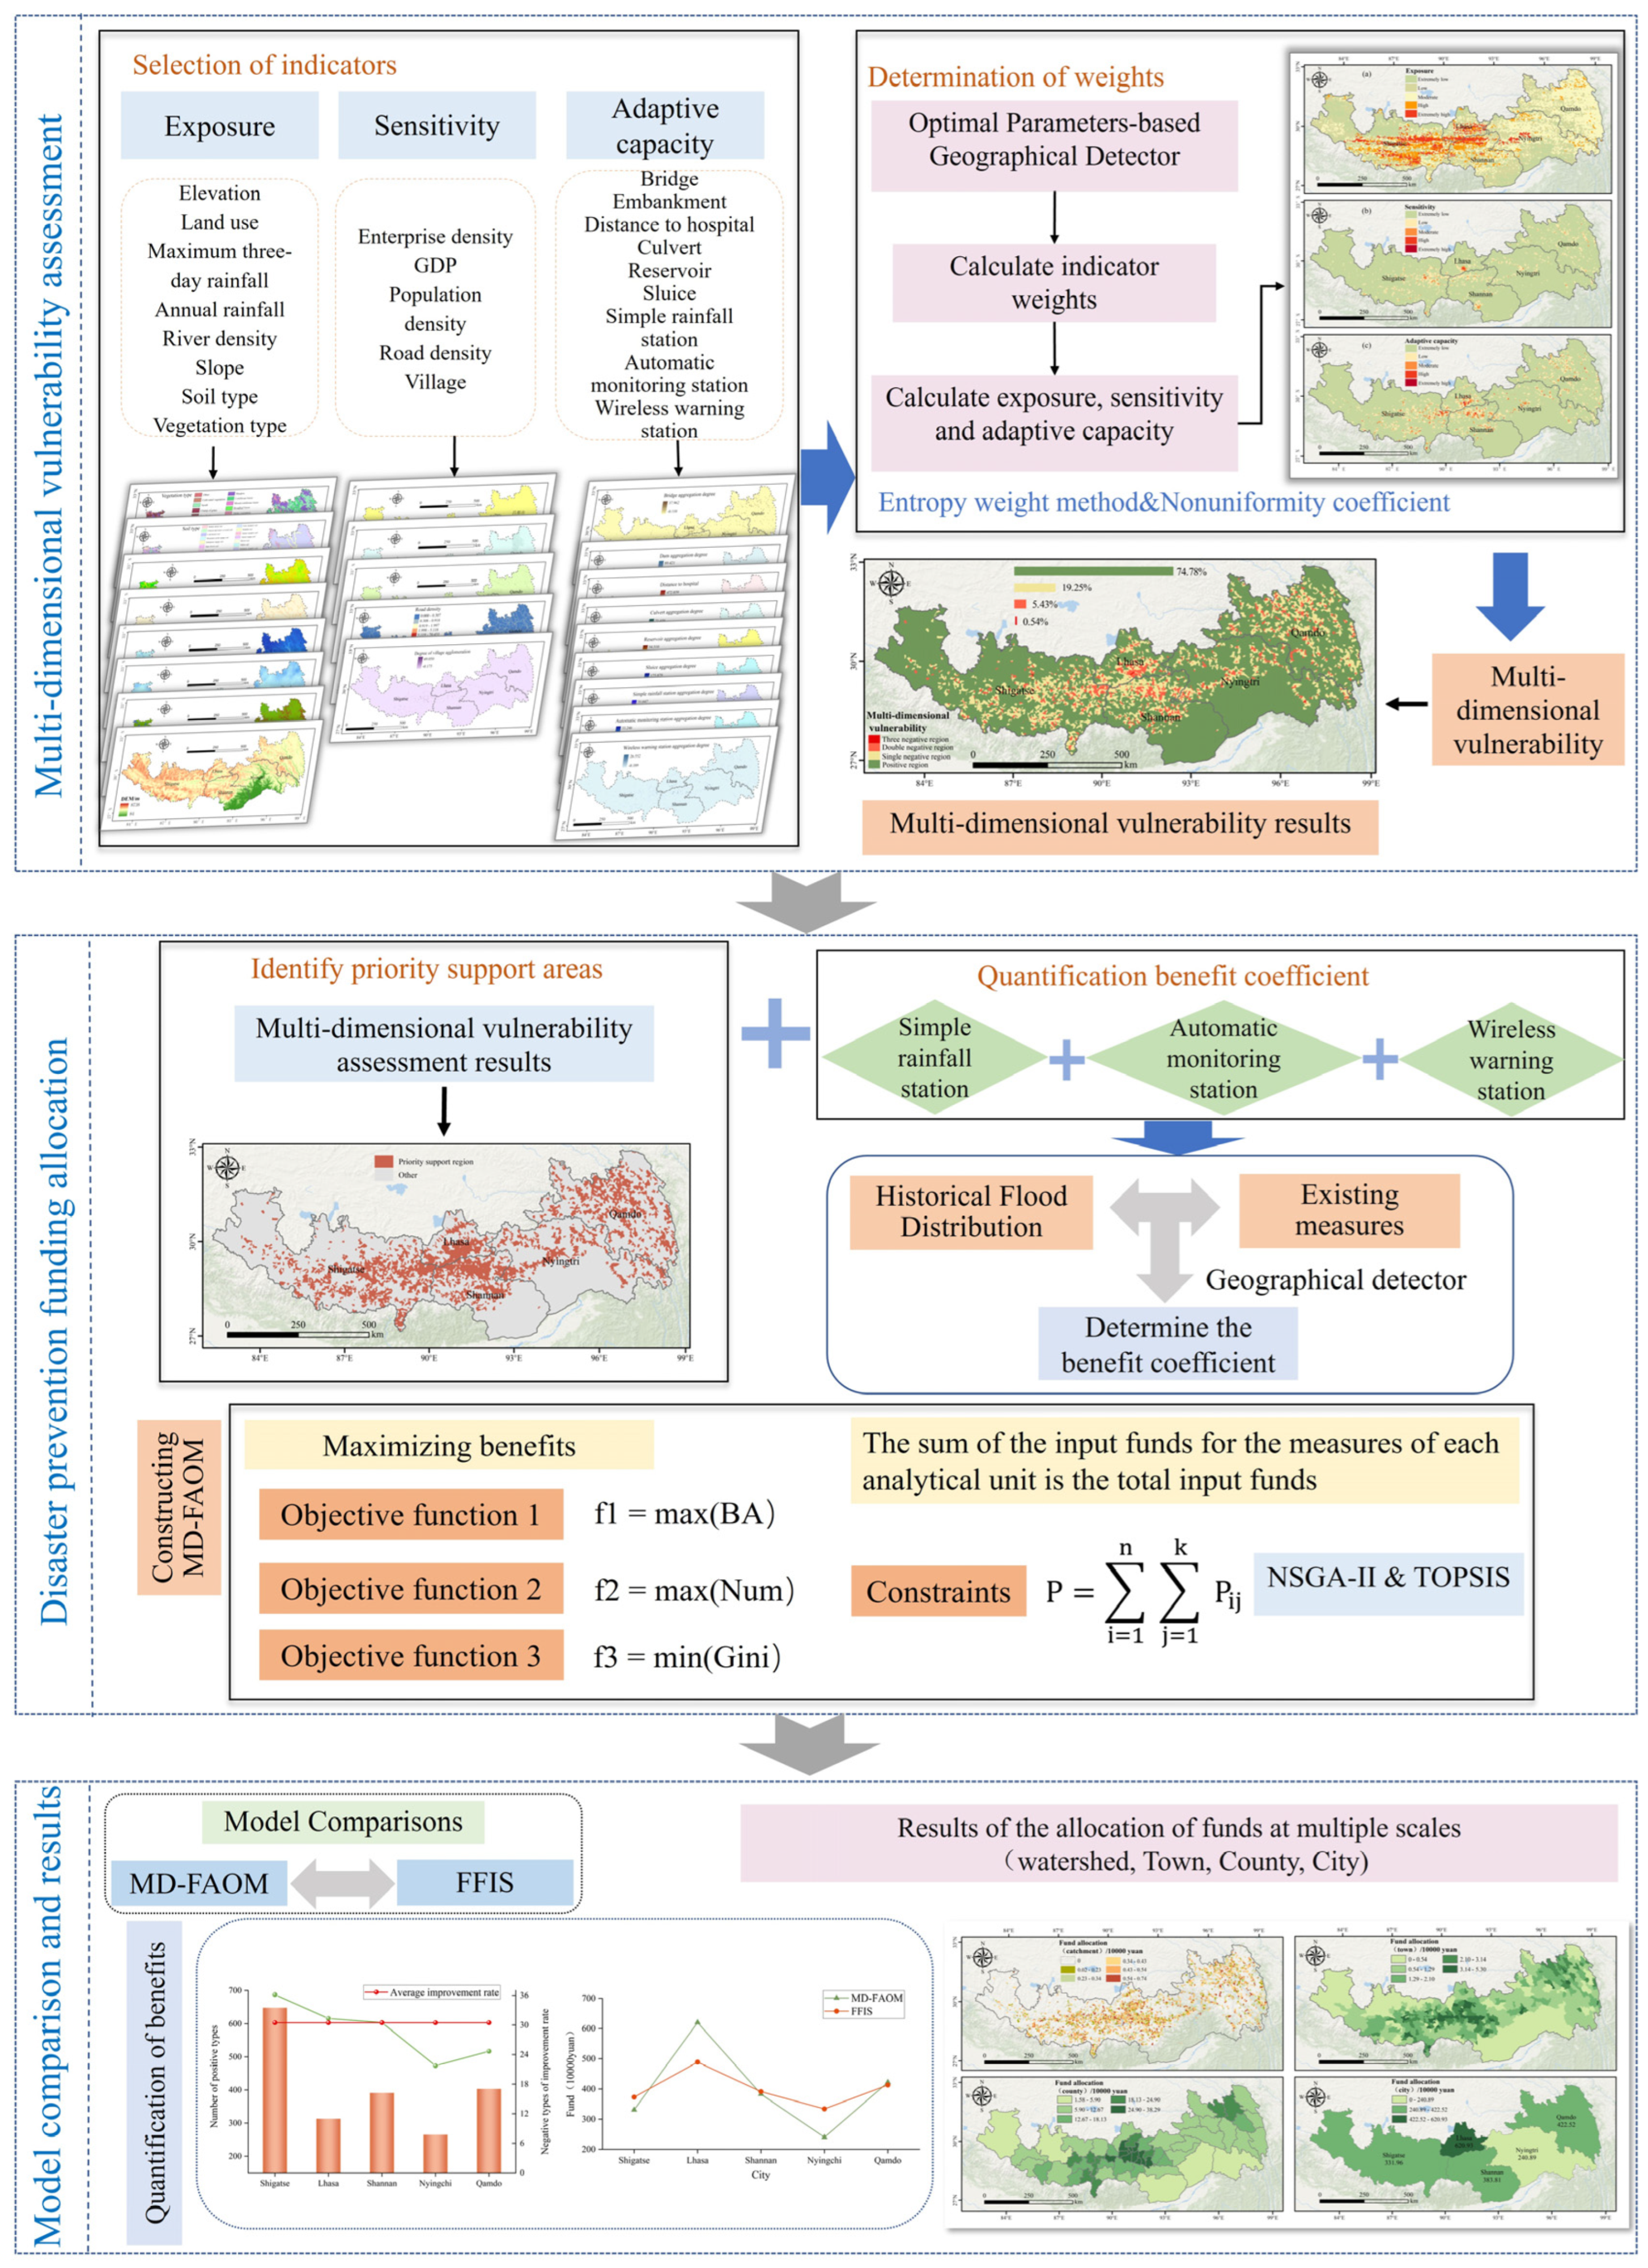
To address the scientific and rational allocation of limited disaster funds across regions, this study develops a framework integrating multi-dimensional vulnerability assessment and flash-flood-mitigation fund allocation (Figure 2). The framework proceeds in three stages: first, a multi-dimensional vulnerability assessment system is established, with indicator weights determined via the geographical detector, yielding exposure, sensitivity, adaptive capacity, and multi-dimensional vulnerability results. Second, priority support areas are identified from these results; suitable disaster-prevention measures are selected, and their benefit coefficients are determined using the geographical detector. Third, under limited resource constraints, a funding allocation framework is constructed by integrating vulnerability’s spatial differentiation, addressing both system-wide optimization and key-area governance via multi-dimensional decision optimization. The framework employs NSGA-II for multi-objective collaborative optimization and integrates TOPSIS to identify the optimal solution, providing decision support for enhancing the precision and sustainability of disaster-prevention resource allocation.

2.3. Multi-Dimensional Evaluation of Vulnerability

2.3.1. Selection of Indicators

The concept of vulnerability generally comprises three essential elements: the degree of exposure to disturbances or external pressures, sensitivity to disturbances, and coping capacity [22]. Consequently, flash-flood vulnerability is categorized into three components: exposure, sensitivity, and adaptive capability. Currently, the indicator system-based assessment approach is widely applied across various fields [23]. This approach integrates multiple dimensions, including natural, social, and economic factors, to form a structured framework [24]. By taking a multi-dimensional perspective, this method overcomes the limitations of focusing on a single aspect, thereby providing a more thorough comprehension of the underlying causes of vulnerability. Flash-flood vulnerability needs to incorporate natural exposure, social sensitivity, economic structure, and adaptive capability. Based on the above analysis and considering the principles of representativeness, systematicity, measurability, and operability, this study ultimately constructs a vulnerability assessment system consisting of 22 indicators (see Table 2 for details). All detailed information regarding the vulnerability assessment indicators is displayed in the table.
Exposure reflects the potential likelihood of an area being threatened by disasters, mainly determined by natural geographic conditions [25]. It includes factors such as elevation, land use, and annual rainfall. Sensitivity measures the potential damage of flash floods to socioeconomic systems, emphasizing the concentration of population and economy [26]. It includes factors such as gross domestic product (GDP), population density, and road density. Adaptive capability is a region’s capacity to utilize infrastructure and emergency resources to react to disasters [27]. It includes factors such as bridges, embankments, and wireless warning stations.

2.3.2. Multi-Dimensional Assessment

Before conducting a vulnerability assessment, the indicators’ weights must be established. The geographical detector is utilized in this work to establish the indicators’ weights [28]. Geo-detectors are used to examine spatial heterogeneity and identify its influences [29]. This method quantifies the degree to which different potential factors explain the spatial heterogeneity of phenomena, thereby objectively determining the weights of different indicators. Compared to the limitations of traditional methods that rely on subjective weighting or simple linear assumptions, the Geographical Detector explores the geographical coupling characteristics between variables, avoiding the risk of weight allocation being disconnected from the true spatial association, and is calculated using Equations (1) and (2).
q = 1 h = 1 L N h σ h 2 N σ 2
w j = P D j j = 1 m P D j
where N h and N represent the number of layers h and the total number of study units, respectively; σ 2 is the variance of vulnerability across the entire study area; w j is the weight of each indicator; P D j is the contribution distribution of the jth category of indicators to mountain flood hazards.
Exposure, sensitivity, and adaptive capability are the three factors that determine vulnerability, calculated using Equations (3)–(9).
H i = k j = 1 n f i j ln f i j
f i j = z i j j = 1 n z i j
k = 1 ln n
u i = 2 H i
E X i = E X u i j = 1 n w j x i j
S E i = S E u i j = 1 k w j x i j
A C i = j = 1 p w j x i j A C u i
where z i j is the quantitative value of each indicator; f i j is the characterization value of each indicator; H i is the entropy value of the ith evaluation object; u i is the inhomogeneity coefficient of the ith evaluation object; E X u i , S E u i and A C u i are the inhomogeneity coefficients of exposure, sensitivity, and adaptive capacity of the ith small watershed, respectively; E X i , S E i and A C i are the exposure, sensitivity and adaptive capacity of the ith evaluation object, respectively.
This study introduces the concept of multi-dimensional vulnerability. It is based on a quantitative analysis that examines the balanced development between exposure, sensitivity, and adaptive capacity. Six dimensions have been identified for consideration in the vulnerability assessment process: Disaster Risk Potential (DRP), Economic Growth Potential (EGP), Adaptive Deficiency Indicator (ADI), Community Resilience Capacity (CRC), Hazard Frequency Risk (HFR), and Resource Utilization Inefficiency (RUI). Specific details are shown in Table S1. Based on the above definitions, the multi-dimensional vulnerability assessment result map can be obtained.

2.4. Framework for Allocation of Flash-Flood-Disaster-Prevention Funds

2.4.1. Determine Priority Support Areas and Benefit Coefficient

When determining the priority of disaster management, the criteria for assessing the severity of disasters should be based on systemic risk assessment [13]. Traditional methods typically focus solely on analyzing the physical destructive potential of single natural hazard factors [30], whereas the innovative multi-dimensional vulnerability assessment integrates interactions among the three vulnerability components. Based on multi-dimensional vulnerability results, priority support areas characterized by high population density, weak infrastructure protection, and unbalanced emergency resource allocation, thus prone to severe disaster consequences [31], are identified.
Within the multi-dimensional vulnerability framework, adaptive capacity can be enhanced via infrastructure development [32], considering feasibility and cost. Improved adaptive capacity transforms ADI and HFR into positive types, reducing overall vulnerability. Additionally, geo-detector technology quantifies relationships between historical flash-flood distributions and preventive measures [33], revealing correlations between measures and flood patterns [34] to derive benefit coefficients for all measures.

2.4.2. Framework for Allocating Funds Based on Multi-Dimensional Assessment of Vulnerability

To maximize investment efficiency, this study develops a multi-dimensional vulnerability-based fund allocation model (MD-FAOM) built on the existing FAOM [17]. MD-FAOM emphasizes interrelationships between exposure, sensitivity, and adaptive capacity [35] and their impacts on allocation decisions, incorporating three objective functions:
Firstly, in terms of overall disaster-prevention benefits, the fund’s investments generate specific benefits, which are assessed by transforming negative indicators into the unit of analysis. Single-indicator conversion achieves 1/3 of the target; double conversion achieves 2/3. Marginal benefits persist even in the absence of positive conversions. Secondly, in terms of optimization of disaster-prevention objectives, the ideal strategy would be to transform passive indicators into active ones, gradually narrowing the scope of the objectives and thus the focus of the allocation of funds. Furthermore, the Gini coefficient would be introduced to ensure fairness in the distribution of funds for flash-flood prevention and control [36], and an “equity-efficiency” dynamic balancing mechanism would be adopted to maximize the effectiveness of disaster prevention.
Goal function 1: maximize the total benefit areas of every analysis unit within the study area, calculated using Equations (10)–(15).
f 1 = M a x ( B A )
B A = i = 1 q P A C i S i 3 M i n ( E X i , S E i ) + i = q + 1 l 1 3 S i + i = l + 1 n 2 3 S i
P A C i = A C i + I A C i
I A C i = j = 1 k M i j ω j
M i j = y i j y i j min y i j max y i j min
y i j = P i j I j
where B A is the total of all analysis units’ areas of benefit; P A C i is the current adaptive capacity of the ith analysis unit with the addition of new measures; S i is the ith watershed’s area; q is the number of analysis units without a positive type in the six dimensions of vulnerability; I A C i is the added adaptive capacity; M i j is the jth measure’s standardized value in the ith unit of analysis; k is the number of non-engineering measure types; ω j is the benefit coefficient; y i j is the number of the jth measure in the ith unit of analysis; P i j is the amont invested in the jth measure inside the ith unit of analysis; and I j is the measure’s cost.
Goal function 2: The number of positive types for all analysis units reaches the maximum value, calculated using Equations (16) and (17).
f 2 = M a x ( N u m )
N u m = i = 1 n N u m ( P A C i > E X i o r P A C i > S E i )
where Num is the total number of positive types in the vulnerability measure for all units of analysis in the study area.
Goal function 3: Minimize the Gini coefficient, calculated using Equation (18).
f 3 = min ( G i n i )
Restrictions: The total amount of funds invested in each research unit cannot be more than the entire sum of funds, and the sum of the funds invested in the research units must match the total amount of funds invested in all the measures, calculated using Equation (19).
P = i = 1 n j = 1 k P i j
where P is the overall investment across all analytical units.
Within the multi-objective optimization framework for fund allocation [37], this study adopts a hybrid strategy combining NSGA-II and TOPSIS [38]. Starting with a random initial population, the algorithm evaluates each individual’s objective function performance, then filters high-performance individuals via crowding distance calculation and non-dominated sorting. Pareto-optimal solutions are generated through iterative selection, crossover, and mutation to produce new generations until reaching the predefined number of generations or solution convergence [39]. Finally, TOPSIS is used to select the optimal solution from the Pareto set.

2.5. Spatial Data Processing and Visualization for Mapping Results

Before outputting all spatial maps and statistical figures in this paper, standardized spatial preprocessing and post-processing workflows were uniformly implemented for multi-source datasets, and all figures were generated following the data processing procedures:
(1)
For Figure 1 (location map of the study area): Administrative vector boundaries of southern Tibet, 30 m DEM raster, and river vector datasets were unified to the same coordinate system via projection transformation. Multi-scale nested layout mapping was completed in professional software to display the national location, regional scope, and topographic background of the study area.
(2)
For Figure 2 (framework for research): All indicator layers, weighting algorithms, multi-objective optimization models, and comparison modules were sorted according to the logical sequence of vulnerability assessment-fund allocation-model verification, and the process framework was visualized by combining the intermediate input and output variables of each step.
(3)
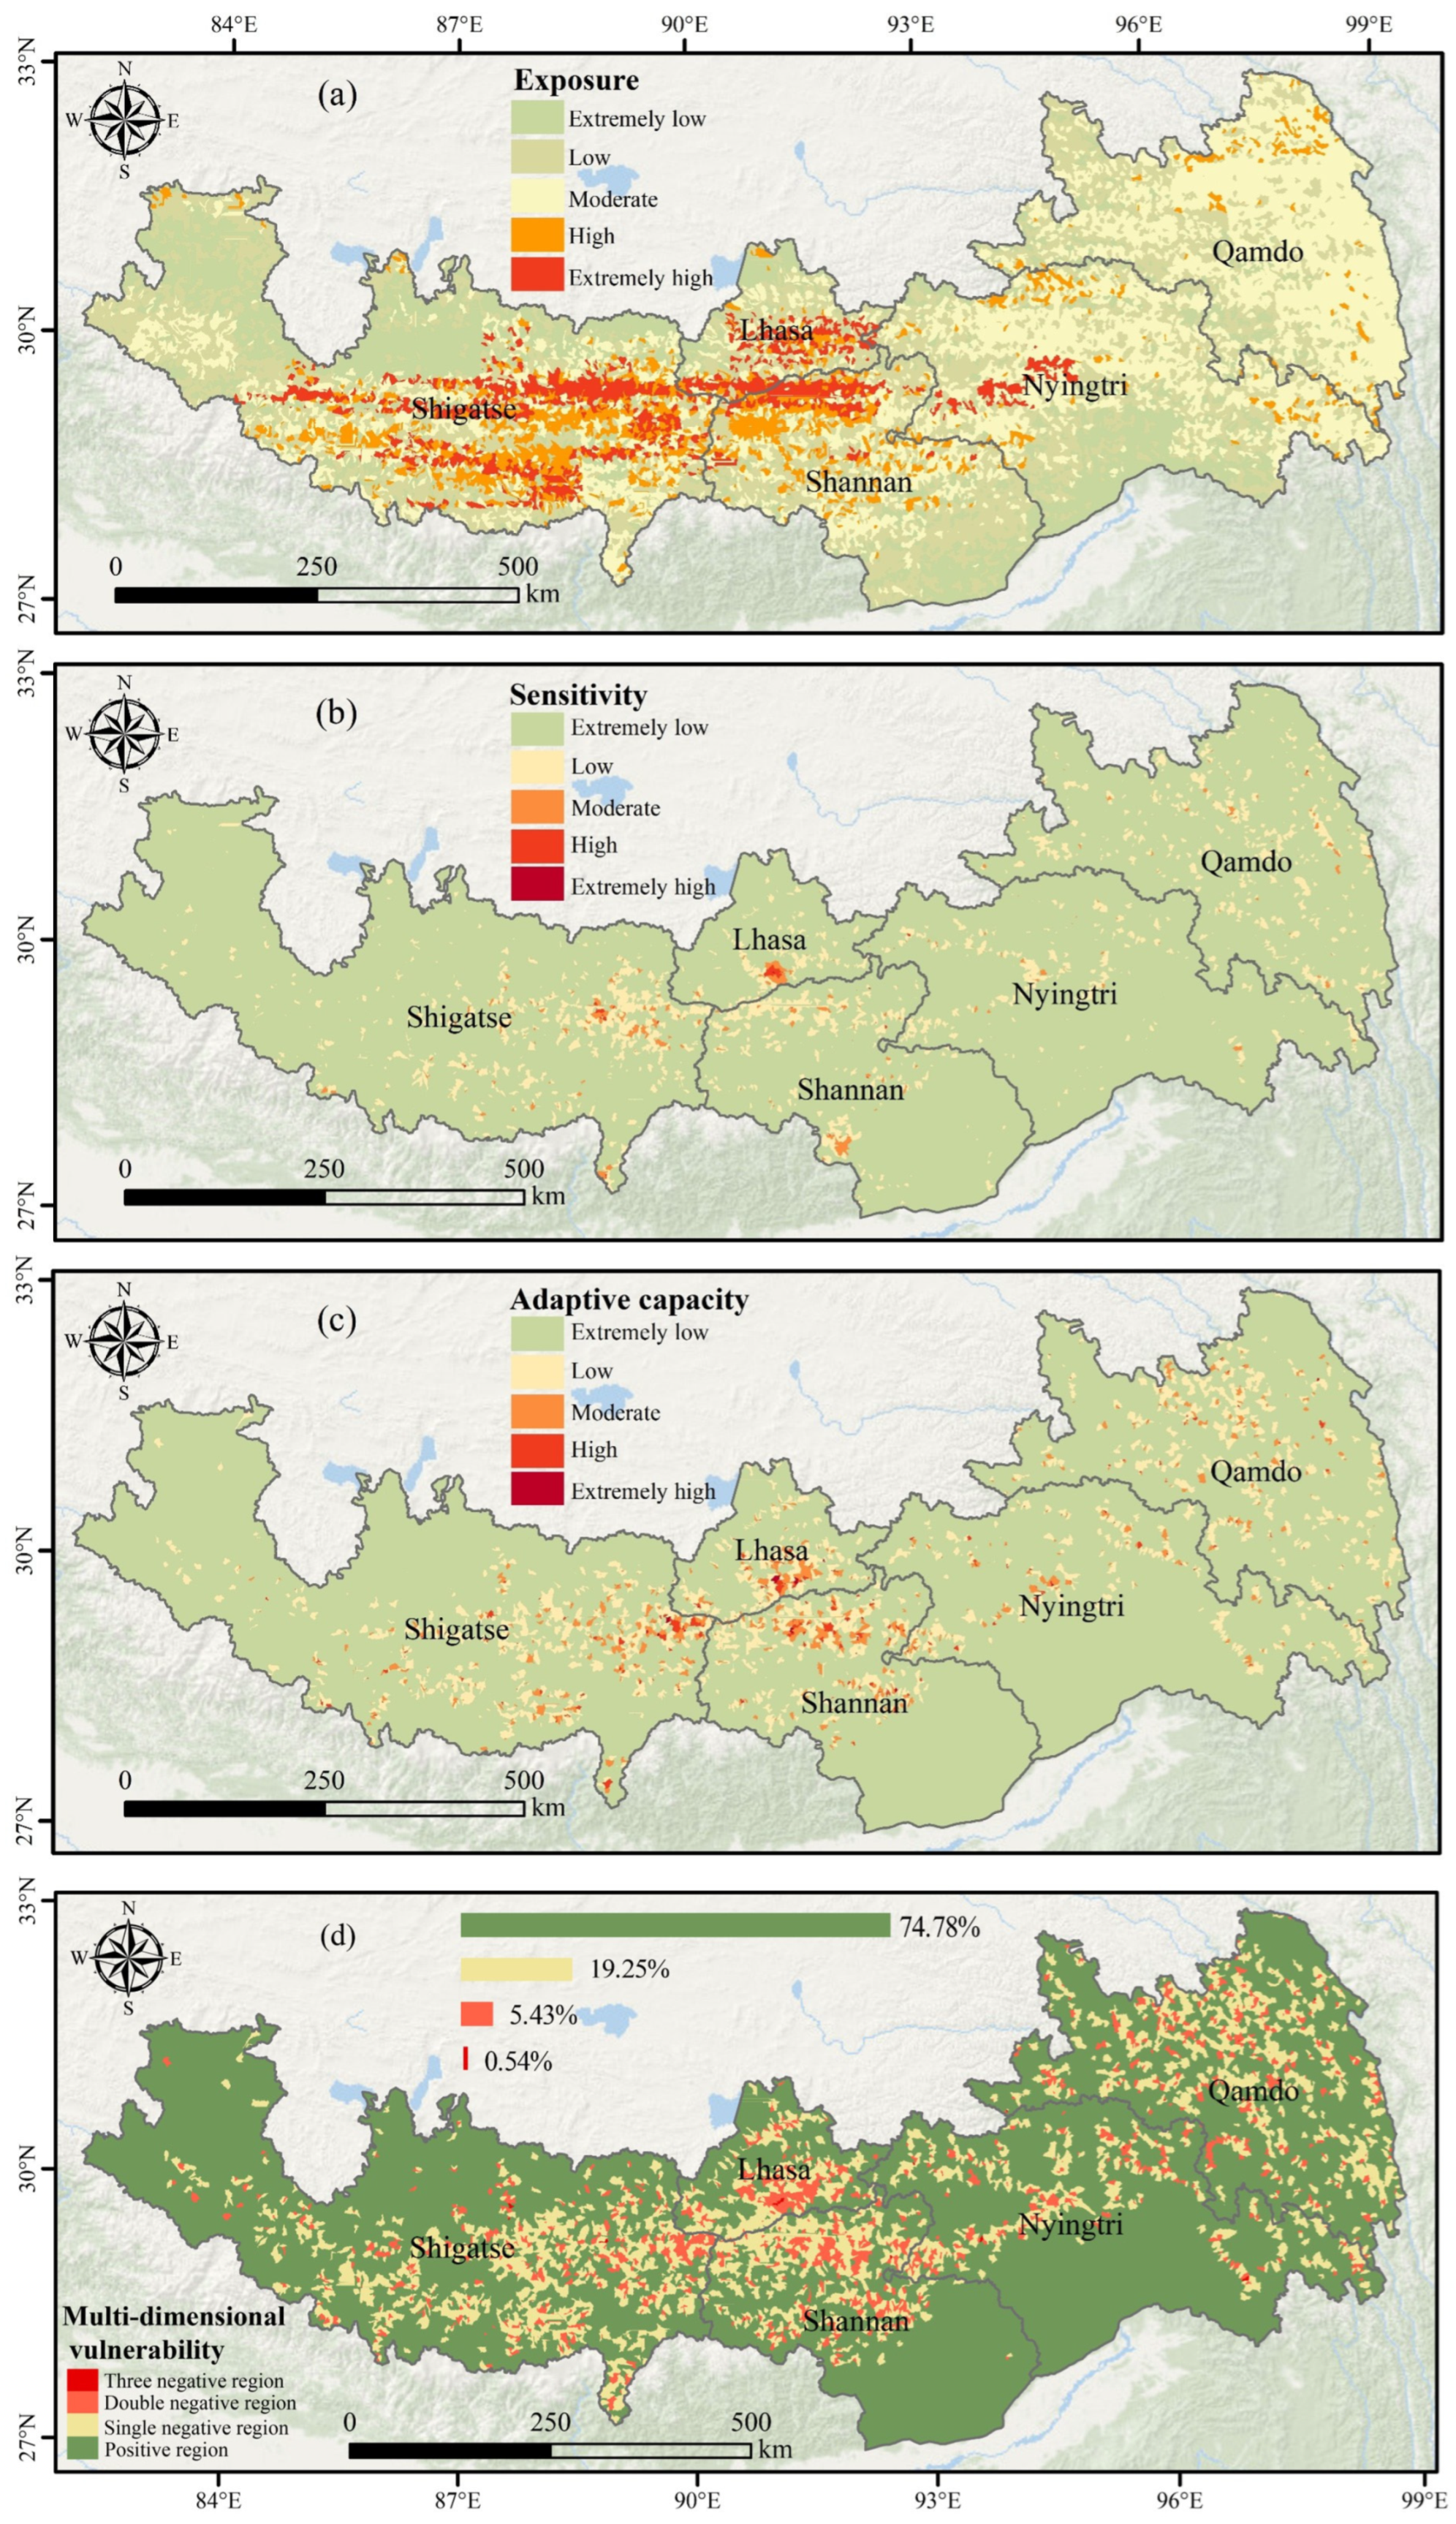
For Figure 3 (exposure, sensitivity, adaptive ability, and multi-dimensional vulnerability maps): All 22 vulnerability indicators were subjected to normalization, followed by indicator weight calculation via the geographic detector and entropy-inhomogeneity coefficient methods. The weighted superposition of exposure, sensitivity, and adaptive capacity raster layers was performed on a small watershed unit scale, and the natural breakpoint classification method was adopted to divide vulnerability grades for spatial rendering.
(4)
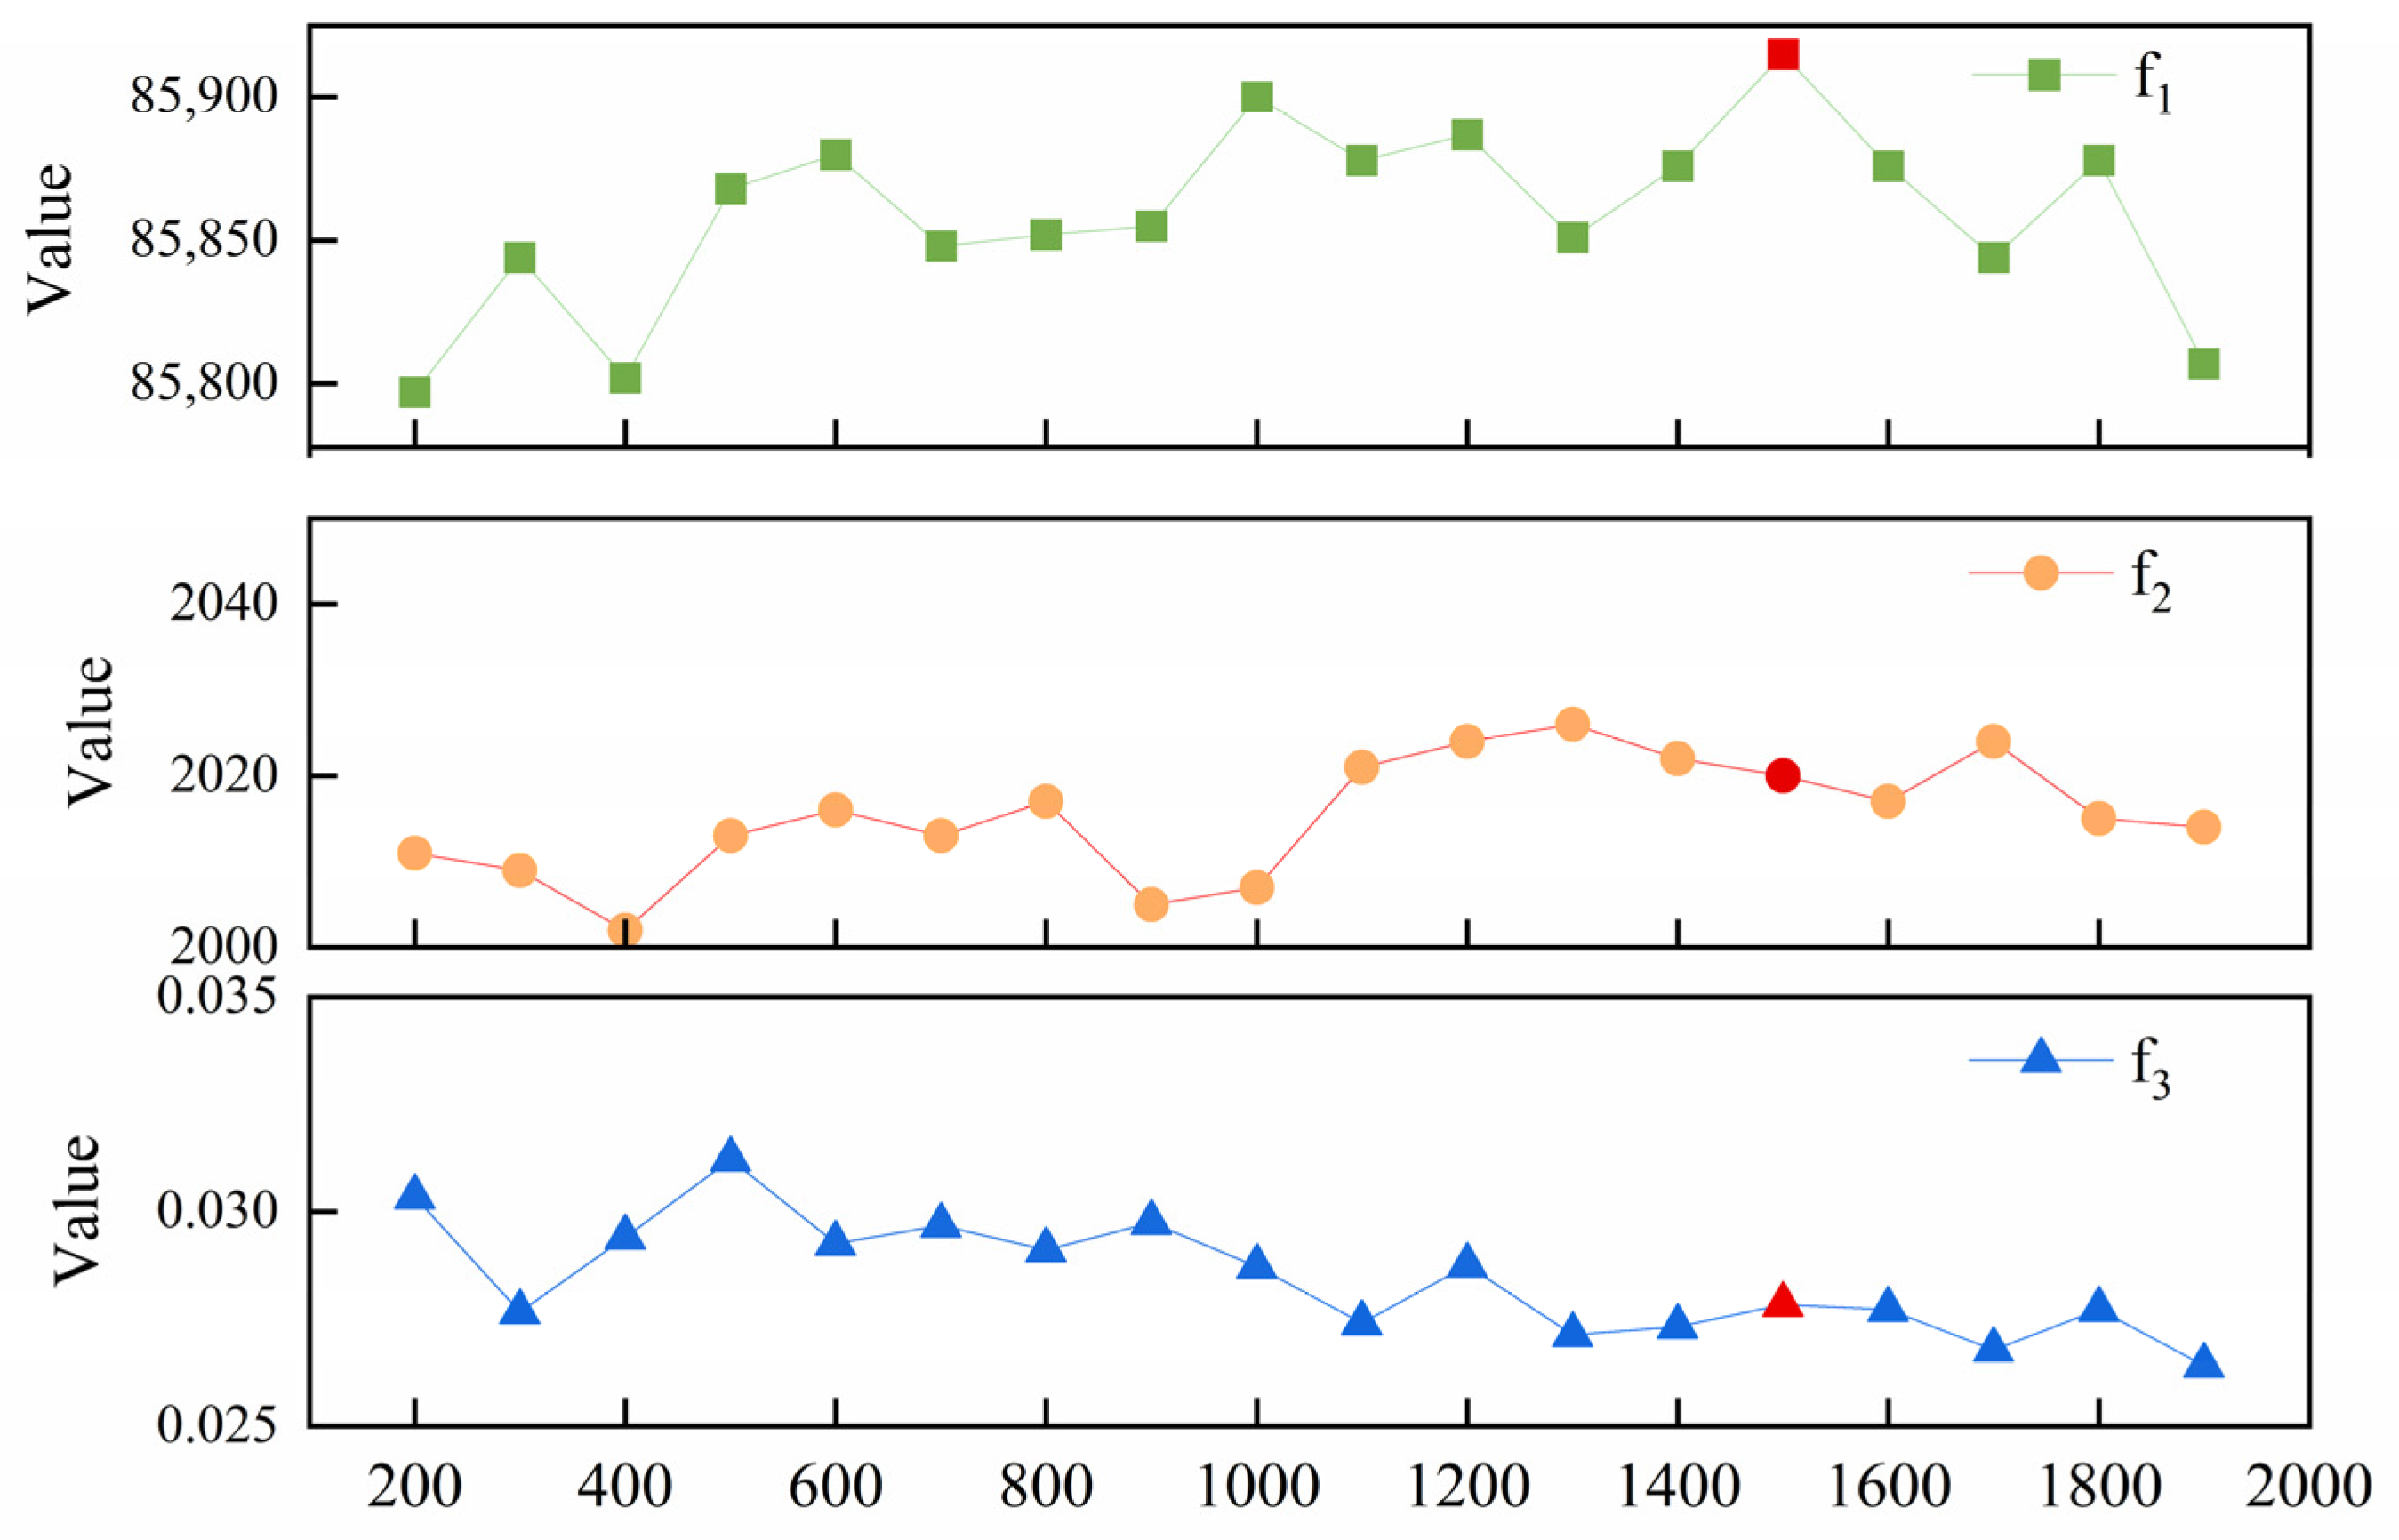
For Figure 4 (change in the value of the objective function as a function of iterations): The three objective function values of f1, f2, and f3 output by NSGA-II under different iteration generations were extracted, and the variation trend of each target index was plotted with iteration times as the horizontal axis to determine the optimal iteration threshold of 1500 generations.
(5)
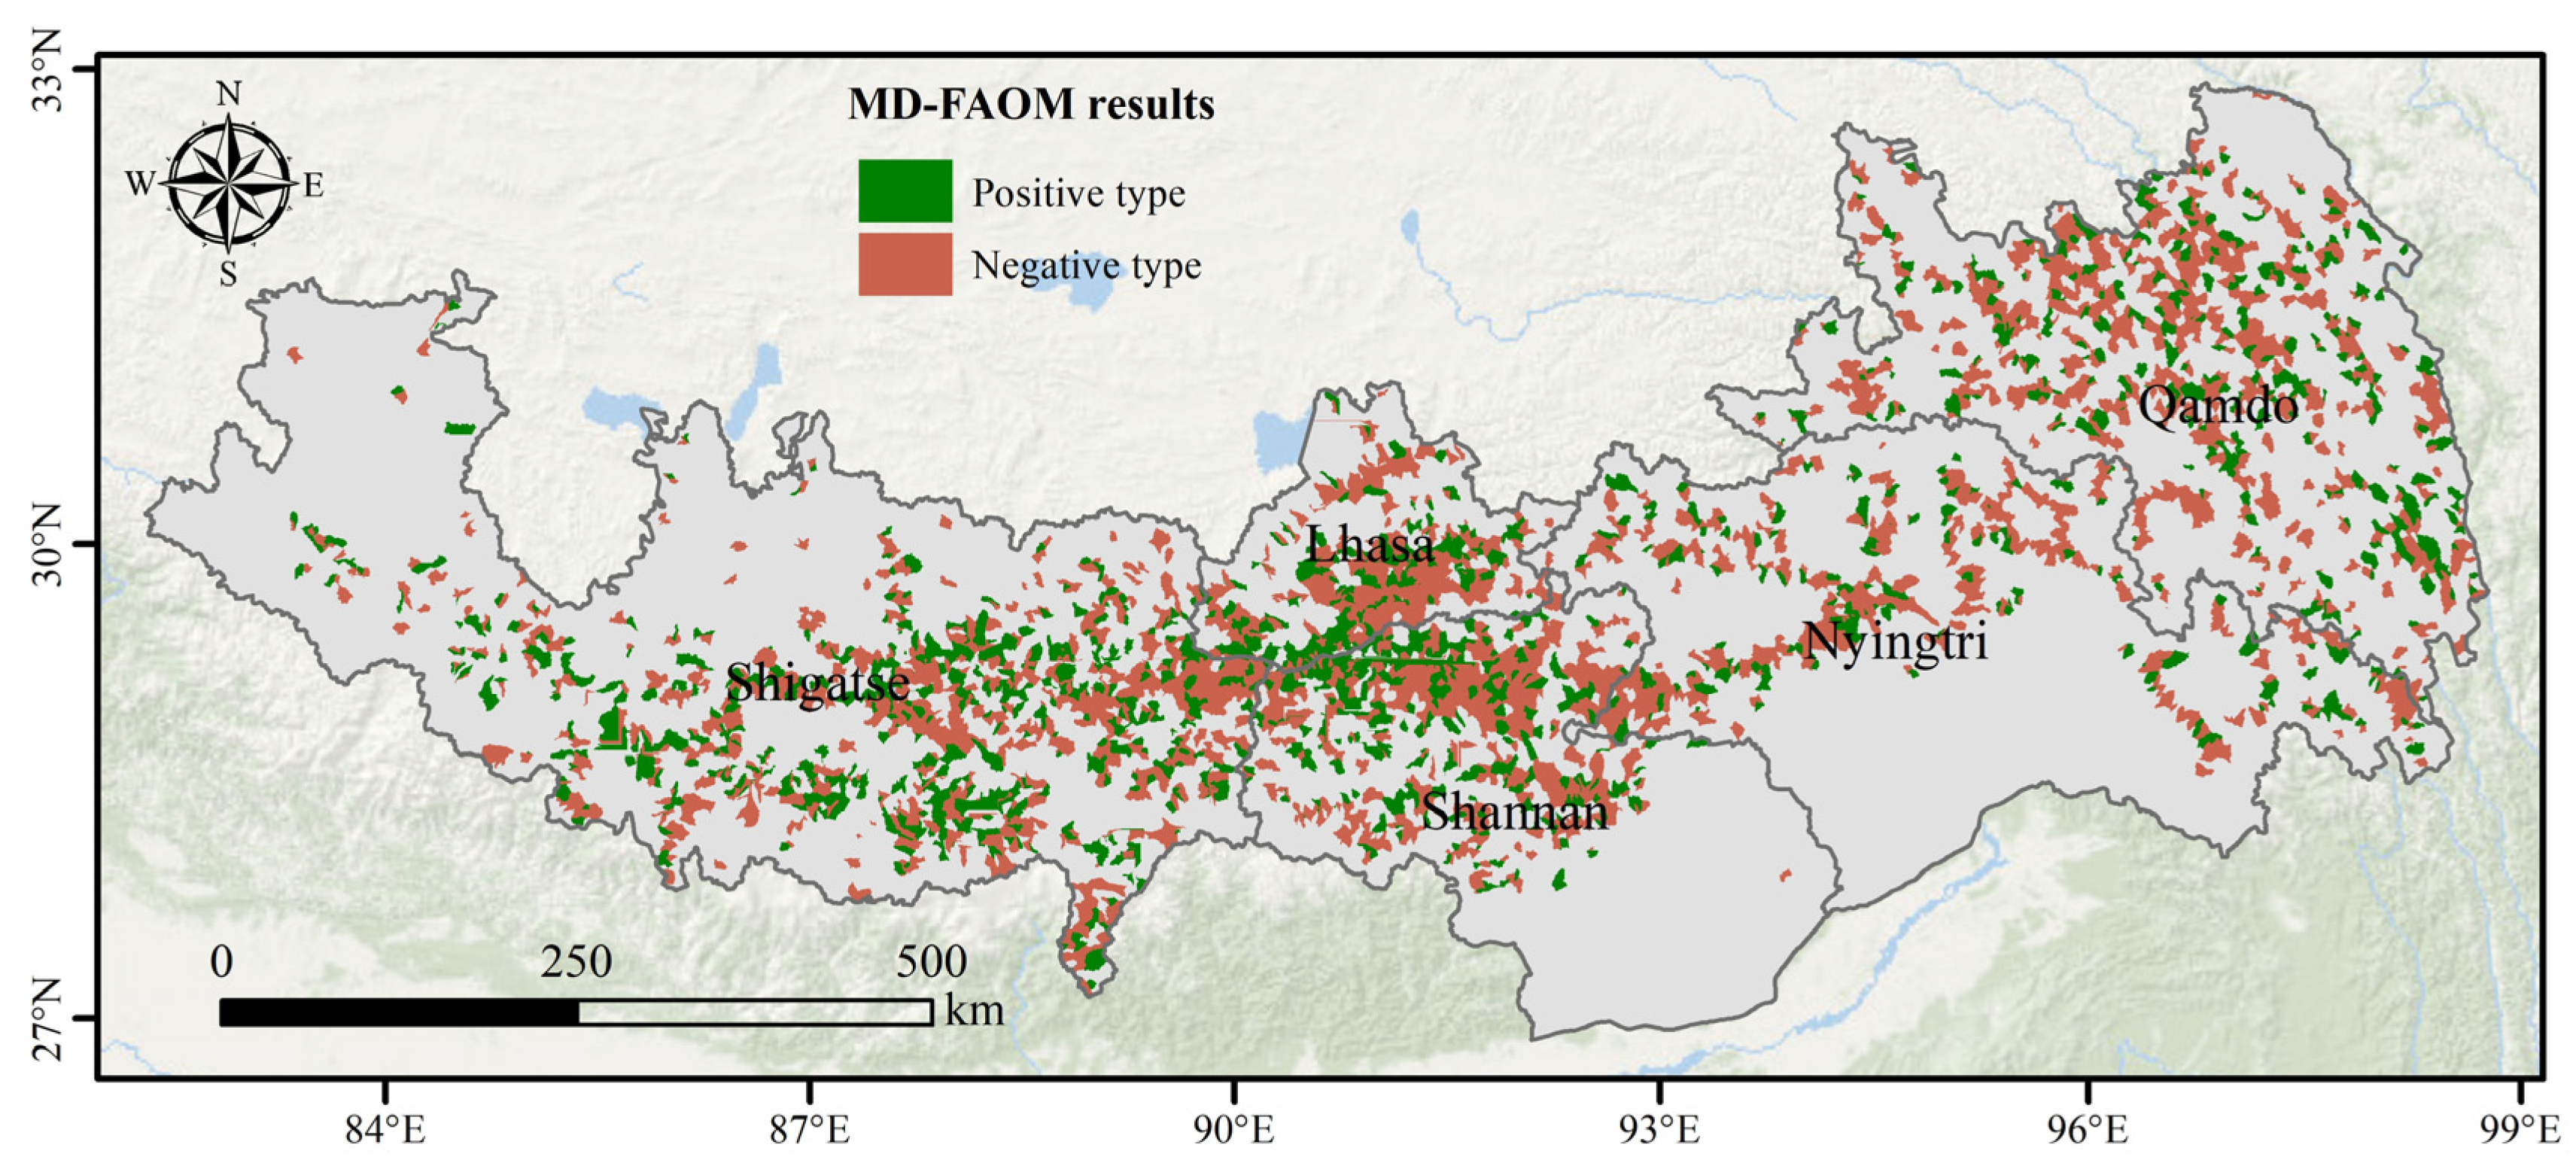
For Figure 5 (spatial distribution results of objective function 2): The Pareto-optimal solution screened by TOPSIS was assigned to each small watershed analysis unit, and watershed units were divided into positive and negative types based on the six-dimensional vulnerability conversion results.
(6)
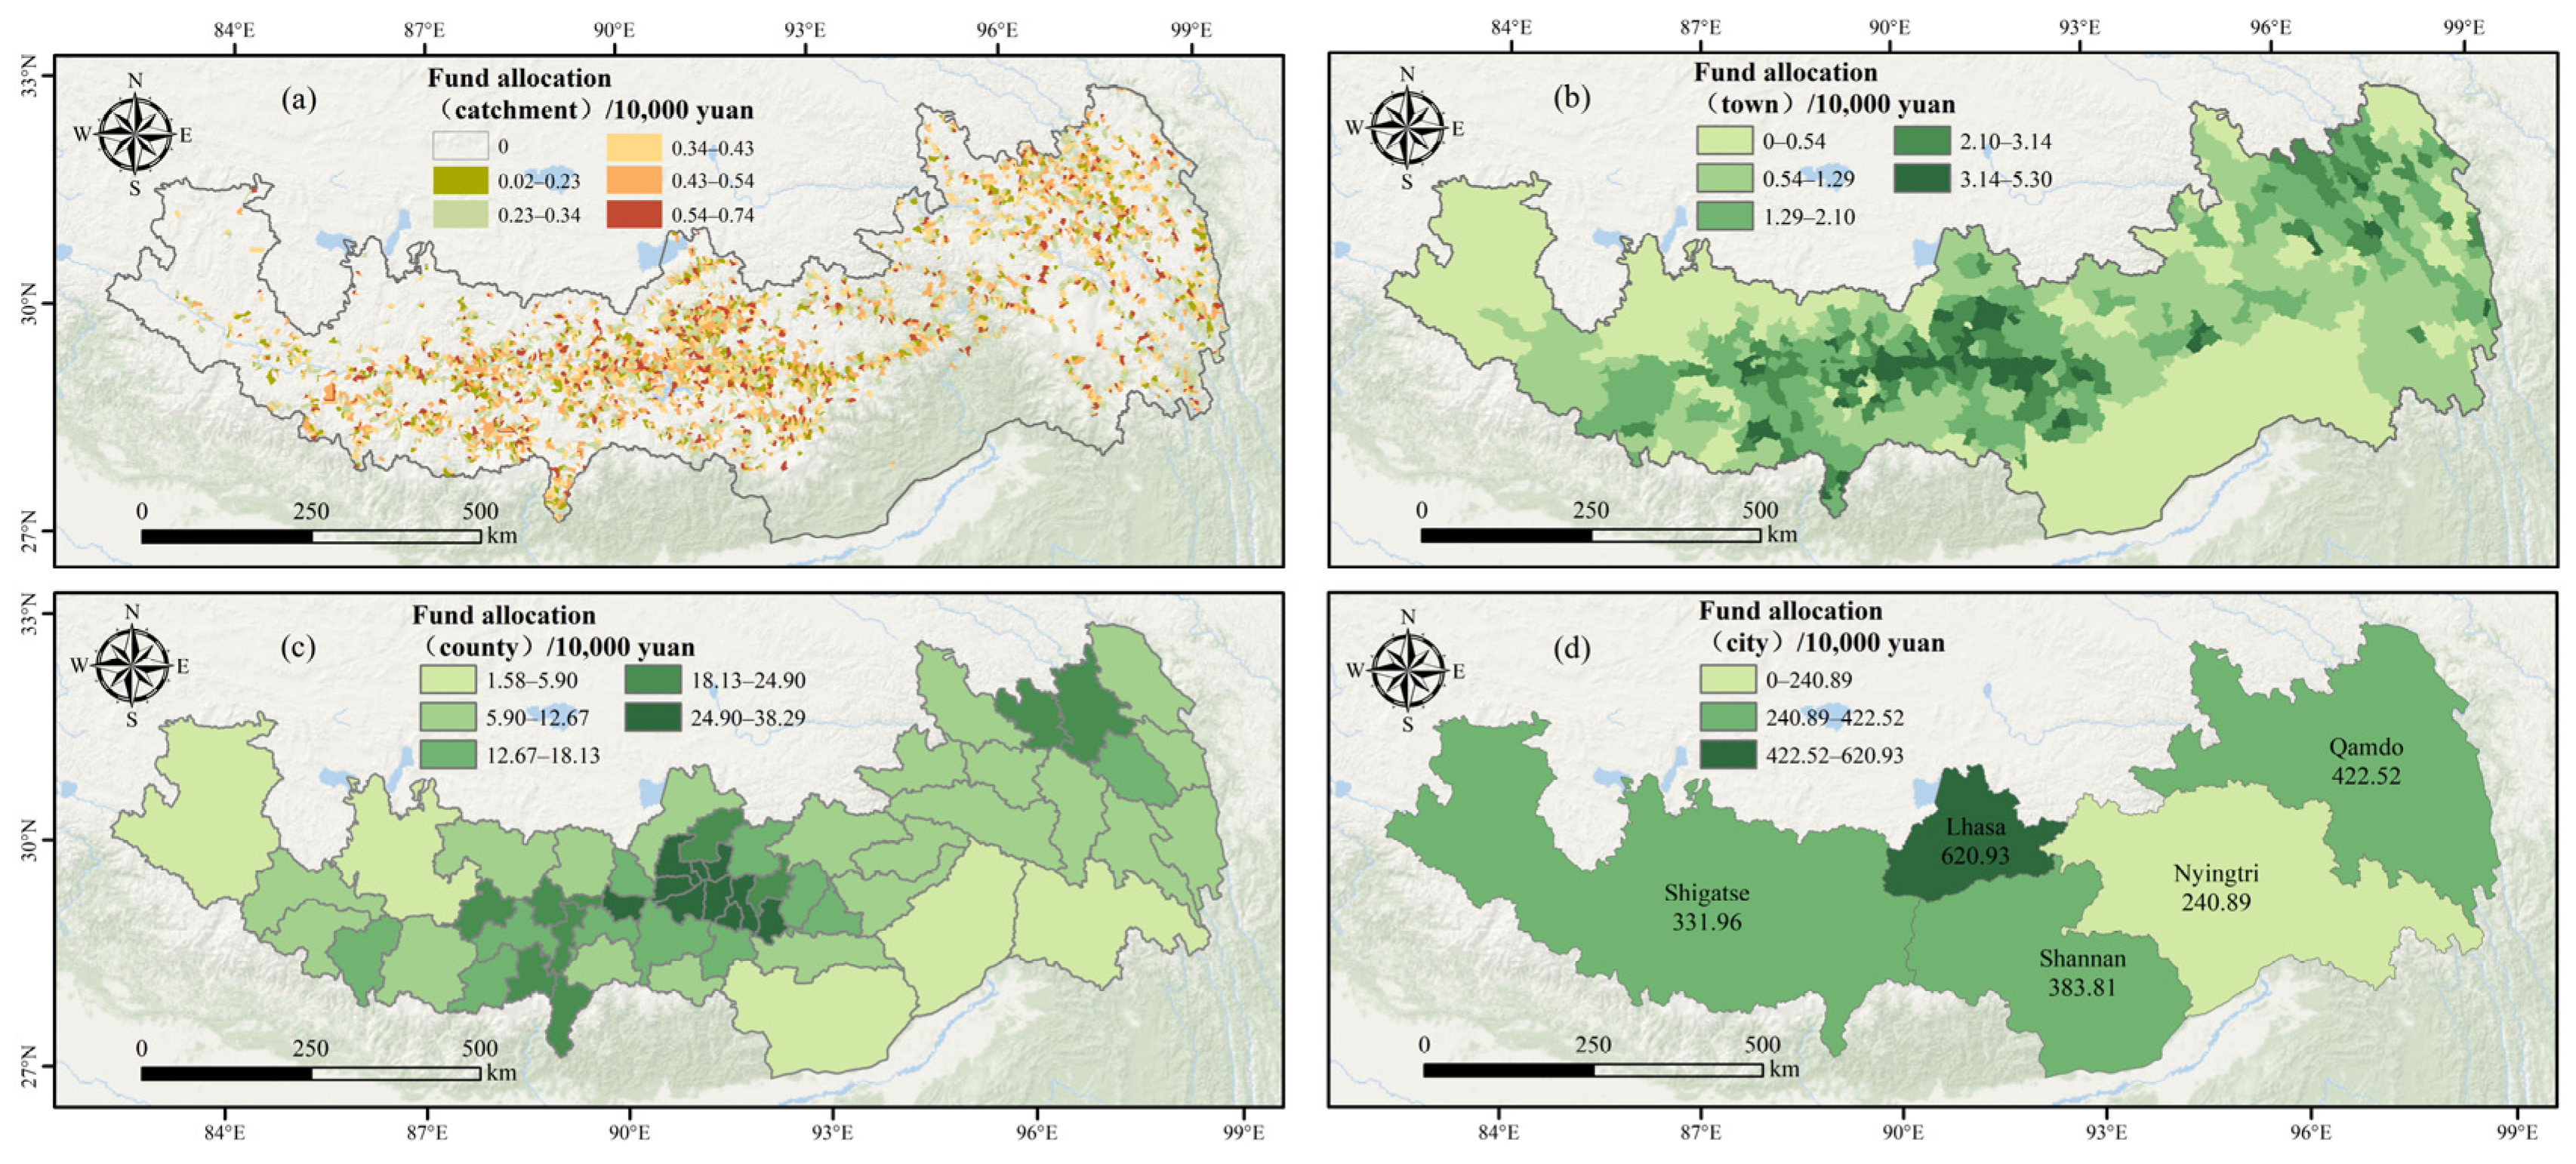
For Figure 6 (outcomes of the distribution of funding at various scales): The total investment of each small watershed was aggregated to township, county, and municipal administrative scales by spatial overlay statistics; the fund values of each scale were classified by natural breakpoints to generate graded spatial distribution maps at four statistical units.
(7)
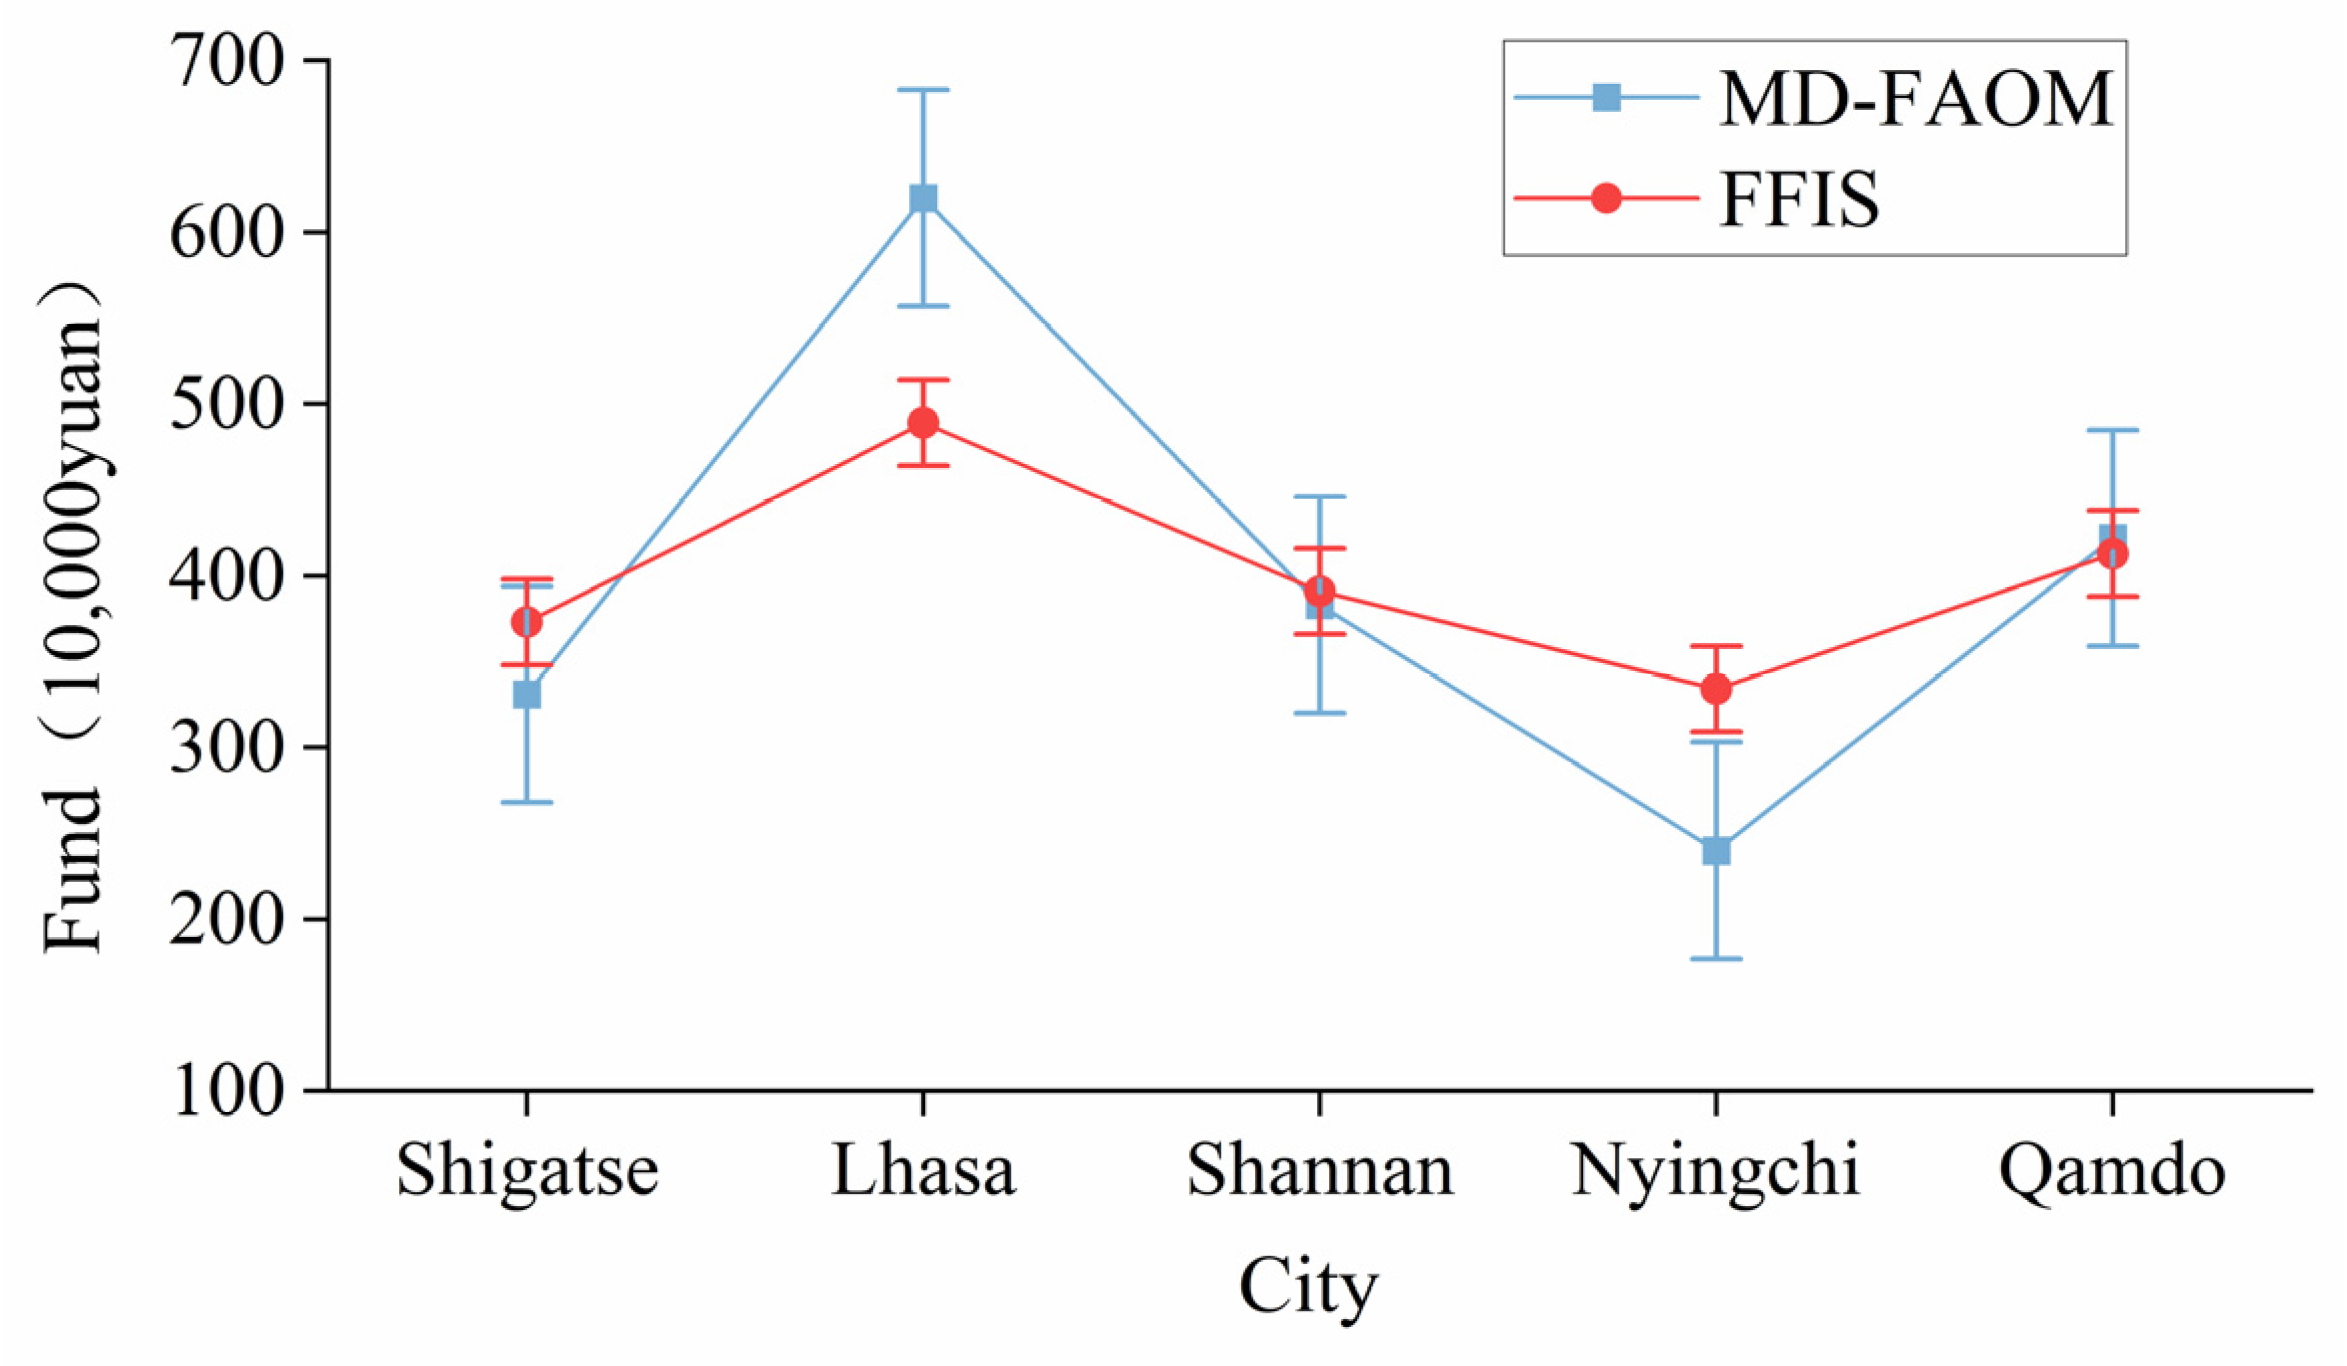
For Figure 7 (allocation of funds at the municipal level under the two schemes): The total investment of the five cities under the two allocation models was counted, and the standard errors of regional funds were calculated to draw grouped bar charts with error bars for comparative analysis.
(8)
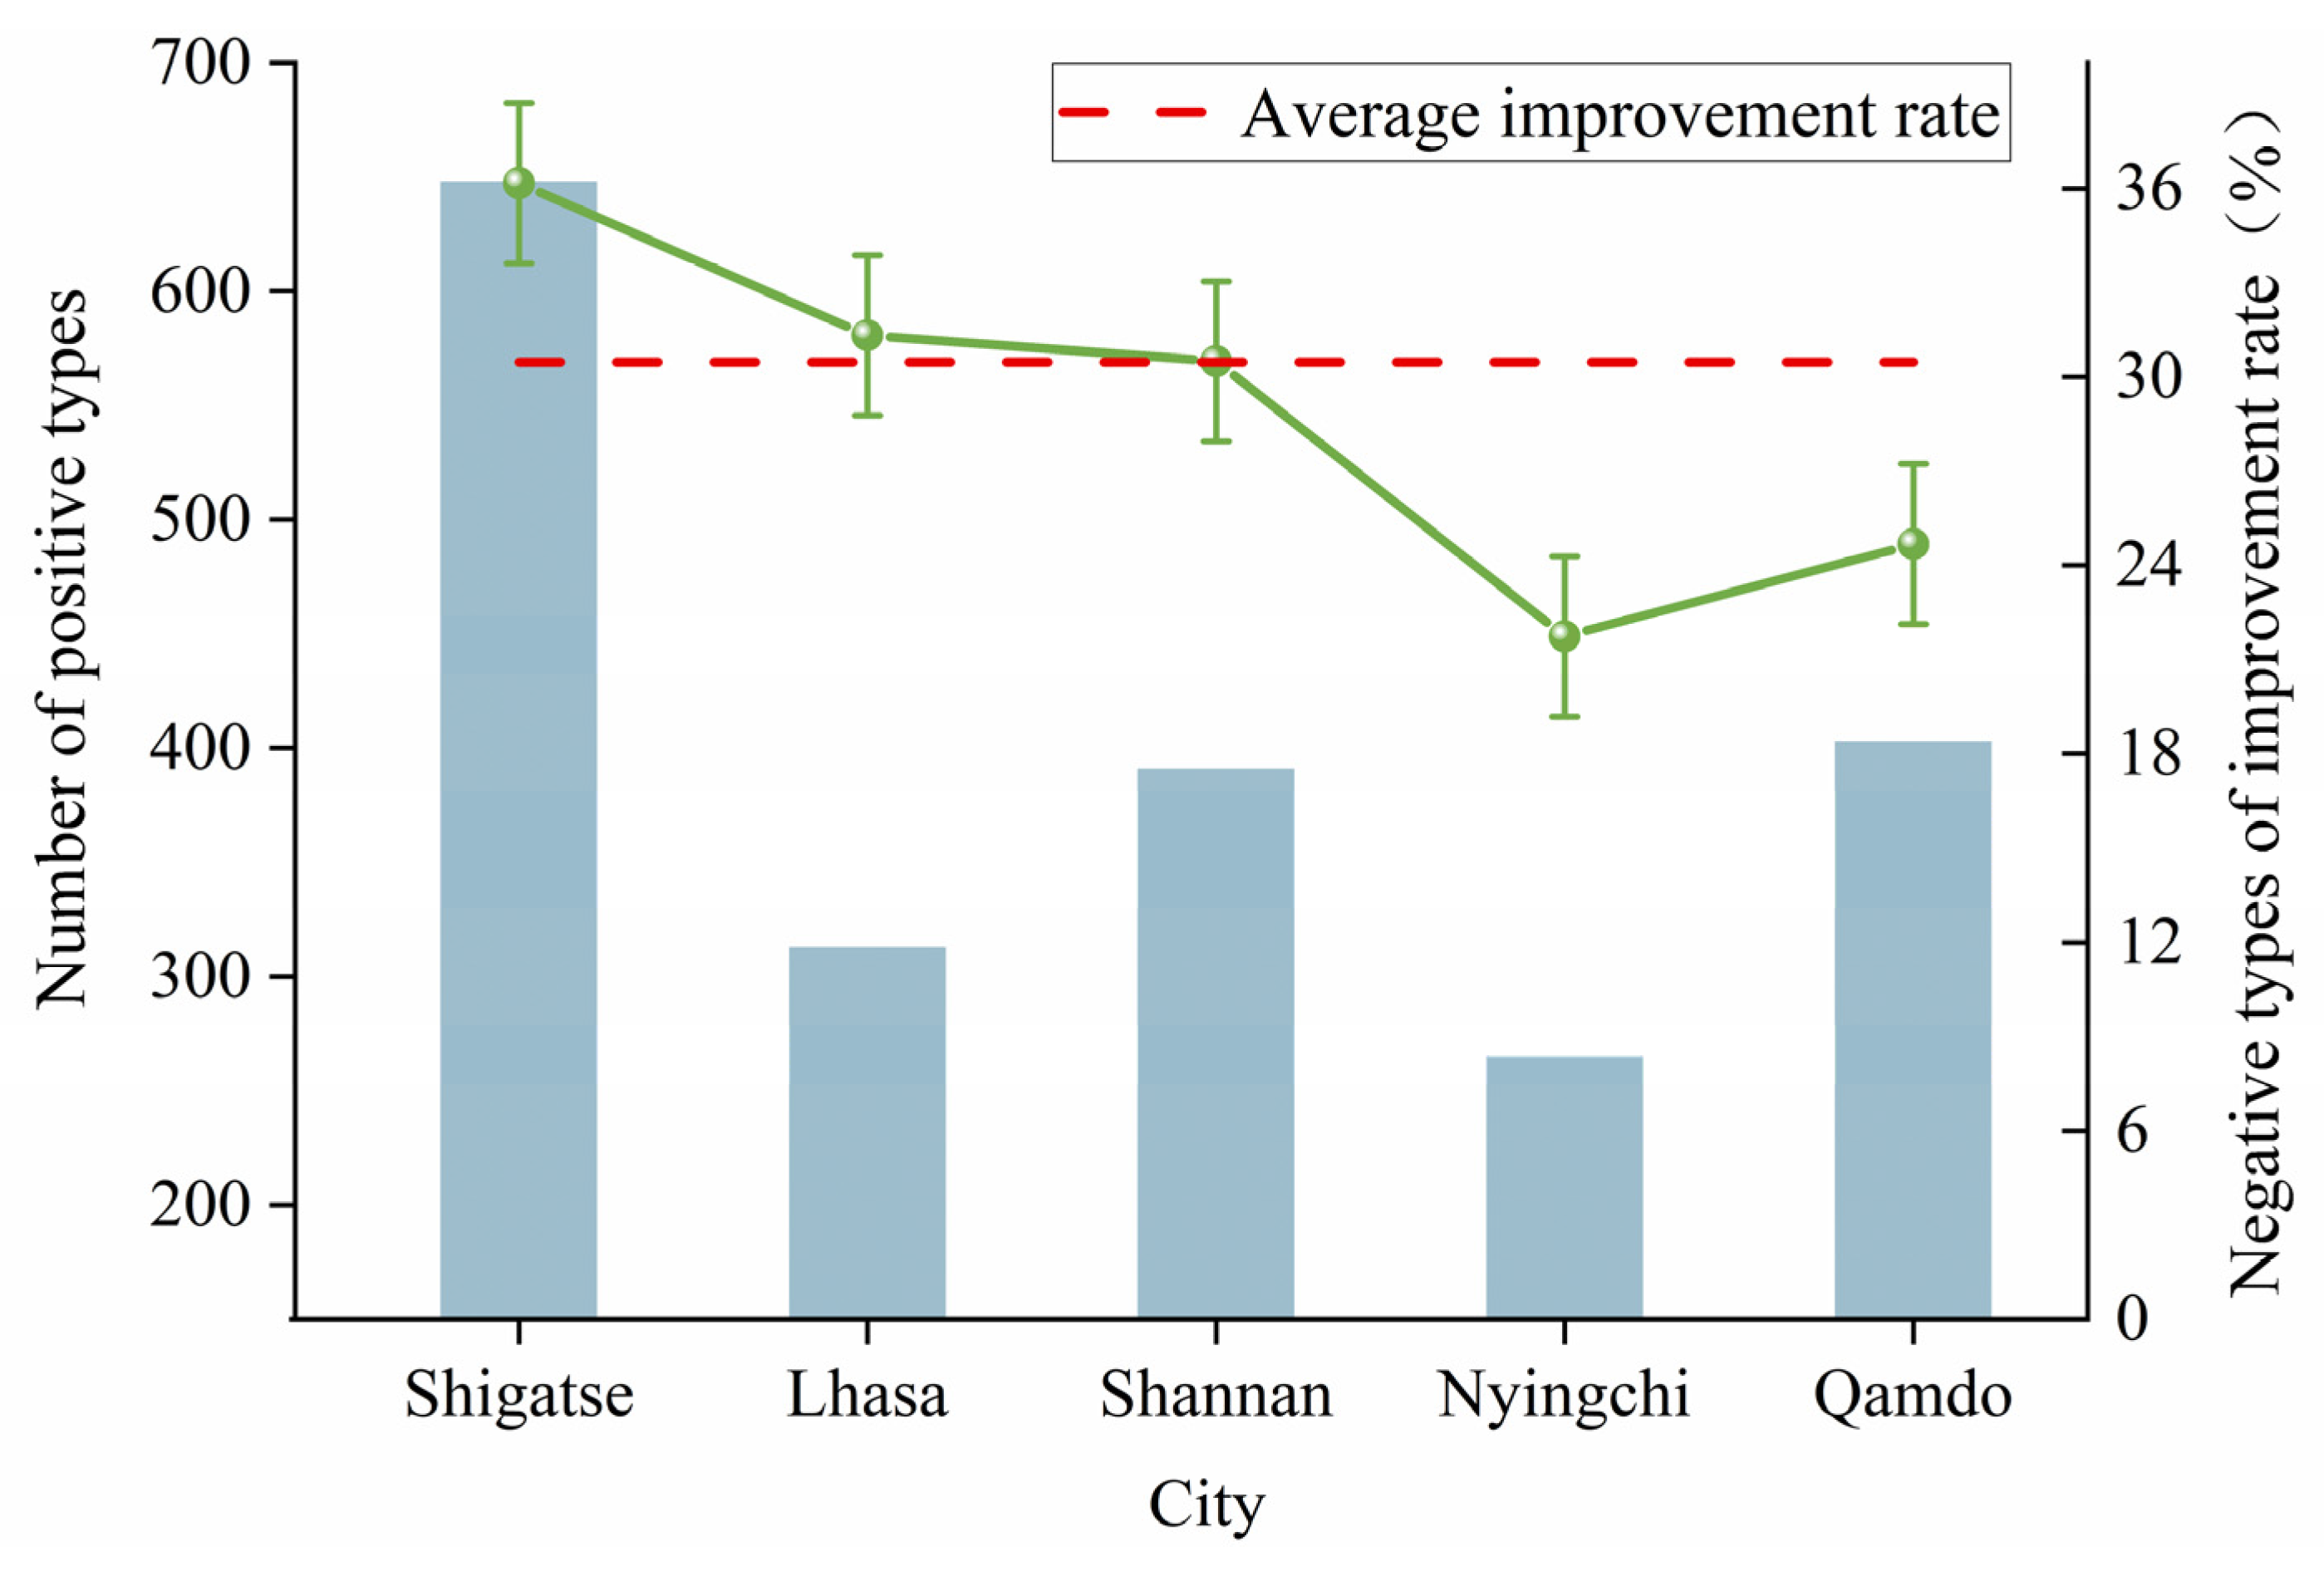
For Figure 8 (outcome of funding distribution in various cities): The number of watersheds converted to positive types in each city was statistically summarized, and the regional average optimization improvement rate (30.11%) was calculated by comparing the pre- and post-investment vulnerability results. Then, a dual-axis statistical chart combining bar graphs and trend lines was drawn.

3. Results

3.1. Current Multi-Dimensional Vulnerability

Based on the multi-dimensional assessment method, results for exposure, sensitivity, and adaptive capacity are presented in Figure 3. High and extremely high exposure is concentrated in the central region, distributed across residential areas, national highways, rivers, and agricultural land. Both sensitivity and adaptive capacity exhibit a “high in the center, low in the periphery” pattern; notably, regions with high gross domestic product (GDP) and population density show elevated sensitivity, indicating strong correlations with these factors.
Derived from the three vulnerability components, the multi-dimensional flash-flood vulnerability map, as shown in Figure 3d, the figure shows the following: scattered distribution of triple-negative areas, primarily driven by extreme environmental conditions or socioeconomic factors; double-negative areas predominantly in Lhasa and Shannan, with scattered occurrences in Shigatse and Qamdo; single-negative areas (19.25%), widely dispersed but relatively concentrated in the central and eastern regions, which may be linked to permafrost thaw and the eastern Hengduan Mountains transition zone. The remaining areas are positive, with low flash-flood susceptibility.
To verify the robustness of weight fluctuation, Monte Carlo simulation-based uncertainty analysis was implemented in this study [40]. Taking the original indicator weights derived from the Geographical Detector and entropy weight method as the baseline, an unbiased disturbance of 10% was imposed on each single indicator weight. The multi-dimensional vulnerability index was recalculated for 1000 repeated sampling runs, and the coefficient of variation (CV) was adopted to quantify the stability of assessment results. The averaged CV of all watershed units was 8%, which is lower than the 15% stability threshold. This demonstrates that even with reasonable random errors in original indicator weights, the spatial pattern and numerical ranking of multi-dimensional vulnerability remain consistent, proving strong robustness of the vulnerability evaluation framework.

3.2. Flash-Flood-Prevention Fund Allocation

3.2.1. Priority Support Areas and Benefit Coefficient

In line with the core principle that regions with higher flash-flood vulnerability deserve more financial support, we first demarcated priority investment watersheds based on the multi-dimensional vulnerability results in Section 3.1. Regions with higher vulnerability levels warrant higher priority support. Therefore, areas above the single negative level are classified as priority areas for support (Figure S23). These areas are located in regions with flat terrain, concentrated cultivated land, a good basis for agricultural and urban development, and a concentration of educational, population, and medical facilities. Subsequently, the benefit coefficient is quantified using the geographic detector.
Given the accessibility of data and the feasibility of implementation, three non-engineering measures were selected: simple rainfall stations, automatic monitoring stations, and wireless warning stations. The combination of these three measures can optimize the entire process of data collection and notification, significantly reducing flash-flood losses. Then, the benefit coefficients of each measure are quantitatively analyzed through the geographical detector, and their investment ratios are allocated according to the costs. The results are shown in Table S2. The benefits generated by these three measures, from highest to lowest, are automatic monitoring stations, simple rainfall stations, and wireless early warning stations. The investment ratios, from highest to lowest, are automatic monitoring stations, wireless warning stations, and simple rainfall stations. The benefit coefficients and investment ratios can be used as input conditions for MD-FAOM.

3.2.2. Specific Funding Allocation Plan

In constructing the MD-FAOM, the following are the precise parameter settings: the population is fixed at 500; arithmetic crossover operators are used for crossover operations with a crossover probability of 80%; non-uniform mutation operators are used for mutation operations with a mutation probability set to 10%; the dimension of an individual is the total number of small watersheds that need priority support; the total input fund is set to 20 million yuan. Different iteration numbers have different effects on the results, and a sensitivity analysis was conducted to determine the optimal iteration number. The model’s effectiveness and the confluence of the computational outputs are evaluated by tracking the convergence trajectory of the best objective value in the iterations, and the optimal iteration number is selected comprehensively. As shown in Figure 4, the objective function values show a modest upward trend up to 1500 iterations, followed by a fast increase in f3, a gradual reduction in f2, and a tendency toward stabilization after 1500 iterations. Therefore, considering the objective function values’ overall trend of change, the number of iterations is set to 1500 generations, which is used as the input condition for the model. Then, based on the MD-FAOM solution, the optimal solution can be identified through TOPSIS, obtaining the optimal funding allocation scheme for the small watershed, as shown in Table 3. Because Case 1 has the highest C value, it is selected as the ultimate funding allocation plan. The values of the three objective functions for this scheme are: the area of benefit is 85,915 km2, the number of positive types is 2020, and the Gini coefficient is 0.282. As shown in Figure 5, due to the investment of funds, many small watersheds have already transitioned into positive types. However, most small watersheds remain negative types, mainly because of frequent flash floods and a high economy, leading to high vulnerability, so these areas need more financial investment.
The results of fund allocation at the watershed scale are shown in Figure 6a. It can be seen that there is a disparity in fund allocation between different watersheds, with the maximum being 7400 yuan and the minimum only a few hundred yuan. The center regions, including Lhasa and the eastern portion of Shigatse, are mostly home to places with the largest allocation of funds. The reason for this result is taking into account the interrelationships between exposure, sensitivity, and adaptability, that is, the unevenness coefficient, which makes such allocation more reasonable.
Generally, public funds cascade vertically from central to provincial administrations, subsequently flowing downstream to municipalities, counties, and townships. Therefore, the distribution of funds at different scales has been statistically analyzed, including township, county, and municipal levels. Figure 6b delineates township-tier funds allocation, varying between 5400 yuan at the lowest and 53,000 yuan at the highest. Some townships receive no financing because they lack priority-supporting watersheds, while the central region receives the largest funding amounts. Figure 6c illustrates the allocation of financing at the country level, with a minimum of 15,800 yuan and a maximum of 382,900 yuan. The allocation of funding at the municipal level, as depicted in Figure 6d, varies significantly among different cities. The minimum is Nyingchi City, with an investment of 2.4 million yuan, and the maximum is Lhasa City, with an investment of 6.2 million yuan. This is because Lhasa City has a generally higher level of vulnerability, and therefore, more funds should be invested. The funds allocated to the Shigatse, Shannan, and Qamdo regions are roughly equal. The outcomes of the funding distribution at these various scales can provide local decision-makers with the references they need to make decisions that are genuinely scientific.
Figure 7 presents municipal fund allocation results under the two schemes. Both models assigned the largest fund volume to Lhasa and the smallest to Nyingchi, with distinct numerical differences between schemes. MD-FAOM distributed more funds to Lhasa and fewer funds to Nyingchi relative to the Flash Flood Intensity Scheme (FFIS) [17]. The error bars in the figure display intra-city fund distribution fluctuations for each city. MD-FAOM captured greater funding disparities among internal watershed units.
Figure 8 shows the number of watersheds converted to positive vulnerability types and improvement rates via a dual-axis chart. Shigatse has the highest improvement rate, while Nyingchi ranks lowest on both metrics. Qamdo and Shannan display intermediate outcomes, jointly demonstrating that MD-FAOM prioritizes areas with higher disaster-mitigation returns.

4. Discussions

4.1. Comparison with Previous Studies

The problem of flood control fund allocation has long plagued disaster risk management, and existing methods have obvious limitations that make it difficult to achieve optimal resource allocation [41]. Conventional models often rely on a single risk assessment [42], leading to a mismatch between financial inputs and actual needs, such as over-concentration of resources on uninhabited high-risk areas while underfunding populated areas with high economic value. In addition, conventional mechanisms often neglect to balance social equity with disaster-prevention efficiency, as well as to accommodate spatial heterogeneity at different scales, which can lead to the neglect of key risk points due to inappropriate unit delineation [43]. The FFIS has begun to allocate funds by hazard intensity, which has improved but is still limited by relying solely on historical data. While incorporating socioeconomic factors, it failed to consider the interactions between vulnerability elements [44]. In contrast, the proposed MD-FAOM fills these gaps through three innovative improvements. First, MD-FAOM quantifies the dynamic associations among natural, socioeconomic, and adaptive factors to provide a comprehensive assessment of hazards. Second, by combining the NSGA-II algorithm with TOPSIS, this framework strikes a balance between fairness and efficiency, overcoming the methodological shortcomings of pursuing efficiency or fairness alone. Finally, by analyzing at different scales such as sub-watersheds, towns, counties, and cities, MD-FAOM avoids the averaging effect in large-scale assessments [45], captures the fluctuating characteristics of local vulnerability, and ensures that key risk points are not missed. This multi-scale coupled framework also better coordinates multiple sustainability objectives than single-risk allocation models. By establishing a data-driven, cross-scale, multi-dimensional decision-making framework, the framework breaks through the limitations of previous studies and lays a more scientific foundation for capital allocation.

4.2. Implications of MD-FAOM

This study applied the MD-FAOM framework to southern Tibet, demonstrating its efficacy in optimizing fund allocation across spatial scales. This concentration reflects the framework’s strategic prioritization, targeting regions where investment yields the most significant reduction in potential flood losses per unit of currency. In terms of effectiveness improvement, 2020 sub-watersheds were transformed into positive types after funding (Figure 5). This indicates that the framework can pinpoint key regional resources. In addition, the allocation of disaster-prevention resources is significantly affected by regional heterogeneity [46]. The results of this study remain robust at different scales, confirming that the MD-FAOM avoids over-averaging and eliminates geographical bias, ensuring a balance between global strategies and local needs.
The framework of this study identifies regions with the highest marginal benefits of funding by integrating exposure, sensitivity, and adaptive capacity. The results show the high vulnerability of the Lhasa region, whose special status as a political, economic, and cultural center [47], as well as the rapid flow of surface runoff during heavy rainfall, is a reasonable basis for its high level of financial support. The NSGA-II algorithm seeks an optimal balance between loss minimization and equitable distribution, avoiding over-concentration of funds in low-value, high-risk areas while ensuring that densely populated, low-risk areas receive adequate inputs. Such optimization is critical. Vulnerability-specific strategies alone may neglect critical infrastructure in moderate-risk areas, while simple and crude population-based allocations may lead to underfunding of important ecological buffers. The NSGA-II is computationally validated to maximize system resilience and strike a fine balance in resource allocation.
For southern Tibet, the MD-FAOM framework significantly improves flood resilience and advances regional socioecological sustainability by prioritizing the protection of areas critical to socioeconomic stability and ecologically sensitive areas. The framework supports sustainable development in Tibet by ensuring equitable distribution of resources while reducing disaster losses. The framework contains multi-dimensional vulnerability assessment, multi-objective optimization, and multi-scale validation [48], which can be applied to other regions according to local conditions by adjusting suitable indicators. For instance, coastal regions would likely emphasize sea-level rise exposure metrics, while arid areas might well prioritize sensitivity to flash floods. Consequently, the selection of vulnerability indicators, the weighting schemes applied to optimization objectives, and the benchmarks used for validation must be meticulously calibrated to local conditions. It is particularly suitable for watersheds with complex topography, significant socioeconomic gradients, and varying disaster risks. By adapting region-specific parameters, MD-FAOM can guide the allocation of funds on a global scale.

4.3. Uncertainties and Future Research

Although the MD-FAOM framework proposed in this study demonstrates multi-dimensional optimization capabilities in allocating disaster-prevention funds, it still has limitations. Limited by data-acquisition conditions, the current vulnerability assessment system has not fully integrated key indicators, such as local community opinions, building structural strength, and fire centers, which may affect the scientific nature of fund allocation. Furthermore, the framework does not consider the disaster risk transmission mechanism between adjacent areas, which may lead to impacts on adjacent areas after investing funds in one area. Although MD-FAOM can optimize fund allocation, it does not specify the spatial layout of specific disaster-prevention measures, such as the location of dam construction and the deployment of early warning facilities, which may weaken the actual effect. In addition, the study allocates funds based on a multi-dimensional assessment of historical flash floods and current vulnerabilities, without coupling future climate change, such as extreme rainfall events, urban expansion, and human activities, making it challenging to adjust to the changing requirements of building long-term resilience. Future research can integrate high-resolution, real-time monitoring data to construct a dynamically updated vulnerability indicator system. By combining urban planning predictions, the framework can be improved, and a dynamic multi-stage fund allocation algorithm can be developed to make fund allocation more comprehensive and scientific.

5. Conclusions

This study aims to construct an equity-efficiency-balanced fund-allocation model for flash-flood prevention to solve the unreasonable resource distribution issue across ecologically fragile southern Tibet. First, a 22-indicator multi-dimensional vulnerability assessment system covering exposure, sensitivity, and adaptive capacity is established, and the results reveal that 25.22% of the study area presents negative vulnerability, mainly clustered in Lhasa and Shannan. Second, the MD-FAOM model integrating NSGA-II and TOPSIS is proposed to optimize three core objectives. Compared with the traditional FFIS, the model expands the effective disaster-mitigation area to 85,915 km2, with a 30.11% overall optimization improvement rate, and delivers hierarchical fund allocation results at watershed, township, county, and municipal scales. This multi-objective allocation framework advances coordinated flood risk mitigation and plateau ecological conservation, contributes to advancing Sustainable Development Goals 13 and 15, and offers flexible, transferable scientific decision support for sustainable disaster management in other mountainous flash-flood-prone regions.

Supplementary Materials

The following supporting information can be downloaded at https://www.mdpi.com/article/10.3390/su18146979/s1, Figure S1. Spatial distribution of DEM; Figure S2. Spatial distribution of Land use; Figure S3. Spatial distribution of Maximum three-day rainfall; Figure S4. Spatial distribution of Annual rainfall; Figure S5. Spatial distribution of River density; Figure S6. Spatial distribution of Slope; Figure S7. Spatial distribution of Soil type; Figure S8. Spatial distribution of Vegetation type; Figure S9. Spatial distribution of Enterprise density; Figure S10. Spatial distribution of GDP; Figure S11. Spatial distribution of Population density; Figure S12. Spatial distribution of Road density; Figure S13. Spatial distribution of Degree of village agglomeration; Figure S14. Spatial distribution of Bridge aggregation degree; Figure S15. Spatial distribution of Dam aggregation degree; Figure S16. Spatial distribution of Distance to hospital; Figure S17. Spatial distribution of Culvert aggregation degree; Figure S18. Spatial distribution of Reservoir aggregation degree; Figure S19. Spatial distribution of Sluice aggregation degree; Figure S20. Spatial distribution of Simple rainfall station aggregation degree; Figure S21. Spatial distribution of Automatic monitoring station aggregation degree; Figure S22. Spatial distribution of Wireless warning station aggregation degree; Figure S23. Spatial distribution of priority support areas; Table S1. Multi-dimensional vulnerability; Table S2. Benefit coefficient.

Author Contributions

Conceptualization, K.X. and J.W.; methodology, J.W.; software, J.W. and Y.Y.; validation, H.T. and Y.Y.; formal analysis, J.X. and C.Y.; investigation, M.L. and H.T.; resources, J.X. and C.Y.; data curation, J.W.; writing—original draft preparation, J.W.; writing—review and editing, J.X. and C.Y.; visualization, K.X. and M.L.; supervision, Y.Y.; project administration, J.X. and C.Y.; funding acquisition, J.X. All authors have read and agreed to the published version of the manuscript.

Funding

This research was funded by National Key Research and Development Program of China (Grant No. 2023YFC3006701), Sichuan Science and Technology Program (Grant No. 2024YFHZ0134) and Science and Technology Projects of Xizang Autonomous Region, China (Grant No. XZ202403ZY0008).

Institutional Review Board Statement

Not applicable.

Informed Consent Statement

Not applicable.

Data Availability Statement

The raw data supporting the conclusions of this article will be made available by the authors on request.

Acknowledgments

The authors are grateful to those who reviewed the article. The anonymous reviewers are acknowledged for their valuable comments.

Conflicts of Interest

Author Yong Yang is employed by Tibet Hongwei Survey and Design Engineering Co., Ltd., Lhasa, China. The remaining authors declare that the research was conducted in the absence of any commercial or financial relationship that could be constructed as a potential conflict of interests.

References

  1. Liu, J.; Zhao, X.; Chen, Y.; Sun, H.; Gu, Y.; Xu, S. A novel flood conditioning factor based on topography for flood susceptibility modeling. Geosci. Front. 2025, 16, 101960. [Google Scholar] [CrossRef]
  2. Na, S.; Cailin, L.; Baoyun, G.; Xiaokai, S.; Yukai, Y.; Yue, W. Urban flooding risk assessment based on FAHP–EWM combination weighting: A case study of Beijing. Geomat. Nat. Hazards Risk 2023, 14, 2240943. [Google Scholar] [CrossRef]
  3. Elliot, T.; Matallana, J.A.T.; Teebken, J. Urbanization under extreme climate events leads to synchronized decreases in flood protection and increases in vulnerability. Cities 2025, 160, 105827. [Google Scholar] [CrossRef]
  4. Christo, C.; Sizwile, K.; Nemakonde, L.D.; Shoroma, L.B.; Wentink, G.W.; Maynard, N.; Steven, C.; Tchaka, K.; Kgosietsile, M.; Rankopo, M.J.; et al. Financing Disaster Risk Reduction: Exploring the Opportunities, Challenges, and Threats Within the Southern African Development Community Region. Int. J. Disaster Risk Reduct. 2023, 14, 398–412. [Google Scholar] [CrossRef]
  5. Shah, A.A.; Ullah, W.; Khan, N.A.; Kaifi, K.; Pervez, A.K.M.K.; Alotaibi, B.A.; Mudavanhu, C. The dynamics and underlying factors shaping rural-urban connections for rural flood hazard susceptibility in Pakistan: The case of Khyber Pakhtunkhwa. J. Environ. Manag. 2025, 389, 125831. [Google Scholar] [CrossRef]
  6. Attoh, E.M.N.A.N.; Amarnath, G. A framework for addressing the interconnectedness of early warning to action and finance to strengthen multiscale institutional responses to climate shocks and disasters. Clim. Risk Manag. 2025, 47, 100689. [Google Scholar] [CrossRef]
  7. Bischiniotis, K.; Moel, H.D.; Homberg, M.V.D.; Couasnon, A.; Aerts, J.; Nobre, G.G.; Zsoter, E.; Hurk, B.V.D. A framework for comparing permanent and forecast-based flood risk-reduction strategies. Sci. Total Environ. 2020, 720, 137572. [Google Scholar] [CrossRef] [PubMed]
  8. Kumari, K.; Koley, T.; Dutta, T. Assessment of flood damage severity, economic growth dynamics and relief fund allocation in the districts of Bihar: A non-parametric approach. Int. J. Disaster Risk Reduct. 2025, 116, 105047. [Google Scholar] [CrossRef]
  9. Bhakuni, M.S.; Das, A. A cost-efficient relocation model minimizing economic and social disruption of the disaster-affected population of the Kedarnath considering uncertainty. Comput. Ind. Eng. 2024, 190, 110005. [Google Scholar]
  10. Ren, H.; Pang, B.; Zhao, G.; Yu, H.; Tian, P.; Xie, C. Incorporating dynamic drainage supervision into deep learning for accurate real-time flood simulation in urban areas. Water Res. 2025, 270, 122816. [Google Scholar] [PubMed]
  11. Karim, A.; Noy, I. Risk, poverty or politics? The determinants of subnational public spending allocation for adaptive disaster risk reduction in Bangladesh. World Dev. 2020, 129, 104901. [Google Scholar] [CrossRef]
  12. Goodden, A.E.; Porter, J.J.; Vantaggiato, F.P. Does flood risk funding protect the most vulnerable? A case study of England. Environ. Sci. Policy 2024, 157, 103781. [Google Scholar] [CrossRef]
  13. Jibhakate, S.M.; Timbadiya, P.V.; Patel, P.L. Multiparameter flood hazard, socioeconomic vulnerability and flood risk assessment for densely populated coastal city. J. Environ. Manag. 2023, 344, 118405. [Google Scholar] [CrossRef]
  14. Zhu, A.; Xu, Y.; Zhong, J.; Hao, J.; Ma, Y.; Xu, G.; Chen, Z.; Wang, Z. From Flood Vulnerability Mapping Using Coupled Hydrodynamic Models to Optimizing Disaster Prevention Funding Allocation: A Case Study of Wenzhou. Water 2025, 17, 3369. [Google Scholar] [CrossRef]
  15. Chao, M.; Rui, X.; Wei, H.; Xia, J. Determining the limiting water level of early flood season by combining multiobjective optimization scheduling and copula joint distribution function: A case study of three gorges reservoir. Sci. Total Environ. 2020, 737, 139789. [Google Scholar] [CrossRef]
  16. Patriarca, R.; Lovaglio, L.; Simone, F. Functional resonance analysis via a genetic algorithm to ensure cost-effective maintenance planning. Int. J. Disaster Risk Reduct. 2025, 281, 109516. [Google Scholar] [CrossRef]
  17. Yang, W.; Xu, K.; Ma, C.; Lian, J.; Jiang, X.; Zhou, Y.; Bin, L. A novel multi-objective optimization framework to allocate support funds for flash flood reduction based on multiple vulnerability assessment. J. Hydrol. 2021, 603, 127144. [Google Scholar] [CrossRef]
  18. Homeyra, K.; Parvaneh, S. Coordination of humanitarian logistic based on the quantity flexibility contract and buying in the spot market under demand uncertainty using NSGA-II and NRGA algorithms. Expert Syst. Appl. 2023, 214, 119187. [Google Scholar]
  19. Qiu, X.; Yang, X.; Fang, Y.; Xu, Y.; Zhu, F. Impacts of snow disaster on rural livelihoods in southern Tibet-Qinghai Plateau. Int. J. Disaster Risk Reduct. 2018, 31, 143–152. [Google Scholar] [CrossRef]
  20. Chen, C.; Zheng, Y.; Zheng, Z.; Zong, Y.; Huang, K.; Rolett, B.V.; Peng, H.; Zhang, X.; Tang, Y.; Wan, Q.; et al. Holocene millennial-scale megaflood events point to ENSO-driven extreme climate changes. Sci. China-Earth Sci. 2023, 66, 2530–2545. [Google Scholar] [CrossRef]
  21. Han, P.; Yu, G.-A. Morphometry of alluvial fans in an alpine valley basin in southeast Tibet: Spatial heterogeneity, controls, and implications. Catena 2025, 250, 108799. [Google Scholar] [CrossRef]
  22. Jaafari, A.; Gholami, D.M.; Choubin, B. Spatiotemporal dynamics of social vulnerability to natural hazards: Trends and projections from 2002 to 2030 in northwestern Iran. Sustain. Cities Soc. 2025, 120, 106172. [Google Scholar] [CrossRef]
  23. Aroca-Jiménez, E.; Bodoque, J.M.; García, J.A. How to construct and validate an Integrated Socio-Economic Vulnerability Index: Implementation at regional scale in urban areas prone to flash flooding. Sci. Total Environ. 2020, 746, 140905. [Google Scholar] [CrossRef] [PubMed]
  24. Anand, T.D.; Prakash, M.M. A synergistic approach towards understanding flood risks over coastal multi-hazard environments: Appraisal of bivariate flood risk mapping through flood hazard, and socio-economic-cum-physical vulnerability dimensions. Sci. Total Environ. 2023, 901, 166423. [Google Scholar] [CrossRef]
  25. Rogers, J.S.; Maneta, M.M.; Sain, S.R.; Madaus, L.E.; Hacker, J.P. The role of climate and population change in global flood exposure and vulnerability. Nat. Commun. 2025, 16, 1287. [Google Scholar] [CrossRef] [PubMed]
  26. Tang, X.; Huang, X.; Tian, J.; Pan, S.; Ding, X.; Zhou, Q.; Sun, C. A novel framework for the spatiotemporal assessment of urban flood vulnerability. Sustain. Cities Soc. 2024, 109, 105523. [Google Scholar] [CrossRef]
  27. Mruksirisuk, P.; Thanvisitthpon, N.; Pholkern, K.; Garshasbi, D.; Saguansap, P. Flood vulnerability assessment of Thailand’s flood-prone Pathum Thani province and vulnerability mitigation strategies. J. Environ. Manag. 2023, 347, 119276. [Google Scholar]
  28. Luo, Z.; Tian, J.; Zeng, J.; Pilla, F. Resilient landscape pattern for reducing coastal flood susceptibility. Sci. Total Environ. 2023, 856, 159087. [Google Scholar] [PubMed]
  29. Zhang, B.; Fang, H.; Zhang, G.; Li, S.; Wu, S.; Siddique, K.H.M. Integrating multi-model frameworks to unravel the spatiotemporal dynamics of flash floods in the Tianshan Mountain, China. Ecol. Indic. 2025, 172, 113259. [Google Scholar] [CrossRef]
  30. Pham, N.T.T.; Nong, D.; Sathyan, A.R.; Garschagen, M. Vulnerability assessment of households to flash floods and landslides in the poor upland regions of Vietnam. Clim. Risk Manag. 2020, 28, 100215. [Google Scholar] [CrossRef]
  31. Meng, C.; Liu, K.; Li, Y.; Wang, Y.; Hu, Z.; Dong, Z.; Wu, H.; Wang, Y. Identification of compound flood-heatwave extremes in the Yangtze River Basin and their socio-economic exposure. J. Hydrol. 2025, 649, 132387. [Google Scholar] [CrossRef]
  32. Liu, Y.; Zhang, X.; Liu, J.; Wang, Y.; Jia, H.; Tao, S. A flood resilience assessment method of green-grey-blue coupled urban drainage system considering backwater effects. Ecol. Indic. 2025, 170, 113032. [Google Scholar]
  33. Deng, J.; Zhang, R.; Chen, S.; Li, Z.; Gao, L.; Li, Y.; Wei, C. Spatiotemporal evolution and influencing factors of flood resilience in Beibu Gulf Urban Agglomeration. Int. J. Disaster Risk Reduct. 2024, 114, 104905. [Google Scholar] [CrossRef]
  34. Armon, M.; Shmilovitz, Y.; Dente, E. Anatomy of a foreseeable disaster: Lessons from the 2023 dam-breaching flood in Derna, Libya. Sci. Adv. 2025, 11, eadu2865. [Google Scholar] [CrossRef] [PubMed]
  35. Kim, M.; Song, K.; Chon, J. Key coastal landscape patterns for reducing flood vulnerability. Sci. Total Environ. 2020, 759, 143454. [Google Scholar] [PubMed]
  36. Pollack, A.B.; Helgeson, C.; Kousky, C.; Klaus, K. Developing more useful equity measurements for flood-risk management. Nat. Sustain. 2024, 7, 823. [Google Scholar] [CrossRef]
  37. Roushan, A.; Das, A.; Dutta, A.; Senapati, T.; Bera, U.K. Multi-objective supply chain model with multiple levels of transit and vulnerable zone detection implementing hexagonal defuzzification: A case study of 2022 Assam flood. Eng. Appl. Artif. Intell. 2024, 133, 108183. [Google Scholar] [CrossRef]
  38. Sinha, L.; Narulkar, S.M. Optimal Operation of Multi-reservoir System Utilizing DEA, AIDE Algorithm and Flood Control Assessment by MCDM Approach. Water Resour. Manag. 2024, 39, 1783–1802. [Google Scholar] [CrossRef]
  39. Seyedashraf, O.; Bottacin-Busolin, A.; Harou, J.J. A design framework for considering spatial equity in sustainable urban drainage infrastructure. Sustain. Cities Soc. 2022, 85, 103960. [Google Scholar] [CrossRef]
  40. Sun, J.; Lu, J.; Liu, Y.; Liu, T.; Mi, J.; Li, Z.; Wang, X. Characterization of fluorine pollution and evaluation of multi-media environmental health risk in Daihai watershed: Based on coupled uncertainty-sensitivity modeling. Ecotoxicol. Environ. Saf. 2025, 307, 119437. [Google Scholar] [CrossRef] [PubMed]
  41. Qian, J.; Du, Y.; Liang, F.; Yi, J.; Zhang, X.; Jiang, J.; Wang, N.; Tu, W.; Huang, S.; Pei, T.; et al. Measuring community resilience inequality to inland flooding using location aware big data. Cities 2024, 149, 104915. [Google Scholar] [CrossRef]
  42. Ogie, R.I.; Holderness, T.; Dunn, S.; Turpin, E. Assessing the vulnerability of hydrological infrastructure to flood damage in coastal cities of developing nations. Comput. Environ. Urban Syst. 2018, 68, 97–109. [Google Scholar] [CrossRef]
  43. Gandini, A.; Quesada, L.; Prieto, I.; Garmendia, L. Climate change risk assessment: A holistic multi-stakeholder methodology for the sustainable development of cities. Sustain. Cities Soc. 2020, 65, 102641. [Google Scholar]
  44. Zhong, J.; Yang, Y.; Wang, Z.; Xiong, J.; Xu, Y.; Hao, J.; Ma, Y.; Shen, G.; Yong, Z. Pre-disaster flood prevention funds allocation and benefit analysis considering social vulnerability to enhance urban sustainable flood resilience. Int. J. Disaster Risk Reduct. 2025, 119, 105324. [Google Scholar] [CrossRef]
  45. Tao, H.; Abba, S.I.; Al-Areeq, A.M.; Tangang, F.; Samantaray, S.; Sahoo, A.; Siqueira, H.V.; Maroufpoor, S.; Demir, V.; Bokde, N.D.; et al. Hybridized artificial intelligence models with nature-inspired algorithms for river flow modeling: A comprehensive review, assessment, and possible future research directions. Eng. Appl. Artif. Intell. 2024, 129, 107559. [Google Scholar] [CrossRef]
  46. Zhu, J.; Zhou, W.; Yu, W.; Wang, W. Block-level spatial integration of population density, social vulnerability, and heavy precipitation reveals intensified urban flooding risk. Sustain. Cities Soc. 2024, 117, 105984. [Google Scholar] [CrossRef]
  47. Huang, H.; Chen, W.; Zhang, Y.; Qiao, L.; Du, Y. Analysis of ecological quality in Lhasa Metropolitan Area during 1990–2017 based on remote sensing and Google Earth Engine platform. J. Geogr. Sci. 2021, 31, 265–280. [Google Scholar] [CrossRef]
  48. Akter, T.; Simonovic, S.P. Aggregation of fuzzy views of a large number of stakeholders for multi-objective flood management decision-making. J. Environ. Manag. 2005, 77, 133–143. [Google Scholar] [CrossRef]
Figure 1. Location map of the study area.
Sustainability 18 06979 g001
Figure 2. Framework for research.
Sustainability 18 06979 g002
Figure 3. Exposure, sensitivity, adaptive ability, and multi-dimensional vulnerability maps. (a) Exposure; (b) Sensitivity; (c) Adaptive capacity; (d) Multi-dimensional vunerability.
Sustainability 18 06979 g003
Figure 4. Change in the value of the objective function as a function of iterations.
Sustainability 18 06979 g004
Figure 5. Spatial distribution results of objective function 2.
Sustainability 18 06979 g005
Figure 6. Outcomes of the distribution of funding at various scales. (a) Catchment; (b) Town; (c) County; (d) City.
Sustainability 18 06979 g006
Figure 7. Allocation of funds at the municipal level under the two schemes.
Sustainability 18 06979 g007
Figure 8. Outcome of funding distribution in various cities.
Sustainability 18 06979 g008
Table 1. Historical flash-flood disaster conditions in the southern part of Tibet.
Occurrence TimeSceneThe Extent of the Disaster
July 2015Cuona County, Shannan CityThe flood destroyed three highway bridges and damaged 150 m of road surface
July 2014Dazi County, Lhasa CityA total of 710 people were affected by the disaster, and water flooded 14 residential houses
August 2013Sangzhuzi District, Shigatse CityTwenty acres of farmland were washed away, and a household’s house collapsed
August 2010Angren County, Shigatse CityThe floodwaters submerged three houses, damaged one kilometer of roads, and damaged two bridges and culverts
Table 2. Indicator information.
CategoryIndicatorsData SourcesTimeResolution
ExposureElevationEuropean Space Agency (https://dataspace.copernicus.eu/) (accessed on 25 June 2026)201530 m × 30 m
Land useAnnual China Land Cover Dataset202030 m × 30 m
Maximum three-day rainfallNational Aeronautics and Space Administration (https://disc.gsfc.nasa.gov/) (accessed on 25 June 2026)20200.1° × 0.1°
Annual rainfallEarth Resources Data Cloud (http://www.gis5g.com/home) (accessed on 25 June 2026)20201 km × 1 km
River densityOpenStreetMap (https://www.openstreetmap.org/) (accessed on 25 June 2026)2020
SlopeDEM data extraction201530 m × 30 m
Soil typeResources and Environmental Science Data Center (https://www.resdc.cn/) (accessed on 25 June 2026)2020
Vegetation typeResources and Environmental Science Data Center (https://www.resdc.cn/) (accessed on 25 June 2026)20201 km × 1 km
SensitivityEnterprise densityOpenStreetMap (https://www.openstreetmap.org/) (accessed on 25 June 2026)2020
gross domestic product (GDP)Institute of Geographic Sciences and Natural Resources Research (http://www.igsnrr.ac.cn/) (accessed on 25 June 2026)20201 km × 1 km
Population densityLandScan (https://landscan.ornl.gov/) (accessed on 25 June 2026)20201 km × 1 km
Road densityOpenStreetMap (https://www.openstreetmap.org/) (accessed on 25 June 2026)2020
VillageNational Bureau of Statistics2020
Adaptive capacityBridgeNational Flash Flood Investigation and
Evaluation Project (NFFIEP)
2015
EmbankmentNFFIEP2015
Distance to hospitalOpenStreetMap (https://www.openstreetmap.org/) (accessed on 25 June 2026)2015
CulvertNFFIEP2015
ReservoirNFFIEP2015
SluiceNFFIEP2015
Simple rainfall stationNFFIEP2015
Automatic monitoring stationNFFIEP2015
Wireless warning stationNFFIEP2015
Table 3. TOPSIS identifies the optimal plan for allocating funds.
Pareto-Optimal Set f 1 f 2 f 3 Relative Closeness
Case 185,91520200.2820.83
Case 285,90720070.2790.71
Case 385,87620130.2800.47
Case 485,90720170.2840.39
Case 585,90220210.2970.34
Disclaimer/Publisher’s Note: The statements, opinions and data contained in all publications are solely those of the individual author(s) and contributor(s) and not of MDPI and/or the editor(s). MDPI and/or the editor(s) disclaim responsibility for any injury to people or property resulting from any ideas, methods, instructions or products referred to in the content.