Curvature-Based Assessment of Left-Turn Trajectories at Urban Intersections Using Video-Extracted Vehicle Paths

 ,
,  ,
,  , and
, and
Abstract
1. Introduction
1.1. Background
1.2. Research Gap and Objectives
- Limited direct linkage between design curves and observed trajectories. Many studies have described observed turning paths qualitatively or reported representative radii for selected trajectories [5,6,21], but few have quantified the distribution of curvature deviations across all vehicles and movements at a set of real intersections, explicitly benchmarking against the geometric design arcs.
- Lack of simple, transferable indicators. There is no widely adopted set of indicators that summarises, in a compact and interpretable form, how closely drivers follow the design geometry, nor that distinguishes between systematic “flattening” (drivers opening the curve relative to design) and “tightening” (drivers following sharper paths than intended). Existing safety indicators are mostly conflict-based and do not explicitly encode geometric consistency [13,14,15,16].
- Scarce multi-site evidence in real urban networks. Most available work has been based on single sites, experimental layouts, or a limited number of approaches, which constrains the generalisability of findings and the ability to compare patterns across different intersection types and configurations [7,18,22]. Large-scale drone datasets, such as inD and DRIFT, provide valuable naturalistic trajectories, but they do not directly offer design-versus-observed curvature comparisons for the left-turn movements examined here [23,24].
- To what extent do observed left-turn vehicle trajectories at urban intersections conform to the theoretical circular arcs defined by intersection design?
- How do curvature deviations between observed and design paths vary across different intersections, left-turn movements and, where applicable, left-turn lanes?
- Can curvature-based indicators derived from video-extracted trajectories serve as practical tools for geometric consistency checks and as inputs for the calibration of microscopic traffic simulation models?
1.3. Study Approach and Contributions
2. Literature Review
2.1. Geometric Design of Left-Turn Manoeuvres
2.2. Empirical Observations of Turning Trajectories
2.3. Video-Based Trajectory Extraction and Datasets
2.4. Trajectory-Based Safety and Comfort Indicators
2.5. Modelling and Planning of Turning Paths
3. Study Sites and Methodology
3.1. Study Area and Selected Intersections
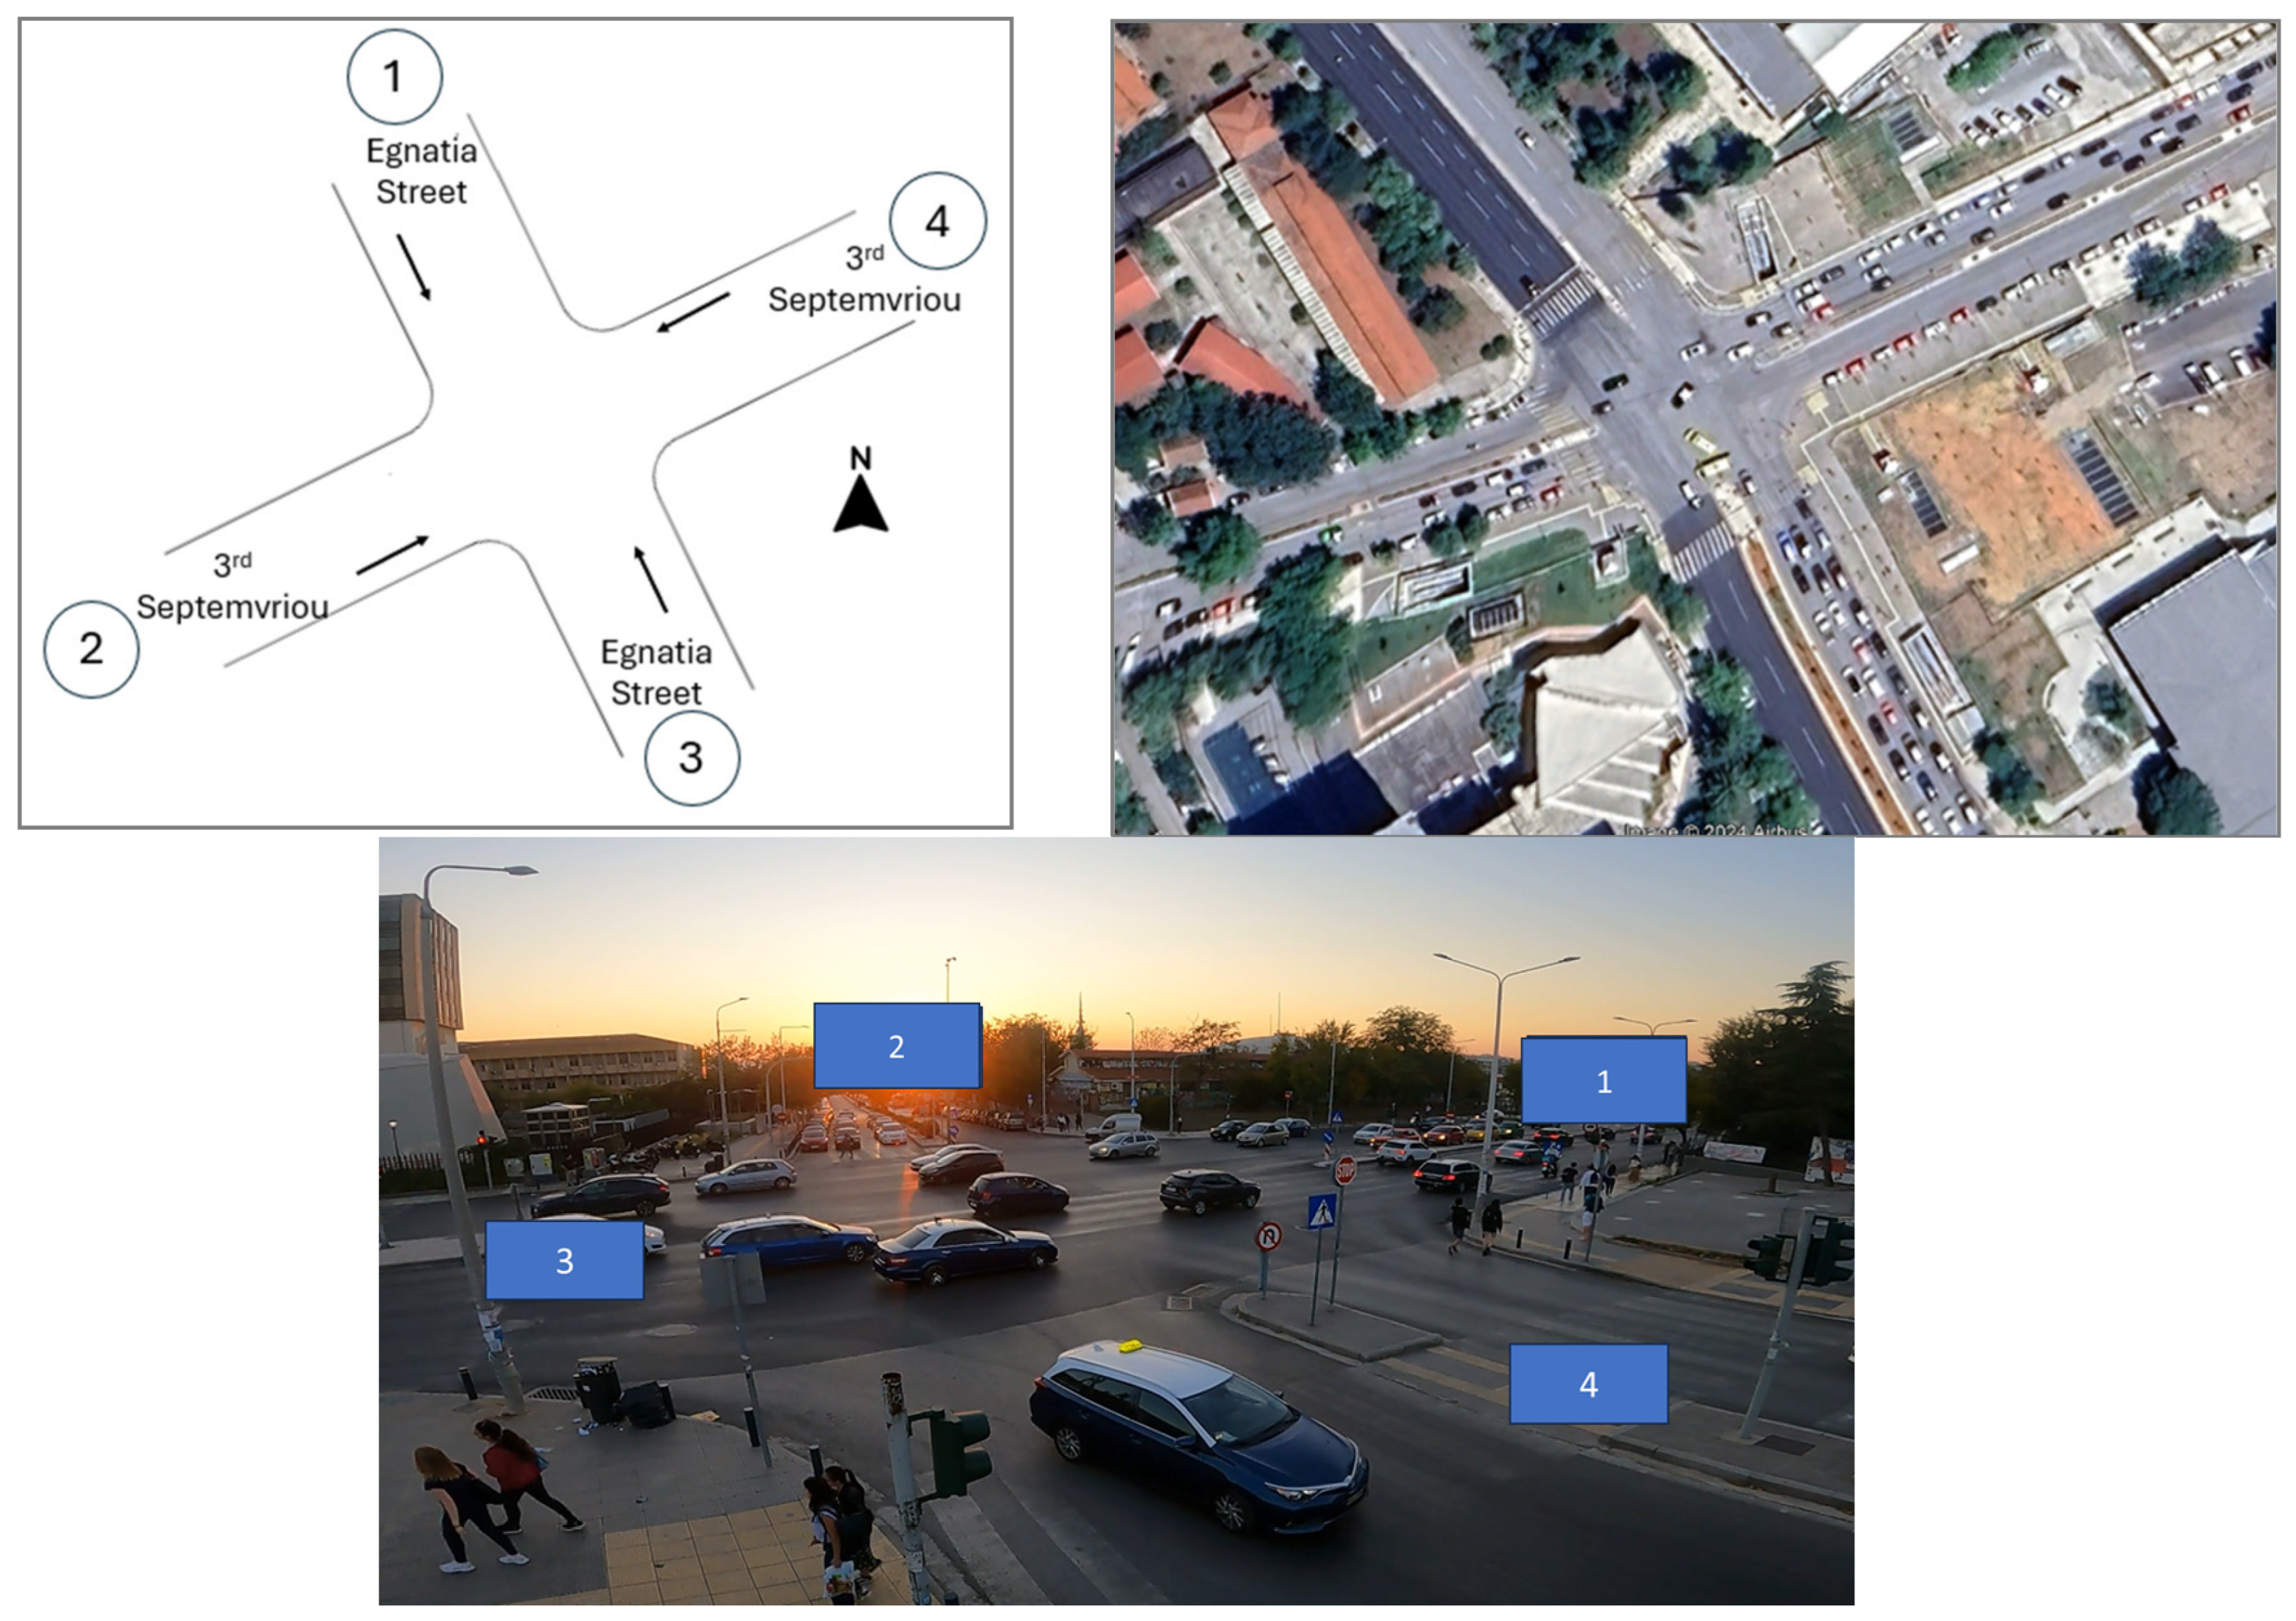
- K01—Egnatia Street/3rd September Avenue.
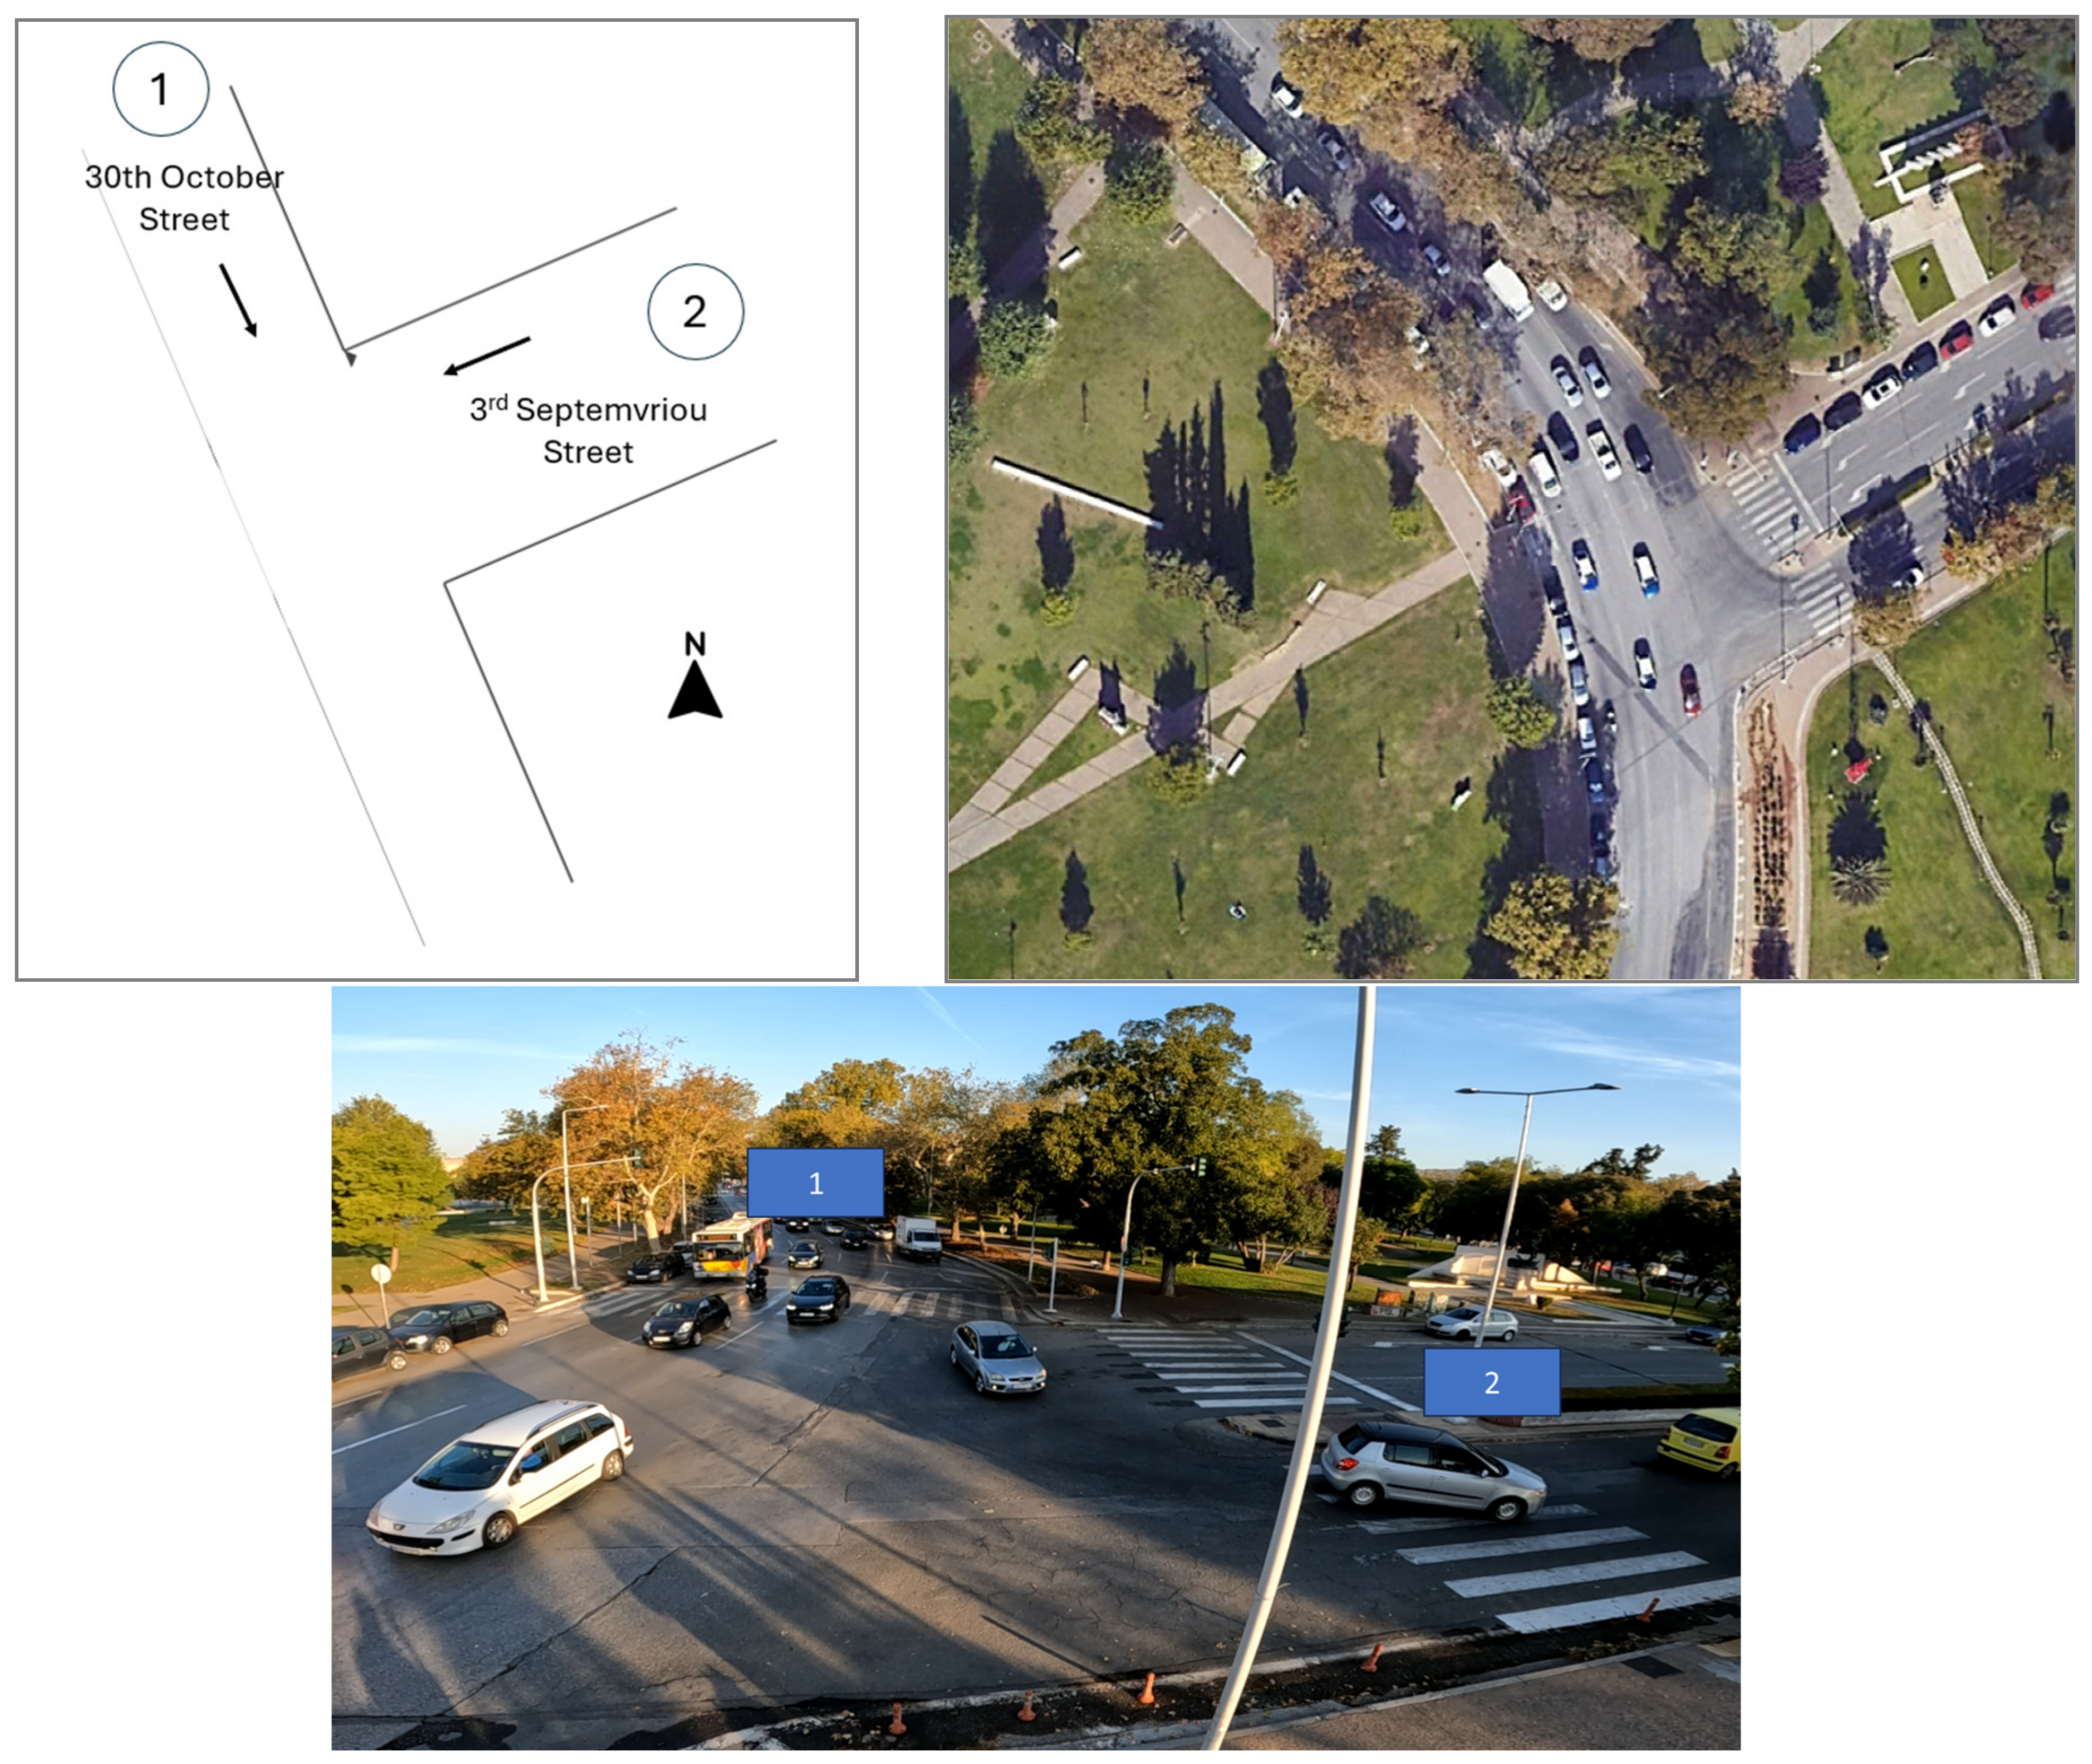
- K02—30th October Street/3rd September Avenue.
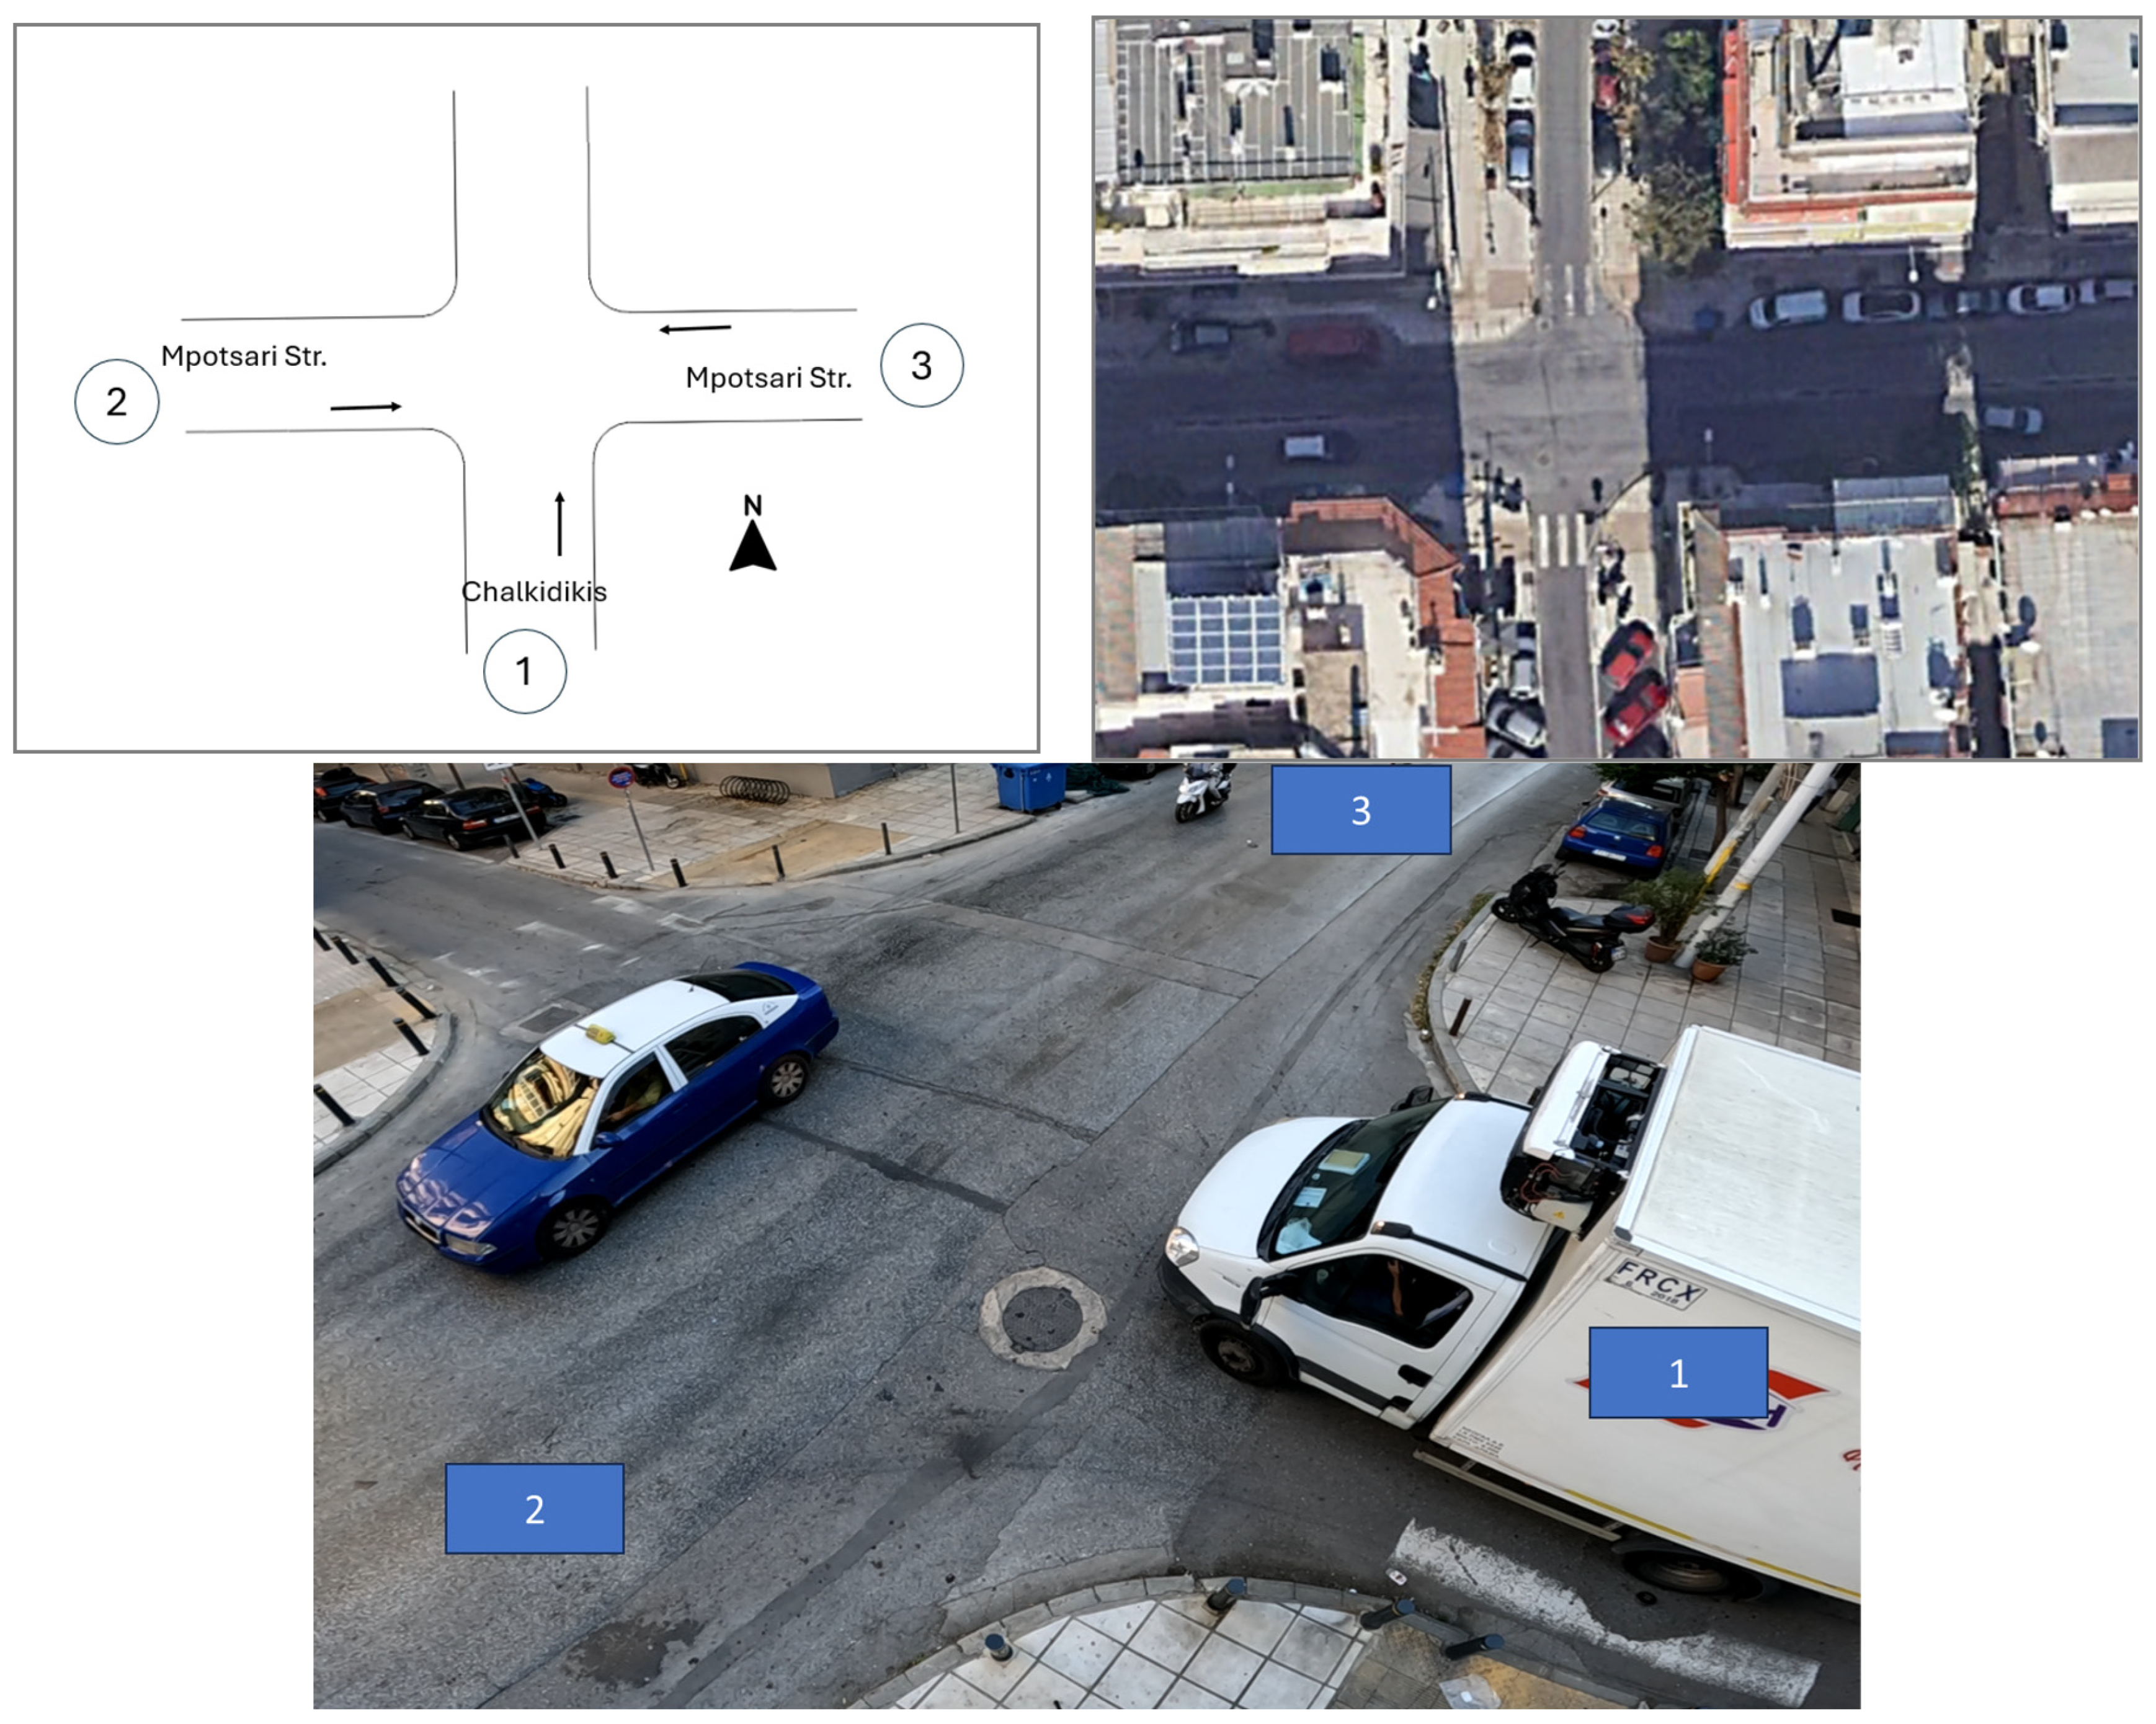
- K03—Mpotsari Street/Chalkidis Street.
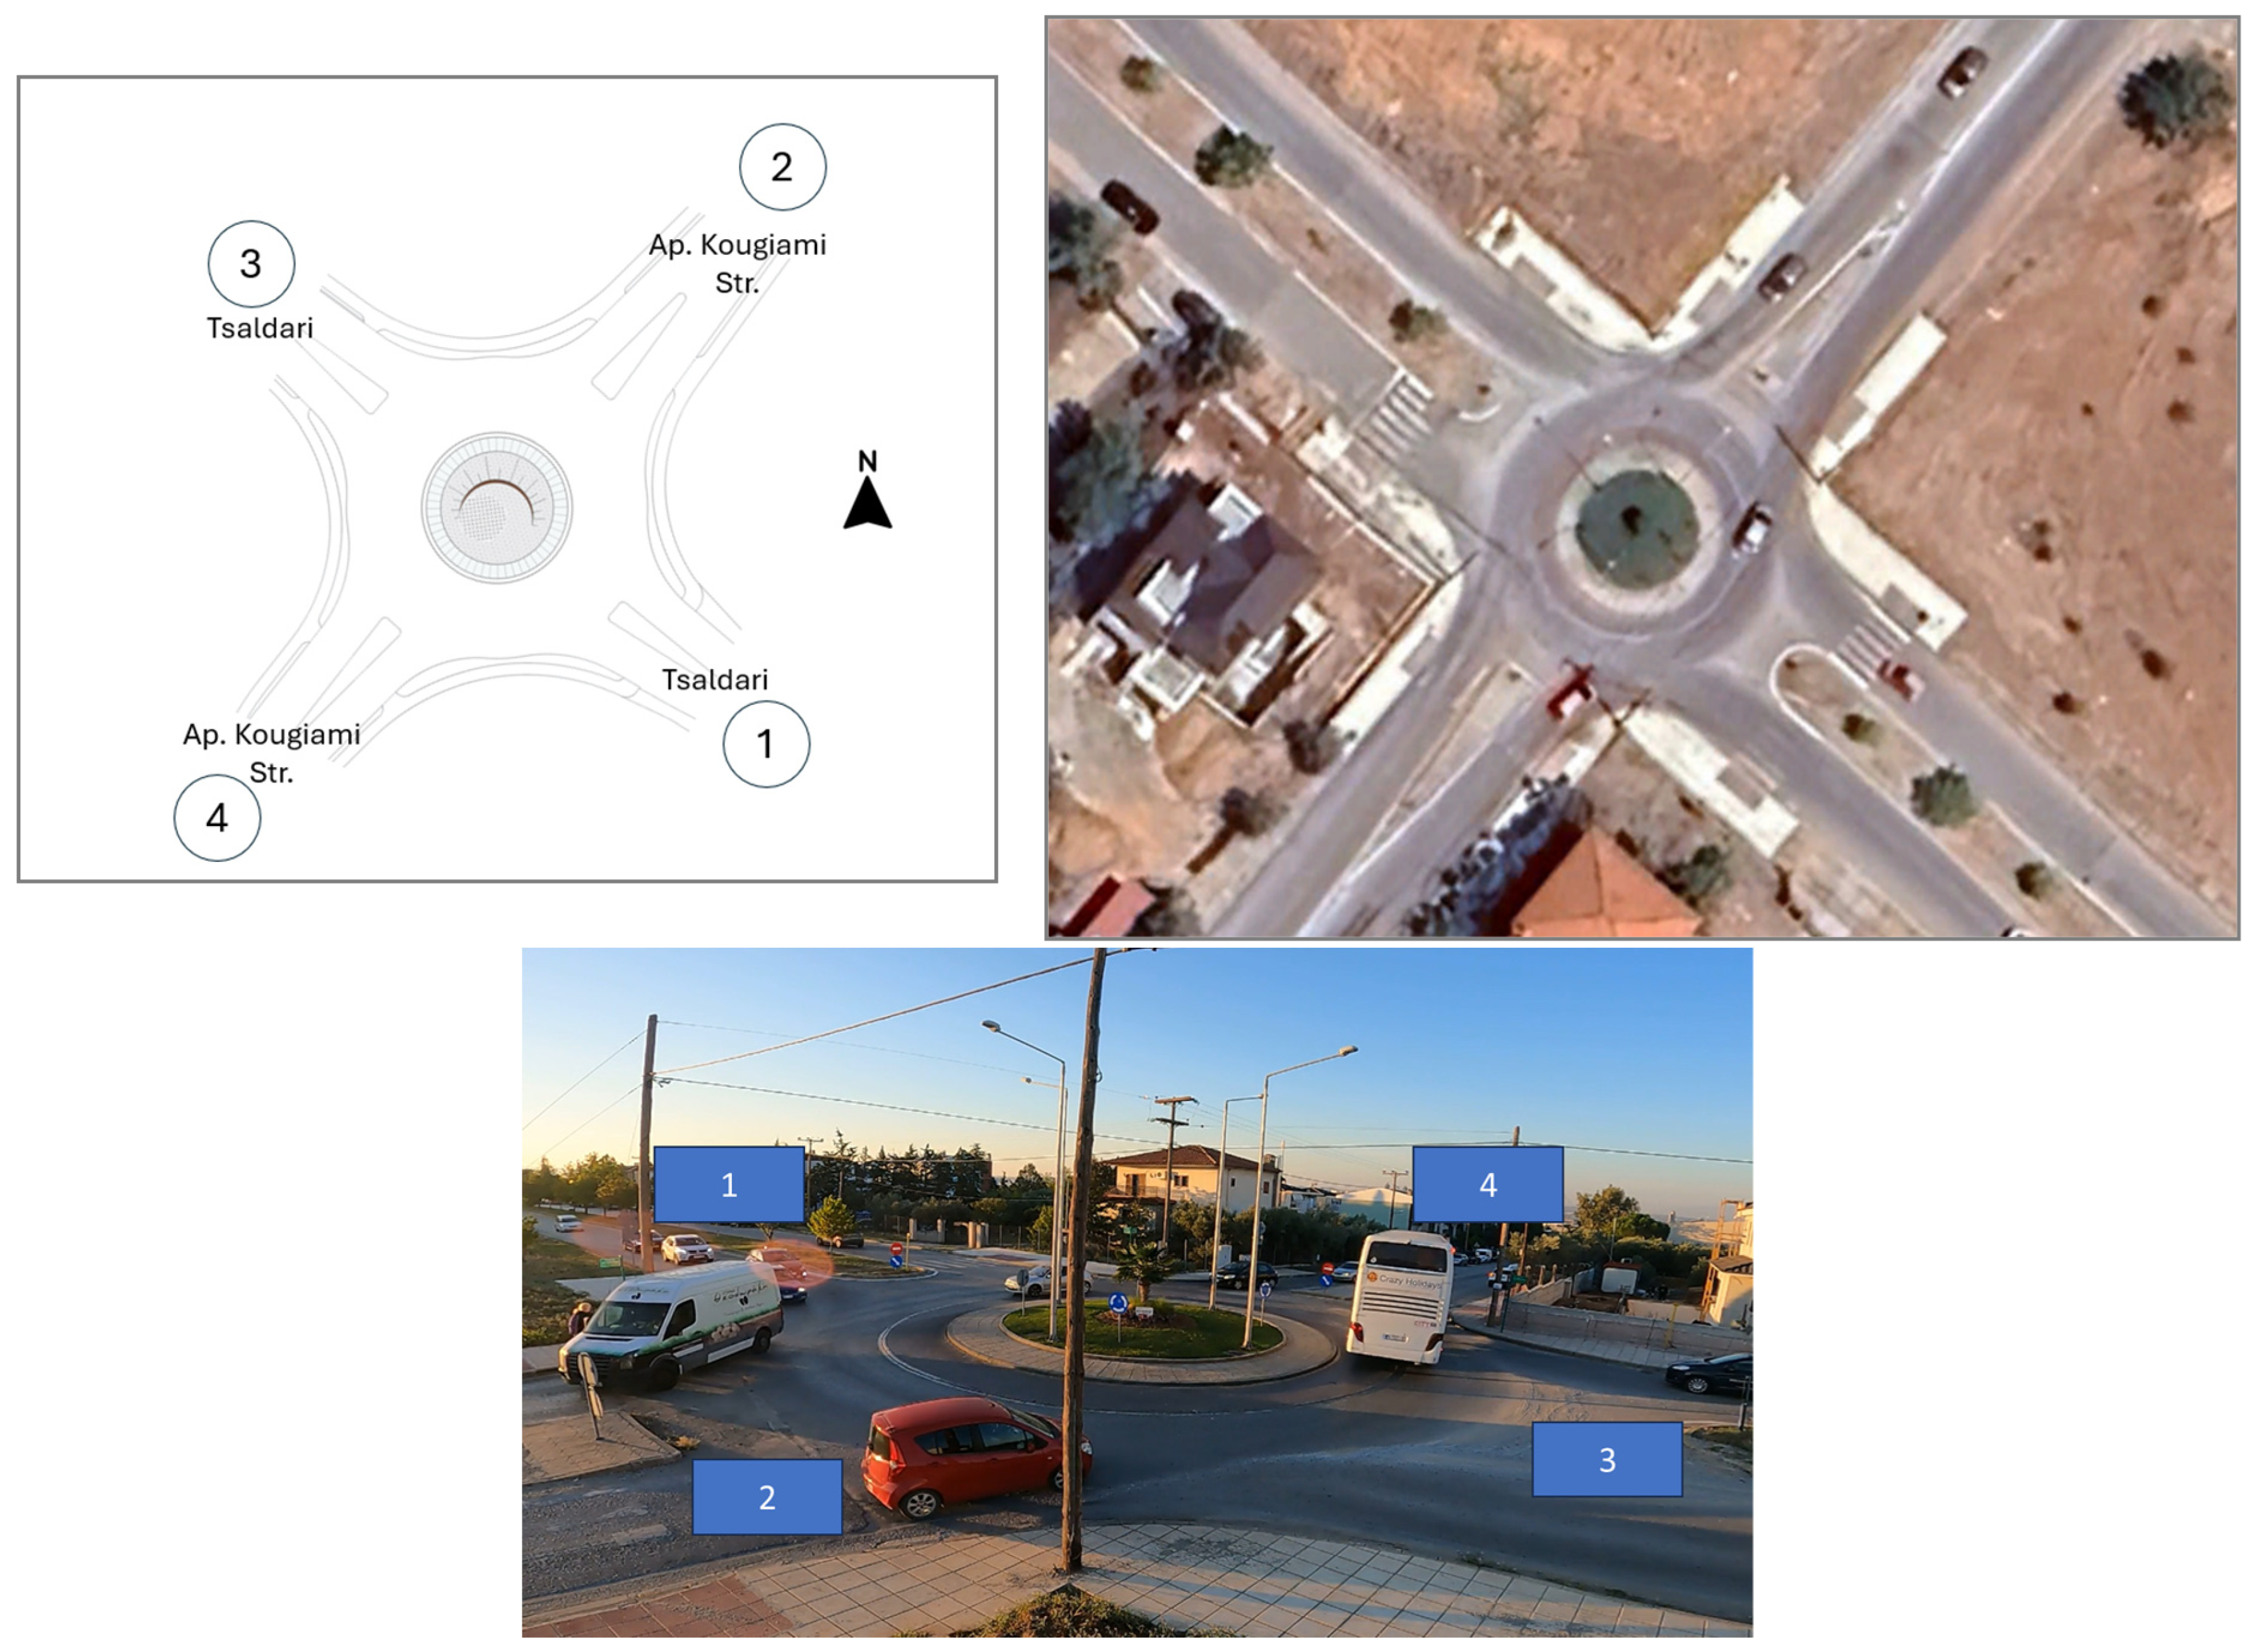
- K04—Tsaldari Street/Kougiami Street.
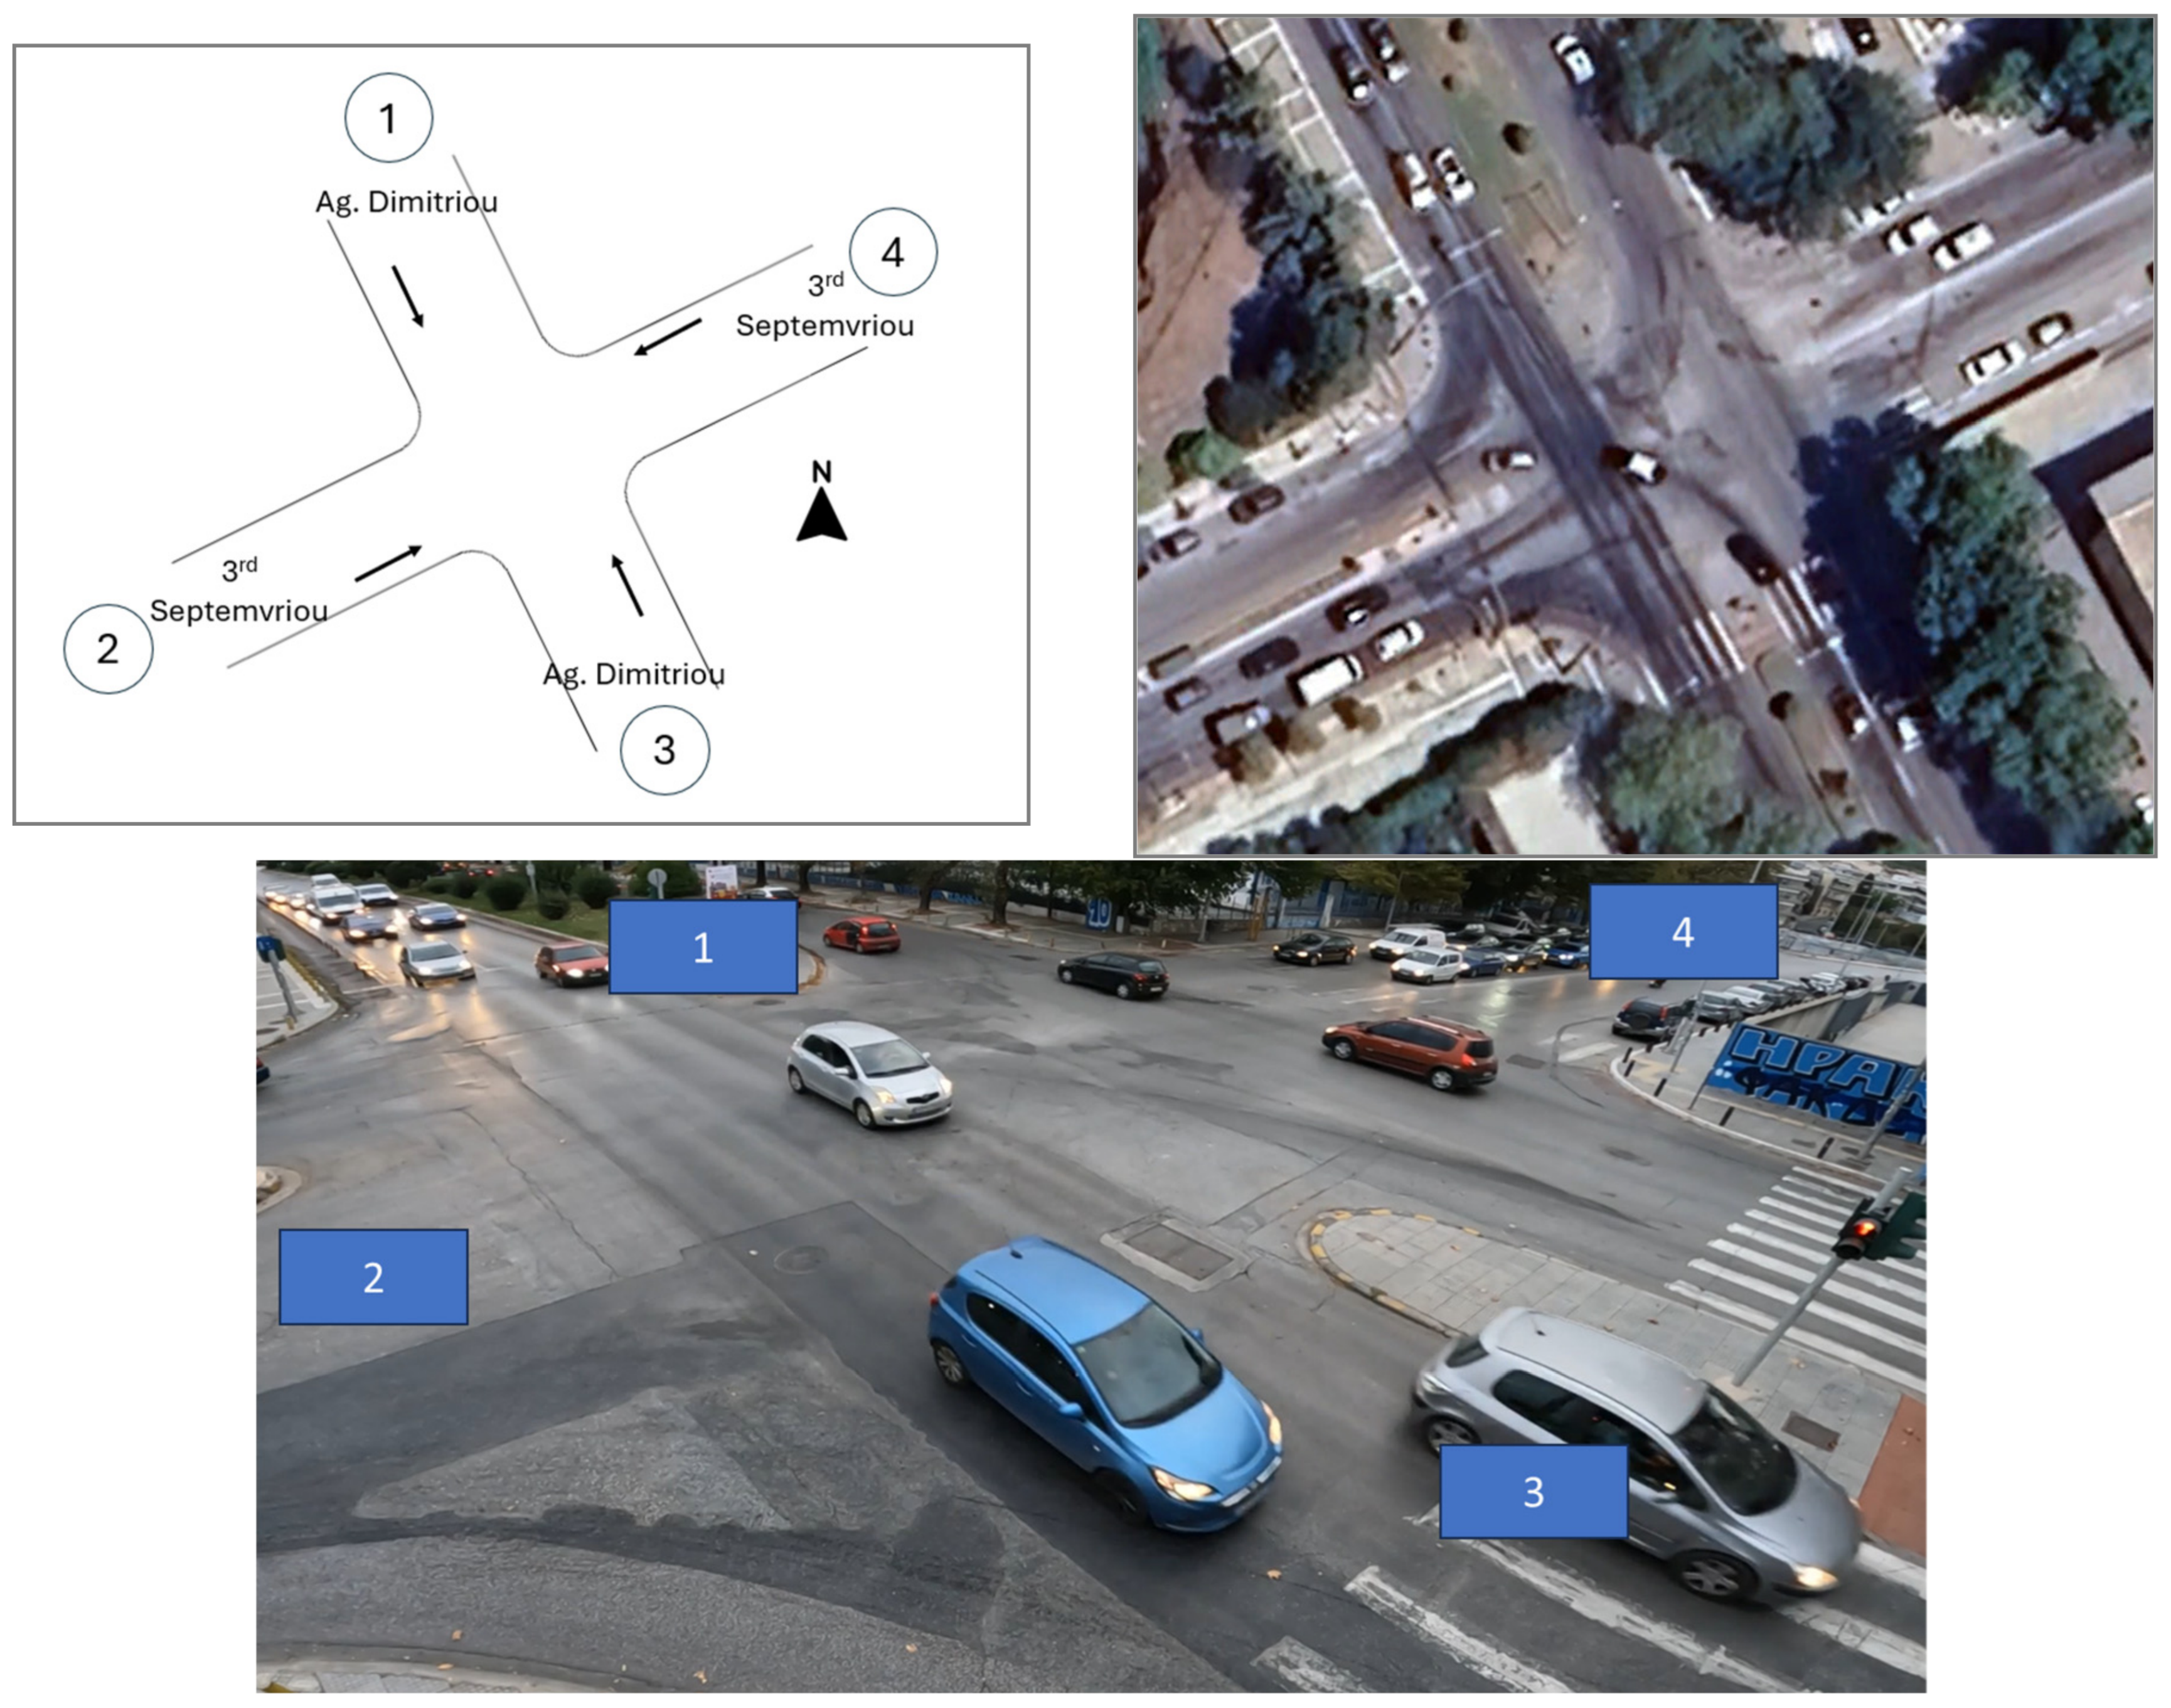
- K05—3rd September Avenue/Agiou Dimitriou Street.
- Intersection size and corner radii;
- Number and width of approach lanes;
- Installed signalised systems;
- Presence or absence of channelised islands and auxiliary lanes;
- Surrounding land use and traffic demand patterns.
3.2. Video Data Collection
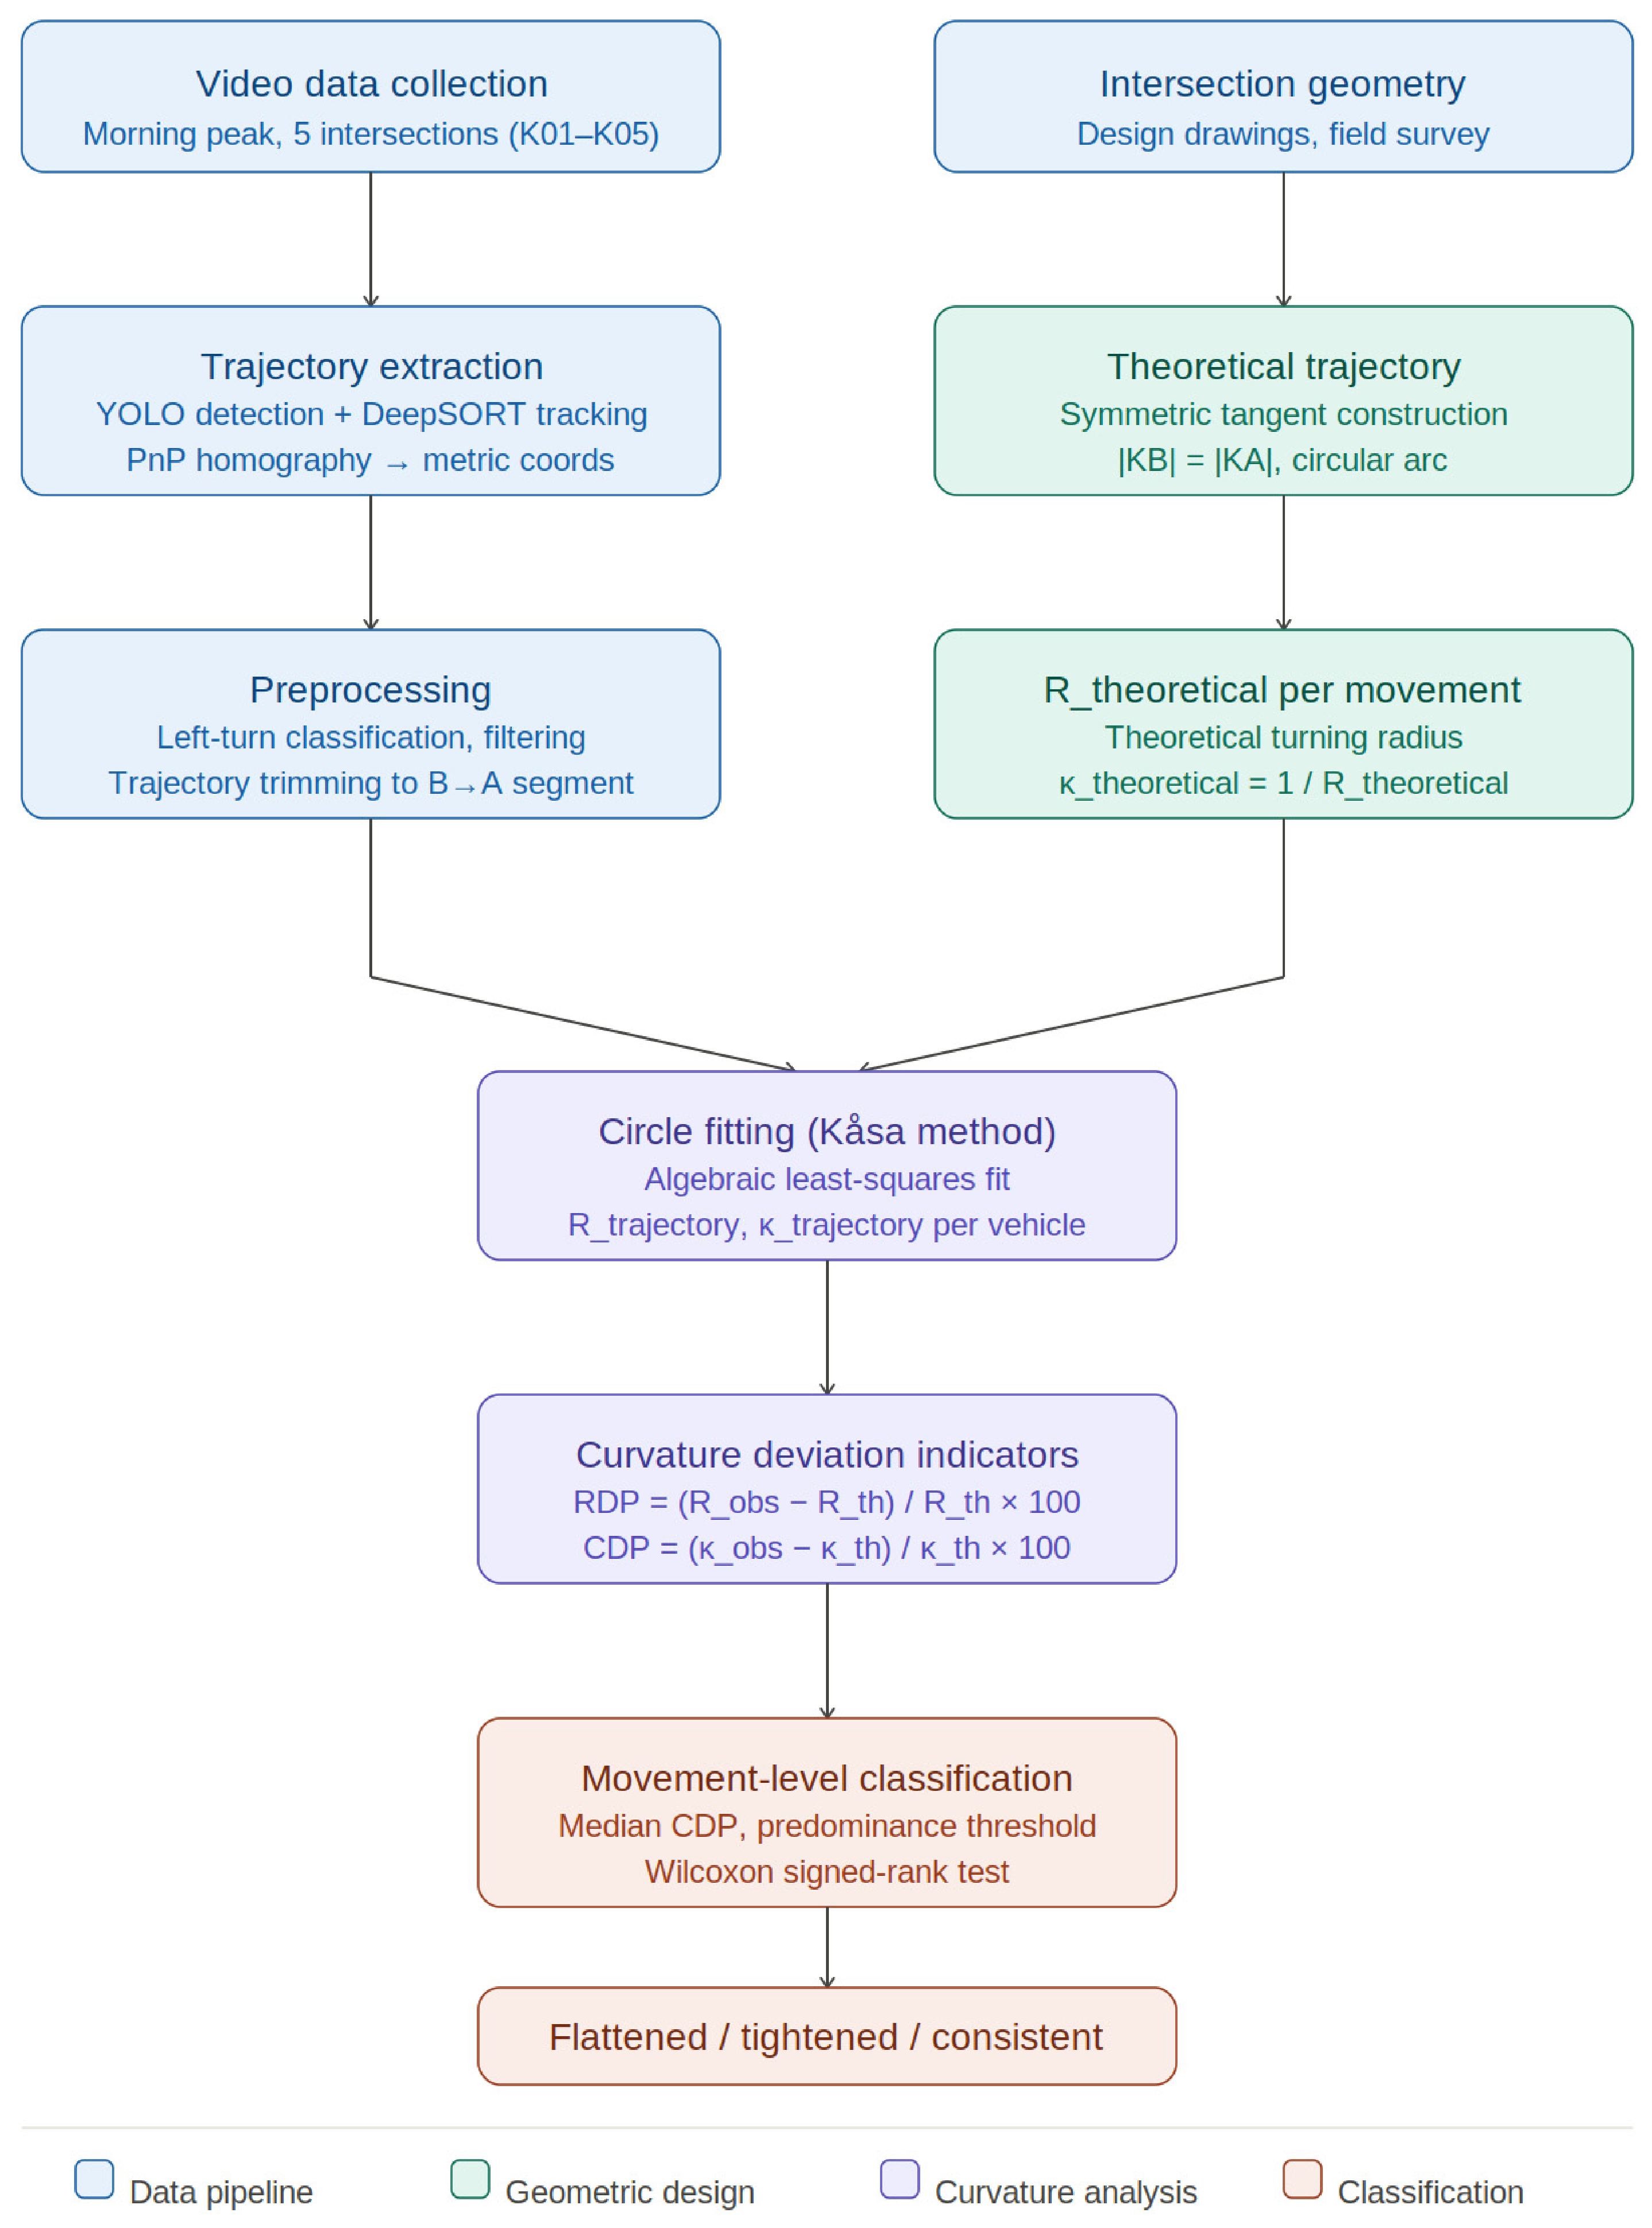
3.3. Trajectory Extraction and Georeferencing
3.4. Selection and Preprocessing of Left-Turn Trajectories
- K01: 532 trajectories across movements 1→4, 2→1 and 4→3;
- K02: 621 trajectories across movements 1→2 and 2→1 (including the leftmost lane at movement 2→1);
- K03: 138 trajectories across movements 1→2 and 2→1;
- K04: 352 trajectories across movements 1→1, 1→4, 2→1, 3→2, 4→3 and 4→4;
- K05: 676 trajectories across movements 2→1, 3→2 and 4→3.
- Trajectories were ordered in time and checked for continuity of the tracking ID.
- Short or fragmented trajectories were discarded when they did not preserve sufficient continuity within the predefined comparison boundaries to allow a meaningful curvature estimate over the curved part of the manoeuvre. This filtering was not based on a single global threshold in terms of frames or path length, because the required extent depends on the geometric length of each analysed turning segment. In practice, fragmented trajectories were usually caused by temporary occlusion, whereas very short trajectories tended to produce unrealistically high fitted curvature values.
- For each retained left-turn trajectory, the portion belonging to the actual turning manoeuvre was extracted, as described next.
3.5. Definition of Theoretical Design Trajectories
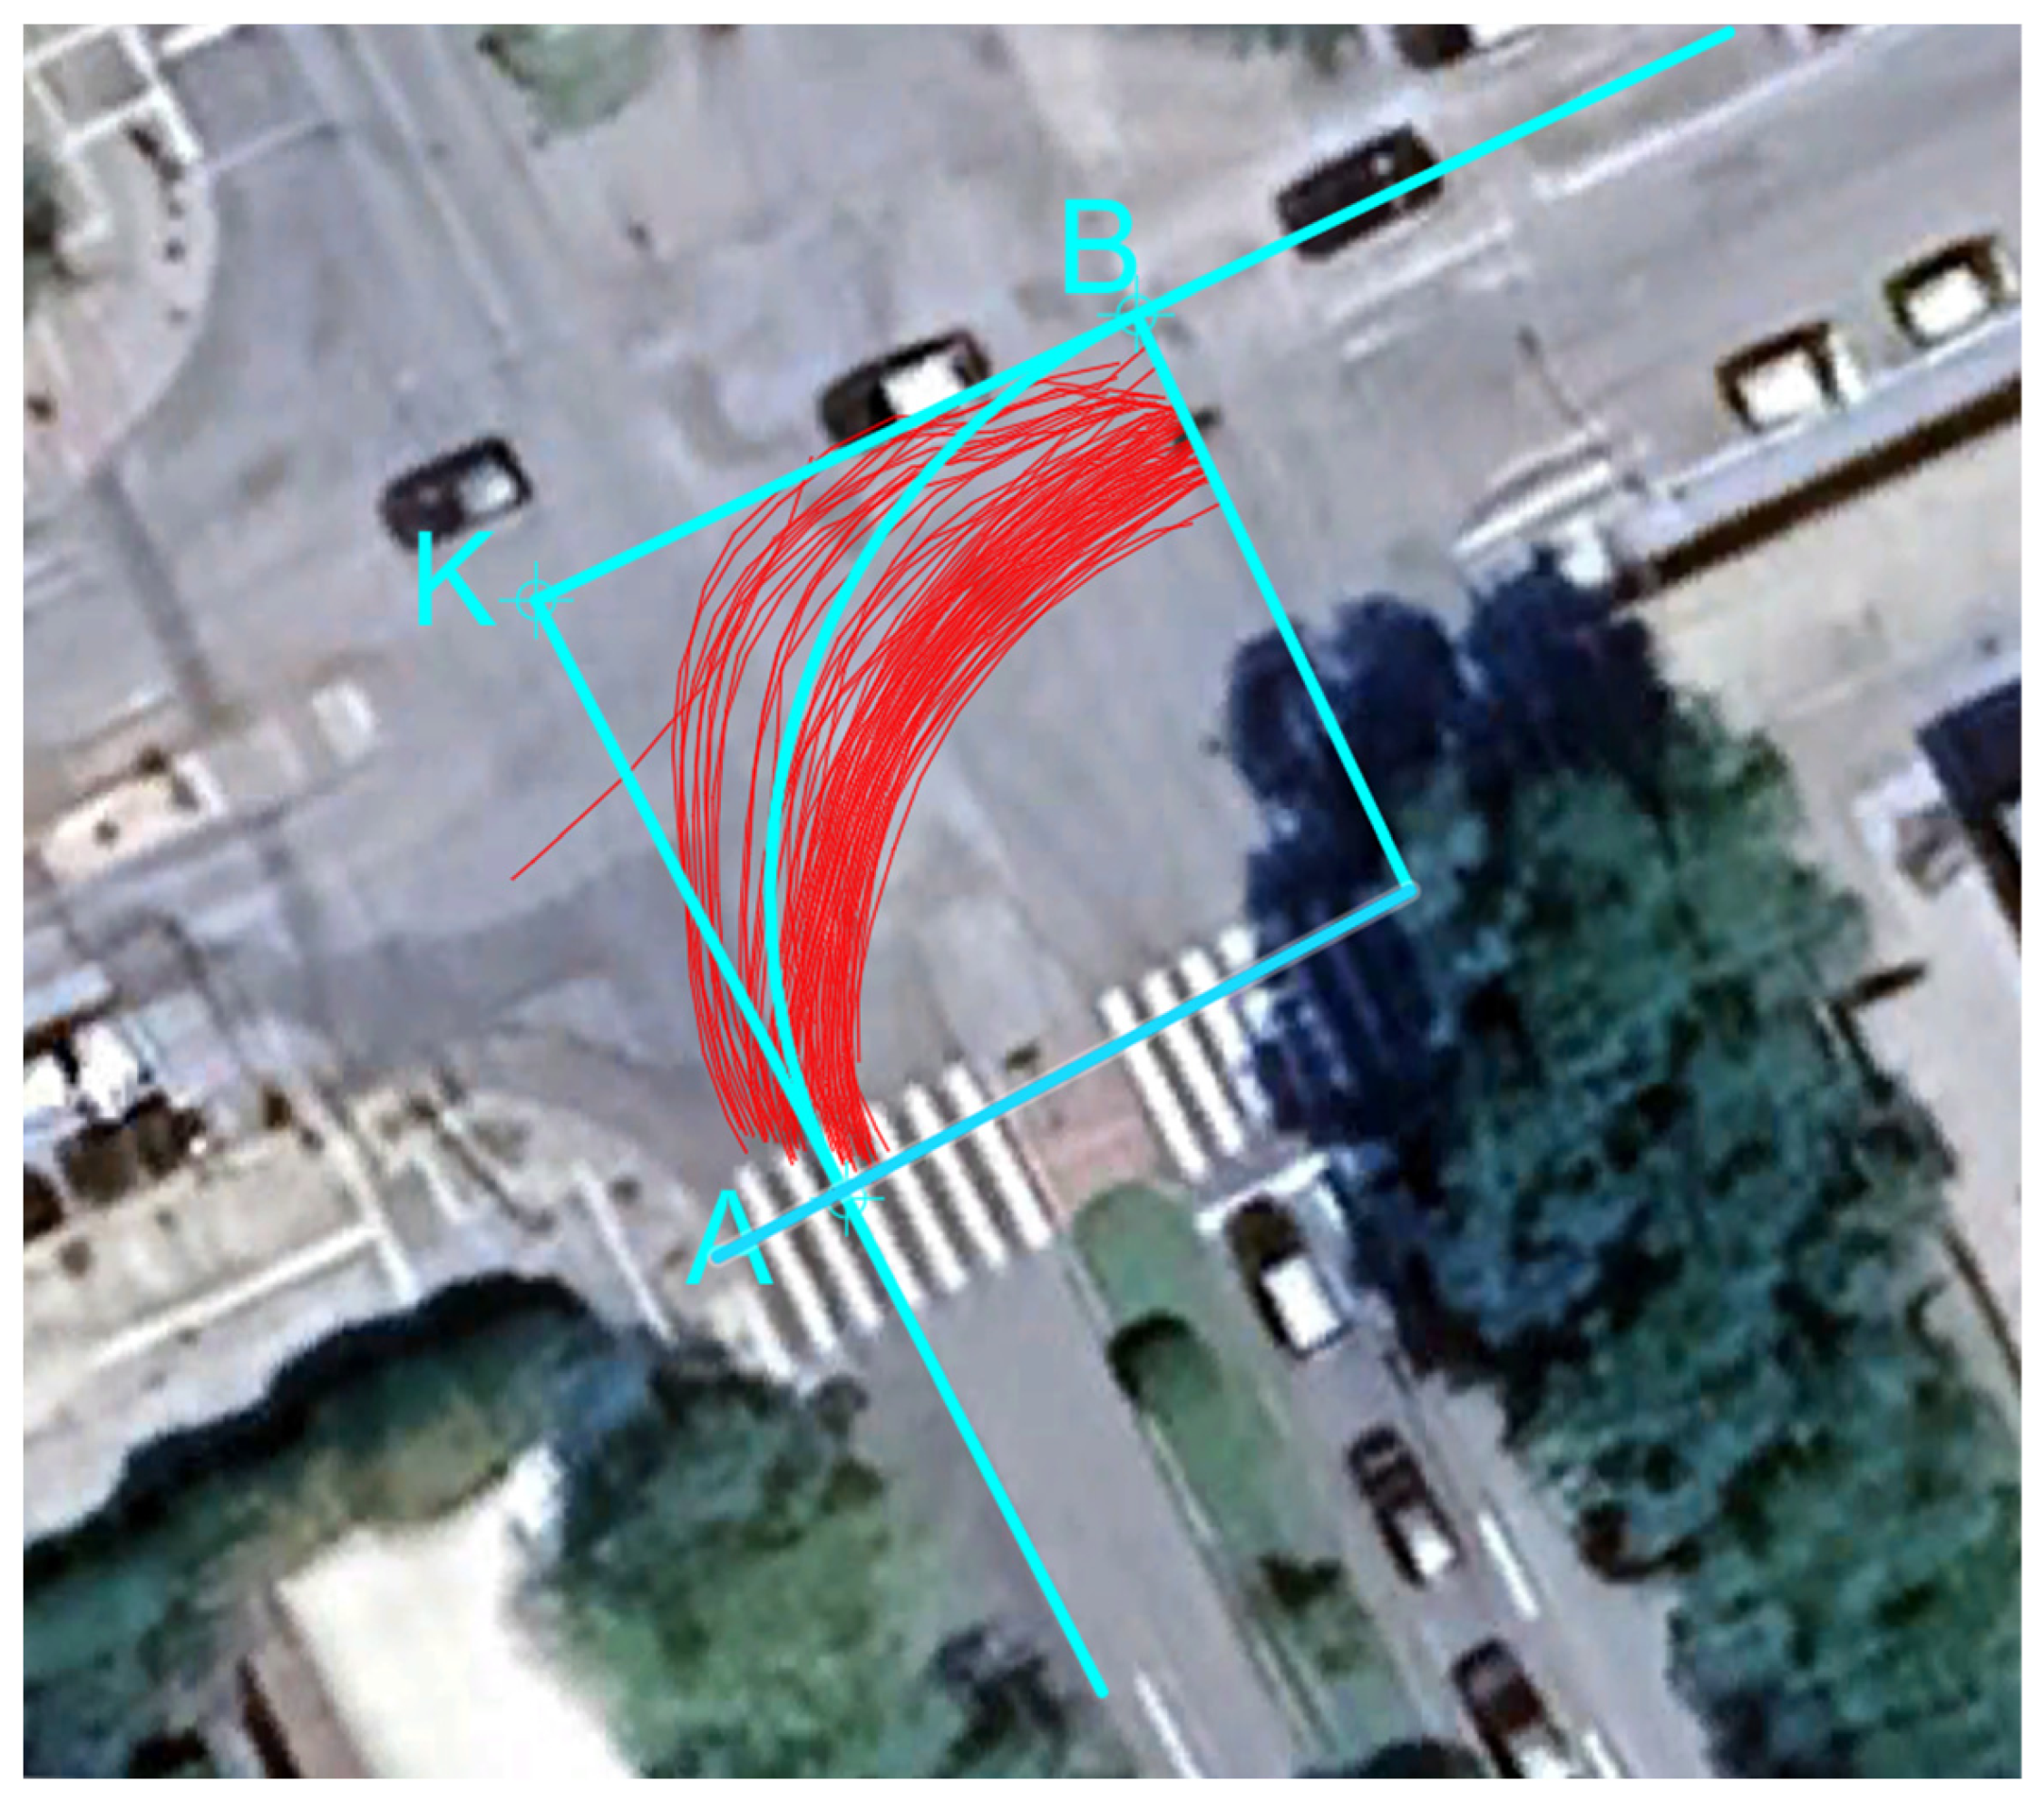
- The intersection point K was defined as the intersection of the prolongations of the centre lines of the entry and exit lanes for the left-turn movement.
- Along the exit-leg tangent, point A was identified at a certain distance from the edge of the island where vehicles straighten their trajectory.
- Along the entry-leg tangent, point B was then defined such that the distance from K to B along the entry tangent satisfies
- The theoretical design trajectory for the left-turn was defined as a circular arc that is tangent to the entry and exit tangents at points B and A, respectively, and connects these two tangency points.
- This symmetric construction was adopted in this study as a practical geometric simplification in order to define, in a consistent manner across movements, the curved portion over which observed and theoretical trajectories are compared. It was not intended to imply that real left-turn trajectories are inherently symmetric, nor that this construction follows a formal design standard. Rather, it provides a transparent and repeatable way to standardise the comparison extent across heterogeneous urban layouts on the basis of the available intersection geometry.
- From this construction, the theoretical turning radius and the corresponding theoretical curvature
3.6. Extraction of the Curved Trajectory Segment
- Using the same local coordinate system as for the geometric design, two virtual cross-sections were defined:
- An upstream section on the entry leg at a distance from the intersection point K along the entry-lane tangent;
- A downstream section on the exit leg at a distance from K along the exit-lane tangent.
- For each vehicle trajectory associated with the given left-turn movement, the instants when the vehicle crossed the upstream and downstream cross-sections were identified.
- The points of the trajectory between these two crossings were extracted and treated as the curved trajectory segment used in curvature analysis; trajectory points upstream of B or downstream of A were discarded.
3.7. Circle Fitting and Curvature Estimation of Measured Trajectories
3.8. Curvature Deviation Indicators
- Radius Deviation Percentage (RDP):
- Curvature Deviation Percentage (CDP):
- Describe systematic biases (e.g., left-turn movements in which drivers consistently tighten or flatten the design arc);
- Quantify inter-driving behaviour variability;
- Explore the implications of these deviations for comfort and safety-related indicators.
4. Results and Discussion
4.1. Overview of Curvature Deviations
- RDP > 0 (CDP < 0): drivers adopt flatter paths than implied by the geometric design, i.e., they use a larger effective radius;
- RDP < 0 (CDP > 0): drivers follow tighter paths, turning with a smaller effective radius than the theoretical one;
- Values close to zero indicate that the observed path is broadly consistent with the design arc.
4.2. Movement-Level Classification and Statistical Support of Curvature Deviations
4.3. Sensitivity Analysis of the Movement-Level Classification
- A threshold sensitivity check using alternative median CDP thresholds (±5%, ±10%, and ±15%) and predominance thresholds (60%, 70%, and 80%) further indicated that the strongest movement-level patterns remained stable, whereas borderline cases near the adopted thresholds were more sensitive to rule specification. On this basis, the ±10%/70% combination was retained as a pragmatic compromise between interpretive stability and sensitivity to systematic movement-level deviation. A targeted sensitivity check using mild asymmetric perturbations of the comparison extent likewise showed that the strongest flattening and tightening movements remained stable, whereas a borderline mixed case proved more sensitive to trimming choice.
4.4. Geometric Design Implications
4.4.1. Movements with Systematic Flattening
- Generous corner radii and wide lanes;
- Long distances between opposite stop lines;
- Absence of physical or optical constraints (islands, lane separators, or markings) that would keep vehicles near the theoretical inner edge of the turn.
- Reducing the effective corner radius by tightening the curb line;
- Repositioning or extending channelising islands to prevent vehicles from cutting across the lane;
- Narrowing the entry and/or exit lanes (or creating visual narrowing with markings);
- Shifting the exit crosswalk slightly upstream or re-aligning it so that pedestrians are not located in zones where flattened paths pass at higher speed.
4.4.2. Movements with Systematic Tightening
- Narrow or offset left-turn lanes;
- Restrictive corner radii combined with adjacent obstacles (islands, poles, and parking);
- Exit lanes that are laterally shifted relative to the entry lane, forcing an abrupt change in direction;
- Misalignment between the theoretical entry/exit tangents and the corridor that drivers visually perceive as the natural continuation of their lane.
- Modestly increasing the effective corner radius where feasible;
- Realigning entry and exit lane centrelines to better match the envelope of the observed paths;
- Adjusting the location of stop lines and crosswalks so that critical pedestrian areas are not directly exposed to the sharpest part of the turn.
4.4.3. Geometrically Consistent Movements
4.5. From Curvature Indicators to Safety-Oriented Design Adjustments
5. Movement-Specific Curvature Patterns
5.1. Intersection K01
- K01, movement 1→4.
- K01, movement 2→1.
- K01, movement 4→3
5.2. Intersection K02
- K02, movement 1→2.
- K02, movement 2→1 (all lanes).
- K02, movement 2→1 (leftmost lane).
5.3. Intersection K03
- K03, movement 1→2.
- K03, movement 2→1.
5.4. Intersection K04 (Single-Lane Roundabout)
5.5. Intersection K05
- K05, movement 2→1.
- K05, movement 3→2.
- K05, movement 4→3.
5.6. Summary: Where Turns Are Flatter and Where They Are Tighter, and Where Behaviour Remains Mixed
5.6.1. Movements Classified as Flattened-Turns
5.6.2. Movements Classified as Tightened-Turns
5.6.3. Movements Remaining Geometrically Consistent or Mixed
6. Conclusions and Future Work
6.1. Summary of Findings
6.2. Implications for Geometric Design and Safety
6.3. Methodological Contributions
- It relies on georeferenced trajectories obtained from video and computer vision, which are increasingly available in both research and practice. In the present case, the extracted movement-level trajectories were also checked for internal consistency in terms of confidence, temporal continuity and retained track quality after preprocessing.
- It uses simple, interpretable indicators (RDP and CDP) that can be computed automatically for large numbers of trajectories and summarised per movement.
- It provides a direct link between observed paths and design geometry by expressing deviations in terms of radius and curvature—quantities that designers already use.
6.4. Limitations and Directions for Future Research
Author Contributions
Funding
Data Availability Statement
Acknowledgments
Conflicts of Interest
References
- AASHTO. A Policy on Geometric Design of Highways and Streets, 7th ed.; American Association of State Highway and Transportation Officials: Washinton, DC, USA, 2018; Volume 83. [Google Scholar]
- Pochowski, A.; Paul, A.; Rodegerdts, L.A. Roundabout Practices; Transportation Research Board: Washington, DC, USA, 2016. [Google Scholar] [CrossRef] [PubMed]
- National Academies of Sciences, Engineering, and Medicine. Guide for Roundabouts; Transportation Research Board; The National Academies Press: Washington, DC, USA, 2023. [Google Scholar] [CrossRef] [PubMed]
- Chen, Y.; Persaud, B.; Sacchi, E.; Bassani, M. Investigation of models for relating roundabout safety to predicted speed. Accid. Anal. Prev. 2013, 50, 196–203. [Google Scholar] [CrossRef] [PubMed]
- Pilko, H.; Brčić, D.; Šubić, N. Study of vehicle speed in the design of roundabouts. GRAĐEVINAR 2014, 66, 407–416. [Google Scholar] [CrossRef]
- Šurdonja, S.; Dragčević, V.; Aleksandra, D.; Korlaet, Ž. Model of vehicle path radius at roundabout centre. Gradjevinar 2019, 71, 163–175. [Google Scholar] [CrossRef]
- Abdeljaber, O.; Younis, A.; Alhajyaseen, W. Analysis of the Trajectories of Left-turning Vehicles at Signalized Intersections. Transp. Res. Procedia 2020, 48, 1288–1295. [Google Scholar] [CrossRef]
- Zhao, J.; Ma, R.; Sun, J.; Zhang, R.; Zhang, C. Modeling and analysis of vehicle path dispersion at signalized intersections using explainable backpropagation neural networks. Fundam. Res. 2025, 5, 1645–1658. [Google Scholar] [CrossRef] [PubMed]
- Iwanowicz, D.; Krukowicz, T.; Chadała, J.; Grabowski, M.; Woźniak, M. Evaluation of Selected Factors Affecting the Speed of Drivers at Signal-Controlled Intersections in Poland. Sustainability 2024, 16, 8862. [Google Scholar] [CrossRef]
- Classen, S.; Shechtman, O.; Stephens, B.; Davis, E.; Justiss, M.; Bendixen, R.; Posse, C.; Mccarthy, D.; Mann, W. The Impact of Roadway Intersection Design on Driving Performance of Young and Senior Adults. Traffic Inj. Prev. 2007, 8, 69–77. [Google Scholar] [CrossRef] [PubMed]
- Naylor, D.W.; Graham, J.R. Intersection Design and Decision–Reaction Time for Older Drivers. Transp. Res. Rec. J. Transp. Res. Board 1997, 1573, 68–71. [Google Scholar] [CrossRef]
- Leonardi, S.; Distefano, N. Roundabout Trajectory Planning: Integrating Human Driving Models for Autonomous Vehicles. Sustainability 2023, 15, 16288. [Google Scholar] [CrossRef]
- Gettman, D.; Head, L. Surrogate Safety Measures from Traffic Simulation Models. Transp. Res. Rec. J. Transp. Res. Board 2003, 1840, 104–115. [Google Scholar] [CrossRef]
- Vasconcelos, L.; Neto, L.; Seco, Á.M.; Silva, A.B. Validation of the Surrogate Safety Assessment Model for Assessment of Intersection Safety. Transp. Res. Rec. J. Transp. Res. Board 2014, 2432, 1–9. [Google Scholar] [CrossRef]
- Gettman, D.; Pu, L.; Sayed, T.; Shelby, S. Surrogate Safety Assessment Model and Validation: Final Report (FHWA-HRT-08-051); Federal Highway Administration: Washington, DC, USA, 2008. [Google Scholar]
- Astarita, V.; Caliendo, C.; Giofrè, V.P.; Russo, I. Surrogate Safety Measures from Traffic Simulation: Validation of Safety Indicators with Intersection Traffic Crash Data. Sustainability 2020, 12, 6974. [Google Scholar] [CrossRef]
- So, J.; Dedes, G.; Park, B.B.; HosseinyAlamdary, S.; Grejner-Brzezinsk, D. Development and evaluation of an enhanced surrogate safety assessment framework. Transp. Res. Part C Emerg. Technol. 2015, 50, 51–67. [Google Scholar] [CrossRef]
- Alhajyaseen, W.K.M.; Asano, M.; Nakamura, H.; Tan, D.M. Stochastic approach for modeling the effects of intersection geometry on turning vehicle paths. Transp. Res. Part C Emerg. Technol. 2013, 32, 179–192. [Google Scholar] [CrossRef]
- Wei, F.; Chen, L.; Guo, Y.; Chen, M.; Ma, J. Car-following Behavior Analysis of Left-turn Vehicles at Signalized Intersections. Civ. Eng. J. 2020, 6, 186–193. [Google Scholar] [CrossRef]
- Fujinami, Y.; Raksincharoensak, P.; Arita, S.; Kato, R. Experimental Validation on Intersection Turning Trajectory Prediction Method for Advanced Driver Assistance System Based on Triclothoidal Curve. Appl. Sci. 2021, 11, 5900. [Google Scholar] [CrossRef]
- Reed, M.P. Intersection Kinematics: A Pilot Study of Driver Turning Behavior with Application to Pedestrian Obscuration by A-Pillars; University of Michigan: Ann Arbor, MI, USA, 2008. [Google Scholar]
- Wolfermann, A.; Alhajyaseen, W.K.M.; Nakamura, H.; Bründel, M. Modeling speed profiles of turning vehicles at signalized intersections. In Proceedings of the 3rd International Conference on Road Safety and Simulation (RSS 2011), Indianapolis, IN, USA, 14–16 September 2011. [Google Scholar]
- Bock, J.; Krajewski, R.; Moers, T.; Runde, S.; Vater, L.; Eckstein, L. The inD Dataset: A Drone Dataset of Naturalistic Road User Trajectories at German Intersections. In Proceedings of the 2020 IEEE Intelligent Vehicles Symposium (IV); IEEE: New York, NY, USA, 2020; pp. 1929–1934. [Google Scholar] [CrossRef]
- Lee, H.; Hong, S.; Song, J.; Cho, H.; Jin, Z.; Kim, B.; Jin, J.; Im, J.; Noh, B.; Yeo, H. DRIFT open dataset: A drone-derived intelligence for traffic analysis in urban environment. arXiv 2025, arXiv:2504.11019. [Google Scholar] [CrossRef]
- Köpeczi-Bócz, Á.T.; Mi, T.; Orosz, G.; Takács, D. YOLOgraphy: Image Processing Based Vehicle Position Recognition. In Advanced Vehicle Control Symposium; Springer: Cham, Switzerland, 2024; pp. 392–398. [Google Scholar] [CrossRef]
- Villagra, J.; Milanés, V.; Pérez, J.; Godoy, J. Smooth path and speed planning for an automated public transport vehicle. Rob. Auton. Syst. 2012, 60, 252–265. [Google Scholar] [CrossRef]
- Igneczi, G.F.; Horvath, E.; Toth, R.; Nyilas, K. Curve Trajectory Model for Human Preferred Path Planning of Automated Vehicles. Automot. Innov. 2024, 7, 59–70. [Google Scholar] [CrossRef]
- Riehl, K.; El-Baklish, S.K.; Kouvelas, A.; Makridis, M.A. Consistent vehicle trajectory extraction from aerial recordings using oriented object detection. Sci. Rep. 2025, 15, 27522. [Google Scholar] [CrossRef] [PubMed]
- Ventura, R.; Roussou, S.; Ziakopoulos, A.; Barabino, B.; Yannis, G. Using computer vision and street-level videos for pedestrian-vehicle tracking and behaviour analysis. Transp. Res. Interdiscip. Perspect. 2025, 30, 101366. [Google Scholar] [CrossRef]
- Li, R. A multi stage deep learning approach for real-time vehicle detection, tracking, and speed measurement in intelligent transportation systems. Sci. Rep. 2025, 15, 22531. [Google Scholar] [CrossRef] [PubMed]
- Fonod, R.; Cho, H.; Yeo, H.; Geroliminis, N. Advanced computer vision for extracting georeferenced vehicle trajectories from drone imagery. Transp. Res. Part C Emerg. Technol. 2025, 178, 105205. [Google Scholar] [CrossRef]
- Dias, C.; Iryo-Asano, M.; Abdullah, M.; Oguchi, T.; Alhajyaseen, W. Modeling Trajectories and Trajectory Variation of Turning Vehicles at Signalized Intersections. IEEE Access 2020, 8, 109821–109834. [Google Scholar] [CrossRef]
- Berghaus, M.; Lamberty, S.; Ehlers, J.; Kalló, E.; Oeser, M. Vehicle trajectory dataset from drone videos including off-ramp and congested traffic – Analysis of data quality, traffic flow, and accident risk. Commun. Transp. Res. 2024, 4, 100133. [Google Scholar] [CrossRef]
- Krajewski, R.; Bock, J.; Kloeker, L.; Eckstein, L. The highD Dataset: A Drone Dataset of Naturalistic Vehicle Trajectories on German Highways for Validation of Highly Automated Driving Systems. In Proceedings of the 2018 21st International Conference on Intelligent Transportation Systems (ITSC), Maui, HI, USA, 4–7 November 2018; pp. 2118–2125. [Google Scholar] [CrossRef]
- Luo, Q.; Lu, X.; Zang, Z.; Gong, H.; Guo, X.; Chen, X. A Real-Time Early Warning Framework for Multi-Dimensional Driving Risk of Heavy-Duty Trucks Using Trajectory Data. Systems 2026, 14, 204. [Google Scholar] [CrossRef]
- Zhao, J.; Knoop, V.L.; Wang, M. Two-dimensional vehicular movement modelling at intersections based on optimal control. Transp. Res. Part B Methodol. 2020, 138, 1–22. [Google Scholar] [CrossRef]
- Yan, Y.; Du, C.; Wang, Y.; Pi, D. Intelligent Vehicle Driving Decisions and Longitudinal–Lateral Trajectory Planning Considering Road Surface State Mutation. Actuators 2025, 14, 431. [Google Scholar] [CrossRef]
- Kåsa, I. A curve fitting procedure and its error analysis. IEEE Trans. Instrum. Meas. 1976, 25, 8–14. [Google Scholar]




| Turning Movement | No of Captured Left-Turns |
|---|---|
| K01 1_4 | 157 |
| K01 2_1 | 80 |
| K01 4_3 | 295 |
| K02 2_1 leftmost | 358 |
| K02 1_2 | 226 |
| K02 2_1 | 37 |
| K03 1_2 | 25 |
| K03 2_1 | 113 |
| K04 1_1 | 13 |
| K04 1_4 | 194 |
| K04 2_1 | 116 |
| K04 3_2 | 5 |
| K04 4_3 | 19 |
| K04 4_4 | 5 |
| K05 2_1 | 163 |
| K05 3_2 | 427 |
| K05 4_3 | 86 |
| SUM | 2319 |
| Movement | N | Median CDP (%) | IQR CDP (%) | Flatter (%) | Tighter (%) | Wilcoxon p-Value |
|---|---|---|---|---|---|---|
| K01 1_4 | 157 | −13.76 | 11.70 | 93.6 | 6.4 | <0.001 |
| K01 2_1 | 80 | +15.77 | 18.09 | 17.5 | 82.5 | <0.001 |
| K01 4_3 | 295 | +37.32 | 18.01 | 0.0 | 100.0 | <0.001 |
| K02 2_1 leftmost | 226 | −10.54 | 11.31 | 87.2 | 12.8 | <0.001 |
| K02 1_2 | 37 | −8.88 | 22.95 | 64.9 | 35.1 | 0.035 |
| K02 2_1 | 358 | +5.71 | 40.35 | 42.7 | 57.3 | <0.001 |
| K03 1_2 | 25 | −1.29 | 23.47 | 60.0 | 40.0 | 0.861 |
| K03 2_1 | 113 | +6.89 | 22.27 | 29.2 | 70.8 | <0.001 |
| K04 1_1 | 13 | +6.84 | 7.59 | 0.0 | 100.0 | 0.001 |
| K04 1_4 | 194 | +3.07 | 5.50 | 25.8 | 74.2 | <0.001 |
| K04 2_1 | 116 | −4.88 | 7.13 | 83.6 | 16.4 | <0.001 |
| K04 3_2 | 5 | −3.42 | 44.51 | 80.0 | 20.0 | 0.225 |
| K04 4_3 | 19 | −28.19 | 22.58 | 94.7 | 5.3 | <0.001 |
| K04 4_4 | 5 | +6.22 | 8.53 | 0.0 | 100.0 | 0.043 |
| K05 2_1 | 163 | −4.55 | 19.11 | 60.1 | 39.9 | 0.012 |
| K05 3_2 | 427 | +26.19 | 9.44 | 0.7 | 99.3 | <0.001 |
| K05 4_3 | 86 | +6.95 | 20.31 | 25.6 | 74.4 | <0.001 |
| Movement | Baseline Class (±10%, 70%) | Stability Across Tested Threshold Combinations | Notes |
|---|---|---|---|
| K01 1_4 | Flattened | Sensitive to threshold choice | Shifts to mixed under stricter thresholds |
| K01 2_1 | Tightened | Stable across all tested combinations | stable |
| K01 4_3 | Tightened | Stable across all tested combinations | Stable |
| K02 2_1 leftmost | Mixed | Stable across all tested combinations | Stable |
| K02 1_2 | Flattened | Sensitive to threshold choice | Shifts to mixed under stricter thresholds |
| K02 2_1 | Mixed | Sensitive to threshold choice | Borderline; shifts from mixed under more permissive thresholds |
| K03 1_2 | Mixed | Stable across all tested combinations | Stable |
| K03 2_1 | Mixed | Sensitive to threshold choice | Borderline; shifts from mixed under more permissive thresholds |
| K04 1_1 | Mixed | Sensitive to threshold choice | Borderline; shifts from mixed under more permissive thresholds |
| K04 1_4 | Mixed | Stable across all tested combinations | Stable |
| K04 2_1 | Mixed | Stable across all tested combinations | Stable |
| K04 3_2 | Mixed | Stable across all tested combinations | Stable |
| K04 4_3 | Flattened | Stable across all tested combinations | Stable |
| K04 4_4 | Mixed | Sensitive to threshold choice | Borderline; shifts from mixed under more permissive thresholds |
| K05 2_1 | Mixed | Stable across all tested combinations | Stable |
| K05 3_2 | Tightened | Stable across all tested combinations | Stable |
| K05 4_3 | Mixed | Sensitive to threshold choice | Borderline; shifts from mixed under more permissive thresholds |
| Movement | Baseline Median CDP (%) | Entry-Longer Median CDP (%) | Exit-Longer Median CDP (%) | Baseline Class | Classification Change? |
|---|---|---|---|---|---|
| K01 4_3 | +36.85 | +38.35 | +36.85 | Tightened | No |
| K04 4_3 | −41.80 | −31.15 | −47.33 | Flattened | No |
| K04 1_4 | +2.53 | −2.83 | +4.86 | Mixed | No |
| K05 2_1 | −5.41 | −11.75 | −5.41 | Mixed | Yes (to flattened under entry-longer variant) |
Disclaimer/Publisher’s Note: The statements, opinions and data contained in all publications are solely those of the individual author(s) and contributor(s) and not of MDPI and/or the editor(s). MDPI and/or the editor(s) disclaim responsibility for any injury to people or property resulting from any ideas, methods, instructions or products referred to in the content. |
© 2026 by the authors. Licensee MDPI, Basel, Switzerland. This article is an open access article distributed under the terms and conditions of the Creative Commons Attribution (CC BY) license.
Share and Cite
Lemonakis, P.; Anagnostopoulos, A.; Kehagia, F.; Zorba, V.; Michopoulos, K.; Manthos, E. Curvature-Based Assessment of Left-Turn Trajectories at Urban Intersections Using Video-Extracted Vehicle Paths. Sustainability 2026, 18, 6974. https://doi.org/10.3390/su18146974
Lemonakis P, Anagnostopoulos A, Kehagia F, Zorba V, Michopoulos K, Manthos E. Curvature-Based Assessment of Left-Turn Trajectories at Urban Intersections Using Video-Extracted Vehicle Paths. Sustainability. 2026; 18(14):6974. https://doi.org/10.3390/su18146974
Chicago/Turabian StyleLemonakis, Panagiotis, Apostolos Anagnostopoulos, Fotini Kehagia, Victoria Zorba, Konstantinos Michopoulos, and Evangelos Manthos. 2026. "Curvature-Based Assessment of Left-Turn Trajectories at Urban Intersections Using Video-Extracted Vehicle Paths" Sustainability 18, no. 14: 6974. https://doi.org/10.3390/su18146974
APA StyleLemonakis, P., Anagnostopoulos, A., Kehagia, F., Zorba, V., Michopoulos, K., & Manthos, E. (2026). Curvature-Based Assessment of Left-Turn Trajectories at Urban Intersections Using Video-Extracted Vehicle Paths. Sustainability, 18(14), 6974. https://doi.org/10.3390/su18146974