1. Introduction
Sustainable product design plays a central role in addressing pressing global challenges such as climate change, resource scarcity, and environmental degradation [
1,
2]. To support sustainable design decisions, engineers and designers increasingly rely on tools such as Life Cycle Assessment (LCA) and Life Cycle Costing (LCC), which provide an assessment of a product’s environmental and economic impacts throughout its life cycle [
3,
4]. However, turning these multi-dimensional data into actionable decisions often involves navigating complex trade-offs, a challenge that traditional evaluation approaches struggle to handle effectively [
5]. For example, the use of lightweight composite materials in transportation design can reduce fuel consumption (and thus greenhouse gas emissions) but often comes at the cost of higher energy demand and emissions during manufacturing, making the environmental benefit less straightforward [
6].
Multi-Criteria Decision-Making (MCDM) methods are frequently used to support tradespace navigation by organizing multiple criteria into a transparent ranking or selection process [
7,
8]. However, MCDM outcomes are strongly influenced by the way criteria weights are determined [
9]. In general, weighting methods fall into two categories: subjective weighting, which captures stakeholder preferences, such as those expressed through the Analytic Hierarchy Process (AHP), and objective weighting, which derives weights from data characteristics, as in the CRITIC method CRiteria Importance Through Intercriteria Correlation (CRITIC) method [
10,
11]. Each approach has its strengths and limitations. Subjective methods incorporate expert or user values, making the process context-sensitive [
12], but can suffer from inconsistency and bias, especially when the number of criteria increases [
13]. Objective methods avoid these issues by using mathematical relationships within the data, but may overlook important human-centered value judgments [
11,
14]. In sustainability applications, where decisions can significantly affect communities, ecosystems, and long-term economic outcomes, understanding the differences and implications of these two approaches is critical [
15,
16].
Prior studies have shown that weighting choices and ranking procedures can significantly influence MCDM results [
16,
17]. Comparative studies in broader domains, including sustainable energy planning and site selection, have reported that subjective and objective approaches can yield different rankings depending on the weighting scheme, attribute set, and ranking method employed [
18]. These studies are valuable in demonstrating the sensitivity of MCDM outcomes to methodological choices, but they are typically framed as broad benchmarking or integrated-comparison exercises across many methods and alternatives. By contrast, consumer product designers often face a narrower problem: selecting among feasible configurations within a fixed product architecture, where component-level material and process decisions generate tractable environmental and economic trade-offs during design. That narrower design context warrants a focused comparison between representative MCDM approaches using the same product dataset and the same set of feasible alternatives.
This study addresses that need by comparing two contrasting MCDM approaches within a consumer-product design problem: AHP as a stakeholder-driven method and the CRITIC–TOPSIS workflow as a data-driven method. The case study focuses on electric bicycles (e-bikes), a product category in which component and material choices meaningfully affect both environmental impact and life cycle cost [
19,
20]. Four component categories were varied: frame material (steel, aluminum, carbon fiber) [
21], battery type (lithium-ion, nickel-metal hydride) [
22], tire material (natural rubber, synthetic rubber) [
23], and coating method (liquid paint, powder coating) [
24]. A full-factorial combination of these options generated 24 feasible e-bike configurations, each representing a candidate design alternative within the same product architecture.
Each configuration was assessed using LCA, applying the ReCiPe Midpoint (H) method to capture 18 indicators of environmental impact [
25]. LCC was also conducted to estimate total life cycle costs [
26]. The AHP method was applied to a subset of five environmental indicators using pairwise comparison surveys of stakeholders, while the CRITIC-TOPSIS method was applied in two rounds: first, using the same five indicators for a direct comparison with AHP, and second, using all 18 environmental indicators to evaluate the sensitivity of the rankings to the selection of indicators.
Finally, to assess the robustness of the AHP-derived results, a one-at-a-time (OAT) sensitivity analysis was conducted on the top-level criteria weights (environmental and economic). This analysis involved systematically varying the criterion weights by ±10%, while proportionally rescaling the remaining weights to maintain normalization, following established practices in AHP-based sensitivity analysis [
27]. The resulting rank variations provide information on how stable the rankings are under changing stakeholder priorities.
The scientific contribution of this study is not limited to producing a ranked list of e-bike configurations. Rather, the study generates new knowledge about how stakeholder-driven and data-driven weighting approaches translate the same environmental and economic life-cycle evidence into design recommendations. First, the results show that high overall agreement among MCDM methods can coexist with meaningful rank shifts among individual alternatives. Second, the comparison demonstrates that AHP and CRITIC–TOPSIS encode different decision logics: AHP preserves stakeholder-valued sustainability priorities, whereas CRITIC–TOPSIS emphasizes criteria that provide high contrast and low redundancy within the decision matrix. Third, the study shows that disagreement between the two approaches can be used diagnostically to identify alternatives whose desirability is sensitive to stakeholder values, indicator scope, or data uncertainty. These findings provide a transferable interpretation framework for sustainable product-design decisions in which environmental and economic evidence must be translated into early-stage configuration choices.
2. Background
The design of sustainable products involves navigating complex trade-offs between environmental and economic considerations [
28]. To effectively address these trade-offs, structured evaluation frameworks are essential [
29]. This section outlines LCA and LCC as the analytical basis for evaluating environmental and economic performance and then situates the selected MCDM approaches within the broader decision-method landscape.
2.1. Life Cycle Assessment (LCA) Background
LCA is the most widely used method to quantify the environmental impacts of products and systems [
30]. LCA evaluates potential environmental effects at all stages of the life cycle of a product, from raw material extraction to manufacturing, use, and end-of-life disposal [
29]. The ISO 14040 standard outlines the principles and framework for conducting LCA, ensuring consistency, transparency, and comparability between studies [
29].
In this study, the ReCiPe Midpoint (H) method was applied to evaluate 18 environmental impact categories, providing a detailed analysis of potential burdens across multiple dimensions [
25]. These categories include global warming potential (GWP), particulate matter formation (PMFP), terrestrial ecotoxicity (TETP), water depletion (WDP), mineral resource depletion (MDP), and others. This robust set of indicators enables a thorough understanding of the environmental trade-offs associated with different material and technology choices in e-bike design.
2.2. Life Cycle Costing (LCC) Background
LCC complements environmental analysis by providing a systematic evaluation of the total costs associated with a product throughout its life cycle [
31]. LCC includes costs related to material acquisition, manufacturing, use-phase operation, and end-of-life disposal or recycling [
26]. By quantifying these costs, LCC enables designers and decision-makers to assess the economic feasibility of alternative design choices alongside their environmental impacts [
29].
2.3. MCDM in Sustainability
Sustainability-related decisions often involve the evaluation of multiple conflicting criteria, such as environmental impact versus economic cost [
15,
32]. MCDM methods provide a systematic way to compare and rank alternatives in complex scenarios [
16]. These methods are especially valuable in product design contexts where trade-offs must be clearly understood and justified [
15]. MCDM techniques vary according to how criteria weights are assigned and how alternatives are ranked. Subjective methods rely on stakeholder input, while objective methods use data-driven approaches [
33].
Developed by Thomas Saaty in the 1970s [
34], AHP is one of the most widely used subjective MCDM methods. AHP allows for structured decision-making by capturing the relative importance of decision criteria through pairwise comparisons, transforming qualitative judgments into quantitative weights.
To illustrate the diversity of available MCDM approaches,
Table 1 provides an overview of commonly used methods [
35]. These include subjective methods such as AHP and Analytic Network Process (ANP), which rely heavily on expert judgment, as well as objective methods such as Simple Additive Weighting (SAW) and Weighted Product Model (WPM), which use data-driven weighting schemes. Hybrid approaches such as the Technique for Order Preference by Similarity to Ideal Solution (TOPSIS) and VlseKriterijumska Optimizacija I Kompromisno Resenje (VIKOR) seek to balance subjective preferences and objective indicators.
MCDM methods are instrumental in systematically evaluating multiple conflicting sustainability criteria. These methods facilitate structured and transparent assessments, critical for effective decision-making in multi-dimensional sustainability contexts [
36]. Several established MCDM methods are widely employed, each offering distinct advantages and applicability, as summarized in
Table 1.
Table 1 provides an overview of the prominent MCDM methods, categorized by their subjectivity, rank type, and suitability for various decision-making scenarios. Rank type refers to the way alternatives are ordered or prioritized based on evaluation outcomes: Full ranking generates a complete, ordered list of alternatives, while partial ranking or outranking methods identify subsets of preferable options without forcing a total order. For example, subjective methods such as AHP and ANP rely on stakeholder judgments, making them suitable for structured hierarchical problems and interrelated criteria. Objective methods such as SAW and WPM leverage quantitative data, thus minimizing stakeholder bias. Hybrid methods such as TOPSIS and VIKOR balance both subjective and objective considerations, often used when seeking compromise solutions.
2.4. Selection of Methods for This Study
This study focuses specifically on two MCDM methods: AHP and the CRITIC-TOPSIS approach. The selection of these methods was not arbitrary, but was guided by their fundamental differences, complementary strengths, and suitability to address the objectives of this research.
AHP and CRITIC-TOPSIS represent two major schools of thought in MCDM: subjective and objective weighting approaches, respectively. This distinction aligns with the primary research goal of this study, which is to compare how subjective stakeholder preferences and objective, data-driven weights influence decision outcomes in sustainability-focused product design.
Several other MCDM methods, such as VIKOR, PROMETHEE, and ELECTRE, were considered. However, these methods often operate within the same subjective weighting paradigm as AHP, relying on stakeholder inputs or preference functions. While valuable in specific contexts, they would not provide a fundamentally different perspective on the weighting process compared to AHP [
37]. Therefore, including them would have resulted in redundant comparisons rather than new insights into the core research question.
However, objective weighting methods such as entropy, Standard Deviation, and CRITIC offer a contrasting perspective by relying solely on the data’s mathematical properties. Among these, CRITIC was chosen because it considers both the standard deviation (representing the contrast intensity of criteria) and the correlation among criteria, making it a more robust approach for objective weighting than methods like Entropy, which only consider variability [
11,
38].
In the CRITIC–TOPSIS framework, CRITIC is first used to calculate the objective weights of the criteria by analyzing both their variability and inter-criterion correlation. These weights are then applied in the TOPSIS method, which ranks the alternatives based on their geometric distance from both an ideal and a negative-ideal solution. This integration ensures that the ranking reflects both the internal structure of the data and the performance of the alternatives on all weighted criteria [
9].
TOPSIS was selected as the ranking method to pair with CRITIC because it is widely recognized, interpretable, and suitable for handling complex multi-criteria problems [
39]. It ranks alternatives based on their proximity to an ideal solution, aligning with the goal of identifying optimal trade-offs in sustainability assessments [
40].
In summary, AHP and CRITIC-TOPSIS were deliberately selected to represent the two fundamental approaches to MCDM: subjective versus objective. Their application allows for a meaningful comparison of how stakeholder-driven and data-driven weighting strategies affect sustainability decisions in product design. This targeted comparison addresses a key gap in the literature [
33].
2.5. Importance of Comparing Subjective vs. Objective Methods
In sustainability-focused product design, the method used to assign criteria weights plays a pivotal role in shaping decision outcomes [
15]. Subjective and objective weighting approaches each bring distinct advantages and trade-offs, and understanding these differences is crucial for developing reliable and transparent decision-making frameworks [
41].
Subjective methods, such as AHP, are valuable to capture stakeholder knowledge, preferences, and context-specific insights [
15,
34]. These methods allow decision makers to incorporate expert judgments or user values, making them highly relevant for participatory design processes [
42]. In sustainability contexts, this is particularly important because many criteria, such as ethical considerations, user comfort, or long-term environmental responsibility, are not easily quantifiable and benefit from stakeholder input [
43]. AHP helps structure this input by enabling pairwise comparisons of criteria using a standardized scale, which transforms qualitative opinions into quantifiable priorities [
10]. This makes it easier to reflect real-world perspectives in a systematic and transparent way [
41].
However, subjective methods face several challenges. As the number of criteria increases, the number of pairwise comparisons increases rapidly, leading to increased respondent burden and potential fatigue [
10]. For example, comparing just five criteria requires ten comparisons, while ten criteria require forty-five. This can make the process time-consuming and cognitively demanding, especially for participants who are not familiar with the method [
44]. In addition, the quality of the results is highly dependent on the consistency of the responses. Inconsistent judgments may lead to unreliable weight calculations, and even when consistency checks such as the Consistency Ratio (CR) are used, they may not fully eliminate subjective bias [
34]. Responses can also be influenced by individual background and experience levels. Moreover, subjective methods may lack reproducibility, as different stakeholder groups could produce different results in the same problem setup [
45]. Despite these limitations, subjective methods remain essential when stakeholder perspectives are critical to ensuring relevant, inclusive, and socially informed decision-making [
43].
In contrast, objective methods such as CRITIC (CRiteria Importance Through Intercriteria Correlation), first proposed by Diakoulaki et al. (1995), determine criteria weights based on the intrinsic properties of the data, specifically the variability (standard deviation) of each criterion and the correlation between criteria [
11]. These methods eliminate the need for stakeholder input, offering scalability, repeatability, and consistency. However, they may overlook important qualitative factors that stakeholders consider essential, such as equity, long-term impact, or user acceptability [
43].
Several studies have explored how different ways of assigning weights can affect the results of MCDM. For example, Ponhan et al. [
33] compared five weighting methods: three subjective (direct rating, rank order centroid and rank sum) and two objective (entropy and standard deviation) in an industrial site selection study using fuzzy TOPSIS. Another study by Sahin [
18] compared sustainable energy options by combining six weighting methods, covering both subjective (e.g., AHP) and objective (e.g., CRITIC, Entropy), with seven MCDM techniques. Their results showed that rankings varied depending on whether subjective or objective weighting was applied, underscoring the importance of carefully selecting a weighting approach in sustainability-focused decision-making.
Although these studies show that weighting methods can strongly influence decisions, there is still limited research directly comparing subjective and objective approaches using the same problem and dataset. This study aims to fill that gap by systematically comparing two widely used MCDM methods: the Analytic Hierarchy Process (AHP), which uses stakeholder input to assign weights, and the CRITIC-TOPSIS method, which relies on data characteristics such as variability and correlation to assign weights objectively.
Although this research uses the example of selecting components and materials from electric bikes, the focus is not just on that specific product. Instead, the main goal is to understand more generally how the choice between subjective (stakeholder-driven) and objective (data-driven) weighting methods affects the final ranking of alternatives and decision-making processes. By comparing these two approaches directly, this study provides practical insight for engineers, designers, and decision-makers involved in sustainability-related projects, especially where the balance between quantitative data and stakeholder preferences is essential.
3. Methods
To allow a structured comparison of subjective and objective weighting methods in the context of sustainability-focused product design, we designed and analyzed a case study focused on material selection for electric bikes. This section outlines the methodological framework used to conduct the sustainability assessment, including the definition of design alternatives, the application of LCA and LCC, and the use of AHP and CRITIC-TOPSIS for MCDM. Finally, a sensitivity analysis was conducted to evaluate the robustness of the ranking results with respect to changes in environmental and economic weighting preferences.
3.1. Design Components and Alternatives
To evaluate sustainability trade-offs in product design, electric bikes were chosen as the focus of this study. Although electric bikes are often promoted as a lower-emission mobility option, this benefit is context-dependent. Their net environmental advantage is realized primarily when they replace higher-emission modes of transport, such as cars or motorcycles. In contrast, if e-bikes substitute for walking or traditional bicycles, the overall emissions may increase due to the added material and manufacturing requirements. This study does not model mode-shift behavior directly; however, the e-bike platform provides a relevant context for comparing material and design choices, as it represents a growing product category with diverse sustainability trade-offs.
To capture these differences, four components of the e-bike were identified for variation in this analysis: frame material, battery type, tire material, and coating method. These components were selected based on their influence on both the life cycle impact and cost of the product, as well as their prevalence in current e-bike manufacturing practices. To structure component selection, the four categories chosen and their respective options are listed in
Table 2 below.
Each of these options contributes differently to environmental impact and life cycle cost, making them suitable candidates for evaluating design trade-offs.
3.2. Generation of Design Configurations
To evaluate design trade-offs across multiple sustainability criteria, a total of 24 e-bike configurations were generated using a full-factorial combination of the component options listed in
Table 3. Each configuration consists of one frame material, one battery type, one tire material, and one coating method. This approach ensures that all feasible combinations within the selected component design space are systematically evaluated while maintaining a fixed product architecture.
To improve readability in the
Section 4 and figures, each configuration was assigned a descriptive abbreviation based on its component selections. The abbreviation structure is as follows: frame material (SF = steel frame, AF = aluminum frame, CF = carbon fiber frame), battery type (LI = lithium-ion, NM = nickel–metal hydride), tire material (NR = natural rubber, SR = synthetic rubber), and coating method (LP = liquid paint, PC = powder coating). For example, SF-LI-NR-LP represents a configuration with a steel frame, lithium-ion battery, natural rubber tires, and liquid paint coating.
Table 3 lists all 24 configurations evaluated in this study.
The resulting 24 configurations form the set of alternatives evaluated using the LCA, LCC, AHP, and CRITIC–TOPSIS methods described in the following sections. Component-level environmental impact and life cycle cost data were compiled from Ecoinvent datasets [
46], the reference bike-sharing case study [
47], supplier information, market estimates, and proportional scaling assumptions, as described in
Section 3.3 and
Section 3.4. Using a structured data-processing workflow, the environmental and economic values associated with each frame, battery, tire, and coating option were aggregated to determine the total impact of each configuration. These aggregated values formed the decision matrix used in the subsequent MCDM analyses.
3.3. Life Cycle Assessment (LCA)
This study uses LCA to quantify the environmental impacts of the e-bike design alternatives. The assessment follows a cradle-to-grave system boundary, encompassing raw material extraction, component manufacturing, use, and end-of-life stages. The functional unit is defined as one complete electric bicycle in its expected operational life of 15,000 km [
47]. All configurations were assigned the same use profile, charging behavior, and end-of-life assumptions so that rank differences were driven by the varied components: frame material, battery type, tire material, and coating method.
The environmental modeling was carried out in OpenLCA. A publicly available bike-sharing case study was used as a reference point for developing the LCA framework in this work [
47]. Specifically, that case study informed the overall product context, system boundaries, and general modeling assumptions used to represent a bicycle-based system.
Building on that reference framework, this study focused on varying four component categories within the e-bike architecture: frame material, battery type, tire material, and coating method. These component substitutions defined the experimental design space and produced the 24 feasible e-bike configurations analyzed in this study. In this way, the reference case study provided a consistent modeling basis, while the present analysis examined how changes in selected components influenced environmental performance across alternatives.
Inventory inputs for the varied components were compiled from [
47], Ecoinvent v3.4 datasets, and representative engineering assumptions, depending on data availability. Tire masses were aligned with values reported in the reference case study, while other component values were assigned using literature values, proportional scaling, and Ecoinvent-based process data to maintain internal consistency across all configurations. These inputs are summarized in
Table 4.
Environmental impacts were quantified using the ReCiPe Midpoint (H) method, as implemented in OpenLCA 2.1. The exported impact categories followed the ReCiPe 2008 midpoint category structure. The analysis was conducted at the component level so that the contribution of each material and process could be tracked independently. The total environmental footprint for each of the 24 e-bike configurations was then calculated by aggregating the impacts associated with the selected frame, battery, tire, and coating combination.
The use phase was modeled using a global average electricity mix with a total consumption of 0.6 kWh per full charge cycle, assuming typical urban commuting conditions. End-of-life processes were modeled using standard recycling rates for metals and polymer components to preserve consistency across all configurations. The resulting LCA outputs served as the environmental criteria inputs for the subsequent MCDM analysis.
3.4. Life Cycle Costing (LCC)
To evaluate the economic performance of each e-bike configuration, a Life Cycle Costing (LCC) analysis was conducted in parallel with the LCA. LCC quantifies the total cost associated with a product over its entire life cycle, including material acquisition, manufacturing, use-phase expenses, maintenance, and end-of-life processing. This economic analysis complements the environmental assessment and enables assessment of economic and environmental impact trade-offs.
Cost data were collected at the component level to maintain alignment with the LCA framework. For the frame, tire, and coating processes, cost estimates were derived from Ecoinvent datasets, supplier information, and market averages. Battery prices were updated using publicly available retail data for modern e-bike battery packs, since [
47] study does not provide a detailed cost model. When specific cost information was unavailable, proportional scaling was applied based on material density, production energy requirements, or market price differentials. This approach ensures methodological transparency while providing realistic and comparable cost estimates.
Table 5 summarizes the representative input costs used for the LCC. All values are expressed in 2024 U.S. dollars and correspond to material and process costs per e-bike (excluding distribution and retail margins).
Based on these component-level values, the total life cycle cost for the 24 e-bike configurations ranged from approximately $518 to $805 per unit. This range reflects the influence of both material selection and battery technology, with the battery pack contributing the largest share of total cost.
Use-phase electricity consumption and end-of-life costs were excluded from the comparative ranking. Although roundtrip efficiency and cycle life differ between Li-ion and NiMH batteries, preliminary calculations showed that use-phase electricity costs are small relative to material and manufacturing expenses. Because the same use-phase assumptions were applied uniformly across configurations, excluding common electricity costs is not expected to affect the broad relative ranking structure. However, component-specific use-phase or end-of-life differences, such as battery replacement frequency, efficiency differences, recycling credits, or disposal costs, could affect the exact ordering of adjacent alternatives.
The resulting economic criterion should therefore be interpreted as a component-level LCC proxy rather than a complete ownership-cost model. Under the common use profile applied in this study, adding an identical use-phase electricity cost to all configurations would shift absolute costs but would not change the relative cost ordering. Similarly, a uniform end-of-life fee or disposal cost would not affect the ranking. These terms were therefore excluded to maintain focus on component-level design differences and avoid introducing uncertain cost estimates that would be common across alternatives. However, use-phase and end-of-life costs could affect rankings if they were to vary significantly by component choice.
The resulting LCC values were integrated into the same decision matrix as the LCA-derived environmental indicators, serving as the economic criterion in the MCDM analysis.
To integrate the economic impacts with the environmental impact, two different approaches were used based on the MCDM method. AHP allows for a hierarchy or categorization of the variables using criteria and sub-criteria. Environmental and economic impacts were both treated as criteria, with their relevant indicators treated as sub-criteria. The CRITIC-TOPSIS approach treated all economic and environmental indicators at the same level and allowed the method to determine the weights between all the indicators.
3.5. Analytic Hierarchy Process (AHP)
To integrate stakeholder preferences into the sustainability assessment, AHP was used as the subjective MCDM method. AHP is a well-established decision-making technique that enables the structuring of complex problems into a hierarchy and quantifies the relative importance of criteria through pairwise comparisons [
34].
3.5.1. Indicators Selection
In this study, AHP focused on five environmental indicators selected from the ReCiPe Midpoint (H) method. These indicators were selected based on four considerations: (1) relevance to the design variables varied in this study, namely frame material, battery type, tire material, and coating process; (2) coverage of distinct sustainability mechanisms, including climate effects, air-quality-related health effects, ecotoxicity, water use, and mineral resource depletion; (3) interpretability for engineering and sustainability stakeholders who may not be LCA specialists; and (4) feasibility for pairwise-comparison elicitation. Because AHP requires
pairwise comparisons, using all 18 ReCiPe midpoint indicators would have required 153 comparisons per respondent, which was judged likely to reduce response quality, consistency, and the likelihood of respondents completing the survey. The selected five indicators therefore represent a reduced but interpretable subset of the full ReCiPe results rather than a claim that the remaining indicators are unimportant. The selected indicators and their corresponding units are presented in
Table 6. These indicators collectively capture key environmental dimensions relevant to the selection and manufacturing of bike materials. All environmental indicators and net cost were treated as cost-type criteria, meaning that lower values indicate preferable performance.
3.5.2. Survey Design and Data Collection
To capture stakeholder preferences, a structured online survey was developed using the standard 1–9 AHP comparison scale. The participants evaluated the relative importance of each pair of the five environmental criteria listed in
Table 6. Clear instructions and an example comparison were provided at the beginning of the survey to ensure a consistent interpretation of the scale. Respondents were asked to consider long-term environmental implications relevant to sustainable e-bike design rather than short-term performance or cost.
The survey was distributed primarily to engineering graduate students who had received prior training in sustainability assessment and LCA, with a small number of additional responses recruited through professional engineering and sustainability contacts. This respondent pool was selected because the AHP task required participants to compare environmental impact categories, interpret trade-offs among LCA indicators, and make consistent pairwise judgments. The responses were collected anonymously. As a result, individual-level demographic variables such as age, gender, geographic background, sector, and detailed professional experience were not retained. Therefore, the respondent pool should be interpreted as a trained engineering convenience sample rather than a representative sample of e-bike consumers, practicing industry engineers, or the general public.
A total of 23 complete responses were received. For each response, a pairwise comparison matrix was constructed and evaluated using the Consistency Ratio (CR). Following standard AHP guidelines, matrices with CR were considered acceptably consistent. Of the 23 surveys submitted, 20 met this consistency threshold and were retained for further analysis. The three inconsistent responses were excluded entirely rather than adjusted or corrected to preserve the integrity of the aggregated preference results.
The resulting set of 20 consistent matrices formed the input for subsequent aggregation and weight derivation.
3.5.3. Weight Calculation and Consistency Check
After data collection, we used the AHPy library in Python 3.12 to implement the AHP methodology [
48].
Step 1: Construct the Pairwise Comparison Matrix
Each stakeholder’s responses were used to build a reciprocal Pairwise Comparison Matrix (PCM), where each element
denotes the importance of criterion
i over criterion
j on a scale of 1 to 9. The matrix structure is shown in Equation (
1):
Step 2: Normalize the Matrix and Calculate Priority Weights
Each element
of the pairwise comparison matrix is divided by the sum of its column to normalize the matrix. The relative importance or priority weight for each criterion, denoted as
, is obtained by averaging the entries in the
ith row of the normalized matrix:
Step 3: Compute the Consistency Index (CI)
To assess the consistency of stakeholder judgments, the Consistency Index (CI) is computed based on the principal eigenvalue
of the comparison matrix:
Step 4: Compute the Consistency Ratio (CR)
The Consistency Ratio (CR) is calculated by dividing the CI by the Random Consistency Index (RI), which depends on the size of the matrix
n:
Only pairwise comparison matrices with CR values less than or equal to 0.1 were deemed consistent and retained for further aggregation and analysis.
Step 5: Aggregate Final Weights
The accepted matrices were aggregated using the geometric mean method, following the Aggregation of Individual Judgments (AIJ) approach proposed by Forman and Peniwati [
49]. This produces a single consensus pairwise comparison matrix from which a unified weight vector is derived. The resulting vector was normalized to ensure the weights sum to 1. These final weights reflect stakeholder preferences and were used in the MCDM analysis to evaluate the environmental performance of each configuration of e-bikes.
3.5.4. AHP Final Sustainability Ranking
For each environmental indicator, the raw value
for configuration
i and criterion
j was normalized using the following cost-type min–max transformation:
where
is the value of environmental criterion
j for configuration
i, and
and
are the maximum and minimum values of criterion
j across the 24 configurations. This transformation assigns a value of 1 to the configuration with the lowest impact for a given criterion and a value of 0 to the configuration with the highest impact.
The stakeholder-weighted environmental score for each configuration was then calculated as
where
is the environmental score for configuration
i,
is the AHP-derived weight for environmental sub-criterion
j, and
is the normalized performance value for that criterion. The five environmental sub-criteria were climate change, terrestrial ecotoxicity, particulate matter formation, water depletion, and metal depletion.
Net cost was normalized using the same cost-type transformation:
where
is the normalized economic score for configuration
i,
is the net cost of configuration
i, and
and
are the maximum and minimum net costs across all configurations.
The final AHP-based sustainability score was calculated by combining the environmental and economic scores using the top-level AHP weights:
where
is the final sustainability score for configuration
i,
is the top-level weight assigned to environmental performance, and
is the top-level weight assigned to economic performance. In this study, the top-level weights were
and
.
Configurations were ranked in descending order of , where higher values indicate better combined environmental–economic performance. This final ranking therefore represents a cost-aware, stakeholder-informed evaluation of the e-bike design alternatives under the selected AHP hierarchy, normalization approach, and weighting structure.
3.6. CRITIC-TOPSIS Method
To provide an objective alternative to stakeholder-based evaluation, the CRITIC-TOPSIS method was used. This hybrid approach combines the CRITIC (CRiteria Importance Through Intercriteria Correlation) method for objective weight determination with the TOPSIS (Technique for Order Preference by Similarity to Ideal Solution) method for ranking alternatives [
11]. The method was applied twice, once with five environmental indicators and again with all 18 ReCiPe midpoint indicators, to assess the influence of dimensionality on ranking. In this study, all LCA indicators and net cost were treated as cost-type criteria; therefore, the TOPSIS positive ideal solution corresponds to the minimum weighted-normalized value for each criterion, and the negative ideal solution corresponds to the maximum weighted-normalized value.
3.6.1. CRITIC Weighting Method
The CRITIC method assigns weights to criteria based on their statistical characteristics, specifically their intensity of contrast and their conflict (or independence) with other criteria. This allows for the calculation of objective weights without requiring stakeholder input.
To clarify the notation used in this method, let denote the value of the jth criterion for the ith alternative, where alternatives and criteria.
Before applying the CRITIC calculations, a small illustrative excerpt of the non-normalized decision matrix is shown in
Table 7. This example (three alternatives and two criteria) is provided for transparency and to walk through the computation process, while the full method was applied to all 24 e-bike configurations.
This excerpt is only for illustrating the CRITIC computation steps; the full analysis used all environmental or economic indicators depending on the scenario.
Step 1: Min–max normalization.
Each criterion is normalized using the min–max method in Equation (
9):
For example, for the GWP100 value of A1:
Step 2: Compute standard deviation.
Step 3: Compute correlation matrix.
Step 4: Compute information content.
Step 5: Compute objective weights.
The resulting weights reflect the discriminating power and independence of each criterion. These CRITIC-derived weights are then used as inputs for the TOPSIS ranking procedure.
3.6.2. TOPSIS Ranking Procedure
The TOPSIS method ranks alternatives based on their geometric distance from two reference points: the positive ideal solution (which maximizes benefit and minimizes cost) and the negative ideal solution (which minimizes benefit and maximizes cost). The closer an alternative is to the ideal solution, the better its overall performance.
The ranking process involves the following steps:
Step 1: Normalize the Decision Matrix. To begin with, the original decision matrix is normalized using vector normalization. This transformation removes unit dependence and brings all data into a comparable scale. Each element
is divided by the square root of the sum of squares for its corresponding column, as shown in Equation (
14):
Step 2: Construct the Weighted Normalized Decision Matrix. Next, the normalized matrix is weighted using the objective weights
obtained from the CRITIC method. Each entry in the normalized matrix is multiplied by the corresponding weight, as given in Equation (
15):
Step 3: Determine the Ideal and Negative-Ideal Solutions. The ideal solution
consists of the best values across all alternatives for each criterion, while the negative-ideal solution
consists of the worst values. For benefit criteria, the ideal value is the maximum and, for cost criteria, it is the minimum. These are mathematically defined in Equations (
16) and (
17):
Step 4: Calculate the Separation Measures. The Euclidean distance is used to quantify how far each alternative is from the ideal and negative-ideal solutions. This follows the standard TOPSIS formulation and implicitly assumes that the criteria space is Euclidean, an assumption commonly adopted in MCDM applications where criteria have been normalized. The separation measures are computed as
Step 5: Calculate the Closeness Coefficient. The closeness coefficient
is a ratio that compares the degree of proximity of an alternative to the ideal solution relative to its distance from ideal and negative-ideal solutions. A higher
value indicates better performance. It is computed using Equation (
20):
Step 6: Rank the Alternatives. Finally, the alternatives are ranked in descending order of . The configuration with the highest value is considered the best-ranked configuration under the modeled criteria.
This complete process was conducted using two sets of indicators, first with the same five environmental indicators used in the AHP analysis, and then with the 18 midpoint indicators of the ReCiPe method to assess how the dimensionality of the indicators influences the final rankings.
When applying TOPSIS with the full set of 18 ReCiPe midpoint indicators, it is important to note that several of these impact categories are not fully independent of each other. For example, many of the toxicity-related indicators share upstream processes and therefore tend to be correlated. In a strict mathematical sense, Euclidean distance assumes independent (orthogonal) dimensions, so using it directly on correlated indicators introduces some approximation.
In this study, the effect of correlated criteria is partially addressed using the CRITIC weighting method. Since CRITIC incorporates the correlation structure of the data when calculating weights, categories that are highly correlated with others naturally receive lower information content. As a result, redundant or closely related indicators have less influence when TOPSIS calculates distances. This does not completely eliminate correlation, but reduces its impact in a transparent and commonly used way within MCDM studies.
3.7. Sensitivity Analysis
To evaluate the robustness of the sustainability rankings obtained through the Analytic Hierarchy Process (AHP), a one-at-a-time (OAT) sensitivity analysis was conducted following established approaches in AHP-based decision analysis [
27]. OAT analysis systematically perturbs one input factor at a time while keeping others constant, allowing a clear assessment of how sensitive the final rankings are to variations in the relative importance of key criteria.
In this study, the top-level weights assigned to the two main sustainability criteria, environmental and economic, were perturbed by ±10%. When the weight of one criterion was adjusted, the other was proportionally rescaled to ensure that the weights summed to one. This procedure generated a set of alternative weighting scenarios that represent different stakeholder priorities between environmental performance and cost considerations.
For each perturbed scenario, the combined sustainability scores of all 24 configurations of the electric bikes were recalculated using the environmental weights derived from AHP and the economic criterion. The resulting rank profiles capture how sensitive the preferred design alternatives are to small variations in the environmental–economic weighting balance.
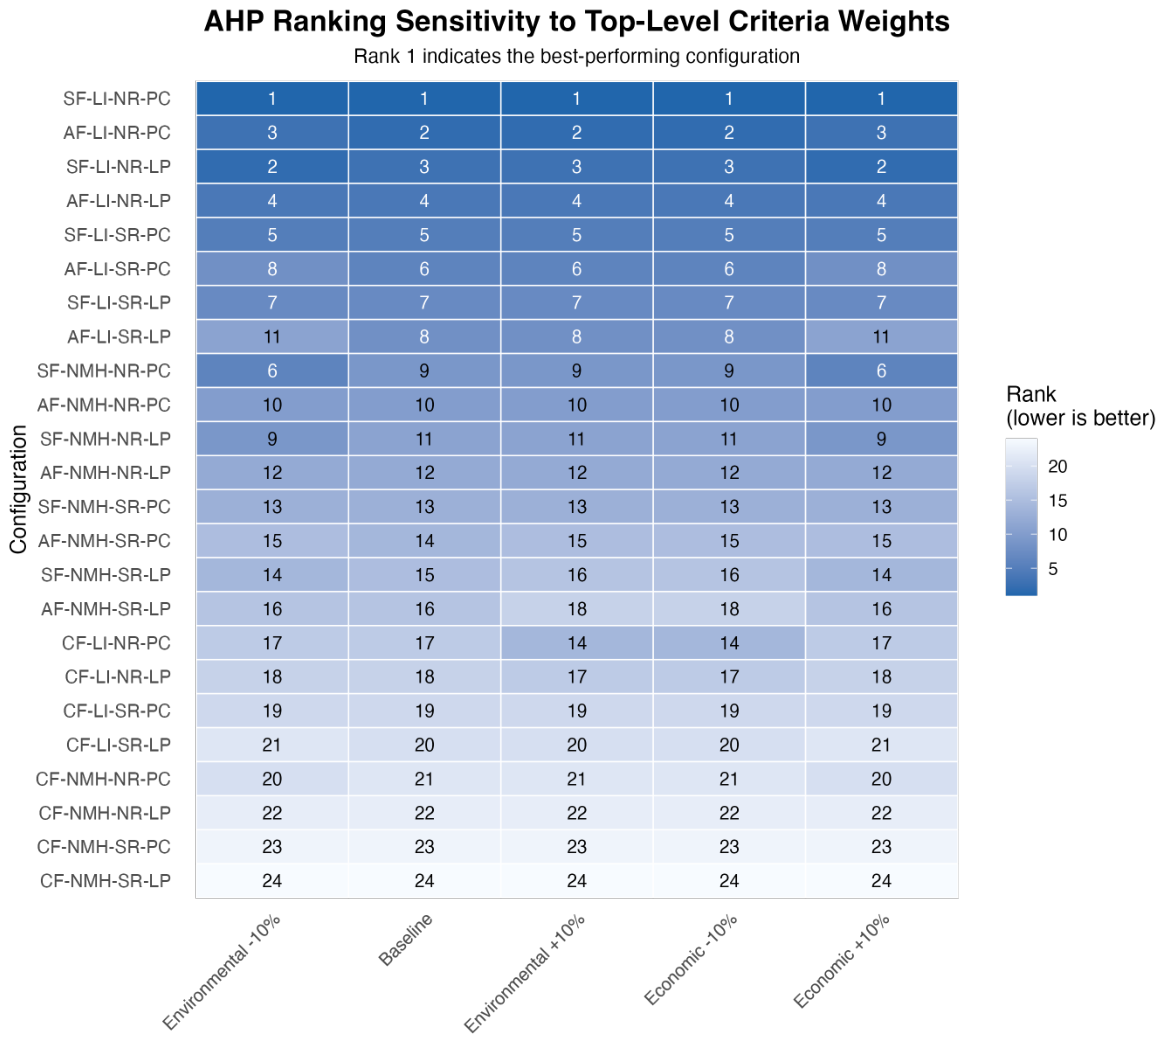
To aid in interpretation, the results were visualized as a rank heatmap, where rows represent e-bike configurations and columns represent each weighting scenario. Each cell displays the rank of a given configuration under a specific perturbation. Configurations that maintain similar ranks across scenarios indicate robust and stable performance, while large rank shifts highlight alternatives that are more sensitive to changes in stakeholder priorities.
Since the CRITIC–TOPSIS method determines criterion weights objectively from the data, no external perturbation was applied in that case.
3.8. Screening-Level Uncertainty Characterization
Because the available LCA and LCC data were used as deterministic inputs to the MCDM decision matrix, this study did not conduct a full probabilistic uncertainty analysis or rerun the underlying life-cycle inventory models. Instead, a screening-level uncertainty characterization was conducted to identify the main data sources, modeling assumptions, and interpretation risks that could affect the resulting rankings. This characterization focuses on uncertainty in the exported LCA/LCC decision matrix and its implications for ranking robustness, rather than on stochastic uncertainty propagation through the original LCA models.
The main uncertainty sources are summarized in
Table 8. These sources include database-derived process data, adapted literature values, proportional scaling assumptions, engineering estimates, market-derived cost data, battery-related assumptions, and operational factors that were simplified or held constant across configurations. The purpose of this table is to clarify how these assumptions should constrain interpretation of the rankings. In particular, small differences between adjacent alternatives should not be interpreted as definitive, whereas broader patterns across groups of configurations are more appropriate for design-stage interpretation.
4. Results
This section presents the findings from the application of AHP and CRITIC-TOPSIS methods to evaluate the sustainability rankings of 24 electric bike configurations. The analysis begins by examining the results derived from stakeholder-driven weighting using the Analytic Hierarchy Process (AHP), followed by objective rankings generated using the CRITIC-TOPSIS approach. Ultimately, a comparative analysis reveals the similarities and differences in the outcomes generated by these two Multi-Criteria Decision-Making (MCDM) approaches.
4.1. AHP Rankings Based on Stakeholder Preferences
The AHP approach was used to capture stakeholder priorities regarding key environmental concerns in electric bike design. By translating these preferences into numerical weights for five selected impact indicators, the method enabled the ranking of the 24 e-bike design configurations generated from the component combinations defined earlier. This ranking reflects how well each configuration aligns with stakeholder-valued environmental outcomes.
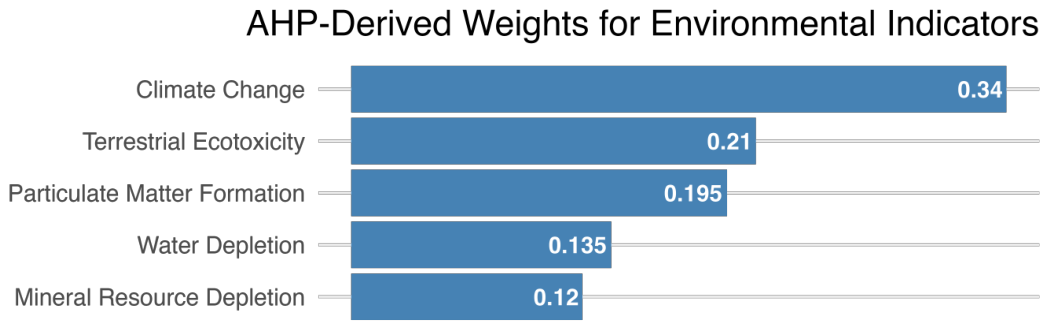
Stakeholder input was collected through pairwise comparisons using AHP, and weights were derived for the top level environmental-economic comparison and the five environmental impact indicators: climate change (GWP100), terrestrial ecotoxicity (TETPinf), particulate matter formation (PMFP), water depletion (WDP), and metal depletion (MDP). The top-level criteria weights were nearly equal, with 0.51 assigned to economic performance and 0.49 assigned to environmental performance. For the environmental sub-criteria, the greatest emphasis was placed on reducing greenhouse gas emissions, with climate change receiving the highest weight (approximately 0.34). Terrestrial ecotoxicity and particulate matter formation followed closely, while water and metal depletion were assigned lower importance (see
Figure 1).
These weights were then applied to the environmental impact values of each of the 24 e-bike configurations to compute a weighted environmental score. The weighted environmental score was combined with the weighted economic factor score according to standard AHP practices.
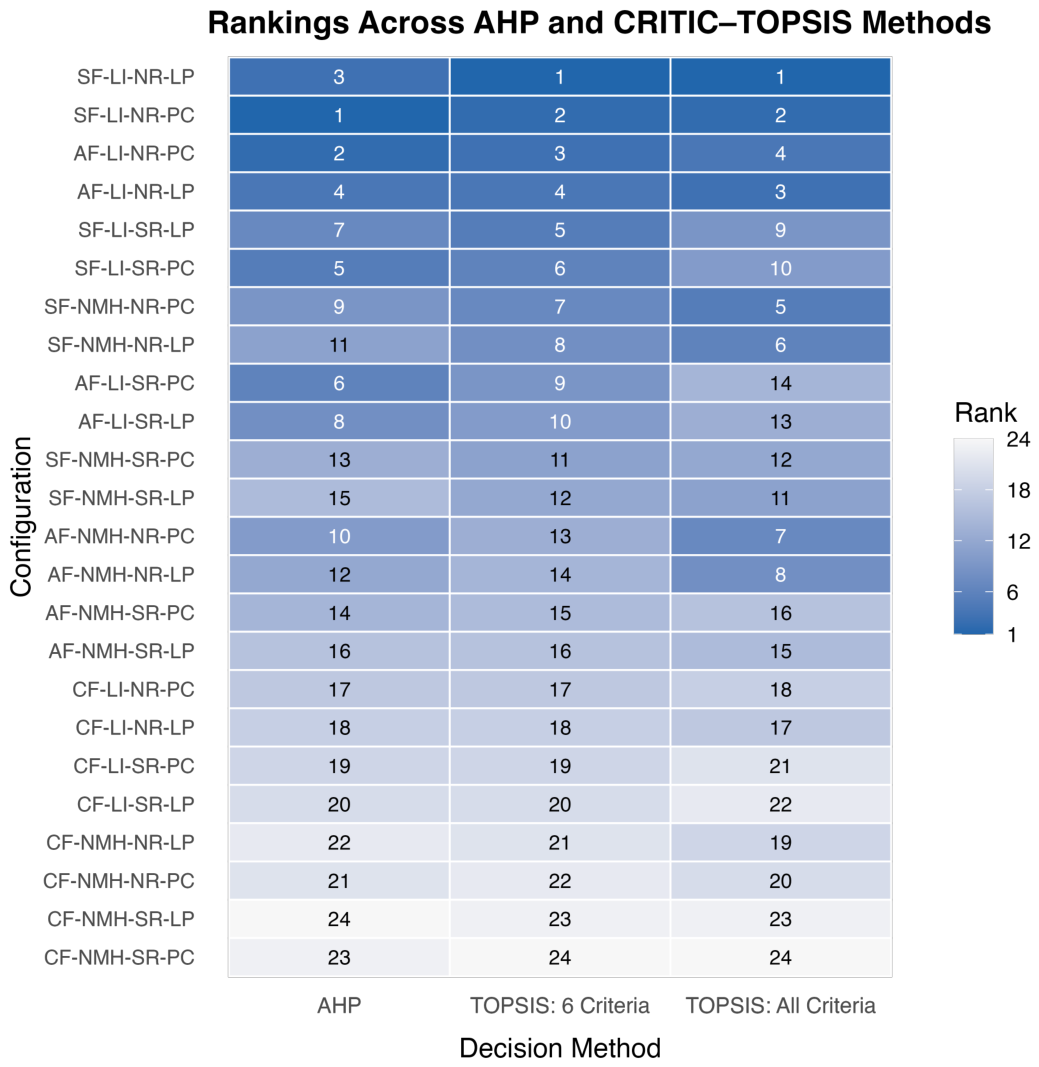
Figure 2 displays a ranking of all 24 configurations based on their stakeholder-weighted environmental and economic scores. The top-ranked alternative for AHP was a combination of a steel frame, lithium ion battery, natural rubber tires, and powder coating. This combination performed well across the highest-weighted environmental indicators while maintaining a relatively low life cycle cost. Notably, carbon fiber frame configurations consistently ranked toward the bottom, primarily due to their poor performance in climate-related and toxicity-based categories. On the other hand, both steel and aluminum frame options appeared frequently in the top half of the rankings.
The results emphasize the importance of aligning sustainable product design with stakeholder values. The AHP-based rankings reflect a prioritization of climate and toxicity impacts, and configurations that minimized these burdens were favored. This highlights the usefulness of stakeholder-informed decision frameworks in guiding environmentally responsible design choices.
4.2. CRITIC Weight Calculation and TOPSIS Rankings
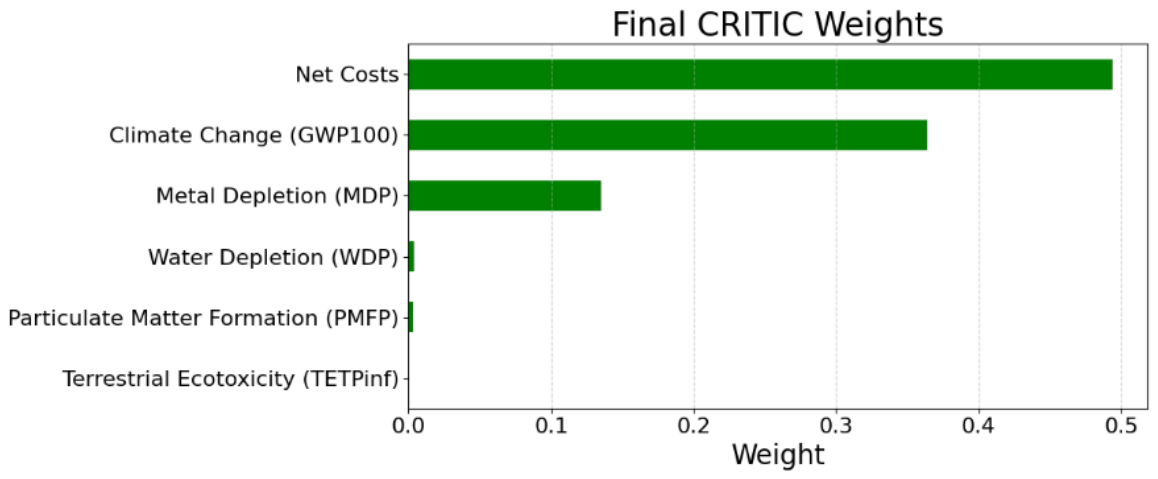
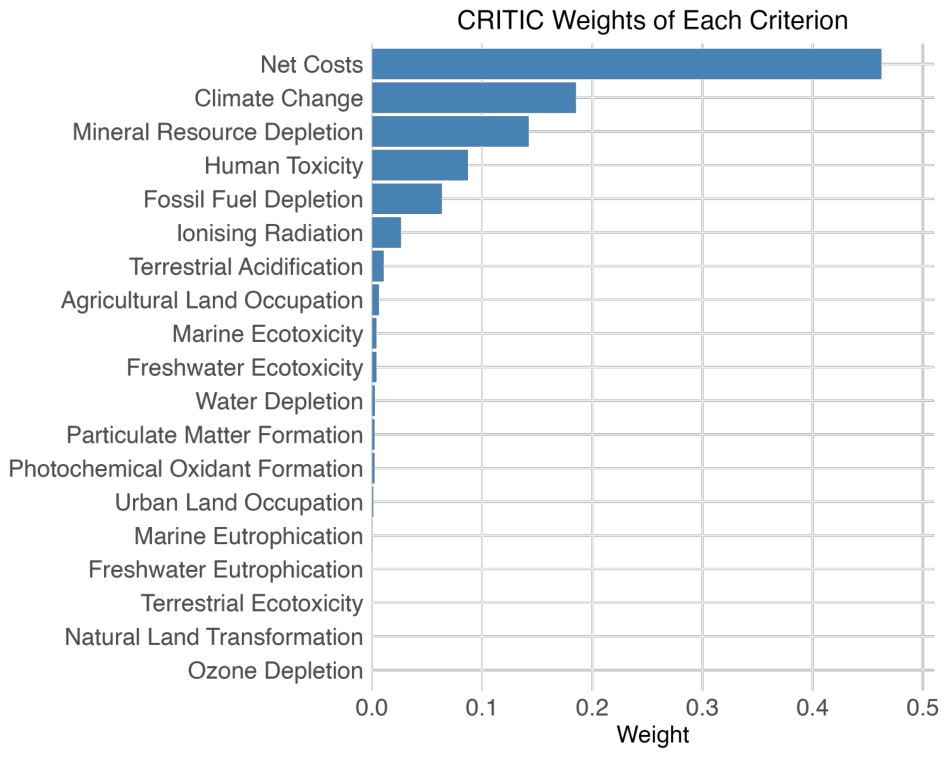
To generate an objective ranking of the 24 e-bike configurations, the CRITIC method was employed to compute data-driven weights for two indicator sets: a reduced set consisting of 5 environmental indicators plus net cost (6 total), see
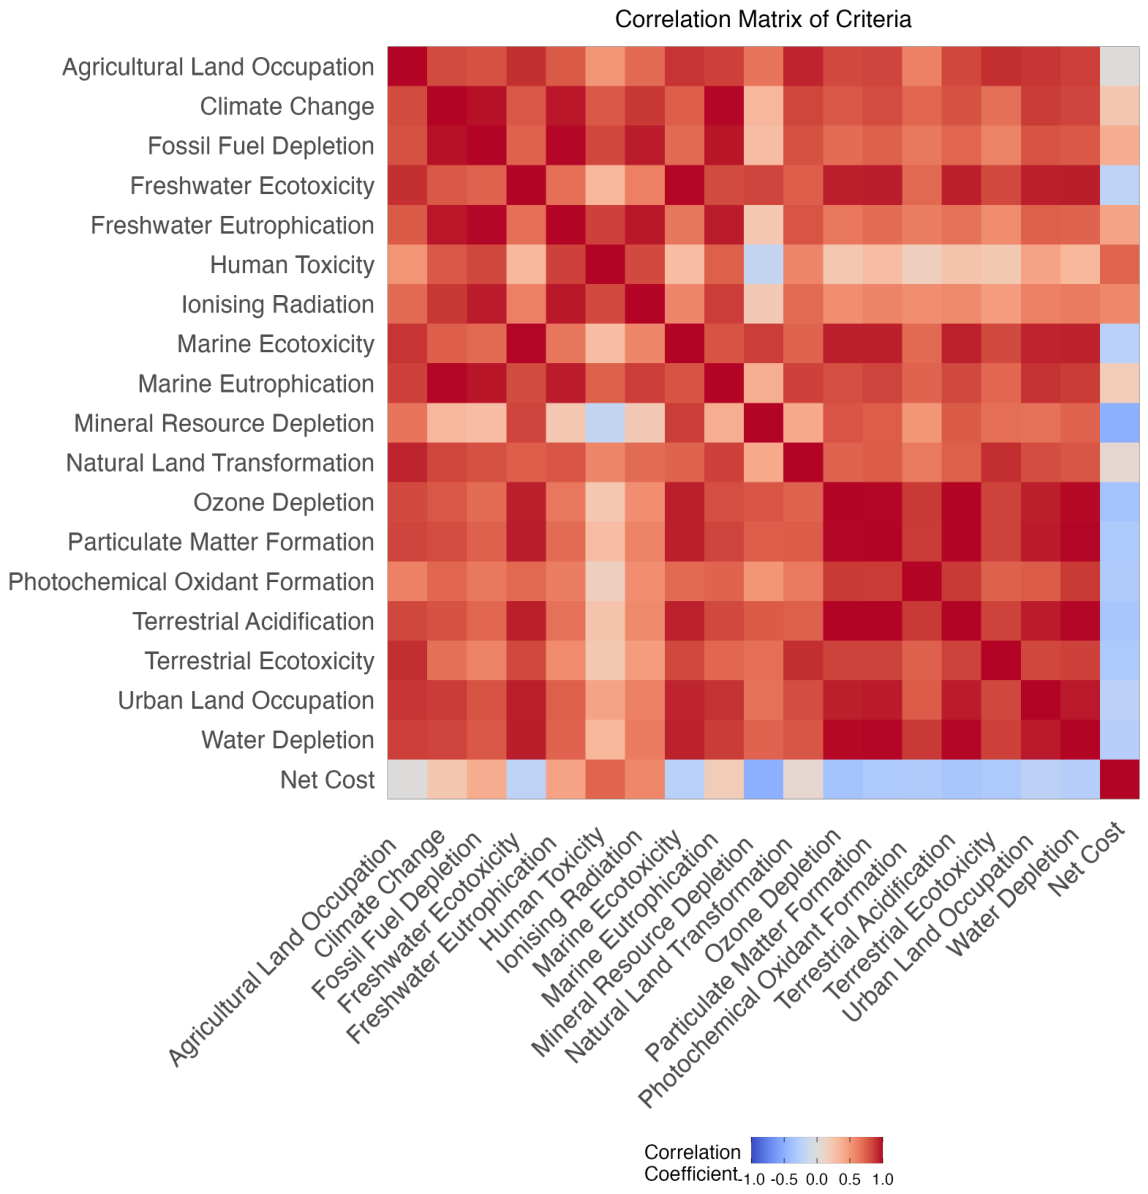
Figure 3, and the full set consisting of all 18 ReCiPe midpoint environmental indicators plus net cost (19 total), see
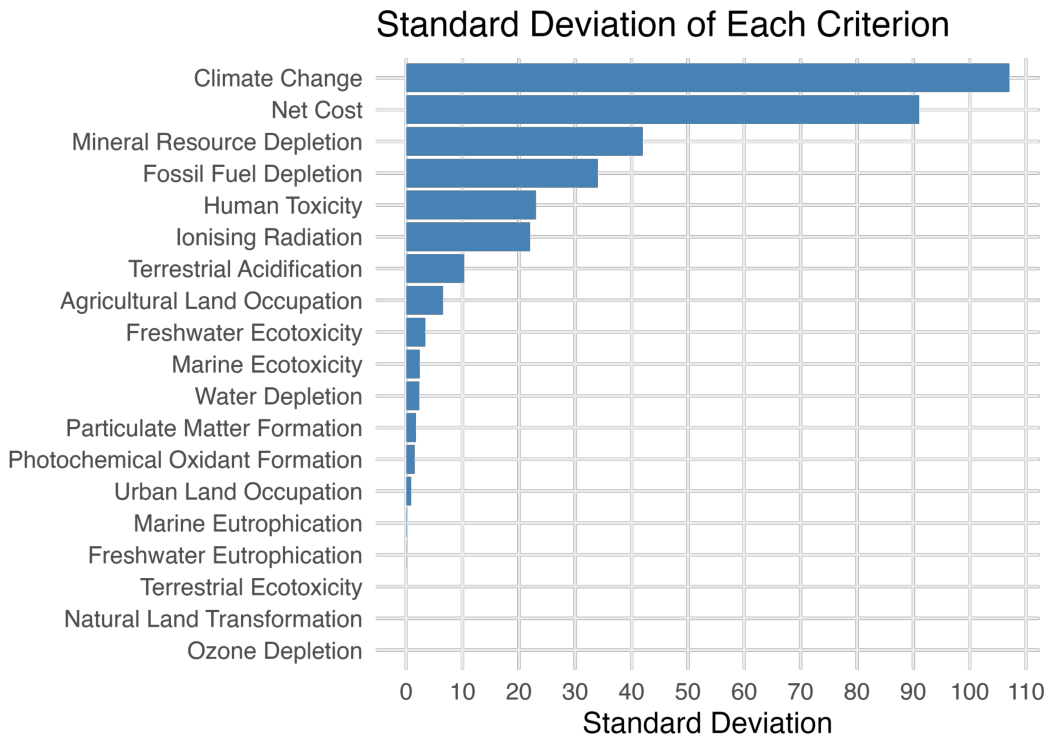
Figure 4. The five-indicator environmental subset was used to enable a direct comparison with the AHP results, while the full 18-indicator set was included to capture a more comprehensive environmental profile. The CRITIC approach calculates each criterion’s importance based on its standard deviation (indicating contrast intensity) and correlation with other criteria (indicating redundancy).
For the full-indicator case, climate change (GWP100) and net cost exhibited the highest standard deviations, as shown in
Figure 5, indicating substantial contrast among the e-bike alternatives. The corresponding correlation matrix (
Figure 6) revealed strong interdependencies among several environmental indicators, as well as a notable negative correlation between net cost and most impact categories. This confirms the CRITIC method’s role in penalizing highly correlated indicators while assigning greater weight to those that are both variable and relatively independent. The resulting CRITIC weights used in the TOPSIS analysis are reported in
Table 9.
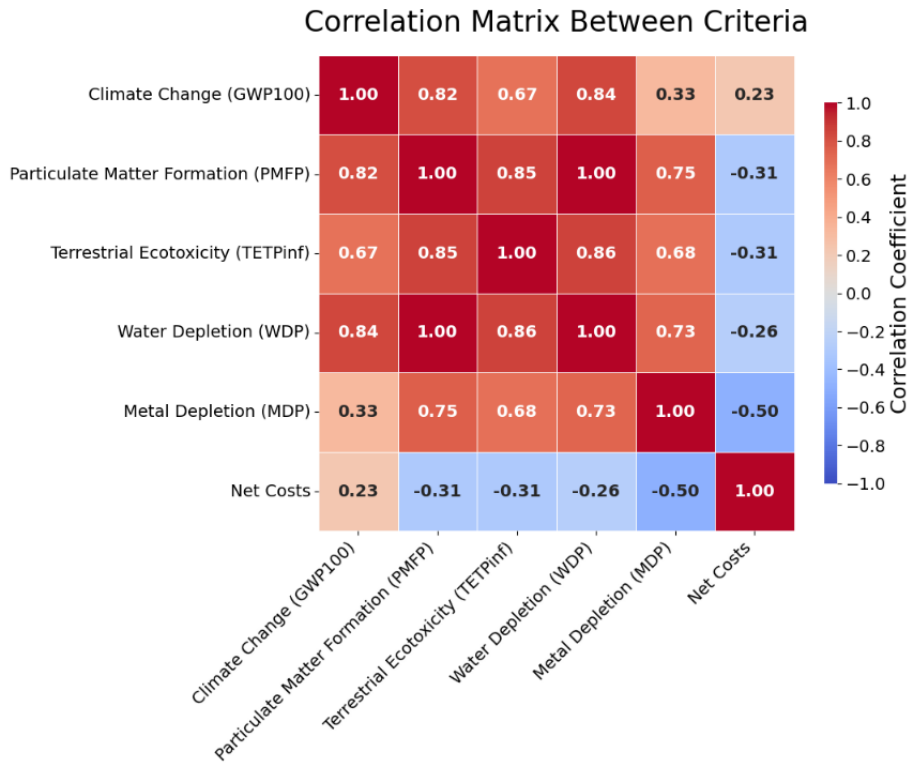
To ensure compatibility with the AHP model, a second CRITIC analysis was conducted using only six shared indicators:
GWP100,
PMFP,
TETPinf,
WDP,
MDP, and
net cost.
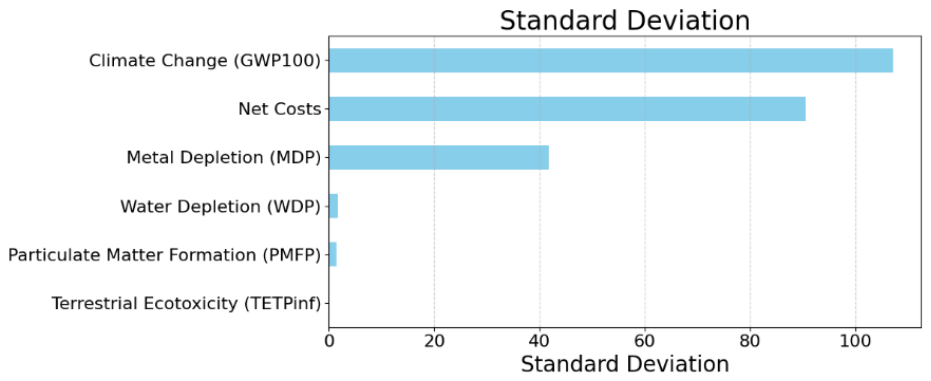
Figure 7 illustrates that GWP100 and net cost remained the most variable across alternatives. The 6 × 6 correlation matrix in
Figure 8 shows moderate to high correlation between most environmental indicators, while net cost again stood out due to its weaker correlation with others.
The final weights from this analysis are reported in
Table 10.
These weights were applied in the TOPSIS method to determine closeness coefficients () and rank all 24 e-bike configurations. In the 18-indicator scenario, the top-performing configuration was a steel frame + lithium-ion battery + natural rubber tires + liquid paint, achieving a score of 0.7989. The 6-indicator CRITIC–TOPSIS analysis also ranked the same configuration first, with an even higher of 0.8441. Notably, this configuration was ranked 3rd in the AHP results, highlighting a divergence between subjective (stakeholder-driven) and objective (data-driven) weighting approaches.
Figure 2 shows a side-by-side ranking comparison of the CRITIC-TOPSIS methods. While the highest and lowest ranks remained mostly stable, configurations involving synthetic rubber or carbon fiber frames showed greater movement between the two analyses. This suggests that these alternatives are more sensitive to the additional impact categories included only in the full 18-indicator model.
The very low CRITIC weights assigned to several indicators should not be interpreted as evidence that these impact categories are environmentally unimportant. Rather, within this specific 24-alternative dataset, low CRITIC weights indicate that an indicator either varied little across alternatives, was highly correlated with other indicators, or both. In practical design terms, such indicators added limited independent ranking information after accounting for the variation already captured by higher-weighted criteria. This behavior is consistent with the purpose of CRITIC weighting, which emphasizes criteria with high contrast and low redundancy. However, it also means that CRITIC–TOPSIS may underemphasize impact categories that are normatively important but statistically redundant in a particular dataset. For this reason, CRITIC-based rankings should be interpreted as data-structure-sensitive screening results rather than value-neutral measures of importance in sustainability.
In summary, the CRITIC–TOPSIS analysis provides a consistent and objective ranking framework that highlights the significant influence of net cost and greenhouse gas emissions. The contrast with the AHP results highlights how the choice of weighting method, whether subjective or objective, can impact design decisions when using MCDM.
4.3. Comparative Analysis of AHP vs. CRITIC-TOPSIS Rankings
To evaluate the alignment and divergence between subjective and objective sustainability assessments, a comparative analysis was conducted across rankings generated using AHP, CRITIC-TOPSIS (with 6 indicators), and CRITIC-TOPSIS (with 18 indicators). The results are presented in
Figure 2.
The AHP rankings, derived from pairwise comparisons based on stakeholder priorities, emphasize perceived environmental priorities, particularly greenhouse gas emissions and impacts related to toxicity. In contrast, CRITIC–TOPSIS ranks alternatives based on statistical contrast and inter-criteria independence, a perspective that is independent of stakeholder judgment.
As shown in
Figure 2, no configuration was consistently ranked first or last across all three methods. Agreement among the three ranking methods was evaluated using Kendall’s coefficient of concordance, while pairwise agreement was evaluated using Spearman’s rank correlation coefficient and Kendall’s
. Kendall’s
W indicated strong overall concordance among the three rankings (
,
,
,
). Pairwise comparisons also showed strong positive agreement, see
Table 11 for full pairwise comparison statistics. Spearman’s
ranged from
to
, and Kendall’s
ranged from
to
, with all pairwise comparisons statistically significant. Top-five overlap was
for each pairwise comparison, corresponding to a Jaccard similarity of
. These results indicate that the methods produced strongly aligned rankings overall, although some configurations shifted by up to eight rank positions depending on the weighting and indicator set.
Rather than indicating that one weighting method produced a fundamentally different design recommendation, the results suggest that AHP and CRITIC–TOPSIS identified broadly similar high-performing regions of the design space while still differing in the exact ordering of some configurations. The ranking patterns suggest that frame material and battery type were important drivers of performance because they contributed substantially to both environmental impacts and cost. However, differences in weighting logic still affected the placement of several alternatives: AHP emphasized stakeholder-derived environmental priorities, whereas CRITIC–TOPSIS emphasized criteria with greater variability and lower redundancy in the decision matrix. Thus, the methods provide complementary perspectives even when their top-ranked configurations substantially overlap.
Although the three ranking procedures were strongly correlated, the observed rank shifts reflect differences in which indicators each method allowed to dominate the aggregate decision score. In the six-indicator comparison, CRITIC assigned most discriminating weight to net cost, climate change, and mineral resource depletion, while particulate matter formation, water depletion, and terrestrial ecotoxicity received smaller weights. This occurred because CRITIC emphasizes indicators with high variation across alternatives and low redundancy with other criteria. In contrast, AHP preserved stakeholder-derived priorities even when those priorities corresponded to lower-contrast or correlated indicators. Thus, AHP and CRITIC–TOPSIS differed most when an alternative’s advantage depended on stakeholder-valued health or toxicity indicators rather than on the high-contrast indicators emphasized by CRITIC.
The coating-related rank shift among the steel-frame, lithium-ion battery, natural-rubber alternatives illustrates this effect. AHP ranked the powder-coated configuration highest, whereas both CRITIC–TOPSIS analyses ranked the liquid-paint configuration highest. Because these alternatives differ only in coating method, this shift should not be interpreted as evidence for a fundamentally different e-bike architecture. Instead, it indicates local sensitivity in how small coating-related environmental and cost differences are translated through the two weighting models. For early-stage design, such cases should be treated as preference-sensitive alternatives rather than definitive winners.
4.4. AHP Sensitivity Analysis
To evaluate the robustness of the sustainability rankings obtained from the AHP method, a one-at-a-time (OAT) sensitivity analysis was conducted on the top-level sustainability criteria, environmental and economic. The baseline weights were perturbed by ±10% while proportionally rescaling the remaining criterion to ensure that the total weight summed to one, following established approaches in AHP-based sensitivity analysis [
27]. For each perturbation scenario, the combined sustainability scores of all 24 e-bike configurations were recalculated and converted into ranks.
Figure 9 presents the OAT sensitivity heatmap, where rows represent e-bike configurations and columns correspond to each perturbation scenario. Color intensity indicates the rank, with lighter shades denoting higher (better) performance.
Key Observations:
Stable but not identical top performers: Configurations such as the Steel Frame–Lithium-ion Battery–Natural Rubber Tire–Powder Coating and Aluminum Frame–Lithium-ion Battery–Natural Rubber Tire–Powder Coating generally remained among the highest-ranked designs, though their exact positions shifted slightly across perturbations. These results indicate that while these combinations are strong candidates for sustainable performance, their dominance is somewhat sensitive to changes in environmental–economic weighting.
Moderately sensitive mid-tier designs: Alternatives such as the Aluminum Frame–Nickel-Metal Hydride Battery–Synthetic Rubber Tire–Powder Coating and Steel Frame–Nickel-Metal Hydride Battery–Natural Rubber Tire–Powder Coating showed fluctuations of two to four rank positions across scenarios. These shifts reflect how subtle weight changes can influence configurations balancing cost and environmental performance.
Consistent low-performing configurations: Combinations using Carbon Fiber Frames and Synthetic Rubber Tires, such as the Carbon Fiber Frame–Nickel-Metal Hydride Battery–Synthetic Rubber Tire–Liquid Paint and Carbon Fiber Frame–Nickel-Metal Hydride Battery–Synthetic Rubber Tire–Powder Coating, consistently occupied the lowest ranks across all weighting variations. Their poor performance stems from the higher life cycle costs and embodied energy associated with carbon-fiber manufacturing and synthetic-rubber production.
Overall, the OAT results demonstrate that the AHP-based sustainability rankings are relatively robust to reasonable variations in criteria weights. While the top and bottom groups remain largely consistent, minor shifts among closely ranked alternatives emphasize the trade-offs between environmental and economic priorities that designers must consider during early-stage decision-making.
5. Discussion
This study compared stakeholder-driven and data-driven weighting approaches for evaluating 24 e-bike configurations using the same environmental and economic life-cycle evidence. The results should be interpreted as a controlled comparison within a fixed design space rather than as a claim that one configuration is universally the most sustainable e-bike design. By holding the product architecture and operating assumptions constant, the analysis isolates how AHP and CRITIC–TOPSIS translate the same decision matrix into different rankings.
The results show that AHP and CRITIC–TOPSIS produced strongly aligned rankings overall. Kendall’s coefficient of concordance indicated strong agreement across the three ranking methods, and pairwise comparisons showed substantial overlap among the highest-ranked configurations. Although differences in exact rank positions remained, particularly among mid-ranked alternatives, the methods generally identified similar high-performing regions of the design space.
This distinction is important for design practice. If the goal is to screen out clearly poor alternatives, either method may provide useful guidance. However, if the goal is to select a small number of configurations for further development, the weighting method can affect the decision outcome; see
Table 12 for a summary of guidelines for selecting a weighting approach. In this case, CRITIC–TOPSIS generally favored configurations with steel or aluminum frames, lithium-ion batteries, and natural rubber tires, whereas AHP assigned higher ranks to some nickel–metal hydride configurations because of the stakeholder-derived weighting structure. Carbon-fiber configurations tended to rank lower across the analyses, reflecting the modeled environmental and cost burdens associated with carbon-fiber production.
AHP and CRITIC–TOPSIS therefore serve complementary, but not interchangeable, roles in sustainability-oriented product design. AHP is most useful when design teams need to make stakeholder priorities explicit, especially in early-stage design contexts where values, expert judgment, or project-specific priorities must be documented. In contrast, CRITIC–TOPSIS is useful when alternatives are well defined and the goal is repeatable, data-driven screening. Because CRITIC derives weights from criterion variability and inter-criterion correlation, it can reveal which indicators most strongly differentiate alternatives within a particular dataset.
The low CRITIC weights assigned to several indicators should not be interpreted as evidence that those impact categories are environmentally unimportant. Rather, within this 24-configuration dataset, low weights indicate that an indicator varied little across alternatives, was strongly correlated with other indicators, or both. In practical terms, these indicators added limited independent ranking information after higher-contrast criteria such as net cost and climate change were considered. This is useful for reducing redundancy, but it also means that CRITIC–TOPSIS may underemphasize impact categories that stakeholders consider important for ethical, regulatory, or contextual reasons.
The component-level findings should also be interpreted cautiously. Frame material and battery type were major drivers of ranking differences because they influenced both environmental indicators and cost; however, the uncertainty sources identified in this study are not expected to affect all alternatives equally. Proportional scaling assumptions, adapted literature values, engineering estimates, market-derived cost data, and battery-related assumptions are most likely to influence alternatives with small score or rank differences, particularly those that differ only by battery chemistry, tire material, or coating method. Therefore, broad rank groups are expected to be more stable than exact adjacent ordering, while mid-ranked alternatives and near-ties should be treated as uncertainty-sensitive. Real-world performance may also depend on factors simplified or held constant in this study, including durability, battery aging, replacement behavior, maintenance, charging infrastructure, transportation logistics, end-of-life treatment, and regional electricity mix. These factors could affect absolute impacts and may alter rankings if they vary systematically across component choices, such as through battery replacement frequency, frame-specific durability, recycling credits, disposal costs, or electricity-related operating impacts. Thus, the rankings should be interpreted as screening-level evidence for robustly favorable, robustly unfavorable, and uncertainty-sensitive configurations rather than as a deterministic final ordering of all 24 alternatives.
The AHP sensitivity analysis suggests that the broad ranking structure is more reliable than exact rank positions. The highest- and lowest-performing groups remained relatively stable under moderate changes to environmental and economic weights, while several mid-ranked alternatives shifted position. Because this study did not conduct a full probabilistic LCA or LCC uncertainty analysis, the rankings should be interpreted as deterministic results conditioned on the selected datasets, proportional scaling assumptions, market-derived costs, and common use-phase assumptions. Small rank differences between adjacent alternatives should therefore not be overinterpreted.
The findings from this study include both transferable methodological insights and case-specific results for the investigated e-bike configuration space. Methodologically, the comparison shows that stakeholder-driven and data-driven weighting approaches can agree on broad high- and low-performing regions while still producing meaningful differences in the ordering of individual alternatives. This distinction is useful because AHP preserves stakeholder-valued criteria, whereas CRITIC–TOPSIS emphasizes criteria that provide high variation and low redundancy within the decision matrix. Thus, disagreement between AHP and CRITIC–TOPSIS should be interpreted as useful diagnostic information rather than simple methodological inconsistency. The case-specific findings indicate that, within the selected alternatives, steel or aluminum frames, lithium-ion batteries, and natural-rubber tires generally appeared in higher-performing regions, while carbon-fiber configurations tended to rank lower. However, these results depend on the selected component options, functional unit, LCA datasets, cost estimates, battery assumptions, and stakeholder sample, and they should not be generalized as universal recommendations for all e-bike designs, particularly because the rankings do not account for mode-shift behavior, consumer use patterns, detailed battery aging, component replacement, durability, maintenance, or product-specific end-of-life economics.
Overall, the results suggest that AHP and CRITIC–TOPSIS should be used as complementary decision-support tools. AHP helps designers understand how stakeholder priorities shape sustainability rankings, while CRITIC–TOPSIS shows how the structure of the quantitative data shapes rankings. When the two methods disagree on top alternatives, as they did in this study, the disagreement should be treated as useful decision information because it reveals configurations whose desirability depends strongly on whether value-driven or data-driven priorities are emphasized.
6. Limitations
This study should be interpreted as a controlled comparison of weighting approaches within a fixed e-bike configuration space rather than as a complete sustainability assessment of e-bike adoption. First, the analysis evaluates environmental and economic indicators only and does not include the social pillar of sustainability. Second, the LCA uses component-level substitutions and simplified assumptions for use of phase and end-of-life processes; therefore, absolute impact values should be interpreted with caution. Third, the AHP survey used a trained engineering convenience sample, primarily engineering graduate students with prior sustainability and LCA training, supplemented by a small number of professional engineering and sustainability contacts. Although appropriate for informed comparison of LCA-based criteria, this sample is not representative of e-bike consumers, policy makers, or broader stakeholder groups. Because detailed demographic variables were not formally collected, the AHP-derived weights should be interpreted as engineering-informed preferences rather than general stakeholder preferences. Finally, the study does not model mode shift; the broader sustainability benefit of e-bikes depends on whether they replace higher-emission travel modes rather than walking or conventional cycling.
7. Conclusions
This study compared stakeholder-driven and data-driven MCDM approaches, specifically AHP and CRITIC–TOPSIS, for evaluating sustainability trade-offs in electric bicycle design using environmental and economic life-cycle evidence. Both methods identified broadly similar high- and low-performing regions of the design space, indicating that the overall sustainability trends were relatively consistent across weighting approaches. However, differences in the exact ordering of alternatives emerged because the methods encode different weighting philosophies: AHP preserved stakeholder priorities and qualitative judgments, whereas CRITIC–TOPSIS emphasized variation, contrast, and independence within the quantitative performance data. Thus, the ranking differences should not be interpreted only as methodological inconsistency but as evidence that weighting choices shape how life-cycle information is translated into design recommendations.
The sensitivity analysis further illustrates the complementary roles of the two approaches. AHP-based rankings were more responsive to changes in environmental and economic weights, which supports its use in early-stage design contexts where stakeholder priorities, value judgments, and preference exploration are central to decision-making. In contrast, CRITIC–TOPSIS showed greater numerical stability because its weights were derived from the structure of the decision matrix, making it useful for repeatable screening when performance data are well defined. For the e-bike case, frame material and battery type were important drivers of ranking differences because they affected both environmental impacts and cost. However, the exact ordering of adjacent alternatives should be interpreted cautiously, particularly where rank differences were small or where component-level assumptions, cost estimates, battery behavior, use-phase effects, or end-of-life treatment may vary in practice.
Overall, the results suggest that AHP and CRITIC–TOPSIS serve complementary roles in sustainability-driven consumer product design. The methodological contribution of this study is showing how stakeholder-driven and data-driven weighting approaches can be compared to distinguish robust design trends from alternatives whose ranking depends on stakeholder values, indicator scope, or data structure. The case-specific findings provide insight into the evaluated e-bike configuration space, but they should not be generalized as universal material or component recommendations for all e-bike designs. More broadly, combining stakeholder-informed weighting with data-driven validation provides a transparent framework for navigating sustainability trade-offs in electric mobility and other engineering design contexts, provided that the choice of weighting method is made deliberately and interpreted alongside uncertainty and design-stage needs.