Article

The Impact of Land-Use Conversion on Carbon Storage Changes: A Case Study Based on Ecological Regions in Shaanxi Province of China

1
Shaanxi Forest Survey and Planning Institute (Shaanxi Forest Resources Monitoring Center), Xi’an 710082, China
2
Shaanxi Academy of Forestry, Xi’an 710082, China
3
College of Environment and Ecology, Taiyuan University of Technology, Taiyuan 030024, China
*
Author to whom correspondence should be addressed.
Sustainability 2026, 18(14), 6938; https://doi.org/10.3390/su18146938
Submission received: 25 April 2026 / Revised: 12 June 2026 / Accepted: 3 July 2026 / Published: 8 July 2026
(This article belongs to the Special Issue Ecological Water Engineering and Ecological Environment Restoration)

Abstract

Terrestrial ecosystems serve as key carbon reservoirs and contribute substantially to global carbon cycling and climate regulation. Shaanxi Province (SP) is located along China’s north–south geographical boundary and climatic transition zone, making it crucial to understand how carbon stocks change within its ecosystems. This study analyzed the land-use patterns, influencing factors, and spatiotemporal dynamics of carbon storage across three regions (Shanbei, Guanzhong, and Shannan) in SP. The results indicated that: (1) From 2000 to 2020, cropland and barren land areas in SP decreased significantly, while the forest land area increased markedly. Total carbon storage in SP increased from 1688.55 Tg in 2000 to 1726.12 Tg in 2020, with the highest accumulation observed in Shannan, followed by Shanbei and Guanzhong. (2) Forest land acted as the most significant carbon sink; its contribution to SP’s total carbon storage increased from 54.98% in 2000 to 60.28% in 2020. (3) Carbon storage across the three regions was positively correlated with elevation, slope, soil silt content, and precipitation, but negatively correlated with soil sand content, gross domestic product, and population distribution. (4) Geographical detector analysis identified precipitation as the key influencing factor for carbon storage in Shanbei and Guanzhong, whereas the primary factors in Shannan were temperature, elevation, and slope. This study recommends future land use priorities: maintaining grassland dominance in Shanbei, scientifically optimizing the planning of cropland and impervious land in Guanzhong, and sustaining current forest protection and management in Shannan. These results provide vital quantitative support and important references for ecologically sustainable development and the realization of China’s dual-carbon goals in SP.

1. Introduction

Human activities have led to substantial carbon dioxide emissions, thereby accelerating global warming and influencing global carbon storage dynamics [1,2,3]. As a critical component of ecosystem services [4], carbon storage is widely recognized as an important indicator for evaluating the responses of terrestrial ecosystems to global climate change [5,6]. While climate change is primarily driven by rising anthropogenic carbon emissions from fossil fuel consumption [7,8], increasing evidence indicates that land-use change has become a major source of carbon emissions [9], second only to fossil fuel combustion [10]. Enhancing terrestrial carbon storage contributes to reducing atmospheric carbon dioxide (CO2) concentrations [11] and mitigating the greenhouse effect [12,13]. Therefore, investigating the relationship between land use and carbon storage is necessary for improving the understanding and management of the global carbon cycle [14,15].
The primary carbon pools in terrestrial ecosystems include aboveground biomass, belowground biomass, soil, and litter, with vegetation and soils serving as the dominant reservoirs [16,17]. Land-use change can alter ecosystem carbon storage patterns, consequently affecting the spatial distribution of vegetation and soil characteristics [18,19,20]. Previous research has demonstrated that climatic factors affect carbon accumulation in plants and soils, acting as fundamental drivers of variation in carbon storage, whereas topographic features (such as elevation and slope) and soil types affect their potential geographic patterns [21,22]. Driven by human activities, rapid urbanization has led to the continuous conversion of forest land and cropland into impervious land. Consequently, high-sequestration ecosystems are progressively being replaced by low-sequestration land-use types [23,24]. Ultimately, vegetation growth conditions and soil properties are influenced by land-use change, which in turn alters overall ecosystem carbon storage capacities [25,26].
Carbon stocks are strongly correlated with climatic factors. In SP, both aboveground and belowground carbon densities of forest ecosystems exhibit positive correlations with mean annual precipitation and Normalized Difference Vegetation Index (NDVI) [27]. Similarly, changes in carbon stocks in Sichuan Province are predominantly driven by human activities, gross domestic product (GDP), and NDVI [28]. Although agricultural land is essential for guaranteeing food security [29], human-induced forest degradation and its associated carbon emissions can increase surface temperatures, thereby exacerbating climate change. Multi-regional studies have demonstrated that socioeconomic factors can also affect the variability of carbon stocks [30,31]. In recent years, researchers have increasingly employed machine learning techniques and geographic detector methods to reveal the driving factors affecting carbon dynamics [32,33,34]. Moreover, integrating SSP-RCP scenarios [35] to predict future carbon storage, support regional emission reduction strategies, and inform land use planning has become a major research trend. Therefore, quantifying the response of carbon storage to land-use changes and its spatial distribution patterns [36], as well as identifying the key drivers of carbon dynamics, are essential for accurately monitoring carbon fluxes in regional ecosystems and comprehensively understanding carbon sequestration processes.
The primary approaches for quantifying carbon storage include field investigations, remote sensing inversions, and model simulations [37,38]. Results obtained from field investigations based on sample plot inventories are generally more highly accurate and reliable. These traditional techniques exhibit high precision when applied to smaller spatial scales. However, for large-scale carbon storage studies, these methods are labor-intensive, time-consuming, and limited by the complexity of data collection and processing, thereby restricting their applicability for regional carbon storage estimation [39]. Currently, remote sensing techniques and modeling have proven to be effective and widely applied approaches for estimating carbon storage. Models used for estimating carbon storage primarily include biogeochemical processes models and empirical models based on carbon density data [40,41]. At the regional scale, biogeochemical models often suffer from reduced estimation accuracy due to their complexity, as they involve a large number of parameters related to landscape features [42,43]. Therefore, the InVEST model [30] is frequently used to assess ecosystem carbon stocks because of its simplicity, parameter accessibility, and computational efficiency.
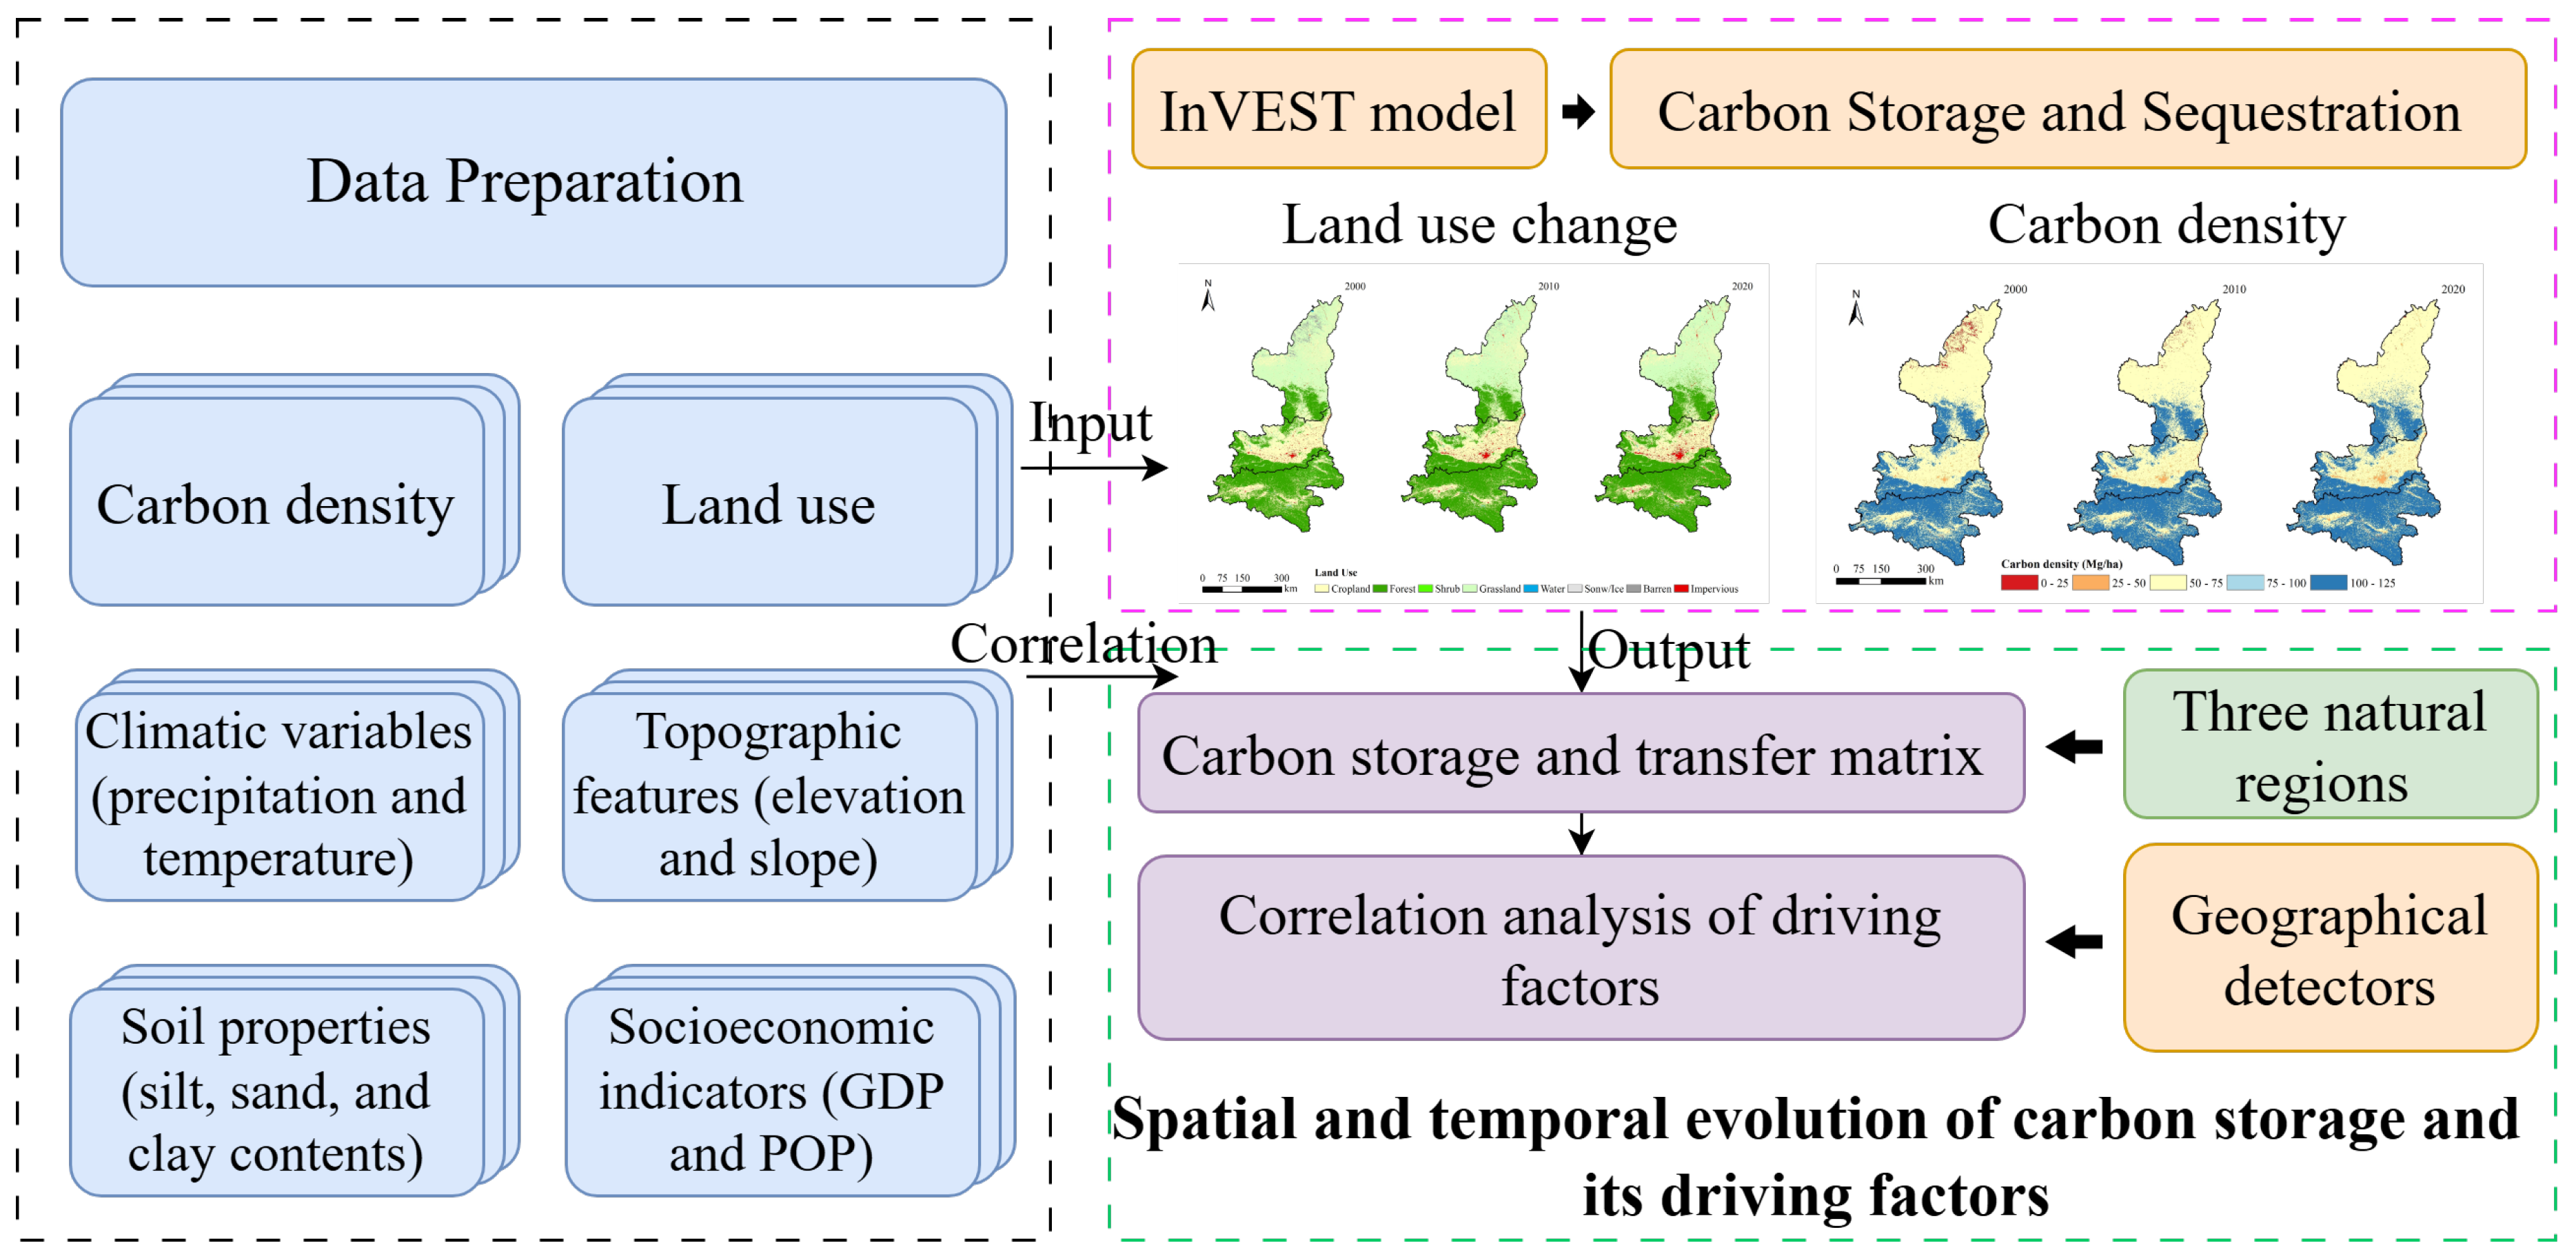
While carbon storage estimation approaches have been widely applied, significant research gaps remain. Large-scale assessments often obscure the spatial heterogeneity within extensive administrative regions, as carbon storage may respond differently to local socioeconomic drivers and ecological restoration policies. SP features an elongated terrain and a unique geographical location; it is divided into three distinct natural sub-regions from north to south: the Shanbei Loess Plateau, the Guanzhong Plain, and the Shannan Qinling-Daba Mountains [44]. Significant variations in physical geography and socioeconomic conditions among these regions have resulted in marked differences in land-use types, thus providing an ideal setting for investigating regional variations in carbon storage. To address these issues, SP was selected as the study area. By integrating multi-source regional data, the objectives of this study are: (1) to analyze spatiotemporal land-use changes across the three sub-regions; (2) to quantify the response of carbon storage to these land-use changes; and (3) to determine the relationships between carbon storage and climatic variables, topographic features, socioeconomic indicators, population distribution (POP), and other influencing factors (Figure 1).

2. Materials and Methods

2.1. Study Area

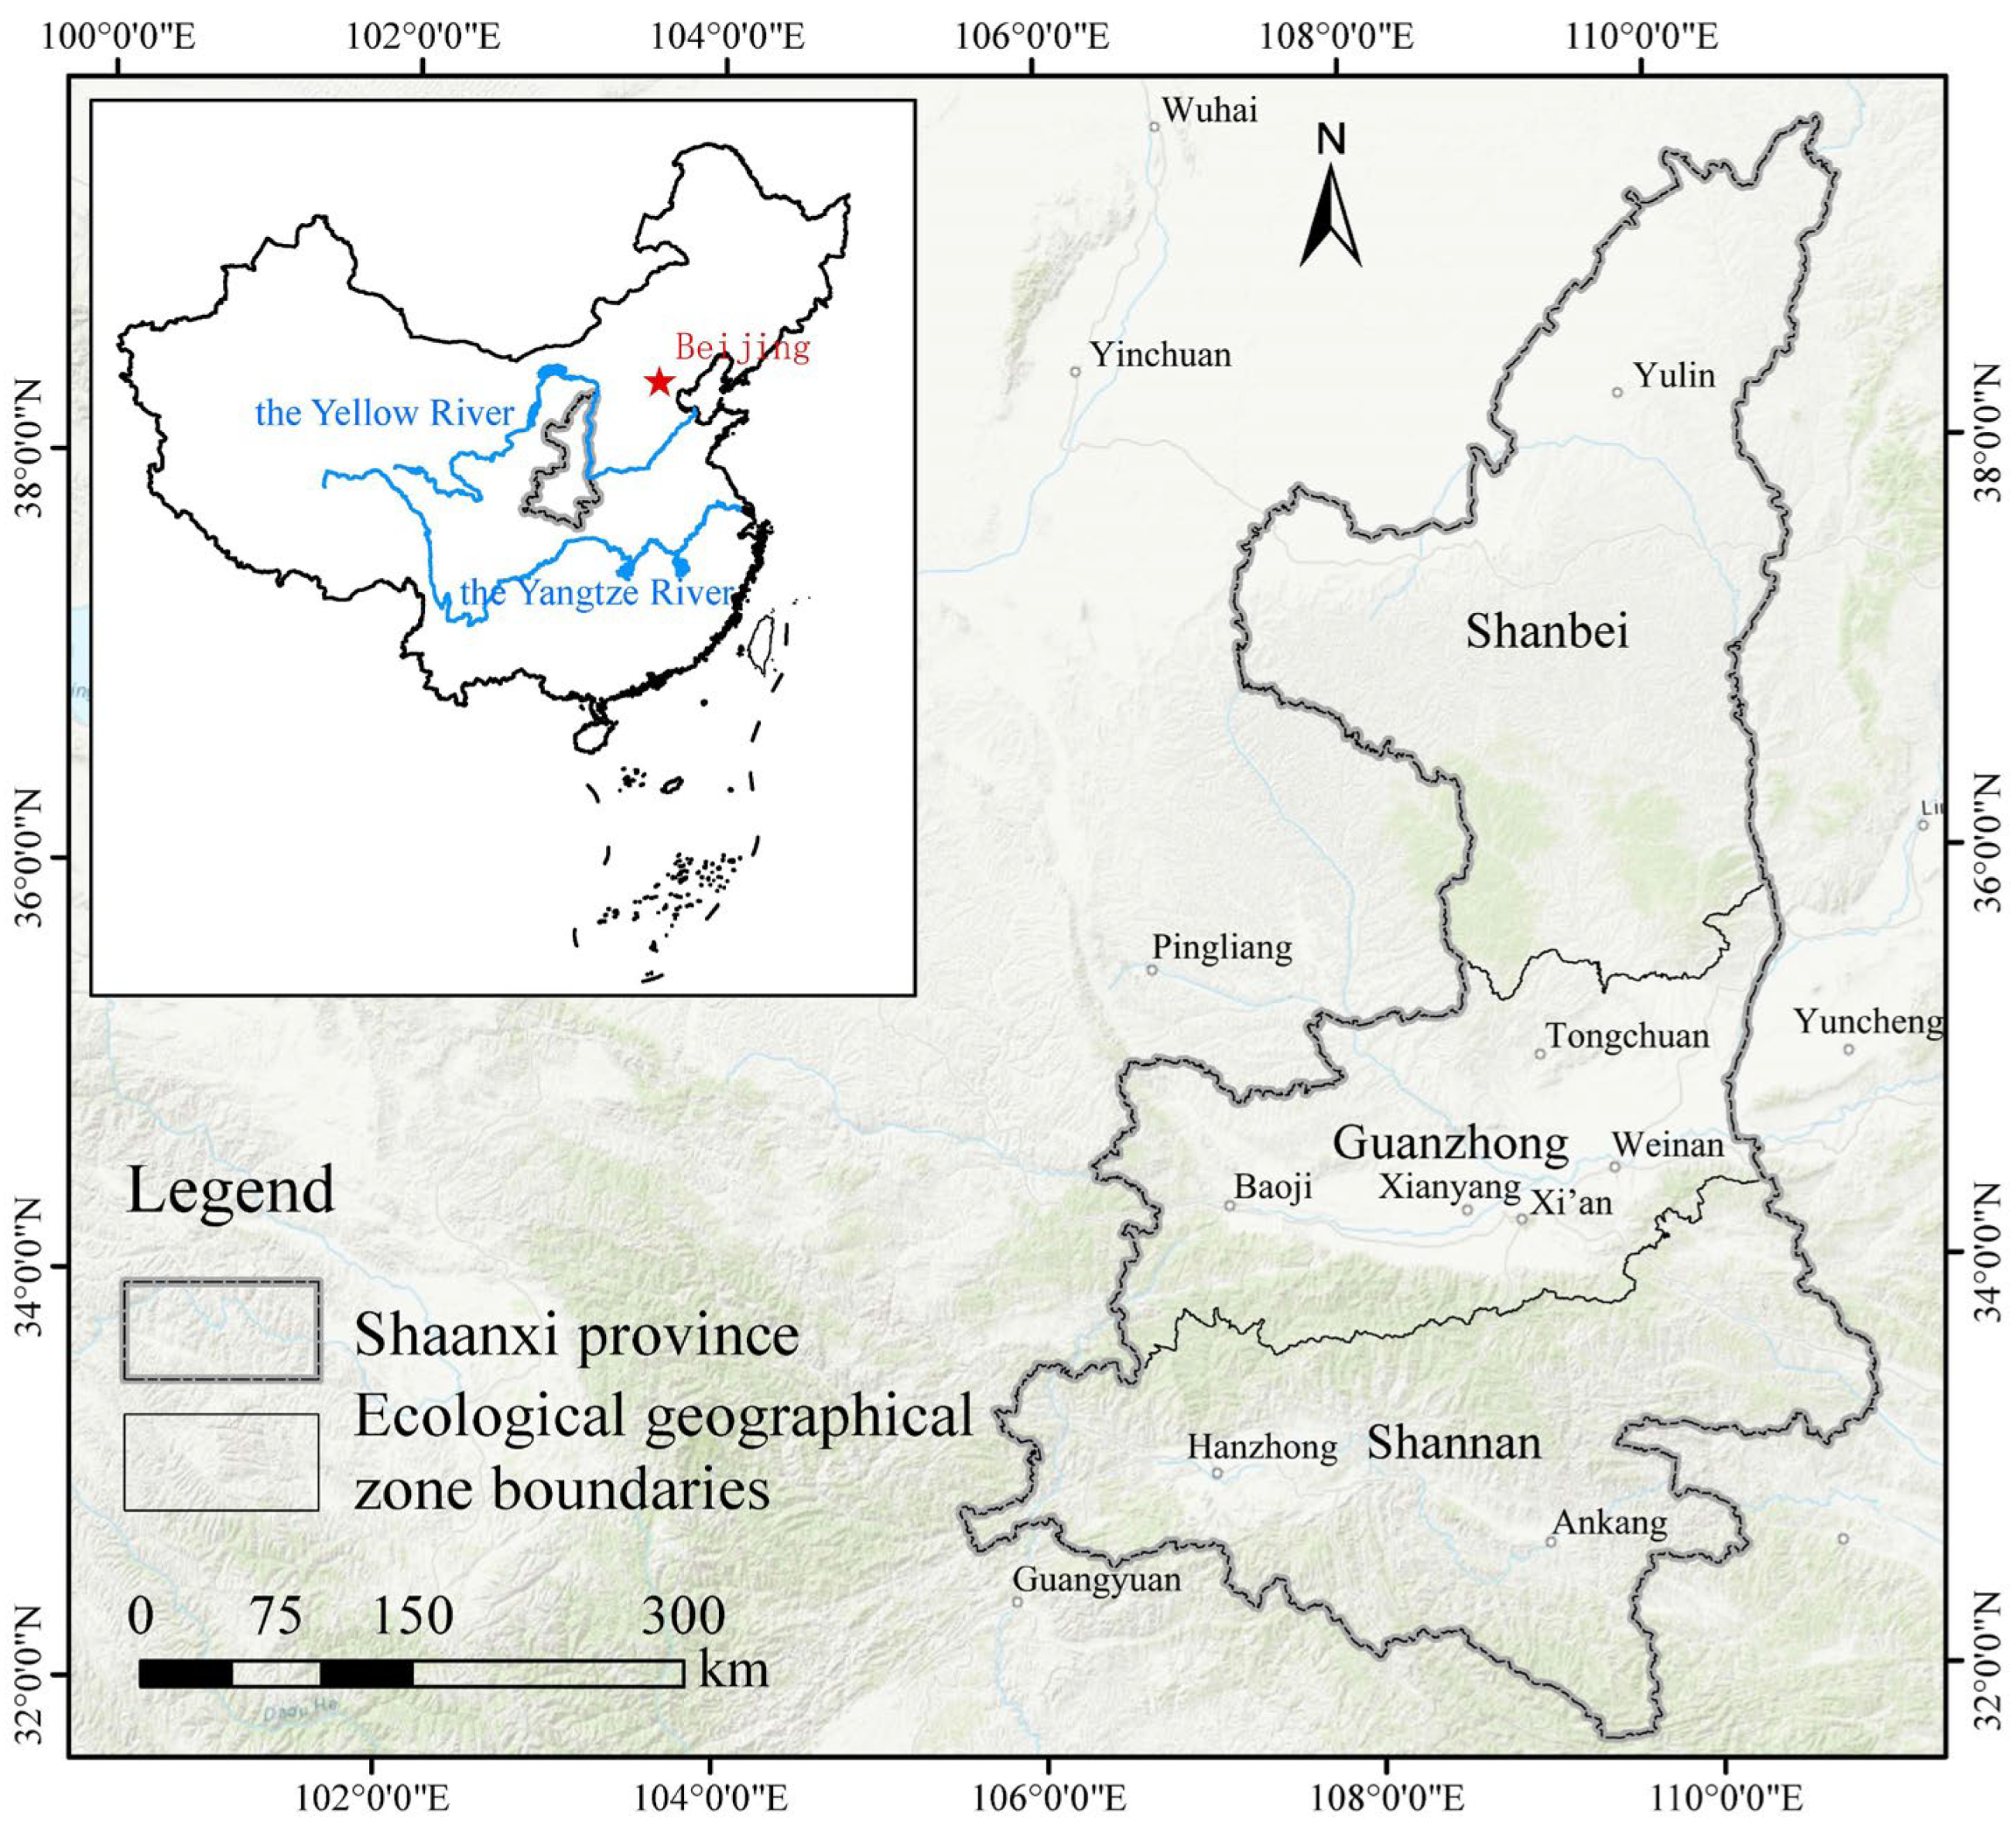
SP (105°29′–111°15′ E, 31°42′–39°35′ N, Figure 2) is located in central China, covering an area of approximately 20.56 × 10⁴ km2. SP extends across the northern subtropical, warm temperate, and middle temperate zones, exhibiting marked climatic differences [27]. The mean annual temperature ranges from 9 to 16 °C, and the mean annual precipitation varies from 340 to 1240 mm. Based on topographic and natural conditions, the elevations of Shanbei, Guanzhong, and Shannan are approximately 900–1900 m, 460–850 m, and 1000–3000 m, respectively. According to administrative statistics, Shanbei, Guanzhong, and Shannan account for 40%, 27%, and 33% of SP’s total area, respectively [45]. Shanbei exhibits high land development intensity, with substantial conversion of grassland and cropland into impervious land [46]. The Guanzhong Plain is characterized by a dense population, well-developed transportation networks, and a relatively high level of urbanization. Land use is primarily shaped by urban expansion and diversified industrial development [47]. In contrast, Shannan is predominantly mountainous. Constrained by its rugged topography, land development intensity remains low, and forest coverage is extensive [48].

2.2. Data Preparation

The datasets utilized in this study included carbon density data, meteorological variables, socioeconomic factors, soil texture, elevation, and slope. All datasets were preprocessed using ArcGIS 10.2, employing tools such as Project Raster, Resampling, and Dissolve to ensure a consistent spatial resolution (1 km × 1 km) and to convert raster data into vector formats. Detailed sources for these datasets are provided in Table 1.

2.3. The InVEST Model

This study utilized the Carbon Storage and Carbon Sequestration module [51] of the InVEST model to estimate carbon storage across four primary carbon pools (aboveground biomass, belowground biomass, soil, and litter) for different land-use types in SP [52]. Total carbon storage was calculated using the following equation:
C T o t a l   = i = 1 n C a b o v e i + C b e l o w i + C s o i l i + C d e a d i
where CTotal is the total carbon storage (Mg/ha); Cabovei, Cbelowi, Csoili, and Cdeadi represent the carbon storage (Mg/ha) of the aboveground biomass, belowground biomass, soil, and litter pools, respectively; i indicates the specific land-use type; and n is the total number of land-use types.
A carbon density dataset of Chinese terrestrial ecosystems [49] was selected for this study. Specifically, carbon densities for forest land, grassland, cropland and soil were extracted and subsequently adjusted based on the 2012 Forest Inventory of SP. Ultimately, the calibrated carbon density data were obtained, as detailed in Table 2.

2.4. Statistical Analysis

Carbon storage data were calculated for SP, and its three sub-regions (Shanbei, Guanzhong, and Shannan). The spatial relationship of carbon density was quantified using the global and local Moran’s I indices. Furthermore, the relationships between carbon storage and four categories of driving factors: climatic variables (precipitation and temperature), topographic features (elevation and slope), soil properties (silt, sand, and clay contents), and socioeconomic indicators (GDP and POP) were analyzed using Pearson correlation analysis.

2.5. Optimal Parameter-Based Geographical Detectors (OPGD)

The OPGD was employed to analyze the spatial variability of carbon storage and the interactions among multiple driving factors. Within the OPGD framework, continuous variables were discretized using five schemes (quantile interval, equal interval, natural breaks, geometric interval, and standard deviation) [53], and the optimal discretization parameters were automatically determined by maximizing the q-statistic, thereby minimizing subjectivity in parameter selection. Accordingly, this study utilized the factor and interaction detector to examine the individual impacts of these factors on carbon storage changes, as well as their interactive effects [54]. The “GD” package in R 4.4.1 was utilized for the analysis, and Origin 2021 was employed to visualize the detection results.

3. Results

3.1. Land Use Changes

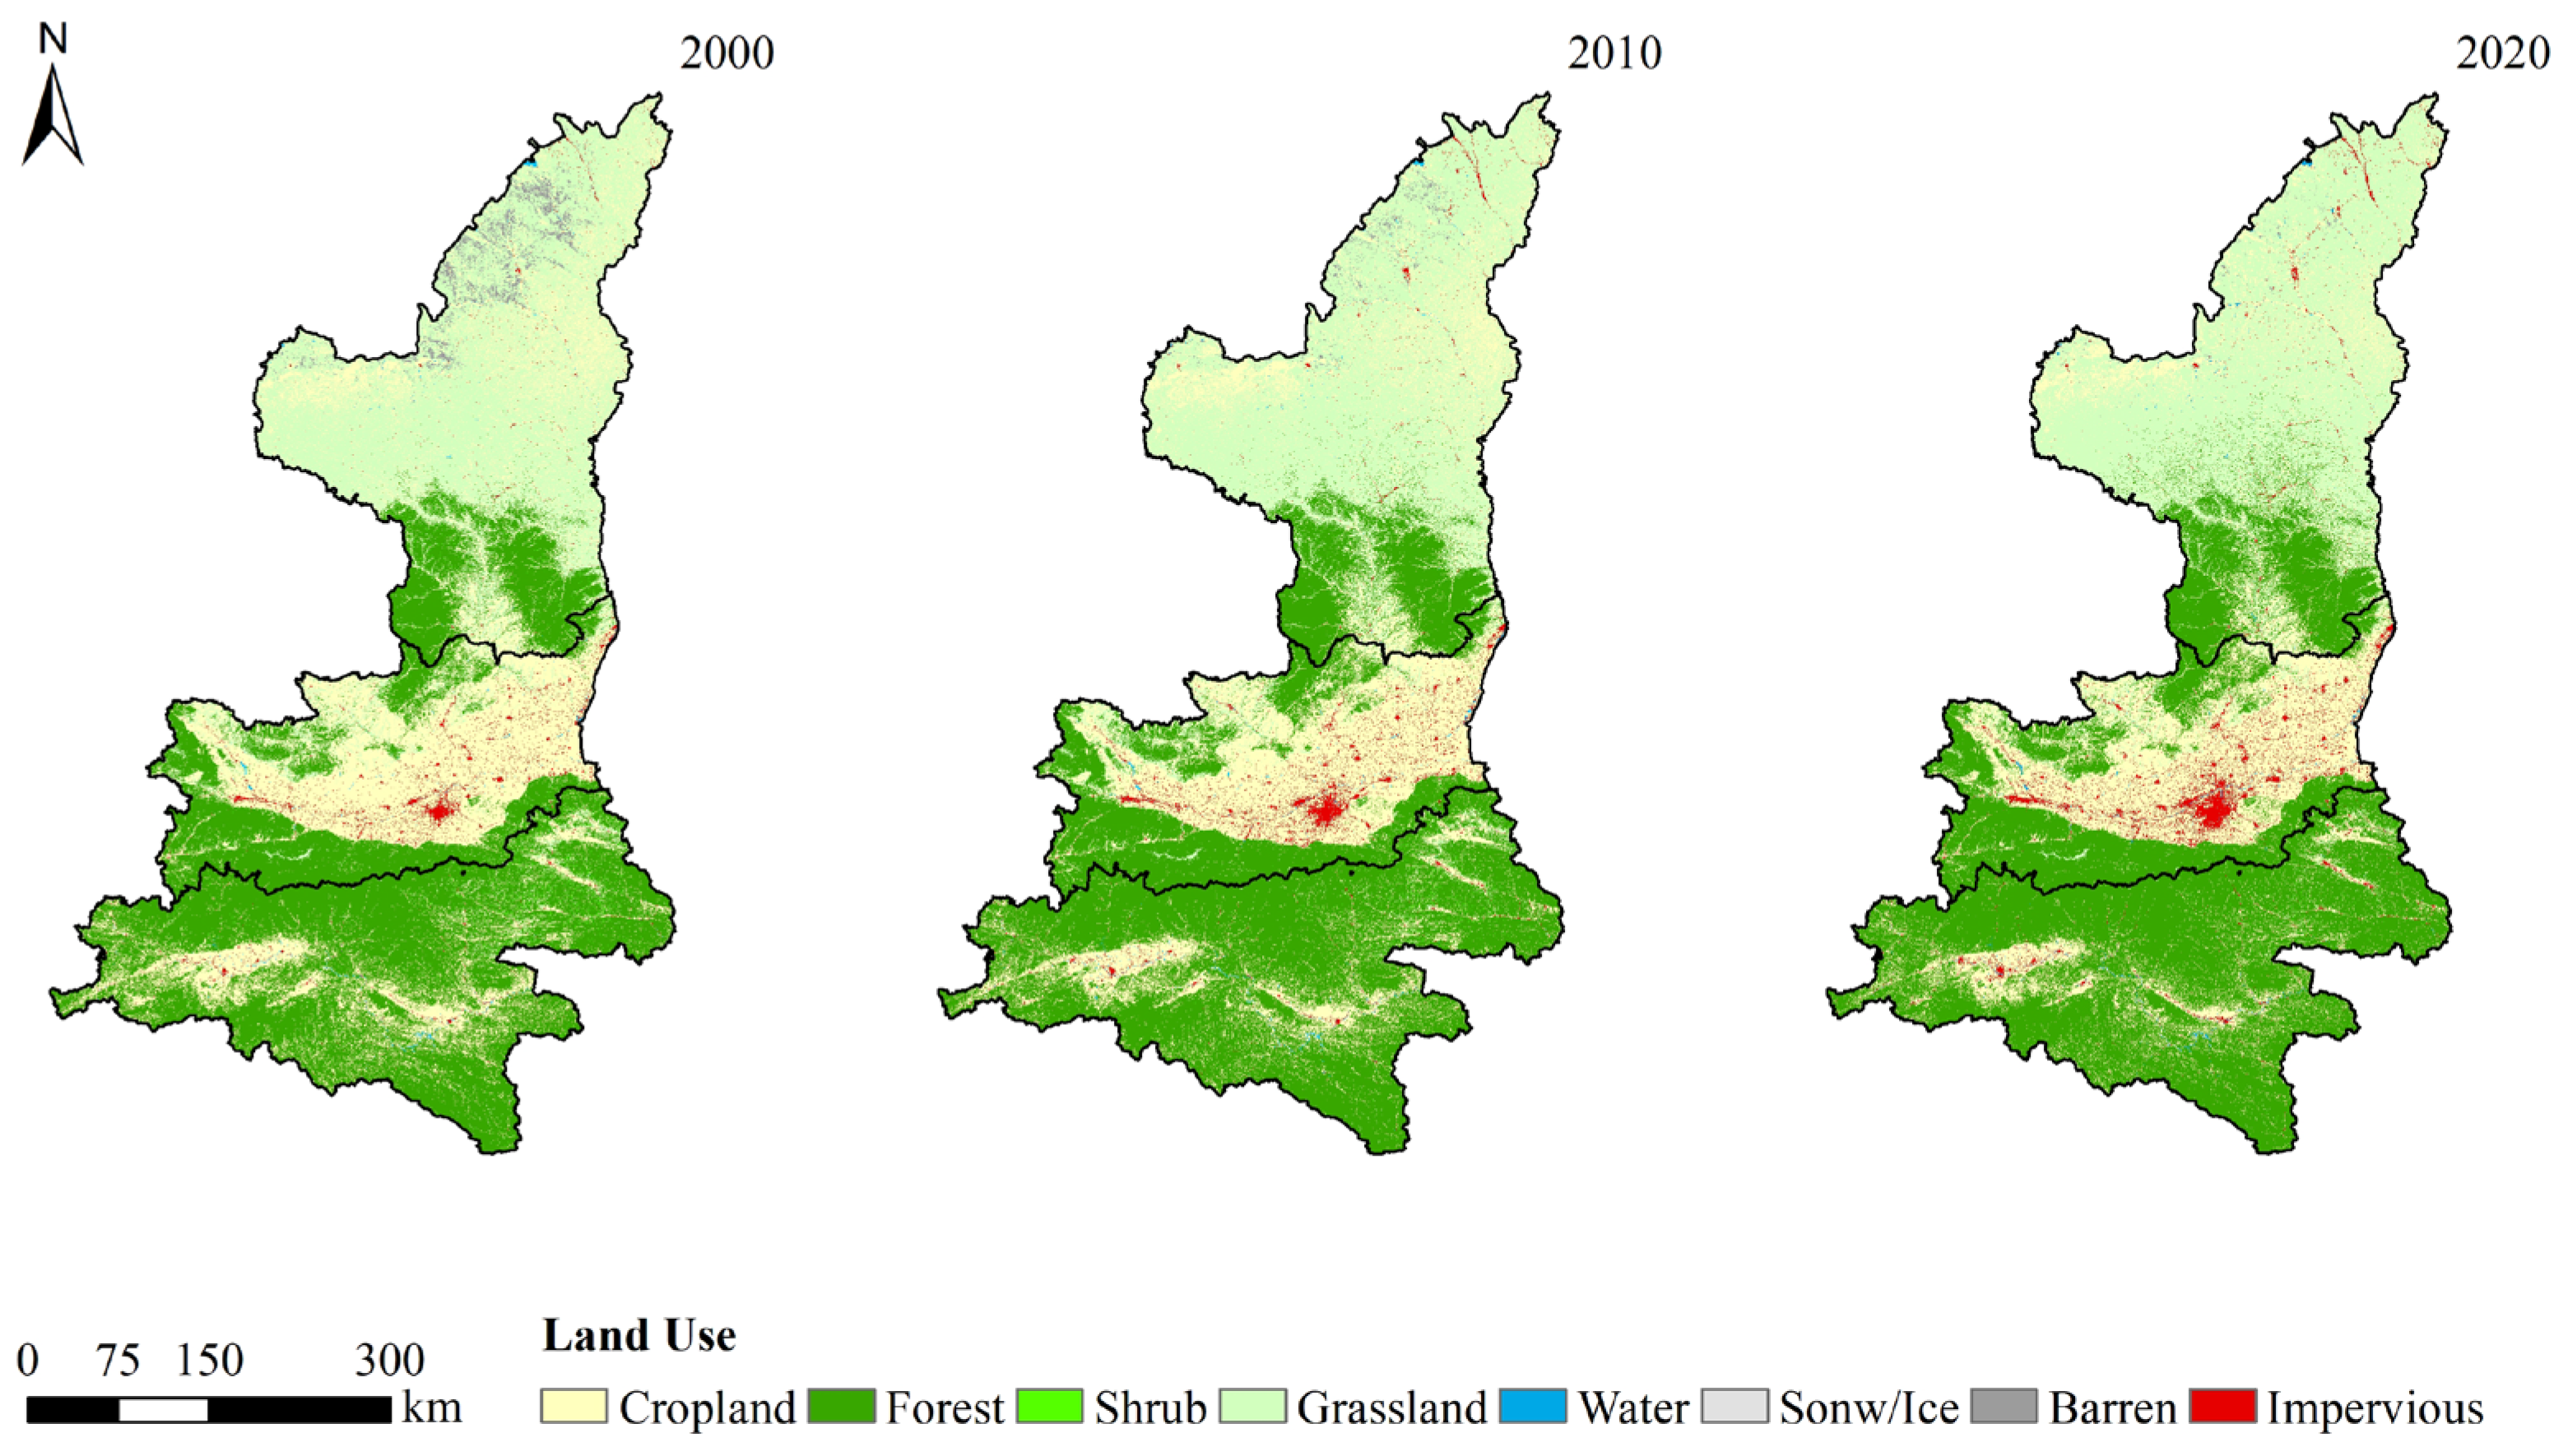
The spatiotemporal distribution of land use in SP is illustrated in Figure 3. Forest land constituted the dominant land-use type across the province, accounting for 40.09%, 42.67%, and 44.93% of the total area in 2000, 2010, and 2020, respectively. The primary land-use types in Shanbei, Guanzhong, and Shannan were grassland, cropland, and forest land, respectively. From 2000 to 2020, the proportion of cropland gradually decreased across all three regions, while that of forest land steadily increased. Compared with 2000, the impervious land area in 2020 increased by 109.94%, 129.75%, 108.56%, and 98.98% in SP, Shanbei, Guanzhong, and Shannan, respectively. Additionally, barren land in SP and Shanbei decreased by 92.98% and 93.09%, respectively, while shrubland in Guanzhong and Shannan decreased by 60.63% and 81.02%, respectively.
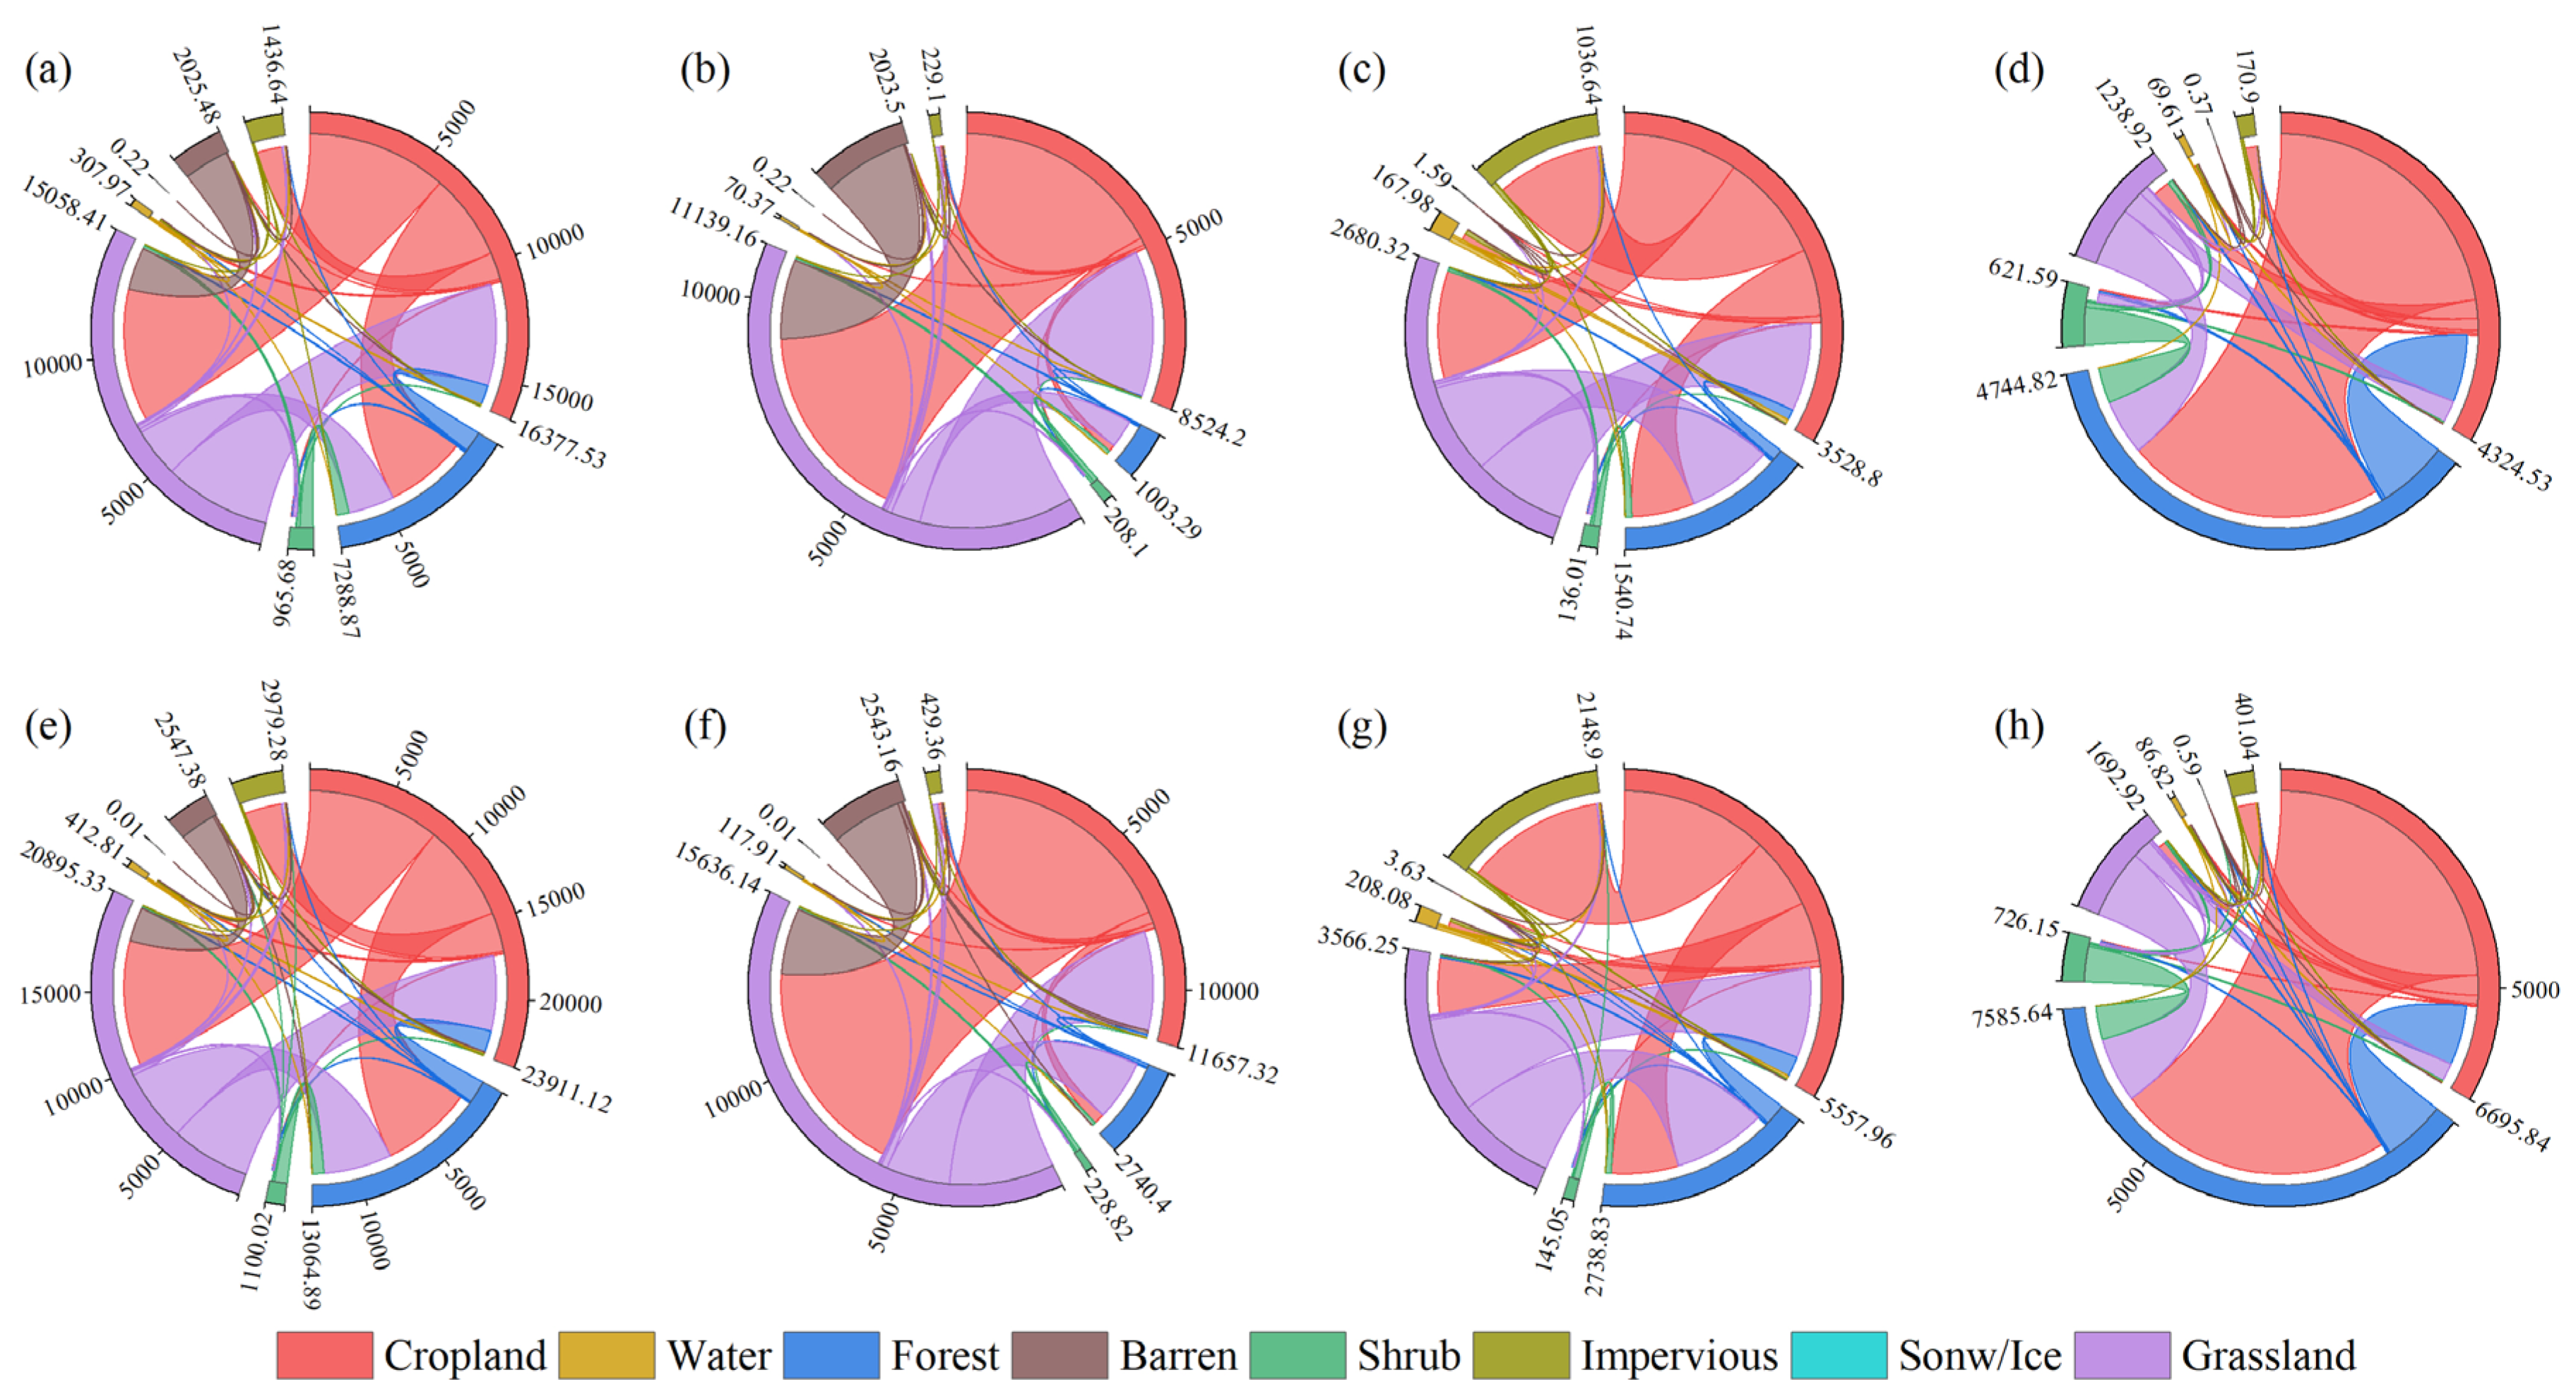
The land-use transition matrix (Figure 4) shows that between 2000 and 2010, the proportions of cropland, shrubland, and barren land in SP decreased by 8.79%, 46.38%, and 73.09%, respectively. These changes were mainly driven by the conversion of cropland into forest land (3659.13 km2) and grassland (5931.08 km2), as well as the conversion of shrubland into forest land (564.25 km2) and grassland (141.48 km2), and barren land into grassland (1911.33 km2). From 2010 to 2020, the proportions of cropland, shrubland, and barren land further decreased by 9.23%, 59.00%, and 73.91%, respectively. This was primarily due to the conversion of cropland into forest land (299.31 km2) and grassland (6186.31 km2), shrubland into forest land (318.99 km2) and grassland (79.70 km2), and barren land into grassland (545.19 km2). These conversions largely contributed to the observed increases in the proportions of forest land and grassland.
At the sub-regional level, the land-use types that underwent the most significant conversions in Shanbei and Guanzhong (accounting for ≥50% of the converted areas) included cropland, forest land, grassland, and water. In Shanbei, these changes primarily involved the conversion of forest land (100.23 km2) and grassland (3410.37 km2) into cropland; shrubland (132.55 km2) into forest land; cropland (7428.06 km2) and barren land (2286.82 km2) into grassland; and impervious land (8.50 km2) into water. In Guanzhong, the main conversions involved forest land (290.58 km2) and water (45.26 km2) into cropland; shrubland (84.27 km2) into forest land; impervious land (47.44 km2) into water; and cropland (2019.53 km2) into impervious land. In Shannan, the land-use categories exhibiting the most pronounced changes were cropland, forest land, water, and impervious land. This primarily resulted from the conversion of forest land (1037.75 km2) into cropland, while extensive areas of cropland (4787.49 km2), shrubland (585.83 km2), and grassland (1128.31 km2) were converted into forest land. Additionally, impervious land (31.24 km2) was converted to water, while water (11.53 km2) and barren land (0.24 km2) were converted to impervious land. Overall, there were relatively minor changes in barren land, water, and impervious land.

3.2. The Spatio-Temporal Variation in Ecosystem Carbon Storage

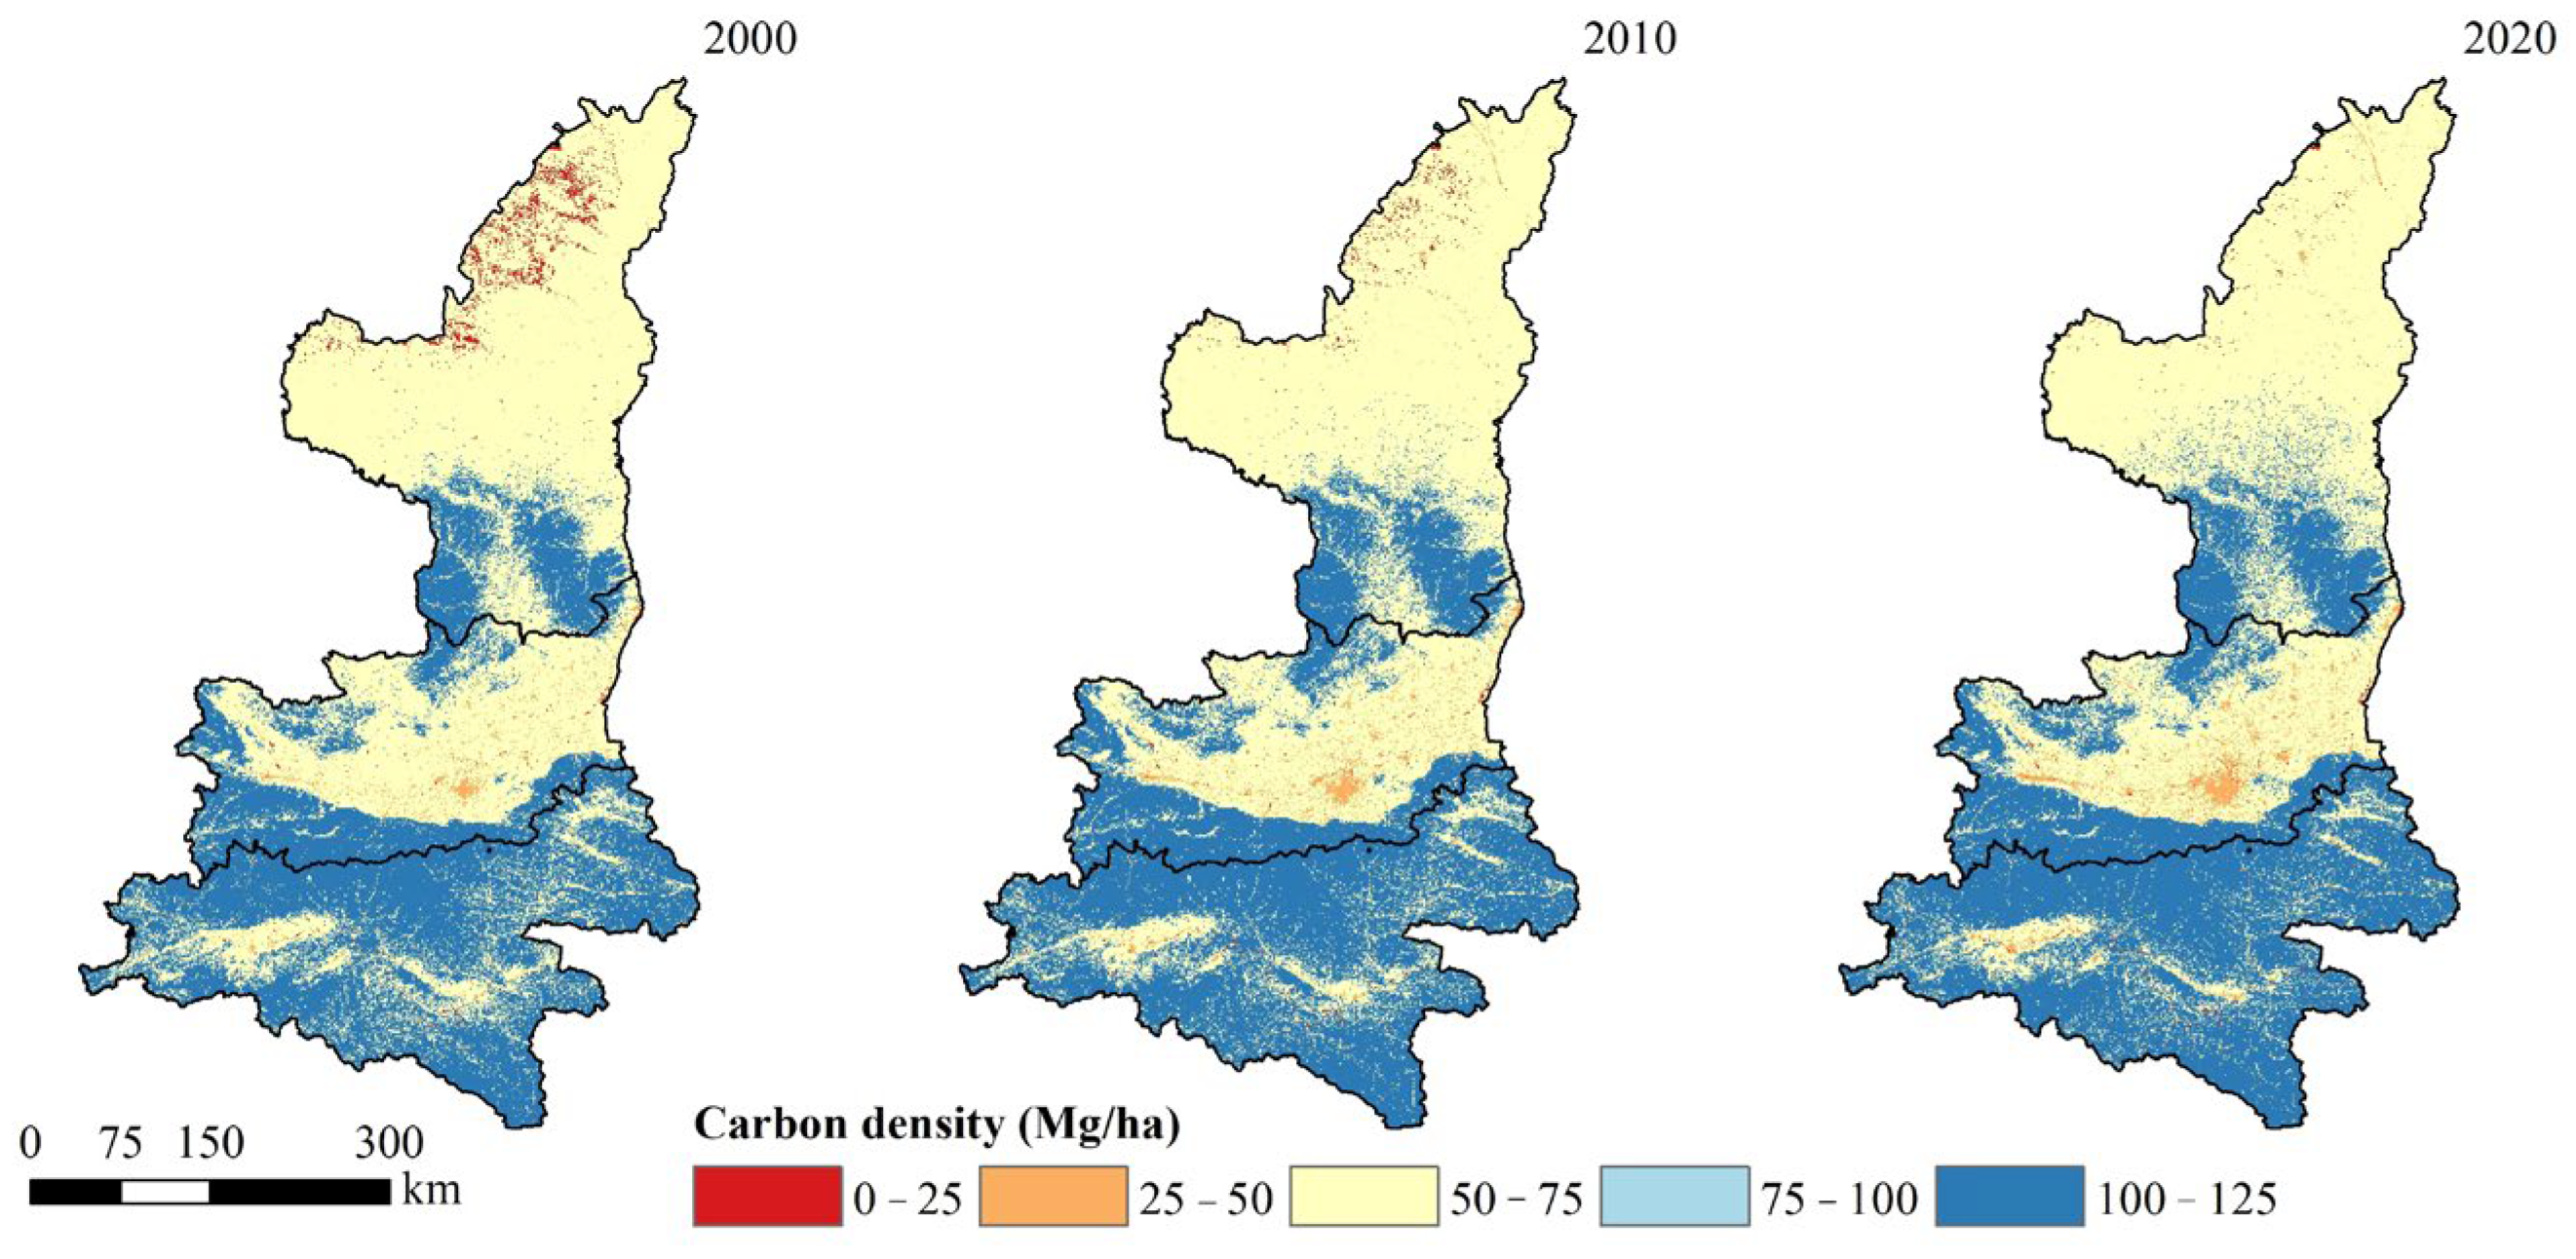
As illustrated in Figure 5, the average carbon density of SP increased from 82.12 Mg/ha in 2000 to 83.95 Mg/ha in 2020, representing a 2.23% increase over the 20-year period. Overall, carbon density exhibited a slight upward trend. Areas with a carbon density > 75 Mg/ha were mainly concentrated in Shannan, southwestern Guanzhong, and southern Shanbei. Throughout the study period, the average carbon density consistently followed a spatial gradient of Shannan > Guanzhong > Shanbei, with all three sub-regions demonstrating slight increases. In 2000, the carbon density in Shannan reached 99.33 Mg/ha, while the average carbon densities in Guanzhong and Shanbei accounted for 84.16% and 79.08% of that in Shannan, respectively. Compared with 2000, the average carbon density in Shannan increased by 1.86% in 2010 and 3.18% in 2020. Similar upward trends were observed in Shanbei (increases of 1.63% and 2.57% for the respective years) and Guanzhong (increases of 0.33% and 0.39%).
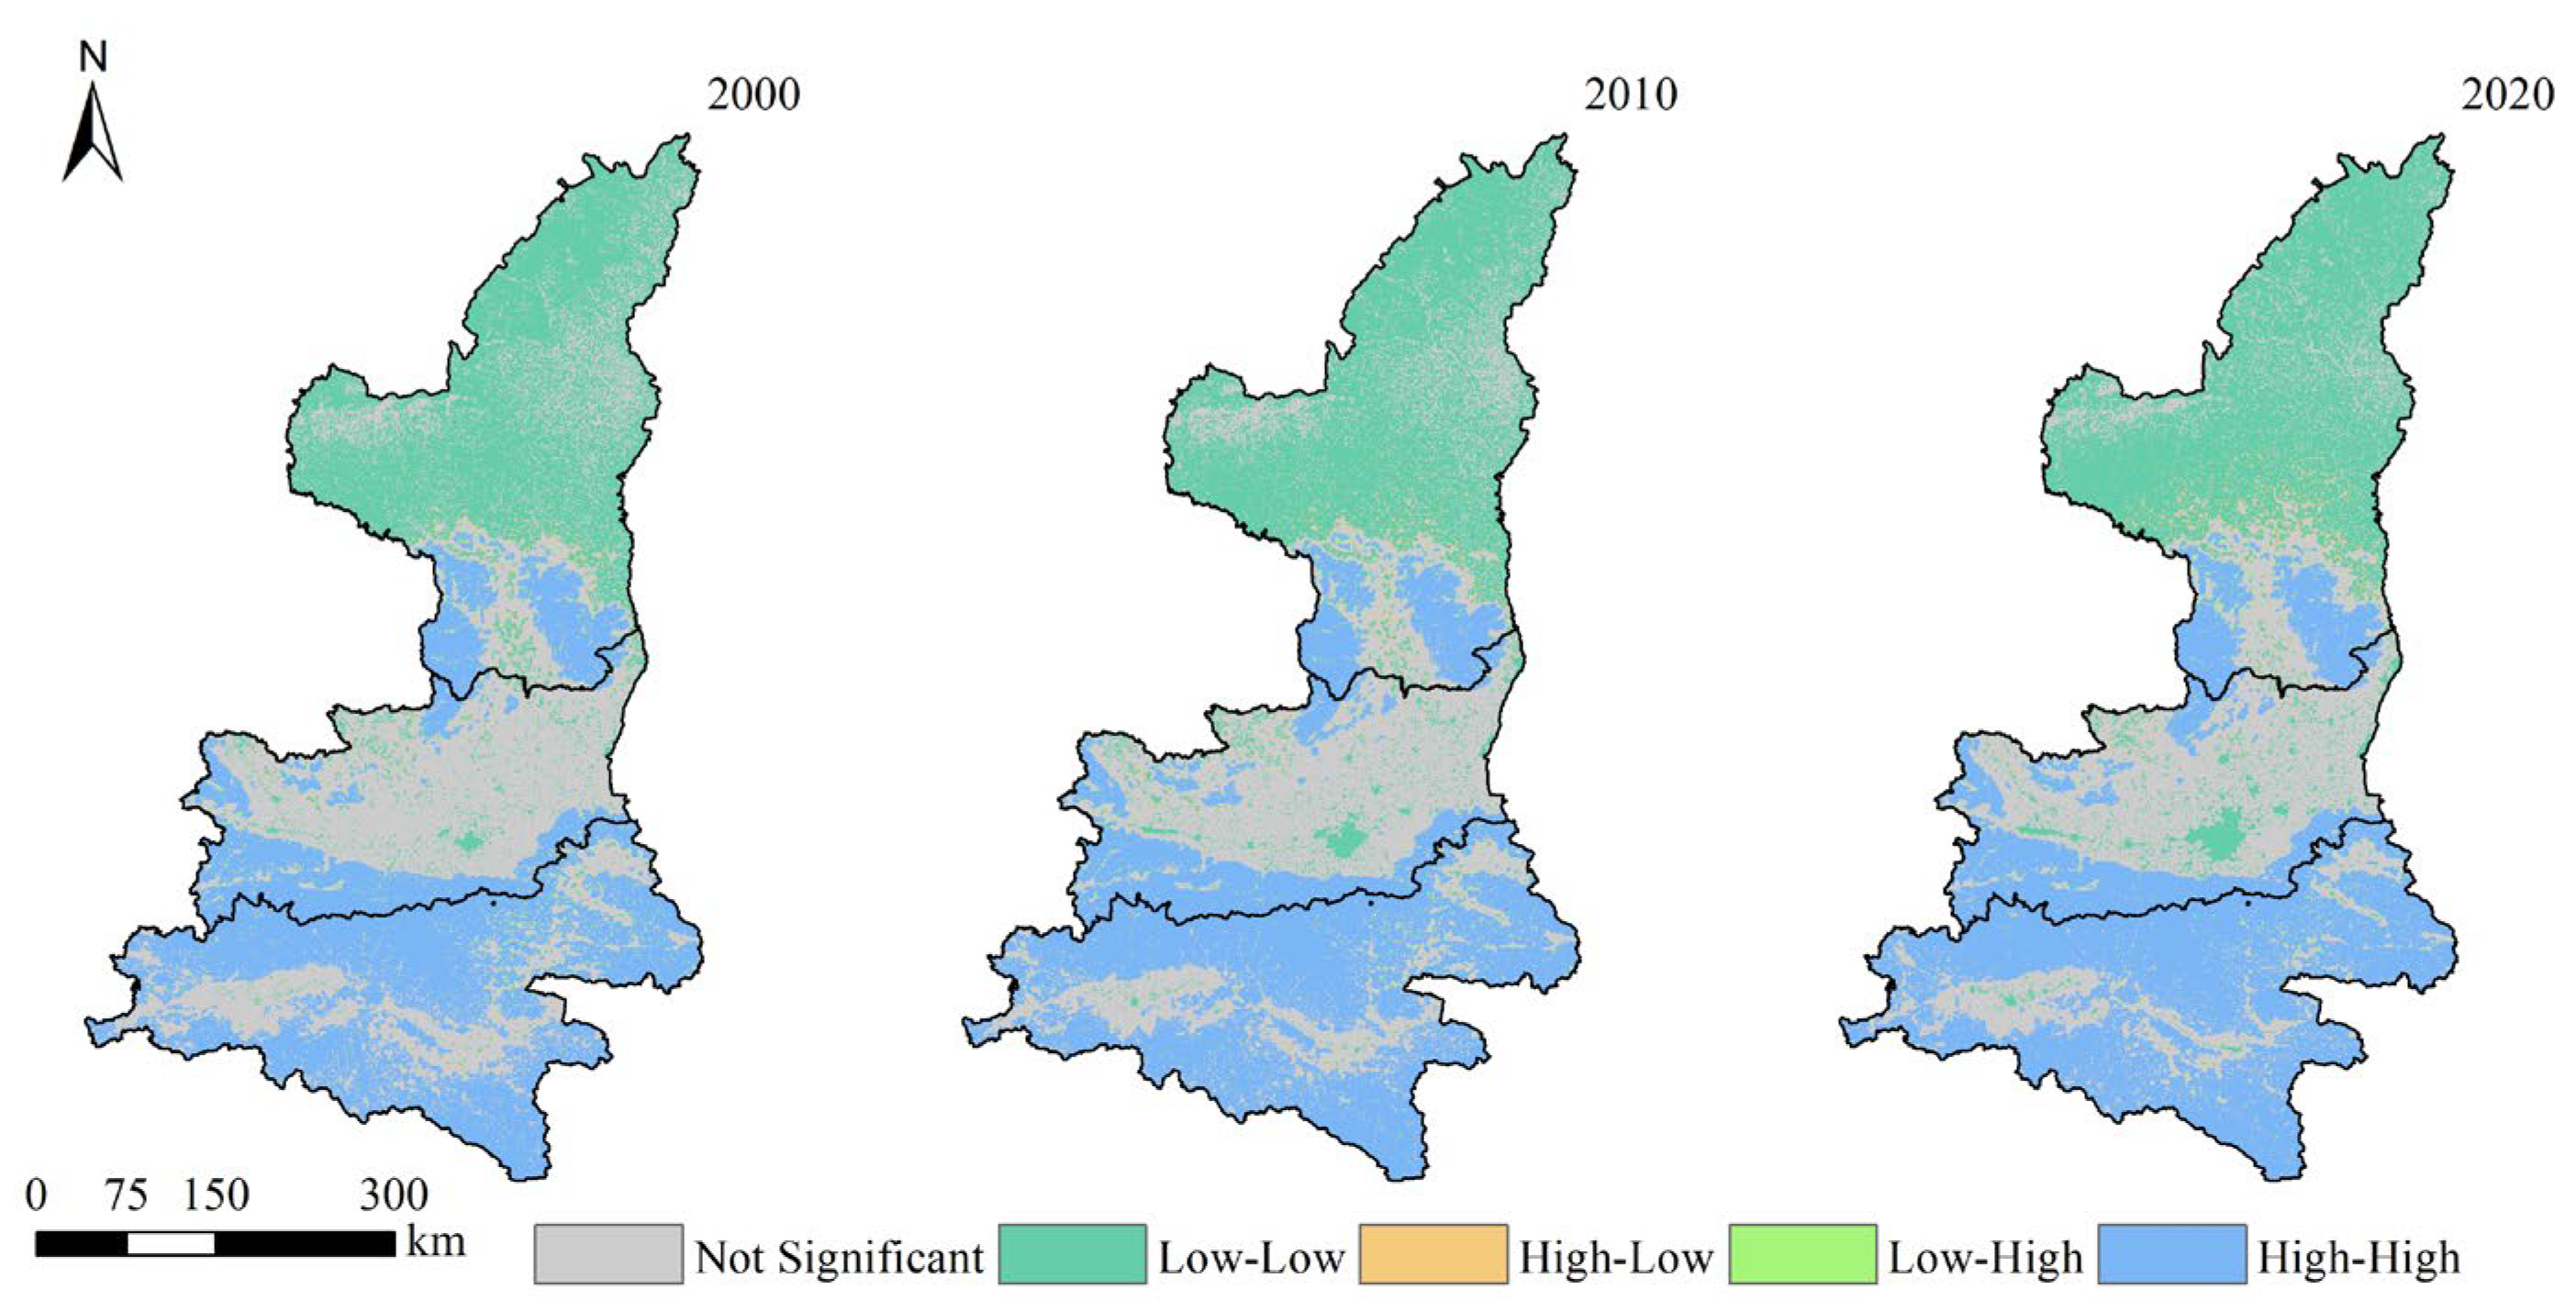
In Figure 6, Moran’s I values were consistently >0.68, accompanied by low expected values and variances, with p-values < 0.001 (Table 3); these findings indicate that carbon density exhibited clear spatial clustering characteristics.
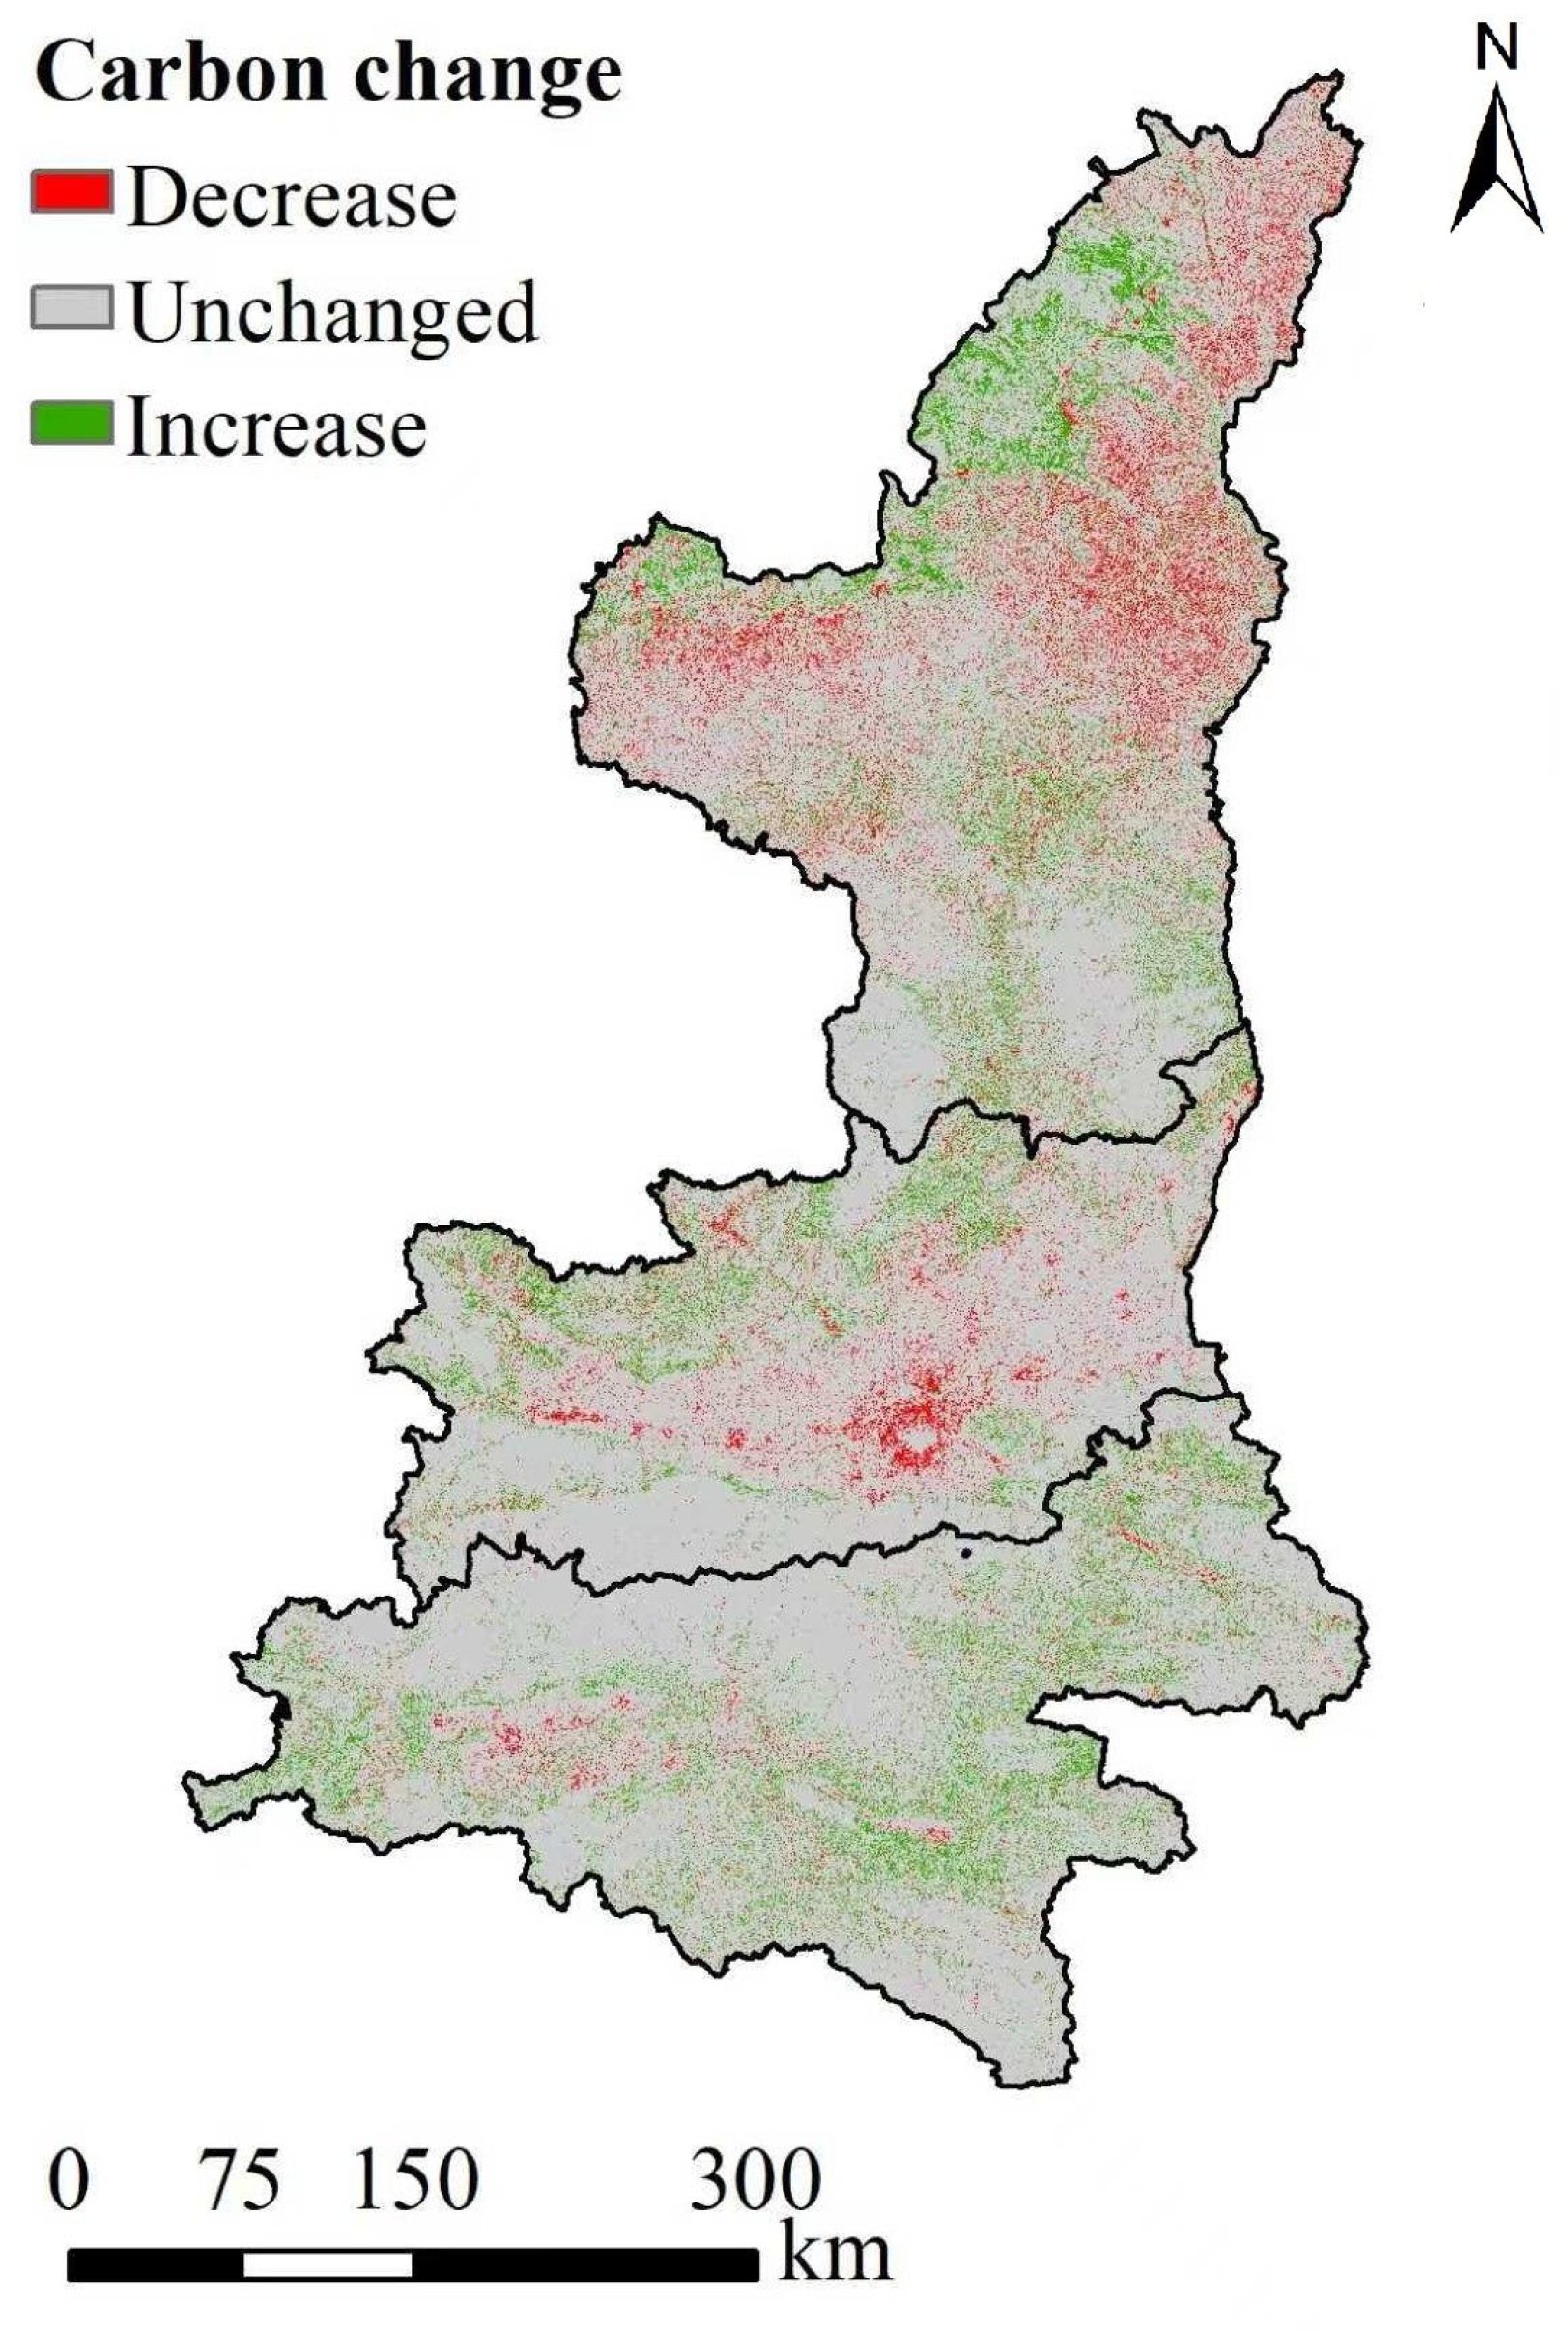
Total carbon storage in SP increased from 1688.55 Tg in 2000 to 1726.12 Tg in 2020 (Figure 7). During this period, 84.22% of the total area showed no change in carbon storage, while 9.38% exhibited an increase and 6.40% experienced a decrease. These declines were mainly concentrated in Shanbei and Guanzhong. Spatially, the total carbon storage consistently followed the order of Shannan > Shanbei > Guanzhong throughout the study period, with all three sub-regions experiencing slight increases. At the sub-regional level, the areas exhibiting increased carbon storage accounted for 10.07%, 10.46%, and 6.92% of Shannan, Shanbei, and Guanzhong, respectively; conversely, the areas experiencing a decrease accounted for 2.45%, 9.95%, and 6.06% of these regions, respectively.

3.3. Changes in Carbon Storage Under Different Land-Use Types

As shown in Table 4, forest land had the largest carbon storage, holding 928.42 Tg, 988.21 Tg, and 1040.50 Tg in 2000, 2010, and 2020, respectively. Over this period, its contribution to the total carbon storage steadily increased from 54.98% to 60.28%. From 2000 to 2020, the combined carbon storage from cropland and grassland decreased from 742.08 Tg to 670.14 Tg, with their combined proportion decreasing from 43.95% to 38.82%. The proportion of all other land-use types consistently accounted for less than 2% of the total, thereby contributing minimally to the regional carbon sink.
According to the carbon storage transfer matrices for different land-use types (Table 5 and Table 6), the conversion of cropland and grassland into forest land increased carbon storage. These transitions contributed to carbon storage increases of 43.02 Tg in 2010 and 38.63 Tg in 2020. Conversely, the conversion of cropland into grassland, forest land into cropland, and cropland into impervious land resulted in carbon storage losses. These changes reduced carbon storage by 20.63 Tg in 2010 and 24.46 Tg in 2020. Overall, the net increases in carbon storage in SP in 2010 and 2020 were 23.16 Tg and 14.41 Tg, respectively. Among these regions, the carbon storage increment in Shannan was the highest, while that in Guanzhong was the lowest.

3.4. Factors Influencing Carbon Storage Changes

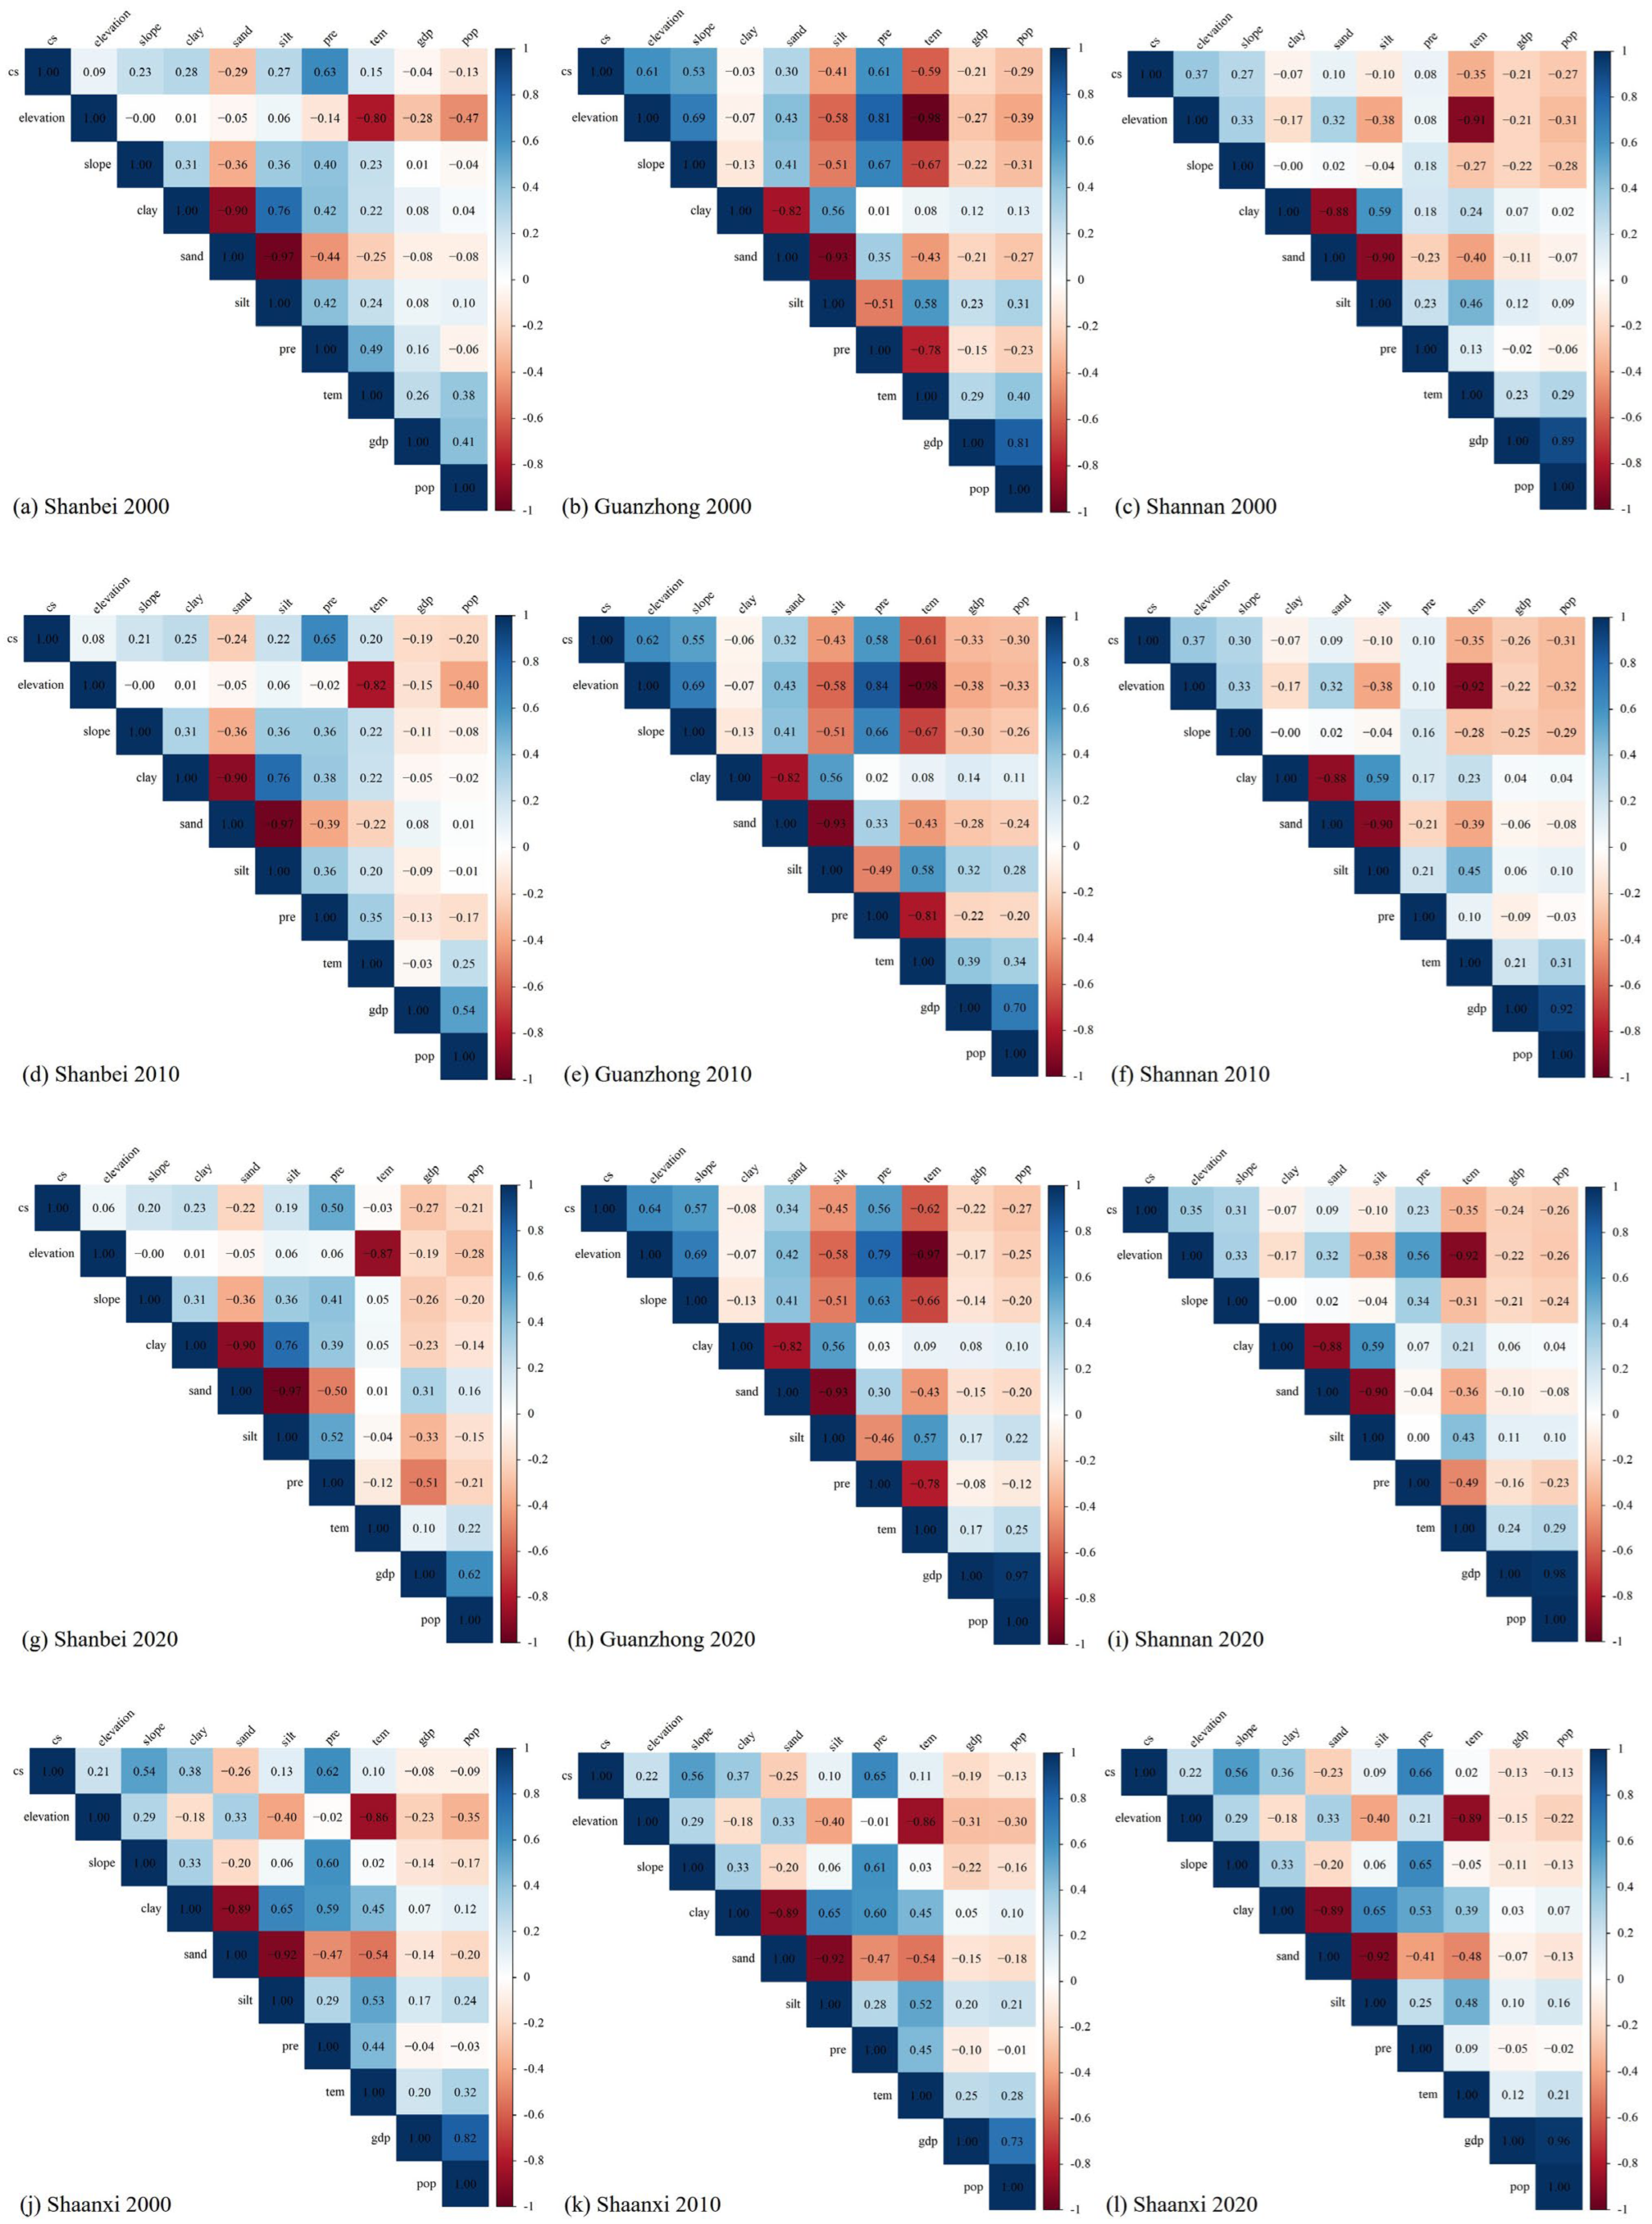
As illustrated in Figure 8, carbon storage in Shanbei generally exhibited positive correlations with elevation, slope, precipitation, and soil clay and silt contents, while showing negative correlations with soil sand content, GDP, and POP. In both Guanzhong and Shannan, carbon storage was positively correlated with elevation, slope, precipitation, and soil sand content, but negatively correlated with temperature, GDP, POP, and soil clay and silt contents. At the provincial scale, carbon storage consistently showed positive correlations with elevation, slope, precipitation, temperature, and soil clay and silt contents, whereas it correlated negatively with GDP, POP, and soil sand content (Figure 8j–l). The factor with the strongest positive correlation with carbon storage was precipitation (Pearson correlation coefficients of 0.62, 0.65, and 0.66 in 2000, 2010, and 2020, respectively), followed by slope (0.54, 0.56, and 0.56). Conversely, the factor with the strongest negative correlation was soil sand content, with coefficients of −0.26, −0.25, and −0.23 for the respective years.
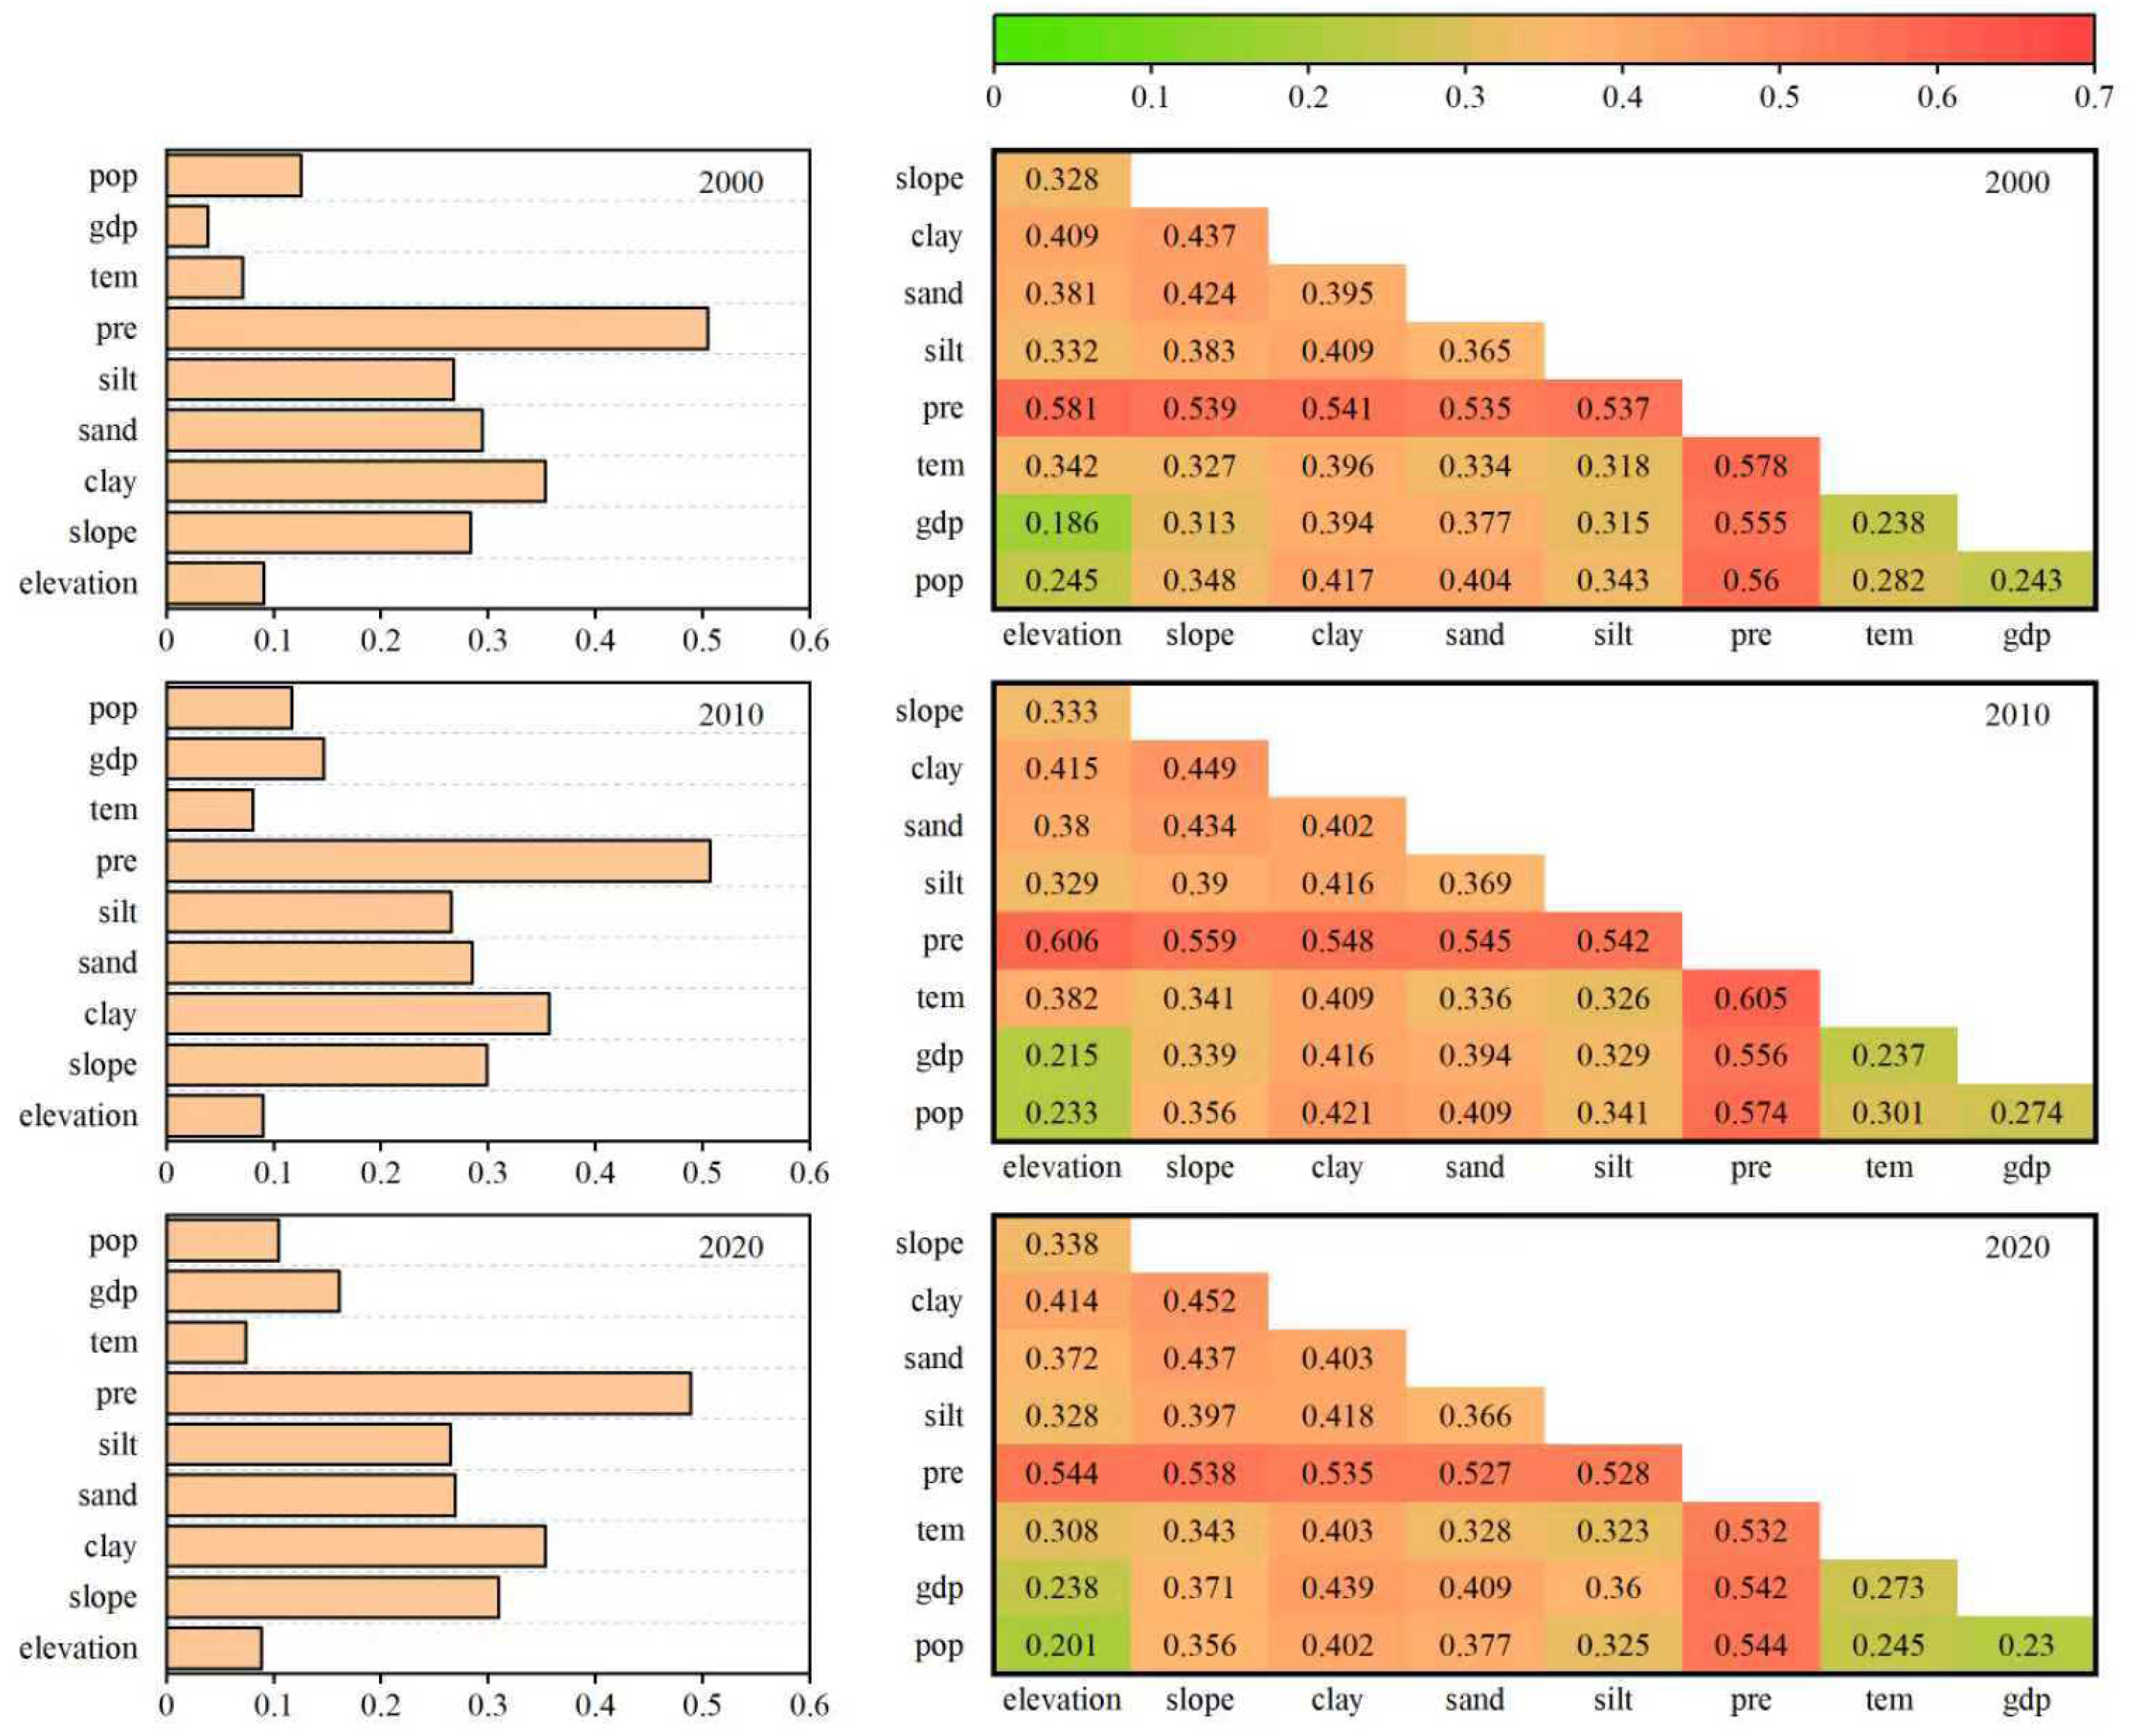
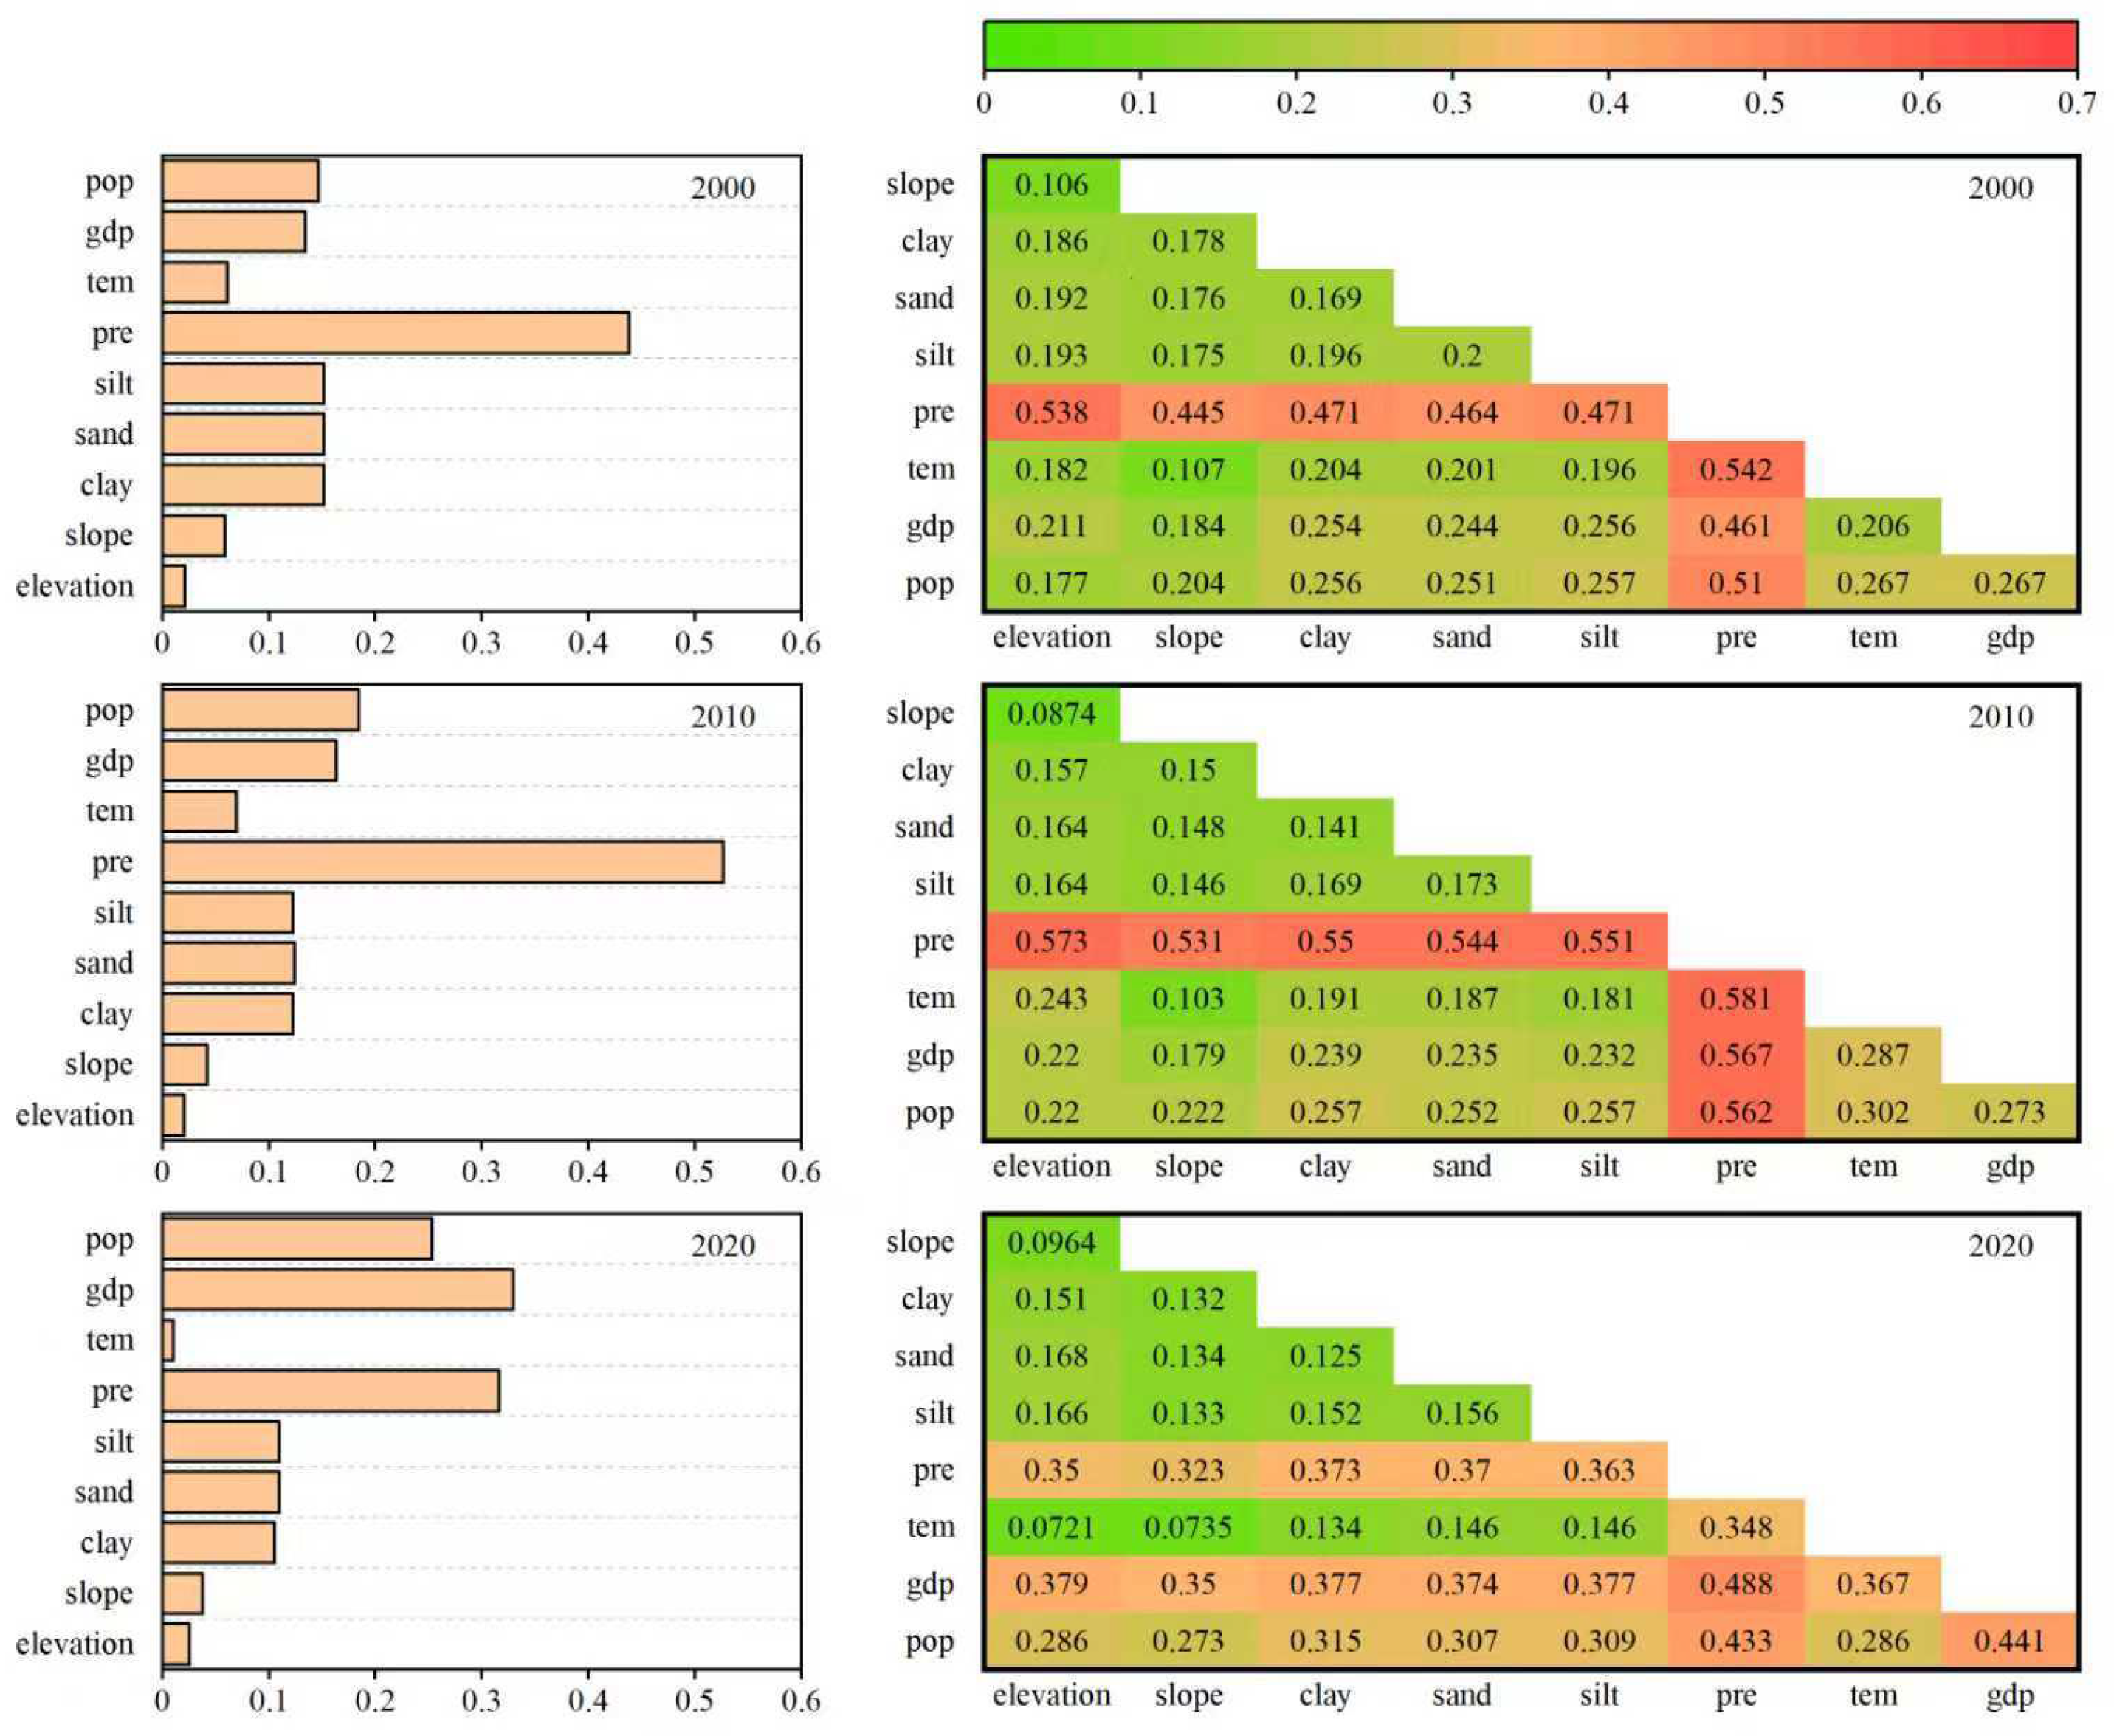
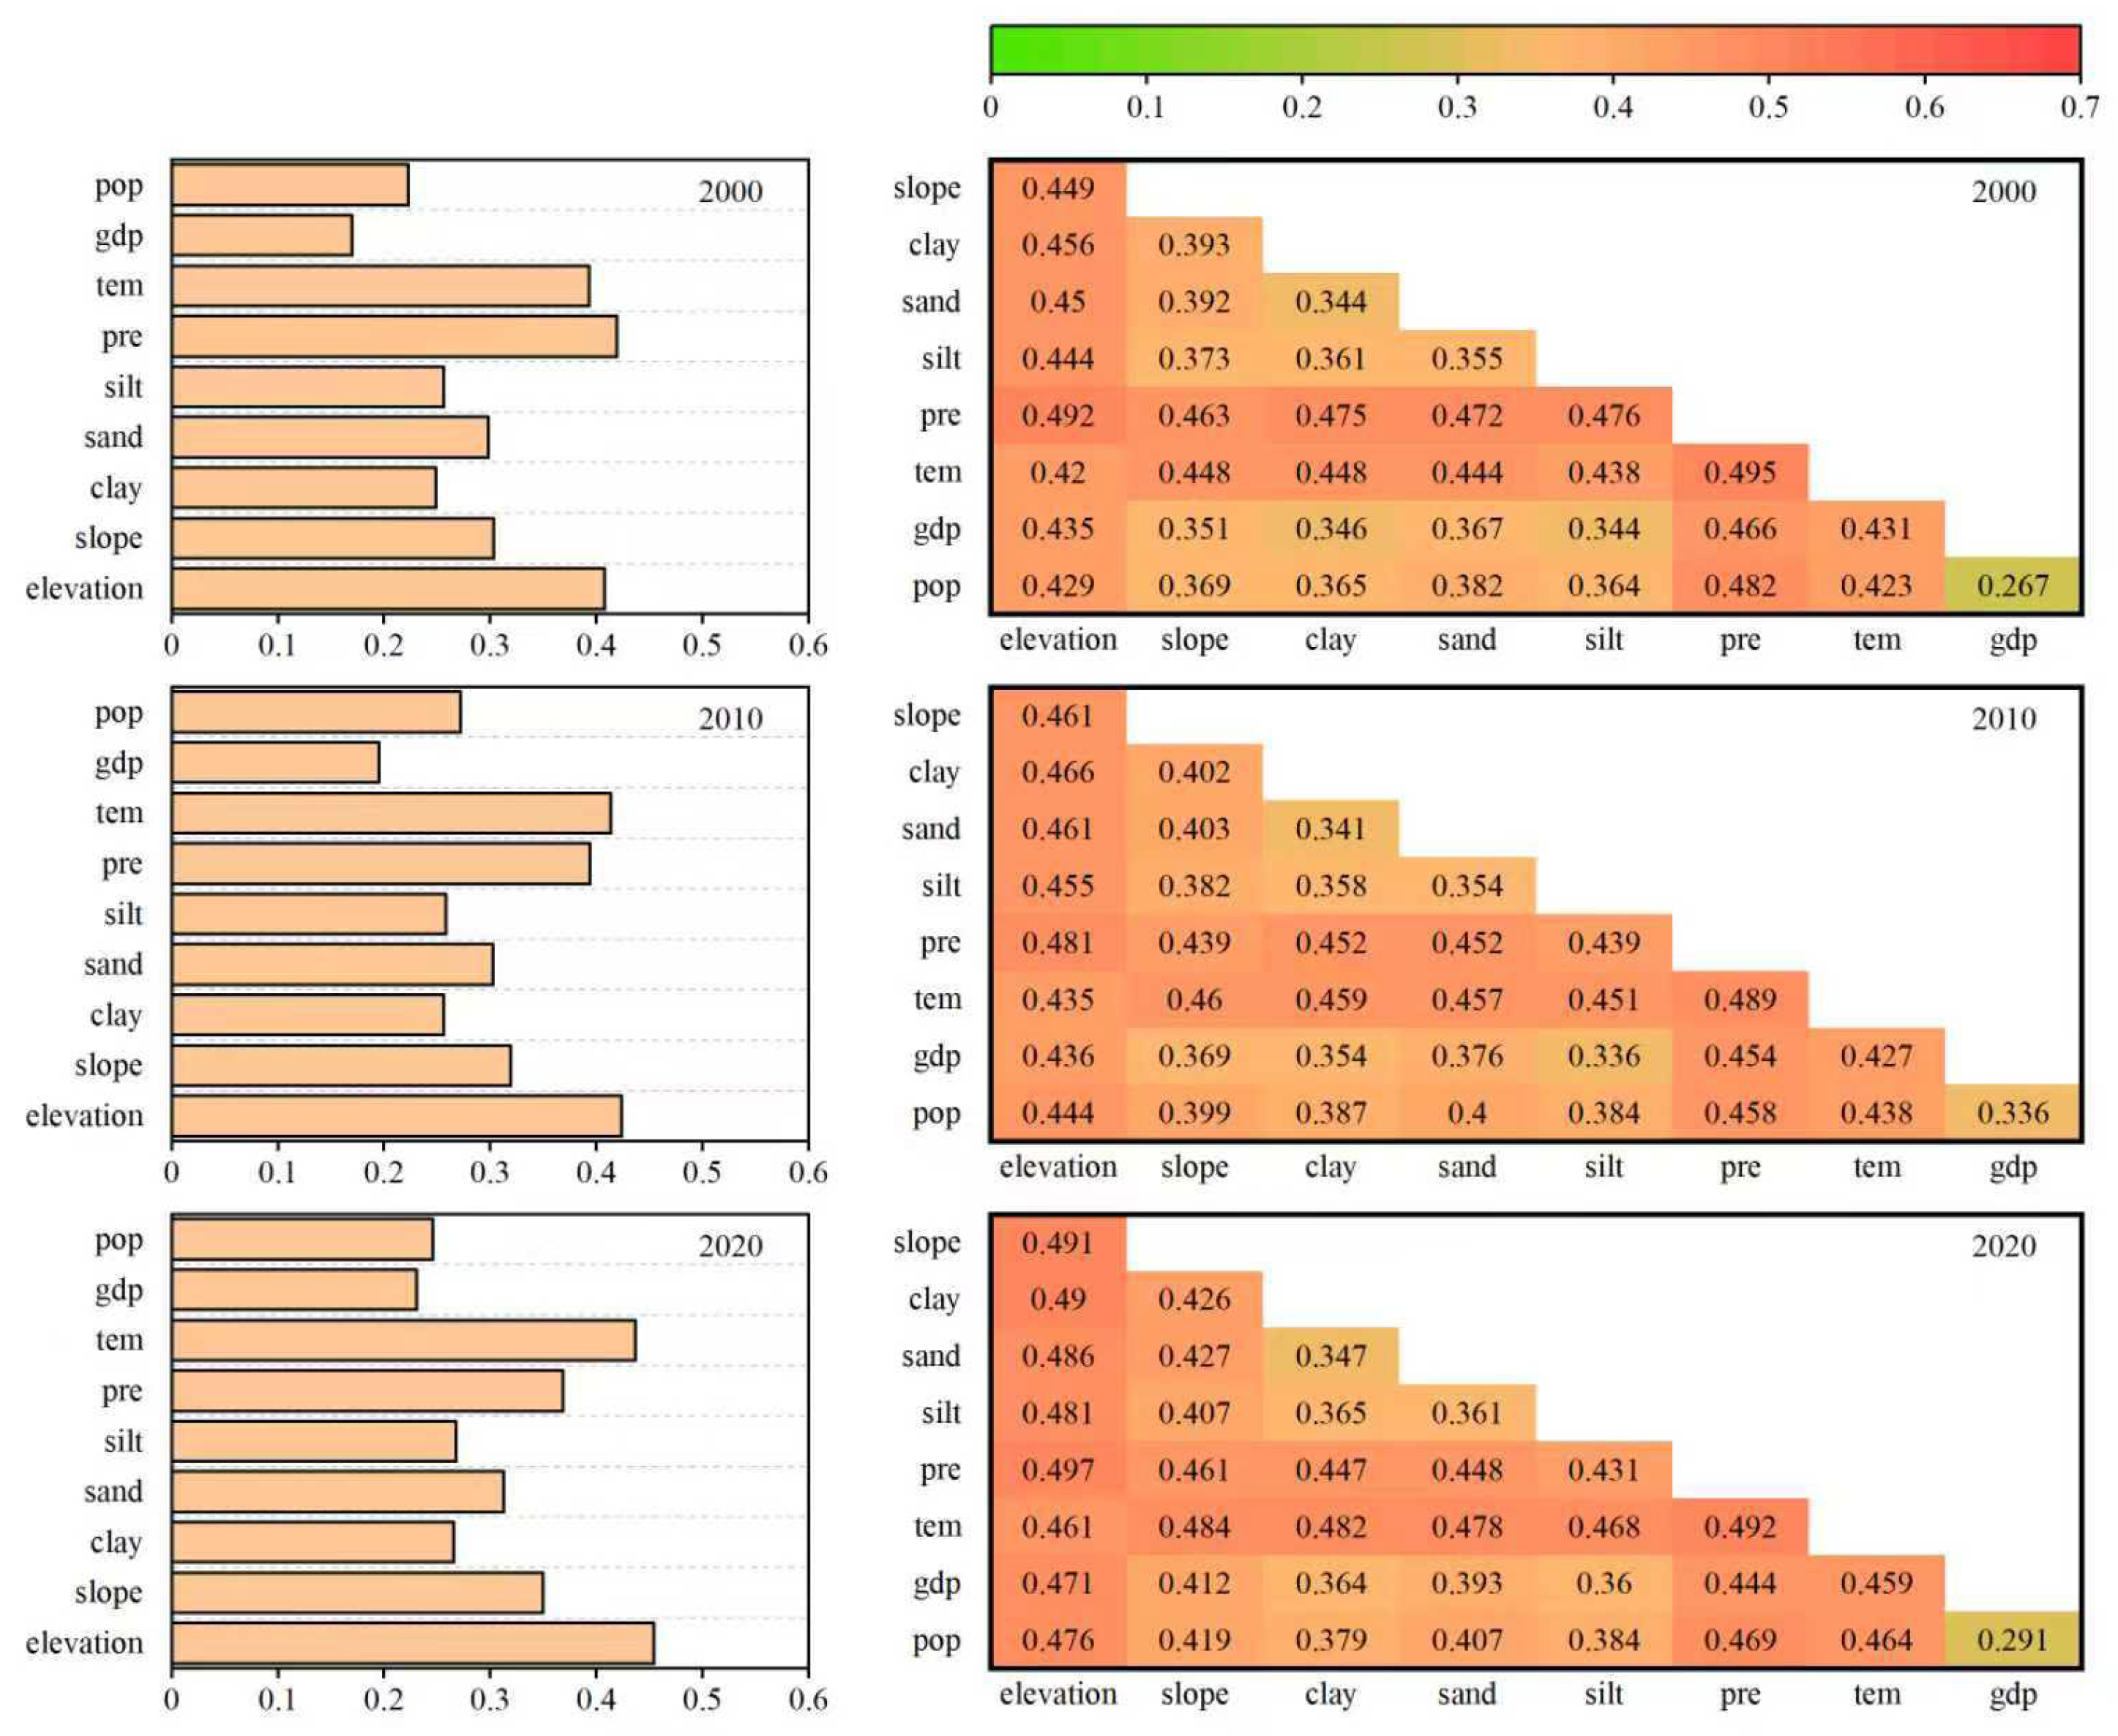
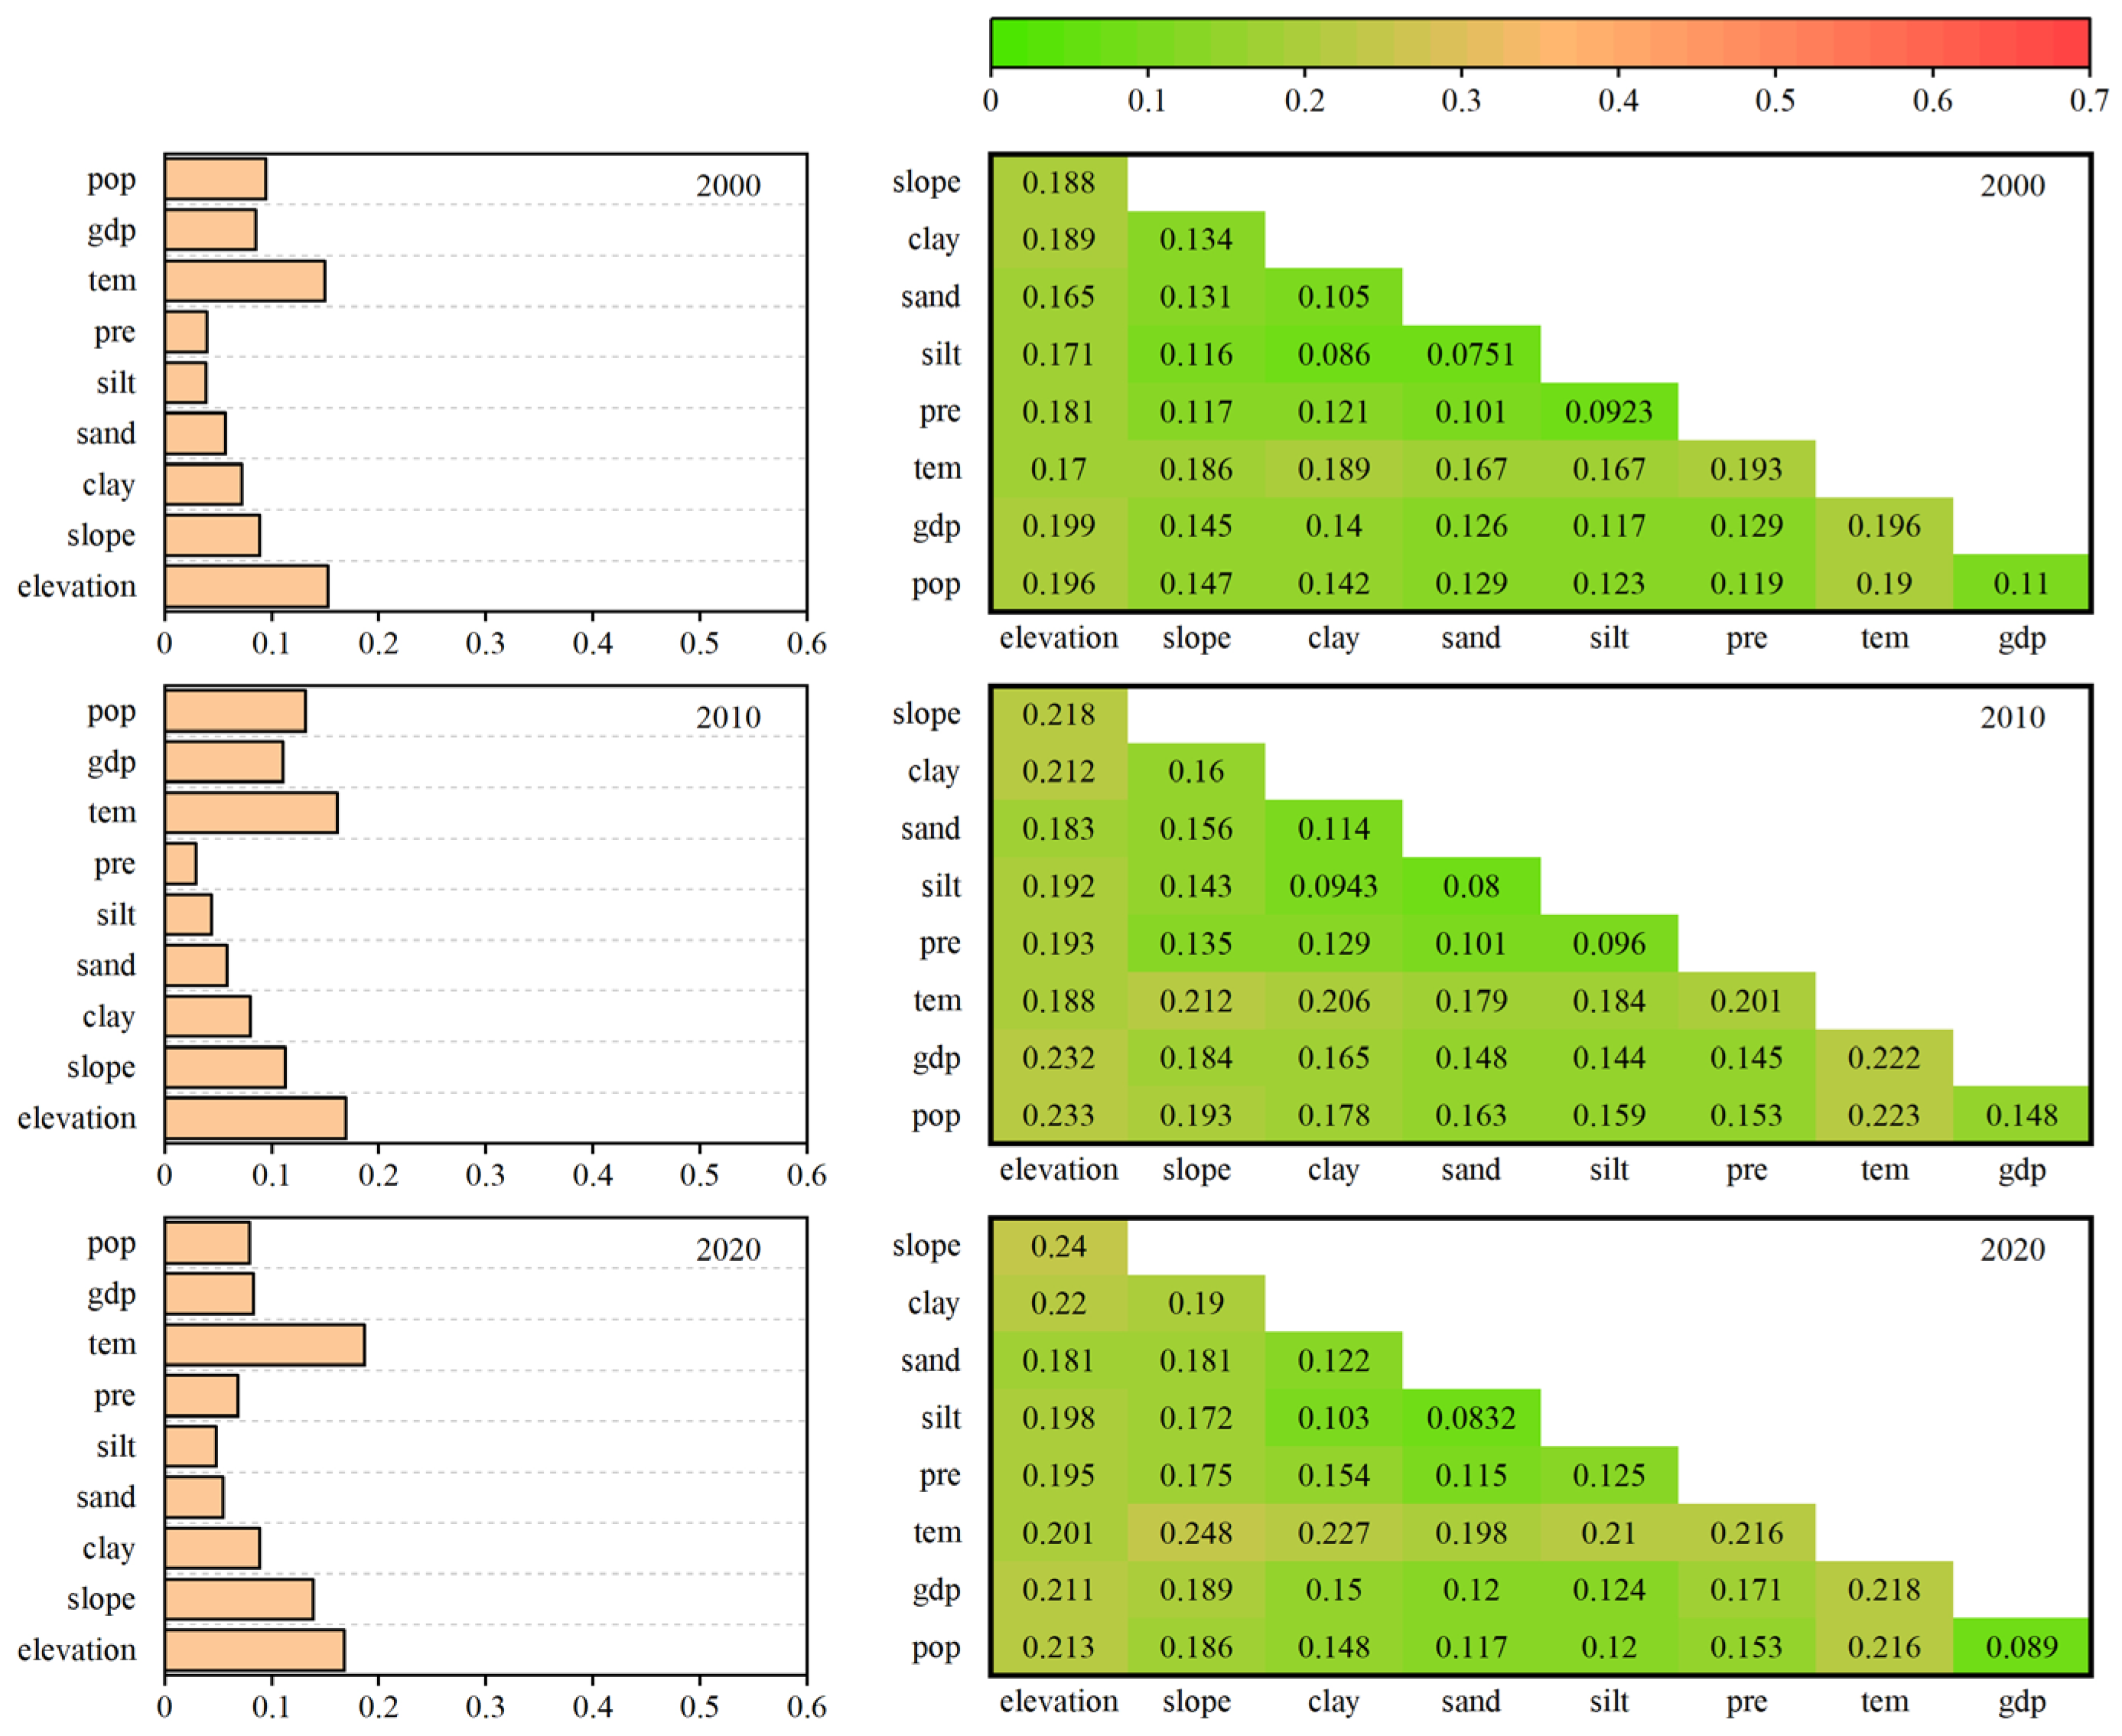
According to the OPGD results (Figure 9, Figure A1, Figure A2 and Figure A3), precipitation was identified as the principal single determinant of carbon storage in SP across all three years, yielding q-values of 0.51, 0.51, and 0.49 in 2000, 2010, and 2020, respectively. At the provincial scale, interactions involving precipitation consistently accounted for over 50% of the explanatory power. In 2000 and 2010, the interactions of precipitation with elevation and temperature had the highest explanatory power (q = 0.58 and q = 0.61, respectively). By 2020, the most influential interactions involved precipitation with elevation, slope, soil clay content, GDP, and POP, all yielding q-values of around 0.54.
At the sub-regional level, the interaction between precipitation and elevation in Shanbei demonstrated greater explanatory power in 2010 (q = 0.5732) than in 2000 (q = 0.538). However, by 2020, the interaction between GDP and elevation exerted the strongest influence in this region (q = 0.3785). In Guanzhong, the interaction between precipitation and elevation consistently exhibited the highest explanatory power, with q-values of 0.492, 0.4812, and 0.497 for 2000, 2010, and 2020, respectively. In Shannan, the explanatory power of the interaction between POP and elevation increased over time (q = 0.1956, 0.2329, and 0.2399, respectively).

4. Discussion

4.1. Land Use Leads to Changes in Carbon Storage

The regional carbon pool is largely regulated by land-use-driven variations in soil and vegetation carbon sinks [55,56]. Over the past two decades, both total carbon storage and average carbon density in SP have continuously increased, with overall gains of 37.57 Tg and 1.83 Mg/ha, respectively, indicating a substantial improvement in the region’s ecosystem service functions. The observed upward trend in SP’s total carbon storage aligns with findings from other regions, such as Guizhou Province, the Three-River Source, the Hexi Region, and coastal areas of Bangladesh. However, because the carbon storage potential inherently varies across different ecosystems [56,57], the specific mechanisms driving these increases differ among regions, primarily encompassing vegetation restoration and land-use transformations. These findings suggest that implementing environmental protection measures to expand high-density carbon sinks (e.g., forest land and grassland), while limiting low-carbon-density areas like impervious land, can effectively enhance regional carbon storage [58,59,60].
From 2000 to 2020, the expansion of forest land led to an increase of 112.08 Tg in carbon storage, while the reduction in cropland resulted in a decrease of 76.50 Tg. Spatially, the increases in carbon storage were mainly concentrated in northwest Shanbei and Shannan, while the decreases were primarily observed in central Shanbei and Guanzhong (Figure 5). Over the past 20 years, large areas of cropland were converted into forest land and grassland [61]. Specifically, 2417.24 km2 of barren land in Shanbei was transformed into grassland, yielding a net increment of 9.72 Tg. In Shannan, 5570.29 km2 of cropland and 1168.77 km2 of grassland were converted into forest land, generating a net increment of 22.12 Tg. However, a large area of cropland (10,044.86 km2) in Shanbei was converted into grassland instead of forest land. Due to geographic and climatic conditions, the aboveground biomass of cropland in Shanbei was higher than that of grassland. Despite this, total carbon storage in Shanbei still increased, achieving a net increment of 13.64 Tg. Moreover, large-scale urban expansion in Guanzhong led to a reduction of 2220.44 km2 in cropland, accompanied by an increase of 2014.55 km2 in impervious land, ultimately resulting in a decline in carbon storage [56].
Carbon density serves as an objective indicator of regional carbon sequestration capacity. In 2020, the carbon density values for the Beijing-Tianjin-Hebei region [62], the coastal cities of Shandong Province [63], and Fuzhou City [64] were 78.12 Mg/ha, 63.84 Mg/ha, and 81.32 Mg/ha, respectively. Notably, all of these values were lower than that of SP (83.95 Mg/ha). The observed differences are largely attributed to accelerated urban economic growth, which has driven the widespread replacement of forest land and grassland areas by impervious land and cropland. In contrast, Guizhou Province, with over 60% forest coverage and the implementation of the national high-quality development strategies, has experienced the substantial conversion of cropland into forest land. Consequently, this has resulted in a 2020 carbon density that is 2.35 times higher than that of SP [58].

4.2. Factors Affecting Carbon Storage

4.2.1. Factors Affecting Carbon Storage Changes

Carbon storage in SP exhibits pronounced regional characteristics, primarily driven by differences in climate, vegetation cover, and land-use types. Shannan, located in the Qinling-Daba Mountains, benefits from favorable moisture and thermal conditions, supporting a widespread distribution of evergreen forest land. Consequently, its vegetation productivity and biomass carbon density are significantly higher than those in Shanbei [65]. Guanzhong is predominantly covered by cropland and planted forests; the Grain for Green Program (GGP) has driven substantial increases in vegetation cover [66,67], thereby greatly enhancing regional carbon storage. In contrast, the loess hilly and gully areas of Shanbei are dominated by grassland and planted forest, which are characterized by sparse vegetation and slow biomass accumulation. Furthermore, the soil organic carbon content in this region is generally low [68], resulting in carbon storage capacity that is markedly lower than that of Shannan. Differences in vegetation types also affect litter input and root distribution patterns, influencing microbial community composition and soil enzyme activities [69,70]. Studies indicate that broadleaf forests yield higher litter biomass with lower carbon-to-nitrogen ratios, facilitating rapid microbial decomposition and subsequent sequestration into stable carbon pools. In contrast, the litter from grassland and shrubland exhibits high lignin content, slow decomposition rates, and limited carbon sequestration efficiency [71,72]. Spatial gradients in climatic factors and topography further exacerbate these regional variations in carbon storage [73,74]. Shannan receives a mean annual precipitation of 800–1200 mm, contributing 26.16% of the province’s total carbon storage; this humid climate promotes vegetation growth. Conversely, Shanbei receives less than 500 mm of mean annual precipitation. The resulting aridity stress severely restricts vegetation cover, limiting its contribution to only 19.3% of the province’s total carbon storage [75]. Thus, precipitation emerges as the most significant factor influencing carbon storage in SP, interacting strongly with other environmental and socioeconomic factors.
Previous studies indicate that SP experienced a rapid decrease in carbon storage from 1980 to 2000, with an average annual decrease of 0.2% [76,77]. During this period, extensive land reclamation led to losses in soil carbon storage. In Shanbei, overgrazing and energy development exacerbated this trend, resulting in a rate of carbon density decline that was 1.8 times higher than that of Shannan. After 2000, policy intervention became the dominant factor influencing carbon storage dynamics [78,79]. In Shannan, where abundant rainfall facilitates vegetation restoration, increases in carbon density occurred 5–8 years earlier than in Shanbei [80]. This study found that during the periods 2000–2010 and 2010–2020, forest land covering 989.80 km2 and 1547.82 km2 was converted into other land-use types, resulting in carbon storage losses of 4,037,702 Mg and 6,198,472 Mg, respectively. Research indicates that between 1980 and 2020, SP experienced a reduction of 12,430.34 km2 in cropland, with 67% of this area converted into forest land and grassland. This conversion manifested as a 36.36% increase in carbon density in the Qinling-Daba Mountains. Cropland conversion into impervious land led to losses in carbon reserves in Shanbei.

4.2.2. Differences in Carbon Storage Between Regions

Carbon storage variations in SP exhibit distinct regional differences, primarily resulting from socioeconomic and natural geographic conditions. Li et al. [81] confirmed that the significance of factors influencing carbon storage changes varies markedly across regions. Analysis of the individual and interactive effects via the geographic detector reveals that the explanatory power of any two interacting drivers consistently exceeds that of any single driver. Huo and Sun [82] reported a similar conclusion, indicating that spatial variations in regional carbon storage patterns are a composite outcome of multiple interacting drivers.
Shanbei’s carbon storage changes are mainly affected by precipitation, GDP, and POP. As a typical arid region of the Loess Plateau, the area’s carbon storage potential is highly dependent on vegetation restoration. Precipitation directly determines vegetation conditions, while GDP and POP exert indirect effects through ecological projects and land-use practices. Previous research indicates that carbon storage in Shanbei is highly sensitive to policies and socioeconomic activities [83]. In recent years, economic growth has been accompanied by ecological conservation and the development of artificial carbon sinks, achieving a synergistic increase in both GDP and carbon storage. Although POP may exert pressure on land resources, carbon storage can still be enhanced through scientific management, particularly in artificial carbon sinks. In contrast, carbon storage changes in Guanzhong are mainly affected by elevation, temperature, and precipitation. In this transitional region, these changes are jointly driven by climatic conditions and land management practices. In Shannan, carbon storage changes are predominantly affected by natural factors such as temperature, elevation, and slope. This region is primarily composed of mountainous forests, where carbon storage remains in the accumulation stage due to the relatively immature stand age [27]. This difference in carbon storage between the north and south is largely influenced by the Qinling Mountains, which significantly alter regional climate and topography [84,85].
Overall, carbon storage in Shanbei is more heavily influenced by socioeconomic factors, whereas in Shannan, it is predominantly governed by natural environmental conditions. Guanzhong acts as a transitional zone where human activities and natural factors jointly influence carbon storage changes. These regional differences highlight the spatial heterogeneity of the factors influencing carbon storage across SP.

4.3. Uncertainties and Limitations

In this study, carbon storage changes in SP were efficiently assessed using the InVEST model. However, such estimation inevitably involves uncertainties. The temporal and spatial resolutions of land-use-based carbon datasets vary considerably, and the acquisition and accurate calibration of model parameters remain challenging [86]. Therefore, two relatively detailed carbon data sources were selected in this study, both of which underwent rigorous data screening and quality control during the initial data acquisition process, thereby providing high-precision and reliable carbon density data [87]. In addition, the model relies on historical land-use dynamics and ignores the impacts of regional government policies, technological progress, and socioeconomic changes [88]; furthermore, its static assessment framework overlooks internal variations caused by factors such as stand age, tree species composition, and management intensity. These limitations are particularly evident when assessing regional carbon dynamics and land degradation in response to climate change or disturbance scenarios [89].
In Shanbei, the InVEST model neglects the continuous carbon accumulation associated with increasing stand age following the implementation of the GGP. Studies conducted on the Loess Plateau indicate that the ecosystem carbon storage of Pinus tabuliformis and Robinia pseudoacacia planted under the GGP can increase substantially from 70 Mg/ha to over 300 Mg/ha as stand age increases [90]. In assessing the carbon sink of the GGP on the Loess Plateau, Deng et al. [91] explicitly pointed out that the soil carbon sequestration rate (0.29 Mg ha−1 yr−1) is highly dependent on the restoration age. Research has further confirmed that in Shaanxi Province, the impact of forest land expansion and forest growth on carbon storage is almost equivalent [27]. Furthermore, the GGP generates an additional vegetation carbon sink of 4.29 Tg yr−1 [92]. Therefore, by using a single carbon density value to represent afforested land, the InVEST model significantly underestimates the carbon sink potential of young and middle-aged forests. Driven by the GGP, the areas of grassland and forest land have increased significantly, and there remains considerable potential for further growth in carbon storage. Therefore, the actual carbon sink capacity is expected to be higher than current estimates. Although uncertainty may affect the specific magnitude of changes in carbon storage, the spatial pattern and direction of these changes are reliable.
Guanzhong is a typical agricultural region. Long-term human activities and conventional tillage can easily lead to the latent loss of SOC, and the static model masks this soil degradation process. Agricultural activities such as irrigation and fertilization significantly affect the SOC within the 0–60 cm soil profile; hence, monitoring carbon dynamics solely in the topsoil (<30 cm) can lead to a severe underestimation of carbon losses or an overestimation of carbon sinks [93]. Consequently, the InVEST model fails to capture the dynamic effects of management practices. Moreover, because the expansion of impervious land area exceeds the contraction of cropland area, the actual carbon loss may be greater than that reported in this study.
Shannan is dominated by mature forests, with minimal changes in land-use types. Carbon storage in this region is primarily contributed by extensive forest land and is largely controlled by stable natural environmental conditions. Research by Liu et al. [94] on vegetation in the Qinling region revealed that carbon use efficiency exhibits a nonlinear trend with increasing elevation, reflecting the complex impact of vertical climate gradients on carbon dynamics. Furthermore, Ge et al. [95] pointed out that the steady-state assumption significantly underestimates the mean carbon turnover time, leading to an underestimation of forest ecosystem productivity. Analyzing the nonlinear relationships among ecosystem services, climate fluctuations, and vegetation coverage remains a formidable challenge; moreover, these relationships are particularly elusive in complex mountainous terrains [96]. From a macro perspective, the overall trend of increasing carbon storage due to land-use conversion is accurate. However, because the model fails to capture potential interannual fluctuations within forests, it may underestimate the interannual variability of carbon sinks. Given that the area of land-use change accounts for only a limited proportion of the entire region in Shannan, the resulting uncertainty is unlikely to significantly affect the observed spatial distribution of carbon storage. Therefore, the identified spatial pattern of high carbon storage remains credible.
The static InVEST model was chosen instead of a dynamic ecological model to evaluate the impacts of land-use conversion; this choice aligns with our focus on the macro-level impacts of regional land-use policies, and is beneficial for providing recommendations to government departments. At larger spatial scales, high-resolution data are an important foundation for analyzing dynamic processes, but if the use of coarse-resolution dynamic data leads to higher errors that outweigh the benefits of capturing dynamic processes, it is clearly counterproductive. Therefore, a more robust and conservative static modeling framework was chosen. Future studies should integrate field observations and remote sensing data within a multi-method framework to reduce uncertainties in carbon storage estimation [97]. The focus should be on (1) coupling process-based dynamic models with the InVEST framework; (2) developing multi-scenario and multi-model ensemble prediction frameworks to enhance the reliability and scientific value of carbon storage assessments; and (3) incorporating future land-use scenarios, such as SSP-RCP scenarios, to simulate potential changes in carbon storage under different development paths.
Overall, the uncertainty associated with the static InVEST framework primarily affects the absolute magnitude of estimated carbon storage, rather than the relative spatial patterns and regional differences identified in this study. Although carbon sequestration in afforested areas may be underestimated and soil carbon dynamics in agricultural regions may not be fully captured, these limitations do not fundamentally alter the following main conclusions: (1) the overall increase in carbon storage in Shaanxi Province, (2) the dominant contribution of increased forest land area under ecological restoration policies to carbon gains, and (3) the contrasting effects of ecological restoration and urban expansion on regional carbon storage dynamics.

4.4. Management Suggestions

The findings confirm that land-use transitions have driven substantial changes in carbon storage in SP, with forest land contributing 60.28%. However, given the static nature of the InVEST model, future policies should shift from large-scale afforestation to sustainable forest management and structural optimization. Decision-makers should enhance ecological resilience to ensure ecosystem sustainability and effectively respond to future climate change. Accordingly, in Shanbei, close attention should be paid to soil and water conservation and water resource availability, while improving the quality of existing grassland and forest land. In Guanzhong, urban expansion boundaries and cropland protection redlines should be strictly delineated to prevent further cropland loss. Regional agricultural policies should actively promote conservation tillage practices, such as straw incorporation and organic fertilization, to restore and enhance the soil organic carbon pool in remaining cropland. In Shannan, forest protection redlines need to be prioritized, and where necessary, an ecological compensation mechanism from Guanzhong to Shannan should be established to effectively fund the long-term management of forest carbon sinks.

5. Conclusions

This study evaluated the land-use and carbon storage characteristics of Shaanxi Province, as well as Shanbei, Guanzhong, and Shannan from 2000 to 2020. In Shaanxi Province, forest land area was the largest (accounting for >40%), followed by grassland and cropland. From 2000 to 2020, the province experienced a marked decrease in cropland and barren land, while forest land and impervious land expanded significantly. The main land-use transitions were the conversions from cropland into forest land and grassland. Regionally, Shanbei is dominated by grassland, Guanzhong by cropland, and Shannan by forest land. Ecosystem carbon storage increased from 1688.55 Tg in 2000 to 1726.12 Tg in 2020, and this change was closely related to land-use changes. Forest land remained the primary carbon pool, with its proportion rising from 54.98% in 2000 to 60.28% in 2020. In contrast, the carbon storage proportion of cropland and grassland decreased from 43.95% to 38.82%. Land-use conversions contributed to carbon storage increments of 43.02 Tg and 38.63 Tg in 2010 and 2020, respectively.
We demonstrate that regional human–environmental differences lead to differences in ecosystem carbon storage. Ecosystem carbon storage in Shanbei is more strongly influenced by socioeconomic factors, while that in Shannan is predominantly governed by natural environmental conditions. Guanzhong represents an area where both natural and anthropogenic factors interact significantly. Therefore, understanding the relationships among socioeconomic development, human activities, land-use changes, and carbon storage at the regional level is essential for comprehensively characterizing carbon changes under climate change.

Author Contributions

Conceptualization, X.Q. and Y.X.; methodology, X.Z.; software, X.Z.; validation, X.D. and G.X.; formal analysis, F.Z.; investigation, W.W.; resources, Y.X.; data curation, Z.S. and H.L.; writing—original draft preparation, X.Q.; writing—review and editing, X.Q.; visualization, X.Z.; supervision, X.D.; project administration, G.X.; funding acquisition, Y.X. All authors have read and agreed to the published version of the manuscript.

Funding

This research was funded by Ecosystem Service Value Assessment Program of Shaanxi Province (No. 441122098).

Institutional Review Board Statement

Not applicable.

Informed Consent Statement

Not applicable.

Data Availability Statement

All data reported in the manuscripts are available from the corresponding author upon justified request.

Conflicts of Interest

The authors declare no conflicts of interest.

Appendix A

Figure A1. Correlation analysis of the drivers of carbon storage changes in Shanbei.
Sustainability 18 06938 g0a1
Figure A2. Correlation analysis of the drivers of carbon storage changes in Guanzhong.
Sustainability 18 06938 g0a2
Figure A3. Correlation analysis of the drivers of carbon storage changes in Shannan.
Sustainability 18 06938 g0a3

References

  1. Fang, J.; Zhu, J.; Wang, S.; Yue, C.; Shen, H. Global warming, human-induced carbon emissions, and their uncertainties. Sci. China Earth Sci. 2011, 54, 1458–1468. [Google Scholar] [CrossRef]
  2. Aminu, M.D.; Nabavi, S.A.; Rochelle, C.A.; Manovic, V. A review of developments in carbon dioxide storage. Appl. Energy 2017, 208, 1389–1419. [Google Scholar] [CrossRef]
  3. Fang, J.; Yu, G.; Liu, L.; Hu, S.; Chapin, F.S., III. Climate change, human impacts, and carbon sequestration in China. Proc. Natl. Acad. Sci. USA 2018, 115, 4015–4020. [Google Scholar] [CrossRef] [PubMed]
  4. Cao, M.; Woodward, F.I. Net primary and ecosystem production and carbon stocks of terrestrial ecosystems and their responses to climate change. Glob. Change Biol. 1998, 4, 185–198. [Google Scholar] [CrossRef]
  5. Rustad, L.E. The response of terrestrial ecosystems to global climate change: Towards an integrated approach. Sci. Total Environ. 2008, 404, 222–235. [Google Scholar] [CrossRef] [PubMed]
  6. Runting, R.K.; Bryan, B.A.; Dee, L.E.; Maseyk, F.J.F.; Mandle, L.; Hamel, P.; Wilson, K.A.; Yetka, K.; Possingham, H.P.; Rhodes, J.R. Incorporating climate change into ecosystem service assessments and decisions: A review. Glob. Change Biol. 2017, 23, 28–41. [Google Scholar] [CrossRef] [PubMed]
  7. Abbasi, K.R.; Shahbaz, M.; Zhang, J.; Irfan, M.; Alvarado, R. Analyze the environmental sustainability factors of China: The role of fossil fuel energy and renewable energy. Renew. Energy 2022, 187, 390–402. [Google Scholar] [CrossRef]
  8. Kartal, M.T. The role of consumption of energy, fossil sources, nuclear energy, and renewable energy on environmental degradation in top-five carbon producing countries. Renew. Energy 2022, 184, 871–880. [Google Scholar] [CrossRef]
  9. Houghton, R.A.; House, J.I.; Pongratz, J.; Van Der Werf, G.R.; Defries, R.S.; Hansen, M.C.; Le Quéré, C.; Ramankutty, N. Carbon emissions from land use and land-cover change. Biogeosciences 2012, 9, 5125–5142. [Google Scholar] [CrossRef]
  10. Mendoza-Ponce, A.; Corona-Nunez, R.; Kraxner, F.; Leduc, S.; Patrizio, P. Identifying effects of land use cover changes and climate change on terrestrial ecosystems and carbon stocks in Mexico. Glob. Environ. Change 2018, 53, 12–23. [Google Scholar] [CrossRef]
  11. Soeder, D.J. Greenhouse gas sources and mitigation strategies from a geosciences perspective. Adv. Geo-Energy Res. 2021, 5, 274–285. [Google Scholar] [CrossRef]
  12. Prentice, K.C.; Fung, I.Y. The sensitivity of terrestrial carbon storage to climate change. Nature 1990, 346, 48–51. [Google Scholar] [CrossRef]
  13. Sharma, S.; Sharma, V.; Chatterjee, S. Contribution of plastic and microplastic to global climate change and their conjoining impacts on the environment-A review. Sci. Total Environ. 2023, 875, 162627. [Google Scholar] [CrossRef] [PubMed]
  14. Chang, X.; Xing, Y.; Wang, J.; Yang, H.; Gong, W. Effects of land use and cover change (LUCC) on terrestrial carbon stocks in China between 2000 and 2018. Resour. Conserv. Recycl. 2022, 182, 106333. [Google Scholar] [CrossRef]
  15. Liang, Y.; Hashimoto, S.; Liu, L. Integrated assessment of land-use/land-cover dynamics on carbon storage services in the Loess Plateau of China from 1995 to 2050. Ecol. Indic. 2021, 120, 106939. [Google Scholar] [CrossRef]
  16. Trumbore, S. Carbon respired by terrestrial ecosystems–recent progress and challenges. Glob. Change Biol. 2006, 12, 141–153. [Google Scholar] [CrossRef]
  17. Pongratz, J.; Reick, C.; Raddatz, T.; Claussen, M. A reconstruction of global agricultural areas and land cover for the last millennium. Glob. Biogeochem. Cycles 2008, 22, GB3018. [Google Scholar] [CrossRef]
  18. Tayebi, M.; Fim Rosas, J.T.; Mendes, W.D.S.; Poppiel, R.R.; Ostovari, Y.; Ruiz, L.F.C.; dos Santos, N.V.; Cerri, C.E.P.; Silva, S.H.G.; Curi, N.; et al. Drivers of organic carbon stocks in different LULC history and along soil depth for a 30 years image time series. Remote Sens. 2021, 13, 2223. [Google Scholar] [CrossRef]
  19. Zhu, L.; Song, R.; Sun, S.; Li, Y.; Hu, K. Land use/land cover change and its impact on ecosystem carbon storage in coastal areas of China from 1980 to 2050. Ecol. Indic. 2022, 142, 109178. [Google Scholar] [CrossRef]
  20. Xu, G.; Zhi, Z.; Li, Z.; Zhuang, J.; Guo, M.; Fang, K.; Yi, J.; Ren, Z.; Gao, H.; Jia, L. Attribution of sediment changes and influencing factors of microbial communities in sediment in the Wuding River basin of the Yellow River. CATENA 2025, 249, 108626. [Google Scholar] [CrossRef]
  21. Yang, H.; Huang, J.; Liu, D. Linking climate change and socioeconomic development to urban land use simulation: Analysis of their concurrent effects on carbon storage. Appl. Geogr. 2020, 115, 102135. [Google Scholar] [CrossRef]
  22. Chen, X.; Yu, L.; Hou, S.; Liu, T.; Li, X.; Li, Y.; Du, Z.; Li, C.; Wu, H.; Gao, G.; et al. Unraveling carbon stock dynamics and their determinants in China’s Loess Plateau over the past 40 years. Ecol. Indic. 2024, 159, 111760. [Google Scholar] [CrossRef]
  23. Lubowski, R.N.; Plantinga, A.J.; Stavins, R.N. Land-use change and carbon sinks: Econometric estimation of the carbon sequestration supply function. J. Environ. Econ. Manag. 2006, 51, 135–152. [Google Scholar] [CrossRef]
  24. Arneth, A.; Sitch, S.; Pongratz, J.; Stocker, B.D.; Ciais, P.; Poulter, B.; Bayer, A.D.; Bondeau, A.; Calle, L.; Chini, L.P.; et al. Historical carbon dioxide emissions caused by land-use changes are possibly larger than assumed. Nat. Geosci. 2017, 10, 79–84. [Google Scholar] [CrossRef]
  25. Lai, L.; Huang, X.; Yang, H.; Chuai, X.; Zhang, M.; Zhong, T.; Chen, Z.; Chen, Y.; Wang, X.; Thompson, J.R. Carbon emissions from land-use change and management in China between 1990 and 2010. Sci. Adv. 2016, 2, e1601063. [Google Scholar] [CrossRef] [PubMed]
  26. Zhong, Z.; Han, X.; Xu, Y.; Zhang, W.; Fu, S.; Liu, W.; Ren, C.; Yang, G.; Ren, G. Effects of land use change on organic carbon dynamics associated with soil aggregate fractions on the Loess Plateau, China. Land Degrad. Dev. 2019, 30, 1070–1082. [Google Scholar] [CrossRef]
  27. Wang, B.; Xu, G.; Li, Z.; Cheng, Y.; Gu, F.; Xu, M.; Zhang, Y. Carbon pools in forest systems and new estimation based on an investigation of carbon sequestration. J. Environ. Manag. 2024, 360, 121124. [Google Scholar] [CrossRef] [PubMed]
  28. Xiang, M.; Wang, C.; Tan, Y.; Yang, J.; Duan, L.; Fang, Y.; Li, W.; Shu, Y.; Liu, M. Spatio-temporal evolution and driving factors of carbon storage in the Western Sichuan Plateau. Sci. Rep. 2022, 12, 8114. [Google Scholar] [CrossRef] [PubMed]
  29. Moisa, M.B.; Dejene, I.N.; Deribew, K.T.; Gurmessa, M.M.; Gemeda, D.O. Impacts of Forest Cover Change on Carbon Stock, Carbon Emission and Land Surface Temperature in Sor Watershed, Baro Akobo Basin, Western Ethiopia. J. Water Clim. Change 2023, 14, 2842–2860. [Google Scholar] [CrossRef]
  30. Zhu, G.; Qiu, D.; Zhang, Z.; Sang, L.; Liu, Y.; Wang, L.; Zhao, K.; Ma, H.; Xu, Y.; Wan, Q. Land-use changes lead to a decrease in carbon storage in arid region, China. Ecol. Indic. 2021, 127, 107770. [Google Scholar] [CrossRef]
  31. Wang, B.; Niu, X.; Xu, T. Identifying the full carbon sink of forest vegetation: A case study in the three northeast provinces of China. Sustainability 2023, 15, 10396. [Google Scholar] [CrossRef]
  32. Dignac, M.F.; Derrien, D.; Barré, P.; Barot, S.; Cécillon, L.; Chenu, C.; Chevallier, T.; Freschet, G.T.; Garnier, P.; Guenet, B.; et al. Increasing soil carbon storage: Mechanisms, effects of agricultural practices and proxies. A review: Soil C storage: Mechanisms, practices and proxies. Agron. Sustain. Dev. 2017, 37, 14. [Google Scholar] [CrossRef]
  33. Lessmann, M.; Ros, G.H.; Young, M.D.; de Vries, W. Global variation in soil carbon sequestration potential through improved cropland management. Glob. Change Biol. 2022, 28, 1162–1177. [Google Scholar] [CrossRef] [PubMed]
  34. Cheng, Y.; Lawrence, D.M.; Pan, M.; Zhang, B.; Graham, N.T.; Lawrence, P.J.; Liu, Z.; He, X. A bioenergy-focused versus a reforestation-focused mitigation pathway yields disparate carbon storage and climate responses. Proc. Natl. Acad. Sci. USA 2024, 121, e2306775121. [Google Scholar] [CrossRef] [PubMed]
  35. Sun, J.; Liu, X.; An, Y.; Zhao, P.; Li, J.; He, M.; Bao, H.; Zhang, F. Spatiotemporal evolution of carbon sequestration and the impact of key drivers under multiple SSP-RCP scenarios in the Yangtze River economic belt. Carbon Balance Manag. 2025, 21, 20. [Google Scholar] [CrossRef] [PubMed]
  36. Tuo, M.; Xu, G.; Zhang, T.; Guo, J.; Zhang, M.; Gu, F.; Wang, B.; Yi, J. Contribution of climatic factors and human activities to vegetation changes in arid grassland. Sustainability 2024, 16, 794. [Google Scholar] [CrossRef]
  37. Chen, Y.; Guerschman, J.P.; Cheng, Z.; Guo, L. Remote sensing for vegetation monitoring in carbon capture storage regions: A review. Appl. Energy 2019, 240, 312–326. [Google Scholar] [CrossRef]
  38. Mandal, A.; Majumder, A.; Dhaliwal, S.S.; Toor, A.S.; Mani, P.K.; Naresh, R.K.; Gupta, R.K.; Mitran, T. Impact of agricultural management practices on soil carbon sequestration and its monitoring through simulation models and remote sensing techniques: A review. Crit. Rev. Environ. Sci. Technol. 2022, 52, 1–49. [Google Scholar] [CrossRef]
  39. Sun, P.; Wu, Y.; Xiao, J.; Hui, J.; Hu, J.; Zhao, F.; Qiu, L.; Liu, S. Remote sensing and modeling fusion for investigating the ecosystem water-carbon coupling processes. Sci. Total Environ. 2019, 697, 134064. [Google Scholar] [CrossRef] [PubMed]
  40. Tian, H.; Lu, C.; Yang, J.; Banger, K.; Huntzinger, D.N.; Schwalm, C.R.; Michalak, A.M.; Cook, R.; Ciais, P.; Hayes, D.; et al. Global patterns and controls of soil organic carbon dynamics as simulated by multiple terrestrial biosphere models: Current status and future directions. Glob. Biogeochem. Cycles 2015, 29, 775–792. [Google Scholar] [CrossRef] [PubMed]
  41. Zhao, J.; Liu, D.; Zhu, Y.; Peng, H.; Xie, H. A review of forest carbon cycle models on spatiotemporal scales. J. Clean. Prod. 2022, 339, 130692. [Google Scholar] [CrossRef]
  42. Turner, D.P.; Ollinger, S.V.; Kimball, J.S. Integrating remote sensing and ecosystem process models for landscape-to regional-scale analysis of the carbon cycle. BioScience 2004, 54, 573–584. [Google Scholar] [CrossRef]
  43. Sohl, T.L.; Sleeter, B.M.; Zhu, Z.; Sayler, K.L.; Bennett, S.; Bouchard, M.; Reker, R.; Hawbaker, T.; Wein, A.; Liu, S.; et al. A land-use and land-cover modeling strategy to support a national assessment of carbon stocks and fluxes. Appl. Geogr. 2012, 34, 111–124. [Google Scholar] [CrossRef]
  44. Lin, J.; Lin, Y.; Zhao, H.; He, H. Soil erosion processes and geographical differentiation in Shaanxi during 1980–2015. Sustainability 2022, 14, 10512. [Google Scholar] [CrossRef]
  45. Li, J.; Hu, Y.; Li, J.; Yang, L.; Yan, J. Multidimensional analysis and enhancement strategies for ecological environment quality at the county level under dual carbon goals: A case study of Shaanxi Province, China. Front. Environ. Sci. 2025, 13, 1513325. [Google Scholar] [CrossRef]
  46. Liu, K.; Zhang, C.; Zhang, H.; Xu, H.; Xia, W. Spatiotemporal Variation and Dynamic Simulation of Ecosystem Carbon Storage in the Loess Plateau Based on PLUS and InVEST Models. Land 2023, 12, 1065. [Google Scholar] [CrossRef]
  47. Wen, R.; Gao, Y.; Wu, Z.; Qian, H. Effects of land use change on the temporal and spatial pattern of carbon storage in Guanzhong Plain urban agglomeration. Chin. J. Eco-Agric. 2024, 32, 592–604. [Google Scholar] [CrossRef]
  48. Wei, X.; Zhang, S.; Luo, P.; Zhang, S.; Wang, H.; Kong, D.; Zhang, Y.; Tang, Y.; Sun, S. A multi-scenario prediction and spatiotemporal analysis of the land use and carbon storage response in Shaanxi. Remote Sens. 2023, 15, 5036. [Google Scholar] [CrossRef]
  49. Xu, L.; He, N.P.; Yu, G.R. A Dataset of Carbon Density in Chinese Terrestrial Ecosystems (2010s); Science Data Bank: Beijing, China, 2018. [Google Scholar] [CrossRef]
  50. Yang, J.; Huang, X. The 30 m annual land cover dataset and its dynamics in China from 1990 to 2019. Earth Syst. Sci. Data 2021, 13, 3907–3925. [Google Scholar] [CrossRef]
  51. Sallustio, L.; De Toni, A.; Strollo, A.; Di Febbraro, M.; Gissi, E.; Casella, L.; Geneletti, D.; Munafò, M.; Vizzarri, M.; Marchetti, M. Assessing habitat quality in relation to the spatial distribution of protected areas in Italy. J. Environ. Manag. 2017, 201, 129–137. [Google Scholar] [CrossRef] [PubMed]
  52. Chen, Q.; Ning, Y. Projecting LUCC dynamics and ecosystem services in an emerging urban agglomeration under SSP-RCP scenarios and their management implications. Sci. Total Environ. 2024, 949, 175100. [Google Scholar] [CrossRef] [PubMed]
  53. Song, Y.; Wang, J.; Ge, Y.; Xu, C. An optimal parameters-based geographical detector model enhances geographic characteristics of explanatory variables for spatial heterogeneity analysis: Cases with different types of spatial data. GISci. Remote Sens. 2020, 57, 593–610. [Google Scholar] [CrossRef]
  54. Qiao, B.; Yang, H.; Cao, X.; Zhou, B.; Wang, N. Driving mechanisms and threshold identification of landscape ecological risk: A nonlinear perspective from the Qilian Mountains, China. Ecol. Indic. 2025, 173, 113342. [Google Scholar] [CrossRef]
  55. Xiang, S.; Wang, Y.; Deng, H.; Yang, C.; Wang, Z.; Gao, M. Response and multi-scenario prediction of carbon storage to land use/cover change in the main urban area of Chongqing, China. Ecol. Indic. 2022, 142, 109205. [Google Scholar] [CrossRef]
  56. Wu, X.; Shen, C.; Shi, L.; Wan, Y.; Ding, J.; Wen, Q. Spatio-temporal evolution characteristics and simulation prediction of carbon storage: A case study in Sanjiangyuan Area, China. Ecol. Inform. 2024, 80, 102485. [Google Scholar] [CrossRef]
  57. Tikuye, B.G.; Ray, R.L.; Gurau, S. Modeling carbon stock change and carbon dioxide emissions under different ecosystems in the Brazos River Basin, USA. Environ. Chall. 2025, 19, 101138. [Google Scholar] [CrossRef]
  58. Chen, R.; Fei, X.; Zhu, J.; Chen, W.; Du, H.; Huang, Y.; Shen, Y.; Zhang, Y.; Niu, A.; Xu, P. Assessing carbon storage dynamics in an ecological civilization demonstration zone amid rapid urbanization: A multi-scenario study of Guizhou Province, China. Resour. Environ. Sustain. 2025, 21, 100223. [Google Scholar] [CrossRef]
  59. Li, Y.; Liu, W.; Feng, Q.; Zhu, M.; Yang, L.; Zhang, J. Effects of land use and land cover change on soil organic carbon storage in the Hexi regions, Northwest China. J. Environ. Manag. 2022, 312, 114911. [Google Scholar] [CrossRef] [PubMed]
  60. Hoque, M.Z.; Cui, S.; Islam, I.; Xu, L.; Ding, S. Dynamics of plantation forest development and ecosystem carbon storage change in coastal Bangladesh. Ecol. Indic. 2021, 130, 107954. [Google Scholar] [CrossRef]
  61. Yang, Y.; Yuan, X.; An, J.; Su, Q.; Chen, B. Drivers of ecosystem services and their trade-offs and synergies in different land use policy zones of Shaanxi Province, China. J. Clean. Prod. 2024, 452, 142077. [Google Scholar] [CrossRef]
  62. He, Y.; Xia, C.; Shao, Z.; Zhao, J. The Spatiotemporal Evolution and Prediction of Carbon Storage: A Case Study of Urban Agglomeration in China’s Beijing-Tianjin-Hebei Region. Land 2022, 11, 858. [Google Scholar] [CrossRef]
  63. Zheng, H.; Zheng, H. Assessment and prediction of carbon storage based on land use/land cover dynamics in the coastal area of Shandong Province. Ecol. Indic. 2023, 153, 110474. [Google Scholar] [CrossRef]
  64. Li, C.; Xu, H.; Du, P.; Tang, F. Predicting Land Cover Changes and Carbon Stock Fluctuations in Fuzhou, China: A Deep Learning and InVEST Approach. Ecol. Indic. 2024, 167, 112658. [Google Scholar] [CrossRef]
  65. Wei, X.; Yang, J.; Luo, P.; Lin, L.; Lin, K.; Guan, J. Assessment of the variation and influencing factors of vegetation NPP and carbon sink capacity under different natural conditions. Ecol. Indic. 2022, 138, 108834. [Google Scholar] [CrossRef]
  66. Zhao, Y.; Feng, Q.; Lu, A. Spatiotemporal variation in vegetation coverage and its driving factors in the Guanzhong Basin, NW China. Ecol. Inform. 2021, 64, 101371. [Google Scholar] [CrossRef]
  67. Yi, H.; Zhang, X.; He, L.; He, J.; Tian, Q.; Zou, Y.; An, Z. Detecting the impact of the “Grain for Green” program on land use/land cover and hydrological regimes in a watershed of the Chinese Loess Plateau over the next 30 years. Ecol. Indic. 2023, 150, 110181. [Google Scholar] [CrossRef]
  68. Mu, L.; Liang, Y.; Han, R. Assessment of the soil organic carbon sink in a project for the conversion of farmland to forestland: A case study in Zichang county, Shaanxi, China. PLoS ONE 2014, 9, e94770. [Google Scholar] [CrossRef] [PubMed]
  69. Wan, X.; Yu, Z.; Wang, M.; Zhang, Y.; Huang, Z. Litter and root traits control soil microbial composition and enzyme activities in 28 common subtropical tree species. J. Ecol. 2022, 110, 3012–3022. [Google Scholar] [CrossRef]
  70. Liu, R.; Zhang, Y.; Hu, X.F.; Wan, S.; Wang, H.; Liang, C.; Chen, F.S. Litter manipulation effects on microbial communities and enzymatic activities vary with soil depth in a subtropical Chinese fir plantation. For. Ecol. Manag. 2021, 480, 118641. [Google Scholar] [CrossRef]
  71. Luo, H.; Liu, S.; Trevathan-Tackett, S.M.; Ren, Y.; Liang, J.; Jiang, Z.; Wu, Y.; Zhang, X.; Huang, X. Microbial communities and litter quality co-mediate seagrass litter decomposition under eutrophication. Commun. Earth Environ. 2025, 6, 562. [Google Scholar] [CrossRef]
  72. Blanco, J.A.; Durán, M.; Luquin, J.; San Emeterio, L.; Yeste, A.; Canals, R.M. Soil C/N ratios cause opposing effects in forests compared to grasslands on decomposition rates and stabilization factors in southern European ecosystems. Sci. Total Environ. 2023, 888, 164118. [Google Scholar] [CrossRef] [PubMed]
  73. Doetterl, S.; Stevens, A.; Six, J.; Merckx, R.; Van Oost, K.; Pinto, M.C.; Casanova-Katny, A.; Muñoz, C.; Boudin, M.; Venegas, E.Z.; et al. Soil carbon storage controlled by interactions between geochemistry and climate. Nat. Geosci. 2015, 8, 780–783. [Google Scholar] [CrossRef]
  74. Fekete, I.; Berki, I.; Lajtha, K.; Béni, A.; Móricz, N.; Várbíró, G.; Madarász, B.; Horváth, T.; Juhos, K.; Kotroczó, Z. Changes in tree biomass and soil carbon pools of oak ecosystems along a climate gradient in a Central European region. Plant Soil 2025, 514, 2681–2699. [Google Scholar] [CrossRef]
  75. Zhang, H.Y. A Study on the Drought Characteristics of the Wei River Basin from 1961 to 2014 and Its Impact on Vegetation Net Primary Productivity; Shaanxi Normal University: Xi’an, China, 2016. (In Chinese) [Google Scholar]
  76. Wang, H.Y.; Li, Z.K. Dynamic Changes and Vulnerability Analysis of Carbon Storage in the Weihe River Basin Ecosystem Based on LUCC. Res. Soil Water Conserv. 2024, 31, 252–260. (In Chinese) [Google Scholar]
  77. Hao, L.; Jiang, C.Y.; Sun, X.; He, H.G. Impact Factors and Policy Implications of Carbon Emissions from Energy Consumption in Shaanxi Province. Res. Soil Water Conserv. 2014, 20, 326–332. (In Chinese) [Google Scholar]
  78. Zhang, Z.; Chen, Y.H.; Mishra, A.K.; Ni, M. Effects of agricultural subsidy policy adjustment on carbon emissions: A quasi-natural experiment in China. J. Clean. Prod. 2025, 487, 144603. [Google Scholar] [CrossRef]
  79. Wang, T.F. Assessment of Carbon Sequestration Service Functions of Ecosystems in Shaanxi Province and Analysis of Influencing Factors; Northwest A&F University: Yangling, China, 2024. (In Chinese) [Google Scholar]
  80. Fan, J.Z.; Li, D.K.; Zhou, H. Valuation on carbon fixation and oxygen release in reforested croplands of Shaanxi Province of China. Chin. J. Ecol. 2013, 32, 874–881. (In Chinese) [Google Scholar]
  81. Li, H.; Zhang, K.; Liu, Y.; Qin, Y.; Wang, W.; Wang, M.; Liu, Y.; Li, Y. Spatiotemporal evolution of land use and carbon storage in China: Multi-Scenario simulation and driving factor analysis based on the PLUS-InVEST model and SHAP. Environ. Res. 2025, 279, 121860. [Google Scholar] [CrossRef] [PubMed]
  82. Huo, H.; Sun, C. Spatiotemporal variation and influencing factors of vegetation dynamics based on Geodetector: A case study of the northwestern Yunnan Plateau, China. Ecol. Indic. 2021, 130, 108005. [Google Scholar] [CrossRef]
  83. Lü, Y.; Fu, B.; Feng, X.; Zeng, Y.; Liu, Y.; Chang, R.; Sun, G.; Wu, B. A policy-driven large scale ecological restoration: Quantifying ecosystem services changes in the Loess Plateau of China. PLoS ONE 2012, 7, e31782. [Google Scholar] [CrossRef] [PubMed]
  84. Gong, K.; Huang, Z.; Qu, M.; He, Z.; Chen, J.; Wang, Z.; Yu, Q.; Feng, H.; He, J. Influences of climate change on carbon and water fluxes of the ecosystem in the Qinling Mountains of China. Ecol. Indic. 2024, 166, 112504. [Google Scholar] [CrossRef]
  85. Wang, S.; Gao, M.; Li, Z.; Ma, J.; Peng, J. How Do Driving Factors Affect Vegetation Coverage Change in the Shaanxi Region of the Qinling Mountains? Remote Sens. 2024, 16, 160. [Google Scholar] [CrossRef]
  86. Ma, J.; Jin, X.; Yin, X.; Liu, P.; Nie, Z. A new InVEST–genetic algorithm coupled water yield model: Application to water conservation function assessment in the Zhangjiakou-Chengde area. Ecol. Indic. 2025, 179, 114237. [Google Scholar] [CrossRef]
  87. Paul, T.; Kimberley, M.O.; Beets, P.N. Natural forests in New Zealand—A large terrestrial carbon pool in a national state of equilibrium. For. Ecosyst. 2021, 8, 34. [Google Scholar] [CrossRef]
  88. Zhang, Y.; Tang, J.; Hu, X.; Chen, C.; Luo, Z.; Li, Q.; Li, Q. Understanding the Spatiotemporal Patterns and Drivers of Carbon Stock in Central-Southern China’s Hilly Regions Through Land Use Change and Scenario Simulation. Sustainability 2025, 17, 5578. [Google Scholar] [CrossRef]
  89. Peng, Z.; Li, M.; Liu, Y.; Fang, H.; Yin, J. Multi-scenario simulation and spatial optimization of carbon storage in developed regions from a carbon neutrality perspective. Carbon Balance Manag. 2025, 20, 58. [Google Scholar] [CrossRef] [PubMed]
  90. Liu, Y.; Wang, Q.; Yu, G.; Zhu, X.; Zhan, X. Ecosystems carbon storage and carbon sequestration potential of two main tree species for the Grain for Green Project on China’s hilly Loess Plateau. Acta Ecol. Sin. 2011, 31, 4277–4286. (In Chinese) [Google Scholar]
  91. Deng, L.; Shangguan, Z.P.; Sweeney, S. “Grain for Green” driven land use change and carbon sequestration on the Loess Plateau, China. Sci. Rep. 2014, 4, 7039. [Google Scholar] [CrossRef] [PubMed]
  92. Wang, J.; Zhang, Z.; Li, J.; Shao, M.; Wei, X. Disentangling the effects of the Grain for Green project on ecosystem carbon sequestration on the Loess Plateau. CATENA 2026, 263, 109668. [Google Scholar] [CrossRef]
  93. Niu, X.; Liu, C.; Jia, X.; Zhu, J. Changing soil organic carbon with land use and management practices in a thousand-year cultivation region. Agric. Ecosyst. Environ. 2021, 322, 107639. [Google Scholar] [CrossRef]
  94. Liu, Y.; Guo, H.; Luo, Z.; Yao, C.; Xu, C.; Hou, Y.; Bao, J. Spatiotemporal Variations of Vegetation Carbon Use Efficiency and its Driving Factors Under Climate Change in Qinling Mountains in Shaanxi Province. Earth Environ. 2025, 53, 242–252. [Google Scholar] [CrossRef]
  95. Ge, R.; He, H.; Ren, X.; Zhang, L.; Yu, G.; Smallman, T.L.; Zhou, T.; Yu, S.; Luo, Y.; Xie, Z.; et al. Underestimated ecosystem carbon turnover time and sequestration under the steady state assumption: A perspective from long-term data assimilation. Glob. Change Biol. 2019, 25, 938–953. [Google Scholar] [CrossRef] [PubMed]
  96. Yu, F.; Li, C.; Yuan, Z.; Luo, Y.; Yin, Q.; Wang, Q.; Hao, Z. How do mountain ecosystem services respond to changes in vegetation and climate? An evidence from the Qinling Mountains, China. Ecol. Indic. 2023, 154, 110922. [Google Scholar] [CrossRef]
  97. Yu, Z.; Ciais, P.; Piao, S.; Houghton, R.A.; Lu, C.; Tian, H.; Agathokleous, E.; Kattel, G.R.; Sitch, S.; Goll, D.; et al. Forest Expansion Dominates China’s Land Carbon Sink Since 1980. Nat. Commun. 2022, 13, 5374. [Google Scholar] [CrossRef] [PubMed]
Figure 1. Framework for the study.
Sustainability 18 06938 g001
Figure 2. Location of the study area.
Sustainability 18 06938 g002
Figure 3. Land-use distribution of SP in 2000, 2010, and 2020.
Sustainability 18 06938 g003
Figure 4. Land-use transition matrices for SP from 2000 to 2020. Panels (ad) represent the transitions for SP, Shanbei, Guanzhong, and Shannan from 2000 to 2010, respectively. Panels (eh) represent the transitions for these regions from 2010 to 2020, respectively.
Sustainability 18 06938 g004
Figure 5. Spatial distribution of ecosystem carbon density in SP in 2000, 2010, and 2020.
Sustainability 18 06938 g005
Figure 6. Local Moran’s I index analysis of carbon density in 2000, 2010, and 2020.
Sustainability 18 06938 g006
Figure 7. Regional changes in ecosystem carbon storage in SP from 2000 to 2020.
Sustainability 18 06938 g007
Figure 8. Correlation analysis of the drivers of carbon storage changes in SP. cs: carbon storage; clay: soil clay content; sand: soil sand content; silt: soil silt content; pre: precipitation; tem: temperature; gdp: GDP; pop: POP. The same abbreviations apply hereinafter.
Sustainability 18 06938 g008
Figure 9. Correlation analysis of the drivers of carbon storage changes in SP.
Sustainability 18 06938 g009
Table 1. Data sources for the study.
Data TypeYear and FormatData Source
Carbon density2004–2014, .xlsxXu, L. et al. [49]
Carbon density2012Shaanxi Forest Survey and Planning Institute
DEMRaster; 30 mGeospatial Data Cloud site, Computer Network Information Center, https://www.gscloud.cn/sources/details/310?pid=302 (accessed on 26 December 2023)
Precipitation
Temperature
Soil property
GDP
POP
Raster; 1000 mResource and Environmental Science Data Platform, https://www.resdc.cn, https://doi.org/10.12078/2017121101, https://doi.org/10.12078/2017121102
Land useRaster; 30 mYang and Huang (2021) [50]
Table 2. Carbon density of the four carbon pools for different land-use types (Mg/ha).
Land-Use TypesCaboveCbelowCsoilCdead
Cropland0.5317.1550.451.74
Forest land24.866.2980.091.39
Shrubland5.543.1463.380.34
Grassland1.825.0744.711.79
Water0.000.000.000.00
Snow/Ice0.000.000.000.00
Barren land0.591.0313.560.00
Impervious land3.253.2119.210.00
Table 3. Global Moran’s I index analysis of carbon density in 2000, 2010, and 2020.
YearsMoran’s IExpected Value Variance p Value
20000.6897−0.0000050.0000010.0000
20100.7029−0.0000050.0000010.0000
20200.7066−0.0000050.0000010.0000
Table 4. Carbon storage (Tg) of different land-use types in 2000, 2010, and 2020.
Land-Use Types200020102020
Cropland444.45405.38367.95
Forest land928.42988.211040.50
Shrubland7.714.131.69
Grassland297.63303.22302.19
Water0.000.000.00
Snow/Ice0.000.000.00
Barren land3.911.050.27
Impervious land6.449.7113.52
Total1688.551711.711726.12
Table 5. Carbon storage transfer matrix (Mg) from 2000 to 2010.
Land-Use Types2010
CroplandForest LandShrublandGrasslandWaterSnow/IceBarren LandImpervious Land
2000Cropland014,442,885−2129−11,728,100−690,8220−4029−5,441,409
Forest land−3,456,4150−217,642−339,591−268500−21,369
Shrubland18292,270,2020−268,957000−4
Grassland8,979,63012,292,313292,7770−124,834−12−260,499−398,915
Water415,9819598061,993004343100,761
Snow/Ice00000000
Barren land82,111007,304,331−6233−331025,125
Impervious land32,132590436−190,8790−220
Table 6. Carbon storage transfer matrix (Mg) from 2010 to 2020.
Land-Use Types2020
CroplandForest LandShrublandGrasslandWaterSnow/IceBarren LandImpervious Land
2010Cropland011,838,510−768−12,232,807−594,5940−19,766−6,422,984
Forest land−5,806,8590−168,835−170,264−17130−118−50,683
Shrubland21251,283,4210−151,518−110−39−21
Grassland7,701,05917,006,82171,7400−92,5080−319,261−378,487
Water578,5559359035,812001984111,512
Snow/Ice000160080
Barren land224,2982202,083,506−78690011,946
Impervious land25,465001133−154,6140−700
Disclaimer/Publisher’s Note: The statements, opinions and data contained in all publications are solely those of the individual author(s) and contributor(s) and not of MDPI and/or the editor(s). MDPI and/or the editor(s) disclaim responsibility for any injury to people or property resulting from any ideas, methods, instructions or products referred to in the content.