Article

Analysis of Spatial Correlation Effects and Influencing Factors of Carbon Emission Efficiency in China’s Logistics Industry

Business Administration College, Jiangxi University of Water Resources and Electric Power, Nanchang 330099, China
*
Author to whom correspondence should be addressed.
Sustainability 2026, 18(14), 6936; https://doi.org/10.3390/su18146936
Submission received: 17 May 2026 / Revised: 22 June 2026 / Accepted: 30 June 2026 / Published: 8 July 2026

Abstract

Against the backdrop of global low-carbon transformation and China’s “dual-carbon” target, the logistics industry has become a key sector for carbon emission reduction due to its high energy consumption and significant spatial correlation characteristics. Taking 30 provinces in China from 2010 to 2022 as research samples, this paper uses the Super-SBM model to measure the carbon emission efficiency of the logistics industry, constructs a spatial correlation network based on the modified gravity model, and explores the structural characteristics and evolutionary logic of the network through social network analysis (SNA). Furthermore, the quadratic assignment procedure (QAP) regression is employed to reveal the driving factors of the spatial correlation effect. The results show that China’s logistics carbon emission efficiency presents an obvious “east-high west-low, south-high north-low” spatial pattern with significant positive agglomeration and stable spillover effects. A nationwide connected spatial correlation network has formed, with high connectivity, increasing density, and enhanced stability. Eastern coastal provinces are core nodes, central provinces act as bridges, and western provinces are at the network edge. The block model divides the network into net benefit, net spillover, and broker plates, revealing a spillover pattern from the edge to the core. QAP regression shows that energy intensity, transportation structure, economic level, policy support, and population size are negatively correlated with spatial correlation, and narrowing regional differences strengthens network connections.

1. Introduction

With the continuous intensification of the greenhouse effect, low-carbon development has become a major concern worldwide and domestically, and carbon emissions are the primary driving factor behind this trend [1]. Since 2009, China has ranked first globally in carbon dioxide emissions. In September 2020, China announced its dual-carbon goals at the United Nations General Assembly: to peak carbon dioxide emissions before 2030 and achieve carbon neutrality before 2060. As an important part of China’s economic system, the transportation and logistics industry (TLI) is a major carbon emitter in the tertiary industry, and its carbon emissions have maintained a rapid growth trend [2,3]. China’s transportation and logistics industry accounts for approximately 10% to 12% of the country’s total carbon emissions, making it the third largest source of carbon emissions after power generation and industry.
With the continuous expansion of freight volume and industrial scale, the logistics industry is facing enormous pressure for energy conservation and emission reduction, and promoting its green and low-carbon development has become a research hotspot [4].
Relying on mobile transportation tools such as vehicles, trains, and aircraft, carbon emissions of the logistics industry have distinct spatial attributes. The cross-provincial flow of transportation carriers leads to the generation of logistics-related carbon emissions across different regions, which further forms inherent spatial correlations in logistics carbon emissions among provinces [5]. Driven by the improvement of transportation infrastructure and increasingly frequent cross-regional flow of people and goods, a complex spatial correlation network of logistics carbon emissions has gradually evolved across China. However, prominent differences in transportation scale among provinces hinder the formulation of targeted emission reduction policies.
In addition, simply focusing on total carbon emissions cannot fully reflect provincial influencing factors. In contrast, an in-depth analysis of carbon emission efficiency is more conducive to identifying regional driving factors and designing targeted emission reduction strategies. Against this background, to effectively promote carbon reduction in the logistics industry and formulate coordinated regional emission reduction policies, it is essential to clarify the spatial correlation characteristics and internal driving mechanisms of logistics carbon emission efficiency [6].
This paper aims to explore the spatial correlation network and driving factors of carbon emission efficiency in China’s logistics industry. Based on the panel data of 30 Chinese provinces from 2010 to 2022, this study first evaluates the carbon emission efficiency of the inter-provincial logistics industry and constructs a spatial correlation network. Social network analysis (SNA) is used to conduct a multi-dimensional analysis of the network structural characteristics, and quadratic assignment procedure (QAP) regression is adopted to investigate the driving mechanisms of the spatial correlation network. The research conclusions can provide references for formulating differentiated carbon reduction policies and building cross-regional collaborative governance systems for the logistics industry.
The remainder of this paper is organized as follows. Section 2 presents a literature review. Section 3 introduces the research methods and data sources. Section 4 reports and discusses the empirical results. Section 5 summarizes the main conclusions and puts forward corresponding policy recommendations.

2. Literature Review

Against the background of high-quality economic development and low-carbon green transformation, exploring the influencing factors and evolution rules of regional carbon emissions has become a mainstream research direction. As the world’s largest carbon emitter, China has attached great importance to carbon emission control. Driven by economic growth and the digital economy, the rapid development of China’s logistics industry has led to continuous growth in energy consumption and carbon emissions. Balancing industrial expansion and green development has become an urgent task [7].
Scholars have carried out multi-dimensional research on carbon emissions of the transportation and logistics industry (TLI), mainly focusing on emission accounting, efficiency evaluation, influencing factors, and spatial correlation networks. In terms of carbon emission measurement and efficiency evaluation, the IPCC accounting method is widely used to calculate provincial carbon emission intensity and its spatial distribution [8]. Data envelopment analysis (DEA) models and their extended forms, including DEA-BCC, SBM, Super-SBM, and Malmquist index models, have become mainstream tools for evaluating logistics efficiency and carbon emission efficiency [9,10]. Among them, the Super-SBM model performs better than the traditional SBM model in evaluating carbon emission efficiency [11,12]. For example, Qingyuan Dong et al. employed the super-efficient SBM model, an improved gravity model, component analysis, the Infomap algorithm, and the exponential random graph model to analyze the spatial correlation characteristics and influencing factors of China’s logistics carbon reduction efficiency [13].
Existing studies have covered national, provincial, and typical regional samples such as the Yangtze River Economic Belt, the new western land–sea corridor, and coastal provinces, and all confirmed significant regional heterogeneity in logistics carbon emission efficiency. In terms of influencing factor analysis, scholars have applied the STIRPAT model, Tobit model, and panel regression models to identify key driving factors. Pattak et al. used the STIRPAT model to explore the driving factors of carbon emissions in Italy [14]. LI Y et al. investigated how the digital economy can enhance carbon emission efficiency in the logistics industry [15]. Li et al. tested the impact of technological innovation on carbon emission efficiency in China [16]. A large number of studies have also verified that foreign direct investment, industrial structure, urbanization level, market scale, and population density are important factors affecting carbon emission efficiency [17,18,19]. Empirical results show that logistics efficiency and carbon emission efficiency are mainly affected by economic development, foreign trade, informatization, industrial structure, resource utilization, foreign direct investment, urbanization, market scale, and population density. With the gradual maturity of time-series analysis, academic research has gradually shifted to spatial network analysis [20,21,22]. Social network analysis (SNA) is widely used to construct spatial correlation networks of TLI carbon emissions and analyze network structure, node attributes, and agglomeration characteristics. SNA constructs correlation matrices to reveal the structural characteristics of spatial relationships [23,24,25] and identifies key regions in the spatial correlation network by analyzing overall network structure, individual node attributes, and spatial clustering [26,27]. Scholars further adopted the QAP method combined with panel data to explore the formation mechanisms of spatial correlation networks [28,29]. For example, given the limitation that traditional models analyze attribute variables and relational variables separately, some researchers introduced the exponential random graph model (ERGM) to comprehensively analyze the joint impact of multiple factors on the formation of spatial correlation networks [30,31,32]. Existing studies have proven that TLI carbon emissions are characterized by prominent regional disparities and complex spatial spillovers. Restricted by the mobility of carbon emission sources in the logistics industry, regional emission reduction faces great challenges [32,33].
The logistics industry has obvious regional attributes, and there exist complex spatial correlations among provinces. It is difficult to achieve ideal effects with independent emission reduction policies formulated by a single province. It is necessary to formulate targeted policies based on the characteristics of spatial correlation networks and strengthen cross-provincial and cross-departmental collaborative governance [34,35]. Therefore, formulating differentiated policies according to network characteristics and promoting cross-regional coordinated governance are crucial for the low-carbon development of China’s logistics industry [36].
At present, there are relatively few studies focusing on the spatial spillover effects and internal driving factors of logistics carbon emission efficiency from a national perspective. On this basis, this paper explores the current situation and spatio-temporal evolution characteristics of logistics carbon emission efficiency in China from 2010 to 2022 and analyzes its driving factors. The research results can provide a reference for designing differentiated carbon reduction policies and building cross-regional collaborative governance mechanisms for the logistics industry. The main contributions of this paper are as follows: (1) constructing a spatial correlation network of provincial logistics carbon emission efficiency based on the geographical distance, economic scale, and carbon emission scale among provinces by using a modified gravity model and (2) exploring the spatio-temporal evolution characteristics and internal driving mechanisms of the spatial correlation network of logistics carbon emission efficiency.

3. Method and Data Sources

3.1. Research Methods

3.1.1. Super-SBM Model for Logistics Energy Efficiency Measurement

This paper selects nine major energy types consumed by the logistics industry, including raw coal, gasoline, and kerosene, to calculate provincial energy consumption and carbon emissions. The calculation formulas are shown as Formula (1) and Formula (2):
E i j = Q i j θ j
C i = j = 1 n E i j × δ j
where E i j is the standard coal consumption of energy type j in region i ; Q i j is the physical consumption of energy type j in region i ; θ j is the standard coal conversion coefficient of energy j ; C i is the total carbon emissions of the logistics industry in region i ; and δ j is the carbon emission coefficient of energy j . The relevant energy conversion and emission coefficients are shown in Table 1 [37].
Tone proposed a non-radial and non-oriented SBM model, which can effectively distinguish and rank decision-making units (DMUs) with an efficiency value of 1 [38]. Assuming there are n independent DMUs, each containing m input variables and s output variables, the Super-SBM model is constructed as follows:
min ρ = 1 + 1 m i = 1 m S i x i k 1 1 s r = 1 s S r + y r k
s.t.
j = 1 , j k n x i j λ j s i x i k j = 1 , j k n y r j λ j + s r + y r k λ 0 , s 0 , s + 0 , i = 1 , 2 , , m r = 1 , 2 , , q j = 1 , 2 , , n ( j k )
where ρ represents the efficiency value of the evaluated DMU; s i and s i + represent slack variables of inputs and outputs, respectively; λ denotes the weight coefficient of input and output indicators; and k refers to the k -th decision-making unit.

3.1.2. Spatial Correlation Network for Carbon Emission Efficiency of TLI

Each province is regarded as a network node, and the spatial correlation degree of logistics carbon emission efficiency between provinces is defined as the network edge. The correlation value is taken as the edge weight to construct a weighted directed spatial correlation network. Considering the directionality of inter-provincial logistics transportation and the differences in carbon emission efficiency, geographical location, and economic conditions among provinces, the network presents the characteristics of a weighted directed network.
Common methods for judging network correlation relationships include the VAR Granger causality test and gravity model. The VAR model is overly sensitive to lag order selection and cannot accurately capture dynamic network changes. In contrast, the gravity model can combine cross-sectional data such as geography, economy, and population to judge inter-regional correlation and identify the evolution trend of spatial correlation, and it can also quantify the spatial transmission paths among regional units [39,40].
This paper adopts a modified gravity model, as shown in Formula (4).
G i w = T i T i + T w × P i T i U i 3 P w T w U w 3 D i w e i e w 2
where i and w represent province i and province w , respectively; G i w is the gravity coefficient between province i and province w ; Q i is the carbon emission efficiency value of province i ; P i is the year-end permanent population of province i ; G D P i is the gross domestic product of province i ; D i w is the straight-line distance between the capitals of province i and province w ; and P O P i is the per capita GDP of province i .
The gravity coefficient matrix of 30 × 30 among all provinces is calculated according to Formula (4). The average value of each row in the matrix is set as the threshold: if the gravity coefficient is greater than the threshold, the value is recorded as 1, indicating a significant spatial correlation between the two provinces; otherwise, it is recorded as 0, indicating no significant spatial correlation. Finally, a 0–1 spatial correlation matrix is obtained. Taking 30 provinces as nodes and the elements of the spatial correlation matrix as edges, the spatial correlation network of logistics carbon emission efficiency is constructed.

3.1.3. Social Network Analysis

Social network analysis (SNA) originates from sociology and is mainly used to study social relationship networks. This paper uses UCINET 6.0 software to analyze the inter-provincial spatial correlation network of logistics carbon emission efficiency from three dimensions: overall network characteristics, individual node characteristics, and a block model.
(1) Network Density Analysis
This paper selects network density, network connectivity, network hierarchy, and network efficiency to describe the overall network structure. The calculation formulas are as follows:
D = N / M ( M 1 )
C = 1 V M ( M 1 ) / 2
H = 1 K / max ( K )
E = 1 S / max ( S )
where D is network density; N is the actual number of correlation relationships in the network; M is the total number of network nodes; C is network connectivity; V is the number of isolated node pairs; H is network hierarchy; K is the number of symmetric reachable node pairs; max ( K ) is the maximum number of reachable node pairs in theory; E is network efficiency; S is the number of redundant connections; and max ( S ) is the theoretical maximum number of redundant connections.
(2) Individual Network Analysis
Degree centrality, betweenness centrality, and closeness centrality are adopted to analyze the attribute characteristics of individual network nodes:
C d ( i ) = d ( i ) / ( N 1 )
C b ( i ) = 2 j N k N b j k ( i ) / b j k ( N 1 ) ( N 2 )
C c ( i ) = 1 j = 1 N d i j
where C d ( i ) is the degree centrality of province i ; d ( i ) is the number of provinces connected to i ; C b ( i ) is the betweenness centrality; C c ( i ) is the closeness centrality; d i j is the shortest path length between i and j ; b j k is the number of shortest paths between j and k ; and b j k ( i ) is the number of paths passing through i .
(3) Block Model Analysis
The block model is a classic spatial clustering method in social network analysis, which can classify network nodes and identify their functional attributes according to network relationship characteristics [41]. Referring to existing research, network nodes are divided into four types of plates: two-way spillover, net benefit, broker, and net spillover [42]. The classification criteria are shown in Table 2.
Among these categories, the “two-way spillover” plate refers to a group where its members maintain a relatively high number of spillover connections—both with members of other plates and within the plate itself. The “net benefit” plate, by contrast, denotes a plate that receives far more relational links from other plates than the number of connections it spills outward to other plates. As for the “broker” plate, its members not only obtain a large volume of relationships from other plates but also send out a substantial number of connections to external plates, thereby functioning as intermediaries and bridging nodes in the overall network. Additionally, the “net spillover” plate is defined by its members having notably more spillover relationships with members of other plates compared to the number of relationships they receive from outside their own plate.

3.1.4. Quadratic Assignment Procedure (QAP) Analysis

The quadratic assignment procedure (QAP) is a special method for analyzing the correlation and regression relationships among multiple relational matrices. Its core principle is to compare the corresponding elements of different matrices to calculate correlation coefficients and conduct non-parametric significance tests [43]. QAP regression can realize the regression analysis of one explained matrix and multiple explanatory matrices. The regression formula is as follows:
X = f ( T 1 , T 2 , T 3 , , T n )
where X denotes the spatial association matrix, acting as the explained variable. Specifically, this study employs the spatial correlation matrix of carbon emissions associated with the TLI. T j (j = 1, 2, 3 … n) represents the influencing factor matrices, serving as explanatory variables. Each T j is a square matrix that both exerts an impact on carbon emissions and gauges the regional variations in the TLI.
This paper selects six influencing factors as explanatory variables: transportation structure (TS), energy intensity (EI), transportation intensity (TI), economic development level (GDP), policy support (PS), and population size (POP). The variable definitions are shown in Table 3.

3.2. Data Sources

Considering data availability, representativeness, and integrity, this paper selects 30 provincial-level regions in mainland China (excluding Xizang, Hong Kong, Macao, and Taiwan) as research objects, with the research period from 2010 to 2022. All data are mainly derived from the China Statistical Yearbook, the China Energy Statistical Yearbook, provincial statistical yearbooks, and the Tertiary Industry Statistical Yearbook. Since there is no independent statistical category for the logistics industry in official statistical standards, this paper follows mainstream academic practices and adopts the data of transportation, warehousing, and postal services to represent the development level of the logistics industry [44]. The evaluation index system of logistics carbon emission efficiency, including undesirable outputs, is shown in Table 4.

4. Results and Discussion

4.1. Overall Spatial Distribution of Logistics Carbon Emission Efficiency

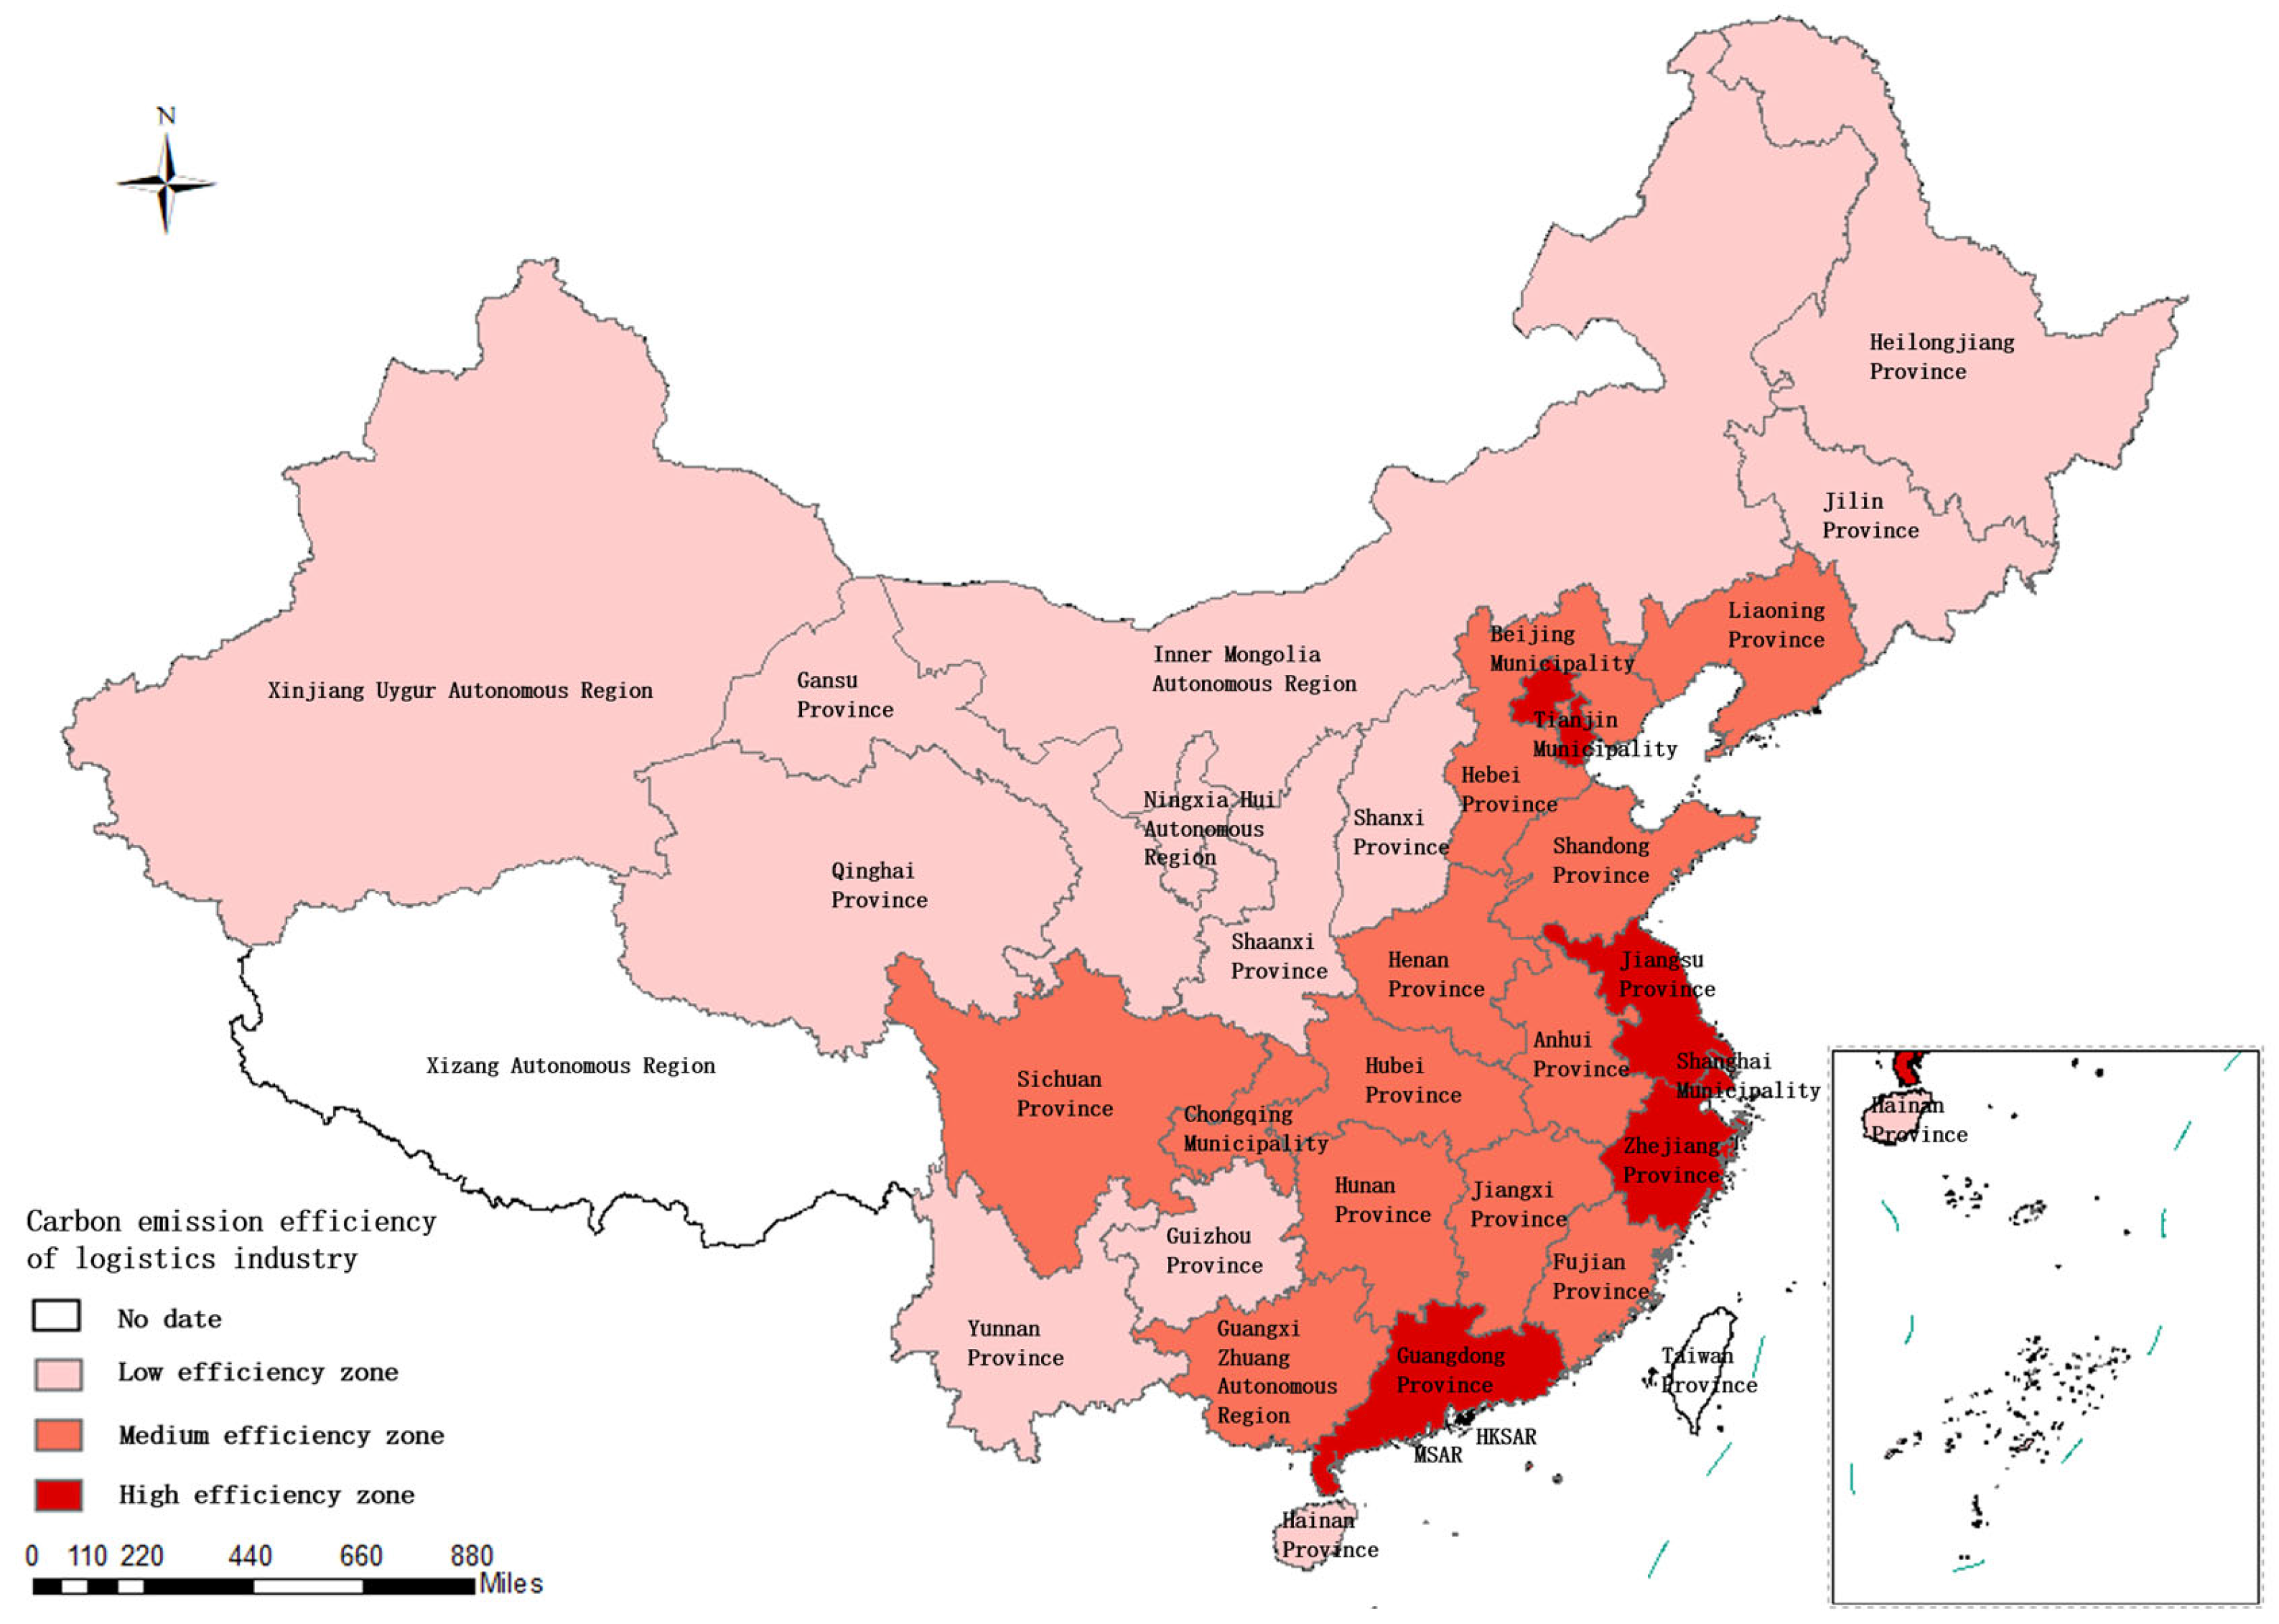
According to Figure 1, the carbon emission efficiency of China’s logistics industry is divided into three levels: a high-efficiency zone, a medium-efficiency zone, and a low-efficiency zone. On the whole, the efficiency presents an obvious gradient pattern: high in the east and low in the west, high in the south and low in the north, with prominent spatial agglomeration characteristics.
High-efficiency zones are concentrated in the three major economic circles along China’s eastern coast, including Beijing and Tianjin in the Beijing–Tianjin–Hebei region, Shanghai, Jiangsu, and Zhejiang in the Yangtze River Delta, and Guangdong in the Pearl River Delta. These regions are the benchmark areas for the low-carbon development of China’s logistics industry.
Medium-efficiency zones present a T-shaped transitional distribution: horizontally covering Liaoning, Shandong, Hebei, and Fujian along the eastern coast; vertically running through Henan, Hubei, Hunan, Anhui, and Jiangxi in central China, as well as Sichuan and Chongqing in southwest China. Medium-efficiency regions connect high-efficiency and low-efficiency zones and have great potential for low-carbon development.
Low-efficiency zones are mainly distributed in northeast, northwest, and southwest inland regions, including Heilongjiang and Jilin in northeast China; Shanxi and Inner Mongolia in north China; Shaanxi, Gansu, Qinghai, Ningxia, and Xinjiang in northwest China; and Guangxi, Yunnan, and Guizhou in southwest China, as well as Hainan. These areas are the weak links of low-carbon transformation in China’s logistics industry, with efficiency values far below the national average.

4.2. Analysis of Spatial Correlation Network Structure of Carbon Emissions in TLI

4.2.1. Overall Network Characteristics

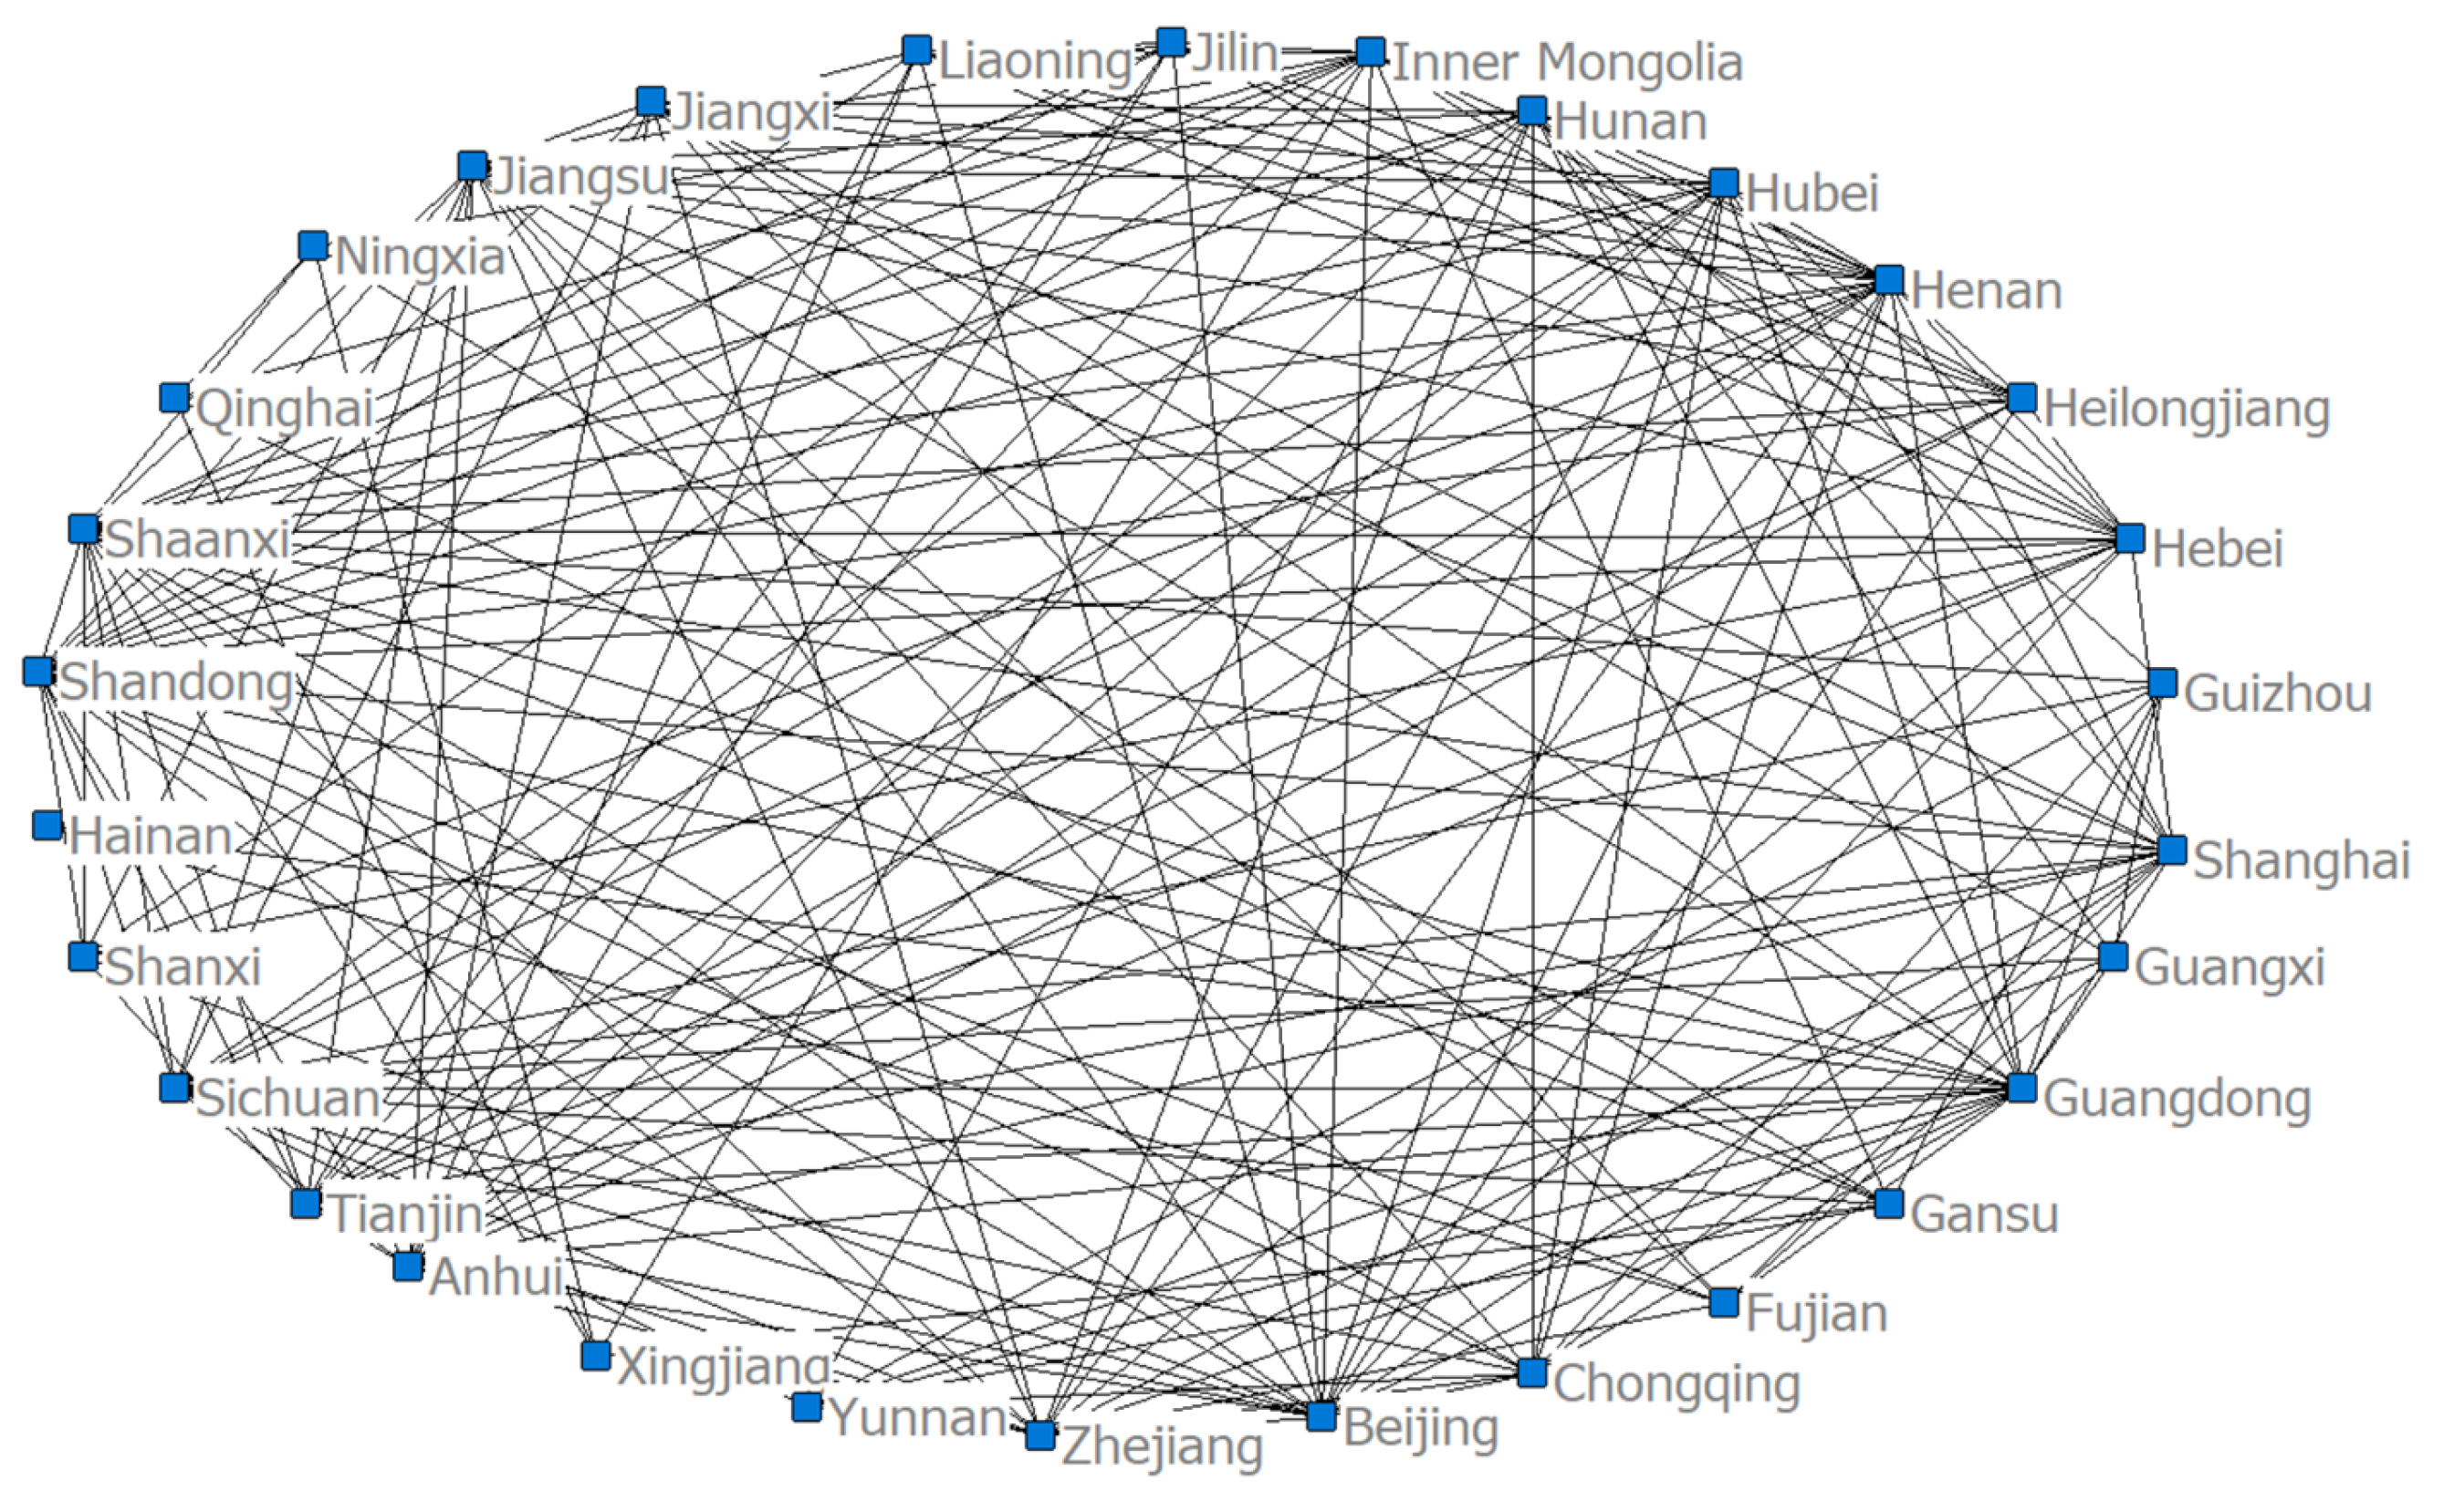
Based on the modified gravity model, the provincial logistics carbon emission efficiency matrix is converted into a 0–1 binary matrix. This paper selects four key time nodes, 2010, 2014, 2018, and 2022, and uses UCINET for network visualization and overall characteristic analysis (Figure 2, Table 5).
From Figure 2, it is evident that a distinct core–periphery structure is observed, with Beijing, Shanghai, Jiangsu, Zhejiang, Guangdong, Fujian, and Shandong serving as network centers that receive a high number of connections, while provinces such as Qinghai, Xinjiang, Yunnan, Heilongjiang, Jilin, and Liaoning are located at the periphery of the network and generate a significant number of connections.
From 2010 to 2018, the network density continued to rise, and the actual number of network connections increased from 261 to 301, indicating that regional logistics integration and low-carbon technology spillover effects were continuously enhanced. Affected by the COVID-19 pandemic, the network density declined slightly from 2018 to 2022 but was still significantly higher than the initial level, and the network showed a recovery trend after the pandemic.
The network connectivity remained 1.0000 in all four years, meaning that all 30 provinces were included in a unified interconnected network with no isolated nodes. The logistics carbon emission efficiency of each province was not independent, and widespread cross-regional correlations existed.
From 2010 to 2018, the network hierarchy decreased continuously, which reflected that the hierarchical gap between eastern core provinces and central and western provinces was gradually narrowed. The network efficiency also declined year by year, accompanied by the increase in redundant connections and the improvement of overall network stability, which avoided network collapse caused by individual node disconnection. From 2018 to 2022, network hierarchy and network efficiency rebounded slightly. The pandemic strengthened the hub status of core provinces and widened regional hierarchical differences to a certain extent, and partial cross-regional connections were interrupted, leading to a slight decline in network stability.

4.2.2. Individual Network Analysis

This paper adopts degree centrality, betweenness centrality, and closeness centrality to analyze individual node attributes in 2010, 2014, 2018, and 2022 (Table 6).
From 2010 to 2018, the three types of centrality indicators of all provinces increased synchronously with the rise of network density. It shows that the spatial correlation scope of inter-provincial logistics carbon emission efficiency was expanding, the intermediary transmission function was improved, and network accessibility was significantly enhanced. From 2018 to 2022, restricted by the pandemic, various centrality indicators decreased slightly but were still higher than the 2010 baseline. The core structure of the network did not change fundamentally and maintained a good recovery momentum.
Eastern coastal provinces, including Guangdong, Shandong, Jiangsu, Zhejiang, Shanghai, Beijing, Henan, and Tianjin, always ranked in the top 8 in all centrality indicators, becoming the absolute core nodes of the network and dominating the correlation and transmission of the whole network. By contrast, northwest provinces such as Xinjiang, Qinghai, Hainan, Ningxia, and Gansu stayed at the bottom of the ranking, with a narrow correlation scope, weak intermediary capacity, and poor accessibility, forming an obvious low-value lock-in effect.
The bridging role of central provinces became increasingly prominent: the growth rate of betweenness centrality of Hubei, Anhui, and Hunan was higher than the national average. From 2010 to 2018, the betweenness centrality of Hubei rose from 9.86 to 12.35, and that of Anhui increased from 7.86 to 10.12. Central provinces have gradually become key transmission nodes connecting eastern core areas and western peripheral areas, and their role as regional collaborative hubs has been continuously strengthened.

4.2.3. Block Model Analysis

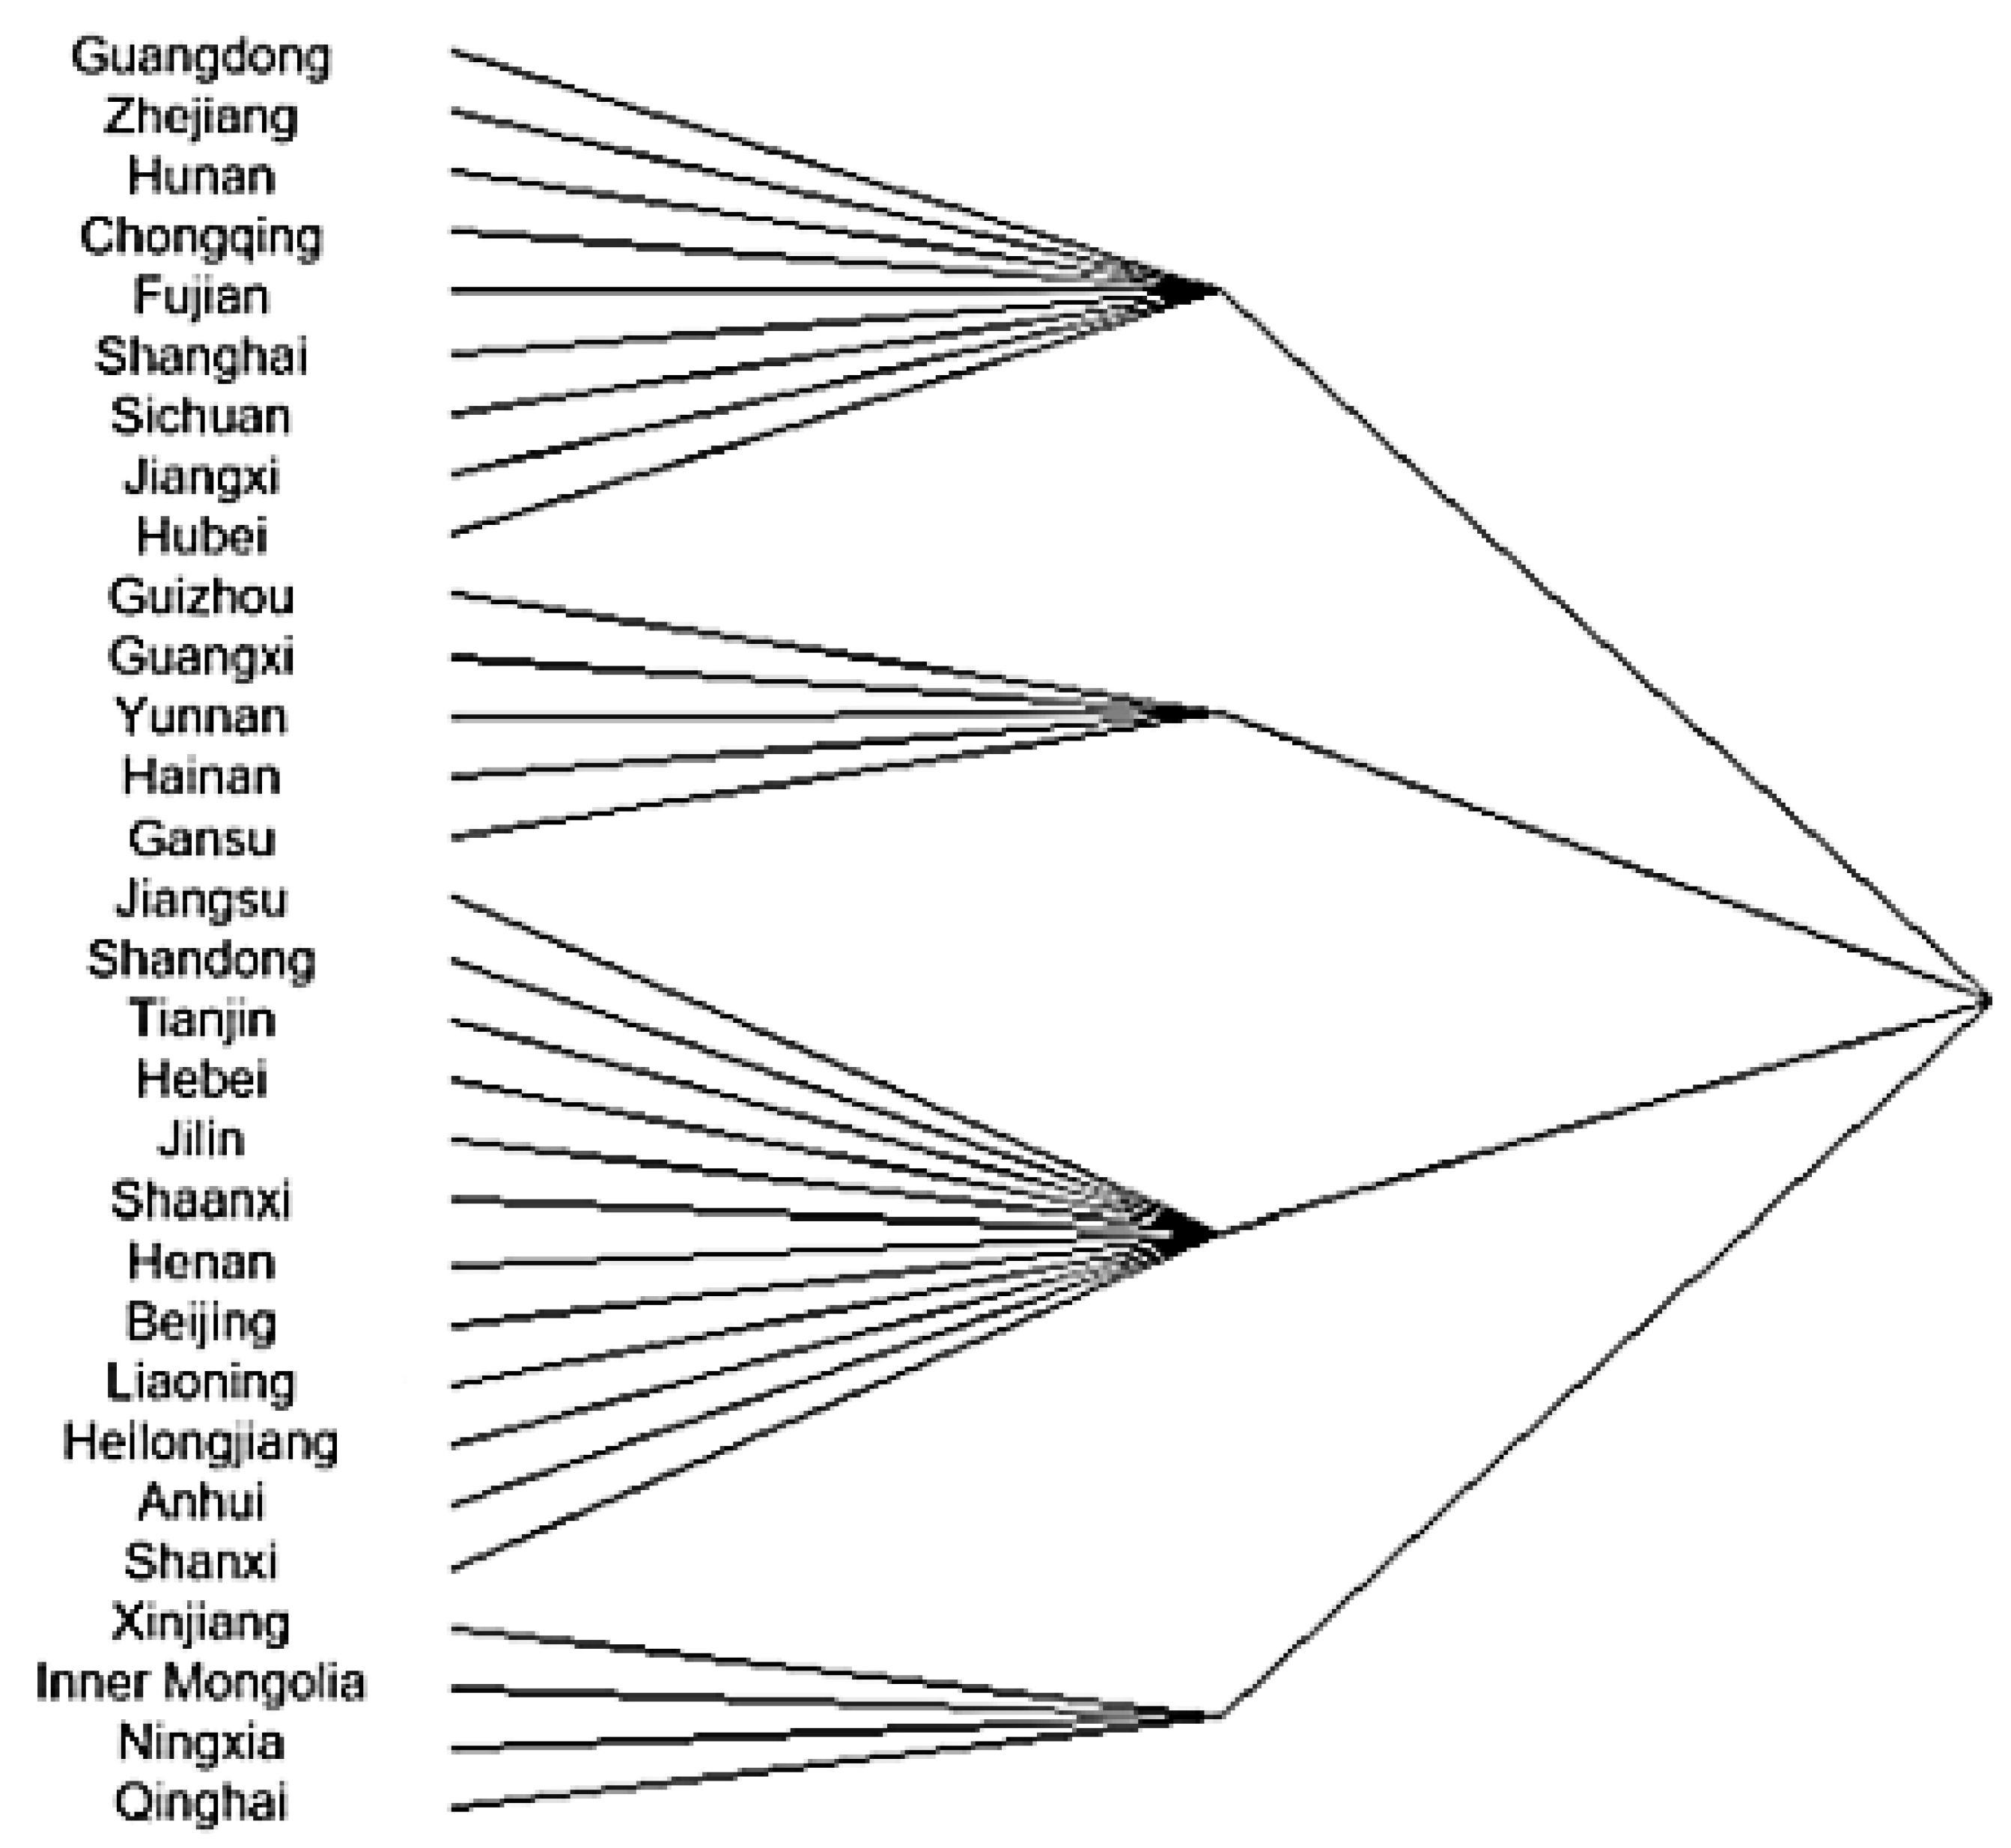
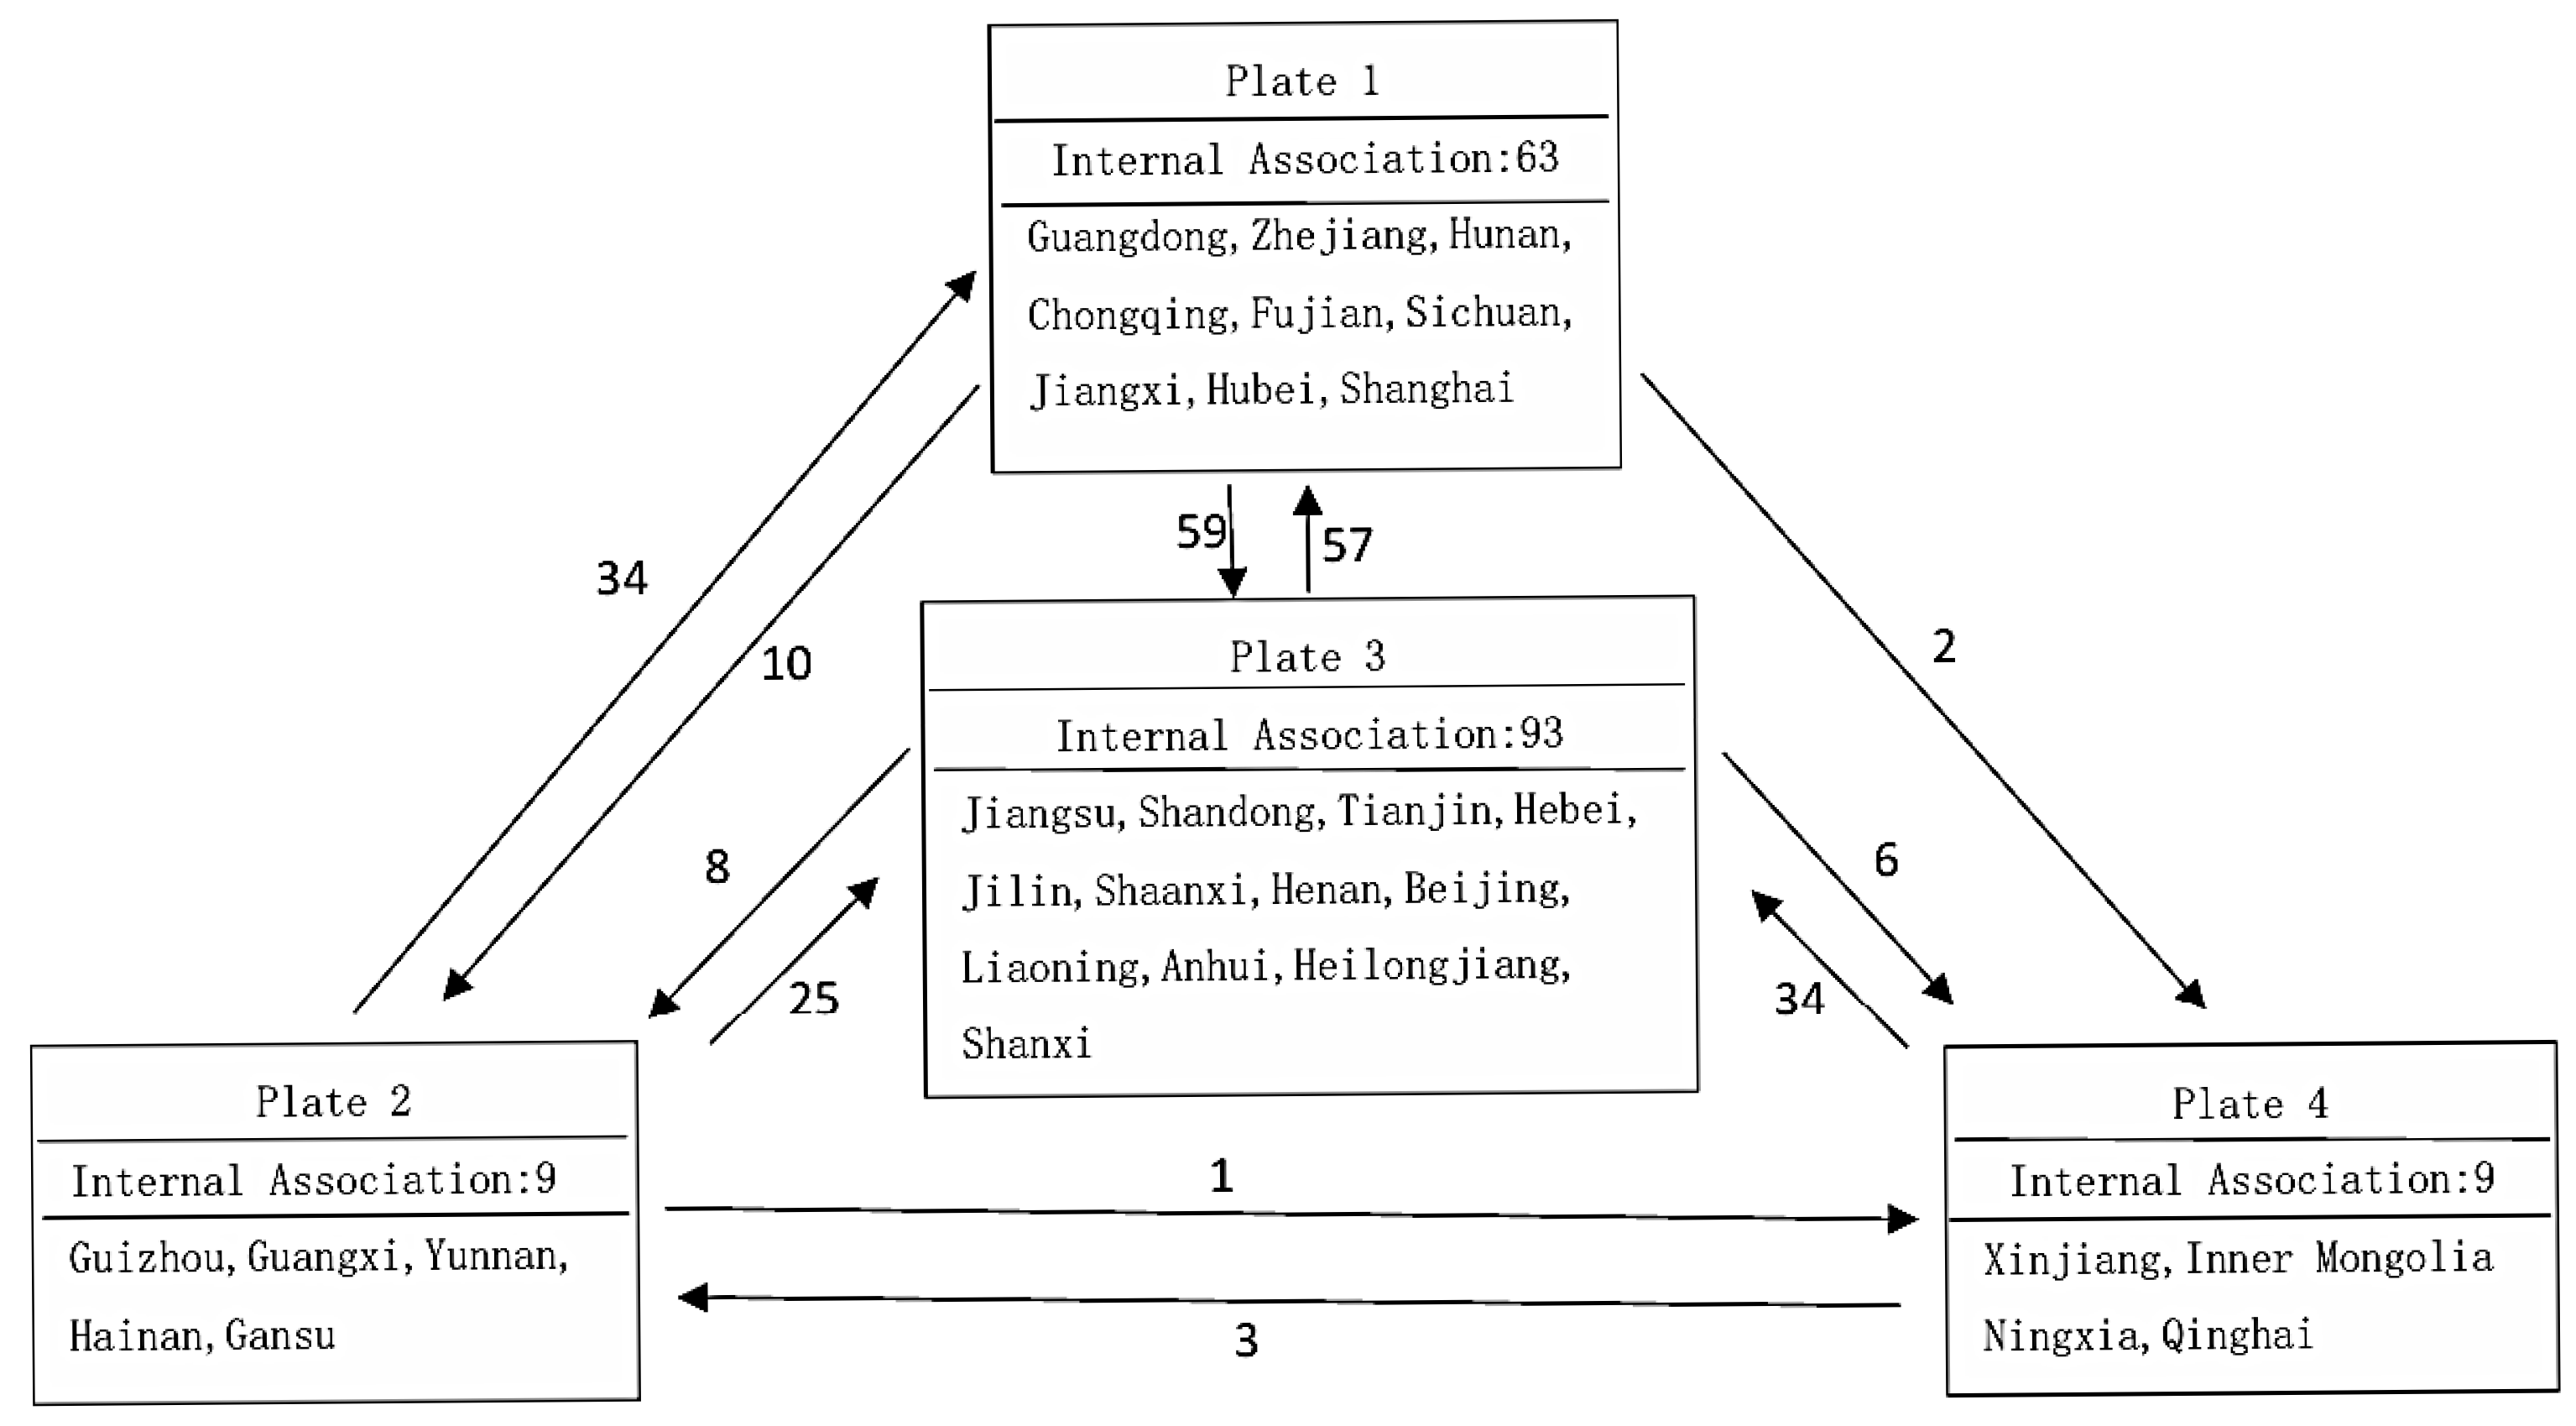
This paper uses the CONCOR algorithm in UCINET to carry out block model analysis on the 2022 logistics carbon emission efficiency network and divides 30 provincial-level regions into four functional plates (Figure 3 and Figure 4, Table 7).
Plate 1 consists of nine provinces mainly distributed in eastern coastal areas and the middle and lower reaches of the Yangtze River, presenting a net benefit attribute. This plate receives more efficiency spillovers than it outputs and is the main recipient of national logistics carbon emission efficiency spillovers. Developed eastern provinces such as Guangdong, Shanghai, and Zhejiang drive the low-carbon development of central and western provinces such as Hunan, Hubei, and Chongqing. Plate 2 includes five provinces located in southwest and southern marginal areas, belonging to the net spillover plate. Its output of efficiency spillovers is far greater than the received spillovers, which is an important source of driving force for the overall improvement of national logistics carbon emission efficiency. Plate 3 covers twelve provinces in north, northeast, and east China, which is the largest net benefit plate in the country and highly dependent on external efficiency input. Plate 4 is composed of four northwest inland provinces with broker attributes. This plate not only receives efficiency spillovers from other plates but also outputs spillovers to the outside, acting as a bridge connecting net spillover plates and net benefit plates. Plate 4 refers to regions abundant in oil, coal, and natural gas reserves, where transportation infrastructure remains underdeveloped and economic growth is relatively slow; consequently, energy efficiency related to logistics in these areas is low.
In 2022, the spatial correlation network of China’s logistics carbon emission efficiency formed a clear plate structure and spillover pattern: spillover from peripheral areas to core areas, which is different from the traditional “core to periphery” spillover mode and reflects the regional imbalance of low-carbon development in China’s logistics industry. In the future, it is necessary to strengthen inter-plate communication and cooperation, improve the internal coordination capacity of net spillover plates, give full play to the bridging role of broker plates, and promote the overall improvement of national logistics carbon emission efficiency.

4.3. Influencing Factors of Spatial Correlation Network of Carbon Emissions Efficiency of TLI

We conducted a QAP correlation analysis and regression analysis on the spatial correlation matrix, and the calculation results are presented in Table 8 and Table 9.
According to QAP correlation results, there is a significant positive correlation between economic development level and population size (coefficient = 0.568). Economic development level is also positively correlated with energy intensity (coefficient = 0.512), indicating that the larger the economic gap between provinces, the more obvious the difference in logistics energy utilization efficiency. The correlation coefficient between energy intensity and policy support is −0.261, showing a significant negative correlation. It means that provinces with strong low-carbon policy support can effectively reduce logistics energy consumption and narrow the efficiency gap with advanced regions even under different economic foundations. The absolute values of correlation coefficients between transportation structure, transportation intensity, and other variables are all less than 0.1, indicating that the two industrial indicators are relatively independent and will not cause multicollinearity with macroeconomic, population, and policy variables.
QAP regression results show that all six variables pass the significance test, and all regression coefficients are significantly negative. It means that the smaller the inter-provincial difference of each indicator, the easier to form a stable spatial correlation of logistics carbon emission efficiency.
In terms of influence intensity, energy intensity has the largest impact (standardized coefficient = −0.315). A smaller gap in energy intensity represents similar low-carbon technology and energy utilization levels between provinces, which is conducive to two-way technology spillover, resource sharing, and coordinated development. Excessive technological differences will form technical barriers and hinder spatial correlation. It is recommended to establish a cross-provincial low-carbon technology sharing platform to bridge the gaps in energy consumption and technological capabilities between provinces and eliminate barriers to technology transfer.
Transportation structure and transportation intensity also significantly restrict spatial correlation. Similar transportation structure reduces the cost of a cross-regional logistics connection and promotes factor flow and efficiency spillover. Close transportation intensity means matching the logistics market demand scale and structure, which helps to form long-term industrial linkage. It is recommended to establish a cross-provincial low-carbon technology sharing platform to bridge the gaps in energy consumption and technological capabilities between provinces and eliminate barriers to technology transfer.
Among external influencing factors, economic development level has the most prominent impact (standardized coefficient = −0.258). Provinces with similar economic levels have matching logistics development demand and low-carbon investment capacity and are more likely to carry out equal cross-regional cooperation. Too large an economic gap will lead to mismatched development stages and difficult collaboration.
Policy support and population size also play significant roles. Consistent low-carbon policy orientation can break administrative barriers and provide an institutional guarantee for cross-regional element flow. A similar population size means equivalent logistics market capacity, which maintains stable logistics exchanges and spatial correlation.

5. Conclusions and Policy Recommendations

5.1. Conclusions

Taking 30 provincial-level regions in China as research samples, this paper combines the Super-SBM model, modified gravity model, social network analysis, and QAP regression to systematically explore the spatio-temporal distribution, network structure, and driving factors of logistics carbon emission efficiency. The main conclusions are as follows:
(1) The carbon emission efficiency of China’s provincial logistics industry has obvious spatio-temporal differentiation characteristics. From 2010 to 2022, the overall efficiency presents a stable pattern of “high in the east and low in the west, high in the south and low in the north”. Eastern coastal provinces maintain high efficiency, while northwest and southwest inland provinces are stuck in low efficiency, with a large regional gap. Global Moran’s I index shows significant positive spatial agglomeration during the whole research period. The Yangtze River Delta forms a national high-efficiency hot spot, while northwest and southwest inland areas form low-efficiency cold spots. Core eastern cities have strong agglomeration but insufficient radiation driving effect on the surrounding areas.
(2) A nationwide interconnected spatial correlation network of logistics carbon emission efficiency has been formed and evolved in phases. The network connectivity always remains 1, with no isolated provinces. The network density increased steadily before 2018 and declined slightly after the pandemic but is still higher than the initial level. The network hierarchy weakened before 2018 and rebounded after 2018. Eastern coastal provinces are core network nodes with strong control ability; central provinces act as important transmission bridges; western provinces are at the network edge with obvious low-value lock-in. The block model presents a unique spillover pattern from peripheral plates to core plates.
(3) Inter-provincial development differences are the core constraints of spatial correlation. Energy intensity, transportation structure, transportation intensity, economic development level, policy support, and population size all have significant negative impacts on spatial correlation. Narrowing regional gaps in technology, industry, economy, policy, and market demand is the key to promoting cross-regional coordinated development of logistics carbon emission efficiency.

5.2. Policy Recommendations

(1) The government should pay attention to the spatial correlation of logistics energy efficiency across provinces, implement cross-regional collaboration and coordination, and abandon the concept of local governments independently improving energy efficiency. Establish a cross-regional and cross-sectoral collaborative emission reduction mechanism for the logistics industry; construct a unified cross-provincial logistics emission reduction coordination system, accelerate the interconnection of logistics infrastructure between the eastern and western regions, as well as between the central and western regions, and compensate for the infrastructure shortcomings in underdeveloped western regions; establish a regional benefit sharing and ecological compensation mechanism to eliminate administrative and policy barriers. The developed eastern regions should fully leverage their technological and economic advantages to promote the low-carbon transformation of the logistics industry in the central and western regions, while the central and western regions should actively learn from advanced experiences and promote the application of relevant technologies.
(2) Optimize the spatial collaborative network to promote coordinated regional development; strengthen the technology spillover and radiation effects in core eastern regions such as the Yangtze River Delta and the Pearl River Delta, addressing the issue of “developed core areas and underdeveloped peripheral areas”; consolidate the bridge role of central provinces, smoothing the efficiency transmission channels between the east and the west; increase targeted policy support for western peripheral provinces, helping them break through the dilemma of low efficiency and integrate into the national collaborative emission reduction system.
(3) Governments at all levels need to balance economic development and environmental protection goals. By transforming the mode of economic growth, they should vigorously develop a low-carbon economy and support the development of logistics enterprises with low energy consumption, low emissions, and low pollution. Provinces at the edge of the network should implement preferential policies for talent introduction as soon as possible, narrow the gap in human capital, and provide sufficient supporting infrastructure and talent reserves for the construction of a smart logistics and distribution system. Balance the investment in environmental infrastructure construction among provinces, especially increasing the investment in environmental infrastructure in remote provinces. Increase investment in environmental infrastructure, promote the continuous upgrading of related facilities, and reduce the gap in logistics carbon emission governance among provinces.

Author Contributions

All authors contributed equally to this work. In particular, H.L. put forward the initial idea of research, designed the research method, and drafted the first draft. J.L. performed the case study. All authors have read and agreed to the published version of the manuscript.

Funding

This research was funded by the Decision-Making Consultation Projects of Jiangxi Provincial Department of Science and Technology, China (Grant No. 20244BAA10036).

Data Availability Statement

All data generated or analyzed during this study are included in the published article (Table 1, Table 2, Table 3, Table 4, Table 5, Table 6, Table 7, Table 8 and Table 9).

Conflicts of Interest

The authors declare no conflicts of interest.

References

  1. Kythreotis, A.P.; Jonas, A.E.G.; Howarth, C. Locating climate adaptation in urban and regional studies. Reg. Stud. 2020, 54, 576–588. [Google Scholar]
  2. Guo, X.; Wang, D. Analysis of the spatial relevance and influencing factors of carbon emissions in the logistics industry from China. Environ. Sci. Pollut. Res. 2022, 29, 2672–2684. [Google Scholar]
  3. Huang, Q.; Ling, J. Measuring embodied carbon dioxide of the logistics industry in China: Based on industry stripping method and input-output model. Environ. Sci. Pollut. Res. 2021, 28, 52780–52797. [Google Scholar] [CrossRef] [PubMed]
  4. Mu, X.Y.; Wang, L.; Xu, R.; Guo, Z.J. Study on carbon emission decoupling and influencing factors of logistics industry in western provinces. Environ. Sci. Technol. 2020, 54, 8123–8132. [Google Scholar]
  5. Deng, F.; Xu, L.; Fang, Y.; Gong, Q.; Li, Z. PCA-DEA-tobit regression assessment with carbon emission constraints of China’s logistics industry. J. Clean. Prod. 2020, 271, 122548. [Google Scholar] [CrossRef]
  6. Zhang, N.; Zhang, Y.; Chen, H. Spatial correlation network structure of carbon emission efficiency of railway transportation in China and its influencing factors. Sustainability 2023, 15, 9393. [Google Scholar] [CrossRef]
  7. Ding, H.; Liu, C. Carbon Emission Efficiency of China’s Logistics Industry: Measurement, Evolution Mechanism, and Promotion Countermeasures. Energy Econ. 2024, 129, 107221. [Google Scholar] [CrossRef]
  8. Kang, X.; Chen, L.; Wang, Y.; Liu, W. Analysis on the spatial correlation network and driving factors of carbon emissions in China’s logistics industry. J. Environ. Manag. 2024, 366, 121916. [Google Scholar] [CrossRef] [PubMed]
  9. Zeng, G.; Sang, Y.; Gui, Q.; Li, J.; Yuan, J.; Zhu, K. Research on carbon emission efficiency and spatial-temporal factors in the transportation industry: Evidence from the Yangtze River Economic Belt. Glob. NEST J. 2024, 26, 1–10. [Google Scholar] [CrossRef]
  10. Dong, Q.; Zhou, J.; Du, Q. Analysis of the spatial correlation pattern of logistics carbon emission efficiency and its influencing factors: The case of China. Environ. Sci. Pollut. Res. 2024, 31, 11178–11191. [Google Scholar] [CrossRef] [PubMed]
  11. Yuan, C.; Zhu, J.; Zhang, S.; Zhao, J.; Zhu, S. Analysis of the Spatial Correlation Network and Driving Mechanism of China’s Transportation Carbon Emission Intensity. Sustainability 2024, 16, 3086. [Google Scholar] [CrossRef]
  12. Qin, X.; Zhao, C. Research on Logistics Industry Efficiency and Spatial-Temporal Evolution of the New International Land-Sea Trade Corridor. Railw. Transp. Econ. 2023, 45, 102–109. [Google Scholar]
  13. Ma, Y.Y.; Li, Y.P.; Ma, L.X. Spatial Correlation Network Effect and Influencing Factors of Green and Low-carbon Development in Logistics Industry. Environ. Sci. 2025, 46, 1462–1472. [Google Scholar] [CrossRef] [PubMed]
  14. Pattak, D.C.; Tahrim, F.; Salehi, M.; Voumik, L.C.; Akter, S.; Ridwan, M.; Sadowska, B.; Zimon, G. The Driving Factors of Italy’s CO2 Emissions Based on the STIRPAT Model: ARDL, FMOLS, DOLS, and CCR Approaches. Energies 2023, 16, 5845. [Google Scholar] [CrossRef]
  15. Xie, X.; Choi, K.; Ji, X. How does the digital economy enhance carbon emission efficiency in the logistics industry? Empirical evidence from 30 Chinese provinces. Sci. Rep. 2025, 15, 20485. [Google Scholar] [CrossRef]
  16. Li, S.; Cao, X. Can green technology innovation empower urban carbon mission reduction? Evidence from China. Front. Environ. Sci. 2025, 13, 1616667. [Google Scholar] [CrossRef]
  17. Lv, Y.; Liu, J.; Cheng, J.; Andreoni, V. The persistent and transient total factor carbon emission performance and its conomic determinants: Evidence from China’s province-level panel data. J. Clean. Prod. 2021, 310, 128198. [Google Scholar] [CrossRef]
  18. Xu, G.; Zhao, T.; Wang, R. Decomposition and decoupling analysis of factors affecting carbon emissions in China‘s regional logistics industry. Sustainability 2022, 14, 6061. [Google Scholar] [CrossRef]
  19. Song, J.; Xiao, H.; Liu, Z. Analysis of the Driving Mechanism of Urban Carbon Emission Correlation Network in Shandong Province Based on TERGM. Sustainability 2024, 16, 4233. [Google Scholar] [CrossRef]
  20. Zhou, T.; Li, W. Efficiency evaluation and influencing factors analysis of logistics industry based on multiobjective intelligent computing. Comput. Intell. Neurosci. 2022, 2022, 3098160. [Google Scholar] [CrossRef] [PubMed]
  21. Zeng, C.; Chai, B.; Stringer, L.C.; Li, Y.; Wang, Z.; Deng, X.; Ma, B.; Ren, J. Land-based transportation influences carbon emission in urbanized China: A regional spatial spillover perspective. Sustain. Cities Soc. 2024, 100, 105008. [Google Scholar] [CrossRef]
  22. Wen, L.; Zhao, L. Spatial correlation of economic and energy consumption factors using SNA method. Energy Rep. 2022, 8, 73–82. [Google Scholar] [CrossRef]
  23. Lu, J.; Zhu, J. Research on the spatial correlation and coordinated development of carbon emissions in logistics industry. Environ. Resour. Ecol. J. 2022, 6, 20–31. [Google Scholar]
  24. Sun, B.; Feng, T.; Du, M.; Liang, Y.; Feng, T. Spatially correlated network structure and influencing factors of carbon emission efficiency in the power industry: Evidence from China. Systems 2025, 13, 30. [Google Scholar] [CrossRef]
  25. Liu, Q.; Fan, X. Spatial effects and transmission mechanism of carbon emissions from interprovincial logistics industry in China. Chin. J. Environ. Eng. 2024, 18, 298–308. [Google Scholar] [CrossRef]
  26. Tang, Y.; Yang, Z.; Yao, J.; Li, X.; Chen, X. Carbon emission efficiency and spatially linked network structure of China’s logistics industry. Front. Environ. Sci. 2022, 10, 1004463. [Google Scholar] [CrossRef]
  27. Cao, C.L. Measuring Sustainable Development Efficiency of Urban Logistics Industry. Math. Probl. Eng. 2018, 2018, 9187541. [Google Scholar] [CrossRef]
  28. You, J.; Hu, J.; Jiang, B. The correlation evolution and formation mechanism of energy ecological efficiency in China: A spatial network approach. Energy 2024, 313, 133971. [Google Scholar] [CrossRef]
  29. Wang, C.; Jiang, X. Green efficiency and influencing factors for highway transportation in Western China. J. Highw. Transp. Res. Dev. 2025, 42, 355–366. [Google Scholar] [CrossRef]
  30. Wang, B.; Liu, M.; Gao, S. Temporal-spatial evolution analysis of carbon emission efficiency in the logistics industry of coastal provinces in China based on the super-efficiency SBM model. Carbon Balance Manag. 2025, 20, 8. [Google Scholar] [CrossRef] [PubMed]
  31. Ren, C.; Lu, L.; Teng, J.; Yin, C.; Li, J.; Ji, H.; Wang, X.; Fu, F. Logistics Distribution Path Optimization Considering Carbon Emissions and Multifuel-Type Vehicles. J. Adv. Transp. 2025, 2025, 6668589. [Google Scholar] [CrossRef]
  32. Jiang, X.H. Evaluating the Carbon Emissions Efficiency of the Logistics Industry Based on a Super-SBM Model and the Malmquist Index from a Strong Transportation Strategy Perspective in China. Int. J. Environ. Res. Public Health 2020, 17, 8459. [Google Scholar] [CrossRef] [PubMed]
  33. Tang, Y.; Jiang, H. Spatiotemporal evolution and spatial differentiation of carbon emission intensity in the Chinese transport sector. Sci. Rep. 2026, 16, 13547. [Google Scholar] [CrossRef] [PubMed]
  34. Li, F.; Cai, W.; Ma, J.; Kou, Y. The evolution of the spatial association effect of carbon emissions in transportation: A social network perspective. Int. J. Environ. Res. Public Health 2022, 19, 15770. [Google Scholar] [CrossRef] [PubMed]
  35. Wang, J.; Lin, S.-j. The action mechanism of logistics agglomeration on the cross-regional transfer of carbon emissions. China Environ. Sci. 2021, 41, 3441–3452. [Google Scholar]
  36. Liu, J.; Hu, Q.; Wang, J.; Li, X. Impacts of logistics agglomeration on carbon emissions in China: A spatial econometric analysis. Environ. Sci. Pollut. Res. 2023, 30, 87087–87101. [Google Scholar] [CrossRef] [PubMed]
  37. Shu, X.; Xia, C.; Li, Y.; Tong, J.; Shi, Z. Relationships between carbon emission, urban growth, and urban forms of urban agglomeration in the Yangtze River Delta. Acta Ecol. Sin. 2018, 38, 6302–6313. [Google Scholar] [CrossRef]
  38. Tone, K. A slacks-based measure of super-efficiency in data envelopment analysis. Eur. J. Oper. Res. 2002, 143, 32–41. [Google Scholar] [CrossRef]
  39. Rong, T.; Zhang, P.; Li, G.; Wang, Q.; Zheng, H.; Chang, Y.; Zhang, Y. Spatial correlation evolution and prediction scenario of land use carbon emissions in the Yellow River Basin. Ecol. Indic. 2023, 154, 110701. [Google Scholar] [CrossRef]
  40. Dong, J.; Li, C. Structure characteristics and influencing factors of China’s carbon emission spatial correlation network: A study based on the dimension of urban agglomerations. Sci. Total Environ. 2022, 853, 158613. [Google Scholar] [CrossRef] [PubMed]
  41. White, H.C.; Boorman, S.A.; Breiger, R.L. Social structure from multiple networks. I. Blockmodels of roles and positions. Am. J. Sociol. 1976, 81, 730–780. [Google Scholar] [CrossRef]
  42. Scott, A.B.; Harrison, C.W. Social structure from multiple networks. II. Role structures. Am. J. Sociol. 1976, 81, 1384–1446. [Google Scholar] [CrossRef]
  43. Zhang, M.; Weng, A. Spatial correlation network and its formation mechanism of urban water utilization efficiency in the Yangtze River Economic Belt. Acta Geogr. Sin. 2022, 77, 2353–2373. [Google Scholar]
  44. Mei, G.; Gong, Y.; Wan, J.; Ji, K.W. Study of the efficiency measurement of logistics industry in East China based on three-stage DEA model. Manag. Rev. 2019, 31, 234–241. [Google Scholar]
Figure 1. Spatial distribution of annual average carbon emission efficiency in China’s logistics industry.
Sustainability 18 06936 g001
Figure 2. Spatial correlation network of logistics carbon emission efficiency (2022).
Sustainability 18 06936 g002
Figure 3. Spatial clustering results of logistics carbon emission efficiency (2022).
Sustainability 18 06936 g003
Figure 4. Internal and external correlation of each plate (2022). The numbers on the horizontal line with an arrow pointing to the right represent the number of receiving relationships outside. The numbers on the horizontal line with an arrow pointing to the left in represent the number of sent relations outside.
Sustainability 18 06936 g004
Table 1. Standard coal conversion coefficients and carbon emission coefficients of common energies.
CoefficientRaw CoalGasolineKeroseneDieselFuel OilOther Petroleum ProductsNatural GasHeatElectricity
θ j 0.71431.47141.47141.45711.42861.21.1430.03411.29
δ j 0.7560.4010.5710.5920.6180.5850.4480.2520.29
Table 2. Block model division criteria.
Ratio of Internal RelationshipsRatio of Received Relationships
≈0>0
( g k 1 ) ( g 1 ) Two-way spilloverNet benefit
< ( g k 1 ) ( g 1 ) Net spilloverBroker
Note: g k represents the number of provinces within the sector, g represents the number of provinces in the entire correlation network.
Table 3. Description of related variables.
VariableAbbreviationIllustrateUnit
transportation structureTSComprehensive indicator of the proportion of highways, railways, and water transportation%
energy intensityEIThe total amount of energy consumed in producing each unit of logistics added value, measured in standard coal10,000 tons/10,000 yuan
transportation intensityTIThe turnover of goods corresponding to a unit of GDPTon kilometer/10,000 yuan
level of national economic developmentGDPGross domestic product10,000 yuan
policy supportPSThe proportion of the local government’s fiscal expenditure in the logistics industry to the total local public budget expenditure%
population sizePOPYear-end permanent population10,000 people
Table 4. Evaluation index system of logistics carbon emission efficiency.
Indicator TypeIndicator NameIndicator Caliber
InputFixed asset investment (100 million yuan)Total social asset investment in logistics
Energy consumption (10,000 tons)Total energy consumption of logistics
Employees (10,000 people)Year-end employees in logistics
Desirable outputIndustrial GDP (100 million yuan)Logistics GDP of each province
Undesirable outputCO2 emissions (10,000 tons)Carbon emissions from logistics energy consumption
Table 5. Overall characteristics of spatial correlation network (2010–2022).
Indicator2010201420182022
Network density0.28970.31260.33450.3218
Network connectivity1.00001.00001.00001.0000
Network hierarchical degree0.57260.55130.52870.5402
Indicator0.61430.59270.57060.5834
Table 6. Centrality analysis results of provincial nodes.
Degree CentralityBetweenness CentralityCloseness Centrality
Provinces201020142018202220102014201820222010201420182022
Guangdong82.7686.2189.6686.2114.2214.8715.6815.1387.5689.2390.3289.15
Shandong79.3182.7686.2182.7612.6513.2413.9713.5185.1286.7887.8986.71
Jiangsu79.3182.7686.2182.7612.5813.1913.9213.4685.0786.7287.8386.65
Hebei37.9341.3844.8341.383.383.593.843.763.0864.8566.5964.78
Zhejiang75.8679.3182.7679.3110.3711.0511.8611.4282.6384.3685.4784.29
Shanghai75.8679.3182.7679.3110.2910.9811.7911.3582.5884.3185.4284.24
Beijing72.4175.8679.3175.869.8610.4211.0310.7180.2382.0583.1681.99
Tianjing62.0765.5268.9765.527.638.178.728.4175.4277.2678.9577.18
Henan72.4175.8679.3175.869.7210.3610.9710.6580.1581.9883.0981.92
Hunan58.6262.0765.5262.078.249.1510.069.5873.2575.1476.9375.07
Liaoning37.9341.3844.8341.383.423.673.923.7863.1564.9266.6764.85
Hubei58.6262.0765.5262.079.8611.0212.3511.7874.1676.0377.8275.96
Sichuan58.6262.0765.5262.077.958.629.389.0172.9874.8776.6674.8
Anhui55.1758.6262.0758.627.868.9510.129.6471.6473.5275.3173.45
Fujian37.9341.3844.8341.383.573.824.073.9363.2965.0466.7964.97
Xinjiang17.2417.2417.2417.240.180.210.240.2241.9243.5845.3343.51
Shanxi55.1758.6262.0758.627.528.038.548.2671.3273.1874.9773.11
Heilongjiang27.5931.0334.4831.031.521.741.961.8557.2358.9760.7258.9
Jilin27.5931.0334.4831.031.461.681.91.7957.1558.8960.6458.82
Jiangxi41.3844.8348.2844.834.264.685.124.8565.7867.4569.1467.38
Chongqing41.3844.8348.2844.834.184.595.034.7665.6267.3169.0167.24
Guangxi31.0334.4837.9334.482.162.382.592.4759.4761.2362.9861.16
Yunnan31.0334.4837.9334.482.092.312.522.459.3261.0862.8361.01
Shanxi31.0334.4837.9334.481.952.172.382.2659.1660.9262.6760.85
Neimenggu31.0334.4837.9334.481.872.092.312.1858.9460.7662.5160.69
Guizhou27.5931.0334.4831.031.231.451.671.5656.8758.6260.3758.55
Gansu24.1424.1427.5924.140.850.920.990.9554.6256.3458.0956.27
Hainan17.2417.2417.2417.240.310.340.370.3548.7550.4252.1750.35
Ningxia20.6920.6924.1420.690.420.470.520.4952.1853.8955.6453.82
Qinghai17.2417.2417.2417.240.210.240.270.2542.3544.0145.7643.94
Table 7. Correlation and spillover characteristics of each plate (2022).
BlockProvincesReceived RelationsSent RelationsExpected Internal Relation RatioActual Internal Relation RatioBlock Attribute
WithinOutsideWithinOutside
1Guangdong, Zhejiang, Hunan, Chongqing, Fujian, Shanghai, Sichuan, Jiangxi, Hubei6391637127.59%47.01%Net
Benefit
2Guizhou, Guangxi, Yunnan, Hainan, Gansu92196013.79%13.04%Net Spillover
3Jiangsu, Shandong, Tianjin, Hebei, Jilin, Shaanxi, Henan, Beijing, Liaoning, Heilongjiang, Anhui, Shanxi93118937137.93%56.71%Net
Benefit
4Xinjiang, Inner Mongolia, Ningxia, Qinghai9993710.34%19.57%Broker
Table 8. QAP correlation coefficients of influencing factors.
CoefficientGDPEIPOPTSTIPS
GDP1.0000.5120.568−0.0150.006−0.087
EI0.5121.0000.379−0.0210.053−0.261
POP0.5680.3791.000−0.0340.038−0.112
TS−0.015−0.021−0.0341.0000.0470.005
TI0.0060.0530.0380.0471.000−0.002
PS−0.087−0.261−0.1120.005−0.0021.000
Table 9. QAP regression results of spatial correlation matrix.
Variable NameNon-Standard Regression CoefficientStandard Regression CoefficientPermutation Standard Deviationp-Value
Intercept term0.28300.0120
EI−0.182−0.3150.0270
TS−0.105−0.1740.0310.0007
TI−0.072−0.1180.0330.0142
GDP−0.146−0.2580.0290
POP−0.084−0.1460.0320.0041
PS−0.091−0.1530.030.0023
Disclaimer/Publisher’s Note: The statements, opinions and data contained in all publications are solely those of the individual author(s) and contributor(s) and not of MDPI and/or the editor(s). MDPI and/or the editor(s) disclaim responsibility for any injury to people or property resulting from any ideas, methods, instructions or products referred to in the content.