1. Introduction
Contemporary economic transformations are defined by the increasingly close interdependence between digitalization, infrastructure development, and industrial performance, within a global context characterized by climate pressures, structural constraints, and ambitious sustainability goals. The intensification of global warming, ecosystem degradation, and increasing pressures on natural resources have led to a reevaluation of traditional models of economic growth, steering industrial policies and strategies toward integrating sustainability into the structure of production processes [
1,
2,
3]. In this context, sustainability can no longer be treated as a complementary objective but becomes a structural condition for long-term economic competitiveness and resilience, redefining the criteria for evaluating economic performance and industrial transformation [
4,
5].
This reconfiguration is reflected in the development of the policy framework at the global and regional levels, through initiatives such as the 2030 Agenda for Sustainable Development, the Paris Agreement, and the European Green Deal, which reinforce the role of technological progress and innovation in economic transformation processes [
1,
2,
4].
In this context, the interplay between infrastructure, digitalization, and innovation becomes crucial for sustainable industrial performance and for economies’ ability to simultaneously meet economic demands and environmental goals [
6]. These dimensions are integrated into Sustainable Development Goal 9 (Industry, Innovation, and Infrastructure), which aims to develop resilient infrastructure, promote inclusive industrialization, and foster innovation. From this perspective, SDG 9 provides a relevant analytical framework for examining how infrastructure investments, digital progress, and research and development activities correlate with sustainability-oriented industrial transformation [
6,
7,
8].
However, despite strategic guidelines and the growing relevance of SDG 9, economic and industrial performance remains uneven, influenced by persistent constraints regarding emissions intensity, infrastructure efficiency, and the ability of industrial systems to integrate innovation into production processes [
3,
5]. This variability suggests that sustainable industrial transformation is characterized by heterogeneous structural configurations and reflects distinct combinations of structural factors.
At the European Union level, these differences are particularly pronounced. Although common policies support infrastructure modernization, the strengthening of innovation capacity, and the integration of digital technologies, their effects vary significantly among member states, depending on economic structure, level of development, and institutional capacity [
9,
10,
11].
Within this framework, European Union strategies—including the European Green Deal, the Industrial Strategy for Europe, and the Digital Agenda—aim to transform economic systems by modernizing infrastructure, strengthening innovation capacity, and integrating digital technologies into industrial processes. However, the implementation of these objectives remains dependent on differing structural conditions across Member States, which limits the relevance of aggregated interpretations of European progress [
9,
10,
11]. Therefore, the comparative assessment of sustainable industrial development requires an analytical framework capable of capturing these structural differences and interdependencies.
Against this backdrop, recent literature on the relationship between digitalization, infrastructure, and sustainable industrialization has expanded considerably; however, existing approaches remain predominantly descriptive or based on aggregate analyses, failing to systematically capture the structural patterns of relevant indicators at a comparative level. Particularly in the case of emerging economies within the European Union, the analysis of relative positioning with respect to these dimensions is underdeveloped, which limits our understanding of the mechanisms through which different combinations of factors produce distinct multidimensional structural profiles.
The conceptual framework distinguishes between the dimensions directly observed in the empirical analysis and the broader process of industrial upgrading. Four empirical domains are examined: digital infrastructure availability, innovation capacity and technological output, sustainable transport infrastructure, and industrial environmental pressure. Digital infrastructure is operationalized through high-speed internet coverage. Innovation capacity and technological output are captured through R&D expenditure, R&D personnel, and patent applications. Sustainable transport infrastructure is represented by the modal shares of buses and trains in passenger transport and rail and inland waterways in freight transport. Industrial environmental pressure is approximated through industrial PM10 emission intensity.
Industrial upgrading is not operationalized through a separate indicator in the present analysis. Conceptually, it refers to structural improvements in production capabilities, productivity, technological sophistication, value-added generation, and resource efficiency. The selected indicators capture conditions that may support or constrain such upgrading, particularly research capacity, technological output, digital access, sustainable transport infrastructure, and particulate-emission intensity. However, they do not directly measure manufacturing productivity, manufacturing value added, the share of medium- and high-technology production, industrial employment structure, or the technological composition of exports.
The conceptual relationship is therefore interpreted as follows: digital infrastructure provides an enabling condition; the innovation system influences the capacity to use this infrastructure productively; sustainable transport and environmental conditions characterize the broader SDG 9-related structural profile; and industrial upgrading represents a potential process associated with these conditions rather than an observed cluster variable. The cluster analysis consequently identifies configurations that may be more or less supportive of sustainable industrial upgrading, but it does not directly measure or causally explain industrial upgrading itself.
In this context, a national-level analysis is essential for understanding these structural differences. Romania is a relevant case for examining the structural heterogeneity in SDG 9-related alignment, as progress in digital connectivity and economic integration coexists with persistent limitations in transportation infrastructure, industrial performance, and innovation capacity.
Building on these limitations, the main objective of the research is to assess Romania’s alignment with the structural dimensions associated with SDG 9 through a cluster-based analysis applied to Eurostat indicators for European Union member states. The approach aims to identify structural patterns and determine Romania’s relative positioning within them, focusing on how these dimensions manifest at a comparative level.
The study examines two separate cross-sectional snapshots, one for 2015 and one for 2023. Hierarchical cluster analysis is conducted independently for each reference year, and the resulting classifications are subsequently compared. This design permits the identification of differences in indicator values, country profiles, cluster composition, and cluster assignment between the two benchmark years. It does not reveal the intervening annual path and therefore cannot establish trajectories, continuous evolution, the timing or speed of change, temporary reversals, or convergence among EU Member States.
Accordingly, the identification of five clusters for 2015 and three clusters for 2023 is interpreted only as a difference between the two cross-sectional classification structures. The smaller number of clusters in 2023 does not demonstrate that cross-country differences narrowed continuously between 2015 and 2023. Similarly, the assignment of a country to different clusters in the two reference years is described as a difference in classification rather than as evidence of movement, transition, or repositioning over time.
The analytical framework is grounded in sustainable development theory and in a systemic view of industrial transformation. Sustainable development theory emphasizes the need to reconcile economic performance, social progress, and environmental limits, which is reflected in SDG 9 through the combined focus on resilient infrastructure, inclusive industrialization, and innovation. At the same time, the study adopts a configurational perspective, according to which sustainable industrial growth depends not on isolated variables, but on the complementarity between innovation capacity, digital infrastructure, transport systems, and environmental performance. This theoretical perspective supports the use of cluster analysis, as countries may achieve different forms of SDG 9 alignment through different combinations of structural conditions.
Despite the growing body of research on digitalization, innovation, infrastructure, and sustainable industrial transformation, the existing literature remains fragmented. Many studies examine these dimensions separately, focusing either on digital infrastructure, innovation capacity, transport systems, or environmental performance, without sufficiently capturing how they combine within national development profiles. This fragmentation limits the understanding of whether progress toward SDG 9 reflects coherent structural alignment or isolated improvements in individual indicators. The present study addresses this gap by applying a configurational and comparative approach, using hierarchical cluster analysis to identify patterns among EU Member States and to evaluate Romania’s relative position within these patterns. In doing so, the research contributes to the literature by moving beyond single-indicator assessment and by examining how digitalization, innovation, sustainable infrastructure, and industrial environmental performance jointly shape alignment with SDG 9 targets.
The study makes three main contributions. First, it analytically integrates dimensions that are often treated separately—transport infrastructure, industrial environmental performance, innovation and digital infrastructure—highlighting the role of structural complementarities in sustainable industrial development. Second, it adopts a configurative perspective on development, moving beyond approaches based exclusively on isolated relationships or aggregate indicators. Third, it offers a comparative assessment of Romania’s position within the European context, based on structural patterns rather than statistical averages.
The analysis is structured around two complementary objectives. First, it identifies Romania’s relative position within the cross-sectional classification of EU Member States in each reference year. Second, it compares Romania’s indicator profile and cluster assignment in 2015 and 2023, without inferring the temporal process through which the observed differences emerged.
In line with these objectives, this paper is structured to integrate the theoretical framework underlying the relationships between infrastructure, digitalization, and sustainable industrial development; the presentation of the data and methodology used; the analysis and interpretation of the results; and the formulation of relevant implications for public policy and development strategies.
2. Literature Review
2.1. Industrial Transformation and Sustainable Development
The transformation of industrial systems is a central aspect of the transition to sustainable development, and is analyzed in the context of pressures arising from environmental degradation, rising resource consumption, and the cumulative impact of economic activities on ecosystems [
3,
12,
13]. These developments have highlighted the limitations of traditional industrialization models, prompting a reevaluation of the relationship between economic growth and sustainability.
In this context, industrial transformation goes beyond the logic of economic expansion and is reinterpreted as a process of structural reconfiguration, in which performance is conditioned by resource efficiency and compatibility with environmental limits. This shift involves the simultaneous redefinition of the criteria of efficiency, productivity, and competitiveness.
Sustainable industrial development reflects this reconfiguration, as it involves reorganizing production processes to simultaneously support economic growth and reduce environmental impact [
1,
2,
3]. However, the relationship between these dimensions remains characterized by structural tensions, as economic and environmental objectives are not automatically compatible, and outcomes depend on institutional configurations and coordination mechanisms [
1,
2].
In this context, sustainability-oriented industrial policies function as mechanisms for redirecting investments and productive capacities toward activities compatible with environmental objectives [
1,
2,
4]. Their effectiveness, however, depends on the economic and institutional context, which leads to significant variations across economies.
Digital transformation adds an additional dimension to these processes. Industry 4.0 technologies are associated with production optimization and increased resource efficiency [
4,
5,
14], but their impact depends on the degree of integration and complementarity with infrastructure, and technological capacity. Digitalization thus functions as an amplifying factor, not as an autonomous determinant of sustainability.
The relationship between industrial development and resource use remains characterized by non-linearity. Industrialization and infrastructure development are associated with increased energy consumption and environmental pressures [
3,
12,
13], while resource efficiency and infrastructure modernization can reduce environmental impact [
3,
4,
5].
Infrastructure modernization is closely linked to environmental policies and the promotion of innovation. Environmental regulations and research support instruments can accelerate the development of green technologies and increase productivity [
1,
2,
5], but the effects remain dependent on implementation capacity and institutional coherence.
Expanding infrastructure and intensifying industrial production can amplify pressures on the environment in the absence of internalizing negative externalities. Under these conditions, intensive resource use can lead to ecosystem degradation and increased social costs of economic development. The green economy provides an analytical framework for assessing these relationships [
3,
12,
13], without eliminating the structural tensions between economic and environmental objectives.
These dynamics are reflected in global sustainability frameworks, in which industrial development, innovation, and infrastructure are integrated into a coherent model of sustainable economic growth, as summarized in SDG 9. However, translating these goals into concrete results is influenced by diverse structural factors and the interdependencies among these dimensions.
At the European Union level, these interdependencies translate into persistent differences among member states. The capacity to integrate innovation, infrastructure, and sustainability varies depending on economic structure and institutional capacity [
9,
10,
11], with emerging economies exhibiting asymmetric configurations of these dimensions.
In this context, existing approaches treat these components predominantly in isolation or through partial relationships. This fragmentation limits our understanding of how they structurally combine at the level of economies and generates the observed differences between countries [
3,
4,
5].
Consequently, there is a need for a configurative approach capable of integrating these interdependencies and capturing the structural configurations of sustainable industrial development.
2.2. Sustainable Transport Infrastructure
Sustainable transport infrastructure is a structural component of industrial transformation, influencing resource efficiency, the organization of economic flows, and environmental impact. The reconfiguration of transport systems involves moving beyond road-centric models and shifting toward collective modes and low-emission solutions, reflecting a structural transformation of mobility and logistics chains [
15,
16].
This transition is not exclusively technological but involves reorganizing the relationships between infrastructure, economic activity, and resource use. Investments in sustainable infrastructure are associated with economic and social benefits, including reduced external costs and improved public health, but the magnitude of these effects depends on their integration into specific economic and territorial structures, yielding varied outcomes across economies.
The assessment of transport infrastructure sustainability is influenced by the methodological framework used. Existing approaches reveal significant variations and limited integration of long-term benefits, indicating the need for more comprehensive analytical frameworks [
15,
16]. In this context, transport infrastructure must be analyzed as an element integrated into a system of economic and technological interdependencies, not as an isolated determinant of sustainable performance.
The empirical operationalization of this dimension is achieved through indicators that reflect the modal structure of transport. The indicator “Share of buses and trains in inland passenger transport” (sdg_09_50) captures the shift in mobility toward collective and energy-efficient modes, while “Share of rail and inland waterways in inland freight transport” (sdg_09_60) reflects the distribution of freight transport toward alternatives characterized by low emissions and superior energy efficiency.
However, interpreting these indicators requires contextualization. Their significance depends on the economic structure, infrastructure density, and level of development of transportation networks, which limits the validity of direct comparisons and necessitates an analytical approach that avoids oversimplified generalizations.
In the case of passenger transport, a focus on public transit is a key determinant of the sustainability of urban and regional mobility. The performance of this sector is influenced by accessibility, service quality, and the ability to adapt to user needs, requiring integrated approaches that combine quantitative and qualitative methods [
17]. At the same time, the development of transport infrastructure is linked to economic dynamics and the performance of productive sectors, including SMEs [
18].
In the case of freight transport, a shift toward energy-efficient modes, such as rail and inland waterway transport, is essential for reducing environmental impact. Recent developments, including intermodal transport and integrated logistics solutions, contribute to optimizing flows and reducing emissions [
19,
20]. Solutions such as containerized barge transport (COB) highlight the potential of intermodal integration to reduce costs and congestion [
21].
However, the expansion of these solutions is constrained by structural factors, such as existing infrastructure, the regulatory framework, and the level of logistical integration, which result in significant differences between economies and limit the uniform applicability of these models.
At the European Union level, the persistent reliance on road freight transport, particularly in the heavy-duty transport segment, poses a major challenge for decarbonization. Transitional solutions, such as liquid biofuels (FAME, HVO), contribute to a partial reduction in emissions but do not alter the fundamental structure of transport systems, maintaining dependence on road infrastructure.
At the same time, the emphasis on infrastructure resilience, in the context of climate and geopolitical risks, has led to the development of adaptive solutions, such as temporary infrastructure and portable matting systems (PMS). These contribute to the continuity of mobility in crisis situations, but play a complementary role and do not influence the structural configurations of transport systems.
Overall, the transformation of transport infrastructure in the European Union involves not only reducing emissions but also the structural reorganization of mobility and logistics systems, as well as strengthening their resilience [
22,
23].
However, existing approaches often address these dimensions in a fragmented manner, either through sectoral analyses or individual indicators. This perspective limits the understanding of the interdependencies between the modal structure of transport, economic performance, and integration into broader industrial systems.
In this context, analyzing transport infrastructure through the lens of modal structure allows for the assessment of mobility systems’ orientation toward sustainable alternatives, using indicators that are comparable at the European level.
2.3. Environmental Sustainability of Industrial Systems
The environmental sustainability of industrial systems has become a central aspect of economic transformation, against a backdrop of increasing pressure on natural resources and the environmental impact of industrial activities. This shift reflects the replacement of traditional production models by more integrated approaches that include sustainable product design, process optimization, and the reorganization of production systems [
24].
In this context, material selection, reduced energy consumption, and the integration of circular economy principles—including recycling and remanufacturing—contribute to mitigating environmental impacts and supporting sustainable industrial development. However, the implementation of these practices remains uneven across economies and sectors, being conditioned by technological capacity, the institutional framework, and economic incentives, which leads to heterogeneous results in environmental performance.
Digitalization introduces an additional dimension to these processes, simultaneously generating both environmental benefits and costs. The application of digital technologies contributes to increased resource efficiency and the optimization of information flows, but it also entails significant energy consumption and resource use associated with technological infrastructure [
25,
26].
Consequently, the impact of digitalization on sustainability must be assessed in an integrated manner, taking into account the life cycle of the products and technologies used. This perspective highlights the ambivalent nature of digitalization, whose effects depend on how it is integrated into industrial and institutional structures.
Digital transformation extends these mechanisms by integrating advanced technologies into industrial and urban processes. The use of artificial intelligence, data analysis, and digital infrastructure contributes to pollution control, the optimization of waste management, and the improvement of production process efficiency [
27].
However, the effects of these technologies are not uniform. They depend on the level of digital maturity and institutional capacity, which leads to significant differences among economies in terms of environmental performance.
The expanding use of digital technologies in logistics and supply chains amplifies these interdependencies. Methods based on data science and big data analytics contribute to optimizing resource use and improving decision-making processes, supporting the development of more efficient industrial systems [
28,
29,
30].
The integration of artificial intelligence and automation into logistics operations can generate environmental benefits by optimizing flows and reducing resource consumption. However, these effects remain dependent on the implementation method and the characteristics of the existing infrastructure, which limits the generalizability of the results.
Overall, the relationship between digitalization and the sustainability of industrial systems is twofold. Technological progress simultaneously contributes to reducing environmental impact and generating new pressures on resources, which highlights the decisive role of the institutional context and the manner of integration.
The empirical assessment of environmental sustainability is carried out using specific indicators, particularly industrial emission intensity. The indicator “Air emission intensity from industry—PM10” (sdg_09_70) allows for the assessment of environmental pressure and provides an approximation of the technological efficiency of industrial systems.
The indicator Air emission intensity from industry–PM10 (sdg_09_70) captures a specific form of industrial environmental pressure: the intensity of particulate emissions relative to economic output. It should therefore not be interpreted as a comprehensive measure of industrial environmental sustainability. In particular, it does not capture greenhouse-gas and CO2 intensity, emissions of other pollutants such as NOx and SOx, industrial energy efficiency, the share of renewable energy in industrial consumption, material productivity, waste intensity, or circular material use.
The environmental dimension of the present analysis should consequently be interpreted as PM10-related industrial environmental performance rather than as an exhaustive assessment of the environmental footprint of industrial systems. PM10 remains relevant because it provides a harmonized and comparable Eurostat measure for the countries and reference years included in the study, but it represents only one component of a broader environmental profile.
From an operational perspective, emission levels are determined by complex atmospheric dispersion processes, influenced by the dynamics of turbulent flows and the characteristics of emission sources [
31]. This highlights the role of exogenous factors, such as weather conditions and urban structure, in determining emission levels.
This complexity introduces limitations in comparative analyses, as observed variations may reflect both real structural differences and contextual influences that are difficult to control.
At the micro-industrial level, emissions control depends on the performance of capture and ventilation systems. Parameters such as capture rate and structural configuration influence pollutant concentrations and the energy efficiency of industrial processes [
32].
However, these mechanisms have limited relevance for explaining structural differences between economies at the aggregate level, as they are specific to technological and sectoral contexts.
Sustainability assessment therefore requires the integration of life-cycle perspectives. Environmental impact is determined by the interaction between production processes, supply chains, and product use [
33].
At the same time, emission reductions are influenced by public policy instruments. Regulatory mechanisms and market-based instruments help internalize environmental costs and stimulate the transition to cleaner technologies [
34,
35].
However, the effectiveness of these instruments remains dependent on the coherence of the institutional framework and implementation capacity, leading to significant variations across economies.
Overall, the intensity of PM10 emissions reflects not only the level of industrial pollution but also the efficiency of the technological, organizational, and institutional systems involved in production processes. Nevertheless, existing approaches frequently treat these dimensions in isolation, failing to capture how they structurally interact at the level of economies. This analytical fragmentation limits our understanding of differences between countries and the interdependencies among environmental performance, infrastructure, and digitalization, highlighting the need for approaches capable of integrating these dimensions into a coherent analytical framework.
2.4. Structural Drivers of Innovation and Digital Transformation
Digital transformation and the dynamics of innovation are driven by a set of structural factors that go beyond the technological dimension itself and reflect how economies organize and leverage knowledge resources. Digitalization cannot be reduced to the mere adoption of technologies but must be understood as a systemic process resulting from the interaction between economic, institutional, and organizational dimensions [
36,
37].
From this perspective, innovation is not treated as a directly observable outcome, but as a process emerging from these structural interdependencies. Its empirical assessment involves the use of indicators that capture the conditions that facilitate or limit the generation and diffusion of technological progress, without exhaustively reflecting innovative outcomes.
This approach highlights a key distinction between the direct measurement of innovation and the use of structural indicators of innovative capacity. Differences among economies are thus explained not only by traditional variables, but by complex configurations that include market functioning, resource allocation, and the role of public policies [
38,
39].
Digital transformation intensifies these constraints by shifting demand toward advanced skills, adaptability, and continuous learning. The integration of emerging technologies into education contributes to redefining learning outcomes and developing transferable skills [
40,
41,
42,
43].
Complementary to human capital, digital infrastructure is a necessary condition for realizing the economic effects of digitalization. Access to high-speed internet supports the integration of technologies and connection to global knowledge flows, and is associated with positive effects on productivity and economic growth [
44].
However, these effects are not linear. Existing analyses highlight diminishing returns and significant differences between user categories and regions, indicating that infrastructure does not automatically generate economic benefits.
The impact of broadband infrastructure depends on the gap between availability and actual usage. Economic benefits manifest primarily through the adoption and integration of technologies into economic activities, influenced by labor market characteristics and skill levels [
44,
45]. Recent research further indicates that the effects of digital infrastructure on sustainable economic performance are indirect and depend on complementary mechanisms such as technological adoption, green innovation, industrial reorganization, and more efficient resource allocation [
46]. This reinforces the distinction between infrastructure availability and productive digital transformation: connectivity creates potential, while innovation systems and institutional capacity determine whether that potential is converted into measurable economic and environmental outcomes.
This distinction highlights a significant limitation of infrastructure indicators, which capture technological availability but not the degree of usage or its economic impact. In this context, the High-speed internet coverage indicator (sdg_17_60) reflects the availability of digital infrastructure and serves as a proxy for digitization potential. The impact of emerging technologies on productivity is positive, but depends on the availability of the skills necessary for their integration [
47,
48].
The persistence of digital divides, particularly in rural areas, highlights limitations in access to infrastructure and the need for integrated interventions that combine infrastructure development with the strengthening of digital skills [
49,
50].
2.5. Research Gap and Analytical Framework
Existing studies generally examine digitalization, innovation capacity, sustainable transport, and industrial environmental performance separately or combine them through aggregate indicators. Consequently, less attention has been given to how these dimensions coexist within multidimensional national profiles. This gap is particularly relevant within the European Union, where common policy frameworks coexist with substantial structural heterogeneity. Romania provides a relevant case because comparatively strong digital connectivity is accompanied by persistent weaknesses in R&D capacity and technological output. The present study addresses this gap through a configurational comparison of EU Member States based on the selected SDG 9-related indicators.
The analytical framework of this study is grounded in sustainable development theory, innovation systems theory, and a configurational perspective on industrial transformation. Sustainable development theory provides the broad normative foundation, as it emphasizes the need to reconcile economic development, technological progress, infrastructure modernization and environmental limits. This logic is directly reflected in SDG 9, which integrates resilient infrastructure, inclusive and sustainable industrialization, and innovation within a common development objective. In this sense, sustainable industrial growth cannot be assessed only through production expansion, but must also account for research capacity, technological output, transport sustainability, digital infrastructure and environmental performance.
Innovation systems theory further supports the selection of R&D expenditure, R&D personnel and patent applications as core variables. These indicators capture different components of the innovation process: financial input, research capacity and technological output. Their inclusion is therefore not redundant, even if they may be statistically related, because each reflects a distinct stage in the transformation of knowledge resources into industrial competitiveness. At the same time, the configurational perspective assumes that sustainable industrial development results from the interaction between several structural conditions rather than from the isolated effect of a single variable. Countries may therefore reach different levels of SDG 9 alignment through different combinations of innovation capacity, transport infrastructure, digital readiness and industrial environmental performance. This theoretical logic justifies the use of hierarchical cluster analysis, since the objective is to identify structural profiles of countries and Romania’s position within them, rather than to estimate direct causal effects.
The relevant research gap is therefore not whether the selected countries followed convergent or divergent paths, which cannot be determined from two observations, but whether favourable performance in individual indicators is accompanied by a coherent structural configuration across innovation, digital infrastructure, sustainable transport, and industrial PM10 intensity. Romania is particularly relevant because strong digital connectivity coexists with comparatively weak R&D and technological-output indicators.
The analysis consequently compares Romania’s multidimensional profile and cluster assignment in 2015 and 2023. It examines whether the structural imbalance between digital and transport-related strengths and innovation-related weaknesses is visible in both cross-sectional classifications, without drawing conclusions about the intervening temporal process.
Existing research on sustainable industrial development increasingly relies on multidimensional assessment frameworks, as single indicators are insufficient to capture the interaction between innovation, infrastructure, digitalization, and environmental performance. Composite indicators, benchmarking methods, multi-criteria decision-making techniques, principal component analysis, and clustering approaches have all been used to compare national sustainability profiles. However, these approaches differ in purpose. Composite indices reduce multidimensional information to a single score, while cluster-based methods preserve structural diversity by grouping countries according to similarities across several dimensions. For this reason, hierarchical cluster analysis is appropriate for the present study, since the aim is not to construct a ranking index, but to identify structural configurations of SDG 9 alignment and to position Romania within them.
3. Materials and Methods
The study adopts an exploratory and comparative design to identify cross-sectional structural profiles of EU Member States in 2015 and 2023. It does not test causal relationships or temporal processes. The objective is not to test causal relationships or temporal processes, but to identify cross-sectional structural patterns and the relative positioning of EU Member States in each of the two reference years. Hierarchical cluster analysis is appropriate in this context [
51,
52] because the interaction among these dimensions is complex, and causal assumptions are not yet sufficiently established within an integrated SDG 9 analytical framework.
Several multivariate techniques could be used to analyse the selected indicators, but they address different research objectives. Principal component analysis and factor analysis are primarily dimensionality-reduction methods: they identify latent structures among correlated variables and can reduce the number of indicators, but they do not directly classify countries according to their complete multidimensional profiles. K-means is a partitioning technique that can group countries, but it requires the number of clusters to be specified in advance and its results may depend on the initial selection of cluster centroids. These characteristics make it less suitable as the primary exploratory method when the underlying number and nested structure of country groups are not known beforehand.
Hierarchical cluster analysis was preferred because the objective of this study is to identify interpretable country typologies rather than to construct latent factors or impose a predefined partition. This method is particularly appropriate for the relatively small sample of 25 EU Member States, as it provides a complete sequence of agglomerative solutions and allows the relationships between countries and clusters to be examined through dendrograms and agglomeration schedules. Ward’s method was selected because, at each agglomeration stage, it merges the two groups that produce the smallest increase in within-cluster variance. When applied to standardized quantitative indicators with squared Euclidean distance, this procedure tends to produce compact and internally homogeneous clusters, which is consistent with the purpose of identifying structurally similar SDG 9 country profiles.
Ward’s method with squared Euclidean distance was therefore applied to the z-standardized indicator matrix [
51,
52,
53]. The final cluster solutions were selected by jointly considering the dendrograms, the agglomeration schedules, significant changes in agglomeration distance, intra-cluster homogeneity, inter-cluster differentiation, and the substantive interpretability of the resulting country profiles. The silhouette coefficient and cophenetic correlation coefficient were subsequently used as complementary validation measures, while post-clustering ANOVA assessed whether the retained groups differed significantly across the selected indicators.
Sustainable industrial growth is a multidimensional construct that includes innovation capacity, research intensity, technological output, infrastructure quality, transport sustainability, environmental performance, and digital readiness. Since these dimensions cannot be captured by a single variable, this study uses a set of Eurostat proxy indicators aligned with SDG 9 and related enabling conditions [
54]. The analysis includes gross domestic expenditure on R&D (sdg_09_10), R&D personnel (sdg_09_30), patent applications to the European Patent Office (sdg_09_40), the share of buses and trains in inland passenger transport (sdg_09_50), the share of rail and inland waterways in inland freight transport (sdg_09_60), air emission intensity from industry—PM10 (sdg_09_70), and high-speed internet coverage (sdg_17_60). Therefore, the results should not be interpreted as an exhaustive measurement of sustainable industrial development, but as a comparative typology based on key observable and comparable dimensions. Within this indicator set, sdg_09_70 operationalizes only the PM10-related component of industrial environmental pressure. Accordingly, references to environmental performance in the empirical analysis concern relative differences in industrial PM10 emission intensity and should not be understood as a complete evaluation of industrial decarbonization, energy efficiency, resource efficiency, or circularity.
These indicators are particularly relevant to this research, because they capture the main structural conditions through which digital transformation can support SDG 9-oriented development. Published by Eurostat and used within the European monitoring framework, they measure EU Member States’ progress in strengthening resilient infrastructure, advancing inclusive and sustainable industrialization, and fostering innovation. In this study, they provide the empirical basis for assessing how Romania’s digital infrastructure, innovation capacity, transport systems, and industrial environmental performance contribute to its alignment with sustainable industrial growth.
Furthermore, the analysis is conducted at country level and therefore identifies macro-level structural profiles rather than sectoral patterns or firm-level behaviours. Accordingly, the clusters should be interpreted as national typologies based on comparable indicators of innovation, transport infrastructure, environmental performance, and digital infrastructure. They should not be read as direct evidence of individual firms’ innovation strategies, industrial practices, or infrastructure investment decisions.
The analysis covers innovation inputs and outputs, sustainable transport infrastructure, industrial environmental pressure, and digital infrastructure, using Eurostat data for EU Member States. Two separate reference years are examined: 2015, associated with the adoption of the 2030 Agenda, and 2023, the most recent year for which comparable data were available for the selected indicators. A separate cluster analysis is conducted for each year. Comparing the resulting solutions permits the identification of differences in country profiles and classifications, but it does not establish the annual path between the two observations.
Before clustering, all variables were standardized through z-score transformation in order to remove scale effects and ensure that each indicator contributed equally to the distance calculation. This step is essential in distance-based clustering because the indicators are measured in different units. Without standardization, variables with larger numerical ranges or higher variability could disproportionately influence the cluster formation.
The analysis was conducted for 25 EU Member States for which complete data were available for both reference years; Malta and Cyprus were excluded from the model due to missing data. The selected indicators, together with their definitions, units of measurement, data sources, and descriptive statistics, are reported in
Table 1 and
Table 2.
Table 1 establishes the correspondence between the conceptual and measurement frameworks. The selected indicators are directly represented in the standardized data matrix used for clustering. The industrial upgrading is included only as a broader theoretical process and is not represented by a separate variable. Accordingly, the empirical analysis evaluates whether countries possess combinations of innovation, digital, transport, and PM10-related conditions that may be more or less supportive of sustainable industrial upgrading. It does not determine whether industrial productivity, manufacturing value added, or technological specialization actually increased.
Cluster analysis is applied in this research to group EU Member States according to their similarities in relation to sustainable industrial growth. The objective is to ensure that countries within the same cluster share comparable structural profiles, while countries assigned to different clusters display meaningful differences in terms of innovation capacity, research intensity, technological output, sustainable transport infrastructure, industrial environmental performance, and digital infrastructure. This method is particularly useful for identifying hidden patterns in multidimensional datasets and for offering a comparative perspective on the relative positioning of EU Member States, without implying direct causal relationships among the selected indicators [
55].
To obtain a reliable and meaningful classification aligned with the objective of the study, squared Euclidean distance was used to calculate the proximity matrix [
52,
56]. This distance measure is appropriate for standardized quantitative indicators because it captures the degree of dissimilarity between countries across the selected variables and provides the basis for grouping them into internally homogeneous clusters (1):
where
W = total within-cluster variation
wij2 = the squared Euclidean distance
i = denotes each variable included in the analysis
n = total number of variables (n = 7)
zik, zij = standardized values of variable i for countries j and k
To determine the distance between the clusters formed during the agglomerative procedure, Ward’s method was applied [
51,
57]. This method is appropriate for the present SDG 9 analysis because it progressively combines countries in a way that minimizes the increase in the total within-cluster sum of squared errors. As a result, it supports the identification of compact and internally homogeneous groups of EU Member States with similar profiles in terms of innovation, infrastructure, digitalization, and industrial environmental performance. The increase in within-cluster variation generated by merging two clusters is calculated according to Equation (2):
where,
Δ(A,B) = the increase in within-cluster sum of squares by merging clusters A and B
xi = the vector of standardized values for country i
nA, nB = the numbers of observations in clusters A and B
mA, mB = the centroids of clusters A and B
As a preliminary step for the subsequent statistical comparisons, the available data were tested for normality. The normality tests were used to assess whether the selected indicators showed statistically significant deviations from a normal distribution, which is relevant for the later application of parametric post-clustering comparisons, particularly ANOVA. In these tests, the test statistic indicates the degree of departure from normality, “df” refers to the number of observations included in the test, and “Sig.” represents the
p-value. A
p-value higher than 0.05 indicates that the assumption of normality cannot be rejected. These tests are not a prerequisite for hierarchical cluster analysis itself; however, they provide methodological support for comparing cluster means after the classification procedure. The results are reported in
Table 3 for the Kolmogorov–Smirnov test and in
Table 4 for the Shapiro–Wilk test.
Consistent with the methodological literature on the interpretation of normality tests [
58,
59,
60], the Kolmogorov–Smirnov and Shapiro–Wilk results indicate no statistically significant departures from normality for the variables included in the analysis, since all
p-values are above the conventional 0.05 threshold. Therefore, the assumption of normality cannot be rejected on the basis of these tests, although minor distributional deviations cannot be fully ruled out given the limited sample size. In line with previous studies [
60,
61], these results support the use of the full dataset for hierarchical cluster analysis and provide an appropriate basis for subsequent post-clustering comparisons.
In operational terms, alignment is assessed separately for 2015 and 2023 through each country’s cluster membership and indicator profile. Convergence tendencies are assessed through changes in cluster composition and country repositioning between the two reference years. The reduction in the number of clusters is interpreted as structural consolidation and is considered consistent with partial convergence only when accompanied by greater similarity in country profiles or movement toward more advanced configurations.
4. Empirical Results
Although hierarchical cluster analysis does not require strict distributional assumptions, normality tests were conducted to assess the suitability of subsequent parametric procedures used for post-clustering comparisons. In this context, the Kolmogorov–Smirnov and Shapiro–Wilk tests were used only to inform the interpretation of mean comparisons, not to validate the clustering procedure itself. Since the results did not indicate statistically significant deviations from normality, and considering the documented robustness of analysis of variance (ANOVA) under moderate departures from normality, the data were considered adequate for the descriptive comparison of cluster means.
In the next stage, the agglomeration schedules and dendrograms generated for the two reference years, 2015 and 2023, were examined separately in order to determine the most appropriate number of clusters. This step was necessary because the research aims to identify how the structural positioning of EU Member States evolved over time in relation to sustainable industrial growth.
The dendrogram provides a visual representation of the hierarchical clustering process, showing how countries are progressively grouped according to their similarity across the selected indicators. The agglomeration schedule provides the same information numerically, indicating the distance at which clusters are merged at each stage. Large increases in agglomeration distance suggest that relatively dissimilar groups are being combined, which helps identify a suitable cluster solution. This process was guided by both the visual interpretation of the dendrograms and the methodological recommendations in the existing literature [
52,
62], ensuring a meaningful classification of EU Member States according to their profiles in innovation capacity, sustainable transport infrastructure, industrial environmental performance, and digital infrastructure.
The determination of the optimal number of clusters was therefore based on a combined methodological and substantive assessment. The decision considered the visual structure of the dendrograms, significant jumps in agglomeration distance, the principle of minimizing intra-cluster variance while maximizing inter-cluster differentiation, and the interpretative coherence of the resulting groups from an economic and institutional perspective [
62,
63].
Based on these criteria, a five-cluster solution was considered the most appropriate for 2015, while a three-cluster solution was retained for 2023. The transition from a more fragmented clustering pattern in 2015 to a more consolidated structure in 2023 indicates that EU Member States have tended to regroup around broader development profiles in terms of digital infrastructure, innovation capacity, sustainable transport, and industrial environmental performance. Within this framework, Romania’s cluster membership provides the empirical basis for evaluating whether its trajectory reflects stronger alignment with SDG 9 targets or the persistence of structural gaps in the shift from digitalization toward sustainable industrial growth.
To strengthen the robustness of the retained cluster solutions, two complementary validation procedures were applied: the average silhouette coefficient and the cophenetic correlation coefficient. The silhouette coefficient assesses the degree of cohesion and separation of the clusters, while the cophenetic correlation evaluates how well the hierarchical dendrogram preserves the original pairwise distance structure. Both validation measures were computed using the same standardized indicator matrix and distance specification as the hierarchical clustering procedure. For the five-cluster solution retained for 2015, the average silhouette coefficient was 0.489 and the cophenetic correlation was 0.617. For the three-cluster solution retained for 2023, the average silhouette coefficient was 0.528 and the cophenetic correlation was 0.653. These values indicate acceptable cluster separation and a moderate correspondence between the original distance matrix and the dendrogram structure. The slightly stronger validation results for 2023 support the interpretation of a more consolidated cluster configuration compared with 2015.
As a sensitivity analysis, k-means clustering was applied to the same z-standardized indicator matrix, using five clusters for 2015 and three clusters for 2023. The algorithm was estimated with 100 random initializations, and the solution with the lowest within-cluster sum of squares was retained. Agreement with the Ward classification was assessed using the adjusted Rand index. For 2023, k-means reproduced the Ward classification exactly, yielding an adjusted Rand index of 1.000. All 25 countries retained the same broad cluster membership, including Romania in the structurally constrained group. For 2015, the adjusted Rand index was 0.689, indicating moderate to strong agreement. The k-means solution reproduced the clusters containing Romania, Bulgaria, Estonia, Latvia, and Lithuania and the group comprising Czechia, Hungary, and Slovakia, but merged the two advanced Ward clusters, assigned Slovenia to this broader advanced group, and identified Portugal as a separate profile.
Prior to comparing mean values across the clusters identified through hierarchical analysis, the assumption of homogeneity of variances was formally assessed using Levene’s test. Once the clusters had been generated, additional statistical tests were applied to examine whether the country groups differed significantly across the selected indicators. These tests were not used to determine the cluster structure, but to strengthen the interpretation of the resulting SDG 9 profiles.
This step is important for validating the subsequent use of parametric mean-comparison procedures, particularly ANOVA, since substantial violations of variance homogeneity may affect the reliability of F-statistics. Levene’s test was selected because it is widely used to assess equality of variances and is relatively robust in the presence of moderate departures from normality, which is relevant for cross-country datasets marked by structural heterogeneity. The test was applied using a significance threshold of α = 0.05, and the results are reported in
Table 5 and
Table 6.
The Levene test results indicate that the assumption of homogeneity of variances is not rejected for the clusters identified in either reference year. For 2015, the reported Levene statistics, including the mean-based, median-based, adjusted median-based, and trimmed-mean variants, produced p-values above the conventional significance threshold of α = 0.05 for all seven indicators retained in the final model. This suggests that variance differences between the five clusters are not statistically significant. A similar result is observed for 2023, where the three-cluster solution also shows p-values above the 0.05 threshold for all indicators. Although some values are close to the significance threshold, particularly for gross domestic expenditure on R&D, patent applications to the European Patent Office, and air emission intensity from industry—PM10, the homogeneity assumption remains statistically acceptable.
From a methodological perspective, these results support the use of classical one-way ANOVA for the comparison of cluster means. The absence of statistically significant variance heterogeneity indicates that the variability within clusters is sufficiently comparable across the selected indicators. Although several Levene test values are marginal, they do not provide an empirical basis for rejecting the homogeneity assumption, especially since the median-based and trimmed-mean variants also remain non-significant. Therefore, variance-adjusted procedures are not required as the primary analytical approach, although cautious interpretation remains appropriate for indicators with borderline values.
Subsequently, one-way ANOVA was applied as a post-clustering comparison tool to examine whether the mean values of the selected indicators differed significantly across the identified clusters. For 2015, the comparison was conducted across the five-cluster solution, while for 2023 it was applied to the three-cluster solution. ANOVA was not used to create the clusters and does not imply causal relationships among the variables. Its role is to support the descriptive validation and interpretation of the cluster structure by testing whether the groups identified through hierarchical clustering are statistically distinguishable in terms of innovation inputs, technological output, sustainable transport infrastructure, industrial environmental performance, and digital infrastructure. The outcomes of this analysis are summarized in
Table 7 and
Table 8.
The ANOVA results for 2015 reveal statistically significant differences between the five clusters for all seven indicators included in the analysis. The strongest differentiation is observed for patent applications to the European Patent Office, R&D personnel, and gross domestic expenditure on R&D, as indicated by the highest F-values and p-values below the 0.001 threshold. The largest F-statistics were recorded for patent applications, R&D personnel, and R&D expenditure, indicating that these innovation-related indicators produced the strongest overall differentiation among the five clusters in 2015. At the same time, the differences are also statistically significant for sustainable passenger transport, sustainable freight transport, industrial PM10 emission intensity, and high-speed internet coverage, confirming that the clusters reflect broader structural disparities related to SDG 9-oriented sustainable industrial growth.
For 2023, the ANOVA results confirm that statistically significant differences persist between the three clusters for all seven indicators. As in 2015, patent applications, R&D personnel, and R&D expenditure recorded the largest F-statistics, indicating that innovation-related indicators produced the strongest overall differentiation among the three clusters in 2023. However, the transport, environmental, and digital infrastructure indicators also show statistically significant differences, demonstrating that the 2023 clustering structure captures not only innovation-related disparities but also broader differences in sustainable infrastructure, industrial environmental performance, and digital readiness.
Overall, the ANOVA results support the analytical relevance of the retained cluster classifications. For each of the seven indicators, the omnibus test was statistically significant in both reference years, confirming overall differentiation among the identified country profiles. The highest F-statistic values were observed for patent applications, R&D personnel, and R&D expenditure, indicating that innovation-related indicators contributed most strongly to the differentiation among clusters. These dimensions are particularly relevant to Romania’s relative position in relation to the selected SDG 9 indicators. Given the exploratory and typological character of the study, ANOVA is used to support the interpretation of the overall cluster structure and not to establish causal relationships.
5. Discussions
In 2015, the five clusters identified among EU Member States reveal substantial heterogeneity in relation to sustainable industrial growth (
Table 9). The cluster configuration reflects structural differences in innovation capacity, research intensity, technological output, sustainable transport infrastructure, industrial environmental performance, and digital infrastructure. These differences indicate that EU Member States followed distinct development profiles, ranging from advanced innovation- and infrastructure-driven economies to countries still affected by structural constraints in research performance, sustainable mobility, industrial emissions, and digital readiness.
Cluster C1_2015 includes Austria, Belgium, Germany, and France. This cluster represents a strong continental industrial and research core. It records high values for gross domestic expenditure on R&D, R&D personnel, and patent applications, indicating well-developed innovation capacity. Industrial PM10 emission intensity is low, suggesting comparatively good industrial environmental performance. However, high-speed internet coverage is weaker than in several other clusters, which shows that this group’s strength in 2015 was more closely linked to traditional research and industrial innovation than to digital infrastructure.
Cluster C2_2015 includes Denmark, Finland, Sweden, Luxembourg, and the Netherlands. This is the most advanced and balanced cluster in 2015. It combines strong R&D performance, very high patenting activity, low industrial PM10 intensity, and the highest average level of high-speed internet coverage. The cluster reflects a highly developed innovation and digital infrastructure profile, with strong alignment between research capacity, technological output, and digital readiness.
Cluster C3_2015 includes Estonia, Bulgaria, Latvia, Lithuania, and Romania. This cluster presents an uneven development profile. It performs well in high-speed internet coverage and has a high share of rail and inland waterways in freight transport, but it records the weakest results in R&D expenditure, R&D personnel, and patent applications. It also has the highest average industrial PM10 emission intensity among the clusters. Romania’s presence in this group indicates that, in 2015, its digital and freight-infrastructure advantages were not matched by comparable innovation capacity or industrial environmental performance.
Cluster C4_2015 includes Croatia, Greece, Italy, Poland, Slovenia, Ireland, Spain, and Portugal. This is a broad and internally diverse cluster with mixed performance. It has moderate levels of R&D expenditure and R&D personnel, but relatively weak sustainable freight transport performance and uneven digital infrastructure. Some countries in the group show specific strengths, such as Ireland in patenting or Spain and Portugal in digital coverage, but the cluster as a whole does not display a coherent high-performing profile across the SDG 9-related indicators.
Cluster C5_2015 includes Czechia, Hungary, and Slovakia. This cluster has a specific Central European profile, characterized by strong passenger transport performance and relatively good freight transport structure. Industrial PM10 intensity is also comparatively low. However, innovation indicators remain moderate, especially patent applications and R&D personnel. The cluster therefore reflects stronger transport-related infrastructure performance than innovation-driven industrial development.
The 2015 cluster structure reveals substantial heterogeneity among EU Member States in relation to SDG 9-oriented sustainable industrial growth. The highest-ranked cluster is C2_2015, composed of Denmark, Finland, Sweden, Luxembourg, and the Netherlands, which combines strong innovation capacity, advanced digital infrastructure, and low industrial emission intensity. C1_2015, including Austria, Belgium, Germany, and France, represents a strong industrial and research core, but its digital infrastructure performance is weaker than that of C2_2015. C5_2015, formed by Czechia, Hungary, and Slovakia, occupies an intermediate position, with relatively strong sustainable transport indicators but more limited innovation capacity. Romania belongs to C3_2015, together with Estonia, Bulgaria, Latvia, and Lithuania. This cluster shows favourable performance in high-speed internet coverage and freight transport structure, but weak R&D intensity, low patenting capacity, and comparatively high industrial PM10 intensity. Therefore, Romania’s 2015 position indicates only partial alignment with SDG 9 targets: digital and infrastructure-related progress existed, but it had not yet translated into stronger innovation capacity or sustainable industrial performance (
Table 10).
The 2023 three-cluster solution shows a more consolidated structure than in 2015, but it still reveals clear differences among EU Member States in relation to the objective of the research.
Cluster C1_2023 includes Austria, Belgium, Germany, Denmark, Finland, Sweden, Luxembourg, and the Netherlands. This is the most advanced cluster in 2023. It records the strongest overall profile in terms of R&D expenditure, R&D personnel, patent applications, digital infrastructure, and industrial environmental performance. The cluster average for patent applications is particularly high, showing a clear technological and innovation advantage over the other groups. Industrial PM10 emission intensity is also very low, indicating stronger environmental performance of industrial systems. Although performance in sustainable transport indicators is not uniformly superior, this cluster is clearly the most aligned with SDG 9 targets because it combines innovation capacity, digital readiness, and relatively clean industrial performance.
Cluster C2_2023 includes France, Estonia, Croatia, Greece, Italy, Poland, Slovenia, Ireland, Spain, Czechia, Hungary, and Slovakia. At the aggregate level, this cluster represents an intermediate SDG 9 profile, with lower innovation capacity than C1_2023 but stronger overall performance than the structurally constrained C3_2023. However, the cluster mean masks substantial internal heterogeneity. Within C2_2023, R&D expenditure ranges from 1.04% to 2.19% of GDP, patent applications range from 10.32 to 200.52 per million inhabitants, the sustainable freight-transport indicator ranges from 0.7% to 33.0%, high-speed internet coverage ranges from 38.4% to 96.3%, and industrial PM10 intensity ranges from 0.01 to 0.27 g per euro. Cluster membership should therefore not be interpreted as indicating that these countries have identical structural profiles.
Several descriptive sub-patterns can be identified within the cluster, although they do not constitute additional statistically estimated subclusters. France, Ireland, Italy, and Slovenia display comparatively stronger innovation-related profiles, particularly in patenting, R&D expenditure, or research personnel. Ireland records the highest patenting value in C2_2023 and the lowest PM10 intensity, but has an extremely weak sustainable freight-transport share. France combines the highest R&D expenditure among the C2 countries with comparatively strong patenting and digital infrastructure, but remains below the leading cluster in innovation intensity and freight-transport performance. Slovenia also records relatively strong R&D expenditure, research personnel, patenting, and freight transport, but does not reach the technological-output levels of C1_2023.
A second pattern is represented by Croatia, Poland, Czechia, Hungary, and Slovakia, whose profiles are more strongly supported by passenger or freight transport than by technological output. Hungary and Slovakia record some of the strongest passenger- and freight-transport values in the cluster, but their patenting performance remains low. Poland and Croatia also display comparatively favourable freight-transport structures, while their innovation indicators remain below the cluster’s stronger performers. Spain and Estonia illustrate a third, digitally connected but structurally uneven pattern. Spain combines the highest high-speed internet coverage in C2_2023 with weak freight transport and moderate innovation performance, whereas Estonia combines relatively strong R&D expenditure and freight transport with lower patenting and the highest PM10 intensity in the cluster. Greece represents another asymmetric case, with relatively strong R&D personnel but very weak digital infrastructure, freight transport, and patenting activity.
The comparison between France and Estonia illustrates why the intermediate cluster must be interpreted as a broad multivariate profile rather than a homogeneous group. France performs substantially better in R&D expenditure, R&D personnel, patent applications, high-speed internet coverage, and PM10 intensity, while Estonia records a stronger sustainable freight-transport share. France remains in C2_2023 because its overall profile is weaker than that of the innovation-intensive leading countries, especially in patenting and sustainable freight transport. Estonia reaches the same broad intermediate position through a different pathway, reflecting improvement relative to 2015 but continued weaknesses in technological output and industrial environmental performance. Their common membership therefore indicates a similar overall multivariate distance from the leading and constrained profiles, not similarity on every individual indicator.
Cluster C3_2023 includes Bulgaria, Latvia, Lithuania, Romania, and Portugal. This is the weakest cluster from the perspective of innovation-driven sustainable industrial growth, although it has some important infrastructure-related strengths. The cluster records the lowest average values for R&D expenditure, R&D personnel, and patent applications, indicating limited innovation capacity and weak technological output. At the same time, it has strong high-speed internet coverage and the highest average share of rail and inland waterways in freight transport. Romania fits this pattern clearly: it has very high high-speed internet coverage and a strong freight-transport indicator, but very low R&D expenditure, R&D personnel, and patenting performance. The main weakness of this cluster is that digital infrastructure has not yet translated into stronger innovation capacity or cleaner industrial performance, especially given the high average PM10 emission intensity. Therefore, Cluster C3 reflects weak overall alignment with the selected SDG 9 dimensions and limited repositioning toward the more advanced profiles.
In ranking terms, Cluster C1_2023 is the leading group, Cluster C2_2023 is the intermediate group, and Cluster C3_2023 is the lagging or structurally constrained group. Romania’s placement in Cluster C3_2023 shows that, in 2023, its alignment with SDG 9 targets remains incomplete: the country performs well in digital infrastructure and freight-transport structure, but continues to lag behind in R&D intensity, technological output, and industrial environmental performance.
5.1. Comparison of the 2015 and 2023 Cluster Classifications
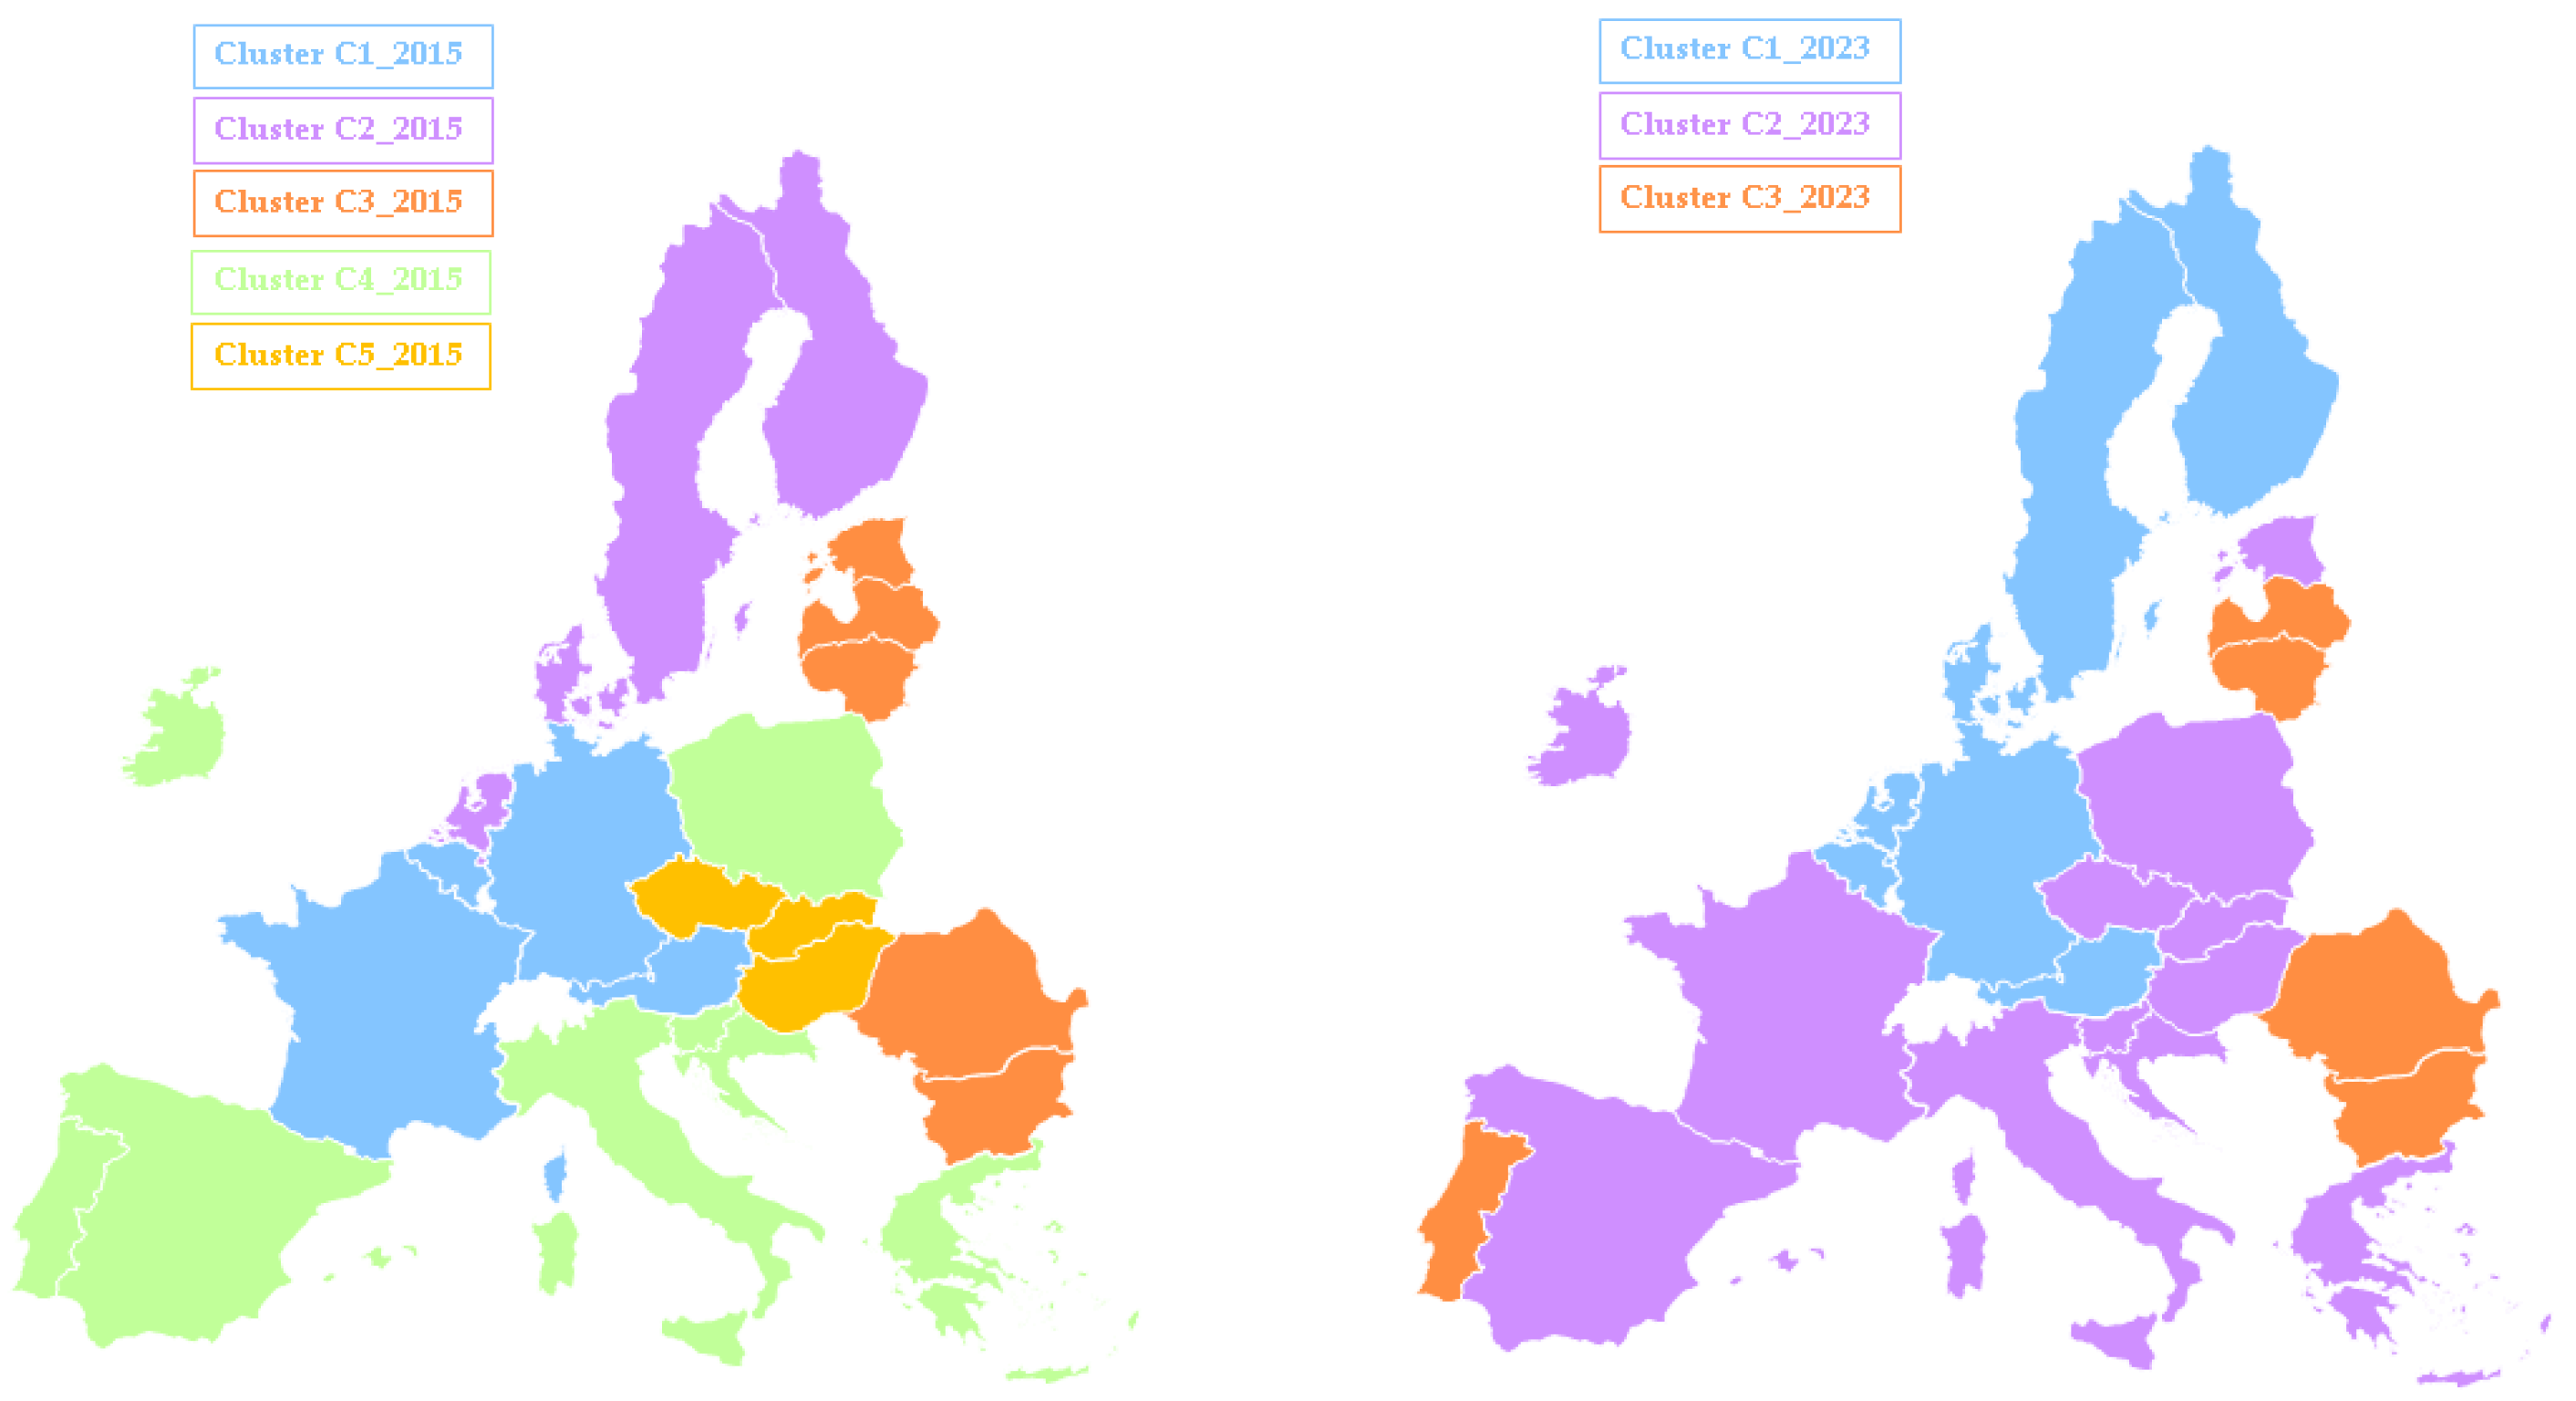
The hierarchical analyses generated different cross-sectional classifications for the two reference years: five clusters were retained for 2015 and three clusters for 2023. This difference indicates that, under the selected clustering procedure, the country profiles observed in 2023 were classified into fewer and broader groups than those observed in 2015. It does not demonstrate convergence, because the study does not observe the annual distributions or determine whether the distances between countries narrowed continuously during the intervening period (
Figure 1).
Based on a detailed analysis of the values of the variables under consideration, the leading countries were divided into two groups in 2015. C1-2015 included Austria, Belgium, Germany, and France, with strong R&D expenditure, R&D personnel, patenting activity, and low industrial PM10 intensity, but relatively weak high-speed internet coverage. C2-2015, including Denmark, Finland, Sweden, Luxembourg, and the Netherlands, had the strongest patenting performance and much better digital infrastructure. By 2023, these two advanced profiles largely merged into C1-2023, which includes Austria, Belgium, Germany, Denmark, Finland, Sweden, Luxembourg, and the Netherlands. This cluster records the strongest average profile: R&D expenditure 2.81, R&D personnel 2.14, patent applications 386.86, PM10 intensity 0.05, and high-speed internet coverage 86.84. This confirms that the leading group became more integrated around a combined innovation–digitalization–sustainable industry profile.
The intermediate profile changed substantially. In 2015, intermediate countries were divided mainly between C4-2015 and C5-2015. C4 had moderate R&D and patenting values but weak freight-transport sustainability and mixed digital infrastructure. C5, composed of Czechia, Hungary, and Slovakia, had stronger passenger transport and freight transport indicators, but weaker innovation capacity. By 2023, these countries were mostly absorbed into C2-2023, together with France and Estonia. This new intermediate cluster has average values of R&D expenditure 1.60, R&D personnel 1.35, patent applications 58.61, PM10 intensity 0.12, and high-speed internet coverage 72.56. Therefore, C2-2023 represents a broad transition group: better than the constrained cluster in innovation and environmental performance, but still far behind the leading group in R&D intensity and technological output.
The structurally constrained cluster is the most relevant for Romania. In 2015, Romania belonged to C3-2015, together with Estonia, Bulgaria, Latvia, and Lithuania. This cluster had weak innovation indicators, with R&D expenditure 0.91, R&D personnel 0.65, and patent applications 11.81, but relatively strong freight transport and digital infrastructure values. In 2023, Romania remains in C3-2023, now with Bulgaria, Latvia, Lithuania, and Portugal. The cluster improved in some areas, especially R&D personnel, which increased from 0.65 to 0.91, patent applications, which increased from 11.81 to 19.86, and high-speed internet coverage, which increased from 54.50 to 85.46. However, it still remains the weakest cluster in innovation terms, with the lowest R&D expenditure, R&D personnel, and patenting values among the 2023 clusters. It also has the highest industrial PM10 intensity, at 0.33, compared with 0.05 in C1-2023 and 0.12 in C2-2023.
As research results demonstrates, the first major change between 2015 and 2023 is the consolidation of the leading group. In 2015, advanced countries were divided between C1-2015 and C2-2015. By 2023, Austria, Belgium, Germany, Denmark, Finland, Sweden, Luxembourg, and the Netherlands formed a single leading cluster. This is consistent with their strong innovation and R&D profile. Eurostat confirms that SDG 9 monitoring focuses precisely on R&D intensity, R&D personnel, patent applications, air-emission intensity, and transport modes, which are the dimensions used in this research. Moreover, recent Eurostat-based evidence shows that Austria, Belgium, Denmark, Finland, Germany, and Sweden were the only EU Member States with R&D expenditure at or near 3% of GDP in 2023, which explains why they remain structurally close in the 2023 leading cluster.
The evolution of Austria, Belgium, and Germany from the 2015 continental industrial cluster into the 2023 leading cluster is mainly explained by the strengthening of their digital infrastructure while maintaining high R&D and patenting capacity. These countries already had strong R&D expenditure and patent applications in 2015, but their high-speed internet coverage was relatively weaker. By 2023, their digital infrastructure values increased substantially, bringing them closer to Denmark, Finland, Sweden, Luxembourg, and the Netherlands. This supports the explanation that the leading countries cluster increasingly combines digitalization with innovation-driven sustainable industrial growth.
France is the main exception within the former C1-2015 group. It shifted from the advanced 2015 cluster to the intermediate 2023 cluster. This does not mean that France became weak in absolute terms; rather, it lost relative proximity to the leading cluster. France’s R&D expenditure remained almost stable, patent applications slightly declined, and the freight-transport indicator weakened. At the same time, the leading group improved more strongly in digital infrastructure and maintained higher patenting intensity. Eurostat’s latest R&D data also show that France remains below the 3% R&D intensity group, unlike Austria, Belgium, Germany, Denmark, Finland, and Sweden. Therefore, France’s shift should be interpreted as a relative repositioning, not as a collapse in performance.
Estonia’s upward shift from Romania’s 2015 cluster to the intermediate 2023 cluster is one of the clearest structural improvements. Estonia improved in R&D expenditure, R&D personnel, patent applications, industrial PM10 intensity, and digital coverage. This moved it away from the low-innovation profile of C3-2015 and closer to the broader intermediate group. This interpretation is supported by the European Innovation Scoreboard country profile [
64], which notes sustained improvement in Estonia’s investment-related innovation indicators since 2017, even though some components remain below the EU average. Eurostat’s more recent R&D data also identify Estonia among the countries with one of the largest increases in R&D intensity between 2014 and 2024.
Portugal’s movement from C4-2015 to C3-2023 needs careful interpretation. It is not a simple deterioration across all variables. Portugal improved in R&D expenditure, R&D personnel, patent applications, and high-speed internet coverage. However, it remained structurally weak in sustainable passenger transport, freight transport, and especially industrial PM10 emission intensity, where it still records the highest value in the 2023 constrained cluster. The European Innovation Scoreboard [
64] also classifies Portugal as a Moderate Innovator but notes that business R&D, PCT patent applications, and environmental sustainability remain below the EU average, with particularly weak performance on air-emissions-related sustainability indicators. This explains why Portugal joins Romania’s cluster in 2023: its strong digital infrastructure is not matched by sufficiently strong industrial-environmental and technological-output performance.
Romania’s persistence in the constrained cluster is central to the research. Research results show that Romania improved high-speed internet coverage substantially and maintained a relatively strong freight-transport structure. Eurostat also notes that in 2023 Romania, Latvia, and the Netherlands were among the only Member States with rail and inland waterways shares above 40% in inland freight transport. However, Romania’s R&D expenditure, R&D personnel, and patent applications remained extremely low. This is consistent with the European Innovation Scoreboard [
64], which classifies Romania as an Emerging Innovator with performance at only 34% of the EU average in 2024, while also identifying broadband penetration as a relative strength. The Digital Decade country report [
65] similarly states that Romania remains one of the EU leaders in fixed connectivity, but that enterprise digitalisation still lags behind the EU average.
The continued presence of Bulgaria, Latvia, Lithuania, and Romania in the constrained cluster reflects a similar structural pattern: relatively good performance in selected infrastructure indicators, especially freight transport or digital coverage, but weak innovation and technological-output capacity. Latvia and Lithuania benefit from strong rail-freight structures, and Eurostat confirms that the Baltic countries report some of the highest rail shares in inland freight transport. However, these advantages are not sufficient to move the countries into the intermediate cluster because the innovation variables—R&D expenditure, R&D personnel, and patent applications—remain the decisive differentiators in both the 2015 and 2023 ANOVA results.
The broadening of C2_2023 reflects consolidation around an intermediate overall position, but not convergence toward a single homogeneous development model. The countries included in this cluster reached the intermediate profile through different combinations of innovation capacity, digital infrastructure, transport structure, and industrial environmental performance. Some countries, such as France and Ireland, are closer to the leading cluster in technological output but remain constrained by particular infrastructure dimensions. Others, including Hungary, Slovakia, Croatia, and Poland, display stronger transport-related profiles but weaker patenting and research capacity. Estonia represents an upward-repositioning trajectory, whereas France represents relative movement away from the leading profile. Consequently, C2_2023 should be interpreted as a heterogeneous transition cluster rather than as a uniform group of middle-performing countries.
Overall, the shifts show partial convergence but not full structural alignment. The EU moved from five clusters in 2015 to three broader groups in 2023, suggesting consolidation around leading, intermediate, and constrained sustainable industrial growth profiles. However, the strongest dividing line remains innovation capacity.
The results show that progress to sustainable industrial growth is uneven across the European Union. Digital infrastructure alone does not automatically translate into stronger innovation capacity or sustainable industrial performance. Romania’s continued placement in the structurally constrained cluster confirms this point: despite strong high-speed internet coverage and a relatively favourable freight-transport structure, the country remains limited by weak R&D intensity, low patenting performance, and persistent industrial sustainability gaps.
The reduction from five clusters in 2015 to three clusters in 2023 does not indicate a uniform convergence path across EU Member States. Instead, the country transitions reveal several distinct patterns. First, Austria, Belgium, and Germany maintained their advanced position while becoming structurally closer to the Nordic and Benelux countries, mainly because improvements in digital infrastructure complemented their already strong R&D and patenting profiles. Second, Estonia followed an upward repositioning path, moving from the structurally constrained cluster to the intermediate group following simultaneous improvements in research intensity, patenting, digital infrastructure, and industrial environmental performance. Third, most Southern and Central European countries converged toward a broad intermediate profile, although from different initial configurations. Fourth, France and Portugal experienced relative downward repositioning: this does not necessarily indicate absolute deterioration, but weaker progress compared with countries in the clusters they previously occupied. Finally, Bulgaria, Latvia, Lithuania, and Romania remained in the structurally constrained group because improvements in selected infrastructure dimensions were not accompanied by comparable progress in innovation capacity and technological output. Thus, the observed consolidation reflects heterogeneous country trajectories rather than a common or linear convergence process.
5.2. Romania’s Alignment with SDG 9 Targets
Romania’s classification in both reference years is consistent with the central argument of the study: digital connectivity alone does not define a favourable multidimensional SDG 9-related profile. In both reference years, Romania belongs to the structurally constrained group. Its profile is marked by relatively favourable high-speed internet coverage and a comparatively strong freight-transport structure, but also by persistently weak R&D expenditure, limited R&D personnel, very low patenting performance, and non-negligible industrial PM10 emission intensity. This combination indicates that Romania’s main constraint is not the absence of digital infrastructure, but the limited conversion of digital readiness into innovation capacity and technological output. The 2023 profiles of countries included in the intermediate cluster generally combine stronger R&D intensity, research personnel, and patenting activity than those observed for Romania.
Romania’s alignment with SDG 9 remains partial: it has infrastructure-related advantages, but these have not yet generated a coherent transition toward innovation-driven and environmentally sustainable industrial growth. Romania’s profile requires separate interpretation because it illustrates the coexistence of strong digital connectivity with weak measured innovation capacity. In both reference years, Romania remains positioned in the structurally constrained cluster. This does not mean that Romania lacks all SDG 9-related assets. On the contrary, the country shows a favourable profile in high-speed internet coverage and in the share of rail and inland waterways in inland freight transport. These strengths indicate that Romania has relevant infrastructure conditions that could support a more advanced sustainable industrial transition.
Romania’s position can be interpreted through a complementary-capabilities mechanism. High-speed connectivity provides access to digital platforms, data, cloud services, and advanced technologies, but it does not generate innovation output automatically. Its effects depend on whether firms possess the skills, financial resources, organizational capacity, research partnerships, and incentives required to integrate these technologies into production and innovation processes. The transmission from digital infrastructure to sustainable industrial growth can therefore be represented as a sequence: connectivity enables technology adoption; technology adoption requires digital skills and absorptive capacity; absorptive capacity supports business R&D and knowledge transfer; and these activities may generate patents, product and process innovation, industrial upgrading, and cleaner production.
In Romania, this transmission process is weakened at several intermediate stages. The European Innovation Scoreboard 2025 identifies high-speed internet access as a relative strength, but reports substantially weaker performance in digital skills, public- and business-sector R&D expenditure, information-technology investment, cloud computing, innovative SMEs, collaboration between innovative firms, and PCT patent applications. The 2025 Digital Decade Country Report reaches a similar conclusion: Romania remains one of the EU leaders in fixed connectivity, while enterprise digitalisation continues to lag behind the EU average, particularly among SMEs. It also highlights limited uptake of cloud and AI services, persistent deficits in basic digital skills, and difficulties in retaining ICT talent [
65]. These conditions restrict the absorptive capacity of firms and research institutions and help explain why widespread connectivity has not produced proportionate gains in technological output or innovation-driven industrial upgrading.
The disconnect is also reinforced by weaknesses in the national innovation system. Low business and public R&D expenditure limits the generation of applied knowledge, while weak cooperation between firms, universities, and research organizations constrains knowledge transfer and commercialization. Limited venture and innovation finance further reduces firms’ ability to transform digital opportunities into scalable products, patents, and cleaner industrial processes. Consequently, Romania’s main constraint is not digital access itself, but the limited institutional and economic capacity to convert that access into enterprise adoption, research activity, technological output, and sustainable industrial transformation.
The policy implications of the cluster analysis suggest that Romania and the other countries in the structurally constrained group require measures that go beyond conventional infrastructure investment. Their main weakness is not the complete absence of digital or transport infrastructure, but the limited capacity to convert these assets into innovation capacity, technological output, and more favourable PM10-related industrial performance. In Romania’s case, the results indicate a clear imbalance between strong high-speed internet coverage and weaker performance in R&D expenditure, R&D personnel, patenting activity, and SME innovation. From this perspective, policy efforts should focus on strengthening the productive and innovation-oriented use of digital infrastructure through targeted support for business R&D, university–industry cooperation, industrial PhD schemes, patenting support, innovation procurement, and SME adoption of AI, cloud services, and advanced digital tools.
A second priority concerns the closer integration of innovation policy with sustainable industrial and transport policy. Romania and several other lagging countries display selected infrastructure advantages, particularly in freight transport or digital connectivity, but these strengths have not been accompanied by repositioning toward the leading structural profile. Policy measures should therefore support green industrial corridors, intermodal freight systems, industrial pollution-abatement technologies, and circular production processes. Public funding could also be linked to measurable improvements in SDG 9-related dimensions, including R&D intensity, R&D personnel, patent applications, industrial PM10 intensity, modal shift in transport, and the effective digitalisation of enterprises. Such an approach would support Romania’s transition from digital readiness toward more innovation-driven and environmentally sustainable industrial growth, which represents the central analytical concern of this study.
At the same time, these policy implications must be interpreted in line with the exploratory and typological nature of the analysis. The cluster results identify the characteristics that distinguish higher-performing country profiles, but they do not demonstrate that changing a single indicator would automatically move a country into another cluster. Therefore, the recommendations concerning R&D investment, university–industry cooperation, patenting support, SME digitalisation, and cleaner industrial technologies should be understood as evidence-informed implications derived from observed structural differences between clusters and from the broader literature, rather than as causal effects estimated by the clustering method.
6. Conclusions
This study examined the relative positioning of EU Member States in relation to SDG 9-oriented sustainable industrial growth, with a specific focus on Romania’s alignment with the structural dimensions of innovation, digitalization, sustainable infrastructure, and industrial environmental performance. Using hierarchical cluster analysis, five country groups were identified for 2015 and three groups for 2023, revealing both a partial consolidation of development profiles and the persistence of substantial heterogeneity across the European Union. The results show that progress from digitalization toward sustainable industrial growth remains uneven, reflecting differences in R&D intensity, technological output, digital infrastructure, transport structure, industrial emission intensity, and national capacity to transform structural assets into innovation-driven development.
The findings highlight a clear distinction between leading, intermediate, and structurally constrained groups. In 2023, the leading cluster includes Austria, Belgium, Germany, Denmark, Finland, Sweden, Luxembourg, and the Netherlands, countries characterized by strong R&D expenditure, high R&D personnel intensity, significant patenting activity, advanced high-speed internet coverage, and relatively low industrial PM10 emission intensity. These countries show the strongest alignment with SDG 9 targets because they combine digital readiness with innovation capacity and more favourable PM10-related industrial performance. By contrast, Romania remains in the structurally constrained cluster, together with Bulgaria, Latvia, Lithuania, and Portugal. This group records weaker R&D expenditure, lower R&D personnel intensity, and limited patenting capacity, despite some strengths in digital infrastructure and freight transport. Romania’s position is therefore marked by a clear imbalance: high digital infrastructure coverage has not yet translated into stronger innovation output or more advanced sustainable industrial performance.
The reconfiguration of clusters between 2015 and 2023 indicates structural consolidation and selective convergence tendencies, while Romania’s alignment with the selected SDG 9 dimensions remains incomplete. The advanced countries that were divided into two separate high-performing clusters in 2015 merged into a single leading group in 2023, indicating stronger coherence between innovation, digitalization, and sustainable industrial performance. At the same time, a broad intermediate cluster emerged, including countries with moderate and uneven profiles, such as France, Estonia, Croatia, Greece, Italy, Poland, Slovenia, Ireland, Spain, Czechia, Hungary, and Slovakia. Estonia’s movement from Romania’s 2015 cluster to the intermediate group in 2023 indicates that upward repositioning is possible when improvements in R&D, patenting, digital infrastructure, and environmental performance occur simultaneously.
Romania was assigned to the structurally constrained group in both classifications. In each reference year, favourable digital-connectivity and freight-transport indicators coexisted with weak R&D expenditure, limited research personnel, and very low patenting activity. The findings therefore show that Romania’s digital and transport-related strengths were not accompanied by innovation-indicator values comparable to those of the leading group in either cross-sectional snapshot.
Overall, the results indicate that EU-level progress toward SDG 9 is real but uneven. The reduction from five clusters in 2015 to three clusters in 2023 shows a degree of consolidation, yet structural gaps remain significant. Innovation-related indicators, especially patent applications, R&D personnel, and gross domestic expenditure on R&D, represent the strongest differentiating factors between clusters. This finding is particularly important for Romania, as it shows that the country’s main development constraint is not primarily digital connectivity, but the limited conversion of digital and infrastructural advantages into innovation-driven industrial transformation. Therefore, Romania’s alignment with SDG 9 targets requires policies that connect digital infrastructure with business R&D, university–industry cooperation, patenting support, industrial technology transfer, green manufacturing, and cleaner production processes.
Romania’s case also suggests that alignment with SDG 9 cannot be achieved through digital infrastructure alone. The decisive challenge is to transform digital readiness into innovation capacity, patenting activity, productive SME digitalisation and more favourable PM10-related industrial performance.
The study has several limitations that should be acknowledged. First, the analysis is based on a selected set of Eurostat indicators, which capture key dimensions of SDG 9-related sustainable industrial growth but cannot fully reflect the complexity of industrial transformation, innovation systems, digital adoption, or environmental performance. Second, the research uses country-level data, meaning that the clusters identify macro-level structural profiles rather than sectoral, regional, or firm-level dynamics. This is particularly relevant for Romania, where national averages may conceal important differences between regions, industries, and types of firms. Third, hierarchical cluster analysis is exploratory and typological; it identifies similarities and differences among countries but does not establish causal relationships between digitalization, innovation, infrastructure, and sustainable industrial growth. Fourth, the comparison between 2015 and 2023 provides a useful temporal perspective, but it does not capture the full trajectory of annual changes or the effects of specific policy interventions.
The exclusion of some potentially relevant dimensions, such as skills quality, business digitalization, green investment, circular economy performance, and industrial energy efficiency, means that the results should be interpreted as a structured comparative assessment of Romania’s alignment with SDG 9 targets, not as an exhaustive evaluation of sustainable industrial development. The omission of these variables may affect the interpretation of Romania’s relative position. High-speed internet coverage captures infrastructure availability but not whether firms and workers possess the skills and organizational capacity required to use digital technologies productively. Consequently, Romania’s digital readiness may appear more favourable when assessed through connectivity alone than it would if digital skills and business-level technology adoption were included. Similarly, reliance on PM10 intensity without indicators of green investment, resource efficiency, and circular economy performance provides only a partial view of industrial sustainability.
Another limitation concerns the possible correlation between innovation-related indicators, particularly R&D expenditure, R&D personnel, and patent applications. The PM10 emission intensity variable captures particulate-related pressure per unit of economic output, but it does not measure the complete environmental impact of industrial activity. Still, these variables were retained because they capture different stages of the innovation process—input, capacity, and output—but future research could test alternative indicator structures using dimensionality-reduction techniques or include additional indicators on circularity, industrial energy efficiency, supply-chain resilience, and low-carbon technologies.
Future research could extend this analysis in several directions. First, the cluster-based approach could be expanded by using annual data rather than two reference years, allowing a more detailed assessment of the speed and direction of Romania’s repositioning toward stronger SDG 9 alignment. Second, future studies could integrate additional variables related to business digitalization, SME innovation, green investment, circular economy performance, industrial energy efficiency, and skills quality in order to capture a broader picture of sustainable industrial transformation. Third, the analysis could be developed at regional or sectoral level, since national averages may conceal significant internal disparities in Romania and other EU Member States. Finally, future research could combine hierarchical clustering with causal or predictive methods, such as panel regression, dynamic clustering, or machine-learning models, to examine not only how countries are grouped, but also which factors most strongly explain movement between clusters over time. Future research could also examine spatial spillover effects between digital transformation and sustainable industrial development by applying spatial econometric models or regional-level data, which would allow the identification of cross-border and territorial diffusion mechanisms.
By providing a comparative, cluster-based perspective, this study contributes to the empirical literature on SDG 9 implementation and sustainable industrial transformation in the European Union. It shows that national trajectories cannot be interpreted through isolated indicators alone, but must be understood as structural configurations combining digitalization, innovation, infrastructure, and industrial environmental performance. The findings support differentiated policy approaches: leading countries need to consolidate technological leadership and sustainable industrial standards; intermediate countries need to strengthen innovation capacity and infrastructure coherence; while Romania and the other structurally constrained countries require targeted measures to transform digital readiness into measurable progress in R&D, patenting, cleaner industry, and sustainable industrial growth.