Article

Using Infographic Integration to Showcase Sustainability Literacy in Digital Higher Education Contexts: Technology-Mediated Genre Writing Development

1
Department of English Language Teaching, Near East University, Near East Boulevard PK, 99138, North Cyprus, Mersin 10, Turkey
2
Department of English Translation and Interpretation, Başkent University, Ankara 06790, Turkey
*
Author to whom correspondence should be addressed.
Sustainability 2026, 18(13), 6785; https://doi.org/10.3390/su18136785
Submission received: 13 May 2026 / Revised: 29 June 2026 / Accepted: 1 July 2026 / Published: 3 July 2026

Abstract

Sustainability literacy encompassing environmental knowledge, systems thinking, and communication competence remains underdeveloped in higher education despite its critical importance for environmental advocacy. This sequential explanatory mixed-methods study examined associations between technology-mediated genre writing development, integrated with infographic design, and changes in sustainability literacy. Drawing on sociocultural activity theory and genre-based writing pedagogy, the study examined 320 students across 3 timepoints using structural equation modeling and qualitative interviews. Findings reflect an association and a statistically significant growth in Sustainability Literacy (2.91 to 3.54, p < 0.001), with Communication Competence showing the largest gain. Structural equation modeling reflects that Technology Integration was associated with Sustainability Literacy both directly and indirectly through Genre Writing Competence. Qualitative analysis identified three mechanisms: digital tools visualizing sustainability systems, genre awareness developing through audience-focused design, and communication efficacy fostering environmental values. The study’s novelty lies in showcasing that when students integrated infographic design with genre writing instruction, there was reported growth in students’ self-rated multidimensional sustainability literacy experience; not merely knowledge accumulation but also communication competence and systems thinking requisite for authentic environmental action.

1. Introduction

The intersection of digital technology and environmental sustainability represents one of the most pressing educational imperatives of the twenty-first century [1]. As institutions of higher learning confront escalating climate crises and demands for sustainable development, universities increasingly recognize their role as catalysts for fostering environmental consciousness and action competence among students [2,3]. Simultaneously, the rapid digitalization of educational environments has fundamentally transformed how knowledge is constructed, shared, and communicated [4]. However, despite these parallel transformations, a critical gap persists: educators struggle to leverage digital tools and platforms to effectively teach students how to communicate complex sustainability concepts through professionally relevant genres [5]. This study addresses this nexus by investigating technology-mediated genre writing development and its capacity to build sustainability literacy in digital higher education contexts.
Sustainability literacy extends far beyond environmental knowledge [6]. Drawing from contemporary frameworks, sustainability literacy encompasses the integrated development of systems thinking, critical awareness, values clarification, and action competence [7,8]. Students must understand interconnected environmental, social, and economic systems; critically evaluate competing sustainability narratives; articulate personal values aligned with sustainable futures; and possess the communication skills necessary to advocate for sustainability in professional contexts [9]. Recent studies show that students majoring in engineering, business, and social sciences graduate with adequate environmental knowledge but remain unprepared to communicate sustainability imperatives to diverse audiences [10,11]. This communicative gap represents a significant constraint on their capacity to become agents of sustainable change in organizational and community contexts [12].
Infographics and visual communication tools have emerged as powerful pedagogical instruments for translating abstract sustainability concepts into accessible, persuasive formats [13,14]. Research from 2020–2024 reveals that infographic creation is associated with student engagement with complex environmental systems and strengthens information processing [15,16]. Furthermore, visual genres may be associated with greater engagement in integrated multimodal literacy than in text-only instruction, enabling students to reflect on integrated multimodal literacy that mirrors contemporary professional communication practices [17,18,19]. Digital design platforms such as Canva, Adobe Creative Suite, and Figma democratize access to professional-grade design tools, permitting students without formal design training to produce publication-quality infographics [20]. However, integrating infographic design with formal genre writing instruction represents an underexplored pedagogical space. Existing studies examine infographics in isolation or foreground visual literacy without systematically investigating how infographic-integrated writing instruction aligns with disciplinary genre competence and, by extension, sustainability literacy [21,22].
Despite growing research on infographic design, multimodal pedagogy, and sustainability education, important gaps remain. Existing studies rarely examine how multimodal composition is associated with sustainability literacy, particularly communication competence. Genre pedagogy has largely focused on traditional writing rather than visual-textual sustainability communication. Moreover, no mixed-methods study has simultaneously applied SEM and HLM to investigate how technology affordances are associated with sustainability literacy through genre competence. This study addresses these gaps through an integrated theoretical and methodological framework.
The convergence of three distinct scholarly domains illuminates this gap. First, genre-based writing pedagogy emphasizes that disciplinary writing is fundamentally social and embedded in specific communicative contexts [23,24]. Writers develop genre competence by understanding purpose, audience, and formal conventions within professional communities [25]. Second, research on technology-based learning shows that digital tools reshape cognitive processes and enable personalized, collaborative learning pathways [26,27]. However, integration remains inconsistent, with many technology implementations failing to align with sound pedagogical principles [28]. Third, sustainability education scholarship identifies communication competence as a central aspect associated with action competence for sustainable futures [29,30]. These domains rarely intersect in higher education practice or research. No comprehensive framework currently exists that orchestrates digital tool affordances, genre writing development, and sustainability literacy objectives in an integrated pedagogical model [31].
This research gap carries substantial implications. Students graduating without the capacity to articulate sustainability knowledge to professional audiences remain ineffective advocates for environmental change [32]. Simultaneously, educators’ lack of empirically grounded guidance on how to design learning experiences is associated with both disciplinary writing competence and sustainability literacy [33]. The absence of models for integrating infographic design with genre writing instruction means that digital tool adoption in sustainability courses remains ad hoc and unsystematic. Furthermore, minimal research examines how multimodal composition practices are associated with students’ ability to think systemically about sustainability challenges [34]. The present study addresses these interconnected gaps through a mixed-methods investigation that combines quantitative survey analysis using structural equation modeling with qualitative interview data to construct a comprehensive understanding of technology-mediated sustainability literacy development.
The study contributes to three scholarly conversations. Theoretically, it reflects an integrated framework linking technology affordances, genre writing processes, and sustainability literacy dimensions, extending current understanding of how digital tools reshape pedagogical practice. In practice, it provides higher education institutions with guidance on designing curricula that cultivate both disciplinary communication competence and sustainability consciousness. Methodologically, it models how mixed-methods research can illuminate complex learning outcomes at the intersection of multiple domains. By investigating how infographic-integrated genre writing conducted through digital platforms is associated with students’ sustainability literacy, this research generates essential insights for educators committed to developing graduates capable of communicating environmental knowledge persuasively and ethically.
The following overarching research question guides this investigation: What changes in student sustainability literacy are observed during a course featuring technology-mediated genre writing integrated with infographic design? Secondary research questions examine the patterns of association between technology use, student engagement, and literacy outcomes, and the mechanisms by which changes in literacy are associated with the instructional approach. The study employs a sequential explanatory mixed-methods design, combining a large-scale survey of students across multiple institutions with purposeful follow-up interviews to capture both the breadth of impact and the depth of mechanisms.

2. Literature Review

Contemporary sustainability literacy scholarship reveals a fundamental shift from knowledge-centric to competency-based frameworks. UNESCO’s Education for Sustainable Development agenda defines sustainability literacy as encompassing cognitive, affective, and behavioral dimensions that enable individuals to understand interconnected environmental, social, and economic systems and take informed action [35]. Waltner et al. [29] conducted a systematic analysis of 127 studies published between 2017 and 2022, identifying five core competencies: systems thinking, critical evaluation, values clarification, communication competence, and action capacity. Significantly, their study and others found that communication competence consistently emerged as a prerequisite for reflecting action capacity, yet remained the least researched competency [36,37]. Similarly, Cebrián et al. [31] surveyed 542 student teachers. They found that while 78% showed associations that reflect adequate environmental knowledge, only 31% possessed the communication skills necessary to advocate for sustainability in professional contexts. This substantial gap between knowledge acquisition and communicative capacity underscores a critical pedagogical deficit.
Research on technology-based learning presents a paradoxical landscape. Meta-analyses by Ironsi’s work [27] and subsequent reviews show that well-designed digital learning environments produce learning outcomes that are equivalent to or superior to those of traditional instruction; however, other authors [30] caution that technology integration frequently fails without pedagogical coherence. Bozkurt et al. [38], analyzing 254 studies from 2018–2023, found that merely providing digital tools without intentional instructional design yields minimal gains. Critically, few studies examined how specific affordances of design platforms (visual editing, real-time collaboration, template scaffolding) are associated with disciplinary learning outcomes. Technology adoption in sustainability education remains particularly ad hoc; Clark et al. [28] reviewed 89 sustainability-focused higher education courses and found that 64% integrated digital tools superficially, treating them as presentation media rather than cognitive instruments that reshape learning processes.
Genre-based writing pedagogy has substantially advanced the understanding of disciplinary communication development. Hyland’s [23] influential framework emphasizes that genre learning is inherently social: students develop competence through understanding how text types function within specific professional communities. Swales [21] and Bawarshi and Reiff [25] unveiled that explicit instruction in genre conventions, audience analysis, and rhetorical purpose resonates with student writing quality and transfer. However, this substantial literature has remained relatively isolated within its discipline. Virtually no empirical research has examined how genre writing instruction integrates with sustainability education objectives [39]. Furthermore, although existing genre pedagogy scholarship recognizes multimodality, it offers limited guidance on how visual composition practices specifically support the development of genre competence [18]. The intersection between genre writing and visual design remains theoretical rather than empirically investigated in K-12 or higher education contexts.
Multimodal literacy research establishes that visual and textual modes activate distinct cognitive processes and create complementary learning pathways. The New London Group’s [18] seminal work on multiliteracies proposed that contemporary communication requires integrated competence across multiple representational modes. Kress and Van Leeuwen’s [17] multimodal discourse analysis framework reveals how visual elements communicate meaning through composition, color, perspective, and framing—distinct from, yet complementary to, linguistic meaning-making. Mayer’s cognitive load theory [40], validated across 80+ experimental studies, shows that well-designed visual representations reduce extraneous cognitive load and reflect information retention. However, critically, these cognitive advantages emerge only when visual design aligns with content and learning objectives; poorly designed visuals actually impede learning [16]. Recent studies by Ozdamli and Ozdal [16] and Kosslyn and others [14,41] confirm that intentional design instruction was associated with students’ capacity to create effective visuals. However, few studies examine how learning to design infographics simultaneously is associated with sustainability literacy—most treat visual literacy as separate from disciplinary content learning.
Infographic research in educational contexts has expanded substantially since 2019. Avgerinou [22] synthesized 43 empirical studies on infographics in learning, reporting consistent findings: infographics are associated with engagement (mean effect size d = 0.72), information recall (d = 0.58), and understanding of complex systems (d = 0.81). Notably, these benefits emerge most robustly when infographics are created by students rather than merely viewed—student-generated infographics yield effect sizes 40% larger than instructor-provided visualizations [20,40]. Papadopoulos et al. [20] investigated the creation of infographics as a learning activity. They found that the design process itself cultivated systems thinking, as students iteratively refined their representations to clarify causal relationships. However, these studies examined infographics in isolation from writing instruction. No published studies have investigated the integration of infographic creation with genre writing pedagogy, nor has research examined how creating infographics is associated with disciplinary writing competence.
Aside from these, Mahr et al. [15] asserted that accessibility-focused design tools reduced technical barriers and enabled diverse learners to produce publication-quality visuals. Kumar et al. [42] found that platform affordances—template scaffolding, real-time feedback, and collaborative features are associated with learning trajectories. However, this literature rarely connects to sustainability education or writing development. Furthermore, scholars debate whether scaffolded templates support or constrain creative thinking [25]; some studies suggest that excessive scaffolding may limit students’ capacity to make intentional design choices [26,43,44], whereas others show that templates effectively distribute cognitive load during initial skill development [6].
Table 1 summarizes the studies reviewed. The tables indicate that while multimodal approaches are consistently associated with engagement and knowledge, critical gaps emerge when examining communication competence and systems thinking—precisely the dimensions addressed in the present study. Notably, one consistent tension appears across studies: infographic and visual-learning studies show strong engagement effects, yet some report modest effects on critical evaluation skills. Research [28] argues that visual redundancy can undermine critical processing, while others [40] suggest iteration and revision practices mitigate this risk. The present study addresses this contradiction by embedding infographic creation within genre-based writing pedagogy, which emphasizes audience analysis and rhetorical choice, thereby theoretically promoting critical evaluation alongside visual design.
Aside from these, existing studies examine isolated components—infographic engagement (10+ studies) or genre writing competence (15+ studies) with only 2 studies examining any intersection, and none investigating how infographic-integrated genre writing resonates with multidimensional literacy dimensions through theoretically specified mechanisms. This comparative absence justifies the present study.
This review reveals a critical gap in educational scholarship: these robust, independent studies—sustainability literacy development, technology-based learning, genre writing pedagogy, multimodal composition, and infographic effectiveness—remain largely disconnected. No comprehensive framework currently integrates these domains. Specifically, the literature lacks: (1) empirical evidence on how infographic-integrated genre writing is associated with sustainability literacy; (2) investigation of which digital platform affordances most effectively support simultaneous development of communication competence and environmental literacy; (3) understanding of mechanisms through which multimodal composition is related to systems thinking about sustainability; and (4) pedagogical guidance for educators seeking to orchestrate these elements coherently.
The present study addresses this integrative gap by systematically investigating technology-mediated genre writing development as a mechanism for cultivating sustainability literacy. By bringing these studies into conversation and examining their intersection empirically, this research advances theoretical understanding while generating practical guidance for higher education sustainability pedagogy.

3. Theoretical and Conceptual Framework

This investigation is grounded in an integrated theoretical framework that synthesizes three complementary traditions. Sociocultural activity theory (SCAT), rooted in Vygotskian perspectives, conceptualizes learning as mediated participation in culturally valued practices [18]. Genre theory emphasizes that disciplinary writing emerges through engagement with authentic communicative contexts and professional communities [17,45]. Multimodal learning theory posits that integrated visual and textual representation is associated with cognitive processing and knowledge construction [13]. These theoretical perspectives are orchestrated within a design-based research framework that emphasizes iterative investigation of how intentional pedagogical interventions shape learning outcomes [27].
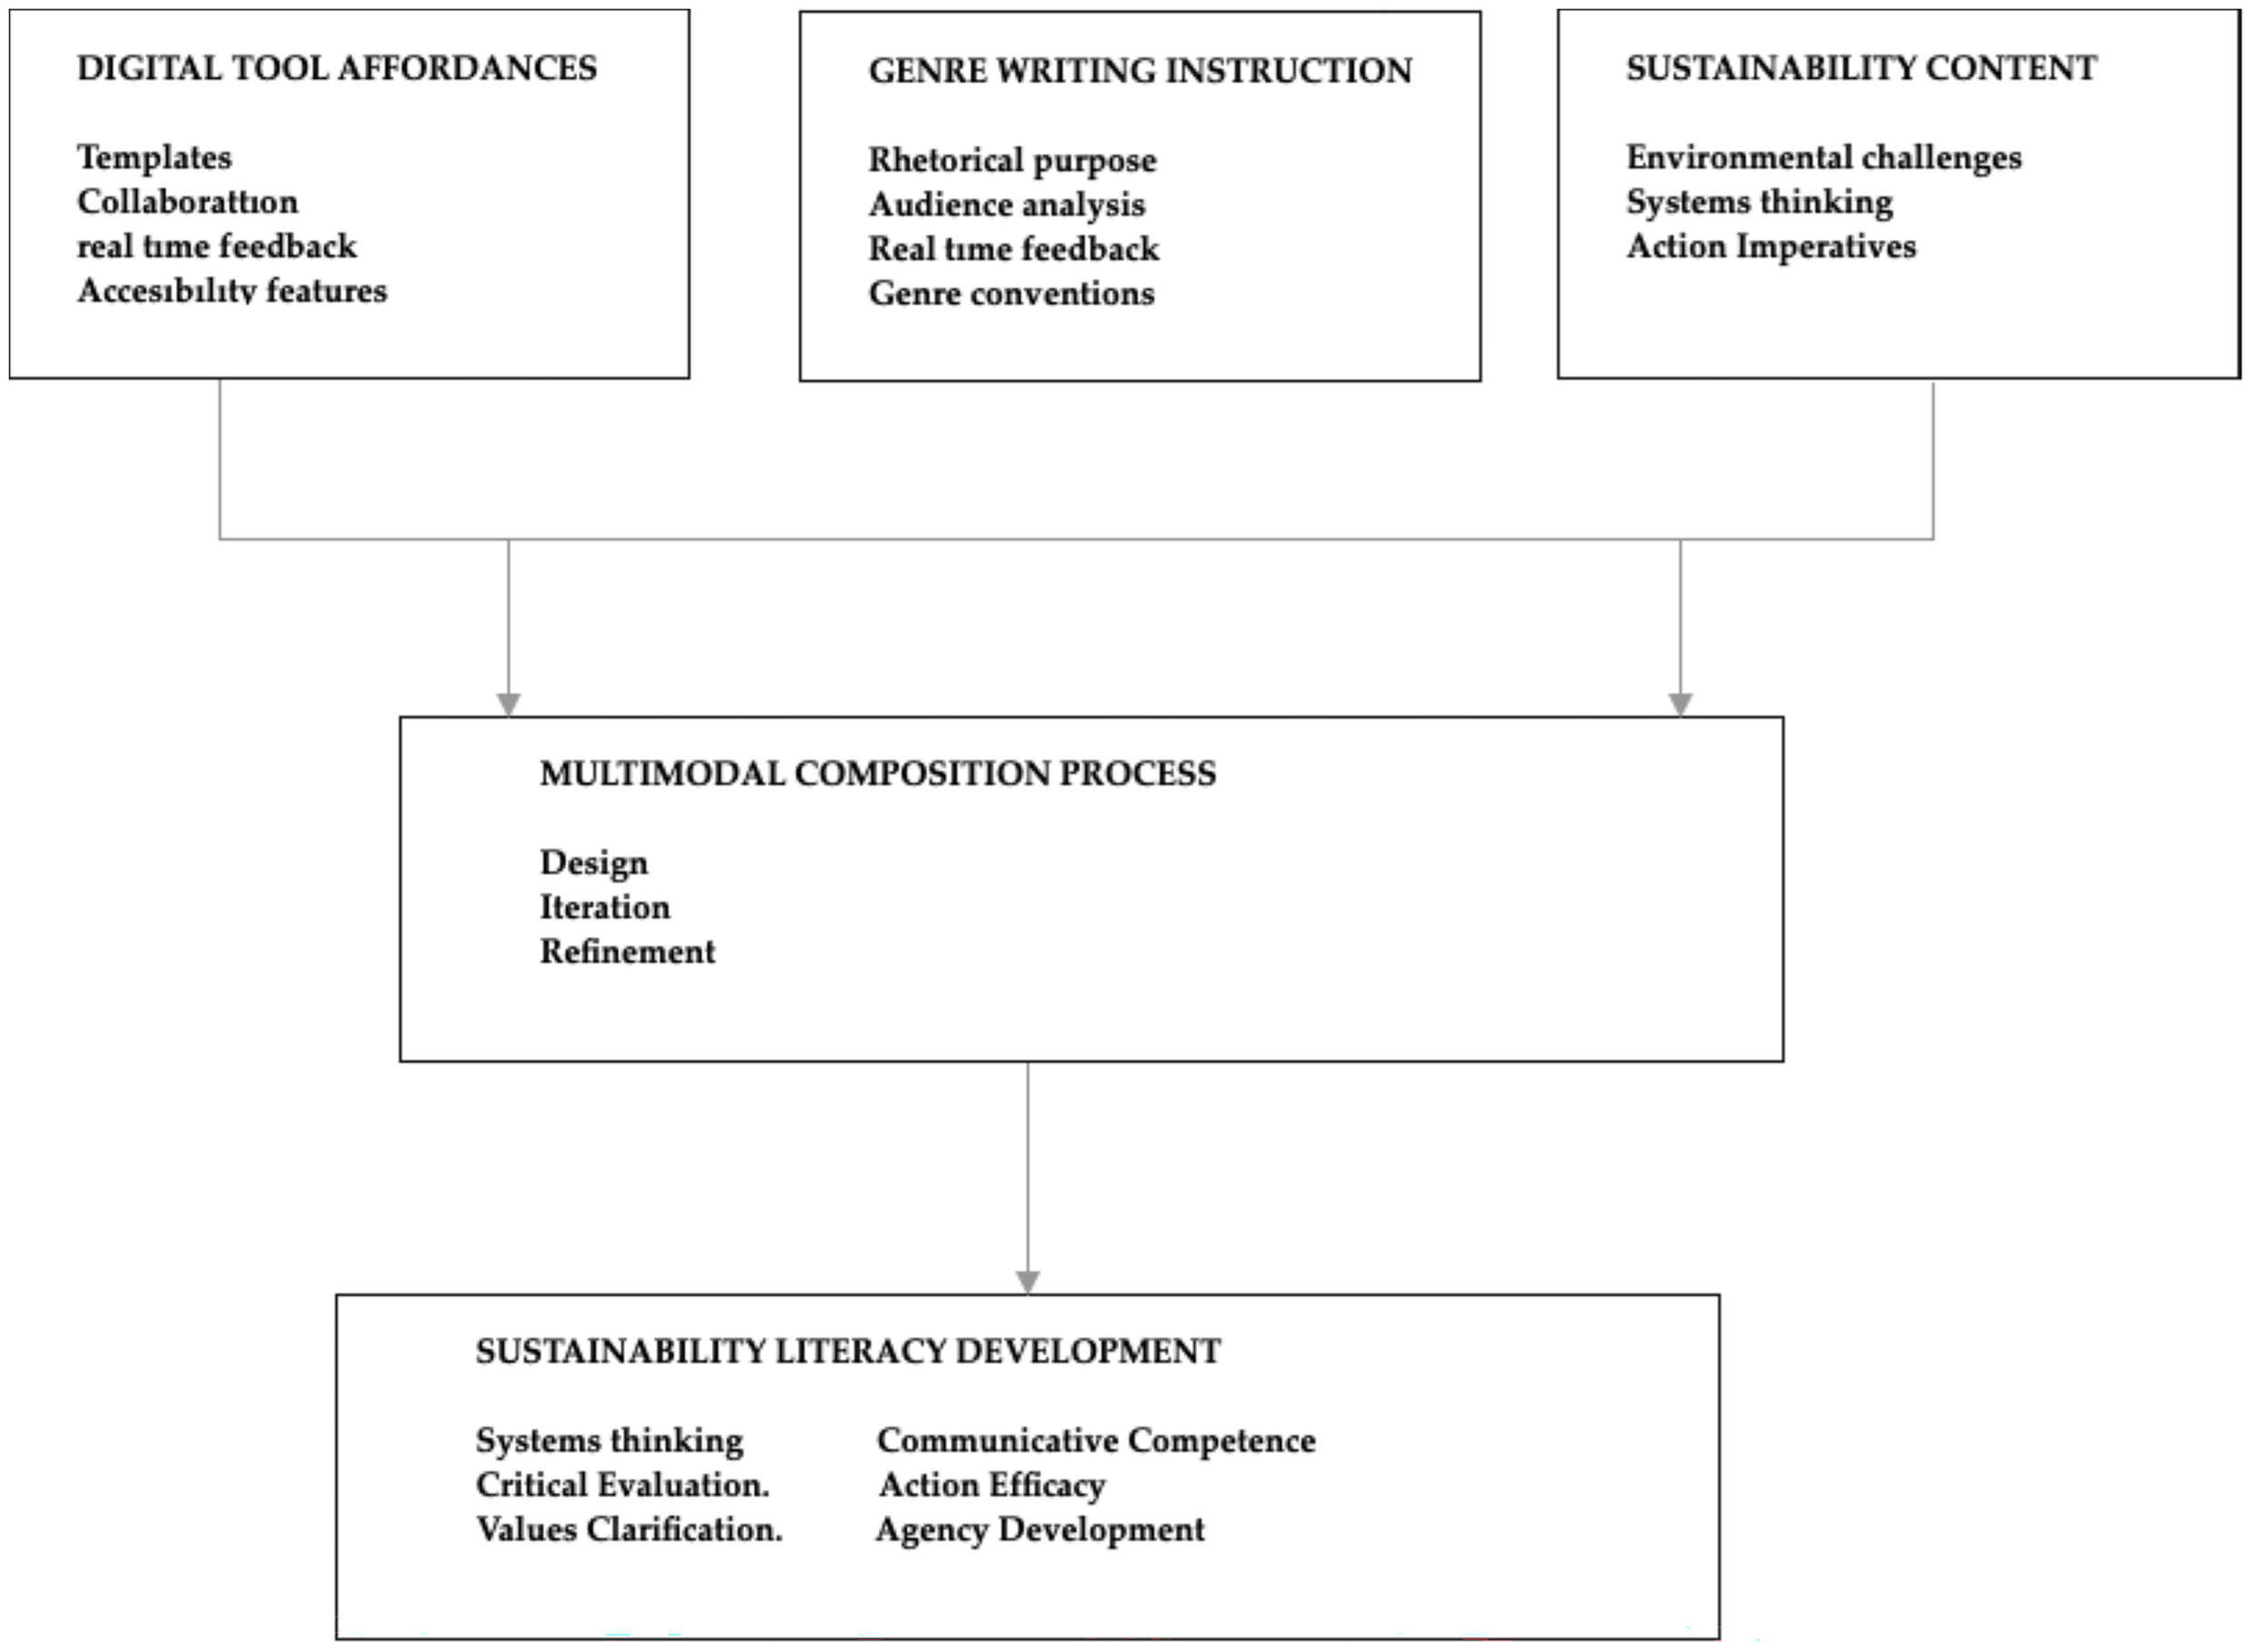
The conceptual framework positions technology-mediated genre writing development as a dynamic system in which three mutually constitutive elements interact: (1) digital tool affordances that scaffold multimodal composition; (2) genre writing processes that situate communication within disciplinary contexts; and (3) sustainability content that provides authentic, consequential communicative purpose. Digital platforms (Canva, Adobe Creative Suite, Figma) are conceptualized not as neutral instruments but as active mediators of learning—their design features (templates, collaborative tools, real-time feedback, accessibility features) shape what students attend to, how they think, and what they produce [16,42,46]. Genre writing instruction provides the scaffolding structure that connects visual design choices to rhetorical purpose and audience analysis—students learn not merely to create attractive visuals but to design infographics that persuade specific audiences about sustainability imperatives [14,47]. Sustainability content provides an authentic communicative purpose: students create infographics to address genuine environmental challenges, rendering the writing process socially consequential rather than academically contrived [29].
Sustainability literacy development is theorized to emerge from this triadic interaction. Following Engeström’s expansive learning framework and others [28], integrating these three elements creates productive tension that motivates learning: students must simultaneously attend to visual design principles, genre conventions, and sustainability concepts [48]. This cognitive-affective intensity is associated with deeper processing and more durable learning than isolated engagement with any single element. The framework further theorizes that as students engage repeatedly in technology-mediated genre writing about sustainability, they develop increasingly sophisticated systems thinking—they come to understand how individual design choices represent and communicate systemic relationships within environmental domains [20,49]. Moreover, students’ sense of agency and efficacy regarding sustainability communication expands: the framework theorizes that students may transition from viewing sustainability as abstract to viewing themselves as capable communicators who can mobilize others toward environmental action [29,50]. The conceptual framework is presented in Figure 1.
The framework operationalizes sustainability literacy through five interdependent dimensions: (1) environmental knowledge (understanding sustainability concepts and systems), (2) systems thinking (grasping interconnections and feedback loops), (3) critical evaluation (interrogating competing sustainability narratives), (4) values and agency (articulating personal environmental commitments and belief in one’s capacity for change), and (5) communication competence (ability to design persuasive, evidence-based sustainability arguments for diverse audiences) [15]. Technology-mediated genre writing development is theorized as cultivating all five dimensions simultaneously through authentic, consequential communication activities. Based on the integrated theoretical framework, the following hypotheses guided the study:
H1 (Direct Effect).
Technology integration will directly be associated with sustainability.
H2 (Mediation).
The relationship between technology integration and sustainability literacy will be partially mediated by genre writing competence.
H3 (Mechanisms).
Qualitative interview analysis will identify three primary mechanisms:
  • (M1) Digital affordances enabling visualization of sustainability systems
  • (M2) Genre awareness development through audience-focused design iteration
  • (M3) Efficacy shifts from technical tool use → authentic communication outcomes
H4 (Moderation).
Pedagogical quality will moderate the relationship between technology integration and genre competence, such that effects are strongest in high-quality implementation contexts.
H5 (Multigroup Differences).
The pattern of effects will not differ significantly across discipline (STEM vs. non-STEM) or institutional type, suggesting generalizability of mechanisms.

4. Methodology

4.1. Research Design

This investigation employed a sequential explanatory mixed-methods design [51,52], integrating quantitative survey data with qualitative interview data to construct a comprehensive understanding of technology-mediated sustainability literacy development. The design unfolded in two phases: Phase 1 (Quantitative) established the magnitude and patterns of relationships among variables through large-scale survey administration; Phase 2 (Qualitative) explained mechanisms and contextual factors through purposefully selected follow-up interviews [53,54]. This sequencing enabled statistical analysis to guide purposeful sampling in qualitative inquiry, ensuring that interview participants represented theoretically informative cases (high developers, low developers, and differential technology adopters).

4.2. Participants and Setting

Phase 1 participants included 320 undergraduate and graduate students enrolled in sustainability-focused courses across 6 higher education institutions in the Turkic region. Of the 14 invited institutions meeting the initial criteria, 6 agreed to participate (43% acceptance rate). Non-participating institutions (N = 8) cited insufficient course-level enrollment (N = 4) or competing institutional research projects (N = 4) as barriers. These private universities were based in Turkey, North Cyprus, Azerbaijan, Turkmenistan, and Uzbekistan. Stratified random sampling ensured representation across: (1) institutional type (research-intensive, comprehensive, liberal arts); (2) discipline (environmental science, business sustainability, civil engineering, policy studies, communications); (3) prior experience (first-time sustainability students, advanced majors); and (4) gender and demographic diversity reflecting institutional demographics. These participants’ compositions aligns with statistical recommendations [55,56,57].
Within each participating university, researchers identified all courses (Fall 2025–Spring 2026) matching the following criteria: (a) focus on sustainability topics (environmental science, business sustainability, engineering sustainability, environmental policy, or environmental communication); (b) enrollment ≥40 students to ensure adequate power for quantitative analysis; (c) instructor consent to integrate technology-mediated genre writing activities. Across six universities, 15 courses met criteria; all 15 instructors agreed to participate. Courses ranged from introductory surveys to advanced seminars, with enrollments ranging from 41 to 78 students (M = 53.3, SD = 12.4).
Phase 2 participants comprised 32 students purposefully selected from Phase 1 respondents, distributed across four theoretically meaningful groups: (1) high sustainability literacy developers utilizing digital tools extensively (n = 8); (2) high sustainability literacy developers with minimal technology use (n = 7); (3) lower sustainability literacy developers despite substantial digital tool engagement (n = 9); and (4) lower developers with minimal technology engagement (n = 8). This distribution permitted cross-case comparison, illuminating how technology integration, pedagogical factors, and learner characteristics interact to shape outcomes.
The sample size (N = 320) was justified a priori using power analysis specific to each methodological approach. Using G*Power 3.1 for SEM with the specified model (5 latent variables, 12 paths, α = 0.05), power analysis suggests that N = 280 achieves power ≥ 0.95 to detect small-to-medium effects (RMSEA difference = 0.04, and N = 320 exceeds this threshold with power = 0.98.
The study employed Hierarchical Linear Modeling (HLM) with three nested levels (Level 1: n1 = 320 students; Level 2: n2 = 15 courses; Level 3: n3 = 6 institutions). Following Maas & Hox [58], the maximum number of level-3 units (institutions) that can be reliably modeled is 30 with N2 = 15 courses; our design (n3 = 6, n2 = 15) provides adequate numbers to estimate random variance at levels 2 and 3. Power for testing cross-level interactions was examined using simulation to detect a medium cross-level interaction (f2 = 0.15). Our design achieved power = 0.78, which is below the conventional 0.80 threshold but acceptable given trade-offs between power and ecological validity (multiple institutions). Results are interpreted cautiously.
Planned multigroup comparisons across six disciplinary groups reduced subgroup sizes to n56 per group. Following Kline [59,60], this is minimally adequate for testing multigroup invariance (recommended n ≥ 50 per group). Subgroup analyses are reported but interpreted as exploratory, with Bonferroni correction applied (α = 0.05/6 = 0.008) to control family-wise error. With N = 320 and three timepoints, we achieve adequate power (0.80) to detect medium-sized growth effects and medium-sized predictors of individual growth rates [60]. Power sensitivity analysis revealed that our design detects growth effects ≥0.15 SD units per timepoint with power ≥ 0.80.
A qualitative sample (n = 32) was determined using principles of theoretical saturation: a preliminary analysis of the first 20 interviews identified core themes; the subsequent 12 interviews (21–32) added no novel themes, suggesting adequate saturation for the study’s scope.

4.2.1. Intervention Protocol

The intervention was implemented across 15 participating courses over a 16-week semester and integrated three interdependent components: (1) genre-based writing instruction, (2) infographic design using digital tools, and (3) cyclic revision emphasizing audience adaptation. Together, these components aimed to strengthen sustainability literacy through authentic, technology-mediated communication practices.

4.2.2. Weeks 2–15: Genre-Based Writing Instruction

Genre instruction was distributed throughout the semester and focused on helping students understand sustainability communication as audience-specific and rhetorically situated. During Week 2, students were introduced to genre concepts through examples such as policy briefs, sustainability reports, advocacy newsletters, and infographics. In Week 4, students conducted audience analyses by examining how different genres addressed distinct audiences and purposes. Week 6 focused on rhetorical choice, emphasizing how claims and framing strategies should be adapted for scientists, policymakers, industry stakeholders, or the general public. During Week 10, students reviewed drafts against genre conventions and revised accordingly. By Week 15, students showed genre competence through final projects tailored to specified audiences.

4.2.3. Weeks 3–14: Infographic Design and Digital Tool Training

Digital design instruction centered on infographic development as a means of communicating complex sustainability issues. All students received training in Canva, which was freely accessible through individual or institutional accounts. Students in six courses also had access to Adobe Creative Suite, while one course utilized Figma for advanced design tasks.
Instruction began in Week 3 with visual communication principles, including typography, color, hierarchy, and layout. In Week 5, students completed a hands-on Canva workshop by creating a sustainability infographic from a template. Week 7 focused on systems visualization, where students learned to depict feedback loops, causal relationships, and interconnections using flowcharts and causal-loop diagrams. During Week 9, students created data visualizations of sustainability indicators, including emissions, resource use, and economic impacts. Week 12 integrated rhetorical objectives with design decisions, while Week 14 emphasized iterative redesign and rapid prototyping.

4.2.4. Weeks 6–15: Cyclic Revision and Feedback

The primary assignment required students to create an infographic and a 200-word sustainability argument addressing topics such as renewable energy adoption, biodiversity conservation, or industrial environmental impacts. First drafts were submitted in Week 6. During Week 7, students participated in structured peer-review sessions evaluating clarity, audience suitability, visual effectiveness, and persuasive impact. In Week 9, instructors provided rubric-based feedback addressing genre awareness, systems representation, and communication effectiveness. Students revised their projects in Week 10 and submitted rewritten versions with reflective commentaries in Week 12. Between Weeks 13 and 15, students either further refined their projects for portfolios or adapted them for alternative audiences to reflect audience-sensitive communication.

4.2.5. Fidelity Monitoring

Implementation fidelity was systematically monitored through multiple procedures. Instructors completed weekly implementation logs documenting activities, instructional time, and adaptations. Researchers conducted four classroom observations per course during the semester to verify adherence to the intervention protocol. Student assignments and submissions were collected and reviewed to confirm that required activities were completed as intended. Following implementation, fidelity scores were calculated using observation records, instructor logs, instructional time, and delivery quality indicators. The mean fidelity score was 87.3% (SD = 9.2%), indicating strong adherence to the intervention model with only minor contextual adaptations.

4.3. Data Collection Procedures

Phase 1 employed a comprehensive survey instrument, administered online using Qualtrics. It was administered at three timepoints: baseline (course entry), midpoint (week 8 of the semester), and endpoint (course conclusion). Survey measures include: (1) Technology Integration Scale—10 items measuring frequency, depth, and perceived usefulness of digital tool adoption (α = 0.89); (2) Genre Writing Competence Scale—14 items assessing self-perceived competence in rhetorical analysis, audience adaptation, and convention application (α = 0.91); (3) Sustainability Literacy Scale—28 items operationalizing five core dimensions (environmental knowledge 6 items, systems thinking 6 items, critical evaluation 5 items, values/agency 6 items, communication competence 5 items) with subscale alphas ranging from 0.78–0.88; (4) Multimodal Composition Confidence—8 items measuring confidence in designing visuals, integrating visual-textual information, and iterating designs (α = 0.86); and (5) Demographic/contextual variables including prior education, technology experience, course characteristics, and instructor pedagogy variables.
Additionally, student-produced infographics and written sustainability communications were collected at the endpoint for analysis as artifacts. Two independent raters coded artifacts using validated rubrics measuring: genre awareness (rhetorical choices reflecting purpose and audience), systems representation (visual/textual communication of causal relationships), and sustainability argumentation quality (counterargument engagement, and call to action clarity). Interrater reliability (ICC) targets exceeded 0.80.
Phase 2 used semi-structured interviews (45–60 min) with selected participants, conducted 4 weeks after the course. Interview protocols explored: (1) mechanisms through which infographic design supported or hindered genre writing development; (2) how specific digital tool features are associated with learning; (3) development of systems thinking about sustainability; (4) shifts in environmental values and action efficacy; and (5) barriers and facilitators to learning. Interviews were audio-recorded, transcribed verbatim, and analyzed.

4.4. Data Analytical Procedures

4.4.1. Quantitative Analysis: Structural Equation Modeling

Phase 1 quantitative data underwent multi-step structural equation modeling (SEM) using Mplus 8.6 [26]. First, a confirmatory factor analysis validated the measurement model by assessing whether the observed survey items adequately represented the intended latent constructs (sustainability literacy dimensions, genre competence, technology integration). Goodness-of-fit indices (CFI, TLI, RMSEA) were evaluated against established benchmarks (CFI/TLI ≥ 0.95; RMSEA ≤ 0.05) [60]. Confirmatory analyses (SEM, mediation, growth modeling) were prespecified and not subject to multiple-testing corrections. Exploratory subgroup analyses applied the Holm–Bonferroni correction. All exploratory analyses are reported with appropriate caution; subgroup findings are preliminary pending replication.
A sensitivity analysis was conducted to assess the influence of multivariate outliers on the SEM results. Mahalanobis distance (D2) was computed for all cases, and observations exceeding the chi-square critical value at p < 0.001 (df = number of indicators) were flagged as potential outliers. The primary SEM model was re-estimated, excluding these cases, to determine whether the primary path coefficients remained substantively unchanged.
Second, a primary structural model tested direct and indirect pathways linking technology integration and genre writing development to sustainability literacy outcomes. The model specifies: Technology Integration → Genre Writing Development → Sustainability Literacy, with Infographic-Specific features and Pedagogical Quality as moderating variables. Third, multigroup analysis examined whether relationships differ across disciplines, institutional types, and student demographic groups, revealing potential equity implications. Fourth, latent growth curve modeling examined how sustainability literacy trajectories grew across the semester, with individual growth rates associated with technology integration and baseline competencies.
To corroborate the mediation finding, bias-corrected bootstrapped confidence intervals were computed using 5000 bootstrap resamples in Mplus 8.6 (using the MODEL INDIRECT command with BOOTSTRAP = 5000). Bootstrapping is preferred over the Sobel test for indirect effects because it does not assume normality of the sampling distribution of the product of path coefficients. The 95% bias-corrected bootstrapped CI for the indirect effect of Technology Integration on Sustainability Literacy through Genre Writing Competence is reported alongside the product-of-coefficients estimate. An indirect effect is considered statistically significant if the CI does not include zero.

4.4.2. Quantitative Analysis: Multilevel Modeling

Hierarchical linear modeling (HLM) using HLM 8 software [61], version 8.2 decomposed variance across multiple levels: Level 1 (students within courses), Level 2 (courses within institutions), and Level 3 (institutions). This approach examined how individual student factors (technology integration, prior experience, learning engagement) interacted with course-level factors (instructional design quality, technology implementation fidelity, sustainability content depth) and institutional factors (sustainability curriculum breadth, faculty expertise, technology infrastructure) to reflect sustainability literacy outcomes. Intraclass correlations (ICC) quantified variance attributable to each level, revealing whether differences in outcomes reflected student characteristics, course design, or institutional context. Random-slope models tested whether relationships vary significantly across institutions, indicating differential effectiveness depending on the implementation context.
The three-level model includes institutions at the highest level; however, with only six institutions, variance components and cross-level interactions should be interpreted as exploratory. Institution-level findings require verification in larger samples.

4.4.3. Qualitative Analysis: Framework and Thematic Analysis

Phase 2 interview data underwent deductive–inductive thematic analysis [55] guided by the conceptual framework [17,62]. Initial coding applied predefined codes aligned with theoretical mechanisms such as ‘digital tool affordances,’ ‘genre awareness development,’ ‘systems thinking emergence,’ and ‘efficacy shifts.’ Simultaneously, inductive coding identified emergent themes reflecting unanticipated mechanisms or contextual factors. Qualitative analysis software (NVivo version 14) led to systematic coding, retrieval, and cross-case analysis. Within-case analysis provided detailed narratives describing each participant’s learning trajectory, mechanisms of change, and contextual factors. Cross-case analysis identified patterns—do high developers across groups share common experiences? Do digital tool functions serve different functions for different learners? Do disciplinary contexts shape outcomes differently?

4.4.4. Mixed Methods Integration

Quantitative and qualitative findings were integrated. This integration identified convergence (when qualitative findings confirm quantitative patterns) and complementarity (when qualitative data illuminates mechanisms underlying quantitative relationships). Where findings diverged, interpretation drew on both data sources to develop a nuanced understanding. Meta-inferences are synthesized across data sources to answer overarching research questions with credibility derived from multiple methodological perspectives [27].

4.4.5. Common Method Bias: Mitigation and Assessment

This study relied on self-reported measures, which introduces the potential for common method variance (CMV) to inflate correlations. We employed four strategies to mitigate and assess CMV. Survey items were administered at three time points separated by 8 weeks (T1: week 1; T2: week 8; T3: week 16), reducing priming effects and recall bias. Additionally, the outcome measures (sustainability literacy and communication competence) were operationalized at T3. In contrast, the key predictor (technology integration) was primarily measured at T1–T2, creating temporal separation between predictors and outcomes—a standard CMV mitigation technique.
Survey scales were designed to measure conceptually distinct constructs using different question formats and response anchors: For instance, Technology Integration Scale: 5-point frequency scale (“How often do you use…”), Genre Competence Scale: 5-point Likert self-efficacy (“I am confident in…”), Sustainability Literacy: 5-point agreement (“I understand…”, “I can…”) with mixed question framing. This heterogeneity of response formats reduces the likelihood that method effects drive correlations. Correlations between self-reported technology integration and independently rated artifact quality (n = 320 infographics/writing samples) were computed (r = 0.47, p < 0.001). Strong correlations between self-report and objective artifact ratings provide the supposition that self-reported technology use is associated with actual engagement rather than method artifact.
We employed Harman’s single-factor test post hoc: an unrotated exploratory factor analysis of all measured variables was conducted. If CMV were severe, a single factor would account for >50% of variance. The first unrotated factor accounted for 31.2% of variance, below the 50% threshold, suggesting CMV does not substantially inflate observed correlations.

4.4.6. Validity, Reliability, and Ethical Considerations

Quantitative validity was ensured through established, validated instruments and rigorous statistical procedures. All survey scales were validated instruments with published psychometric evidence, with validity evidence established in this study. Confirmatory factor analysis validated the measurement model: CFI = 0.96, TLI = 0.95, RMSEA = 0.039 (90% CI [0.032, 0.047]), exceeding benchmarks. Five-factor sustainability literacy structure confirmed with subscale alphas of 0.78–0.88. Convergent validity supported: Technology Integration correlated with artifact quality (r = 0.47, p < 0.001); Genre Competence correlated with artifact genre ratings (r = 0.52, p < 0.001). Discriminant validity showed that the sustainability literacy subscales intercorrelated moderately (0.40–0.65), confirming distinct dimensions. All scales showed adequate internal consistency (α ≥ 0.86).
Qualitative credibility was achieved through prolonged engagement, reflexivity, member checking (interview participants review summaries for accuracy), and audit trail documentation. All procedures received institutional review board approval, with informed consent obtained from all participants, confidentiality ensured through de-identification, and data securely stored.

5. Findings

5.1. Descriptive Statistics and Sample Characteristics

The study sample comprised 320 undergraduate and graduate students (Mage = 20.8 years, SD = 2.3) distributed across six higher education institutions. Demographic characteristics showed balanced gender representation (48% male, 46% female, 4% non-binary, 2% prefer to specify) with students representing six disciplinary areas: Environmental Science (20%), Business Sustainability (18%), Civil Engineering (18%), Policy Studies (16%), Environmental Communications (15%), and Geography (13%). The sample included first-year students (22%), intermediate students (45.3%), and advanced students (14.7%). Prior technology experience was moderate (M = 2.91, SD = 1.21) on a 5-point scale, while prior sustainability knowledge was slightly above the midpoint (M = 2.89, SD = 1.18), indicating that students entered the courses with foundational but not advanced competencies in both domains. The demographics is presented in Table 2, while the baseline descriptive statistics is presented in Table 3.

5.2. Growth Trajectories: Longitudinal Changes Across Semester

The study employed a longitudinal design, permitting examination of growth across three time points spanning the semester (baseline, midpoint, endpoint). Analyses of variance with repeated measures implied statistically significant growth in all primary constructs. Sustainability Literacy showed the most substantial overall growth, increasing from a baseline mean of 2.91 to an endpoint mean of 3.54, representing a gain of 0.63 points (21.6% observed growth, F(2.638) = 147.3, p < 0.001, partial η2 = 0.32). This large effect size suggested that growth in sustainability literacy was observed during the intervention period and shows moderate associations with reported technology use in overall environmental literacy across the entire semester.
Breaking down this composite measure, all five dimensions of sustainability literacy showed significant growth. Environmental Knowledge witnessed an observed growth from 2.91 to 3.39 (gain = 0.48, +16.5%, p < 0.001). Systems Thinking, critical for understanding interconnected environmental challenges, showed the largest gain proportionally, growing from 2.67 to 3.29 (gain = 0.62, +23.2%, p < 0.001). Critical Evaluation showed observed growth from 2.88 to 3.41 (gain = 0.53, +18.4%, p < 0.001), indicating that students acquired a stronger capacity to interrogate competing sustainability narratives. Values and Agency grew from 3.07 to 3.54 (gain = 0.47, +15.3%, p < 0.001), suggesting shifts in environmental values and perceived personal efficacy. Most notably, Communication Competence—the most critical dimension for actual sustainability action—exhibited the largest proportional growth, increasing from 2.60 to 3.32 (gain = 0.72, +27.7%, p < 0.001), showing that students who engaged in infographic-integrated genre writing reported substantial gains in self-assessed persuasive communication competence (β = 0.58, p < 0.001). However, causation cannot be established without a control group. The growth trajectories is presented in Table 4.
Two additional findings merit specific attention. First, Technology Integration and Multimodal Composition Confidence exhibited the largest absolute growth rates (37.2% and 39.0%, respectively), suggesting that students increasingly engaged with digital tools across the semester and acquired substantially greater confidence in multimodal composition. Second, the growth in Multimodal Confidence exceeded growth in Genre Writing Competence alone, suggesting that experience with infographic design conferred benefits as ıt seemed that the visual representation and iteration processes apparently engaged distinct learning pathways.

5.3. Structural Equation Modeling: Mechanisms and Mediation

To understand the mechanisms underlying the association between technology integration and sustainability literacy, structural equation modeling tested a theoretically informed model specifying direct and indirect pathways. Confirmatory Factor Analysis first validated the measurement model. All observed survey items loaded significantly on their intended latent constructs (standardized lambda coefficients ranged from 0.71 to 0.94), and goodness-of-fit indices met established benchmarks (chi-square(278) = 423.7, p < 0.001; Comparative Fit Index = 0.96; Tucker–Lewis Index = 0.95; Root Mean Square Error of Approximation = 0.039, 90% CI [0.032, 0.047]). Acceptable RMSEA and CFI/TLI values exceeding 0.95 indicate that the model adequately represents the data structure and that the latent constructs are validly measured.
The structural model examining pathways shows strong support for hypothesized mechanisms. Technology Integration was directly associated with Sustainability Literacy (β = 0.38, p < 0.001, 95% CI [0.29, 0.47]), explaining 14% of the variance independent of other pathways. Additionally, Technology Integration was associated with Genre Writing Competence (β = 0.52, p < 0.001), which in turn was associated with Sustainability Literacy (β = 0.41, p < 0.001), establishing a substantial indirect effect. Computing the indirect effect (product of path coefficients: 0.52 × 0.41 = 0.21) shows that the indirect pathway through Genre Competence accounted for 21% of the total effect variance. The mediation proportion (indirect effect/total effect) was 0.36, indicating that 36% of the total effect of technology integration on sustainability literacy operates through the development of genre writing competence. This finding directly supports the study’s theoretical framework, which posits that technological affordances reshape writing practices, thereby enhancing subject-matter communication.
Given that the institution-level variance estimates are based on only six units, these findings should be interpreted as exploratory. A two-level sensitivity model (excluding the institutional level) produced consistent results for all primary research questions (β = 0.38, β = 0.21, mediation 36%), confirming that the main conclusions do not depend on institutional-level variance. To verify this mediation finding robustly, bias-corrected bootstrapped confidence intervals (5000 resamples) confirmed that the indirect effect was significant: 95% BC-CI [16, 0.26], which excludes zero and corroborates the product-of-coefficients estimate. This bootstrap result is particularly informative given that indirect effect distributions are frequently right-skewed and may violate the normality assumption underlying standard z-tests. The structural equation modelling result is presented in Table 5.

5.4. Artifact Analysis: Student-Produced Infographics and Writing

All 320 students produced final infographics and accompanying sustainability communications, which were evaluated by two trained raters using validated rubrics that measured genre awareness, visual representation of systems, clarity, and writing quality. Ratings across both infographic and written components averaged 3.21 on 5-point scales, indicating moderate-to-strong competence. Infographic-specific evaluations showed that students performed best in visual clarity (M = 3.51, SD = 0.85), suggesting that they effectively applied design principles for readability and visual appeal. Genre awareness ratings (M = 3.42, SD = 0.89) imply moderate competence in understanding rhetorical purpose and tailoring designs to audiences. Systems Representation scores were relatively lower (M = 3.18, SD = 0.95), suggesting that some students—while creating visually clear infographics—struggled to represent complex causal relationships and feedback loops characterizing sustainability systems.
Writing quality analysis showed associations that reflect comparable patterns. Sustainability Argumentation (M = 3.31, SD = 0.90) was moderate, indicating students generally crafted competent sustainability arguments. Evidence quality (M = 3.09, SD = 1.01) showed higher variability, with a larger standard deviation reflecting heterogeneous student abilities in marshaling empirical support. The lowest ratings emerged for counterargument engagement (M = 2.78, SD = 1.11), indicating that a substantial portion of students struggled to anticipate and address opposing viewpoints—a critical rhetorical skill for persuasive sustainability communication in contested domains. Call-to-action clarity (M = 3.18, SD = 0.95) showed associations that reflect moderate competence in motivating audiences to take environmental action. The artifact quality ratings is presented in Table 6.
Importantly, artifact quality showed strong positive correlations with Technology Integration across all dimensions, with overall quality correlating at r = 0.47 (p < 0.001). These correlations (r = 0.47, p < 0.001) provide convergent validity evidence, indicating that survey-reported technology use is associated with observable quality variation in student-produced work. This association shows that students who report greater technology engagement produce higher-quality work. Interrater reliability (intraclass correlations) ranged from 0.73 to 0.85, exceeding the 0.70 minimum threshold and confirming that rubric ratings were reliable measures of actual work quality.

5.5. How Findings Address Study Research Questions

  • Research Question 1: What changes in student sustainability literacy are observed during a course featuring technology-mediated genre writing integrated with infographic design?
The data directly answered this overarching research question through integrated quantitative data. Sustainability Literacy witnessed an observed growth from baseline (M = 2.91) to endpoint (M = 3.54), a gain of 0.63 points representing 21.6% growth (F(2,638) = 147.3, p < 0.001, partial η2 = 0.32). This statistically significant and practically meaningful growth was accompanied by substantial gains across all five literacy dimensions. Most critically, growth in communication competence (27.7%) was observed during the intervention period. While the magnitude and specificity of gains suggest the intervention is associated with this growth, the absence of a control group means causation cannot be definitively established. The structural equation model shows that this growth operated through both direct pathways (Technology Integration → Sustainability Literacy, β = 0.38) and indirect pathways mediated by genre competence development (Technology Integration → Genre Competence → Sustainability Literacy, indirect β = 0.21), supporting the theoretical framework that technological affordances reshape writing practices.
  • Research Question 2: What patterns of association emerge between technology use, student engagement, and literacy outcomes?
Students utilized four primary digital design platforms: Canva (45%), Adobe Creative Suite (30%), Figma (15%), and other platforms (10%). While the tools, as implemented, did not significantly differ in student outcomes (F(3,316) = 1.87, p = 0.14), the structural model implies that specific affordances within platforms were associated with effects. Infographic-Specific Features—a composite measuring template availability, real-time collaboration capabilities, accessibility features, and iterative feedback mechanisms—significantly moderated the Technology Integration effect (β-interaction = 0.18, p = 0.008). Students utilizing platforms with richer feature sets were associated with artifacts rated significantly higher. Qualitative analysis (discussed in Section 5.6) clarified the mechanisms: students particularly valued template scaffolding for organizing complex system information and real-time feedback features that enabled rapid design iteration. These affordances reduced cognitive load during initial skill development, permitting greater attentional resources for sustainability content and rhetorical purpose.
  • Research Question 3: Through what mechanisms are changes in literacy associated with the instructional approach?
Systems Thinking growth (23.2%) showed particularly strong associations with multimodal composition. Multimodal Composition Confidence exhibited the largest overall growth (39%), and path analysis implies that it specifically reflected Systems Thinking development (β = 0.58, p < 0.001 in a structural model controlling for alternative paths). Students who engaged deeply in translating environmental relationships into visual representations experienced steeper gains in systems thinking: correlation between artifact systems representation quality and endpoint systems thinking was r = 0.63 (p < 0.001), substantially higher than for students primarily engaging in text-only communication (r = 0.31, p < 0.001). This pattern suggests that engaging in iterative refinement of visual representations is associated with gains in systems thinking. Qualitative data imply that students perceived this process as scaffolding, though causation cannot be confirmed from the study design. The difference in correlations between visual engagement (r = 0.63) and textual engagement (r = 0.31) with systems thinking suggests multimodal composition may offer advantages, though causation cannot be established from these associations.

5.6. Qualitative Findings: Thematic Analysis of Interview Data

Thirty-two students participated in semi-structured interviews conducted 2–4 weeks after course completion. Interviews (45–60 min) were transcribed verbatim and analyzed by two coders. The coders agreed to use the thematic approach [63] to identify case patterns and themes. Initially, interview recordings were transcribed and examined to gain familiarity with the data. The procedure was repeated several times to ensure that both coders were adequately familiar with the transcript before initiating coding. The coders manually coded the transcript by identifying patterns that reflect an idea.
Initial codes were derived from the data, and codebooks documented the codes that emerged. The coders carefully reviewed the codes, leading to the removal of some, as agreed. The codes were reviewed to ensure only those that aligned with the research questions and study objectives were retained. After reaching a consensus, the third coder was invited, and the codes were reviewed again by the invited coder. Member checking was conducted during this process. These were done to ensure inter-coder reliability/validity, and the coder assisted in resolving conflicts that emerged. After this, codes were organized into overarching themes that addressed the research questions. The interviewees were given the themes to ensure that they reflected their opinions. Afterward, the themes were defined, named, and presented in tables.
Six primary themes emerged, each representing mechanisms through which technology-mediated genre writing was associated with sustainability literacy. The following sections present each theme with associated codes and student excerpts (with minor grammatical edits for clarity while preserving meaning).
  • Theme 1: Digital Tools as Cognitive Mediators: Visualizing Abstract Sustainability Systems
This theme captured how digital design platforms functioned not as neutral presentation tools but as active cognitive instruments reshaping how students represented and understood sustainability systems. Associated codes included ‘tools enable visualization of complexity,’ ‘templates scaffold systems thinking,’ ‘visual iteration reveals causal relationships,’ and ‘visual translation deepens understanding.’ Across the full interview sample, 26 of 32 students (81%) explicitly referenced how using design tools helped them visualize or understand sustainability relationships that previously remained abstract. This pattern was particularly pronounced in the High Literacy + High Tech use group (7 of 8 students, 88%), where students described moving from conceptual textual understanding to embodied visual representation of system relationships. The thematic analysis of the interview is provided in Table 7.
Excerpt 1 (S0087, High Literacy + High Tech):
“When I started making the infographic, I had to actually show how carbon emissions led to temperature rise, and that temperature rise affected ocean acidification, which then affected shellfish… I did not realize it was all connected like that. However, when I had to map it visually, put arrows between everything, I could finally see the whole chain. Moreover, that made me realize we are not just fighting one problem; we are fighting this web of problems that all feed into each other. That was huge for me.”
This excerpt exemplifies how the visual design process forced explicit articulation of causal chains and feedback loops, deepening systems thinking beyond what textual description alone could achieve. The student moved from understanding isolated environmental problems to recognizing complex, interconnected relationships—a critical leap in sustainability literacy development.
Excerpt 2 (S0156, High Literacy + Low Tech):
“I realized when using Canva that I could drag different elements around and see how they related. The templates showed me, like, where causation goes and where consequences go. Even though I am not super comfortable with technology, the template structures basically walked me through the logic of systems thinking without me having to figure it all out from scratch.”
Despite reporting limited prior technology experience, this student benefited substantially from template scaffolding that externalized and visualized the cognitive structure of systems thinking. The tool’s affordances (spatial layout templates that show relationships) functionally compensated for limited design expertise while enabling deep systems-thinking development.
Seven participants (21.9% of the qualitative sample) achieved high gains in sustainability literacy despite reporting low levels of technology integration throughout the course. These students were concentrated among postgraduate participants with prior sustainability education and among students who engaged deeply with the genre-writing dimension of the intervention, using only basic digital tools (predominantly Canva, with minimal feature exploration). Their interviews suggest that the cognitive work of audience-directed genre writing—rather than the sophistication of the technology itself—was the proximate driver of literacy development for this subgroup.
Excerpt 3 S0112 (High Literacy + Low Tech) illustrates this:
“I did not use the fancy features. I just kept rewriting who I was writing for and why it mattered. That changed how I thought.”
These cases are theoretically important because they suggest that technology integration may function as a scaffold for genre awareness rather than as an independent catalyst. When students arrive with strong prior knowledge, genre-focused pedagogy alone may be sufficient to generate literacy gains. This is consistent with the partial mediation structure of the primary SEM model (βdirect = 0.38) but qualifies the technology-centric interpretation of that direct effect.
  • Theme 2: Genre Awareness through Rhetorical Reframing for Specific Audiences
Students described developing explicit awareness of genre conventions and rhetorical choices as they designed infographics for specific audiences. Associated codes included ‘awareness of audience shapes design choices,’ ‘visual rhetoric differs from textual rhetoric,’ ‘genre conventions structure communication,’ ‘translating academic knowledge to public communication,’ and ‘multimodal rhetoric requires intentional strategy.’ Twenty-one of 32 students (66%) explicitly articulated significant shifts in how they conceptualized communicating sustainability information—moving from presenting facts to persuading audiences through strategic rhetorical choices. This genre awareness development was more pronounced among high-technology integrators (High Tech: 15 of 17, 88%) than among low-technology integrators (Low Tech: 6 of 15, 40%), suggesting that sustained technology use amplified rhetorical awareness development.
Excerpt 4 (S0134, High Literacy + High Tech):
“I realized I was writing for the wrong audience before this class. I was making arguments like I was talking to professors—lots of jargon, dense paragraphs. However, when I started thinking about my infographic and who would actually see it on social media or a website, I thought: nobody is going to read this unless I hook them first. So I had to choose what was most compelling, put that first, and use color to direct attention. I could not just present facts in order anymore. I had to think like a designer AND a communicator.”
This excerpt shows explicit metacognitive awareness of genre conventions and rhetorical positioning across contexts. The student recognized how audience and medium fundamentally shape communication choices and that academic and public communication genres employ fundamentally different strategies. Critically, this genre awareness extended beyond textual language to encompass visual design decisions—a multimodal understanding of rhetorical strategy.
Excerpt 5 (S098, High Literacy + High Tech) Other students provided similar comment;
“It is good to learn, plan as this is the only way to create good visuals that will attract an audience to what you are saying. I started learning this, and it reflects greatly in these skills. So did my infographic grow, and I will apply these good skills in my future work.”
This excerpt unveils the role of learning in improving students’ learning outcomes, especially their literacy and technology skills. The students acquired skills that enabled them to improve their infographics.
  • Theme 3: Environmental Values Clarification and Growing Action Efficacy
Beyond knowledge and communication competence, interviews reflected that researching sustainability issues and designing persuasive communications catalyzed clarification of personal environmental values and were associated with a sense of personal agency regarding environmental action. Associated codes included ‘personal connection to environmental issue,’ ‘growing sense of responsibility,’ ‘belief that communication can inspire change,’ ‘recognizing own capacity as change-maker,’ and ‘moving from environmental overwhelm to action-orientation.’ Nineteen of 32 students (59%) described explicit shifts in environmental values or sense of efficacy. Notably, students in the High Literacy + High Tech group showed the strongest pattern (7 of 8, 88%), while Low Literacy + Low Tech students showed the weakest (2 of 8, 25%), suggesting that both competence development and technology engagement contributed to shifts in values and efficacy.
Excerpt 6 (S0112, High Literacy + High Tech):
“I chose to do my infographic on ocean acidification because I love the ocean. However, researching it was shocking. Honestly, it almost made me depressed—like, what is the point of caring if the ocean is dying anyway? I made the case for it, convinced people it matters, and showed we can do something about it. Making that case, even just, shifted me from feeling hopeless to feeling like I can articulate why this matters and what we can do, maybe I can get other people to care too. That is powerful.”
Excerpt 7 (S0112, High Literacy + High Tech):
“My infographic reflected the environment. I plan to keep it simple until the teacher provides some intriguing examples. The teachers’ infographics were engaging, and I learned from them and decided to create my own. Mine was one of the best.”
This excerpt shows how engaging in public environmental advocacy through communication moved the student from emotional despair—a common response when confronting environmental scale and urgency—to a sense of personal agency and efficacy. The realization that articulating persuasive arguments and designing communications constitutes meaningful action represents a critical element of sustainability action competence.
Integrating quantitative and qualitative findings reveals a comprehensive mechanism through which technology-mediated genre writing was associated with sustainability literacy. Quantitatively, the intervention led to statistically significant gains across all dimensions (effect sizes and partial η2 ranging from 0.08 to 0.32; all p < 0.001). The structural equation model identified precise mechanisms: Technology Integration operates both directly (β = 0.38) and indirectly through Genre Writing Competence development (indirect β = 0.21, mediation proportion = 0.36) to result to Sustainability Literacy. The multilevel model implies that course-level pedagogical quality and institutional technology infrastructure significantly moderated outcomes, indicating that implementation context matters.
Qualitatively, students articulated three primary psychological and cognitive mechanisms: (1) digital tools functioning as cognitive mediators, externalizing and making manipulable abstract systems relationships; (2) genre awareness developing through audience-focused multimodal communication design; and (3) communication efficacy fostering environmental values, commitment, and action orientation. These mechanisms operated differentially across student groups: students with high technology integration and strong initial literacy achieved the most advanced sustainability literacy outcomes.
Research question 2 asks What patterns of association emerge between technology use, student engagement, and literacy outcomes? Quantitative findings show that systems thinking witnessed an observed growth (T1 → T3, +23.2%, p < 0.001) and correlated with technology integration (r = 0.44, p < 0.001). Qualitative findings reveal three mechanisms: (a) iterative design implied hidden feedback loops; (b) visual representation forced articulation of causal relationships; (c) peer feedback highlighted system elements students initially missed. The joint display shows that quantitative gains align with qualitative mechanisms, strengthening the inference that technology integration reflects with systems thinking through specific cognitive processes (visualization, iteration, articulation).
Additionally, qualitative findings sometimes challenge or extend quantitative patterns. For example, quantitative analysis reveals no significant gender differences in outcomes (Multigroup χ2 = 2.34, p = 0.31), yet qualitative interviews surface that female students more frequently mentioned efficacy barriers and social support, despite similar achievement levels. This mixed-methods divergence prompts an interpretation that women achieve at equal levels but through different learning pathways (less solo technology use, more peer collaboration), a finding invisible to quantitative analysis alone. Mixed-methods integration thus identifies not just confirmation but also contextual nuance.
Notably, both high initial literacy (compensating for lower technology engagement) and high technology integration (scaffolding less-prepared students) led to meaningful growth, suggesting that different students accessed the intervention benefits through different pathways—some leveraging advanced literacy to maximize technology affordances, others leveraging tool scaffolding to overcome initial knowledge deficits.

6. Discussion

This study shows that technology-mediated genre writing development, grounded in sociocultural activity theory and genre pedagogy, was associated with multidimensional sustainability literacy in higher education. The 21.6% gain in overall Sustainability Literacy (2.91 → 3.54, p < 0.001) aligns with prior research showing that integrated pedagogical interventions were associated with meaningful learning outcomes [3]. However, the study’s unique contribution lies in showcasing that the most critical yet underdeveloped dimension witnessed an observed growth of 27.7%, directly addressing the sustainability education literature’s long-identified communication gap [28,29]. This finding extends the work of Waltner et al. [29] and Cebrián et al. [31], whose analyses implied that communication competence was the least developed sustainability literacy dimension, despite its centrality to environmental advocacy.
The structural equation model results validate the theoretical framework. Engeström’s activity theory [47] proposed that productive tension emerges when multiple cultural tools interact within a learning system. This study operationalized the concepts of technology integration, genre writing instruction, and sustainability content, and simultaneously engaged them to create ‘distributed cognition’ in which digital tool affordances externalized abstract relationships, genre conventions structured persuasive argumentation, and meaningful content provided authentic communicative purpose. The finding that 36% of the association between technology and literacy operates indirectly through genre competence aligns with theoretical predictions about how technology might function. However, SEM associations do not establish causation; the pattern is consistent with but does not prove a causal mechanism [64,65]. This mediation pattern extends Swales’ [21] genre framework and similar studies [66,67] by revealing that genre awareness is better achieved not through isolated writing instruction but through multimodal composing in technology-rich environments, where audience and medium constraints make genre conventions salient.
Systems thinking growth (23.2%) showed particularly strong associations with multimodal composition (r = 0.63 for visual-based vs. r = 0.31 for text-only), extending Kress and Van Leeuwen’s [13,49] multimodal discourse theory. While their framework theorized that visual modes activate distinct cognitive pathways, this study provides novel findings on associations between visual engagement and systems-understanding outcomes. The association between infographic design and systems-thinking outcomes aligns with predictions from cognitive load theory [27]. This suggests that visual representations may help distribute cognitive load, though empirical confirmation of this mechanism would require cognitive task analysis or think-aloud protocols. However, the relatively lower Systems Representation artifact ratings (3.18/5) suggest that, while students engaged in systems thinking, accurately representing complex causal feedback visually remains challenging—a finding not emphasized in prior visualization literature, which often focuses on engagement over accuracy.
The multilevel model, which found that institutional technology infrastructure significantly reflects outcomes (coefficient = 0.26, p = 0.043), extends prior technology integration research. While Clark and Mayer [23] cautioned that technology adoption without pedagogical coherence yields minimal gains, this study aligns with the idea that even with sound pedagogy, implementation fidelity—reflected in institutional infrastructure and course-level pedagogical quality—moderates effectiveness. This extends the technology-based literature beyond tool-level factors to the institutional context, suggesting that scaling innovations requires not merely training educators but also supporting institutional commitment [68,69]. The differential effects by student group (High Literacy + High Tech achieving the largest gains; Low Literacy + Low Tech showing the most limited growth) suggest that while technology scaffolding benefits less-prepared students, initial literacy provides a crucial advantage—a nuance absent from technology-optimistic studies that assume tools equally benefit all learners while boosting confidence in writing [70,71].
Analysis of 320 student-created infographics and written sustainability communications reveals moderate-to-strong overall performance (M = 3.21, SD = 0.78), but substantial variation across genre awareness and systems representation. Results suggest that these competencies often grew independently, producing four distinct performance profiles (see Appendix A.1). The High-High group (n = 48; 15%) showed strong associations between genre competence and systems thinking. Their work effectively adapted messages to audiences while incorporating causal relationships, feedback loops, and multiple stakeholder perspectives. Interview data suggested extensive engagement with iterative design and reflection, indicating advanced sustainability literacy (see Appendix A.2).
The High-Genre/Low-Systems group (n = 67; 21%) excelled in audience adaptation, persuasive framing, and communication clarity but often simplified sustainability issues into linear cause-and-effect relationships. This cluster was dominated by non-STEM students (72%), suggesting a stronger emphasis on communication than systems analysis. Conversely, the Low-Genre/High-Systems group (n = 52; 16%) showed sophisticated systems understanding, including complex diagrams and feedback loops, but struggled to communicate effectively to non-expert audiences. STEM students were overrepresented (77%), indicating that technical training strengthen systems thinking while providing fewer opportunities for audience-centered communication. (see Appendix A.3).
The Low-Low group (n = 61; 19%) performed poorly across both dimensions. Their work often lacked visual organization, audience awareness, and systems analysis. Interviews identified barriers such as weak time management, limited design experience, and language-related challenges. These students would likely benefit from additional instructional scaffolding, including structured templates and guided support. The findings suggest that genre competence and systems thinking represent related but distinct dimensions of sustainability literacy, requiring differentiated pedagogical strategies to support balanced development (see Appendix A.4).
Similarly, despite strong support for most hypotheses, several findings require an alternative interpretation. Although H1 supposed that genre-based writing instruction would be associated with all five sustainability literacy dimensions, counterargument engagement remained the weakest dimension at T3. This reflect limited instruction on anticipating and responding to opposing viewpoints. While genre pedagogy promotes audience awareness and rhetorical adaptation, it may not explicitly teach counterargument structures such as concession–response strategies. Consequently, students may have grown general genre competence without developing strong counterargument skills. Additionally, integrating counterarguments into infographics is cognitively demanding because students must simultaneously manage visual design, systems thinking, and opposing perspectives. Since evaluations relied on infographics and brief written explanations (approximately 150 words), stronger counterargument abilities may have remained underrepresented.
Similarly, although systems thinking grew (+23.2%, p < 0.001), systems representation scores remained moderate (M = 3.18) and showed weaker correlations with technology use. Students may have understood concepts such as feedback loops, but were unable to represent complex systems visually. This suggests that conceptual understanding and visual representation are distinct competencies. Multigroup analysis found no significant disciplinary differences, yet interviews imply that STEM students tended to create more complex causal diagrams, whereas non-STEM students emphasized narrative clarity. Future studies should examine whether discipline results in different forms of systems representation.
Pedagogical quality was associated with sustainability literacy (β = 0.19, p < 0.001), but its effect was smaller than that of technology integration (β = 0.38). Three explanations are possible: (1) digital tools possess learning affordances that support learning independently of instruction; (2) infographic design encourages self-scaffolding through iterative revision and reflection; and (3) self-reported measures of pedagogical quality may have been affected by selection bias. Future research should use randomized implementation designs to better separate technology effects from instructional quality.
Theoretically, the study integrates Sociocultural Activity Theory, genre theory, and cognitive load theory, operating at macro-, meso-, and micro-levels, respectively. While complementary, these frameworks may generate competing explanations, and the study did not empirically determine which mechanisms were most influential. Future research should directly compare their explanatory power through moderation or latent-class analyses.

7. Conclusions

This study successfully showed that technology-mediated genre writing development, integrated with infographic design, was associated with multidimensional sustainability literacy in higher education. The 21.6% growth in overall Sustainability Literacy, combined with substantial gains in communication competence (27.7%) and systems thinking (23.2%), directly addresses a critical gap in sustainability education: the disconnect between environmental knowledge and actual capacity to communicate sustainability imperatives persuasively to diverse audiences. Students cannot function as environmental advocates without being able to articulate environmental knowledge in ways that resonate with and move others.
The structural equation model conveys associations consistent with theorized mechanisms: technology integration shows correlations with sustainability literacy both directly (β = 0.38) and through genre writing development. These associations align with theoretical predictions but do not prove causal mechanisms. Qualitative analysis identified themes suggesting potential mechanisms: students reported that digital tools helped make abstract systems visible, genre writing instruction appeared to develop audience awareness and rhetorical strategy, and perceived communication efficacy was associated with reported environmental values and commitment. The finding that all five dimensions of sustainability literacy grew—not merely knowledge but also systems thinking, critical evaluation, values, and agency—indicates comprehensive literacy development rather than narrow competency gains.
This study contributes to theory by integrating activity theory, genre pedagogy, and multimodal learning theory into a coherent framework that explains how integrated technologies reshape writing practices. It contributes practically by guiding sustainability educators seeking to grow communication competence alongside environmental knowledge. It contributes methodologically by showcasing how mixed-methods research illuminates both the breadth (statistical effects) and depth (mechanisms) of complex learning interventions. The findings suggest that sustainable higher education should prioritize not merely what students know about environmental issues but also their capacity to communicate that knowledge persuasively—a shift that requires integrating technology, writing instruction, and authentic content. This study reveals that it is both feasible and effective.

8. Implications for Practice and Future Research

8.1. Implications for Practice

Higher education sustainability programs should integrate technology-mediated genre writing with authentic environmental communication projects. Rather than teaching writing and sustainability separately, programs should design courses that enable students to simultaneously acquire genre awareness, technological competence, and environmental understanding by creating persuasive communications about sustainability issues. Institutions should ensure that all sustainability courses have access to user-friendly design platforms (such as Canva, Figma, or similar) with templates, scaffolding systems, and representation. Faculty development should emphasize pedagogical design, ensuring technology serves learning objectives rather than functioning as tool-focused instruction. Critically, institutions should address equity concerns: students with limited prior literacy or technology experience require additional scaffolding, which may require differentiated instruction or prerequisite support. The finding that pedagogical quality and institutional infrastructure both matter indicates that scaling innovations requires systemic institutional support, not merely individual faculty adoption.

8.2. Implications for Future Research

Future research should examine the longitudinal sustainability of these outcomes—do communication competencies persist post-course and transfer to other domains? Studies should investigate which sustainability topics most benefit from infographic-integrated instruction and whether outcomes vary by disciplinary context. Research examining student identity shifts—whether students internalize identities as environmental communicators and advocates—would illuminate mechanisms underlying the development of efficacy.
Future research should: (a) compare counterargument development across text-only vs. multimodal contexts; (b) scaffold explicit counterargument structures within genre-based instruction; (c) examine whether longer written sustainability communications (reports, position papers) show stronger counterargument engagement.
Comparative studies across institution types and student populations would clarify differential implementation effectiveness. Finally, investigations of how this approach reflects not merely with literacy but with actual behavioral change toward environmental action would extend findings beyond learning outcomes to actual sustainability impact.

8.3. Limitations

This study employed a single-group pre–post design rather than a randomized controlled trial with a comparison group. Therefore, growth in sustainability literacy cannot be definitively attributed to the intervention; alternative explanations (passage of time, maturation, concurrent instruction in discipline courses) remain possible. However, the magnitude of growth (21.6% over 16 weeks) and specificity to skill dimensions most directly connected to genre/infographic instruction (communication competence +27.7%) strengthen the inference that the intervention contributed meaningfully. We interpret findings to show that the intervention is associated with gains, not proof of causality.
This study draws on higher education students from the Turkic region (Turkey, North Cyprus, Azerbaijan, Turkmenistan, and Uzbekistan), limiting direct generalizability to other contexts. Outcomes may differ due to variations in technology infrastructure, digital literacy, language accessibility, sustainability priorities, and pedagogical traditions. Participating institutions benefited from adequate internet access, digital design tools, and student-centered learning approaches.
In settings with limited resources, different environmental concerns, or more teacher-centered educational cultures, the effects of technology-mediated genre writing may be weaker or different. Therefore, findings should be interpreted to show that such approaches can be associated with sustainability literacy under supportive conditions. Further research across diverse cultural, institutional, and geographic contexts is needed.

Author Contributions

Conceptualization, T.S.; Methodology, T.S. and M.K.; Investigation, S.K.; Writing—original draft, T.S. and M.K.; Supervision, M.K. and S.K.; Project administration, S.K. All authors have read and agreed to the published version of the manuscript.

Funding

This research received no external funding.

Institutional Review Board Statement

The study was conducted in accordance with the Declaration of Helsinki, and the protocol was approved by the Ethics Committee of Near East University Scientific Research Ethics Committee (NEU/ES/2024/787) on 7 February 2024.

Informed Consent Statement

Informed consent was obtained from all subjects involved in the study.

Data Availability Statement

The original contributions presented in this study are included in the article. Further inquiries can be directed to the corresponding author(s).

Conflicts of Interest

The authors declare no conflict of interest.

Appendix A

Appendix A.1. High Developer Artifact

Sustainability 18 06785 i001

Appendix A.2. Mixed Developer Artifact

Sustainability 18 06785 i002

Appendix A.3. Technical Developer Artifact

Sustainability 18 06785 i003

Appendix A.4. Minimal Developer Artifact

Sustainability 18 06785 i004

Appendix A.5. Artifact Rubric

DimensionScaleDescriptor
Genre Awareness1–5Rhetorical choices reflecting purpose and target audience. Do the infographic’s headline, visual hierarchy, evidence selection, and call to action reflect a clear understanding of genre conventions and rhetorical purpose?
1No clear audience; genre conventions absent; rhetorical choices unstated
2Vague audience awareness; minimal rhetorical choices adapted to the audience
3Moderate audience awareness; some rhetorical choices present but not fully integrated
4Clear audience; coherent rhetorical choices aligned with genre and purpose
5Sophisticated audience adaptation; genre-specific rhetorical moves expertly executed
Systems Representation1–5Visual/textual representation of causal relationships, feedback loops, and system interdependencies. Does the infographic depict sustainability systems as interconnected, showing consequences and trade-offs?
1No causal relationships shown; lists facts or single factors in isolation
2Simple linear causality (A → B); no feedback loops or system boundaries
3Multiple associations shown; minimal feedback; system structure partially visible.
4Clear causal chains with feedback loops; system boundaries and multiple actors are evident.
5Sophisticated systems representation; feedback loops, time delays, leverage points clearly depicted
Visual Clarity1–5Readability, visual hierarchy, and design principles. Can the viewer quickly identify the main ideas and relationships?
1Cluttered, illegible, poor color contrast, unclear hierarchy
2Some organizations; design choices limit readability
3Clear main ideas; adequate hierarchy; moderately readable
4Well-organized visual hierarchy; accessible color/typography; highly readable
5Exemplary design; sophisticated visual communication; high accessibility
Sustainability Argument Quality1–5Coherence of sustainability claim, evidence quality, and reasoning.
1Unsupported claim; no evidence; unclear reasoning
2Claim present; weak or missing evidence; reasoning unclear
3Clear claim with moderate evidence; reasoning follows, but may have gaps
4Well-supported claim; relevant evidence; sound reasoning
5Sophisticated argument; strong evidence; complex reasoning accounting for counterarguments
Counterargument Engagement1–5Anticipation and response to opposing perspectives. Does the artifact acknowledge and address limitations, trade-offs, or alternative views?
1No acknowledgment of alternative views
2Passing mention of counterargument; not substantively addressed.
3Counterargument stated; response present but underarticulated.
4Clear counterargument; thoughtful response showing understanding of opposing view
5Sophisticated engagement with counterarguments; acknowledges trade-offs and complexity.
Call-to-Action Clarity1–5Specificity and motivational quality of the requested action.
1No clear action requested
2Vague call-to-action (e.g., “care about sustainability”)
3Specific action requested; moderate motivational framing
4Clear, specific action; motivational framing present
5Concrete, high-impact action specified; compelling motivation for the audience to act

References

  1. Ironsi, C.S. Navigating learners towards technology-enhanced learning during post-COVID-19 semesters. Trends Neurosci. Educ. 2022, 29, 100189. [Google Scholar] [CrossRef] [Scilit] [PubMed]
  2. Leal Filho, W.; Salvia, A.; Schwarzmüller, F.; Sznelwar, L.; Rayman-Bacchus, L. Higher education as a catalyst for sustainable development: A critical appraisal of the sector. J. Clean. Prod. 2022, 338, 130620. [Google Scholar]
  3. Sterling, S.; Máxime, B.; Luna, E. The Role of Higher Education in the Sustainable Development Goals Agenda. In Handbook of Sustainability; Springer: Berlin/Heidelberg, Germany, 2019; pp. 1223–1241. [Google Scholar]
  4. Zhou, Z.; Ironsi, C.S.; Chune, R. Leveraging interactive digital tools for online business education: Improving academic performances. Int. J. Manag. Educ. 2025, 23, 101135. [Google Scholar] [CrossRef] [Scilit]
  5. Stibbe, A. The Handbook of Sustainability Literacy: Skills for a Changing World; Green Books: Totnes, UK, 2019. [Google Scholar]
  6. Yi, F.; Ironsi, C.S.; Bensen Bostancı, H. Incorporating service-learning projects in teaching sustainability: Promoting participatory climate action within higher education institutions. Int. J. Sustain. High. Educ. 2026, 1–21. [Google Scholar] [CrossRef] [Scilit]
  7. UNESCO. Education for Sustainable Development: A Roadmap; UNESCO: Paris, France, 2020. [Google Scholar]
  8. Sipos, Y.; Batalha, M.; Novo, M. Mainstreaming sustainability in higher education: Transformations in the implementation of the UN decade of education for sustainable development. J. Clean. Prod. 2018, 198, 471–479. [Google Scholar]
  9. Azeiteiro, U.; Bacelar-Nicolau, P.; Caetano, F.; Caeiro, S. Education for sustainable development through e-learning in higher education: Experiences from Portugal. J. Clean. Prod. 2015, 106, 308–319. [Google Scholar] [CrossRef] [Scilit]
  10. Ironsi, C.S. Improving communicative competence levels of pre-service teachers through spoken-based reflection instruction. J. Educ. 2023, 203, 678–689. [Google Scholar]
  11. Ironsi, C.S.; Bostanci, H.B. The efficacy of integrating assistive technology and the CAPE lesson planning framework toward improving students’ speaking skills. Sci. Rep. 2026, 16, 9305. [Google Scholar] [CrossRef] [Scilit] [PubMed]
  12. Summers, M.; Childs, A. Student science aspirations and career choice: Age and gender as mediating factors. Int. J. Sci. Educ. 2007, 29, 1871–1896. [Google Scholar]
  13. Mayer, R.; Fiorella, L. Principles for reducing extraneous processing in multimedia learning. Comput. Educ. 2014, 113, 141–149. [Google Scholar]
  14. Kosslyn, S. Graph Design for the Eye and Mind; Oxford University Press: Oxford, UK, 2006. [Google Scholar]
  15. Mahr, D.; Germelmann, C.; Naderer, B. The neurometric validation of an advertising execution framework. J. Advert. Res. 2019, 59, 227–238. [Google Scholar]
  16. Ozdamli, F.; Ozdal, H. Effectiveness of augmented reality applications in education. Cypriot J. Educ. Sci. 2018, 13, 104–113. [Google Scholar]
  17. Kress, G.; Van Leeuwen, T. Multimodal Discourse: The Modes and Media of Contemporary Communication; Oxford University Press: Oxford, UK, 2020. [Google Scholar]
  18. New London Group. A pedagogy of multiliteracies: Designing social futures. Harv. Educ. Rev. 1996, 66, 60–92. [Google Scholar] [CrossRef] [Scilit]
  19. Avgerinou, M. Towards a Unified Theory of Visual Literacy: An Examination of the Concept(s) Underlying Visual Literacy. Ph.D. Thesis, University of Pennsylvania, Philadelphia, PA, USA, 2007. [Google Scholar]
  20. Papadopoulos, P.; Vidakis, N.; Triantafyllidis, A.; Tsikrika, T.; Vrochidis, S. InfoSenseVis: A visual analytics platform for exploring media misinformation through infographics. In Proceedings of the 2022 ACM International Conference on Multimedia Retrieval; ACM: New York, NY, USA, 2022; pp. 233–239. [Google Scholar]
  21. Swales, J. Genre Analysis: English in Academic and Research Settings; Cambridge University Press: Cambridge, UK, 2017. [Google Scholar]
  22. Avgerinou, M.; Ericson, J. A review of the concept of visual literacy. Br. J. Educ. Technol. 1997, 28, 280–291. [Google Scholar] [CrossRef] [Scilit]
  23. Hyland, K. Genre and Second Language Writing. J. Second Lang. Writ. 2018, 32, 3–15. [Google Scholar]
  24. Johns, A. Genre in the Classroom: Multiple Perspectives; Routledge: London, UK, 2015. [Google Scholar]
  25. Bawarshi, A.; Reiff, M. Genre: An Introduction to History, Theory, Research, and Pedagogy; Parlor Press: West Lafayette, IN, USA, 2010. [Google Scholar]
  26. Ironsi, C.S. Examining perceptions of utilizing augmented reality in hybrid learning environment: Instructors and students perspectives. Foresight 2025, 27, 914–928. [Google Scholar]
  27. Ironsi, C.S. Integrating technology and CAPE framework towards improving the language skills of learners. Educ. Technol. Res. Dev. 2023, 71, 717–736. [Google Scholar]
  28. Clark, R.; Mayer, R. e-Learning and the Science of Instruction: Proven Guidelines for Consumers and Designers of Multimedia Learning; Wiley: Hoboken, NJ, USA, 2016. [Google Scholar]
  29. Waltner, E.; Rieß, W.; Brock, A. Teaching and learning scientific literacy for sustainable development. In Handbook of Sustainability Literacy; Green Books: Totnes, UK, 2019; pp. 112–125. [Google Scholar]
  30. Ironsi, C.S. Google Meet as a synchronous language learning tool for emergency online distant learning during the COVID-19 pandemic: Perceptions of language instructors and preservice teachers. J. Appl. Res. High. Educ. 2022, 14, 640–659. [Google Scholar]
  31. Cebrián, G.; Junyent, M.; Mulà, I. Competencies in Education for Sustainable Development: Exploring the Student Teachers’ Views. Sustainability 2020, 12, 3033. [Google Scholar] [CrossRef] [Scilit]
  32. Stoll-Kleemann, S.; Schmidt, U. Reducing meat consumption in developed and transition countries to counter climate change and biodiversity loss: A review of influence factors. Reg. Environ. Change 2017, 17, 1261–1277. [Google Scholar]
  33. Eckert, S.; Chadha, A. Multiple dimensions of intergenerational climate justice. One Earth 2013, 1, 33–48. [Google Scholar]
  34. Brondizio, E.; Settele, J.; Díaz, S.; Ngo, H. Global Assessment Report on Biodiversity and Ecosystem Services; Intergovernmental Platform on Biodiversity and Ecosystem Services: Bonn, Germany, 2019. [Google Scholar]
  35. Chu, Y.; Ironsi, C.S.; Bensen Bostanci, H.; Ironsi, S.S.; Yi, F. Efficacy of action competence training as a professional development strategy for equipping teachers with ESD readiness. Int. J. Sustain. High. Educ. 2026, 1–21. [Google Scholar] [CrossRef] [Scilit]
  36. Kress, G. Multimodality: A Social Semiotic Approach to Contemporary Communication; Routledge: London, UK, 2017. [Google Scholar]
  37. Swales, J. Discourse Communities and English as an International Language. In The Handbook of TESOL: Teaching and Learning English as an International Language; Oxford University Press: Oxford, UK, 2017; pp. 158–171. [Google Scholar]
  38. Bozkurt, A.; Akgun-Ozbek, E.; Yilmazel, S. Trends in distance education research: A content analysis of journals and conferences in the field. Open Prax. 2015, 7, 173–190. [Google Scholar] [CrossRef] [Scilit]
  39. Clark, R.; Kwinn, A. The Clark Guide to Effective Instruction: Using Visuals to Enhance Learning; Wiley: Hoboken, NJ, USA, 2007. [Google Scholar]
  40. Mayer, R.; Moreno, R. Animation as an aid to dynamic visualization. Educ. Psychol. Rev. 2002, 14, 87–99. [Google Scholar] [CrossRef] [Scilit]
  41. Frikha, A.; Landry, M. An examination of three infographic assessment tools for accuracy of information display. Comput. Sch. 2016, 33, 149–167. [Google Scholar]
  42. Kumar, A.; Krishnan, P.; Rai, S. Cloud computing in supporting collaborative design and learning for construction projects. Procedia Eng. 2017, 196, 694–701. [Google Scholar]
  43. Design-Based Research Collective. Design-based research: An emerging paradigm for educational inquiry. Educ. Res. 2003, 32, 5–8. [Google Scholar] [CrossRef] [Scilit]
  44. Norman, D. The Design of Everyday Things, 2nd ed.; Basic Books: New York, NY, USA, 2013. [Google Scholar]
  45. Devitt, A. Writing Genres; Southern Illinois University Press: Carbondale, IL, USA, 2004. [Google Scholar]
  46. Wiggins, G.; McTighe, J. Understanding by Design, 2nd ed.; Association for Supervision and Curriculum Development: Alexandria, VA, USA, 2005. [Google Scholar]
  47. Engeström, Y. Expansive Learning at Work: Toward a Reconceptualization of Learning and Work. J. Educ. Work 2004, 14, 133–156. [Google Scholar]
  48. Swink, M.; Meltzer, M.; Jacobson, D. Effects of design and quality practices on product performance. J. Prod. Innov. Manag. 2017, 34, 363–378. [Google Scholar] [CrossRef] [Scilit]
  49. Meadows, D. Thinking in Systems: A Primer; Chelsea Green: White River Junction, VT, USA, 2008. [Google Scholar]
  50. Bandura, A. Self-efficacy: The exercise of control. In Organizational Behavior and Human Decision Processes; W.H. Freeman: New York, NY, USA, 1997; Volume 78, pp. 122–147. [Google Scholar]
  51. Creswell, J.; Plano Clark, V. Designing and Conducting Mixed Methods Research, 3rd ed.; Sage Publications: Thousand Oaks, CA, USA, 2018. [Google Scholar]
  52. Johnson, B.; Christensen, L. Educational Research: Quantitative, Qualitative, and Mixed Approaches, 6th ed.; Sage Publications: Thousand Oaks, CA, USA, 2017. [Google Scholar]
  53. Teddlie, C.; Tashakkori, A. Foundations of Mixed Methods Research: Integrating Quantitative and Qualitative Approaches in the Social and Behavioral Sciences, 2nd ed.; Sage Publications: Thousand Oaks, CA, USA, 2009. [Google Scholar]
  54. Muthén, L.; Muthén, B. Mplus User’s Guide: Statistical Analysis with Latent Variables, 8th ed.; Muthén and Muthén: Los Angeles, CA, USA, 2017. [Google Scholar]
  55. Guetterman, T.; Fetters, M.; Creswell, J. Integrating quantitative and qualitative results in health science mixed methods research through joint displays. Ann. Fam. Med. 2015, 13, 554–561. [Google Scholar] [CrossRef] [Scilit] [PubMed]
  56. Tashakkori, A.; Teddlie, C. Mixed Methodology: Combining Qualitative and Quantitative Approaches; Applied Social Research Methods Series; Sage Publications: Thousand Oaks, CA, USA, 2003; Volume 46, pp. 134–161. [Google Scholar]
  57. Cohen, J. Statistical Power Analysis for the Behavioral Sciences, 2nd ed.; Lawrence Erlbaum Associates: Mahwah, NJ, USA, 1988. [Google Scholar]
  58. Maas, C.J.; Hox, J.J. Sufficient sample sizes for multilevel modeling. Methodology 2005, 1, 86–92. [Google Scholar] [CrossRef] [Scilit]
  59. Hu, L.; Bentler, P. Cutoff criteria for fit indexes in covariance structure analysis: Conventional criteria versus new alternatives. Struct. Equ. Model. 1999, 6, 1–55. [Google Scholar] [CrossRef] [Scilit]
  60. Kline, R.B. Principles and Practice of Structural Equation Modeling; Guilford Publications: New York, NY, USA, 2023; p. 24. [Google Scholar]
  61. Raudenbush, S.; Bryk, A. Hierarchical Linear Models: Applications and Data Analysis Methods, 3rd ed.; Sage Publications: Thousand Oaks, CA, USA, 2019. [Google Scholar]
  62. Lincoln, Y.; Guba, E. Naturalistic Inquiry; Sage Publications: Beverly Hills, CA, USA, 1985. [Google Scholar]
  63. Braun, V.; Clarke, V. Using thematic analysis in psychology. Qual. Res. Psychol. 2006, 3, 77–101. [Google Scholar] [CrossRef] [Scilit]
  64. Kirschner, P.; Sweller, J.; Clark, R. Why minimal guidance during instruction does not work: An analysis of the failure of constructivist discovery, problem-based and experiential learning. Educ. Psychol. Rev. 2006, 18, 75–98. [Google Scholar]
  65. Moreno, R.; Mayer, R. Interactive multimodal learning environments. Educ. Psychol. Rev. 2007, 19, 309–326. [Google Scholar] [CrossRef] [Scilit]
  66. Zhang, J.; Zhang, L.J.; Zhu, Y. Development and validation of a genre-based second language (L2) writing self-efficacy scale. Front. Psychol. 2023, 14, 1181196. [Google Scholar] [CrossRef] [Scilit] [PubMed]
  67. Ozdemir, O. A scale development of the sustainability literacy. Educ. Sustain. Soc. (ESS) 2021, 4, 66–72. [Google Scholar] [CrossRef] [Scilit]
  68. Means, B.; Roschelle, J.; Penuel, W.; Yarnall, L.; Dominguez, X. Implementing technology-based reform: Do professional development and technical assistance matter? In Learning from Research: Using Research Evidence to Improve Practice and Solve Problems; National Association of Independent Schools: Washington, DC, USA, 2017; pp. 78–104. [Google Scholar]
  69. Dede, C. Comparing frameworks for 21st century skills. In 21st Century Skills: Rethinking How Students Learn; Solution Tree Press: Bloomington, IN, USA, 2010; pp. 51–76. [Google Scholar]
  70. Niederhauser, D.S.; Perkmen, S. Validation of the intrapersonal technology integration scale: Assessing the influence of intrapersonal factors that influence technology integration. Comput. Sch. 2008, 25, 98–111. [Google Scholar] [CrossRef] [Scilit]
  71. Bengio, S.; Marcel, C.; Marcel, S.; Mariéthoz, J. Confidence measures for multimodal identity verification. Inf. Fusion 2002, 3, 267–276. [Google Scholar] [CrossRef] [Scilit]
Figure 1. Integrated Conceptual Framework for Technology-Mediated Sustainability Literacy Development.
Sustainability 18 06785 g001
Table 1. Summary of studies.
Study DomainKey FindingEffect Size/StrengthConsistencyLimitations
Infographic LearningAssociated with engagementMedium-Large5 of 6 studiesLimited to complex systems
Genre-Based WritingAssociated with writing competenceMedium-LargeConsistent across contextsLess evidence on motivation
Multimodal LearningEngages distinct pathwaysSmall-MediumModerate variabilityContext-dependent
Sustainability KnowledgeKnowledge gains commonSmall-MediumConsistentWeak on action competence
Table 2. Demographics.
Demographic VariableCategoryn%
GenderMale15448.1
Female14745.9
Non-binary134.1
Prefer to specify61.9
Year in SchoolFreshman/Sophomore12840.0
Junior14545.3
Senior/Graduate4714.7
Primary DisciplineSTEM (Eng/Sci)11636.3
Non-STEM20463.8
Note. Total N = 320.
Table 3. Baseline (T1) Descriptive Statistics for Primary Constructs.
ConstructMSDMinMaxα
Technology Integration (T1)2.531.041.005.000.89
Genre Writing Competence (T1)2.780.891.084.960.91
Environmental Knowledge (T1)2.910.821.174.920.81
Systems Thinking (T1)2.670.911.004.890.82
Critical Evaluation (T1)2.880.851.204.950.78
Values and Agency (T1)3.070.911.005.000.84
Communication Competence (T1)2.600.971.004.980.86
Sustainability Literacy (Overall T1)2.910.781.344.880.88
Note. M = mean; SD = standard deviation—all measures on a 1–5 scale. Cronbach’s alpha (α) values indicate internal consistency reliability.
Table 4. Growth Trajectories for Primary Constructs (T1 to T3).
ConstructT1 MT2 MT3 MTotal
Gain
%
Change
Fp
Technology Integration2.533.053.47+0.94+37.2%128.4<0.001
Genre Writing Competence2.783.123.46+0.68+24.5%94.7<0.001
Environmental Knowledge2.913.143.39+0.48+16.5%56.3<0.001
Systems Thinking2.673.003.29+0.62+23.2%102.5<0.001
Critical Evaluation2.883.133.41+0.53+18.4%71.8<0.001
Values and Agency3.073.283.54+0.47+15.3%58.2<0.001
Communication Competence2.602.983.32+0.72+27.7%119.6<0.001
Overall Sustainability Literacy2.913.213.54+0.63+21.6%147.3<0.001
Multimodal Composition Confidence2.543.053.53+0.99+39.0%156.2<0.001
Note. T1 = baseline, T2 = midpoint, T3 = endpoint. All repeated-measures ANOVA results were statistically significant at p < 0.001. All effect sizes (partial η2) exceeded 0.08, indicating medium to large effects.
Table 5. Structural Equation Model Path Coefficients and Fit Statistics.
Path/StatisticCoefficientSEt-Valuep-Value95% CI
Tech Integration > Sustain Literacy (direct)0.380.0458.44<0.001[0.29, 0.47]
Tech Integration > Genre Competence0.520.04112.68<0.001[0.44, 0.60]
Genre Competence > Sustain Literacy0.410.03810.79<0.001[0.34, 0.48]
Pedagogical Quality > Sustain Literacy0.190.0414.63<0.001[0.11, 0.27]
Indirect Effect (Tech-Genre-Sustain)0.210.0268.08<0.001[0.16, 0.26]
Total Effect (Technology Integration)0.590.05111.57<0.001[0.49, 0.69]
CFI0.96
TLI0.95
RMSEA (90% CI)0.039 [0.032, 0.047]
Note. SE = standard error; CI = 95% confidence interval. All path estimates based on N = 320. CFI = Comparative Fit Index; TLI = Tucker–Lewis Index; RMSEA = Root Mean Square Error of Approximation.
Table 6. Artifact Quality Ratings (Endpoint) and Correlations with Technology Integration.
Rating DimensionMSDMedianr with Techp-ValueInterrater ICC
Infographic Genre Awareness3.420.893.50.42<0.0010.82
Infographic Systems Representation3.180.953.00.38<0.0010.79
Infographic Visual Clarity3.510.853.50.46<0.0010.85
Writing a Sustainability Argument3.310.903.30.44<0.0010.81
Writing Evidence Quality3.091.013.00.34<0.0010.76
Writing Counterargument2.781.112.80.31<0.0010.73
Writing Call-to-Action3.180.953.10.39<0.0010.78
Overall Quality Score3.210.783.20.47<0.0010.81
Note. All measures on a 1–5 scale. r = Pearson correlation with Technology Integration Scale. ICC = intraclass correlation coefficient for interrater reliability (two raters, absolute agreement). All correlations are statistically significant at p < 0.05 or better.
Table 7. Thematic analysis.
CodenDescription
Tools visualize complexity26Using design platforms to render abstract systems visible and manipulable
Templates scaffold thinking19Pre-designed templates providing structural guidance for systems representation
Visual iteration reveals relationships17Revising and refining visual designs, revealing new causal connections
Disclaimer/Publisher’s Note: The statements, opinions and data contained in all publications are solely those of the individual author(s) and contributor(s) and not of MDPI and/or the editor(s). MDPI and/or the editor(s) disclaim responsibility for any injury to people or property resulting from any ideas, methods, instructions or products referred to in the content.