Article

Sustainability-Oriented Multi-Objective Optimization Design of Service Area Buildings Configured with Energy-Saving Glass Based on NSGA-II

1
CCCC Second Highway Consultants Co., Ltd., Wuhan 430056, China
2
School of Civil Engineering and Architecture, Wuhan University of Technology, Wuhan 430070, China
3
Sanya Science and Education Innovation Park, Wuhan University of Technology, Sanya 572024, China
*
Author to whom correspondence should be addressed.
Sustainability 2026, 18(13), 6709; https://doi.org/10.3390/su18136709
Submission received: 7 June 2026 / Revised: 28 June 2026 / Accepted: 30 June 2026 / Published: 2 July 2026

Abstract

Building energy consumption accounts for a significant proportion of total societal energy consumption, and reducing building energy consumption is critical to the global mission of reducing emissions. Windows are regarded as the least energy-efficient component of a building’s envelope. This study examines service-area buildings fitted with high-performance glass in Chinese cities across various climates and employs the non-dominated sorting genetic algorithm II (NSGA-II) genetic algorithm for multi-objective optimization. In considering design variables such as building orientation and wall insulation, advanced passive design strategies, including electrochromic and aerogel glass, are incorporated into the optimization process to minimize construction costs and operational carbon emissions. Sensitivity analyses were conducted to evaluate the impact of each design variable on building operational carbon emissions. The optimal solution within the Pareto optimal set was further evaluated using the technique for order preference by similarity to ideal solution (TOPSIS) decision-making method, and the preferred energy-saving solution was quantitatively analyzed. The results indicate that optimization leads to a reduction of approximately 7.70–10.50% in annual operational carbon emissions for service-area buildings across different regions, compared to the base case, with a payback period ranging from 4.90 to 13.56 years. The proposed method contributes to sustainable building design by jointly quantifying carbon-emission reduction, construction cost, and payback period, thereby supporting climate-responsive and economically feasible low-carbon envelope decisions for service-area buildings.

1. Introduction

Global warming will trigger a range of extreme weather events and natural disasters, such as rising sea levels, droughts, and melting glaciers [1]. The Paris Agreement emphasizes the critical importance of reducing carbon emissions and conserving energy. According to the International Energy Agency’s (IEA) Energy Statistics Report, buildings consume nearly one-third of final energy demand [2]. Reducing energy consumption in buildings will play an important role in the global mission to reduce emissions, given the large proportion of energy consumption in buildings in the total energy consumption of society. From the perspective of sustainable development, building design should also provide measurable carbon-reduction benefits and economically viable strategies that can be adopted in practice. Research indicates that decisions made during the early design stage significantly influence a building’s energy efficiency [3]. Therefore, adopting an optimal passive design approach during this stage is a key strategy for reducing building energy consumption and improving the sustainability performance of the built environment.
In the passive building design process, design parameters and building performance are usually high-dimensional, computationally intensive, and difficult to make design decisions that are difficult to compare and select by manual means [4]. Consequently, multi-objective optimization of building performance using building performance simulation procedures and optimization algorithms has been widely employed. The research objectives are generally categorized into five main types: economic cost, environmental impact, building energy, indoor thermal comfort, and other related objectives. Passive design strategies for buildings are diverse, with commonly used design variables including orientation [5,6], windows [7,8,9],window-to-wall ratio (WWR) [10,11], shading measures [12], wall insulation [13,14], and roof insulation [15,16]. In fact, local climatic conditions are also a key factor affecting passive design, and numerous studies have explored the optimization of buildings across various climatic regions [17,18,19,20]. Additionally, sensitivity analyses were conducted to evaluate the impact of various design variables on building performance, allowing for the elimination of variables with minimal effect, thereby conserving computational resources [21,22,23,24].
Relevant studies have shown that on average 75% of heat loss/gain occurs in the building envelope [25]. Therefore, the selection of a high-performance envelope at the design stage is critical to improving building energy efficiency. Windows are typically the least energy-efficient component of a building envelope [26]. For buildings with high WWR, selecting high-performance windows is an effective strategy to enhance energy efficiency. In recent years, various methods have been proposed to enhance the thermal performance of windows, including the use of vacuum glass, multilayer glass, coated glass, smart glass, and the integration of materials with exceptional properties into the glass cavity. Smart glass technology can be broadly classified into three types: electrochromic, photochromic, and thermochromic. Electrochromic glass that could demonstrate outstanding light/thermal management efficiency by switching rapidly from the bleached to colored state upon an applied external voltage [27]. Numerous studies have demonstrated that electrochromic windows are effective in reducing building energy consumption, although their efficiency is influenced by geographical location [28,29,30,31]. Aerogels are commonly used in building envelopes due to their low thermal conductivity, superior insulation, and acoustic properties [32,33,34]. The incorporation of aerogel as a filler in multilayer glass units allows the production of aerogel glazing systems (AGS), which are regarded as one of the most promising energy-saving glazing systems [35].
Based on the existing literature, most studies that incorporate windows with other design variables for multi-objective optimization primarily focus on variations in the U-value and solar heat gain coefficient (SHGC), without considering high-performance glazing, such as smart glass, as an optimization variable. Although multi-objective optimization applies to various building types, research on its application to service area buildings remains relatively scarce. Service-area buildings are public facilities in transport infrastructure networks; improving their envelope performance can support sustainable operation by reducing operational carbon emissions while controlling investment cost. Therefore, this paper conducts a multi-objective optimization study for a typical service area building with a high WWR. This study incorporates advanced passive design strategies, such as smart glazing systems, into the optimization variables, taking into account design factors such as building orientation and wall insulation, to minimize construction costs and operational carbon emissions. The optimization algorithm employed is the NSGA-II genetic algorithm, which is widely used in multi-objective optimization for building design. Sensitivity analysis was performed to assess the impact of design variables on carbon emissions from building operations. The optimal design solutions for varying preferences were quantitatively evaluated using the TOPSIS decision-making method. The framework therefore links carbon-emission measurement, economic evaluation, and climate-specific passive design to support sustainable decision-making for service-area buildings.

2. Materials and Methods

In this paper, the multi-objective optimization design process is organized into the following stages: (1) developing a base case model using field survey data, (2) establishing the optimization methodology, (3) performing a sensitivity analysis of the building’s annual operational carbon emissions, (4) conducting a decision analysis of the optimization results, and (5) drawing conclusions. To strengthen the sustainability evaluation, the workflow quantifies operational carbon emissions, construction costs, and payback periods for alternative envelope design strategies. This section provides a detailed description of the model development process and the research methodology applied at each stage.

2.1. Base Case Building

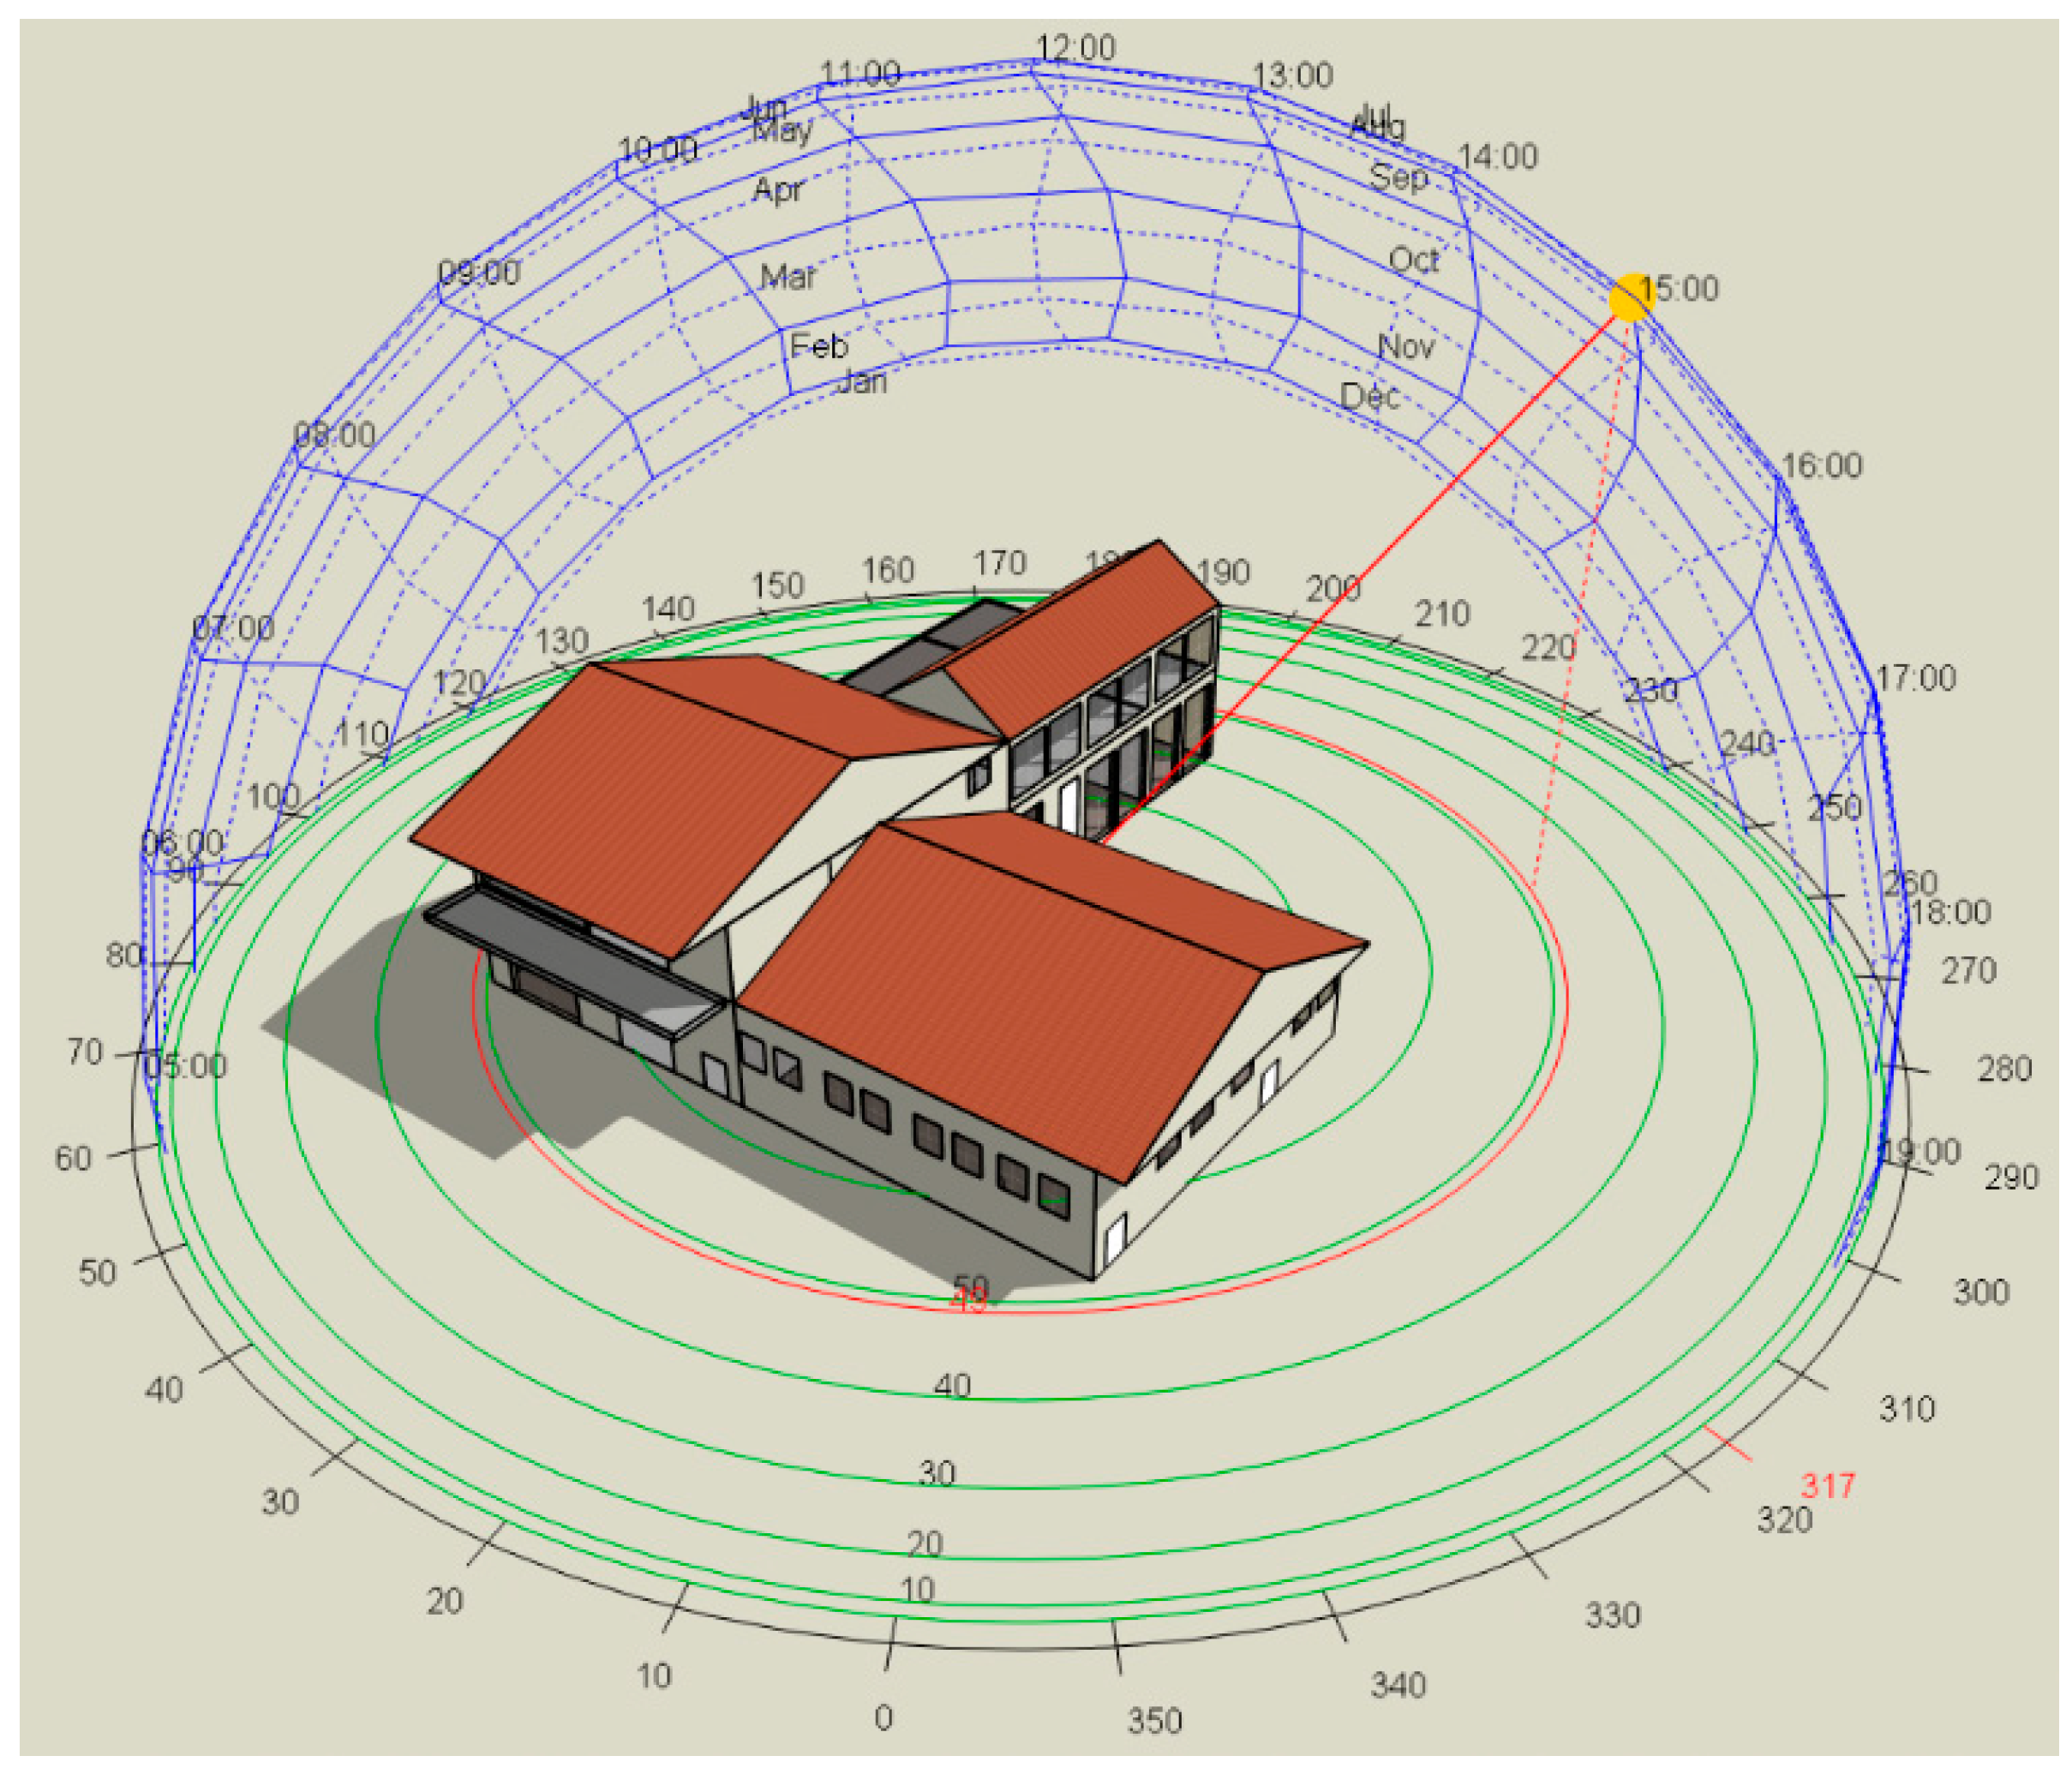
A typical service area building with a high WWR was selected as the case study for this research, and the building prototype is depicted in Figure 1. All relevant building data were collected through a field survey.
Table 1 presents the building information and simulation parameters. The total floor area of the building is 1554 m2, with 963 m2 dedicated to air-conditioned spaces. The building consists of two floors: the first floor includes a lobby, supermarket, toilets, and storerooms, while the second floor houses a restaurant.
Building energy simulations were conducted using DesignBuilder Version 7.3 (DesignBuilder Software Ltd., Stroud, UK, 2023) [36]. DesignBuilder is a graphical building performance simulation platform that integrates the EnergyPlus dynamic simulation engine. It enables detailed modeling and analysis of building geometry, envelope properties, internal loads, HVAC systems, daylighting, thermal comfort, and energy consumption. In this study, DesignBuilder was employed to calculate the operational energy consumption of the service-area building under different climatic conditions and passive design configurations [37].
The window dimensions and building envelope were modeled based on the actual architectural design drawings. The indoor heating and cooling set temperatures were established according to GB 50189-2015 [38], “Design Standard for Energy Efficiency of Public Buildings,” with values of 22 °C and 25 °C, respectively. The lighting control type is Linear/off, with two control zones per room.
The multi-objective optimal design of buildings exhibits significant variability across different climate zones. Hence, this study selected four representative cities in China—Guangzhou, Wuhan, Beijing, and Harbin—which correspond to the Hot-Summer Warm-Winter, Hot-Summer Cold-Winter, Cold, and Severe Cold Region, respectively. The heating and cooling season divisions for each climate zone are presented in Table 2.

2.2. Multi-Objective Optimization

Building energy-saving design optimization refers to the gradual realization of intelligent adjustment and optimization of the design scheme based on the building performance simulation procedure and the set optimization goal, driven by the optimization algorithm. The mathematical formulation for a general multi-objective optimization problem is as follows [39]:
min x   F x = f 1 x , f 2 x , , f k x T
Subject to
g i x 0 , i = 1 , , m
h j ( x ) = 0 , j = 1 , , q
Here x R n is the vector of design variables, and n is the number of decision variables. Also k 2 is the number of objective functions, and f ( x ) R k is their vector, where f i ( x ) : R n R 1 . In addition, m and g ( x ) are the number of inequality constraints and their vector, respectively. Similarly, q and h ( x ) is the number of equality constraints and their vector. Finally, X and S are the feasible decision and criterion spaces, respectively.

2.2.1. Optimization Objectives

This study presents a multi-objective optimization framework that aims to reduce the annual operational carbon emissions of the target building through passive design strategies. High-performance glazing can reduce undesirable solar heat gain and heat transfer through windows, while increasing the thickness of wall insulation can decrease heat transfer through the exterior walls. These measures can therefore reduce the heating and cooling energy demand of the building and the associated operational carbon emissions. However, as the thermal performance of the building envelope improves, the additional reduction in energy consumption and carbon emissions may gradually diminish, whereas the initial construction cost may continue to increase. Therefore, annual operational carbon emissions and construction cost were selected as the two optimization objectives to identify design solutions that achieve an appropriate balance between environmental and economic performance. This objective setting is consistent with sustainability-oriented design because it seeks low-carbon solutions that are also practical for engineering application.
Operational carbon emissions are calculated through energy consumption and carbon emission factors for the corresponding energy sources. Energy consumption in the base case building is mainly for lighting, air conditioning and other equipment, all of which are powered by electricity. Accordingly, this study assumes that all energy used in the building is sourced from electricity. Construction costs refer to the basic costs of building and site construction. The research objectives of this study are summarized as follows:
f 1 ( x ) = C o p = E o p × E F e l e c
f 2 ( x ) = C c o n
where C o p is the annual operational carbon emissions, kg ; E o p is the annual operational energy consumption, kWh ; E F e l e c is the electricity carbon emission factor, kgCO2/kWh; C c o n is the construction cost of the building. The electricity carbon emission factor used in this study is 0.5568 kg CO2e/kWh.

2.2.2. Decision Variables

Carbon emissions from building operations are influenced by numerous design variables. Considering all of these variables simultaneously would require substantial computational resources and incur high costs. To reduce the solution space and enhance computational efficiency, the research variables in this study were selected based on existing literature and prior research. The decision variables for the optimization problem include seven discrete design parameters: glazing type, building orientation, exterior wall and roof U-values, solar absorption coefficients for the façade and roof surfaces, and shading measures. In this case, the U-values of the exterior walls and roofs are determined by adjusting the thickness of the insulation layer in the building envelope. The initial values and ranges of variation for the decision variables are presented in Table 3.
The ranges of the decision variables presented in Table 3 were determined based on a combination of engineering practice, relevant building energy design standards, and values reported in previous studies. For envelope-related parameters such as wall and roof U-values, the ranges were selected according to commonly adopted insulation levels in building energy efficiency design. The orientation range reflects the feasible rotation angles of the building layout in practical design scenarios. For glazing systems, discrete options were defined based on commercially available high-performance glazing technologies. In addition, shading depth and surface solar absorptivity values were set within typical design limits to ensure both physical realism and applicability in architectural design practice.
In the optimization process, four types of glazing systems are selected as research variables: double glazing system (DGS), electrochromic glass system (EGS), aerogel glass system (AGS), and thermal diode glass system (TDGS). Notably, most of these glazing systems are considered high-performance glass. This study also focuses on the impact of incorporating these advanced passive design strategies into the optimization variables on building performance. The structural and performance parameters of the glazing systems are provided in Table 4.

2.2.3. Optimization Algorithms

This paper implements multi-objective optimization design using the DesignBuilder optimization module, which is based on the NSGA-II genetic algorithm for solution optimization. The NSGA-II algorithm, proposed by Deb et al. in 2002, is considered one of the most efficient multi-objective evolutionary algorithms [40]. The algorithm is widely used in multi-objective optimization research for passive building design due to its advantages, including fast running speed, good convergence of the solution set, and low computational complexity. Before implementing the NSGA-II algorithm, key parameters, such as population size, crossover rate, mutation rate, and iteration number, need to be set. It is important to note that the setting of these parameters is crucial for the algorithm’s performance. To achieve optimal algorithm performance, this paper refers to existing studies to rationalize the configuration of these parameters, with the specific values presented in Table 5.

2.3. Sensitivity Analysis

Sensitivity analysis (SA) determines the relative importance of different design variables, thereby guiding subsequent design decisions. Therefore, selecting the appropriate sensitivity analysis method is crucial. In building performance analysis, sensitivity analysis methods are primarily categorized into two types: local sensitivity analysis and global sensitivity analysis. The former is simpler and computationally less expensive; however, it does not account for interactions between variables and may yield misleading results when applied to complex models. As a result, it has become less commonly used in building performance analysis in recent years. In contrast, global sensitivity analysis is regarded as a more reliable and accurate technique and is the most widely used method in this area of research. Its primary methods include regression, screening-based, variance-based, and meta-modeling approaches. Among these, the regression method is fast, easy to understand, and implement, so this study employs the regression model for sensitivity analysis. Standardized regression coefficients (SRC) are used to quantify the degree of influence that design variables have on output variables. A larger absolute value of SRC indicates a greater effect of the design variable on the output variable, while a smaller absolute value suggests a lesser effect. The standardized regression coefficient is calculated using Equation (4):
S R C j = β j i = 1 N ( x i j x ¯ ) 2 N 1 1 / 2 i = 1 N ( y i y ¯ ) 2 N 1 1 / 2
where y i is the output response, β 0 is the constant, β j is the regression coefficient, x i j is the input variable, ε i is an approximate error, y ¯ is the mean of y i , and y ^ i is the predicted value of y i by the model.
Exploring all design options in sensitivity analysis demands considerable time and computational resources. To reduce the number of simulations and minimize computational costs, the Latin Hypercube Sampling (LHS) method is employed for efficient sampling of design variables in this study. The LHS method requires fewer samples than random sampling and converges more quickly, while maintaining the same statistical accuracy. The LHS sample size is typically recommended to be at least ten times the number of design variables. To ensure result accuracy, the sample size in this study is set to 500.

2.4. TOPSIS Decision-Making

Operational carbon emissions and construction costs are often conflicting objectives. As one objective decreases, the other tends to increase, and it is not feasible to minimize both objectives at the same time. Therefore, solving a multi-objective optimization problem yields not a single optimal solution, but a set of Pareto-optimal solutions. The trade-offs and prioritization between objectives must be considered when selecting the final solution. This study employs a comprehensive TOPSIS evaluation method to determine the optimal strategy for each city. The method calculates the Euclidean distance between each solution on the Pareto front and the ideal solution, selecting the solution with the shortest distance as the optimal one. The detailed calculation process is outlined below.
A total of t Pareto-optimal solution sets, and two optimization objectives are established as evaluation metrics. Initially, all data are standardized, followed by the normalization of the resulting matrix. Let the normalized matrix be denoted as Z. In matrix Z, the maximum value of each column defines the optimal solution vector z + , while the minimum value of each column defines the worst solution vector z :
Z + = [ Z 1 + , Z 2 + ] = [ max z 11 , z 21 , , z t 1 , max z 12 , z 22 , , z t 2 ] Z = [ Z 1 , Z 2 ] = [ min z 11 , z 21 , , z t 1 , min z 12 , z 22 , , z t 2 ]
Calculate the proximity of each evaluation object to the optimal solution, and the worst solution D i +   D i :
D i + = j = 1 2 w j ( Z j + z i j ) 2 D i = j = 1 2 w j ( Z j z i j ) 2
where w j is the weight of the jth attribute. Calculate the score S i of the ith evaluation object, the larger S i is the closer it is to the optimal solution ( 0 S i 1 ):
S i = D i D i + + D i
In this study, the payback period is employed to assess the economic viability of the optimal solution, calculated using the following equation:
P P = C O C C B C C B O C O O
Here, C O C is the construction cost of the optimal solution; C B C is the construction cost of the base case; C B O is the operating cost of the base case; and C O O is the operating cost of the optimal solution.

3. Analysis and Discussion of Results

3.1. Analysis of the Optimization Search Results

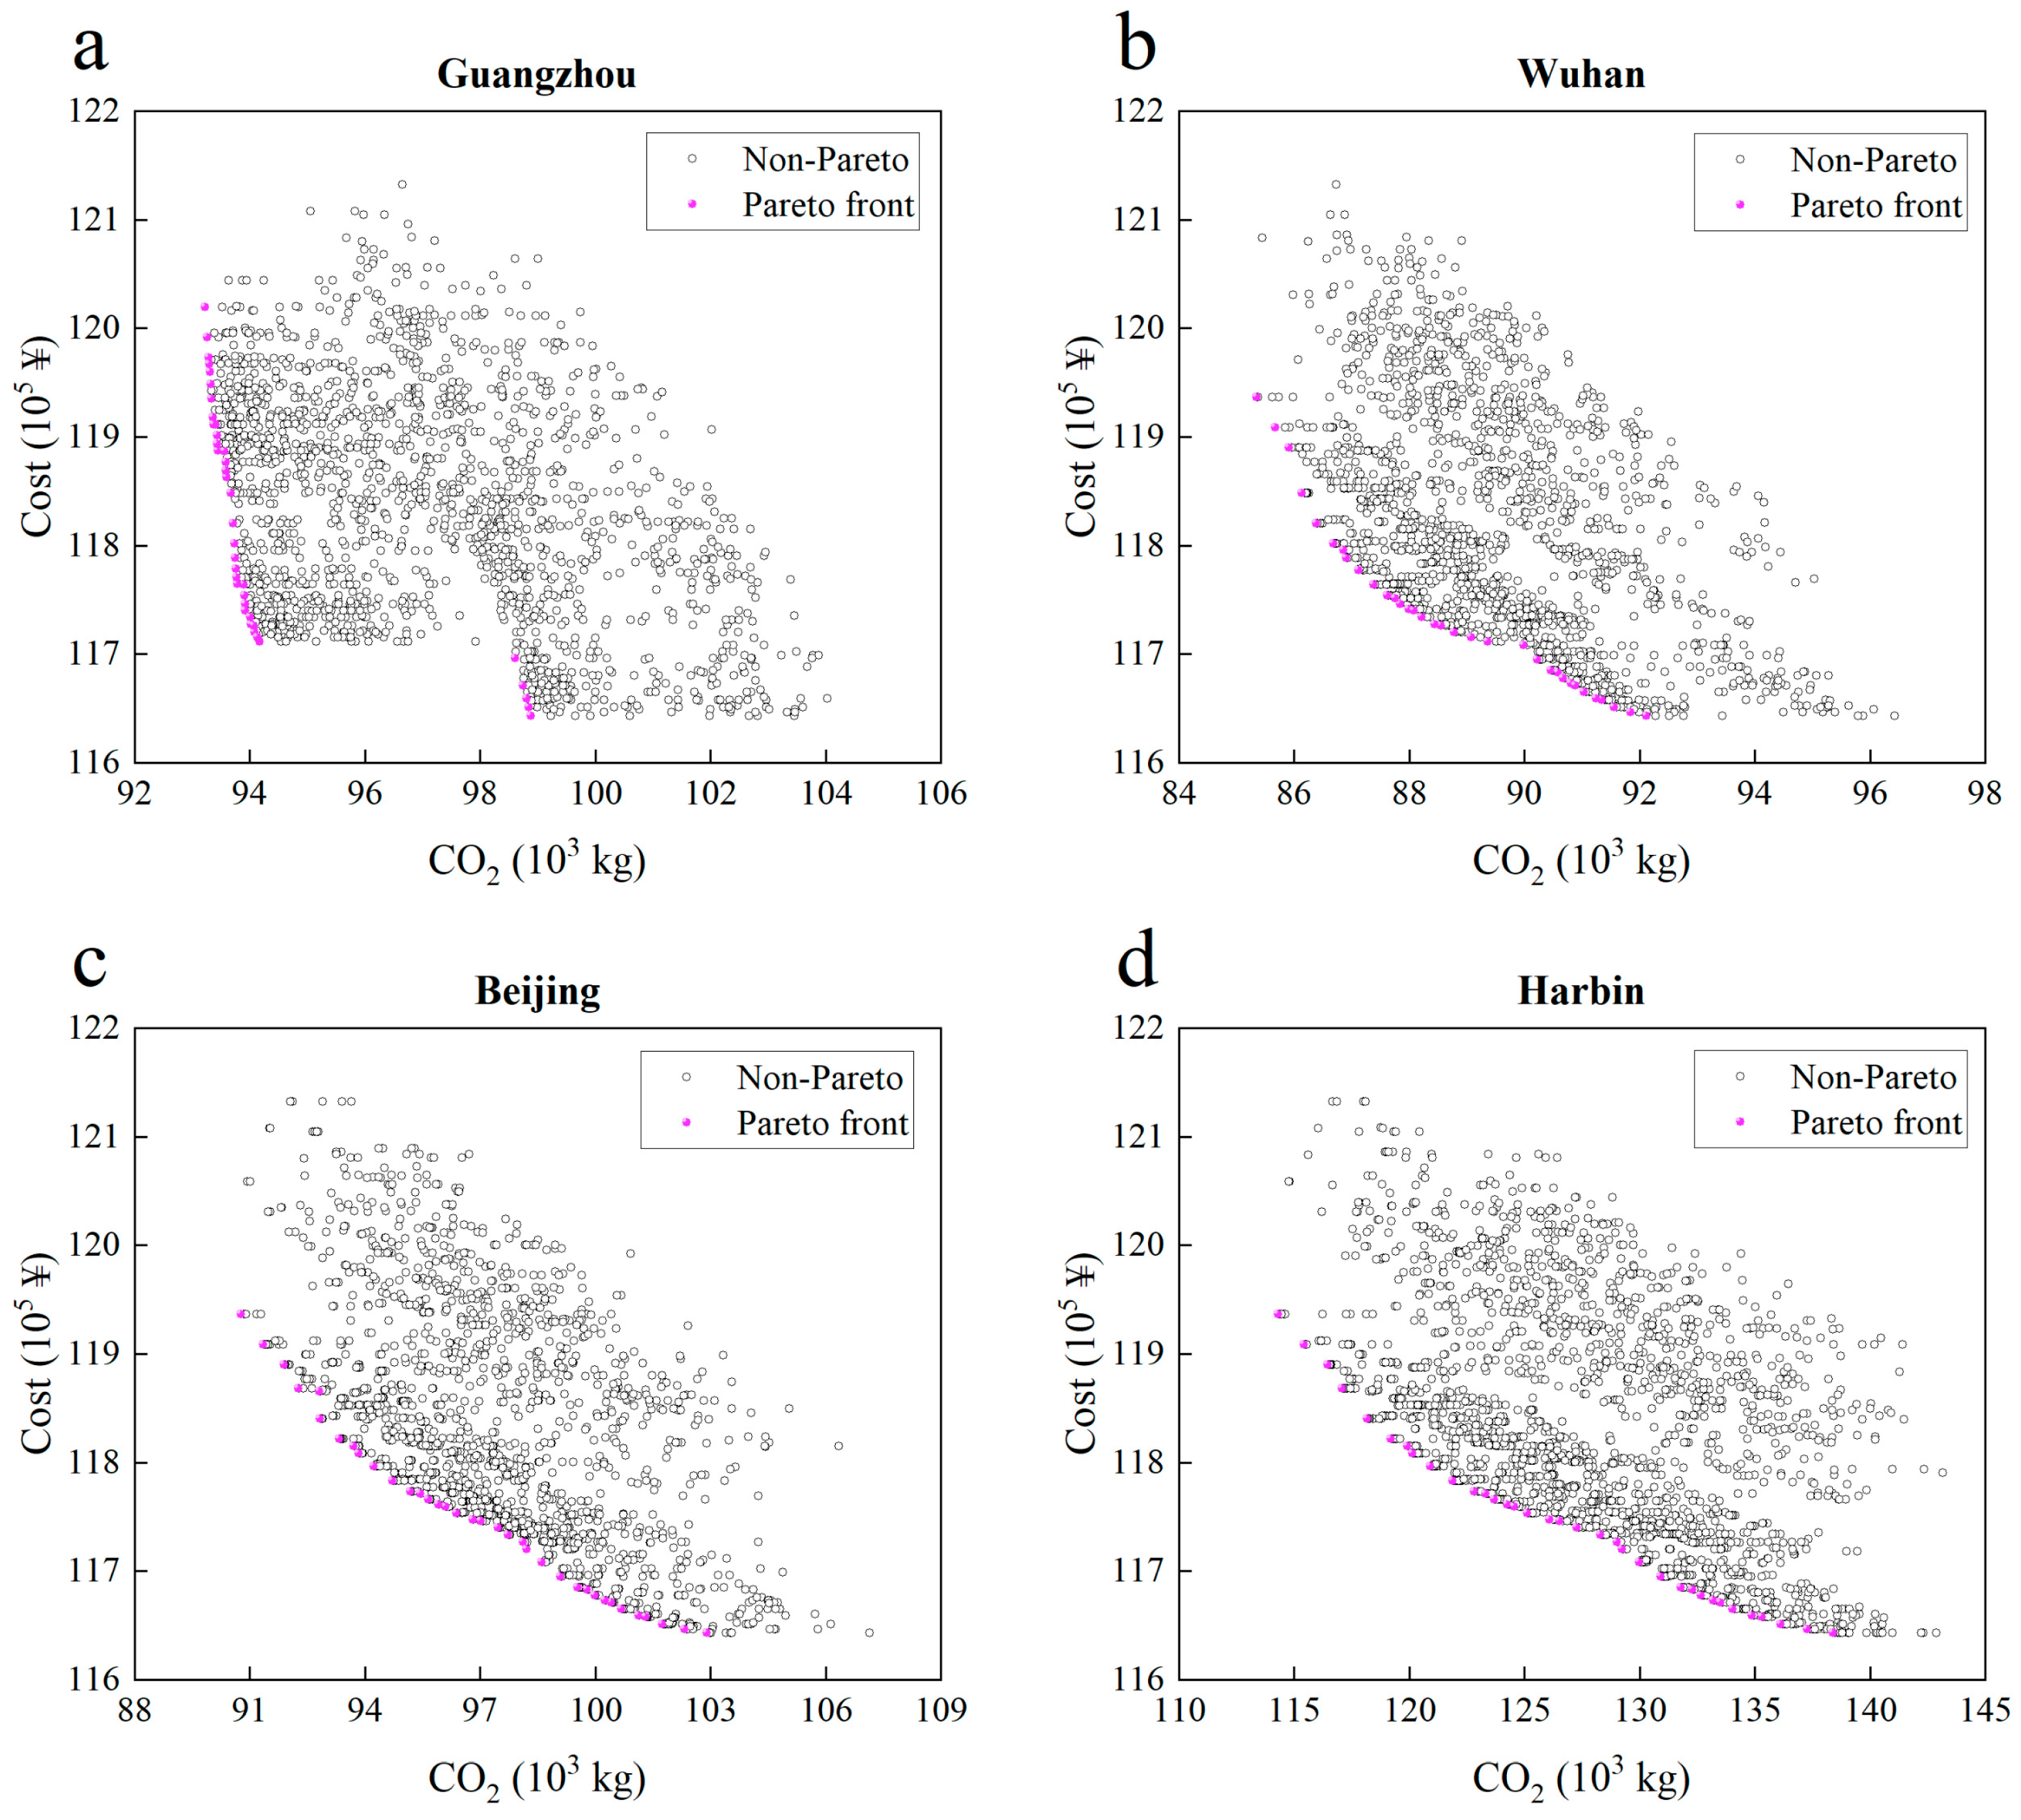
Based on the defined optimization objectives and passive design variables, the optimization results were obtained using the NSGA-II genetic algorithm in DesignBuilder, as shown in Figure 2. After iterations, the optimization process converged for all four climate zones. The optimization results are presented using the Pareto method, with purple points indicating Pareto optimal solutions and gray points representing infeasible solutions. Specifically, there are 39 Pareto-optimal solutions in the Hot-Summer Warm-Winter Region, 34 in the Hot-Summer Cold-Winter Region, 36 in the Cold Region, and 35 in the Severe Cold Region. The Pareto optimal solutions clearly illustrate the relationship between the two optimization objectives: as construction costs increase, operational carbon emissions decrease accordingly.
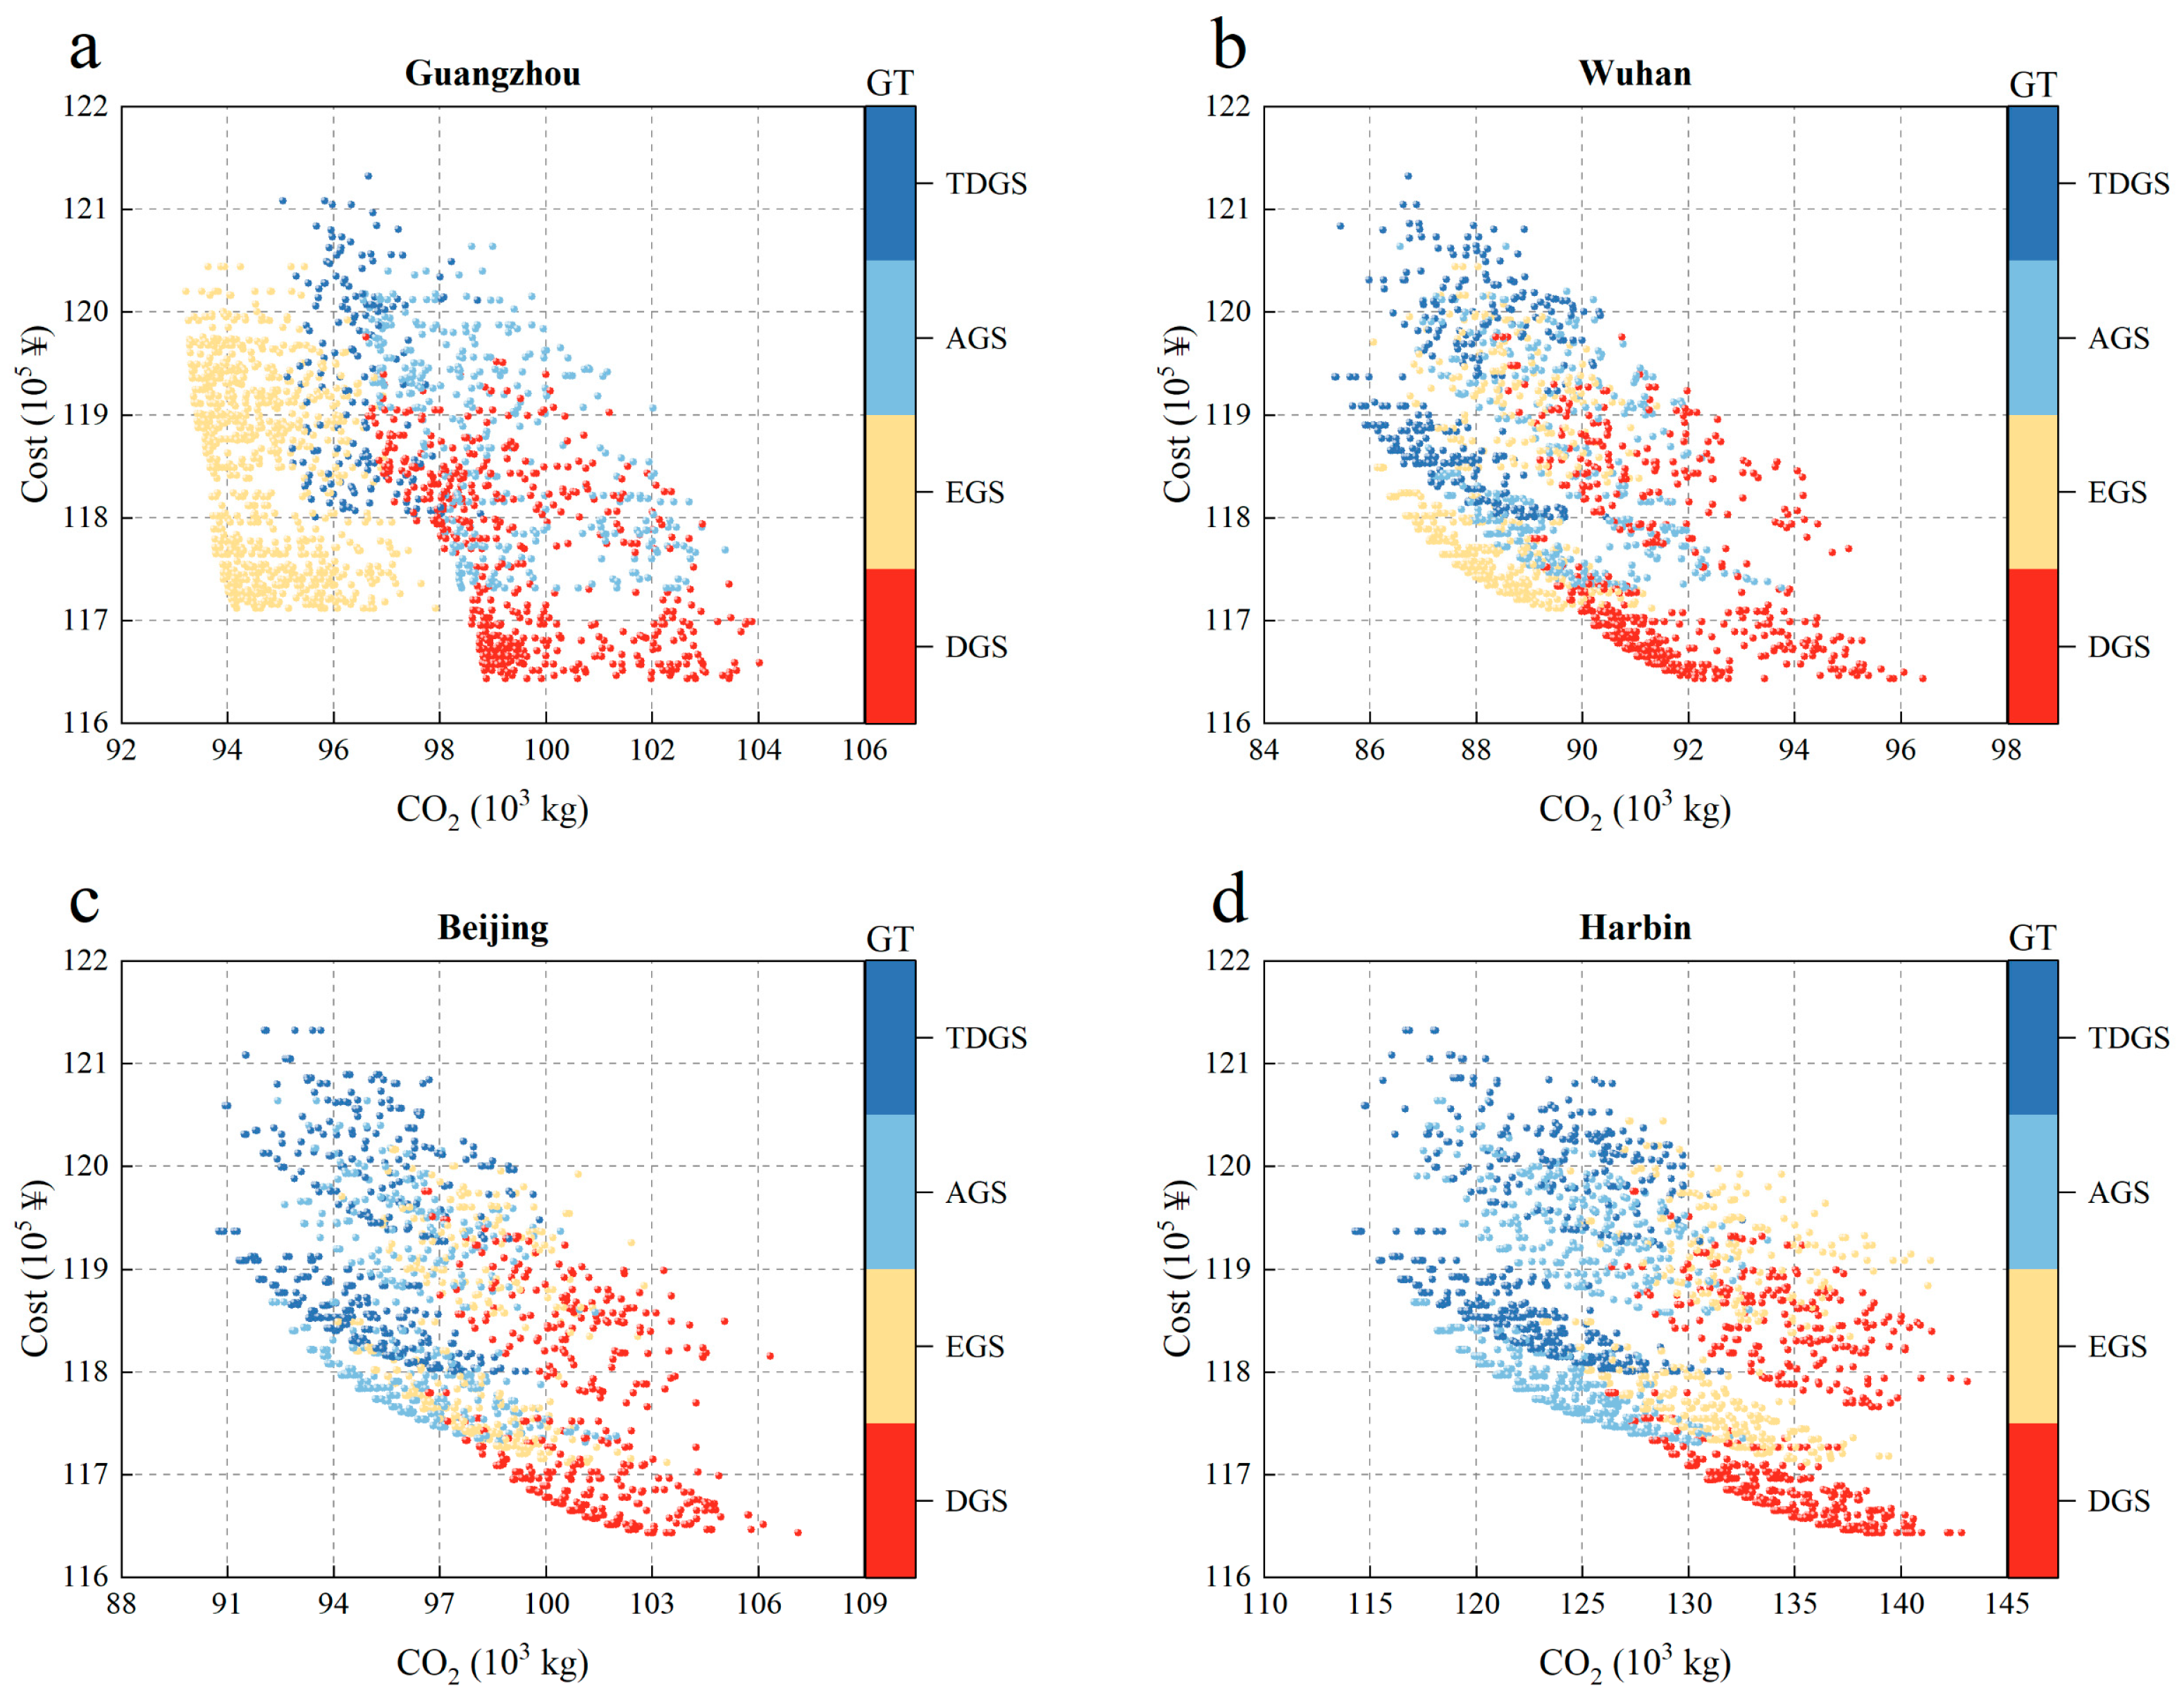
To better understand the impact of different glazing systems on the optimization objectives, the optimization results are colored according to the type of glazing system, as shown in Figure 3a–d. As shown in the figures, regardless of the city, buildings with double-glazing systems exhibit the lowest construction costs but tend to have the highest operational carbon emissions. In Guangzhou, buildings with electrochromic glazing systems (EGS) significantly reduce operational carbon emissions, while aerogel glazing systems (AGS) and thermal diode glazing systems (TDGS) are ineffective in this region. This is because there is no heating season in Guangzhou, and the low U-value of the glazing system does not significantly reduce air-conditioning energy consumption. Additionally, the visible light transmittance of AGS and TDGS is lower than that of EGS during the non-cooling season, which substantially increases lighting energy consumption. The increase in lighting energy consumption is higher than the decrease in air-conditioning energy consumption, leading to higher annual operational carbon emissions.
In Wuhan, the most energy-efficient buildings are those equipped with TDGS, followed by EGS, while AGS is unsuitable for this region. This is because, in this region, AGS reduces heating energy consumption in winter compared to EGS, but also increases lighting and cooling energy consumption. The reduction in heating energy consumption is insufficient to offset the increase in lighting and cooling energy consumption, resulting in higher annual operational carbon emissions.
In the Beijing and Harbin regions, which exhibit similar distribution patterns, the most energy-efficient buildings are those equipped with TDGS, followed by AGS, while EGS is unsuitable for both regions. This is because both regions are heating-dominated, and while EGS can reduce cooling energy consumption, AGS significantly reduces heating energy consumption due to its lower U-value, resulting in lower operational carbon emissions for the building. The Harbin region has lower temperatures and a longer heating season than Beijing, making AGS more effective than EGS in reducing carbon emissions during building operation. This is reflected in the figure, where the distribution of EGS solutions is farther from the Pareto front.
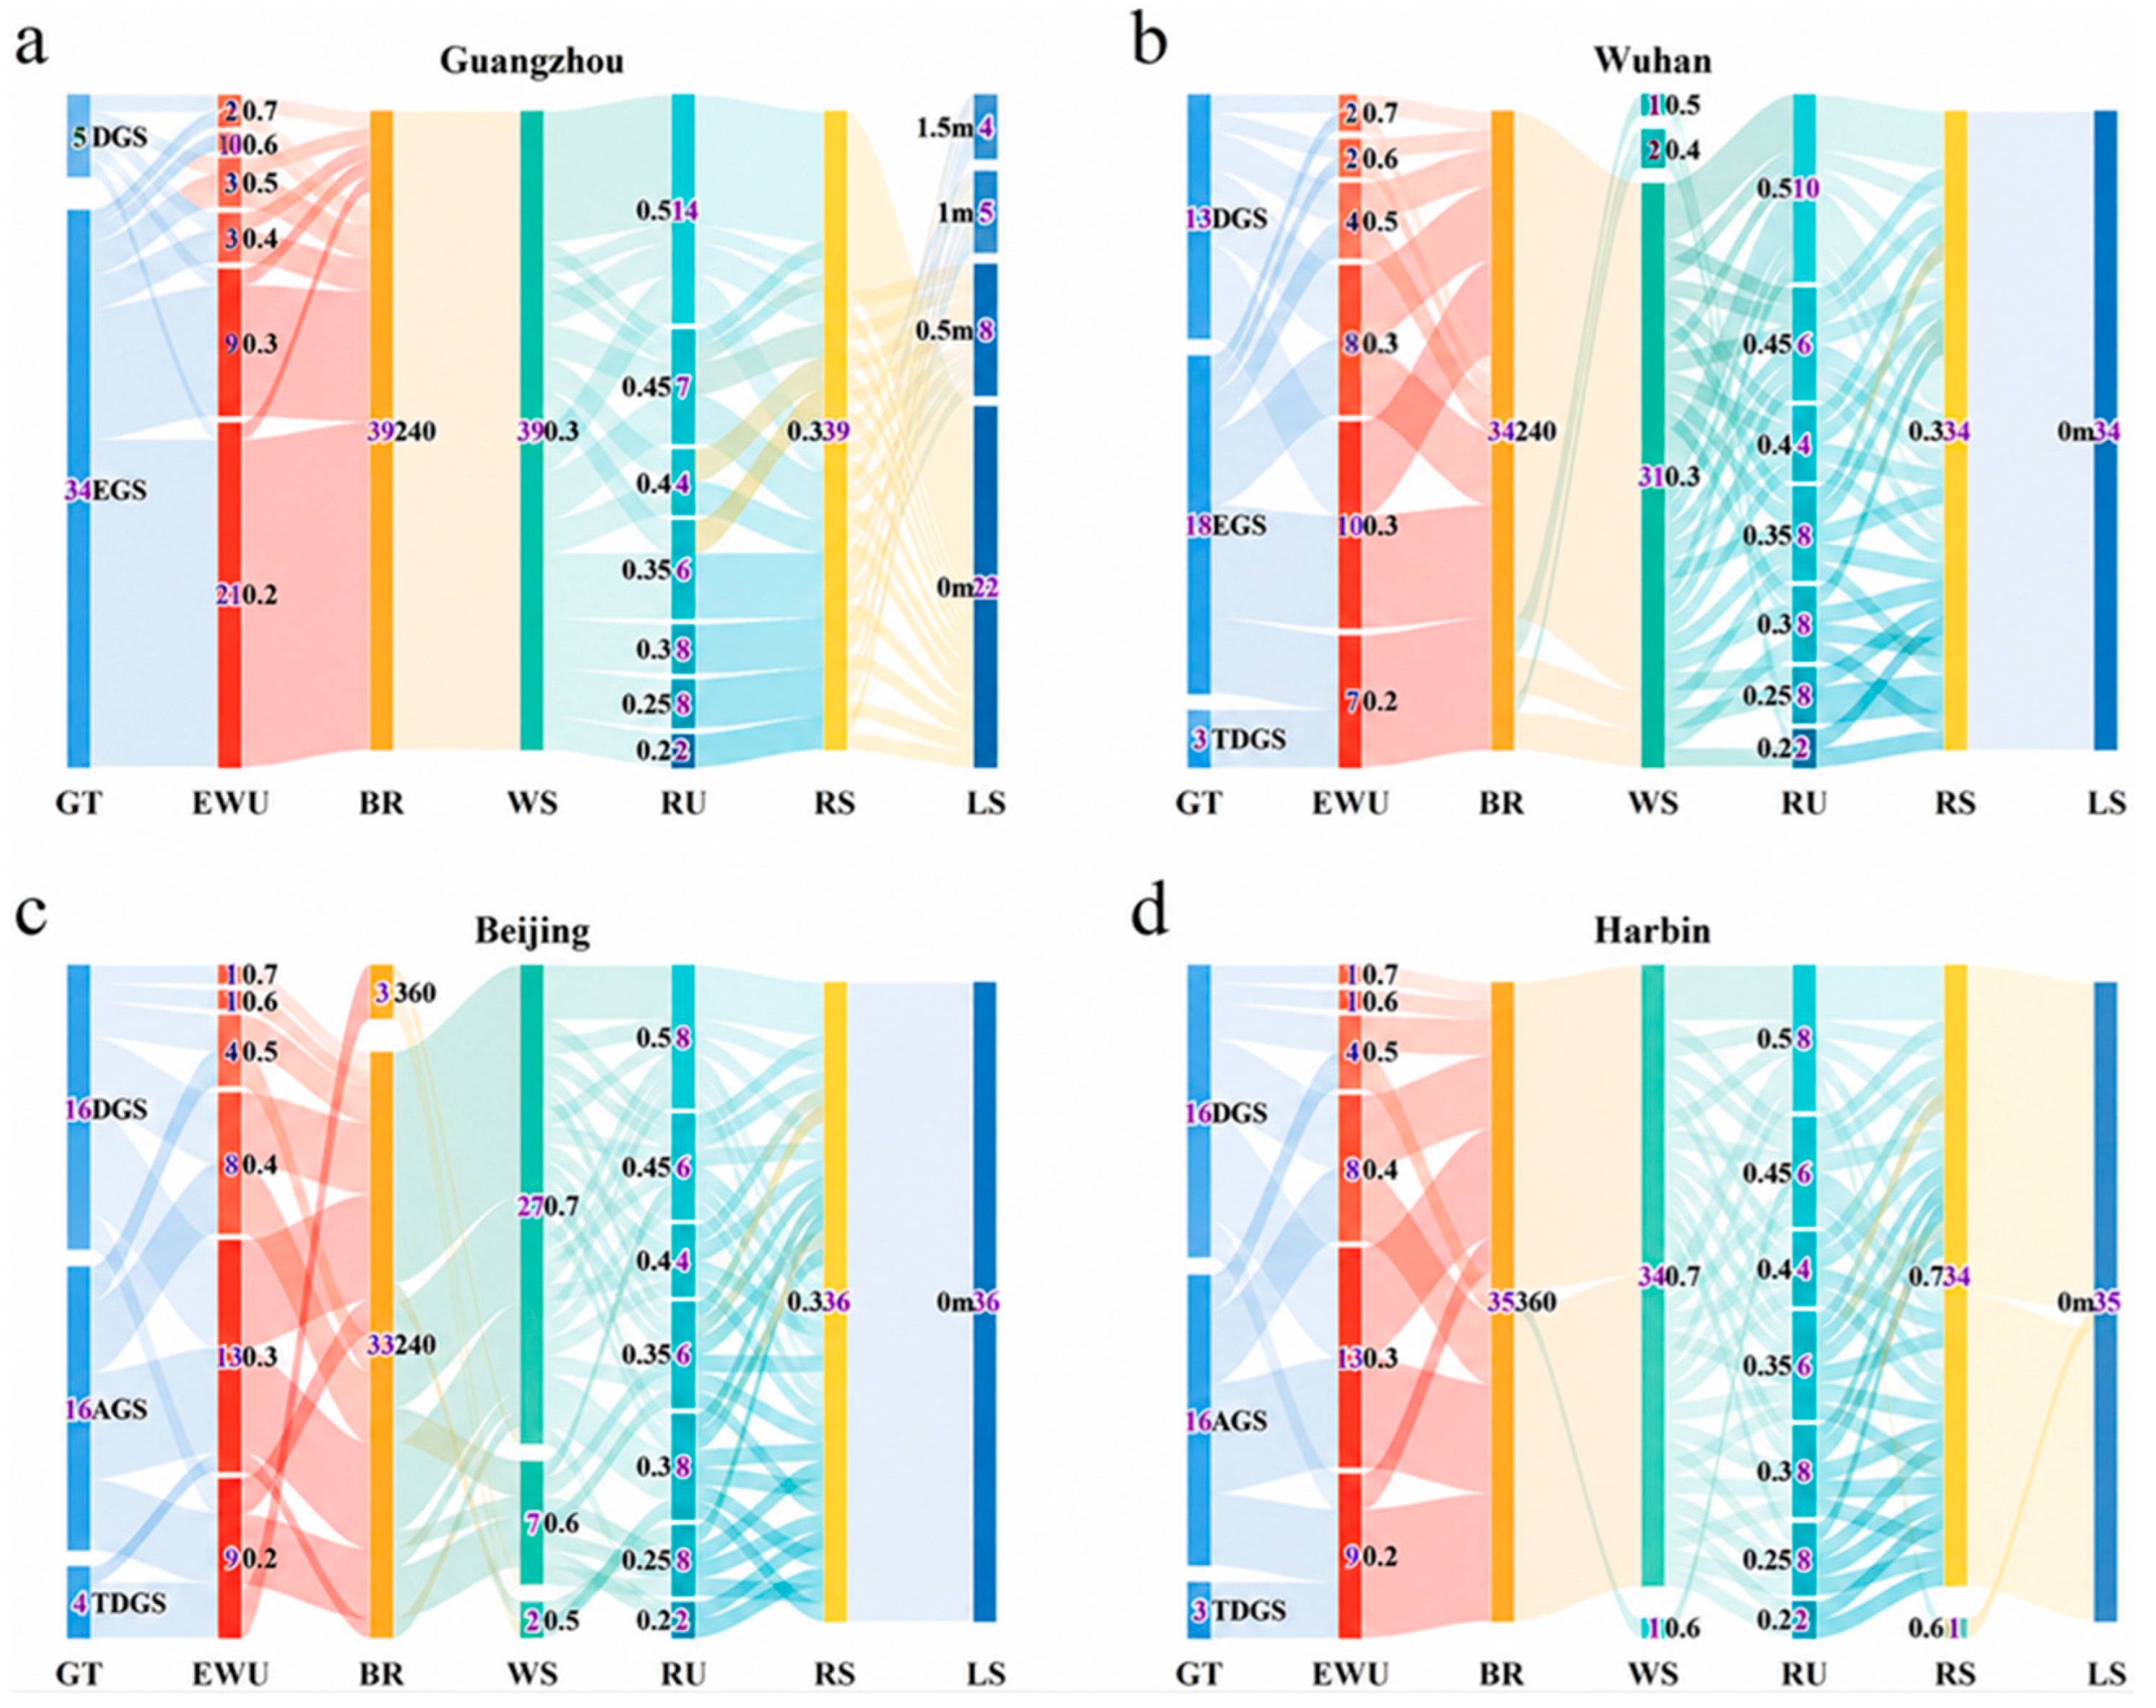
To gain a more comprehensive understanding of the relationship between each design parameter in the Pareto optimal solution set and the optimization objectives, the distribution of the optimal solutions was visualized using parallel coordinate plots, as shown in Figure 4. For the exterior wall and roof U-value, the distribution of values within the Pareto optimal solution set for each climate zone spans the entire range of variation of these variables. This indicates that these two design parameters are applicable across all climate zones, with lower U-values corresponding to higher construction costs and lower annual operational carbon emissions. In fact, lower U-values are not better for different climate zones, requiring a trade-off decision based on a comprehensive evaluation method.
However, for other design parameters, the values in the Pareto optimal solution set tend to concentrate within a specific range or at fixed values, with significant variation across different climate zones. For example, the solar absorptivity of wall and roof surfaces is 0.3 in Guangzhou and 0.7 in Harbin, with the values gradually increasing from south to north. This is because buildings in the southern region are primarily cooled, where a lower solar absorptivity helps reduce the cooling load, while in the northern region, which is mainly heated, a higher solar absorptivity aids in reducing heating energy consumption. It is worth noting that in regions where cooling and heating needs are more balanced, such as Beijing, the values of solar absorptivity for wall and roof surfaces may not be consistent. In Beijing, the solar absorptivity of the wall surfaces ranges from 0.5 to 0.7, while that of the roof surfaces is 0.3.
For the building orientation (BR) parameter, in the northern region, the value of building orientation is 360°, when the south side of the building has the highest WWR, which can increase the solar heat gain inside the building and thus reduce the energy consumption of heating in the building, while in the southern region this situation needs to be avoided, so the value of building orientation is 240°. Additionally, moderate shading measures are recommended for Guangzhou, while local shading is not suitable for the other three regions, as improper shading can have counterproductive effects.

3.2. Sensitivity Results Analysis

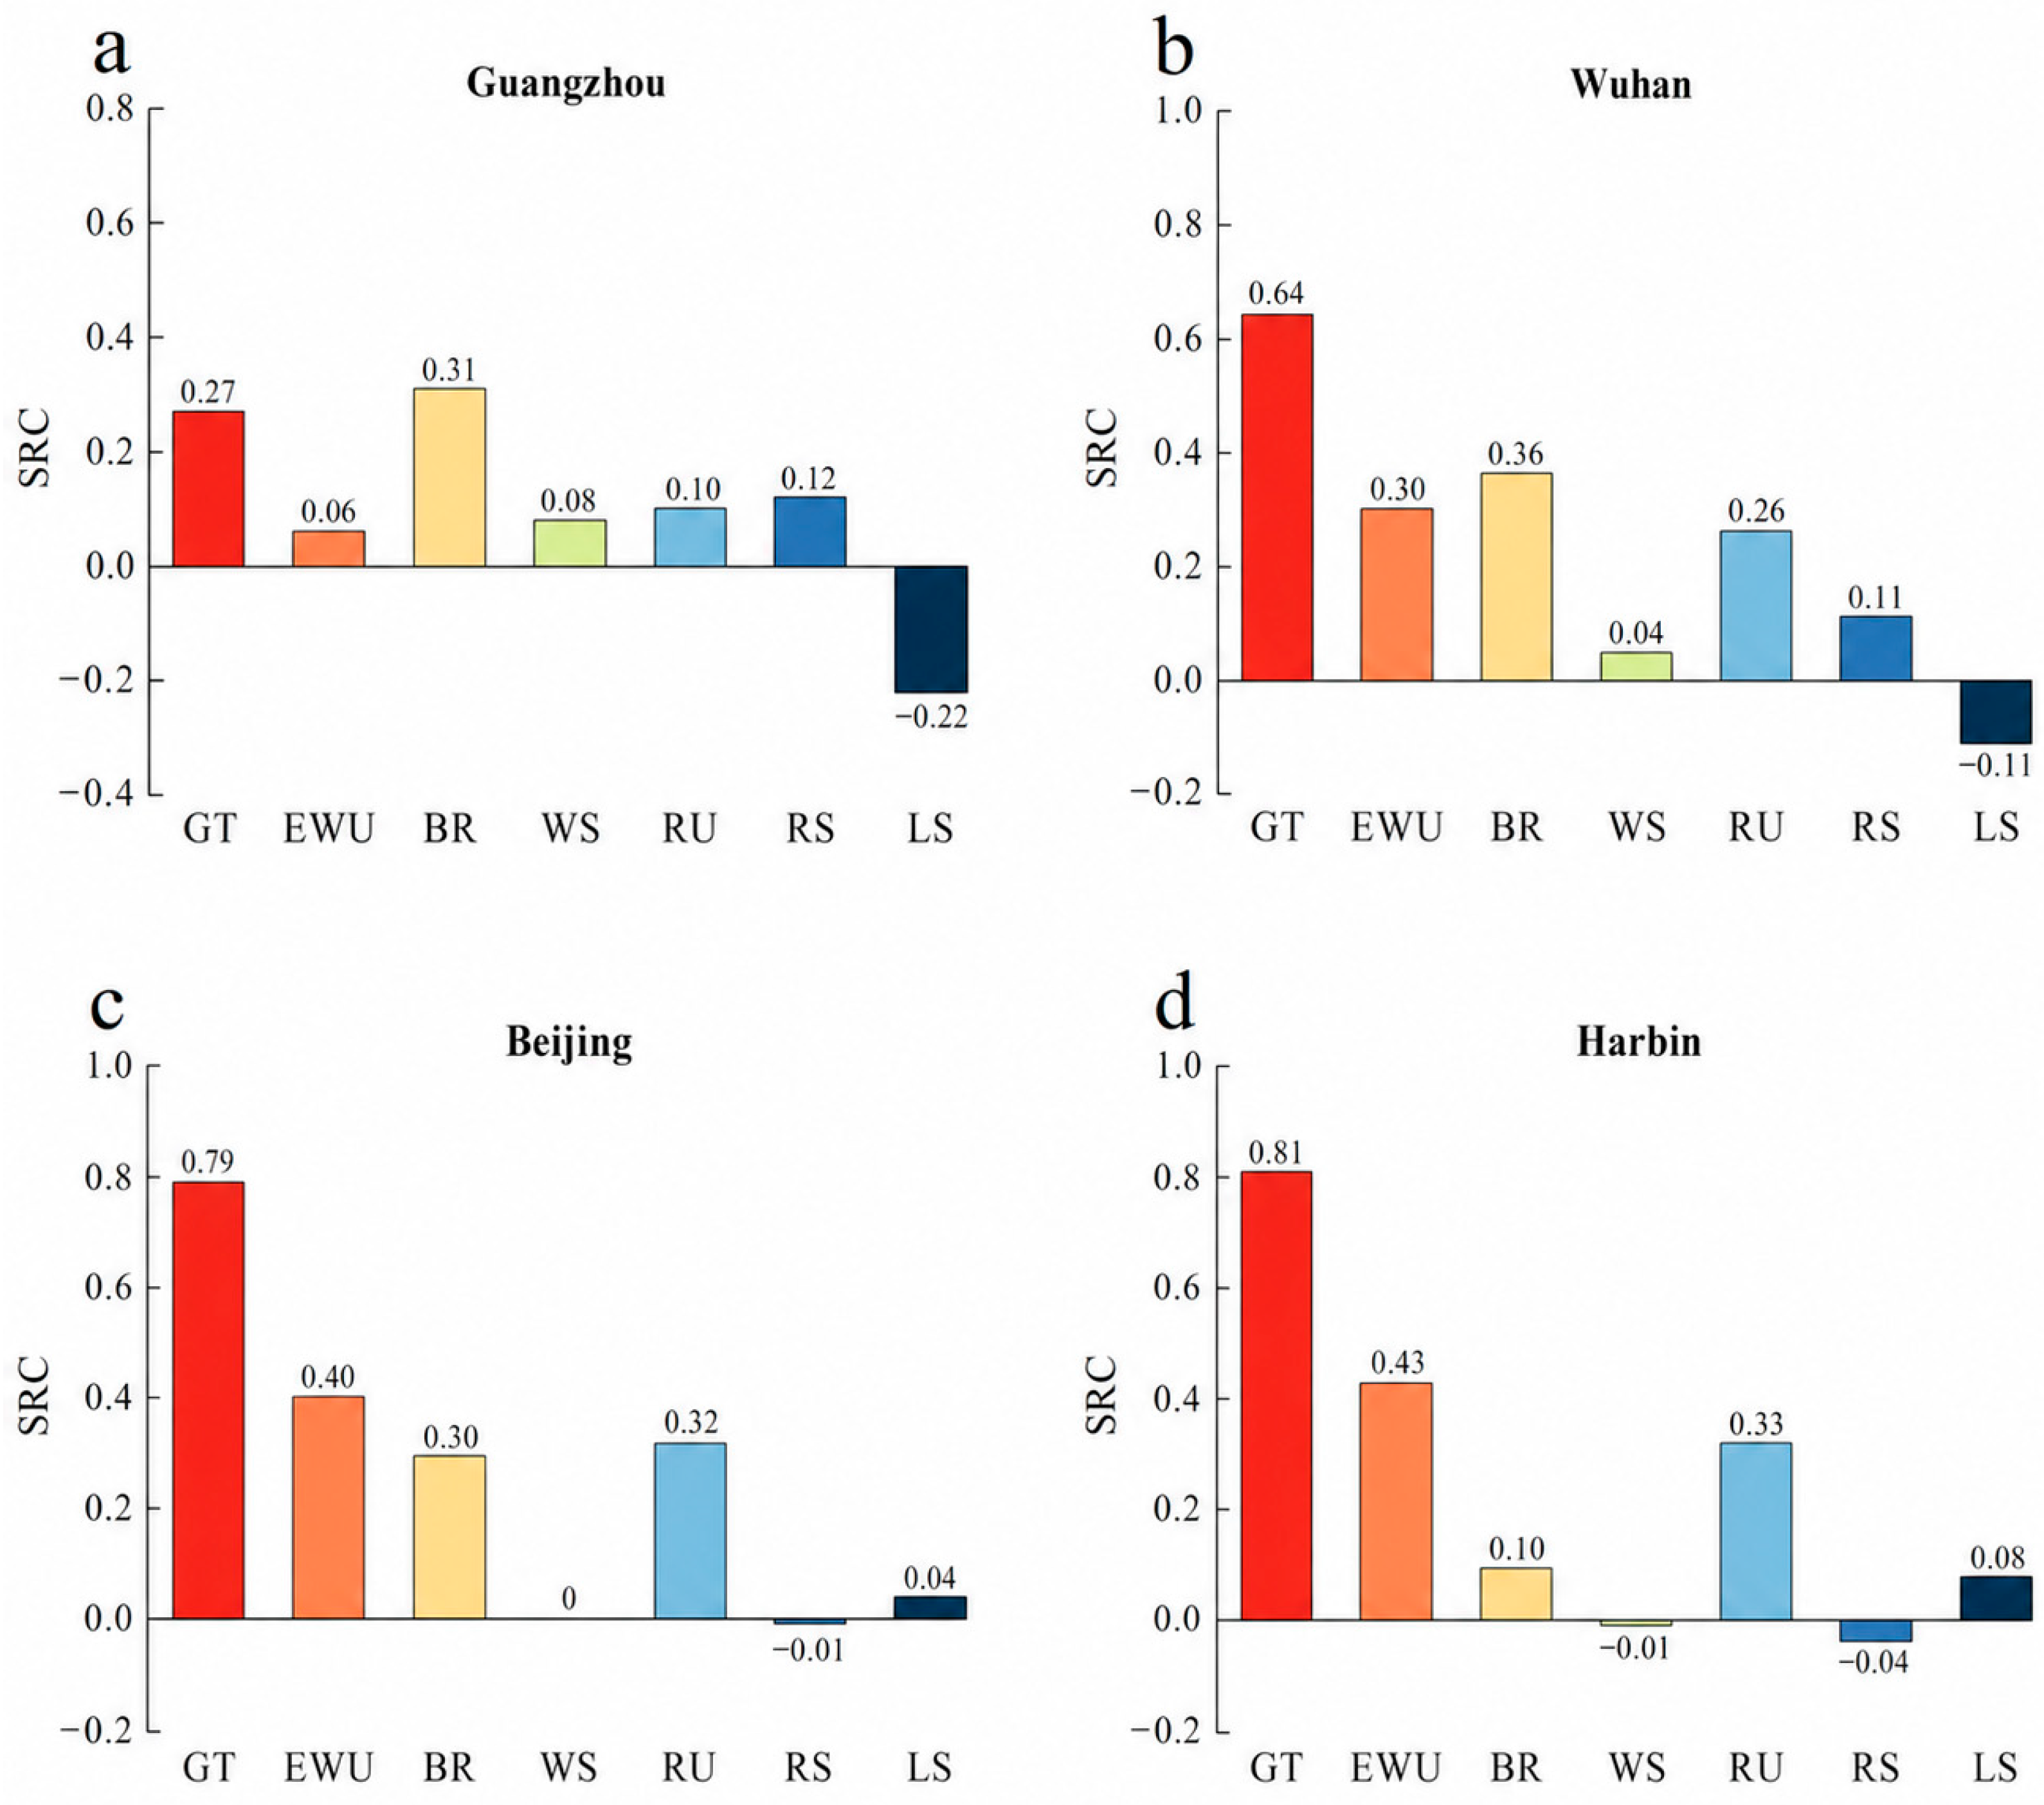
This study employs the standardized regression coefficient (SRC) as an evaluation metric to assess the influence of design variables on annual operational carbon emissions. Figure 5 illustrates the SRC results for cities selected from four different climate zones. The results reveal significant variations in the influence of design parameters on annual operational carbon emissions across different climate zones. In the Hot Summer–Warm Winter Regions, the glazing type (GT), building orientation (BR), and local shading (LS) exert the most significant influence on annual operational carbon emissions. In the Hot Summer–Cold Winter and Cold Regions, glazing type (GT), exterior wall U-value (EWU), building orientation (BR), and roof U-value (RU) play pivotal roles in annual operational carbon emissions. In the Severe Cold Region, GT, EWU, and RU are the primary factors influencing operational carbon emissions.
Notably, GT is an important design parameter affecting annual operational carbon emissions regardless of climate zone, emphasizing the importance of equipping buildings with high WWR with high-performance glazing systems. The influence of BR and LS on operational carbon emissions is more pronounced in the southern region, whereas it is relatively diminished in the northern regions. Specifically, from south to north, the influence of BR and LS on operational carbon emissions gradually decreases. In contrast, EWU and RU have a lesser impact on operational carbon emissions in the southern regions, but their influence becomes more significant in the northern regions. Specifically, from south to north, the impact of EWU and RU on operational carbon emissions progressively increases. These findings suggest that the selection of BR and LS should be prioritized in the southern region, while greater attention should be given to the design of EWU and RU in the northern region. Additionally, wall solar absorption (WS) and roof solar absorption (RS) exhibit relatively minor impacts across all climate zones, but their effects on operational carbon emissions follow opposing trends in the northern and southern regions.

3.3. TOPSIS Comprehensive Evaluation

This section summarizes the results of the economic and environmental evaluations of the Optimal Case and the Most Energy-Efficient Case. The construction cost of the base case is 1.1665 × 10⁷¥, derived from a field survey. The construction costs for the other optimized scenarios were determined by adjusting the costs of the design parameters relative to those of the base case. The variations in the U-values of the roof and exterior wall were achieved by modifying the thickness of the insulation (glass wool), priced at ¥600/m3. The cost of local shading was ¥275/m2, and the costs of the various glazing systems are listed in Table 4. These prices were established based on average market rates in China. Furthermore, this study does not account for regional variations in electricity prices when calculating the payback period and assumes a constant electricity price of 0.634¥/kWh, based on the average commercial electricity rate in China [41].
Table 6 and Table 7 present the results of the design parameters and objective functions for the optimal and most energy-efficient design solutions in different cities. In the optimal design scenario, both objective functions are assigned equal weights. This equal-weight setting represents a balanced sustainability preference between carbon mitigation and economic cost. Compared to the base case, the optimal design solution reduces the annual operational carbon emissions of service area buildings by 7.70% to 10.50%, with a payback period ranging from 4.90 to 13.56 years. In contrast, the most energy-efficient design solution reduces annual operational carbon emissions by 9.00% to 15.30%, but comes with a significantly longer payback period, ranging from 11.52 to 33.64 years. While the most energy-efficient design option excels in reducing operational carbon emissions, its extended payback period presents significant economic challenges. Therefore, sustainable building design should balance environmental performance with affordability rather than pursue carbon reduction without considering economic viability.
In the Guangzhou area, the annual operational carbon emissions of the most energy-efficient design option were reduced by only 0.90% compared to the optimal design option, while the payback period increased by a factor of 6.90. Clearly, adopting the most energy-efficient solution is not advisable in this case. This is primarily because the most energy-efficient design option incorporates local shading, along with walls and roofs with lower U-values, which increases construction costs without delivering significant energy savings. This suggests that it is not desirable to overuse a more insulated envelope in order to save energy. Notably, in the Harbin area, the most energy-efficient design option reduced annual operational carbon emissions by 4.90% compared to the optimal design, with the payback period increasing by only approximately 3 years. This is primarily due to the adoption of TDGS, which is more energy-efficient than AGS. Therefore, in the northern region, TDGS can be a feasible choice when energy efficiency is prioritized. In practice, different weightings can be applied to the objective functions based on specific preferences, enabling the identification of the optimal design solution to meet the desired goals.

4. Conclusions

This paper presents a sustainability-oriented multi-objective optimization design study based on the NSGA-II genetic algorithm for a service area building with a high WWR. The study incorporates design variables such as building orientation and wall insulation, alongside advanced passive design strategies, including smart glass and aerogel glazing, to minimize both construction costs and operational carbon emissions. Additionally, a regression model is used for sensitivity analysis, and the TOPSIS decision-making method is employed to identify the optimal design solution. By quantifying carbon-reduction potential, investment cost, and payback period across different climate zones, the study provides a sustainability assessment framework for climate-responsive envelope design in service-area buildings. The main findings of the study are as follows:
(1) The optimization results reveal that, compared to other glazing systems, TDGS is unsuitable for hot-summer, warm-winter regions; AGS is not suitable for both hot-summer, warm-winter and hot-summer, cold-winter regions; and EGS is not suitable for cold and severe cold regions. Furthermore, in the northern regions, building surfaces should be made of materials with high solar absorptance, while in the southern regions, the opposite is recommended. Notably, local shading is not recommended for northern regions.
(2) The results of the sensitivity analysis demonstrate significant differences in the influence of design parameters on annual operational carbon emissions across different climate zones. In the Hot Summer–Warm Winter Regions, GT, BR, and LS exert the most significant influence on annual operational carbon emissions. In the Hot Summer–Cold Winter and Cold Regions, GT, EWU, BR, and RU play pivotal roles in annual operational carbon emissions. In the Severe Cold Region, GT, EWU, and RU are the primary factors influencing operational carbon emissions.
(3) The TOPSIS decision-making results indicate that the optimal design option reduces the annual operational carbon emissions of the service area building by 7.70–10.50%, with a payback period ranging from 4.90 to 13.56 years, compared to the base case. In contrast, the most energy-efficient design option results in a reduction of annual operational carbon emissions by 9.00–15.30%, but the payback period is significantly longer, ranging from 11.52 to 33.64 years. Furthermore, if the design preference prioritizes energy efficiency, adopting TDGS in the northern region is a feasible choice. Overall, the results demonstrate that integrating high-performance glazing, envelope optimization, and decision-making tools can support sustainable development by reducing operational carbon emissions while maintaining reasonable economic performance.

Author Contributions

Conceptualization, Y.X. and Y.L.; methodology, M.T.; software, S.H.; validation, T.M., T.S. and Y.G.; formal analysis, Y.X.; investigation, H.W.; resources, Y.L.; data curation, Y.L.; writing—original draft preparation, S.H.; writing—review and editing, H.X.; visualization, H.W.; supervision, Y.L.; project administration, T.M.; funding acquisition, Y.G. All authors have read and agreed to the published version of the manuscript.

Funding

This research was supported by the National Natural Science Foundation of China (Grant No. 52278123), and the National Key R&D Program of China (Grant No. 2019YFE0197500).

Institutional Review Board Statement

Not applicable.

Informed Consent Statement

Not applicable.

Data Availability Statement

The original contributions presented in this study are included in the article. Further inquiries can be directed to the corresponding author.

Conflicts of Interest

Authors Yong Xiao, Yinzhou Li, Haijing Wen and Meng Tang are employed by CCCC Second Highway Consultants Co., Ltd. The remaining authors declare that the research was conducted in the absence of any commercial or financial relationships that could be construed as a potential conflict of interest.

References

  1. Fotso-Nguemo, T.C.; Vondou, D.A.; Diallo, I.; Diedhiou, A.; Weber, T.; Tanessong, R.S.; Nghonda, J.P.; Yepdo, Z.D. Potential impact of 1.5, 2 and 3 C global warming levels on heat and discomfort indices changes over Central Africa. Sci. Total Environ. 2022, 804, 150099. [Google Scholar] [CrossRef] [PubMed]
  2. Olatomiwa, L.; Idakwo, H.O.; Olusola, W.S.; Ezeh, C. Global energy consumption trends. Majlesi J. Electr. Eng. 2025, 19, 1–12. [Google Scholar]
  3. Saurbayeva, A.; Memon, S.A.; Kim, J. Sensitivity analysis and optimization of PCM integrated buildings in a tropical savanna climate. J. Build. Eng. 2023, 64, 105603. [Google Scholar]
  4. Wang, M.; Chen, C.; Fan, B.; Yin, Z.; Li, W.; Wang, H.; Chi, F.a. Multi-objective optimization of envelope design of rural tourism buildings in southeastern coastal areas of china based on nsga-ii algorithm and entropy-based topsis method. Sustainability 2023, 15, 7238. [Google Scholar]
  5. Delgarm, N.; Sajadi, B.; Kowsary, F.; Delgarm, S. Multi-objective optimization of the building energy performance: A simulation-based approach by means of particle swarm optimization (PSO). Appl. Energy 2016, 170, 293–303. [Google Scholar]
  6. Zhao, J.; Du, Y. Multi-objective optimization design for windows and shading configuration considering energy consumption and thermal comfort: A case study for office building in different climatic regions of China. Sol. Energy 2020, 206, 997–1017. [Google Scholar] [CrossRef]
  7. Mousavi, S.; Gijón-Rivera, M.; Rivera-Solorio, C.; Rangel, C.G. Energy, comfort, and environmental assessment of passive techniques integrated into low-energy residential buildings in semi-arid climate. Energy Build. 2022, 263, 112053. [Google Scholar]
  8. Albarssi, S.; Hou, S.S.; Latif, E. Thermally future-proofing existing Libyan housing stock with biobased insulation materials and passive measures: An empirical and numerical study using a digital twin. Buildings 2024, 14, 175. [Google Scholar] [CrossRef]
  9. Lin, Y.; Zhong, S.; Yang, W.; Hao, X.; Li, C.-Q. Multi-objective design optimization on building integrated photovoltaic with Trombe wall and phase change material based on life cycle cost and thermal comfort. Sustain. Energy Technol. Assess. 2021, 46, 101277. [Google Scholar] [CrossRef]
  10. Yue, J.; Lu, J.; Yan, C.; Liu, J.; Pan, Y. Dynamic simulation analysis of influencing factors of energy consumption of public building envelope in Central China. Sustainability 2023, 15, 14982. [Google Scholar] [CrossRef]
  11. Vukadinović, A.; Radosavljević, J.; Đorđević, A.; Protić, M.; Petrović, N. Multi-objective optimization of energy performance for a detached residential building with a sunspace using the NSGA-II genetic algorithm. Sol. Energy 2021, 224, 1426–1444. [Google Scholar] [CrossRef]
  12. Xue, Q.; Wang, Z.; Chen, Q. Multi-objective optimization of building design for life cycle cost and CO2 emissions: A case study of a low-energy residential building in a severe cold climate. Build. Simul. 2022, 15, 83–98. [Google Scholar]
  13. Abdeen, A.; Mushtaha, E.; Hussien, A.; Ghenai, C.; Maksoud, A.; Belpoliti, V. Simulation-based multi-objective genetic optimization for promoting energy efficiency and thermal comfort in existing buildings of hot climate. Results Eng. 2024, 21, 101815. [Google Scholar]
  14. Bre, F.; Fachinotti, V.D. A computational multi-objective optimization method to improve energy efficiency and thermal comfort in dwellings. Energy Build. 2017, 154, 283–294. [Google Scholar] [CrossRef]
  15. Liu, Y.; Gao, Y.; Zhuang, C.; Shi, D.; Xu, Y.; Guan, J.; Di, Y. Optimization of top-floor rooms coupling cool roofs, natural ventilation and solar shading for residential buildings in hot-summer and warm-winter zones. J. Build. Eng. 2023, 66, 105933. [Google Scholar]
  16. Kitsopoulou, A.; Bellos, E.; Lykas, P.; Vrachopoulos, M.G.; Tzivanidis, C. Multi-objective evaluation of different retrofitting scenarios for a typical Greek building. Sustain. Energy Technol. Assess. 2023, 57, 103156. [Google Scholar] [CrossRef]
  17. Harkouss, F.; Fardoun, F.; Biwole, P.H. Passive design optimization of low energy buildings in different climates. Energy 2018, 165, 591–613. [Google Scholar] [CrossRef]
  18. Zhao, S.; Si, J.; Chen, G.; Shi, H.; Lei, Y.; Xu, Z.; Yang, L. Research on Passive Design Strategies for Low-Carbon Substations in Different Climate Zones. Processes 2023, 11, 1814. [Google Scholar] [CrossRef]
  19. de Azevedo Correia, C.M.; Amorim, C.N.D.; Santamouris, M. Use of passive cooling techniques and super cool materials to minimize cooling energy and improve thermal comfort in Brazilian schools. Energy Build. 2024, 312, 114125. [Google Scholar] [CrossRef]
  20. Saurbayeva, A.; Memon, S.A.; Kim, J. Integrated multi-stage sensitivity analysis and multi-objective optimization approach for PCM integrated residential buildings in different climate zones. Energy 2023, 278, 127973. [Google Scholar]
  21. Jung, Y.; Heo, Y.; Lee, H. Multi-objective optimization of the multi-story residential building with passive design strategy in South Korea. Build. Environ. 2021, 203, 108061. [Google Scholar]
  22. Xuanyuan, P.; Zhang, Y.; Yao, J.; Zheng, R. Sensitivity Analysis and Optimization of Energy-Saving Measures for Office Building in Hot Summer and Cold Winter Regions. Energies 2024, 17, 1675. [Google Scholar] [CrossRef]
  23. Albatayneh, A. Sensitivity analysis optimisation of building envelope parameters in a sub-humid Mediterranean climate zone. Energy Explor. Exploit. 2021, 39, 2080–2102. [Google Scholar] [CrossRef]
  24. Albatayneh, A. Optimising the parameters of a building envelope in the East Mediterranean Saharan, cool climate zone. Buildings 2021, 11, 43. [Google Scholar] [CrossRef]
  25. Aydın, D.; Mıhlayanlar, E. A case study on the impact of building envelope on energy efficiency in high-rise residential buildings. A case study on the impact of building envelope on energy efficiency in high-rise residential buildings. Archit. Civ. Eng. Environ. (ACEE J.) 2020, 13, 5–18. [Google Scholar]
  26. Ghosh, A. Diffuse transmission dominant smart and advanced windows for less energy-hungry building: A review. J. Build. Eng. 2023, 64, 105604. [Google Scholar]
  27. Huang, R.; Xie, Y.; Cao, N.; Jia, X.; Chao, D. Self-powered electrochromic smart window helps net-zero energy buildings. Nano Energy 2024, 129, 109989. [Google Scholar]
  28. Jia, Z.; Sui, Y.; Qian, L.; Ren, X.; Zhao, Y.; Yao, R.; Wang, L.; Chao, D.; Yang, C. Electrochromic windows with fast response and wide dynamic range for visible-light modulation without traditional electrodes. Nat. Commun. 2024, 15, 6110. [Google Scholar] [CrossRef] [PubMed]
  29. Chen, J.; Cao, S.; Liu, Y.; Qin, S.; Li, H.; Yang, T.; Zhao, J.; Zou, B. A Multi-Color Four-Mode Electrochromic Window for All-Season Thermal Regulation in Buildings. Adv. Energy Mater. 2025, 15, 2403414. [Google Scholar]
  30. Aadinarayanan, B.; Kandasubramanian, B. Self-Regulating Electrochromic Windows: A State-of-the-Art Review of Energy-Autonomous Systems: B. Aadinarayanan and B. Kandasubramanian. J. Electron. Mater. 2026, 55, 3369–3388. [Google Scholar]
  31. Shao, Z.; Huang, A.; Cao, C.; Ji, X.; Hu, W.; Luo, H.; Bell, J.; Jin, P.; Yang, R.; Cao, X. Tri-band electrochromic smart window for energy savings in buildings. Nat. Sustain. 2024, 7, 796–803. [Google Scholar] [CrossRef]
  32. Du, F.; Zhu, W.; Yang, R.; Zhang, Y.; Wang, J.; Li, W.; Zuo, W.; Zhang, L.; Chen, L.; She, W. Bioinspired super thermal insulating, strong and low carbon cement aerogel for building envelope. Adv. Sci. 2023, 10, 2300340. [Google Scholar] [CrossRef]
  33. Cuce, E.; Cuce, P.M.; Wood, C.; Gillott, M.; Riffat, S. Experimental investigation of internal aerogel insulation towards low/zero carbon buildings: A comprehensive thermal analysis for a UK building. Sustain. Clean Build. 2026, 1, 1–22. [Google Scholar]
  34. Adegun, M.H.; Chan, K.-Y.; Yang, J.; Venkatesan, H.; Kim, E.; Zhang, H.; Shen, X.; Yang, J.; Kim, J.-K. Anisotropic thermally superinsulating boron nitride composite aerogel for building thermal management. Compos. Part A Appl. Sci. Manuf. 2023, 169, 107522. [Google Scholar] [CrossRef]
  35. Berardi, U. Aerogel-enhanced systems for building energy retrofits: Insights from a case study. Energy Build. 2018, 159, 370–381. [Google Scholar] [CrossRef]
  36. Garg, V.; Mathur, J.; Bhatia, A. Building Energy Simulation: A Workbook Using Designbuilder™, 2nd ed.; CRC Press: Boca Raton, FL, USA, 2020. [Google Scholar]
  37. Crawley, D.B.; Hand, J.W.; Kummert, M.; Griffith, B.T. Contrasting the capabilities of building energy performance simulation programs. Build. Environ. 2008, 43, 661–673. [Google Scholar] [CrossRef]
  38. GB 50189-2015; Design Standard for Energy Efficiency of Public Buildings. China Architecture & Building Press: Beijing, China, 2015.
  39. Bingham, R.D.; Agelin-Chaab, M.; Rosen, M.A. Whole building optimization of a residential home with PV and battery storage in The Bahamas. Renew. Energy 2019, 132, 1088–1103. [Google Scholar] [CrossRef]
  40. Deb, K.; Pratap, A.; Agarwal, S.; Meyarivan, T. A fast and elitist multiobjective genetic algorithm: NSGA-II. IEEE Trans. Evol. Comput. 2002, 6, 182–197. [Google Scholar] [CrossRef]
  41. GlobalPetrolPrices.com. Electricity Prices Around the World. Available online: https://www.globalpetrolprices.com/electricity_prices/ (accessed on 2 June 2026).
Figure 1. Service area building model (The colored lines and numbers in the background represent the sun-path diagram generated by DesignBuilder and are used only to indicate solar position and orientation).
Sustainability 18 06709 g001
Figure 2. Multi-objective optimization results for different cities: (a) Guangzhou; (b) Wuhan; (c) Beijing; (d) Harbin.
Sustainability 18 06709 g002
Figure 3. Impact of glazing systems on optimization objectives in different cities: (a) Guangzhou; (b) Wuhan; (c) Beijing; (d) Harbin.
Sustainability 18 06709 g003
Figure 4. Distribution of Pareto-optimal solution sets by city: (a) Guangzhou; (b) Wuhan; (c) Beijing; (d) Harbin. Different colors represent different design variables, and the numbers indicate the corresponding parameter values or the number of Pareto-optimal solutions at each level.
Sustainability 18 06709 g004
Figure 5. Results of sensitivity analysis by city: (a) Guangzhou; (b) Wuhan; (c) Beijing; (d) Harbin.
Sustainability 18 06709 g005
Table 1. Building information and simulation parameters.
ItemContentValue
Building informationLocation
Total Building Area (m2)
Net Conditioned Building Area (m2)
WWR (%)
Wuhan (China)
1554
963
30
Simulation parametersOccupancy density (people/m2)
Dimming control (lx)
HVAC cooling setpoint (°C)
HVAC heating setpoint (°C)
0.4
300
25
22
Table 2. Climate zones and typical cities.
Climatic ZoneTypical CityCooling PeriodHeating PeriodMulti-Year Mean Annual Temperature (°C)
Severe Cold RegionHarbin12 June–9 August17 October–10 April of the following year5.2
Cold RegionBeijing12 June–2 September12 November–14 March of the following year13.3
Hot-Summer Cold-Winter RegionWuhan19 June–24 September22 December–9 February of the following year17.4
Hot-Summer Warm-Winter RegionGuangzhou6 May–17 OctoberNone22.4
Temperate (Mild) RegionKunmingNoneNone16.0
Table 3. Design variable parameters.
Parameter NameUnitTypeRangeInitial Value
Glazing type/Discrete4 variantsDGS
Exterior wall U-valueW/(m2·K)Discrete[0.2:0.1:0.7]0.45
Roof U-valueW/(m2·K)Discrete[0.2:0.05:0.5]0.4
Building orientation°Discrete[240:15:360]270
Wall solar absorption/Discrete[0.3:0.1:0.7]0.5
Roof solar absorption/Discrete[0.3:0.1:0.7]0.3
Overhangs depthmDiscrete[0:0.5:2]0
Table 4. Type and properties of the glazing.
Glazing SystemsConstructionsU-Value (W/(m2·K))SHGCPrice (¥/m2)Price (USD/m2)
DGS6 mm clear glass + 12 mm air + 6 mm clear glass2.6950.71570099.34
AGS6 mm clear glass + 12 mm aerogel + 6 mm clear glass1.2660.583900127.72
EGS (light state)
EGS (dark state)
6 mm electrochromic glass + 12 mm air + 6 mm clear glass2.690
1.862
0.712
0.176
850120.62
TDGS (light state)
TDGS (dark state)
6 mm electrochromic glass + 12 mm air + 6 mm clear glass1.266
1.259
0.583
0.125
1050149.01
Note: USD prices were converted from CNY using the 2023 annual average exchange rate of 1 USD = 7.0467 CNY.
Table 5. Parameters settings of NSGA-II.
Parameter (NSGA-II)Value
Initial population size30
Population size30
Maximum number of generations100
Mutation rate0.4
Crossover rate1
Table 6. Optimal design solutions for different cities.
Parameter NameUnitGuangzhouWuhanBeijingHarbin
GT/EGSEGSAGSAGS
EWUW/(m2·K)0.700.300.300.30
RUW/(m2·K)0.500.300.300.25
BR°240240240360
WS/0.300.300.700.70
RS/0.300.300.300.70
LSm0000
Cost105¥117.12117.77117.97118.20
CO2103 kg94.20
(8.10%)
87.10
(7.70%)
94.20
(8.60%)
119.90
(10.50%)
PPyears4.9013.5612.985.50
Table 7. The most energy-saving solution for different cities.
Parameter NameUnitGuangzhouWuhanBeijingHarbin
GT/EGSTDGSTDGSTDGS
EWUW/(m2·K)0.200.200.200.20
RUW/(m2·K)0.200.200.200.20
BR°240240360360
WS/0.300.300.700.70
RS/0.300.300.300.70
LSm1.50000
Cost105¥120.20119.36119.36119.36
CO2103 kg93.20
(9.00%)
85.30
(9.60%)
90.80
(12.00%)
114.30
(15.30%)
PPyears33.6426.4019.2811.52
Disclaimer/Publisher’s Note: The statements, opinions and data contained in all publications are solely those of the individual author(s) and contributor(s) and not of MDPI and/or the editor(s). MDPI and/or the editor(s) disclaim responsibility for any injury to people or property resulting from any ideas, methods, instructions or products referred to in the content.