1. Introduction
The increasing demand for food products and the expansion of production volumes require raw materials, water, energy, packaging, transport, and production infrastructure to be used more efficiently. From a sustainability perspective, it is important not only to reduce the direct environmental burden of food production, but also to prevent product losses during processing and post-production stages caused by microbial spoilage or other factors. Cheese production is a resource-intensive process that requires milk, water, energy, refrigeration, packaging, transport, and, depending on the cheese type, a shorter or longer ripening period. In addition, milk and dairy products provide favourable conditions for microbial growth. Therefore, microbial contamination control, cleaning, and disinfection are integral parts of the dairy industry and are important for ensuring food safety, improving resource efficiency, and reducing environmental impacts [
1,
2].
Starter and ripening cultures are involved in fermentation and contribute to the development of cheese texture, aroma, and flavour. However, adventitious microbiota that enter the product unintentionally may cause undesirable changes, contribute to off-odour formation, and create food safety risks [
3]. Even when hygiene requirements are followed, it is difficult to completely eliminate the risk of contamination, particularly during ripening and storage, when cheese remains exposed to environmental conditions for an extended period [
3,
4].
Microbial spoilage of cheese can be caused by aerobic and anaerobic bacteria, yeasts, and moulds. Yeast and mould contamination is particularly relevant in ripening and storage rooms, as spores can spread through ambient air and settle on the cheese surface. Ambient air may therefore contribute to microbial dissemination, and its control is an important component of microbial management during cheese ripening and storage [
4,
5,
6].
Chemical disinfectants are important for hygiene management and microbial contamination control in the dairy industry. However, their use is associated with both technological and environmental limitations. Disinfectants commonly used in the food industry include chlorine-based compounds, quaternary ammonium compounds, amphoteric compounds, alcohols, and peracetic acid. These substances differ in antimicrobial activity, stability, sensitivity to organic matter and water hardness, toxicity, persistence, and potential environmental impacts related to the formation of by-products (
Table 1) [
7]. Chlorine-based disinfectants are widely used because of their broad antimicrobial activity against Gram-positive and Gram-negative microorganisms, as well as yeasts. Sodium hypochlorite (NaOCl) is relatively short-lived in the environment; however, its environmental risks are associated not only with active chlorine itself, but also with the possible formation of chlorates, chlorinated disinfection by-products, and other reaction products [
1,
7,
8,
9,
10]. In addition, NaOCl may promote corrosion and may have a higher potential environmental impact than some other disinfectants [
7].
Quaternary ammonium compounds also exhibit antimicrobial activity against bacteria, yeasts, and moulds. However, their effectiveness may be reduced by organic matter present on surfaces and by water hardness. These compounds are also associated with strong foaming, which may increase water consumption during rinsing. In addition, repeated exposure may promote the development of microbial resistance to quaternary ammonium compounds [
7,
25]. From an environmental perspective, quaternary ammonium compounds differ from oxidative disinfectants because they can sorb to soil and sewage sludge and may persist in the environment for extended periods [
14].
Amphoteric compounds have properties similar to those of quaternary ammonium compounds; however, their removal from surfaces may be even more difficult because of foaming [
7]. Alcohols are suitable for local surface disinfection, particularly when water-based solutions cannot be used. However, they are not effective against spores and have limited ability to remove soil, organic residues, fats, proteins, or biofilm material [
7]. Alcohols are less persistent in the environment and are readily biodegradable. Ethanol degradation is associated with the formation of acetaldehyde, acetic acid, carbon dioxide, and water [
19]. Peracetic acid is characterized by strong oxidative activity and effectiveness against bacteria, yeasts, and spores. However, it is not highly persistent in the environment and decomposes into acetic acid, hydrogen peroxide, oxygen, and water [
21,
22].
When microbial contamination control measures are applied, several aspects should be considered. Disinfection strategies may affect not only undesirable microorganisms but also the microbiota of milk, whey starter cultures, and cheese, which plays an important role in cheese quality and ripening [
10]. In addition, the use of disinfectants is often associated with high water consumption and with the potential formation of harmful by-products that may enter both food products and the environment. Therefore, additional or alternative microbial control measures are being sought that could reduce the need for chemical disinfection and its environmental burden while preserving product quality and safety. Such measures should also be applicable in production areas where conventional washing or the use of liquid disinfectants is limited.
This need is particularly relevant during ripening and storage, when cheese has already been formed and direct washing with water or chemical solutions is generally not recommended [
26]. Therefore, technologies are needed that can treat ambient air and exposed surfaces without leaving persistent chemical residues on the product.
Ozone is a strong oxidizing agent that can be generated on-site from oxygen present in ambient air. Therefore, unlike many conventional disinfectants, it does not need to be produced in specialized facilities or transported to the place of use. Ozone has a high oxidation potential and is considered one of the strongest oxidizing disinfectants. Its oxidation potential is 2.07 V, which is higher than that of chlorine (1.36 V) and hydrogen peroxide (1.78 V). Among commonly used oxidizing agents, only fluorine has a higher oxidation potential, reaching 2.87 V [
27].
Because of these properties, ozone can effectively oxidize microbial cell components. Its antimicrobial activity is associated with both direct oxidation by ozone molecules and the indirect action of reactive oxygen species. These reactive species can damage microbial cell walls, membranes, proteins, enzymes, and unsaturated fatty acids; therefore, ozone may be effective against bacteria, yeasts, and moulds [
28,
29]. However, ozone is not selective and may also react with organic compounds present in food matrices [
27,
29].
The persistence of ozone in the environment depends on the medium, temperature, pH, and the amount of organic or other reactive substances present. Under acidic conditions, when pH is below 7, ozone is more stable, whereas under alkaline conditions, when pH exceeds 8, it decomposes more rapidly into intermediate compounds and oxygen [
28,
29]. Ozone stability also decreases as ambient temperature increases [
27]. Its stability differs substantially between air and water. At 20 °C, ozone may persist in ambient air for up to 3 days, whereas in water at neutral pH it persists for only approximately 20 min [
27]. In general, water contains more particles and dissolved substances with which ozone can react; therefore, it is consumed and decomposes more rapidly.
After use, ozone mainly decomposes into oxygen and therefore does not leave persistent chemical residues on food products or food-contact surfaces [
2,
6,
29]. The gaseous form of ozone is particularly suitable for cheese ripening and storage rooms because it can treat ambient air, reach areas that are difficult to access, and contribute to the microbiological stability of cheese [
5,
6,
26].
Considering its strong oxidative properties, on-site generation, application in the gaseous phase, and spontaneous decomposition into oxygen, ozone may represent a potentially more sustainable microbial control approach. Its use could create conditions for reducing the need for chemical disinfectants and limiting product losses in the dairy processing industry.
However, the practical application of ozone in dairy product technologies still requires a more comprehensive understanding of its effects on product quality, technological processes, and microbial contamination within dairy product matrices. Therefore, this study aimed to evaluate the potential use of gaseous ozone as a low-residue approach for controlling surface microbial contamination in semi-hard cheese during ripening or storage.
2. Materials and Methods
2.1. Research Object
Sliced semi-hard cheese was used in the study. The dimensions of the cheese slices were as follows: height, 99.2 ± 0.3 mm; width, 74.6 ± 0.2 mm; and thickness, 2.21 ± 0.2 mm. According to the manufacturer’s declaration, the proximate composition of the cheese per 100 g of product was as follows: fat, 26 g, of which saturated fatty acids accounted for 17 g; carbohydrates, 0 g; protein, 25 g; salt, 1.5 g; and energy value, 13,870 kJ/kg (3340 kcal/kg). The experimental work described in this article was carried out at the Agriculture Academy of Vytautas Magnus University.
2.2. Ozone Treatment Procedure
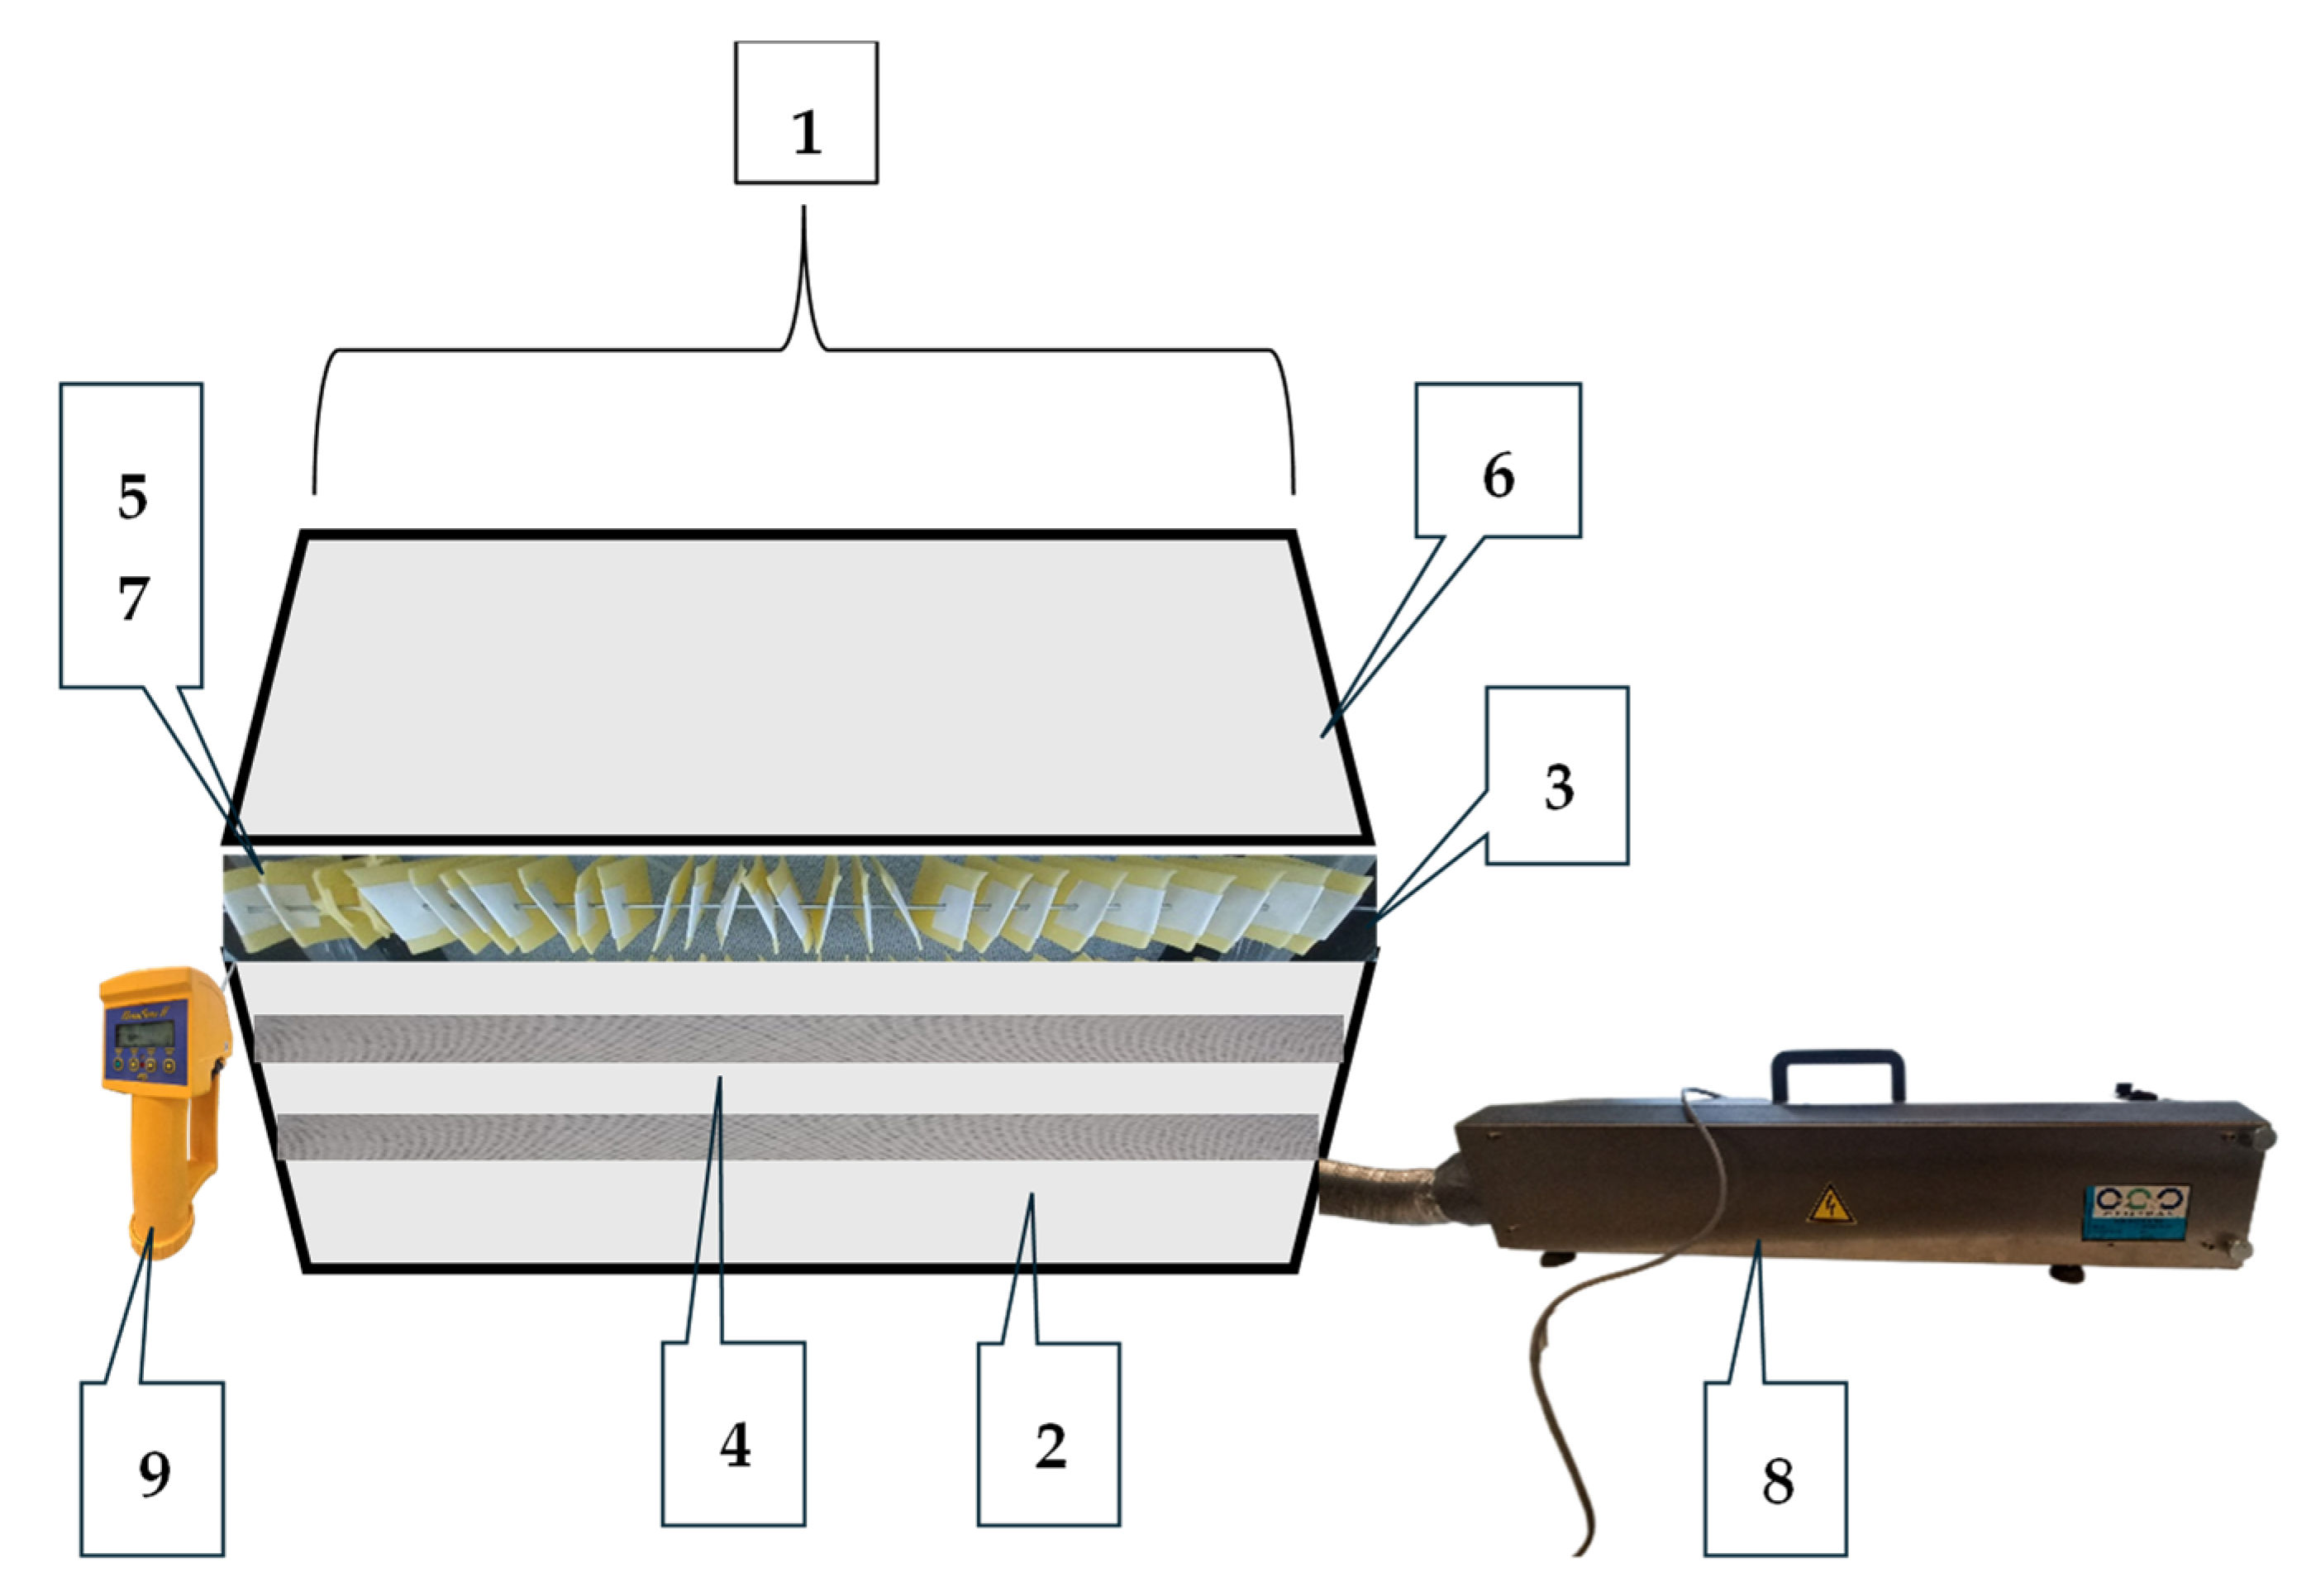
Cheese slices were ozonated in an ozonation chamber with a removable lid, measuring 750 mm in length, 400 mm in width, and 500 mm in height (
Figure 1). The treatment was performed at a temperature of 17.62 ± 0.57 °C, relative humidity of 44.64 ± 1.59%, and ozone concentration of 4.84 ± 0.22 ppm. Ozone gas was generated using an “OZ-NR-30-100” ozone generator (Ozono centras, Maciuiciai, Lithuania). The generator produced ozone by electrical discharge and supplied it to the ozonation chamber through a 100 mm diameter air duct at an air flow velocity of 2.52 ± 0.39 m/s.
To ensure uniform distribution of the supplied ozone–air flow, the ozonation chamber (1) was divided by two mesh layers into a lower constant static pressure zone (2) and an upper ozone treatment zone for the samples (3). From the constant static pressure zone, the ozone–air flow passed evenly upward through the mesh layers (4) into the sample treatment zone, where the cheese slices were suspended (5). The ozonation chamber was covered with a removable lid (6), leaving a 15 mm gap (7) between the lid and the lower part of the chamber. This gap was used to release the ozone–air gas mixture from the experimental setup. The entire experimental setup, except for the ozone generator (8), was installed in a fume hood to prevent ozone from entering the laboratory environment and to ensure its extraction via the ventilation system.
Ozone concentration in the gas flow was periodically monitored using a “PortaSens II” gas analyzer (Analytical Technology, Inc., Collegeville, PA, USA) (9). Five different ozonation durations were selected: 10, 30, 60, 90, and 150 min. The samples were coded according to ozonation duration as follows: “O3-10”, “O3-30”, “O3-60”, “O3-90”, and “O3-150”. A control sample, coded “O3-0”, was also prepared for comparison.
The experiment was performed twice. In each experimental run, five samples were prepared, with each sample consisting of a set of 26 cheese slices. The cheese slices were threaded onto a metal rod and evenly distributed along the entire length of the ozonation chamber. After ozonation, the samples were hermetically packed and transferred to the laboratory, where three analytical subsamples were randomly prepared for microbial contamination analysis and proximate composition analysis.
2.3. Microbial Enumeration Procedure
The effect of ozone on microbial contamination of semi-hard cheese was evaluated by determining the counts of aerobic microorganisms, yeasts, and moulds remaining on the samples. Aerobic microorganisms were enumerated according to ISO 4833-1:2013/Amd 1:2022 [
30], whereas yeasts and moulds were enumerated according to ISO 6611:2004 [
31]. Microorganism counts were expressed as colony-forming units per gram (CFU/g) of product and reported as mean ± 95% confidence interval (CI). To enable comparison with other studies, microbial contamination data were additionally presented in the result tables as logarithmic colony-forming units per gram(log CFU/g) values. Logarithmic values were calculated by applying a log
10 transformation to the CFU/g values of each replicate, followed by calculation of the mean and 95% CI.
The analyses were performed in triplicate for each ozonated semi-hard cheese sample and in six replicates for the control sample. A cheese portion was aseptically taken from each sample and transferred into a “DiluFlow” gravimetric diluter (Interscience, Saint-Nom-la-Bretèche, France), which calculated and added the required amount of diluent. For this purpose, 10 g of cheese sample was mixed with 90 g of potassium dihydrogen phosphate solution. The prepared sample was then transferred into a “BagMixer 400 CC” homogenizer (Interscience, Saint-Nom-la-Bretèche, France), where the contents of the bag were mixed and homogenized. The resulting cheese suspension in potassium dihydrogen phosphate solution was used for further plating.
For the enumeration of aerobic microorganisms, the homogenized samples were further diluted through five decimal dilution steps [
30]. For the enumeration of yeasts and moulds, the samples were diluted through one additional decimal dilution step [
31]. Dilutions were prepared by transferring 1 mL of the homogenized sample into a tube containing 9 mL of buffered peptone water. Then, 1 mL of the diluted sample was transferred into a Petri dish and overlaid with culture medium.
Milk plate count agar (MPCA; Merck, Darmstadt, Germany) was used for the enumeration of aerobic microorganisms. Yeast extract glucose chloramphenicol agar (YGC; Merck, Darmstadt, Germany) was used for the enumeration of yeasts and moulds. Plates prepared for aerobic microorganism enumeration were incubated at 30 °C for 3 days, whereas plates prepared for yeast and mould enumeration were incubated at 25 °C for 5 days.
Colonies grown on the Petri dishes were counted using a colony counter equipped with a magnifying lens. When the number of colonies exceeded 150 colonies per plate, the plate was recorded as too numerous to count. To obtain a more accurate estimate of microbial contamination, plates from higher dilution levels were used.
2.4. Proximate Composition Analysis of Cheese
The moisture content and proximate composition of the cheese samples, including dry matter, protein, fat, and salt content, were determined according to ISO 21543:2020 [
32] using a “FoodScan” food composition analyzer (FOSS, Hilleroed, Denmark). The operating principle of the analyzer is based on near-infrared transmittance spectroscopy (NIT), in which infrared radiation passes through the food sample and the composition of the product is determined from the absorption characteristics of the transmitted radiation.
Before analysis, the samples were ground, homogenized, and placed in an analysis dish [
32]. For each analysis, 60 g of material was prepared from the ozonated semi-hard cheese sample. The prepared sample was placed into a special analysis dish and inserted into the “FoodScan” analyzer for spectroscopic measurement.
For each ozonated sample, proximate composition parameters, including moisture, dry matter, protein, and fat content, were determined in triplicate. For the control sample, four replicates were performed. Protein and fat contents, initially expressed on a wet weight basis, were recalculated to a dry matter basis using Equation (1), based on the measured moisture content:
where
is the content of the component on a dry matter basis, %;
is the measured content of the component in the sample, %; and
is the moisture content of the sample, %.
2.5. Statistical Analysis
The statistical significance of the data was evaluated using one-way analysis of variance (one-way ANOVA). When statistically significant differences were detected, the Tukey–Kramer post hoc test was applied for further analysis to assess the significance of differences between individual sample groups.
Three significance levels were used for result interpretation: results were considered statistically significant at (p < 0.05), highly statistically significant at (p < 0.01), and interpreted as indicating a trend toward statistical significance when (0.05 ≤ p < 0.10).
One-way ANOVA and Tukey–Kramer test calculations were performed using the online calculator “One-way ANOVA (Analysis of Variance) with post hoc Tukey HSD (Honestly Significant Difference) Test Calculator for Comparing Multiple Treatments”. Mean values and confidence intervals were calculated using Microsoft Excel (Microsoft Corporation, Redmond, WA, USA) to assess data variability.
3. Results
3.1. Effect of Ozone on Aerobic Microorganism, Yeast, and Mould Counts on Cheese Samples
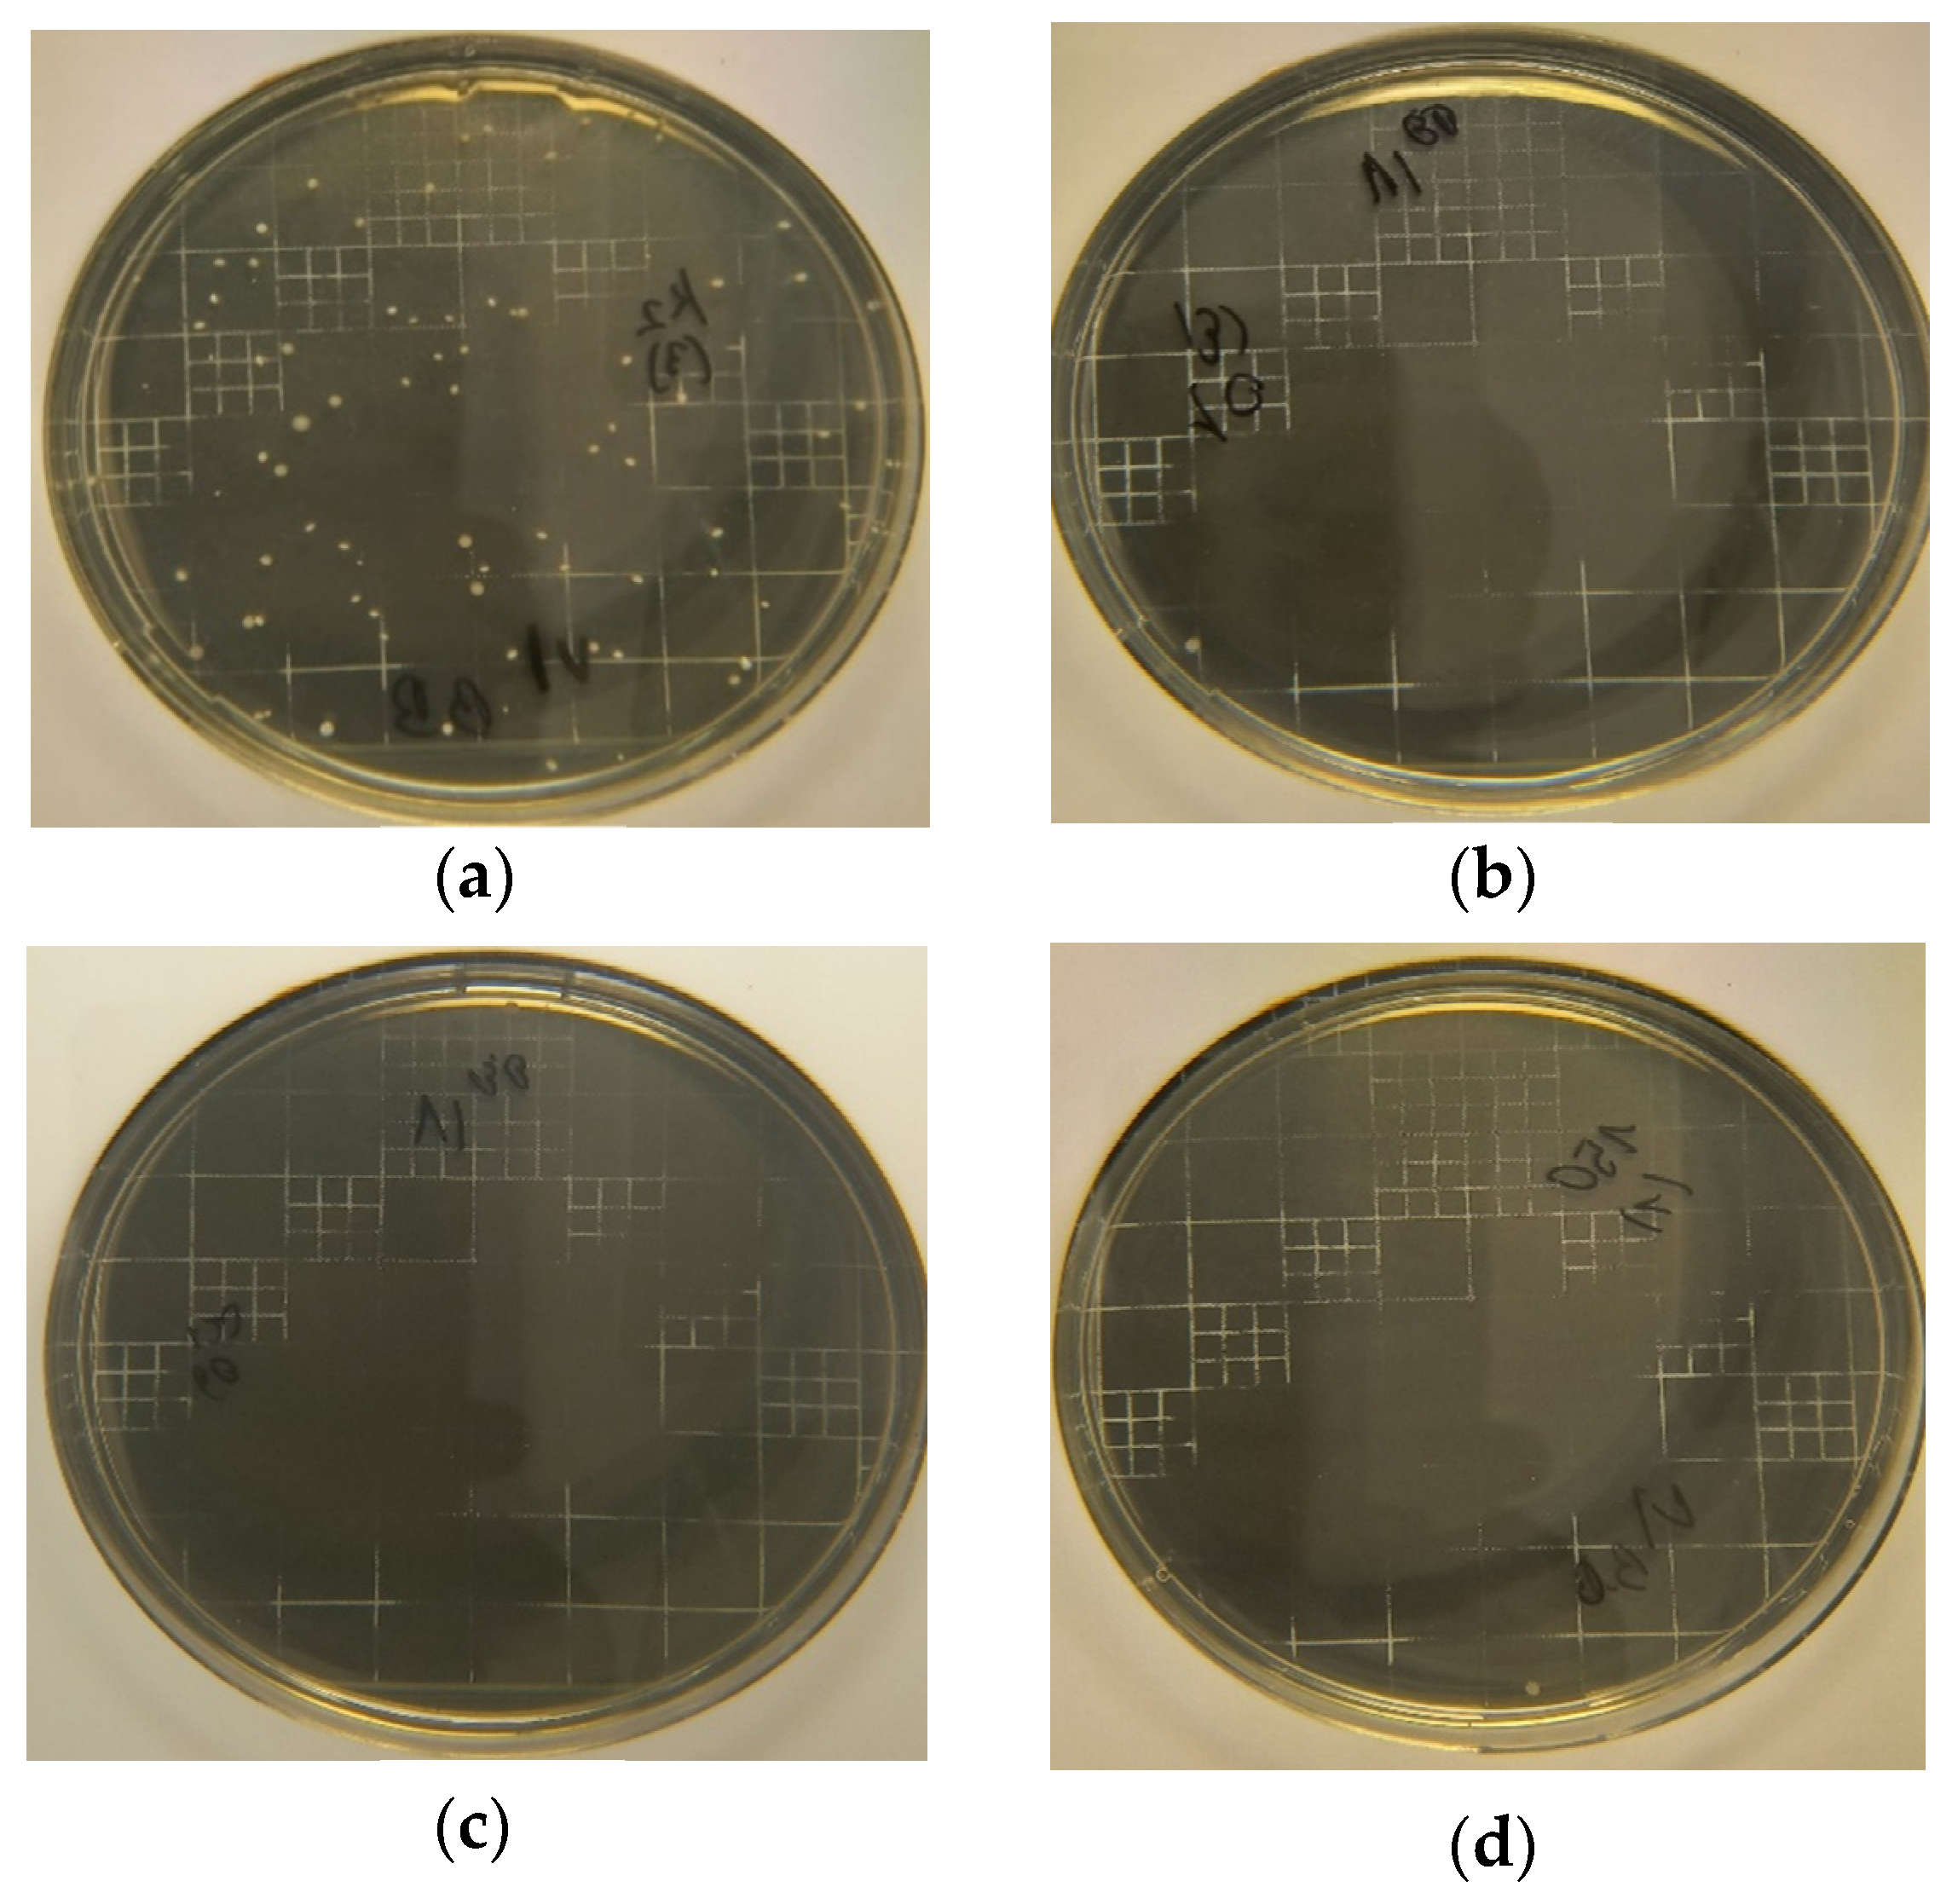
Ozone treatment markedly reduced aerobic microorganism counts on the cheese samples (
Figure 2). After 10 min of ozonation, the counts decreased from 2826 ± 1911 × 10
4 CFU/g in the control samples to 275 ± 184 × 10
4 CFU/g in the ozonated samples (
Table 2).
After 30, 60, 90, and 150 min of ozonation, aerobic microorganism counts on the semi-hard cheese slices further decreased to 246 ± 90 × 104, 173 ± 132 × 104, 143 ± 44 × 104, and 127 ± 21 × 104 CFU/g, respectively. These values represented only 8.7%, 6.1%, 5.1%, and 4.5% of the counts determined in the control samples.
Thus, the largest reduction in aerobic microorganisms counts, corresponding to 90.3 percentage points, occurred during the first 10 min of gaseous ozone treatment. Further extension of the ozonation duration from 10 to 30 min reduced aerobic microorganism contamination in the semi-hard cheese samples by only an additional 1.0 percentage point. Increasing the treatment duration to 60, 90, and 150 min resulted in additional reductions of 3.6, 4.6, and 5.2 percentage points, respectively, corresponding to 6.1%, 5.1%, and 4.5% of the control level.
One-way ANOVA confirmed that treatment with gaseous ozone at a concentration of 4.84 ± 0.22 ppm affected aerobic microorganism contamination in semi-hard cheese. The calculated
p-value was 0.0252, which was below the significance level of 0.05. However, the Tukey–Kramer test did not confirm statistically significant differences between individual sample pairs. A trend toward more pronounced differences was observed only between the control and ozonated cheese samples (
Table 3). The calculated
p-values were below the 0.10 significance level but above 0.05. Therefore, these results were not sufficient to confirm statistically significant pairwise differences, but they indicated a tendency for differences between the control and ozonated samples.
This result was likely influenced by the high variability of aerobic microorganism counts (CFU/g) in the control samples. Nevertheless, ozone treatment showed a clear inhibitory effect on aerobic microorganisms. After gaseous ozone treatment, their counts decreased by more than one order of magnitude and continued to decrease gradually with increasing ozonation duration. Therefore, a 10 min treatment with gaseous ozone at a concentration of 4.84 ± 0.22 ppm can be considered sufficient to achieve a marked reduction in aerobic microorganism counts.
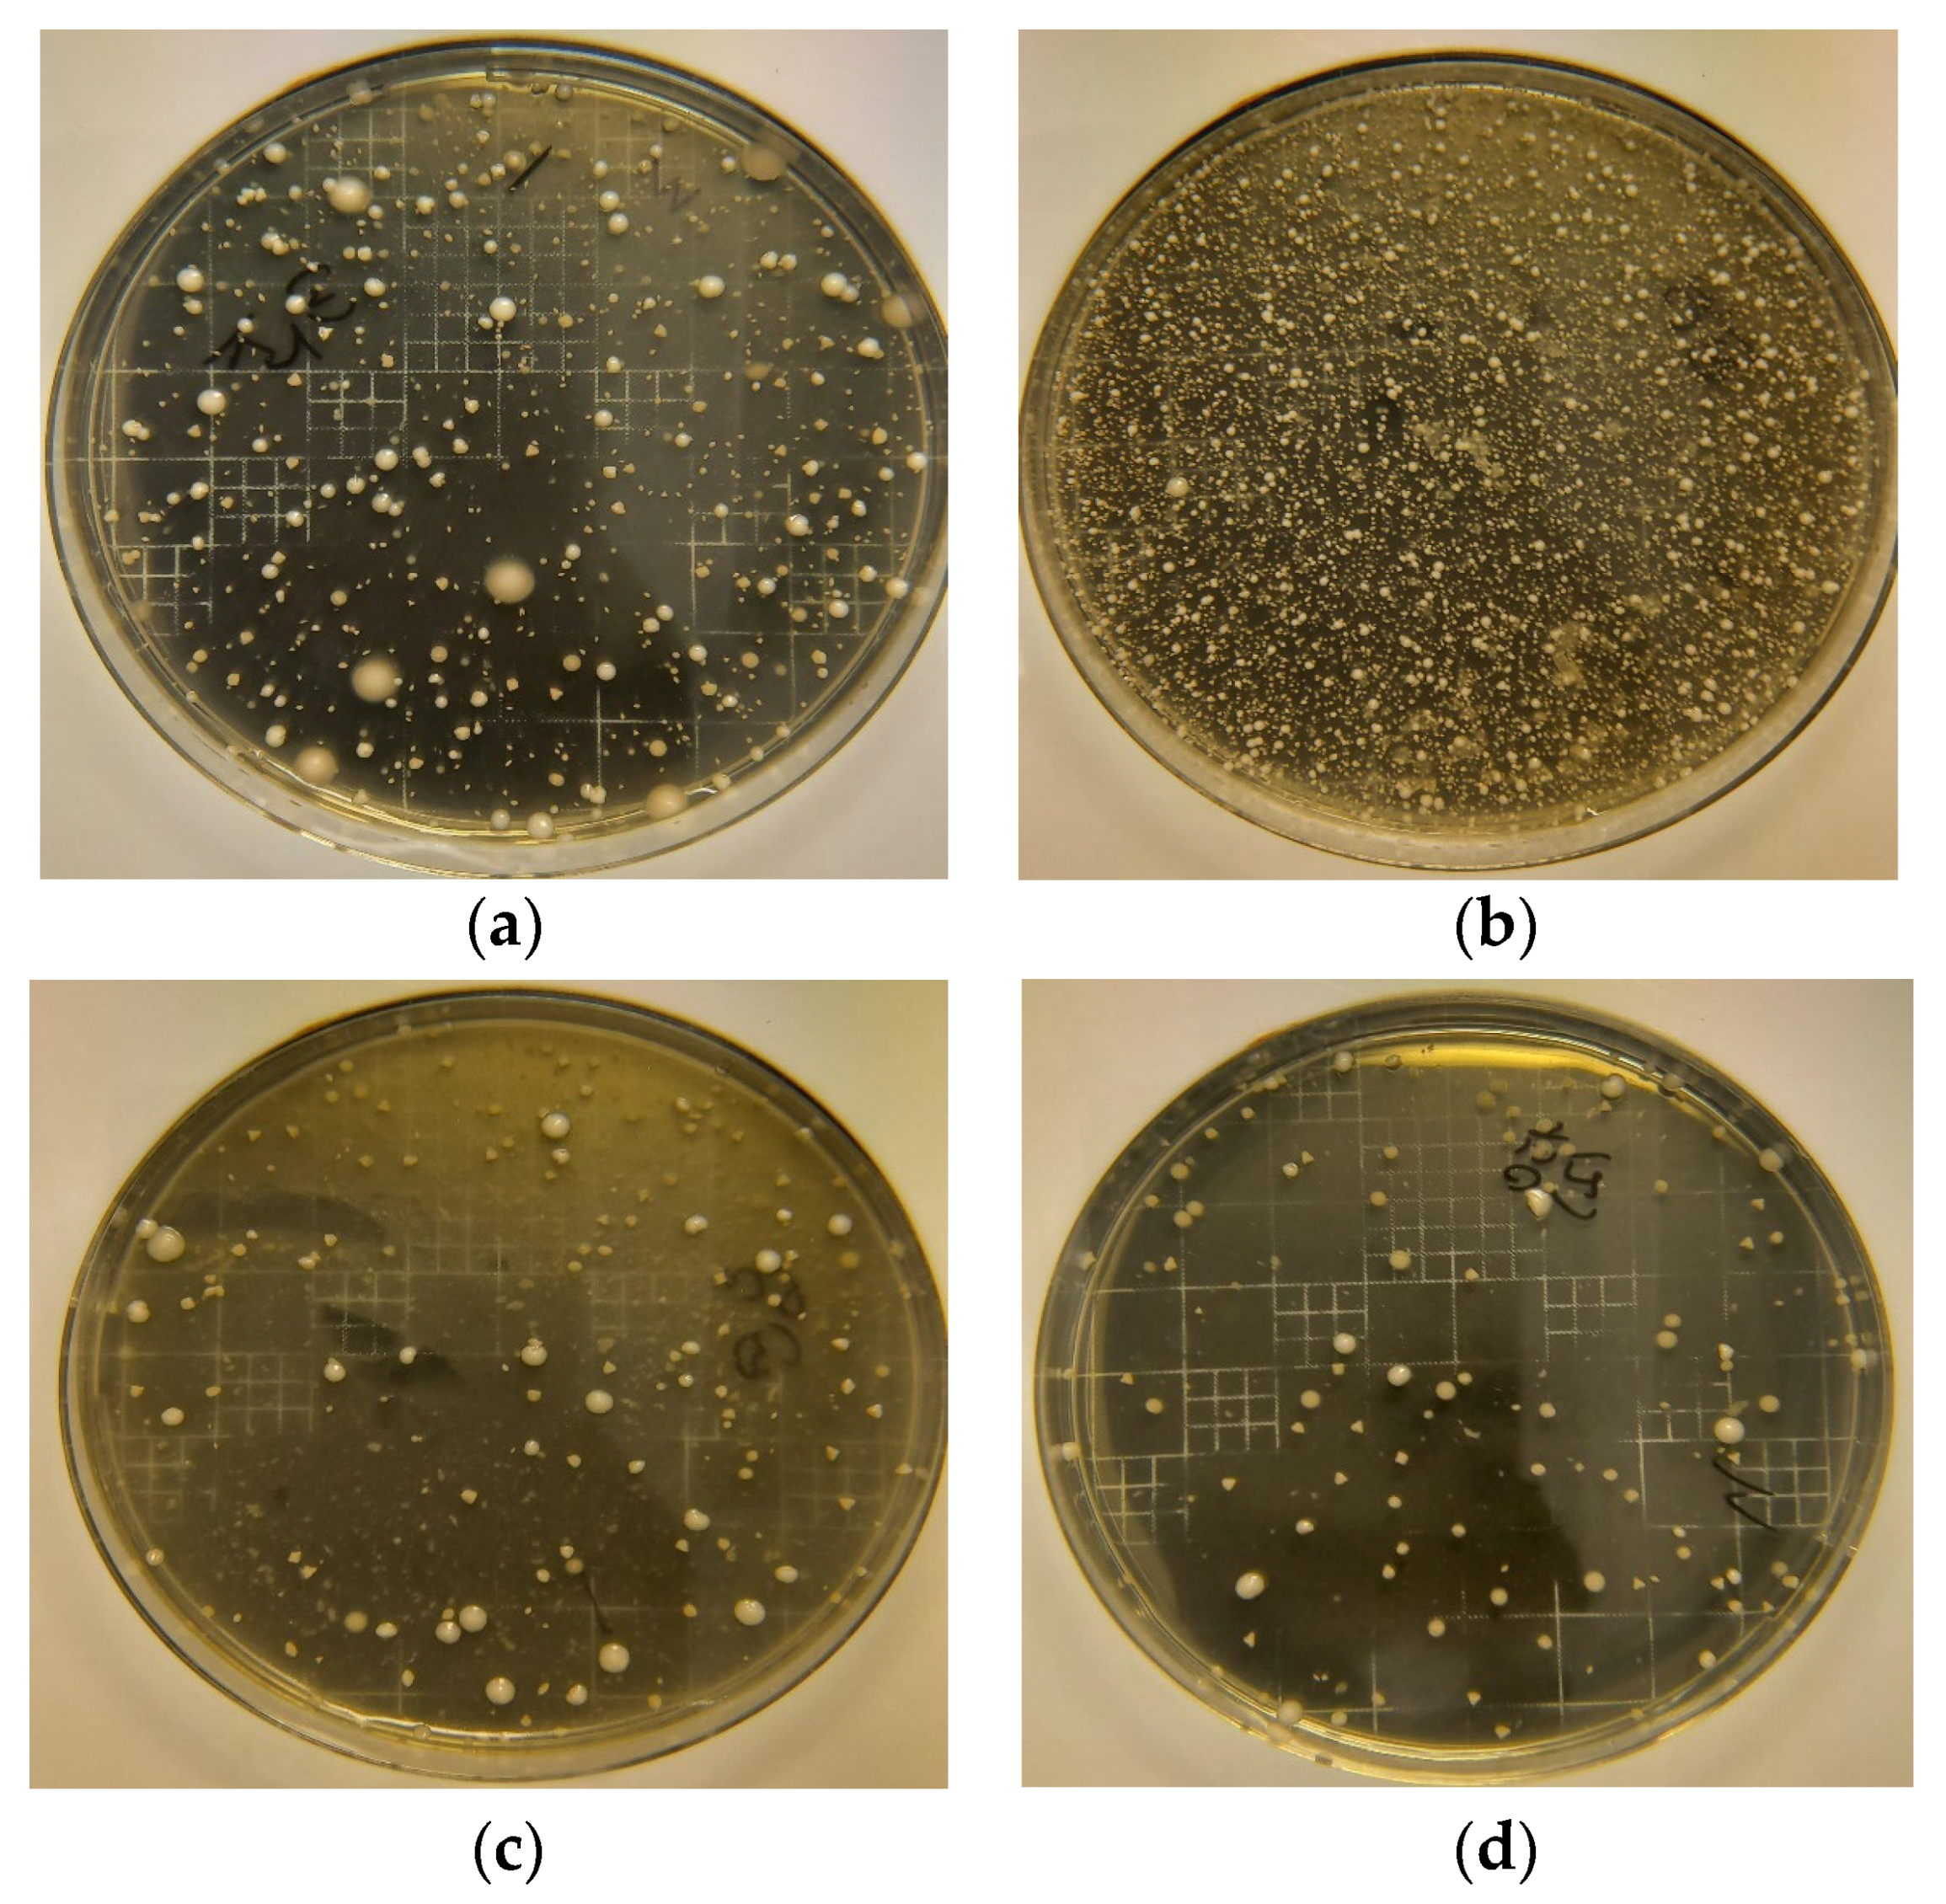
Yeasts were less sensitive to ozone treatment than aerobic microorganisms (
Figure 3). During the first 10 and 30 min of ozonation, yeast counts were higher than in the control sample, increasing from 3687 ± 1090 CFU/g to 8550 ± 3753 CFU/g and 7738 ± 3189 CFU/g, respectively. These values corresponded to 2.32- and 2.10-fold higher counts than those observed in the control sample (
Table 4).
After 60 min of ozonation, yeast counts decreased markedly and reached only 41.5% of the contamination level determined in the control samples. Longer ozonation durations resulted in a further reduction in yeast colony counts: after 90 min of treatment, yeast counts reached 32.6%, whereas after 150 min they reached 32.8% of the initial yeast contamination level on the semi-hard cheese slices. These results indicate that yeasts were less sensitive to ozone treatment than aerobic microorganisms and required longer exposure to achieve a suppressive effect.
One-way ANOVA showed that treatment with gaseous ozone at a concentration of 4.84 ± 0.22 ppm affected yeast counts. The calculated p-value was 4.22 × 10⁻⁸, which was below the significance level of 0.01, indicating statistically significant differences among the sample groups.
The Tukey–Kramer test showed statistically significant differences between the control samples and the samples ozonated for 10 and 30 min (
Table 5). These short-term ozonation treatments also differed significantly from the samples exposed to longer ozonation durations of 60, 90, and 150 min.
Short-term ozonation of the semi-hard cheese slices for 10 and 30 min was associated with an increase in yeast counts, whereas longer ozonation for 60, 90, and 150 min was associated with a decrease in yeast counts. However, because of the high variability of yeast counts in the control samples, the yeast counts in the longer-ozonated samples did not differ significantly from those in the control samples. Nevertheless, a pronounced numerical reduction in yeast counts was observed in the samples ozonated for 60–150 min. Compared with the control samples, yeast counts were lower by 58.5–67.4 percentage points, reaching 1530 ± 374 CFU/g, 1202 ± 183 CFU/g, and 1210 ± 119 CFU/g after 60, 90, and 150 min of ozonation, respectively. A similar pattern was observed when evaluating the effect of ozone on aerobic microorganism counts. Thus, treatment of semi-hard cheese with gaseous ozone at a concentration of 4.84 ± 0.22 ppm reduced yeast counts, but the suppressive effect became evident only when the ozonation duration exceeded 30 min.
The effect of ozonation on mould counts could not be clearly determined, as mould colony counts varied randomly among the samples. This suggests that the semi-hard cheese slices were affected by uneven mould contamination. Mean mould counts in the samples ranged from 38 ± 52 CFU/g to 10 ± 13 CFU/g (
Table 6).
The highest mould contamination was detected in the control semi-hard cheese samples, with a mean count of 38 ± 52 CFU/g. After 10 and 30 min of ozonation, mould counts decreased to 23 ± 40 CFU/g and 10 ± 13 CFU/g, respectively. These values corresponded to 60.9% and 26.1% of the contamination level determined in the control samples.
In the samples ozonated for 60 and 90 min, mould counts were higher than those observed after 30 min of treatment, reaching 18 ± 23 CFU/g and 18 ± 42 CFU/g, respectively. After 150 min of ozonation, mould counts decreased again to 15 ± 18 CFU/g, corresponding to 39.1% of the initial mould contamination level.
One-way ANOVA showed that treatment with gaseous ozone at a concentration of 4.84 ± 0.22 ppm did not have a statistically significant effect on mould contamination of semi-hard cheese. The calculated p-value was 0.752, which was higher even than the 0.10 significance level. Therefore, no statistically significant differences were found between the mean mould counts of the different sample groups. The measured values varied within the error ranges; thus, it cannot be concluded that ozonation had a reliable effect on mould contamination of semi-hard cheese.
3.2. Effect of Ozone on Fat and Protein Content in Semi-Hard Cheese
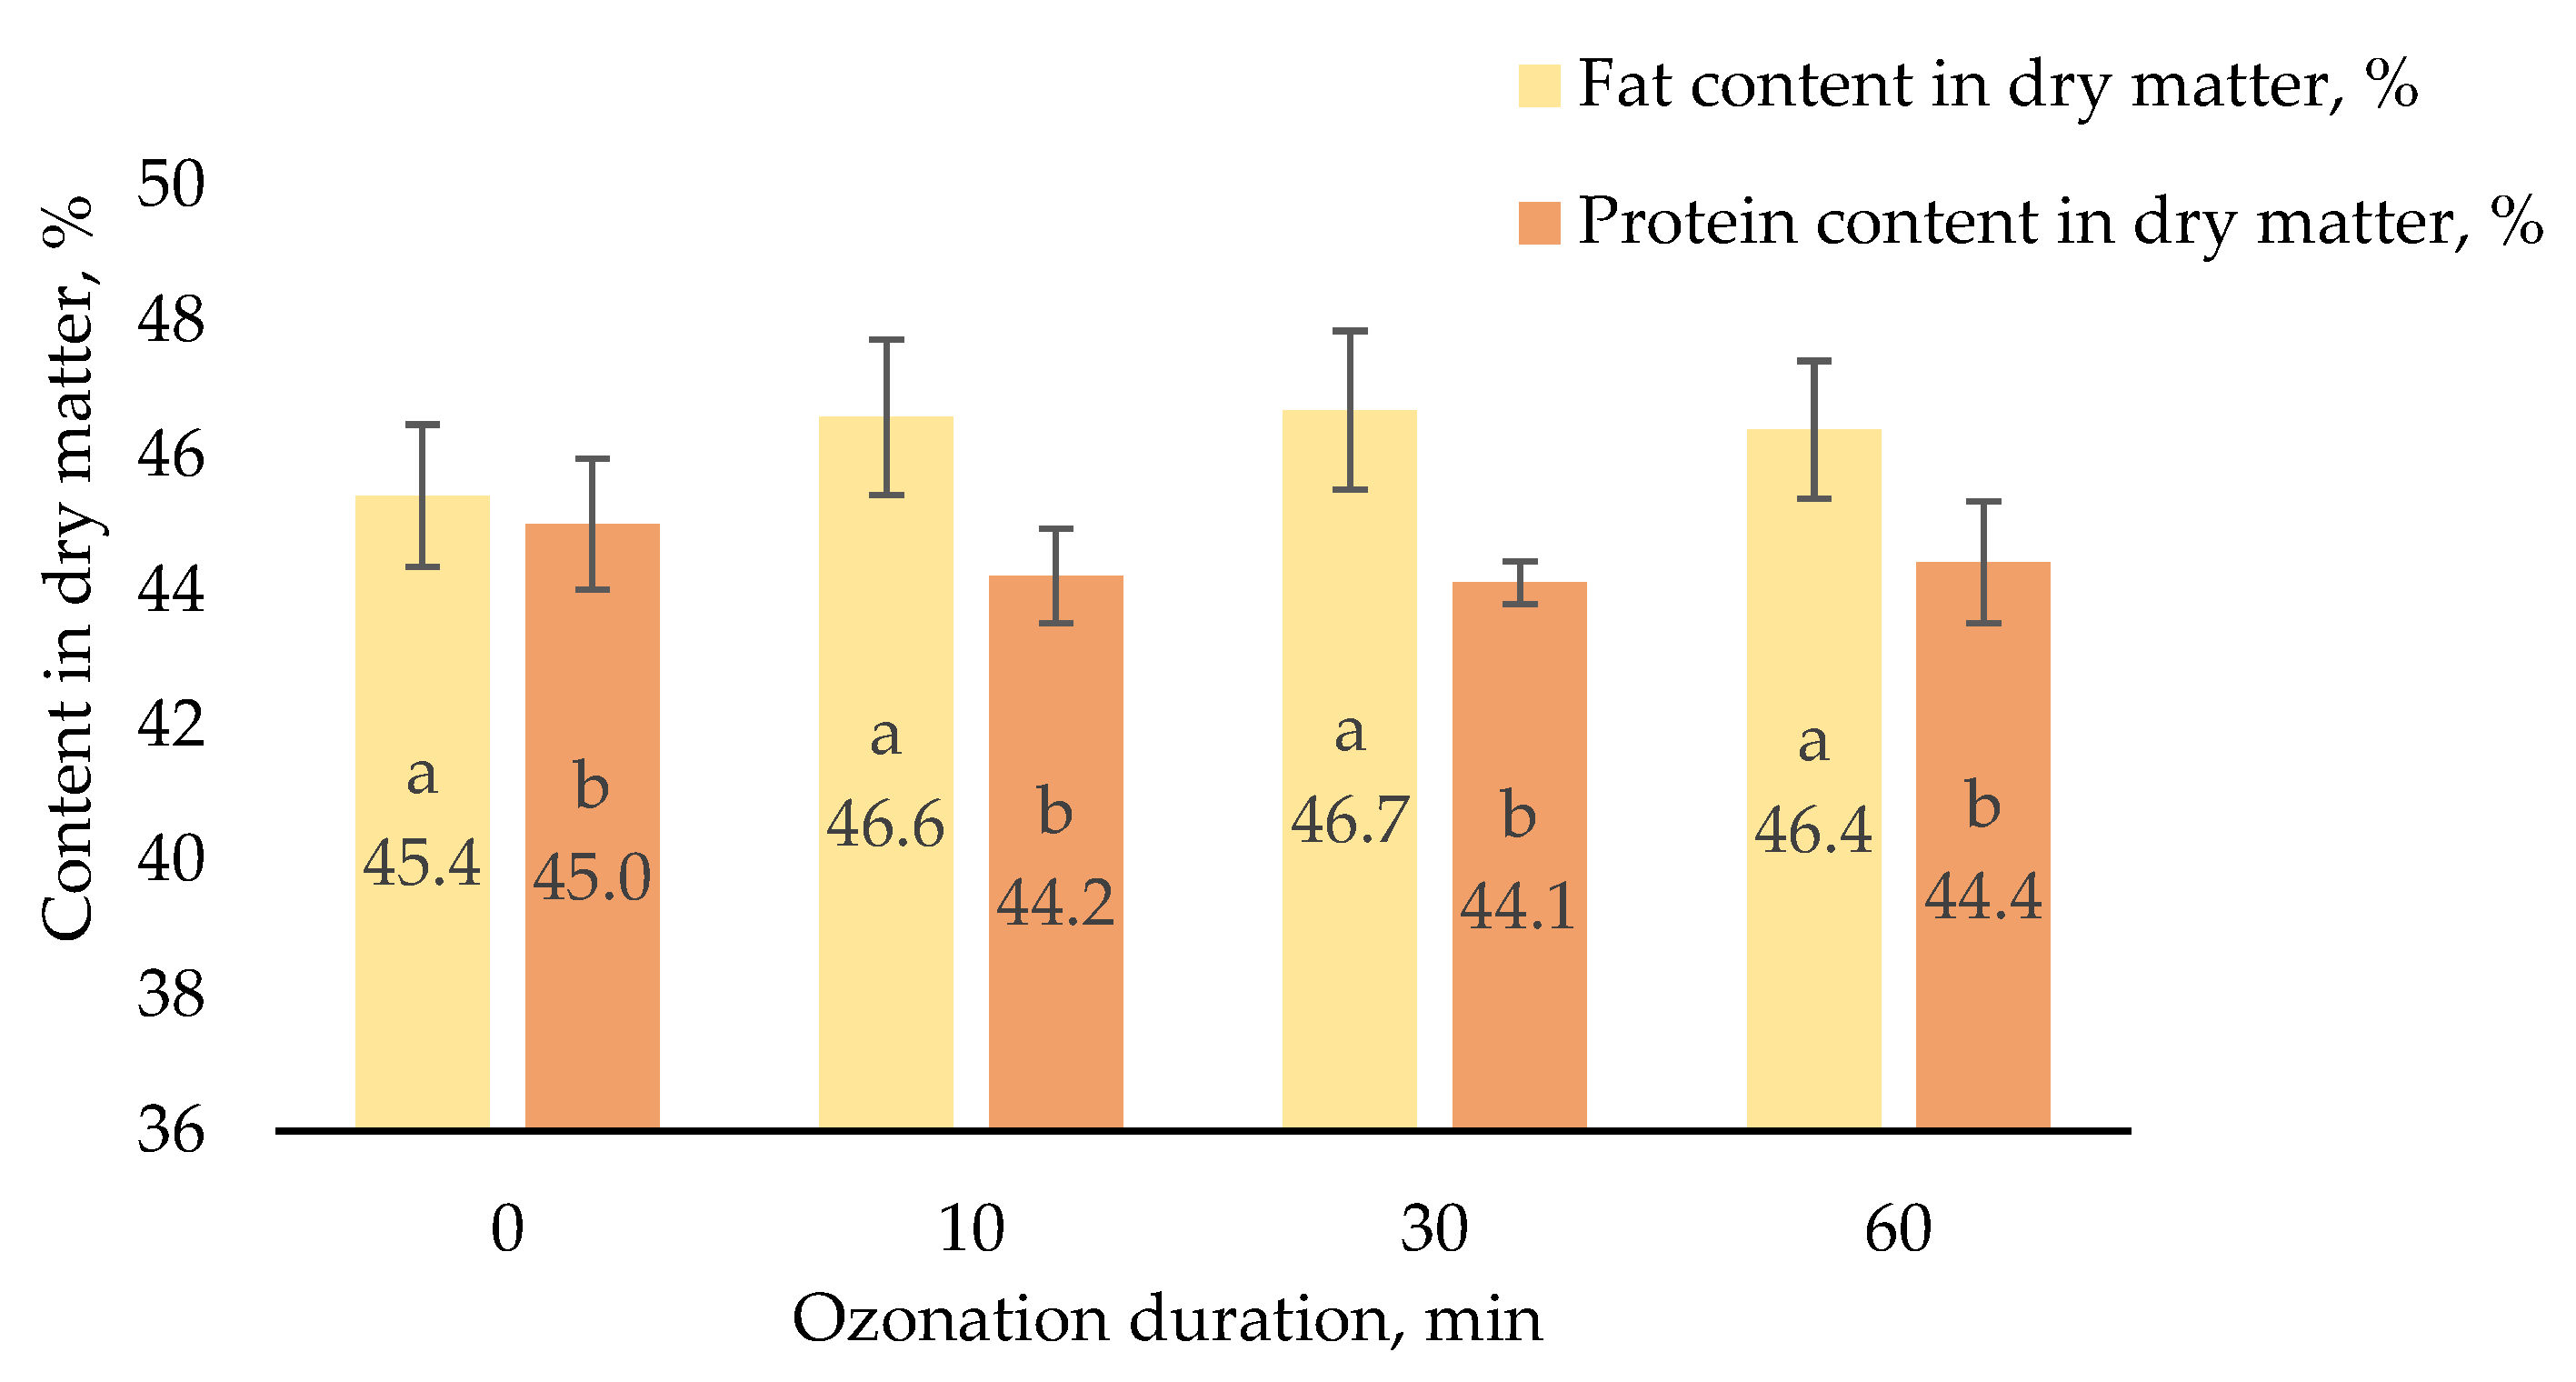
No statistically significant effect of ozone on fat content was observed in the cheese samples. One-way ANOVA showed a
p-value of 0.1178, which was higher than the significance level of 0.05. Therefore, ozonation and treatment duration did not have a statistically significant effect on fat content. Fat content ranged from 45.4 ± 1.10% in the control sample to 46.4 ± 1.21% in the sample ozonated for 60 min (
Figure 4). The highest fat content was recorded in the sample ozonated for 30 min, reaching 46.7 ± 1.28%.
No statistically significant effect of ozone was observed on protein content either. One-way ANOVA produced a p-value of 0.1389. Thus, based on the one-way ANOVA results, gaseous ozone did not have a statistically significant effect on either fat or protein content in the samples. Protein content in the control sample was 45.0 ± 0.97%, which was the highest value determined among the tested samples. In the sample ozonated for 60 min, protein content was 44.4 ± 0.91%.
3.3. Effect of Ozone on Moisture Content in Semi-Hard Cheese
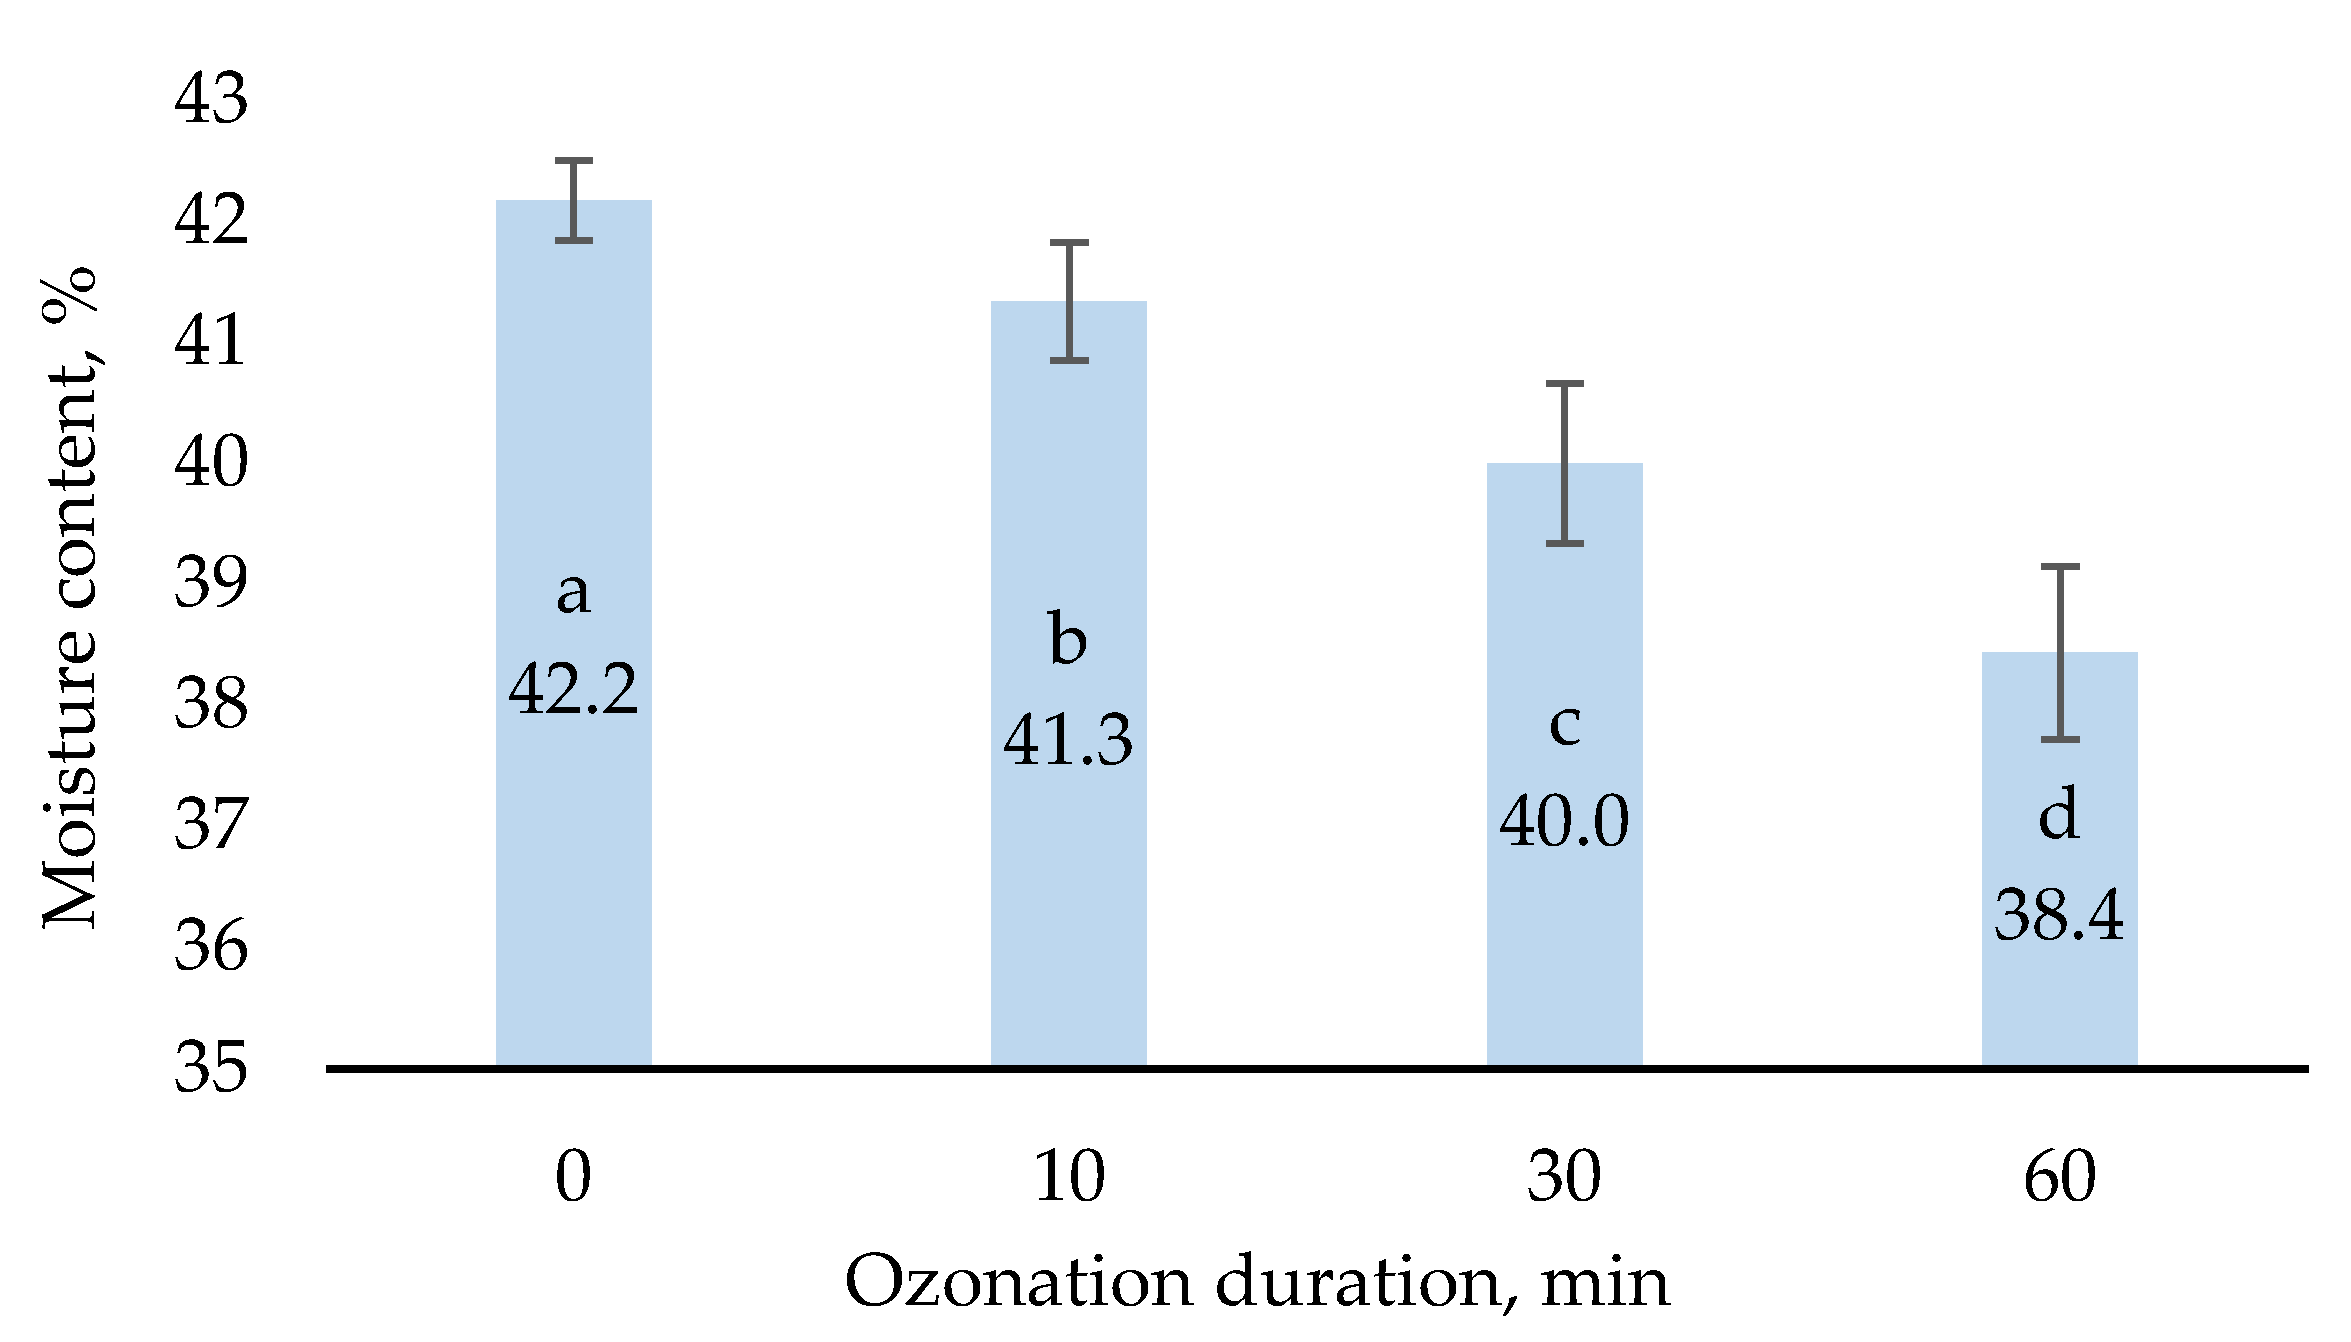
Ozonation had a statistically significant effect on the moisture content of semi-hard cheese samples (
Figure 5). One-way ANOVA showed that the calculated
p-value was 0.349 × 10
−9, which was below both the 0.05 and 0.01 significance levels, indicating statistically significant differences among the tested samples. Further analysis using the Tukey–Kramer test confirmed statistically significant differences between the control sample and samples ozonated for 10 min (
p = 0.0295), 30 min (
p = 0.001005), and 60 min (
p = 0.001005). Significant differences were also observed between the ozonated samples treated for 10 and 30 min (
p = 0.001156), 10 and 60 min (
p = 0.001005), and 30 and 60 min (
p = 0.001005).
Moisture content was 42.2 ± 0.33% in the control sample, 41.3 ± 0.49% in the sample ozonated for 10 min, and 40.0 ± 0.66% in the sample ozonated for 30 min, whereas it decreased to 38.4 ± 0.71% after 60 min of ozonation. These results indicate that longer ozonation promoted moisture loss in semi-hard cheese under the tested conditions. Therefore, although ozonation contributed to the reduction in surface microbiological contamination, longer exposure times may also affect cheese moisture content and should be considered when optimizing treatment conditions.
4. Discussion
The rapid decrease in aerobic microorganism counts after only 10 min of ozonation may be attributed to the strong oxidative effect of ozone on microbial surface structures. This effect can be explained by the ability of ozone to oxidize cell wall, membrane, and cytoplasmic components, including proteins, enzymes, and unsaturated fatty acids. As a result, membrane integrity may be disrupted, enzyme and transport protein activity may be impaired, and leakage of intracellular contents followed by cell death may occur. Ozone antimicrobial activity has been associated with damage to the cell envelope, oxidation of proteins and enzymes, and peroxidation of polyunsaturated fatty acids [
28]. It has also been reported that ozone can attack various microbial structures and that double bonds in unsaturated fatty acids are particularly sensitive to ozone [
6]. Further extension of the ozonation duration beyond 10 min resulted in only a limited additional decrease in aerobic microorganism counts. This may indicate that the most sensitive fraction of the surface microbiota was rapidly inactivated, whereas after the initial treatment, more resistant or physically better-protected microbial cells remained.
The increase in yeast counts after 10 min of ozonation may be explained by the ability of yeasts to temporarily withstand oxidative stress through protective cellular mechanisms. Compared with aerobic microorganisms, yeasts may activate several stress-response and repair systems, including direct mutation repair, mismatch repair, DNA excision repair, and reduction in reactive oxygen species [
33]. Cells are protected against reactive oxygen species by both non-enzymatic and enzymatic defence systems. In non-enzymatic defence systems, reactive oxygen species react with specific molecules and are converted into reduced products. These molecules include glutathione, phytochelatins, polyamines, ascorbic acid, trehalose, metallothioneins, flavohaemoglobin, thioredoxin, and glutaredoxin. In contrast, enzymatic defence systems catalyse decomposition reactions and remove reduced compounds. Catalase catalyses the decomposition of H
2O
2 into O
2 and H
2O, superoxide dismutase removes superoxide ions from the cytoplasm, glutathione reductase reduces oxidized glutathione, and methionine reductase acts as an antioxidant and protects proteins [
34].
However, after longer ozonation times, yeasts became more sensitive to ozone treatment. The initial increase in yeast counts may be interpreted as a possible hormetic response, in which mild stress activates cellular physiological functions as an adaptive response. Under such conditions, cells may temporarily increase metabolic activity, development, or division. Similar effects have been reported in studies using oxidative stress agents. After exposure to H
2O
2, the number of colony-forming units of yeasts grown in fructose medium increased by 155%, whereas that of yeasts grown in glucose medium increased by 130%, at H
2O
2 concentrations of 25 and 50 mmol/L, respectively [
35]. The observed increase in yeast counts may also have been influenced by additional oxygen formed during ozone decomposition, as oxygen can stimulate cellular physiological activity. Short-term exposure of
Saccharomyces cerevisiae to neutral oxygen radicals has been reported to increase yeast counts by 10% after one day and by 20% after two days compared with the control sample [
36]. Therefore, the oxidative effect of ozone may initially activate cellular defence mechanisms and physiological processes; however, under stronger or longer exposure, these protective mechanisms may no longer be sufficient to counteract oxidative stress.
In the case of moulds, no clear effect of ozone was determined. Mould counts in the control sample were low and highly variable, indicating uneven mould contamination of the semi-hard cheese slices. In other words, the obtained results do not necessarily indicate that ozone was ineffective against moulds. On the contrary, mould contamination in the ozonated samples accounted for 26.1–69.0% of the contamination level determined in the control sample. However, the overall level of mould contamination on the cheese slices was low and characterized by high variability. According to the microbiological quality criteria for cheese used in a previous study, yeast and mould counts of up to 6 log CFU/g (1.0 × 10
6 CFU/g) are considered satisfactory [
4]. Therefore, the values obtained in the present study indicate low surface mould contamination, as the determined mould counts ranged only from 10 to 38 CFU/g, corresponding to approximately 1.00–1.58 log CFU/g.
Studies by other authors confirm that ozone can inhibit mould growth in cheese-related environments; however, its effect is usually inhibitory rather than completely eliminative. In a study on the effect of gaseous ozone on the rind of Torta del Casar cheese, ozone concentrations of 2 and 6 mg/m
3 reduced
Mucor plumbeus counts by approximately 2 log cycles, but did not completely eliminate moulds [
26]. Under industrial conditions, the same study showed that 2 mg/m
3 ozone significantly reduced filamentous fungi on the cheese rind after 30 and 45 days of ripening; however, by day 60, the difference between the control and ozonated cheese was no longer observed [
26]. A similar tendency has been reported for cheese ripening rooms, where ozone can strongly reduce the number of airborne mould spores, whereas its effect on mould already present on surfaces is limited [
6].
To provide a broader evaluation of ozone effectiveness against undesirable microorganisms, it is also relevant to discuss its effect on a group of microorganisms not investigated in the present study, namely pathogenic microorganisms. In cheese production, the importance of these microorganisms is primarily associated not with direct sensory or technological changes in cheese quality, but with food safety and potential risks to consumer health. Pathogenic microorganisms may cause foodborne infections and intoxications, which can lead to gastrointestinal symptoms, including diarrhoea, vomiting, nausea, fever, and other health disorders. Relevant examples include Listeria monocytogenes, Salmonella spp., Staphylococcus aureus, and Campylobacter spp.
The effect of gaseous ozone on
Listeria monocytogenes and the natural microbiota of Gorgonzola cheese rind has been evaluated previously [
37]. In that study, gaseous ozone was applied at concentrations of 2 and 4 ppm for 10 min, and the samples were stored at 4 °C for 63 days after treatment. The ozone treatment was not effective in reducing
L. monocytogenes on Gorgonzola cheese rind. In the ozonated samples, final
L. monocytogenes counts were approximately 1 log CFU/g higher than in the control samples. This result was associated with a possible inhibitory effect of ozone on mesophilic lactobacilli, which may suppress the growth of
L. monocytogenes.
The effect of ozonated water on mature
Staphylococcus aureus and
Salmonella spp. biofilms formed on stainless steel food-contact surfaces has also been investigated [
38]. The study used 4-day-old mature biofilms formed on stainless steel plates. Treatment with 16 mg/L ozonated water for 20 min reduced the number of biofilm cells formed by
Staphylococcus aureus and
Salmonella spp. by less than 0.8 log CFU/cm
2. Although the reduction was not identical for both microorganism groups, the effect of ozonated water was limited in both cases. This limited effectiveness was associated with the protective effect of the extracellular polymeric matrix of mature biofilms, which may restrict ozone penetration and reduce its antimicrobial activity.
In another study, the combination of ozone with malic acid reduced
Salmonella enterica serovar Typhimurium biofilm formation on food-contact surfaces [
39]. In that study, a combination of 2% malic acid and 2 ppm ozonated water was evaluated. This treatment reduced
Salmonella biofilm formation on polyethylene bags and polyvinyl chloride (PVC) pipes. In the microtitre plate assay, biofilm formation decreased up to 5-fold after 20 h and up to 6-fold after 40 h of incubation. These results indicate that ozone may be more effective when applied together with additional antimicrobial agents; however, its effect depends on the microorganism, surface type, biofilm maturity, and treatment conditions.
Overall, these studies indicate that the effect of ozone on pathogenic microorganisms is not universal and depends on the specific food matrix, surface type, microbial state, and treatment conditions. The study on Gorgonzola cheese rind suggests that gaseous ozone may not act directly against Listeria monocytogenes in cheese rind, or may indirectly alter the balance of the natural microbiota. The data on mature Staphylococcus aureus and Salmonella spp. biofilms show that pathogenic bacterial biofilms on food-contact surfaces may be relatively resistant to ozonated water alone, whereas the results obtained with malic acid and ozone suggest that ozone effectiveness may be enhanced when it is combined with other antimicrobial agents. Therefore, the reduction in aerobic microorganism counts observed in the present study should not be directly equated with an effect on pathogenic microorganisms. To support the use of ozone for pathogen control in cheese production, further studies are needed to directly evaluate its effect on pathogens within the cheese matrix, on the cheese surface, and on cheese-contact surfaces.
Although no statistically significant effect of ozone on total fat content was observed in the present study, other studies indicate that ozone may affect the chemical state of lipids. Ozone reacts particularly readily with unsaturated fatty acids because their molecules contain double bonds. Such reactions may lead to the formation of peroxides, hydroperoxides, aldehydes, ketones, and other lipid oxidation products [
40]. Therefore, the effect of ozone on lipids should not be assessed only through changes in total fat content, but also through lipid oxidative stability and changes in the fatty acid profile. During cheese ripening, fat content may decrease as a result of lipolysis, during which triglycerides are hydrolysed into glycerol and free fatty acids [
40]. It has also been reported that, in some studies, ozonated milk or cheese products had lower fat content than control samples, whereas in other studies, no statistically significant differences in fat content were observed between ozonated and control samples [
40].
This may explain why changes in fat content were not statistically significant in the present study. Total fat content is not a sufficiently sensitive indicator for evaluating lipid oxidation. Fat content may remain similar even if some unsaturated fatty acids have already been oxidized or if their oxidative stability has decreased. In ozonated cheese samples, monounsaturated fatty acids (MUFA) and polyunsaturated fatty acids (PUFA) contents have been shown to change unevenly during ripening: MUFA content decreased up to day 35 and then increased, whereas PUFA content varied inconsistently depending on ripening time and treatment conditions [
40]. This indicates that lipid changes after ozonation may be complex and may depend on the cheese matrix, moisture content, microbial activity, lipase activity, ripening duration, and ozone dose. Therefore, the stability of total fat content observed in the present study should not be interpreted as evidence that lipid oxidation did not occur. To evaluate this more accurately, additional analyses such as peroxide value, thiobarbituric acid reactive substances (TBARS), free fatty acid content, or fatty acid profile determination would be required.
Similarly, no statistically significant effect of ozone on total protein content was observed in the present study. However, other studies have reported effects of ozone on protein structure, solubility, and susceptibility to proteolysis. Ozone has been shown to affect protein structure, with aromatic amino acid rings and thiol groups being particularly sensitive to oxidation; thiol group oxidation may lead to the formation of disulfide bridges [
41]. Ozone-induced changes in secondary and tertiary protein structures have also been observed, and such structural changes may affect molecular flexibility [
41]. It has also been reported that ozone mainly oxidizes tyrosine, tryptophan, histidine, cysteine, and methionine residues in proteins [
42]. In sulfur-containing amino acids, cysteine thiol groups may be oxidized to cystine, whereas methionine may be oxidized to sulfoxide and sulfone. In aromatic amino acids, ozone affects aromatic rings, leading to the formation of oxidized tryptophan, tyrosine, and histidine products. This suggests that the primary effect of ozone on proteins is not a decrease in total protein content, but rather chemical modification of sensitive amino acid residues.
The effect of ozone on amide groups has not been clearly established or appears to be less pronounced. In protein ozonation studies, the absorption intensity at 275 nm, associated with aromatic amino acids, decreased in ozonated protein samples, whereas the absorption maximum at 222 nm, attributed to amide bonds, remained similar [
42]. This suggests that ozone affects amino acid side chains, especially aromatic and sulfur-containing residues, more strongly than the main peptide backbone or amide groups. The solubility of ozonated proteins may also decrease, indicating protein denaturation caused by ozone-induced oxidation [
43]. Similarly, ozone may denature proteins by altering their secondary and tertiary structures, while the conversion of cysteine thiol groups into disulfide bonds may lead to protein denaturation, changes in solubility, and alterations in folding and binding properties [
40]. Ozone may also reduce the content of free sulfhydryl groups and increase protein surface hydrophobicity, thereby changing the functional properties of proteins [
40].
These molecular changes may explain why total protein content did not change significantly in the present study, even though ozone could theoretically affect protein structure. Total protein content, calculated based on nitrogen content, reflects the total amount of nitrogenous compounds in the sample, but does not indicate whether proteins have been oxidized, denatured, aggregated, or become less soluble [
40]. Therefore, protein molecules may undergo oxidative modifications while their total percentage content remains similar. This is particularly important when interpreting the results of the present study. One-way ANOVA did not show a statistically significant effect of ozonation on protein content, but this finding should not be equated with a complete absence of ozone effects on proteins.
In the present study, ozonation had a statistically significant effect on cheese moisture content. Moisture content decreased significantly after 10 min of ozonation and continued to decline with increasing treatment duration up to 60 min, when the final measurement was performed. This indicates that longer exposure to the ozone–air gas mixture may promote surface moisture loss from the product. This aspect is important for the practical application of ozone. Although ozone may reduce surface microbial contamination, excessive exposure may alter product moisture content and consequently affect texture, mass loss, and the interpretation of fat and protein contents expressed on a dry matter basis.
Climate change mitigation policy has long relied mainly on improving energy efficiency and expanding the use of low-carbon energy sources [
44]. However, material-use efficiency, reduction in material demand, and substitution with alternatives associated with lower environmental impacts are becoming increasingly important.
This perspective is particularly relevant to sanitation processes in the food industry, because conventional washing and disinfection systems are associated not only with high energy demand, but also with substantial consumption of water, detergents, and disinfectants [
45]. It has been reported that a traditional cleaning-in-place (CIP) cycle requires approximately 1000 L of water and 110 kWh of electricity, with the cleaning process itself representing a significant share of the total energy demand [
45]. In the reference dairy processing plant, approximately 40 million L of milk were processed annually, and about 30 CIP cleaning operations were performed per day [
45]. Assuming that approximately 10 L of milk are required to produce 1 kg of semi-hard cheese [
45,
46], approximately 444 kg of cheese production can be assigned to one CIP cycle. Consequently, the CIP-related cleaning demand allocated to 100 kg of semi-hard cheese production corresponds to approximately 225 L of water and 24.5 kWh of electricity.
In contrast, when ozone is used for microbial contamination control, the main operating demand is associated with electricity consumption. Unlike conventional washing and disinfection systems, ozonation does not require additional detergents or disinfectants. Therefore, it may reduce water demand, wastewater generation, and the environmental burden associated with the production and use of chemical cleaning and disinfection agents. For these reasons, the energy demand and overall environmental impact of ozonation technologies may be lower than those of conventional sanitation processes. For the ozonation of a 250 m
3 room containing approximately 2220 kg of semi-hard cheese during ripening, a gaseous ozone flow of approximately 31.2–62.4 g/h would be required to achieve an ozone concentration of 4.84 ppm for 60 min. The two OZ-NR-25-900 ozone generators, which produce a comparable amount of ozone, have a total electrical power demand of 0.84 kW [
47]. Therefore, the comparative energy demand allocated to 100 kg of semi-hard cheese would be only 0.038 kWh per ozonation cycle, corresponding to approximately 0.2% of the electricity demand associated with conventional CIP-based sanitation.