Article

A Tripartite Business Model Canvas for Assessing Maintenance Sustainability Maturity Level: Case Study in Seawater Desalination Plants


1
Mechanical Engineering School, Pontificia Universidad Católica de Valparaíso, Valparaiso 2340000, Chile
2
Graduate Programs in Production Engineering and in Accounting Sciences, Universidade Federal de Santa María, Santa Maria 97105-900, RS, Brazil
*
Author to whom correspondence should be addressed.
Sustainability 2026, 18(13), 6656; https://doi.org/10.3390/su18136656
Submission received: 13 May 2026 / Revised: 11 June 2026 / Accepted: 23 June 2026 / Published: 1 July 2026
(This article belongs to the Special Issue Sustainability Physical Asset Life Cycles)

Abstract

Maintenance plays an increasingly strategic role across industrial sectors, influencing not only asset availability and operational efficiency but also environmental and social performance. However, assessing the sustainability of maintenance practices remains a cross-disciplinary challenge due to the absence of integrative, broadly applicable evaluation frameworks. This study introduces the Tripartite Business Model Canvas (T-BMC), a novel diagnostic instrument that reconceptualises maintenance as a business model structured around the Triple Bottom Line. By embedding each of the nine Business Model Canvas blocks within the economic, environmental, and social dimensions, the T-BMC yields 27 analytical elements, operationalised through a 24-item assessment instrument after three design consolidations to avoid construct redundancy. The instrument supports maturity assessment, benchmarking, and continuous improvement across diverse industrial contexts. An exploratory pilot study with 17 maintenance experts from the Chilean seawater desalination sector assessed its applicability, internal coherence, and contextual relevance. The overall perceived maturity level was 3.96 out of 5, with the Social dimension scoring highest (4.10) and the Economic dimension lowest (3.88); at the block level, Key Activities (4.27) and Value Propositions (4.10) were the strongest areas, while Channels (3.74) and Revenue Streams (3.78) revealed the main sustainability gaps. Internal consistency was strong (Cronbach’s α = 0.94 overall; 0.85, 0.82, and 0.89 for the economic, environmental, and social subscales), although, given the sample size (n = 17), these findings constitute preliminary evidence rather than confirmatory validation. A Maintenance Sustainability Dashboard further translates diagnostic outputs into actionable visual insights for decision-making and cross-plant benchmarking. These contributions offer a structured, transferable pathway for embedding sustainability within maintenance strategy and a basis for future quantitative indicator development and large-scale validation.

1. Introduction

Maintenance plays a pivotal role in ensuring the reliability, efficiency, and resilience of industrial systems. Beyond its traditional technical and cost-oriented scope, maintenance has increasingly been recognized as a strategic function that contributes to the broader objectives of sustainability—encompassing economic efficiency, environmental performance, and social responsibility [1,2]. As industries evolve toward digital and human-centric paradigms, the integration of sustainability principles into maintenance management has become both a technical and managerial imperative [3,4].
Despite the increasing attention given to sustainability in asset management, few studies have addressed maintenance as an integrated sustainability function [5]. Existing maturity and diagnostic models have primarily focused on technical or economic performance while overlooking cross-dimensional interactions. Consequently, the structured evaluation of maintenance sustainability remains fragmented, lacking frameworks that explicitly connect managerial, environmental, and social drivers. Furthermore, current diagnostic tools rarely provide mechanisms for visualizing maturity levels or benchmarking organizational progress, limiting their utility for decision-making and continuous improvement. This gap highlights the need for a holistic and operationally oriented model capable of assessing and guiding the sustainable transformation of maintenance systems.

1.1. Main Research Questions

Guided by the aforementioned gaps and the need for integrative frameworks that connect maintenance and sustainability, this research seeks to address two central questions:
  • How can maintenance be systematically conceptualized and assessed as a sustainable business function that integrates the economic, environmental, and social dimensions of the Triple Bottom Line?
  • Can the adaptation of the Business Model Canvas [6] into a Tripartite framework provide a practical instrument for evaluating the maturity level of sustainable maintenance practices in complex industrial systems?

1.2. Motivation, Justification and Contribution

This study contributes to sustainable maintenance, as an emerging field, by proposing and pilot-testing a Tripartite Business Model Canvas (T-BMC) as a diagnostic instrument for assessing the maturity level of maintenance sustainability. The model integrates the economic, environmental, and social dimensions of the Triple Bottom Line into a coherent business-oriented framework, enabling systematic evaluation, benchmarking, and continuous improvement of maintenance practices.
The selection of the Business Model Canvas as the conceptual foundation responds to specific limitations identified in existing diagnostic tools for sustainable maintenance. While methodologies such as hierarchical component models, maturity matrices, and multi-criteria frameworks have been proposed, they share a common constraint: they evaluate sustainability performance through isolated indicators without capturing the systemic interdependencies among organizational functions. The BMC, by contrast, provides a holistic architecture of nine interrelated building blocks that collectively represent how an organization creates, delivers, and captures value—a structure that maps naturally onto the relational complexity of maintenance management. Critically, the BMC has been previously adapted for maintenance as a business function [7], demonstrating its conceptual suitability; however, that adaptation did not integrate sustainability dimensions. The T-BMC addresses this gap directly. With respect to the seawater desalination sector specifically, the contribution is twofold: it provides the first structured sustainability maturity assessment framework tailored to the operational and environmental profile of desalination maintenance, and it generates sector-specific empirical baseline data that can serve as a reference point for future benchmarking as the Chilean desalination industry continues to expand in response to increasing water scarcity.
This research aligns with several United Nations Sustainable Development Goals (SDGs), particularly SDG 6 (Clean Water and Sanitation), SDG 7 (Affordable and Clean Energy), SDG 8 (Decent Work and Economic Growth), SDG 9 (Industry, Innovation and Infrastructure), SDG 12 (Responsible Production and Consumption), and SDG 13 (Climate Action). The structure and logic of the proposed framework are designed for generalizability across diverse industrial contexts, providing a foundation for advancing sustainable maintenance theory and practice.
The remainder of this paper is structured as follows: Section 2 presents a literature review that supports the proposed approach. Section 3 details the methodological framework, including the development of the T-BMC, the assessment instrument, and the visualization and benchmarking tools. Section 4 presents results and discussion, organized into: pilot study results, sustainability dashboard, benchmarking analysis, and prescriptive action plans. Section 5 summarizes the conclusions and identifies future research directions.

2. Literature Review

In recent years, advances in industrial infrastructure and digitalization have intensified the demand for sustainable maintenance practices capable of balancing economic performance, environmental protection, and social responsibility [6]. Maintenance, traditionally viewed as a technical and cost-centered function, is now recognized as a strategic enabler of sustainability [2]. Its contribution extends beyond asset availability and reliability to include energy efficiency, emissions reduction, resource optimization, and workforce well-being. Consequently, maintenance is increasingly conceptualized as a business function that must itself operate sustainably within the broader corporate sustainability agenda [7].
Despite this paradigm shift, research and industrial practice continue to face challenges in operationalizing sustainable maintenance. The assessment of sustainability maturity remains fragmented, often limited to economic or technical indicators while overlooking social and environmental dimensions [8]. The absence of standardized frameworks and validated diagnostic instruments constrains the ability of organizations to benchmark performance and guide continuous improvement. Although methodologies such as Hierarchical Component Models (HCM), multi-criteria decision methods (BWM, Fuzzy-TOPSIS) [9], and hybrid frameworks combining RAM analysis with sustainability indices [10] have contributed valuable insights, their application remains context-dependent and lacks systemic integration across the Triple Bottom Line (TBL) dimensions [11].
Recent literature highlights increasing attention to multidimensional sustainability models, with Maintenance 4.0 [12,13] and emerging Maintenance 5.0 paradigms [3] positioning digital technologies—such as IoT, data analytics, and digital twins—as key enablers for more efficient and eco-responsible operations [12,14,15]. These technologies enhance predictive diagnostics, optimize energy use, and extend asset life, thus reinforcing the economic [16,17] and environmental pillars of sustainability [18,19].
While sustainability assessment frameworks have been developed for specific sectors [20] such as manufacturing [1,21], transport [22], energy [23], oil and gas [24,25], and construction [26,27], the integration of sustainability principles into maintenance management remains insufficiently standardized [28,29,30]. Most existing approaches lack explicit mechanisms to evaluate maturity levels or to trace interdependencies between sustainability pillars and maintenance processes [31].
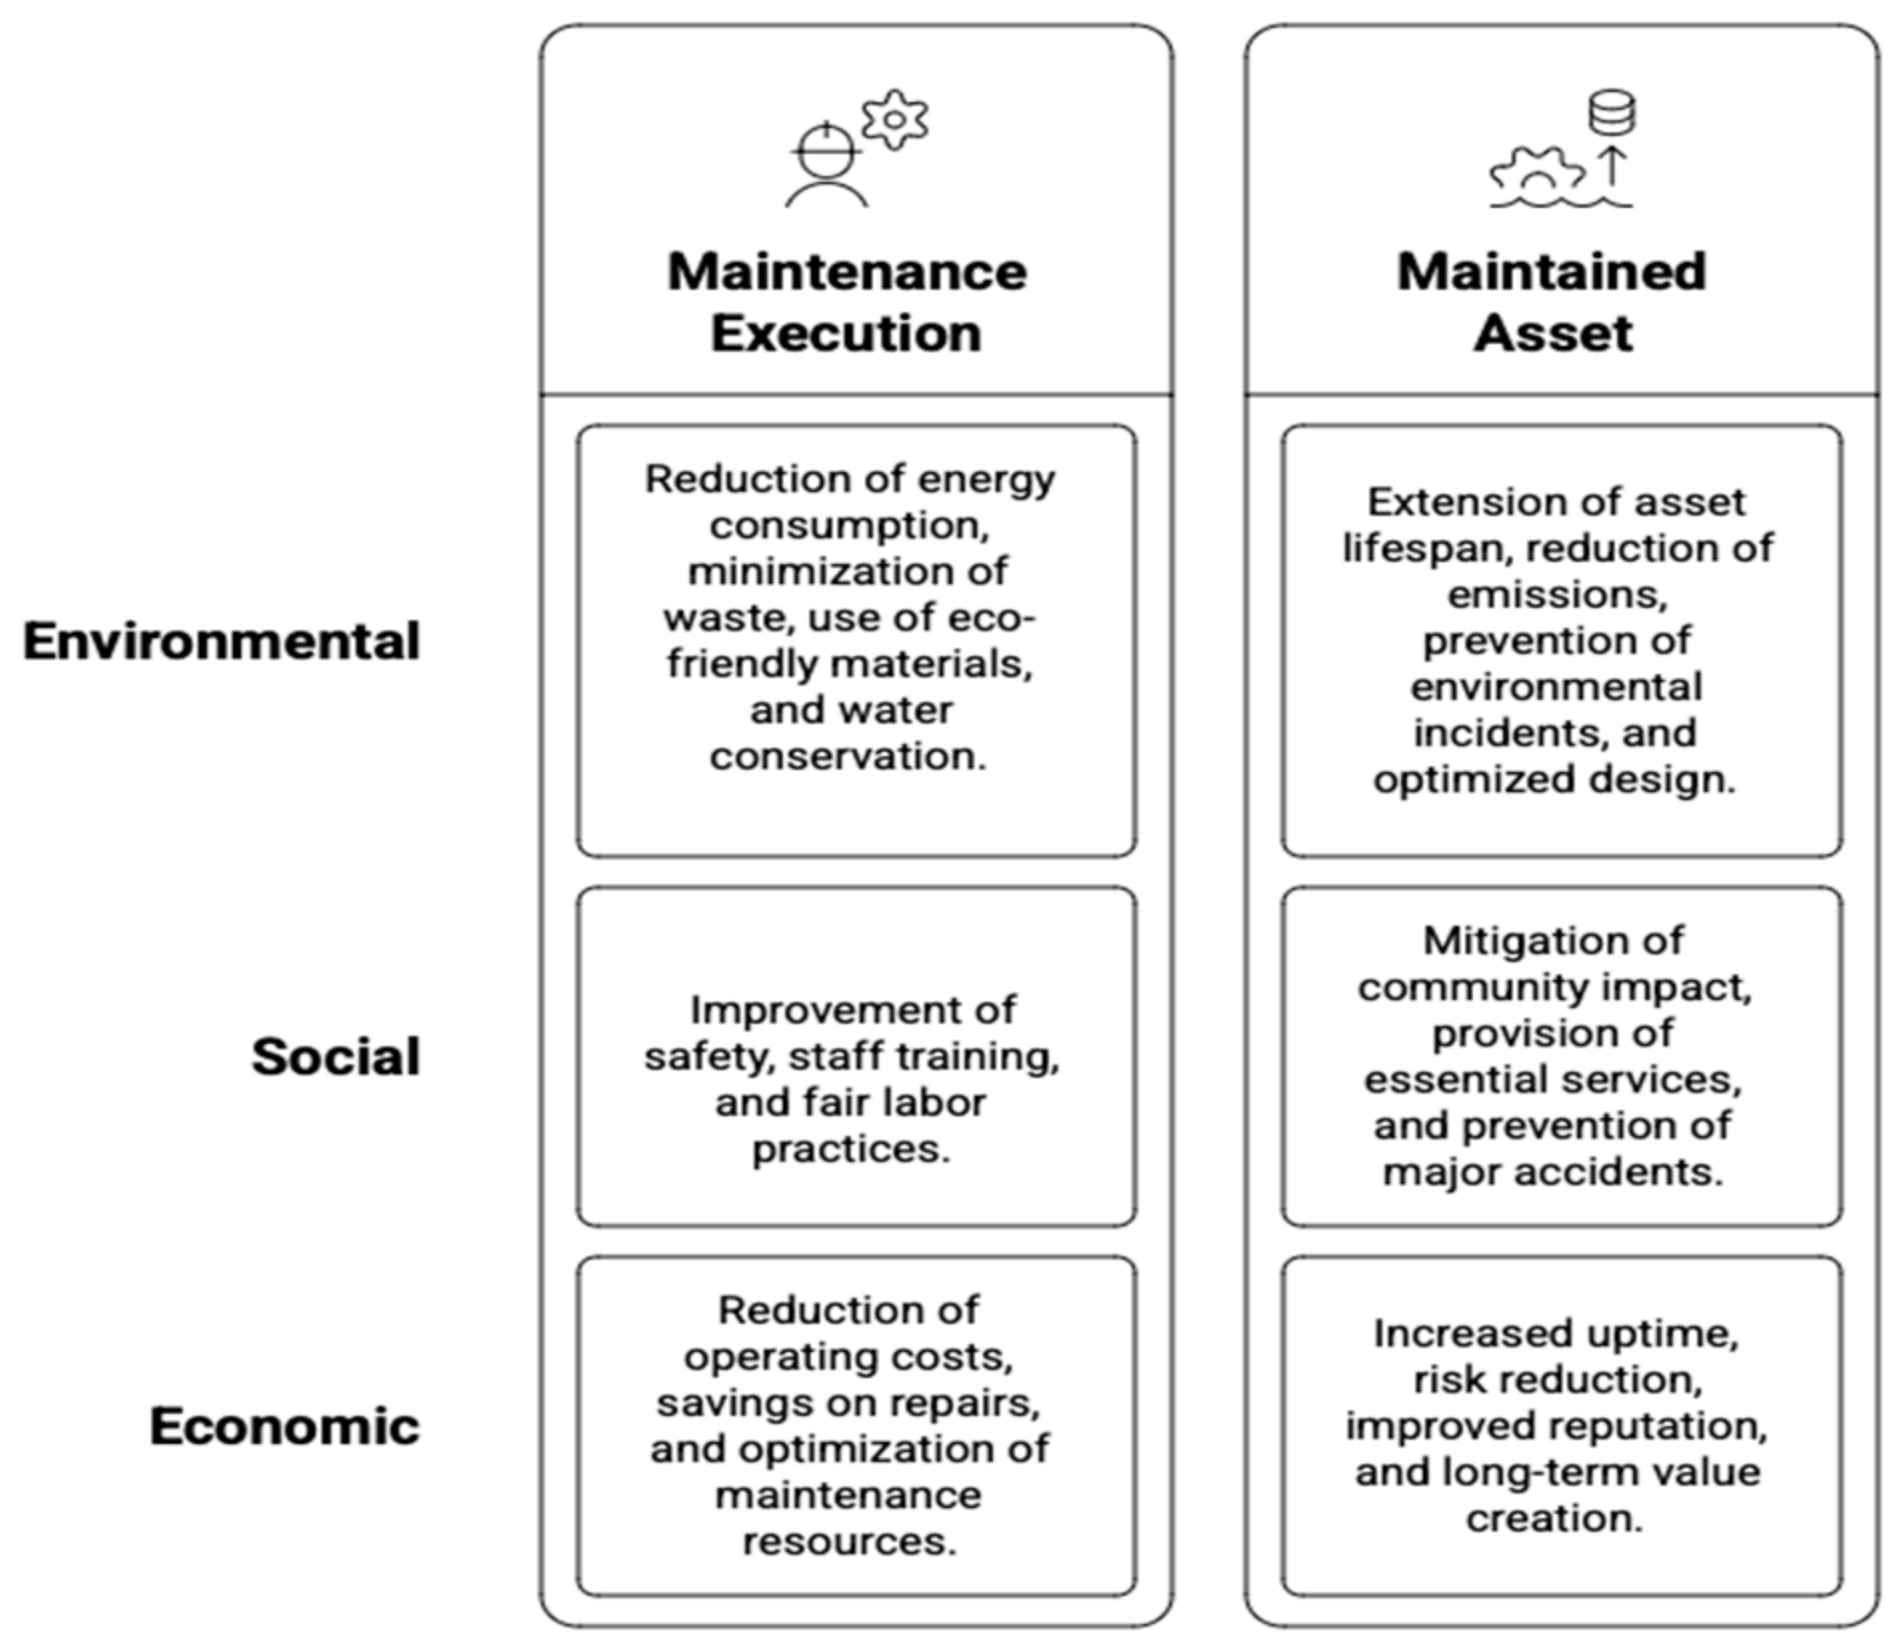
Sustainable maintenance—understood as the systematic integration of environmental, social, and economic considerations into both the execution of maintenance activities and the sustainable performance of the assets they support—provides a strategic pathway for strengthening the overall sustainability profile of industrial facilities. During maintenance interventions, practices such as energy-efficient work methods, waste minimization, responsible material selection, and water conservation directly reduce the ecological footprint of maintenance operations [32,33,34,35]. Beyond the intervention itself, well-maintained assets operate more efficiently, consume less energy, generate fewer emissions, and reduce the likelihood of catastrophic failures with severe environmental consequences (Figure 1).
In the social dimension of sustainability, maintenance plays a pivotal role in safeguarding occupational safety and enhancing community well-being. Economically, sustainable maintenance is a strategic investment: proactive and predictive maintenance practices reduce operating costs, extend equipment life, and optimize labor and resource use [36]. As the principles of Industry 5.0 continue to evolve globally, sustainable maintenance must occupy a central position in the strategic agendas of plant operators, asset owners, and policy makers [37].
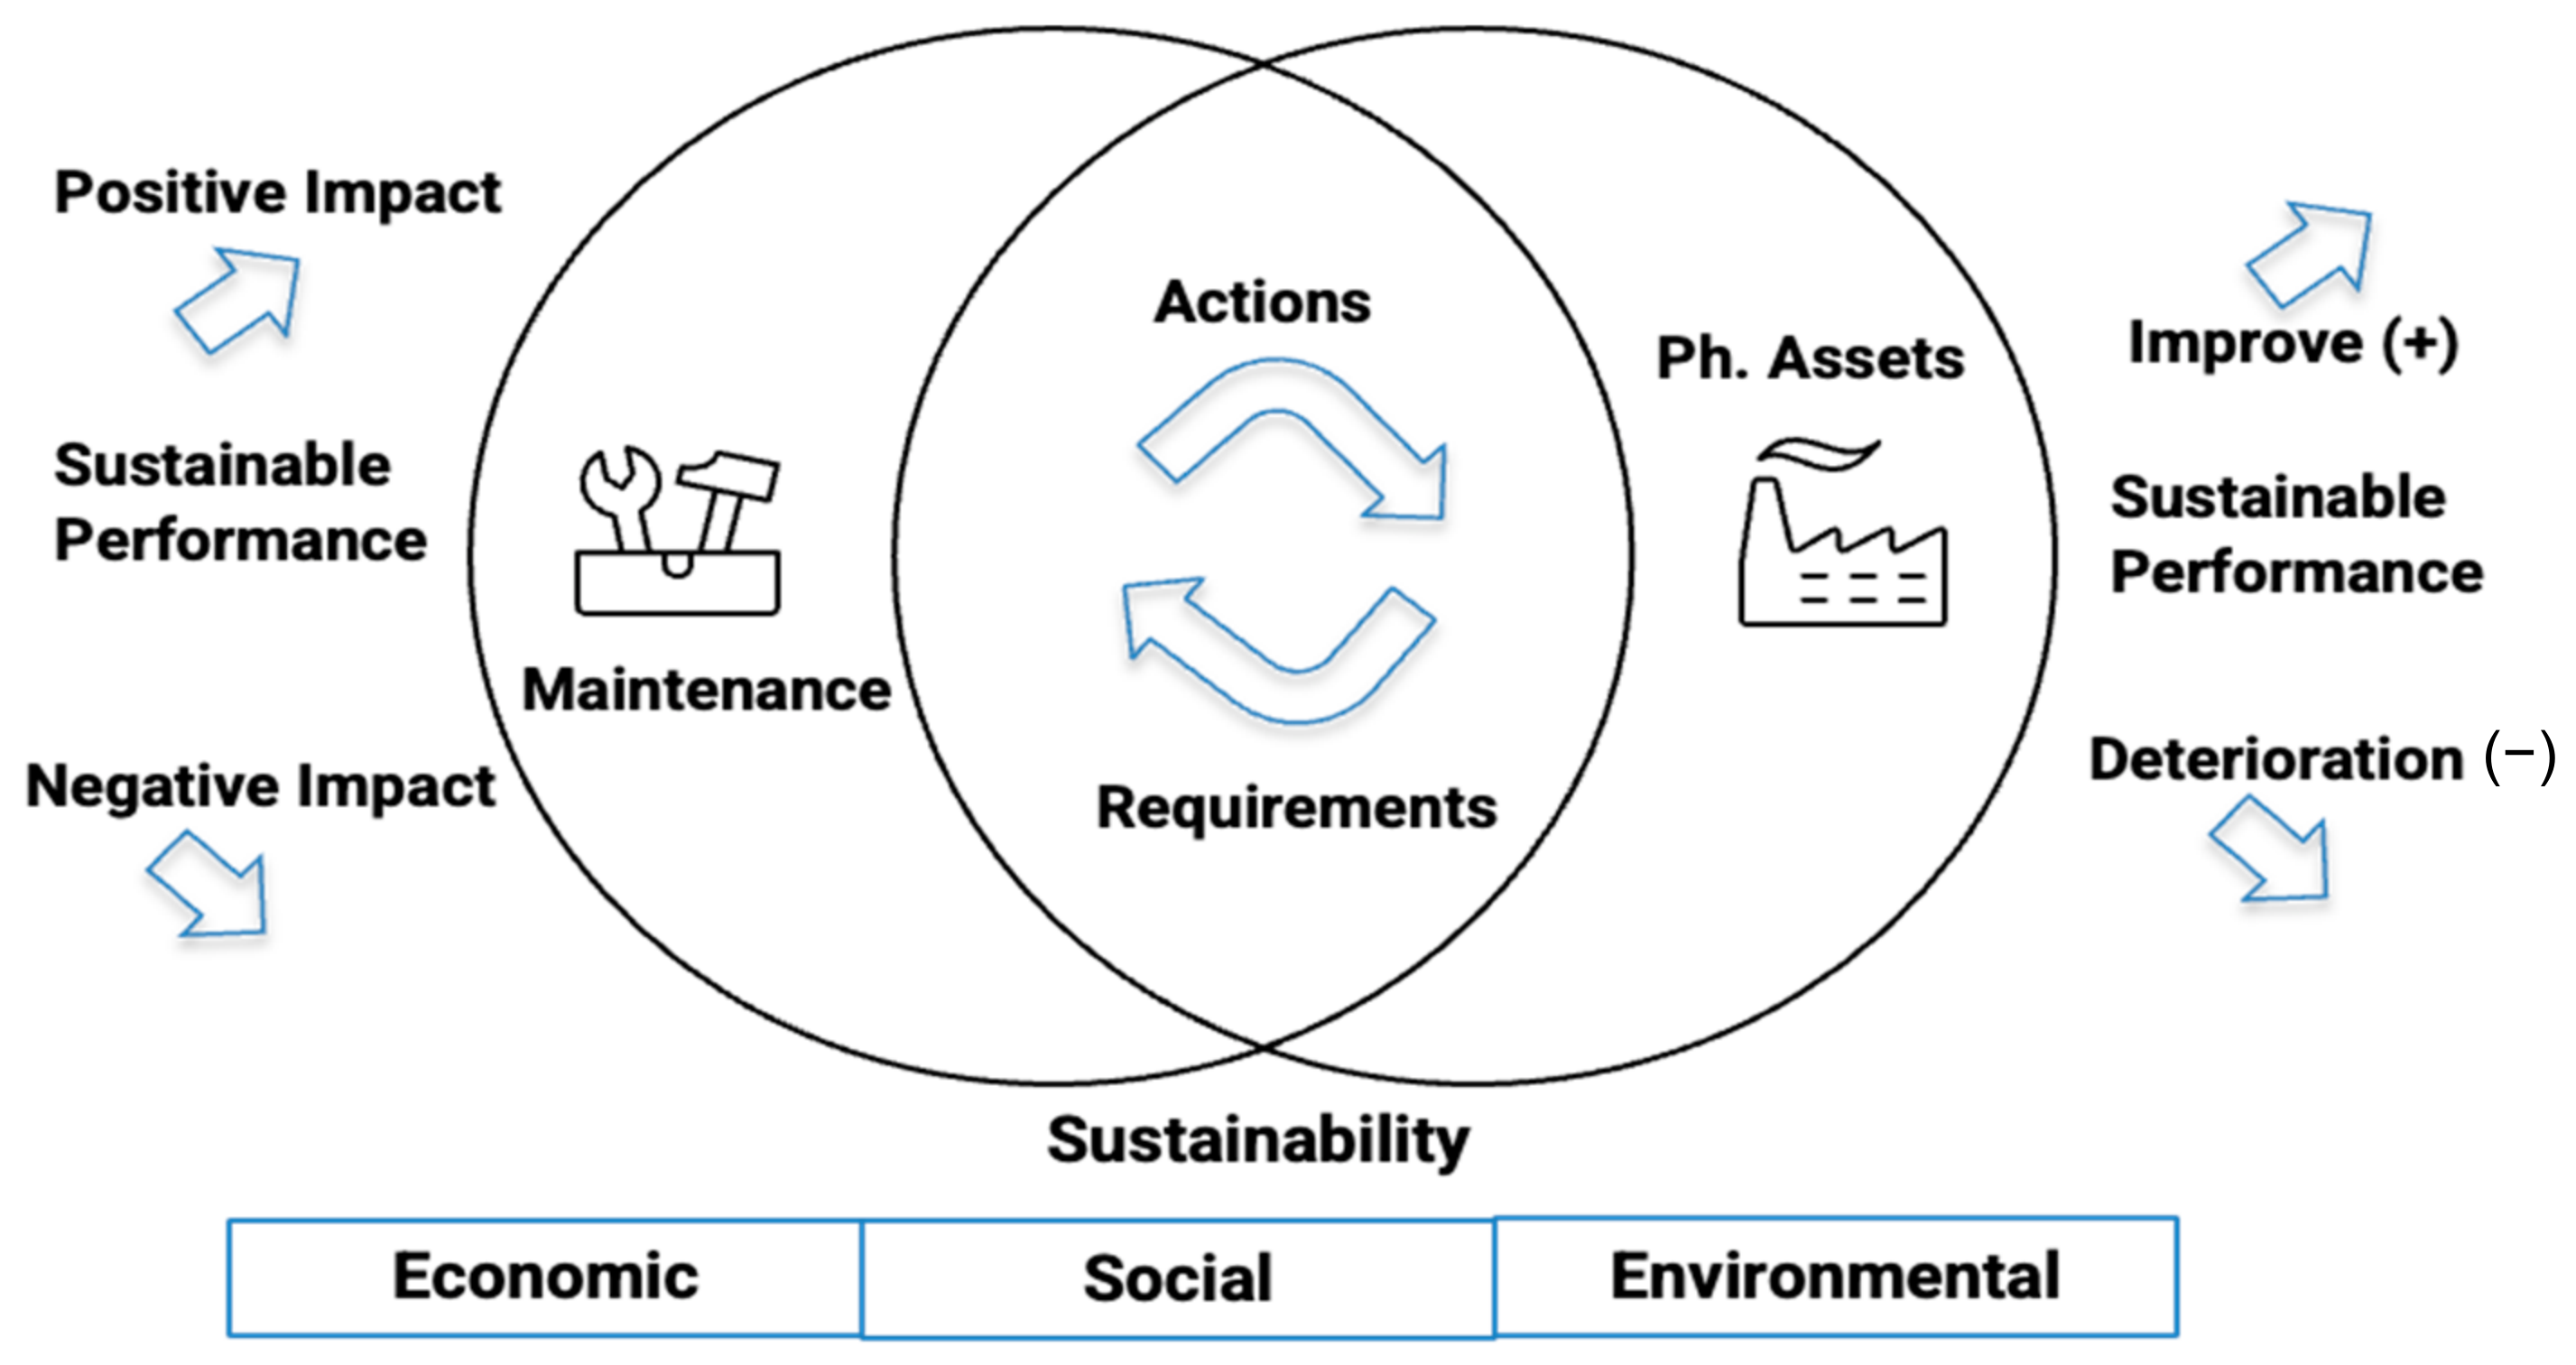
In the context of critical industrial facilities—where operational intensity, environmental impact, and regulatory scrutiny are particularly high—embedding sustainability within maintenance functions is not optional but essential. Recognizing maintenance as both a sustainability-driven activity and a sustainability-enabling function creates new opportunities to enhance performance, reduce lifecycle costs, and strengthen the organization’s social license to operate (Figure 2). As the principles of Industry 5.0 continue to evolve globally, sustainable maintenance must occupy a central position in the strategic agendas of plant operators, asset owners, and policy makers, ensuring that technological progress remains aligned with human-centric and environmentally responsible objectives [37].

3. Methodology

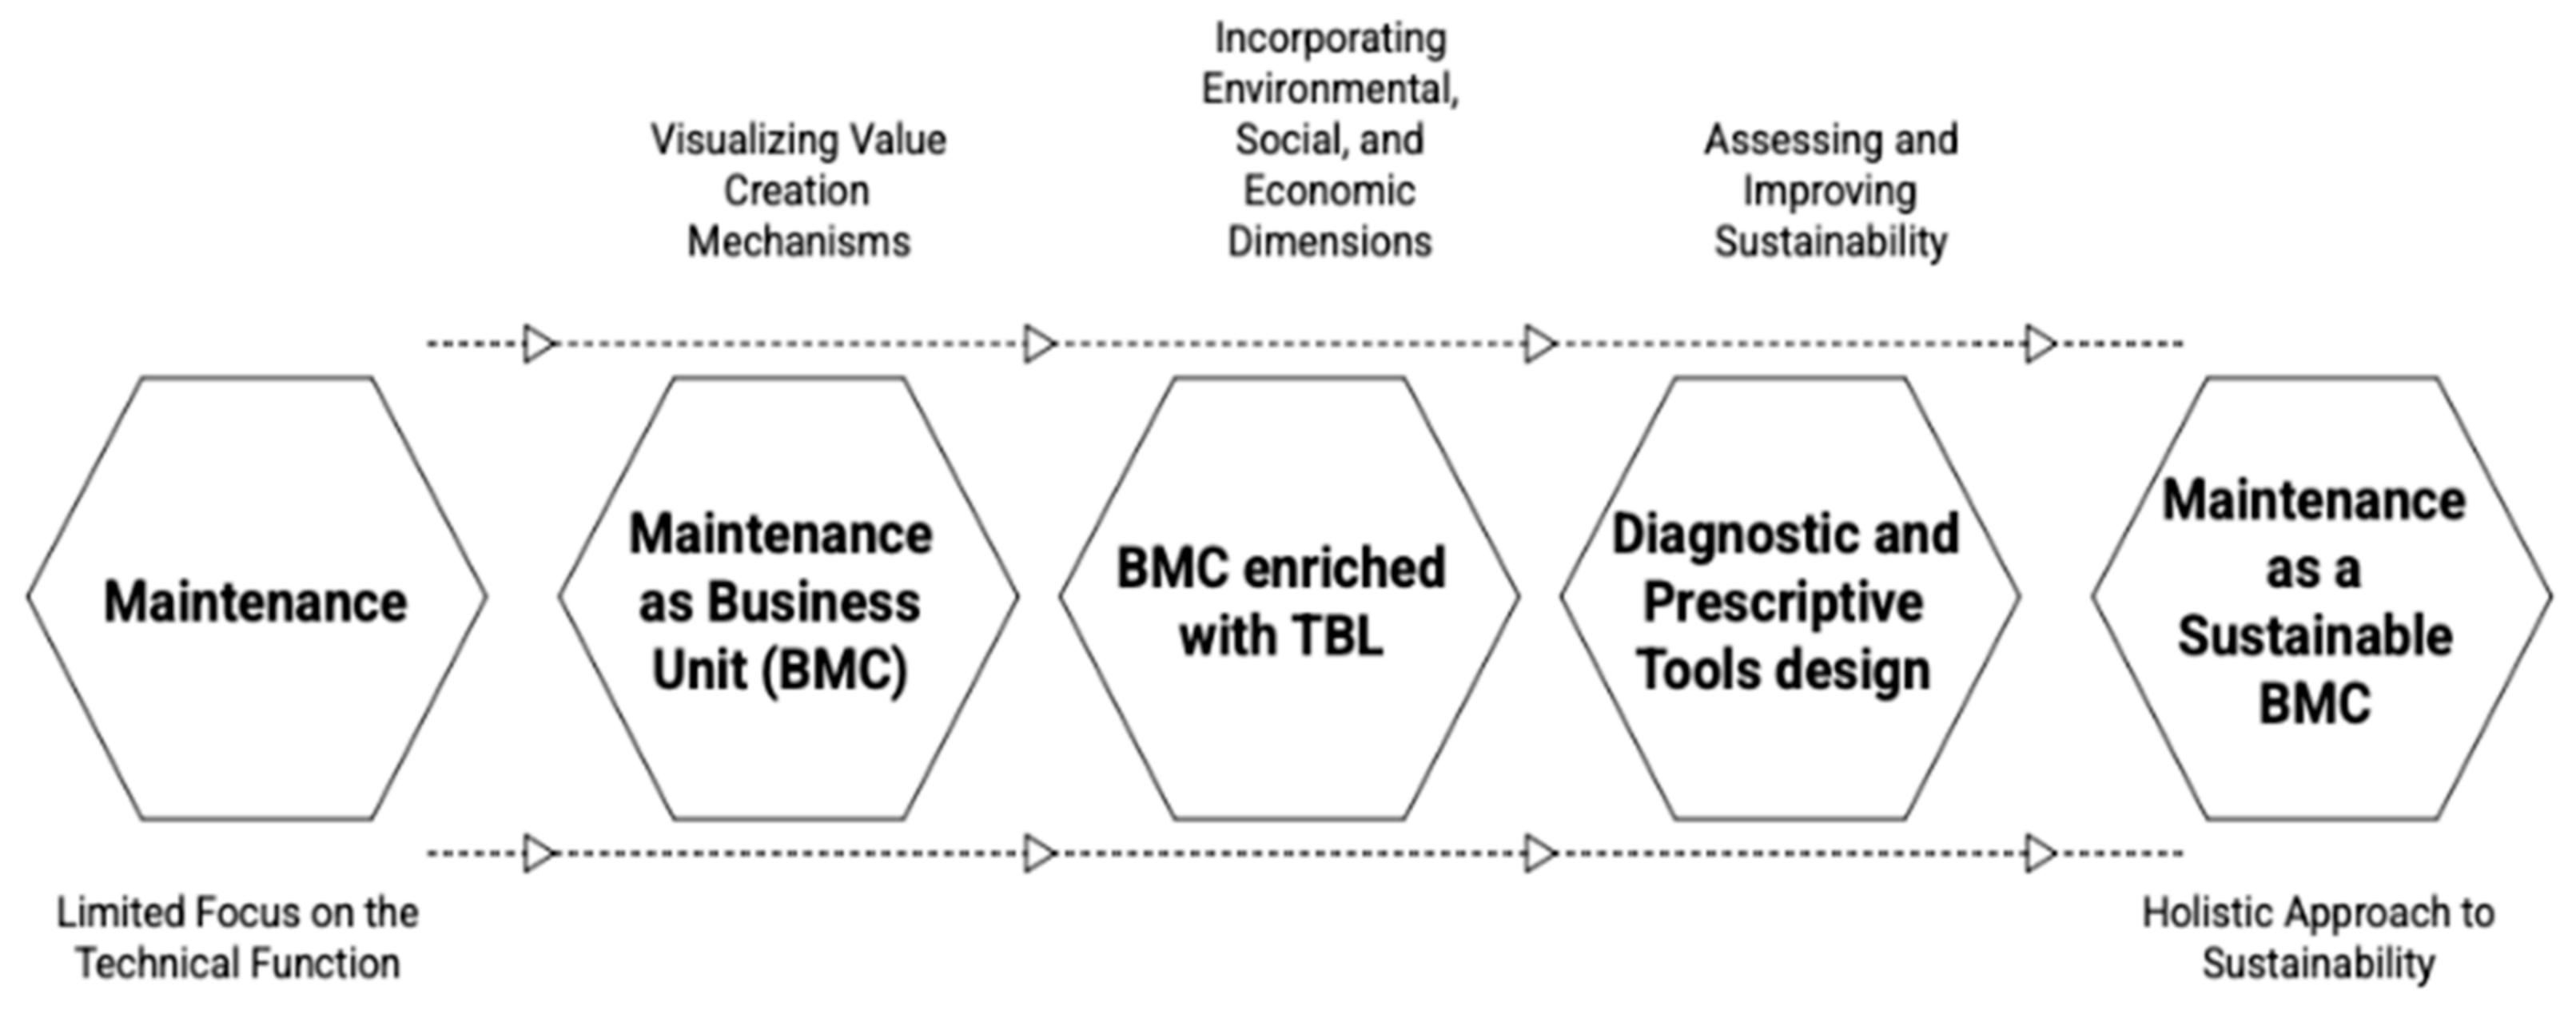
This study develops and validates a conceptual framework designed to assess the sustainability maturity level of maintenance practices. The proposed methodology follows a four-phase structure comprising: (i) formulation of the conceptual framework, (ii) design of the assessment instrument, (iii) expert-based validation, and (iv) results visualization and benchmarking (Figure 3).

3.1. Development of the Conceptual Model: Tripartite Business Model Canvas

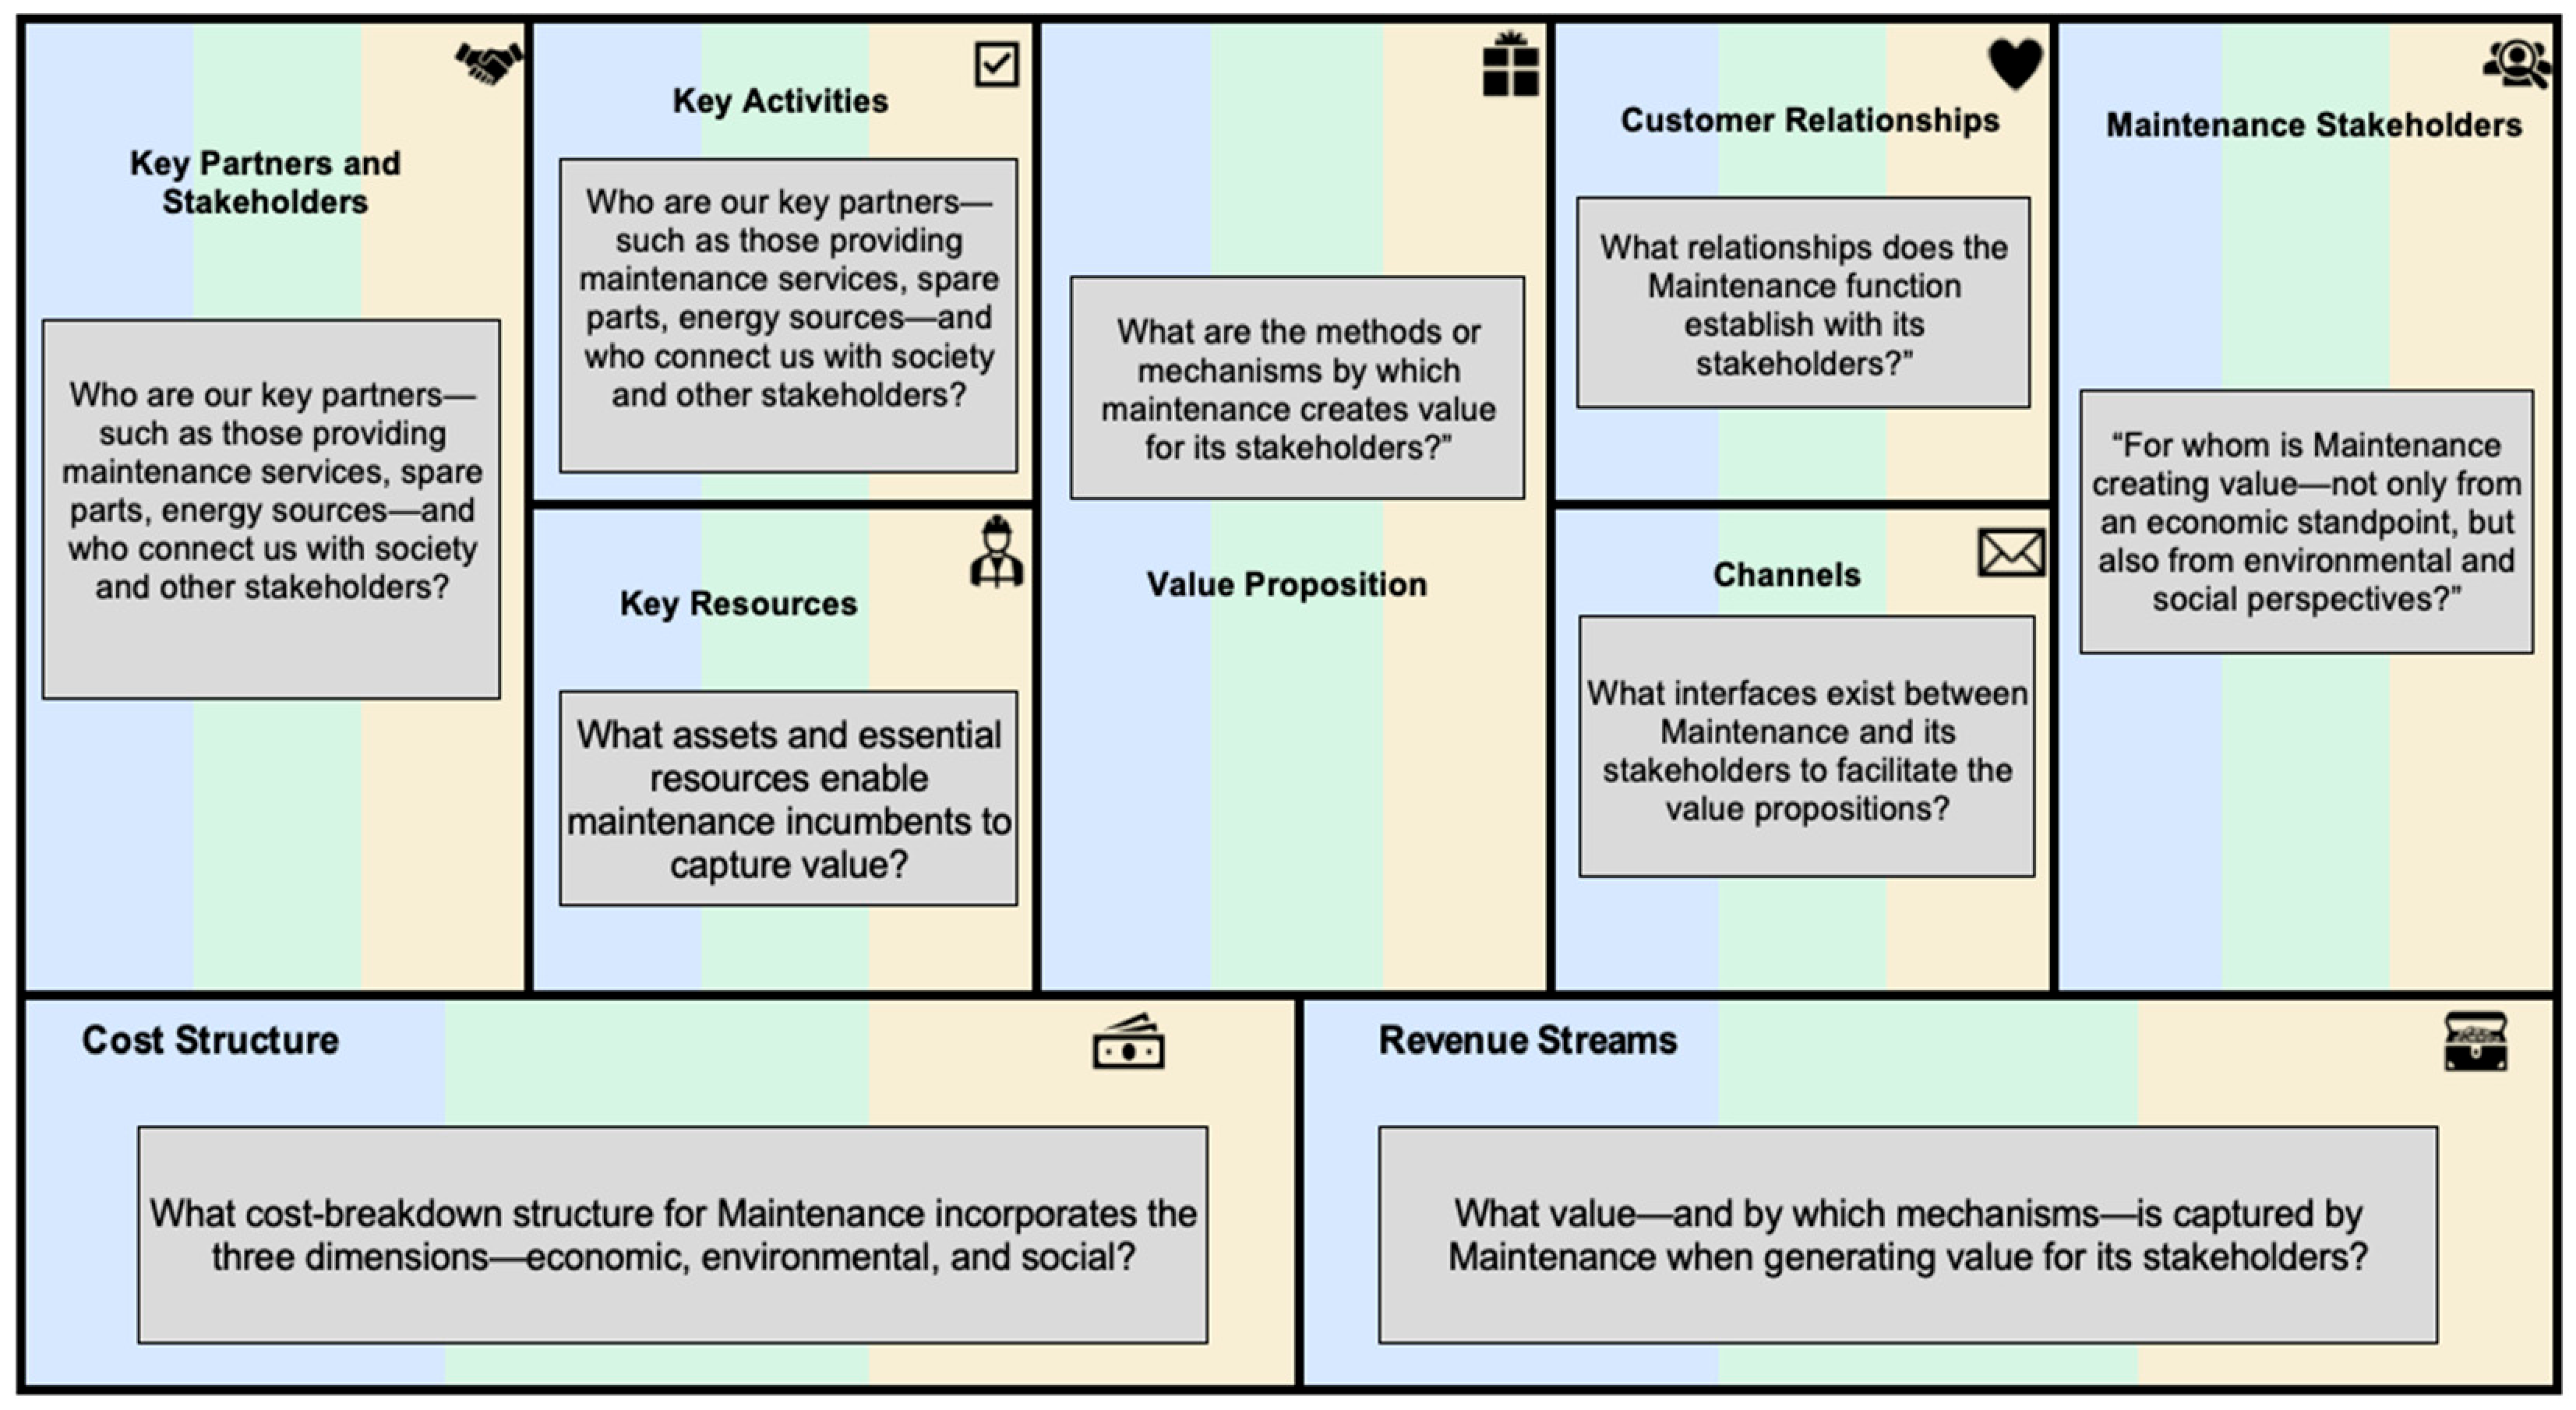
The proposed model is grounded in the recognition of maintenance as a strategic organizational function—one that not only supports operations but also creates and captures value in a manner comparable to a business unit. Building upon the approach of Holgado et al. [7], the Business Model Canvas (BMC) was adopted as the conceptual foundation due to its effectiveness in representing organizational activities through nine interrelated building blocks: customer segments, value propositions, channels, customer relationships, revenue streams, key resources, key activities, key partnerships, and cost structure [38]. The proposed methodology is depicted in Figure 3.
However, the traditional Business Model Canvas does not explicitly incorporate sustainability principles. To bridge this gap, we developed the T-BMC, in which each of the nine building blocks is subdivided according to the three dimensions of the Triple Bottom Line—economic, environmental, and social [11]. The Tripartite Business Model Canvas represents a practical adaptation of the original BMC framework, extending its analytical capability by embedding sustainability principles within each of its nine building blocks. While not intended as a new theoretical construct, the T-BMC serves as a diagnostic and managerial tool that operationalizes sustainability within maintenance management. This adaptation generates 27 analytical elements (9 × 3), providing a comprehensive and multidimensional framework for representing maintenance as a sustainable business model (Figure 4).

3.2. Design of the Assessment Instrument

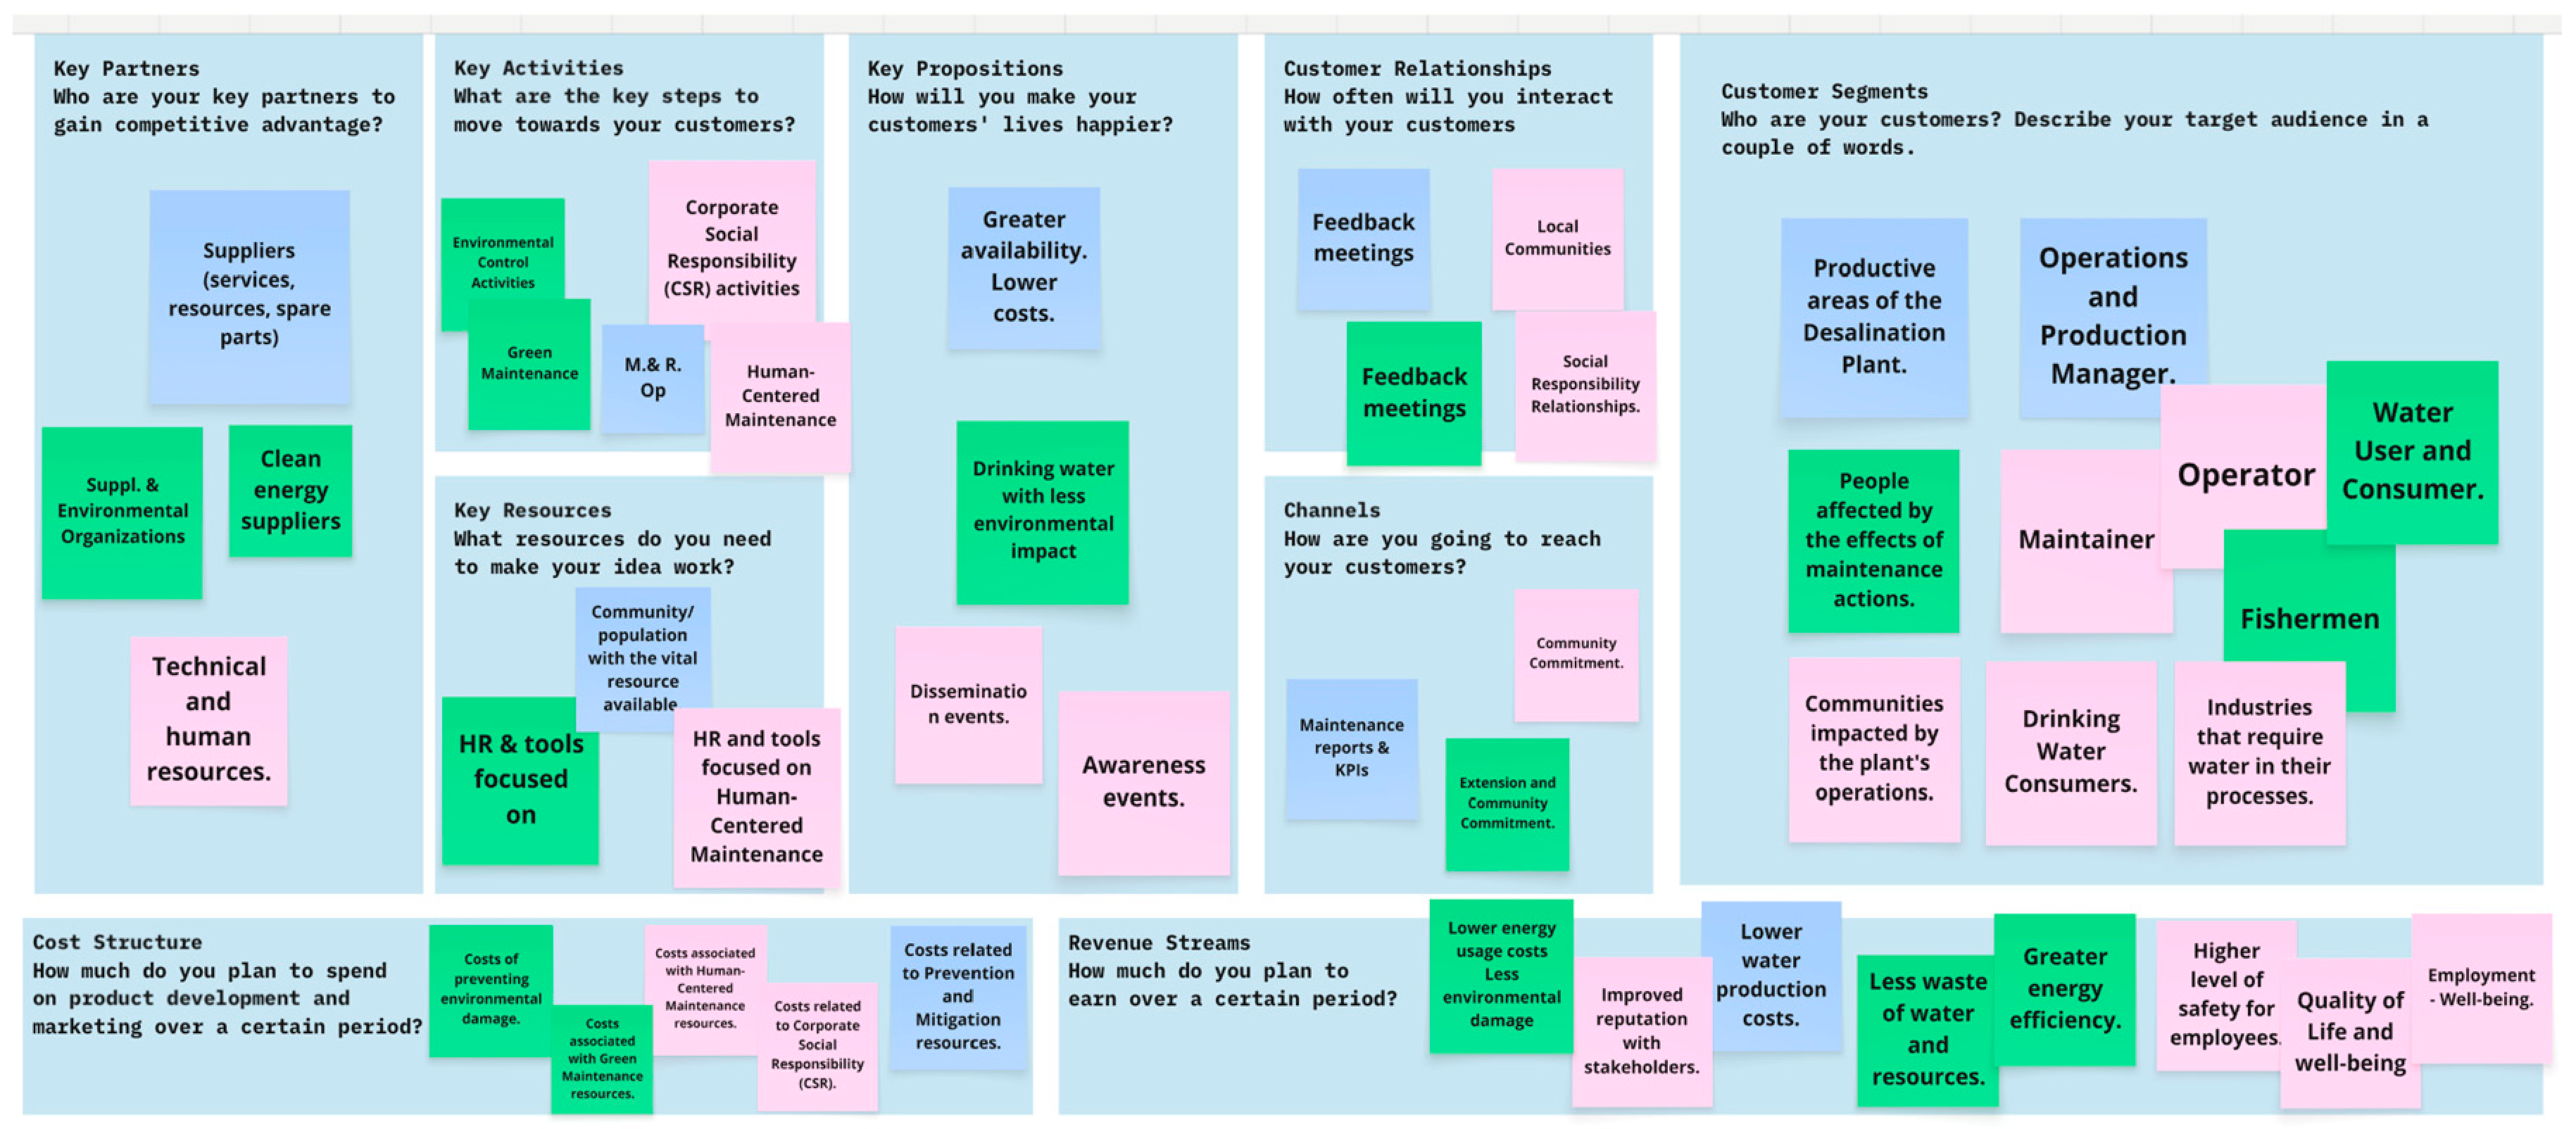
Building upon the T-BMC framework, an assessment instrument was developed to evaluate the organizational maturity of sustainable maintenance practices. The instrument consisted of 24 structured perception statements, each corresponding to specific analytical elements within the 27-component architecture of the T-BMC. These statements were derived through three participatory workshops involving experts from the fields of maintenance management, sustainability, and business model design. This co-creation process ensured both technical validity and contextual relevance through a consensus-based procedure, combining expert discussion and literature evidence to ensure clarity, measurability, and alignment with the three sustainability dimensions (Figure 5).
With respect to content validity, the three participatory workshops constitute a structured expert review process analogous to the content validation panels recommended in applied psychometrics. During these workshops, each of the 24 items was evaluated by experts for clarity, representativeness, and alignment with the corresponding T-BMC element and TBL dimension. Items were retained, modified, or discarded based on consensus. To provide a quantitative estimate of content validity, a Content Validity Index (CVI) was computed from the expert consensus records of the workshops. Item-level CVIs ranged from 0.78 to 1.00, and the Scale-level CVI (S-CVI/Ave) was 0.91, exceeding the 0.90 threshold recommended for newly developed instruments. Construct validity and test–retest reliability assessments, which require substantially larger samples, are explicitly identified as priorities for the next phase of instrument development.
With respect to the statistical treatment of responses, Likert-scale data are ordinal in nature and arithmetic means implicitly assume equal spacing between scale points [39,40]. Following established practice in applied sustainability research, means are reported as indicative descriptors to facilitate comparison across BMC blocks and TBL dimensions. To provide a more complete and statistically conservative representation, medians, modes, and interquartile ranges (IQR) are reported alongside means in the results section. Box plots illustrating the score distributions per TBL dimension are also provided to enable direct visual inspection of data spread and potential asymmetries without relying exclusively on mean values for maturity classification. Regarding the consolidation of dimensions into single items, the expert panels confirmed that merged constructs share a common relational interface from the respondent’s perspective, making independent items conceptually redundant. Nevertheless, the authors acknowledge that this consolidation may result in some loss of dimensional resolution, and future large-scale applications of the instrument should explore whether disaggregated items yield additional discriminant validity.
Although the T-BMC architecture generates 27 analytical elements (9 × 3), the assessment instrument comprises 24 items. This reduction reflects three deliberate design decisions validated by expert consensus during the participatory workshops. First, in the Key Resources block, the three TBL dimensions were integrated into a single item, as budget, personnel, and tooling are inherently cross-dimensional resources that cannot be independently assessed without construct overlap. Second, in the Channels block, the environmental and social dimensions were merged into one item, as external communication mechanisms simultaneously address dissemination of environmental achievements and engagement with socially diverse stakeholders. Third, in the Customer Relationships block, the economic and environmental sub-dimensions were consolidated into a single item, as the expert panels determined that the relational value perceived by stakeholders from maintenance improvements is experienced and reported through the same organizational interface regardless of whether the driver is economic efficiency or environmental responsibility—rendering independent items redundant from the respondent’s perspective. All consolidated dimensions are explicitly indicated in Table 1.

3.3. Visualization, Benchmarking, and Prescriptive Phase

To complement the diagnostic assessment and strengthen managerial interpretation, the proposed methodology integrates three analytical extensions: (i) the Sustainability Dashboard, (ii) the Benchmarking Chart, and (iii) the Prescriptive Action Plan Matrix.
(i)
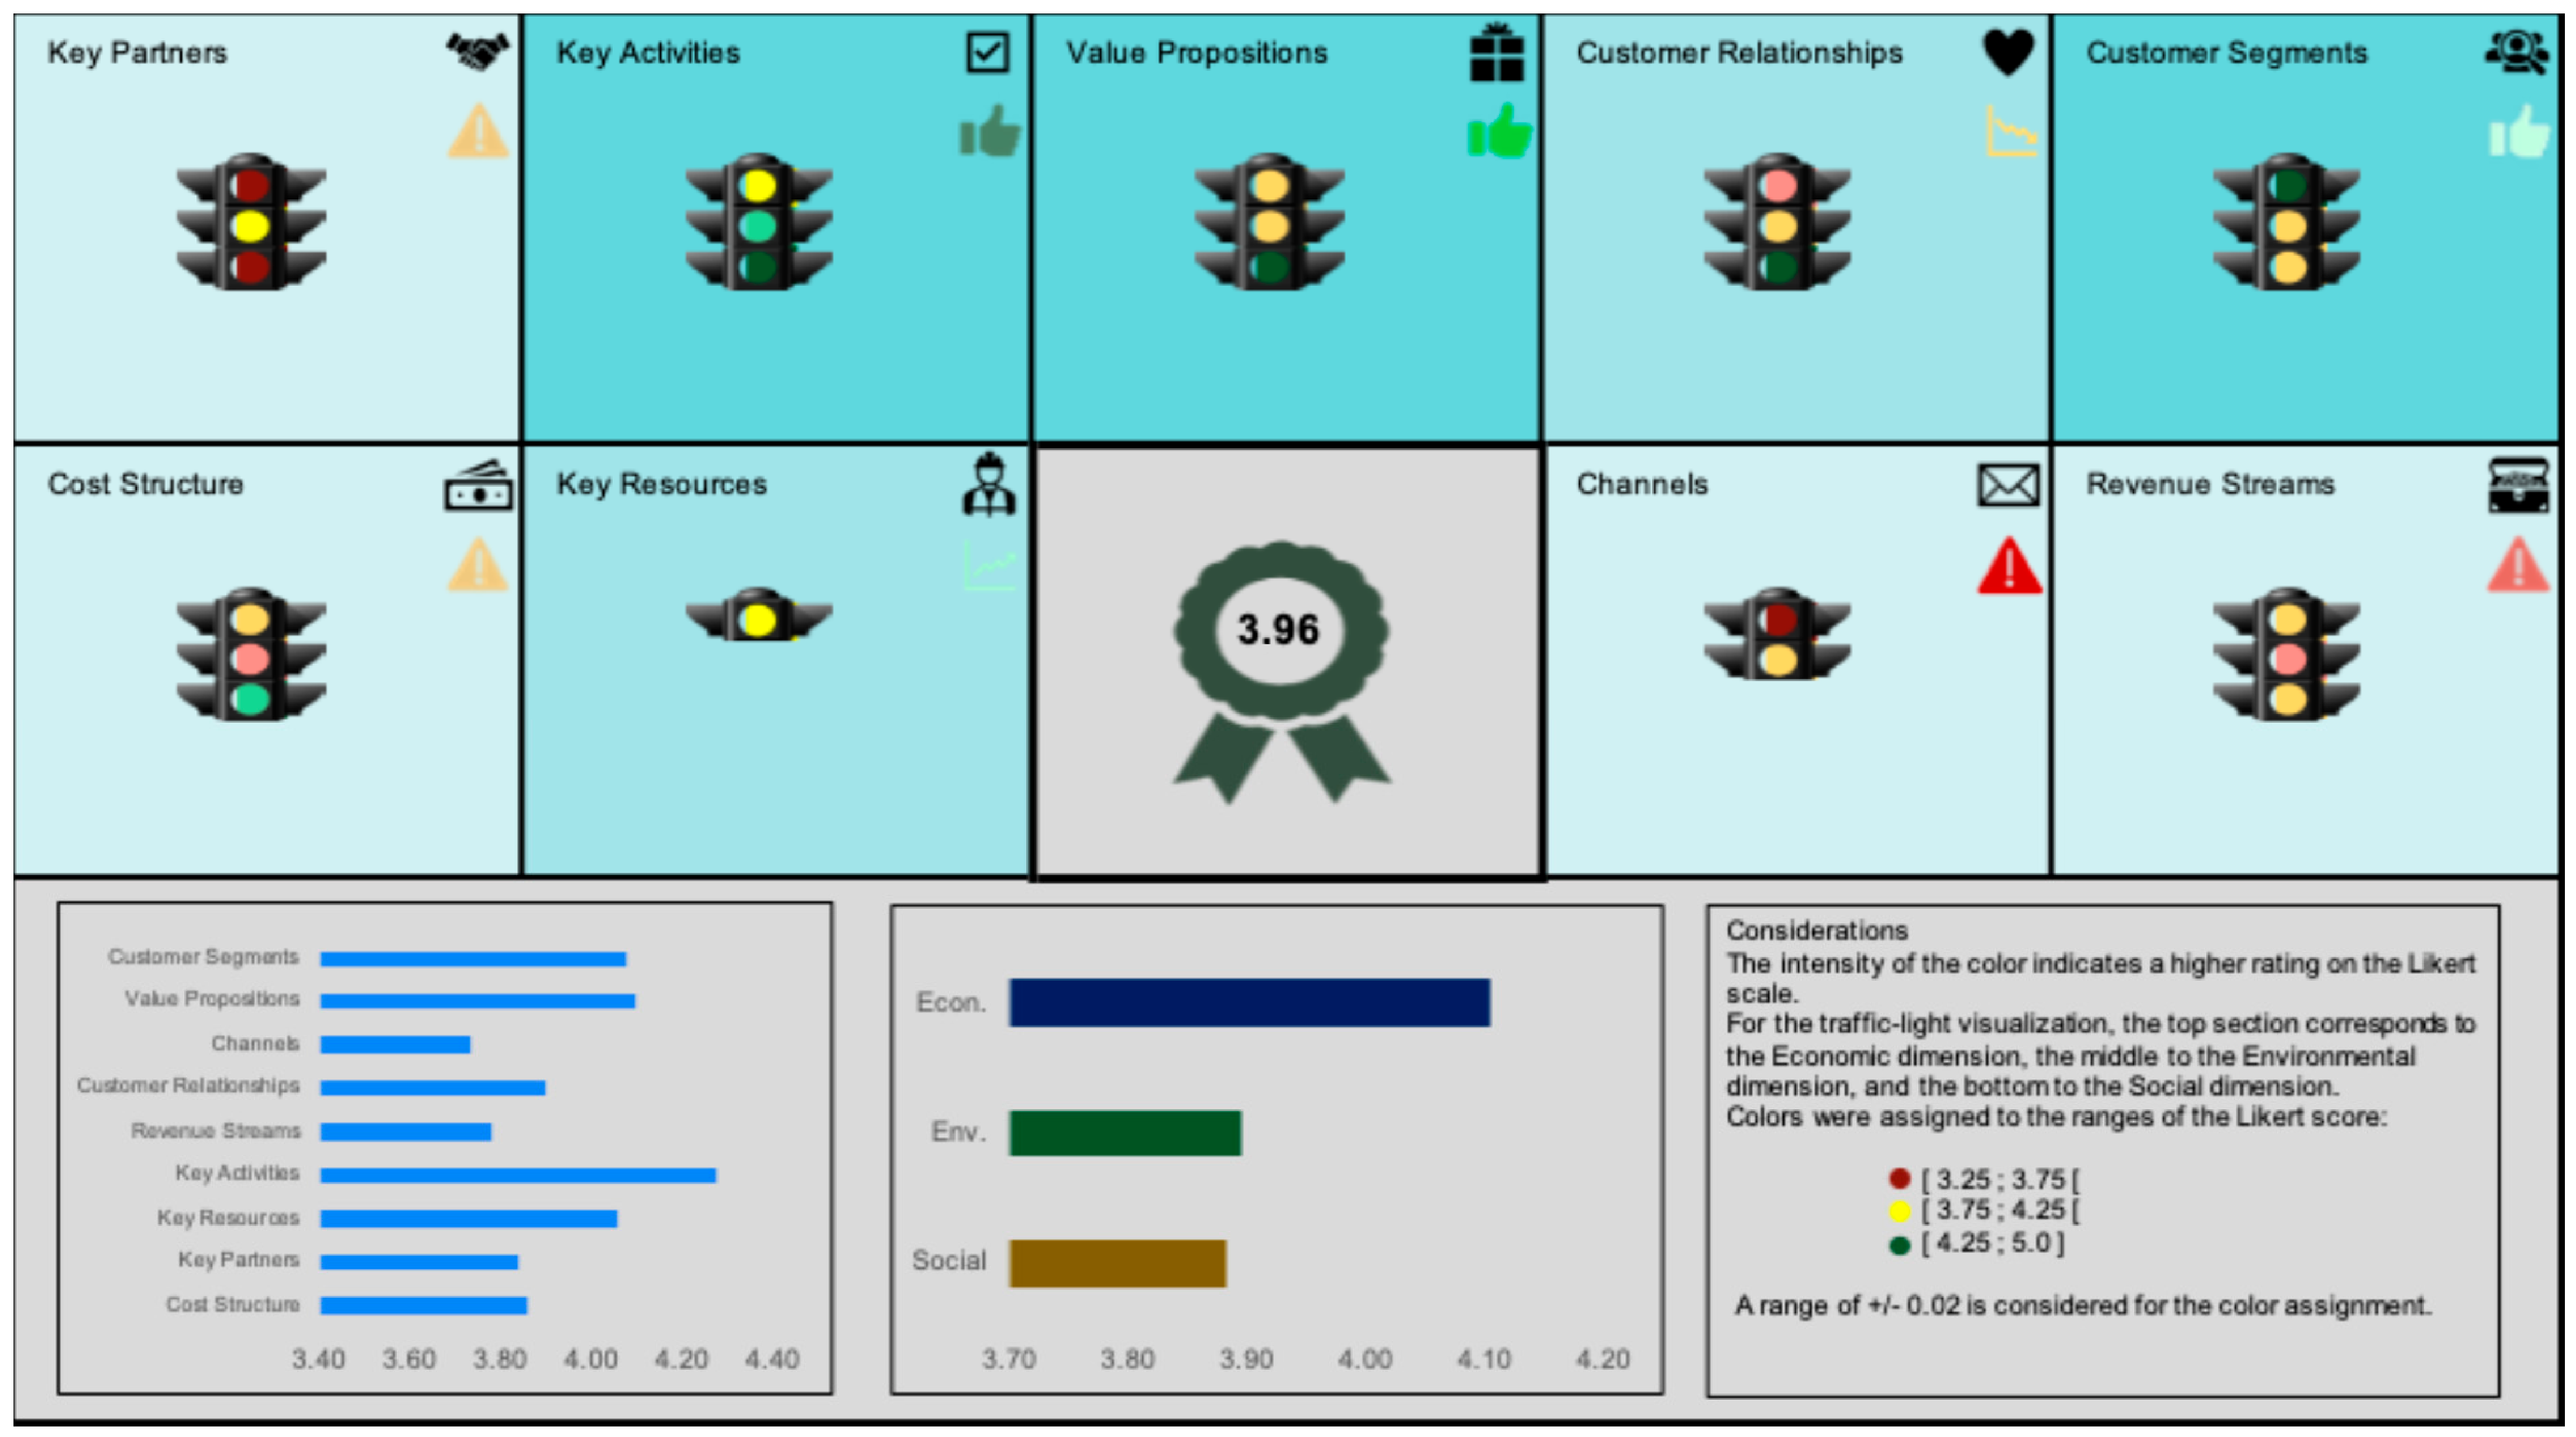
Sustainability Dashboard: The Dashboard converts the numerical outputs of the assessment instrument into a multi-dimensional visual map. Each of the nine BMC blocks is displayed across the economic, environmental, and social pillars of the TBL. Color intensity—ranging from red (incipient) to green (advanced)—represents maturity intervals calibrated according to the Likert-scale distribution (1–5). This visualization enables rapid identification of strengths, weaknesses, and emerging trends.
(ii)
Benchmarking Chart: The second instrument allows comparative analysis among plants, time periods, or organizational units. Each component is represented by two curves: the current performance (solid line) and a benchmark or target (dashed line). In the present case study, a benchmark value of 5.0 (the maximum on the Likert scale) was adopted as the reference point, reflecting an aspirational excellence target. This value was determined through consensus among the participating experts and the research team, who agreed that the maximum attainable score provides the most interpretively unambiguous reference for identifying improvement gaps. Organizations in earlier maturity stages may instead calibrate the reference line to a more proximate target (e.g., 4.0 or 4.5) to reflect realistic improvement horizons. The absence of sector-wide external benchmarks is acknowledged as a limitation; the purpose of the dashed line is therefore managerial rather than statistical.
(iii)
Prescriptive Action Plan Matrix: The third component translates diagnostic and benchmarking results into targeted action plans. For every underperforming BMC block, corrective measures are defined and aligned with the corresponding TBL dimension. Each action plan specifies responsibilities, implementation timelines, and measurable indicators to ensure accountability and traceability.

4. Results and Discussion

To assess the preliminary applicability of the T-BMC instrument, a pilot approach was applied in the seawater desalination sector. Although exploratory in nature, this preliminary feasibility evaluation provides empirical support for the coherence and robustness of the T-BMC dimensions prior to large-scale deployment.
Data were collected from a group of 17 expert professionals with extensive experience in maintenance management at Chilean desalination plants. The instrument—comprising 24 structured perception statements—was applied through a questionnaire using a five-point Likert scale ranging from strongly disagree (1) to strongly agree (5). The sample included professionals with diverse roles within desalination plant organizations—supervision, planning, reliability engineering, and management—from both large mining companies and urban water utilities. The experience of the participants is notable: 59% have nine or more years of experience in the field, with 24% exceeding 13 years, while 41% have between one and eight years. A representative territorial distribution was ensured, with participants from facilities in different regions of Chile: Antofagasta (47.1%), Tarapacá (29.4%), Coquimbo (17.6%), and Atacama (5.9%).

4.1. Results: Internal Coherence and Descriptive Statistics

The responses were analyzed to generate an illustrative maturity profile for the participating plants, represented as a ‘Generic Desalination Plant’. To evaluate the internal consistency of the 24-item assessment instrument, Cronbach’s alpha (α) was calculated using the expert responses. The overall scale exhibited excellent reliability (α = 0.94). The economic, environmental, and social subscales yielded α values of 0.85, 0.82, and 0.89, respectively, all above the commonly accepted 0.70 threshold for exploratory studies.
It should be noted that, with a pilot sample of n = 17, the confidence intervals around these α estimates are necessarily wide. Simulation studies indicate that, for n < 30, Cronbach’s α is susceptible to upward inflation, and point estimates alone should not be interpreted as stable population parameters. Accordingly, the α values reported here should be understood as indicative of internal coherence among the items within each dimension—consistent with a feasibility assessment—rather than as confirmatory evidence of psychometric stability. Replication with substantially larger and more diverse samples is required before stronger reliability claims can be made.
The resulting overall perceived maturity level was 3.96 out of 5, reflecting a generally positive evaluation of the proposed indicators. Table 2 summarizes the descriptive statistics by TBL dimension.
The close agreement between means and medians across all dimensions confirms a broadly symmetric response distribution, lending additional support to the use of means as indicative summary descriptors in this exploratory context. The Social dimension obtained the highest mean (4.10) and the lowest IQR (1.00), indicating not only the strongest average performance but also the greatest degree of consensus among respondents. The Environmental dimension yielded a mean of 3.90 and a median of 4.00 (IQR = 2.00), while the Economic dimension obtained the lowest mean (3.88), also with a median of 4.00 (IQR = 2.00). The wider IQR observed in the Economic and Environmental dimensions relative to the social dimension suggests greater variability in expert perceptions, potentially reflecting heterogeneous levels of implementation of economic evaluation tools and environmental monitoring practices across the participating plants.
The block-by-block analysis (Table 3) reveals marked variations across strategic areas. Among the nine blocks, Key Activities (4.27) and Value Propositions (4.10) obtained the highest average scores. Conversely, the Channels (3.74) and Revenue Streams (3.78) blocks obtained the lowest average scores. Full item-level descriptive statistics are provided as Supplementary Material (Table S1), attached to this submission.

4.2. Discussion: Interpretation and Implications

The results presented in Section 4.1 allow for a substantive interpretation of the sustainability maturity of maintenance practices in the Chilean desalination sector, and for a critical assessment of the T-BMC’s diagnostic performance as an instrument.
The overall maturity score of 3.96 out of 5 indicates that participating organisations have progressed beyond basic compliance toward an intermediate sustainability integration stage. This result is broadly consistent with findings from comparable maturity assessments in industrial maintenance contexts, where organisations embedded in high-regulation environments—such as water supply and mining—tend to exhibit stronger social and environmental awareness relative to their economic sustainability metrics [8,26]. The dominance of the Social dimension (4.10) over the Economic dimension (3.88) aligns with this pattern and may reflect the influence of Chilean occupational health and safety legislation, as well as the heightened social license pressures characteristic of the water sector.
The most diagnostically significant finding is the performance gap between the operational blocks (Key Activities: 4.27; Value Propositions: 4.10) and the communicative-financial blocks (Channels: 3.74; Revenue Streams: 3.78). This disparity suggests that organisations in the sector are capable of executing sustainable maintenance practices but have not yet developed the reporting and value-capture mechanisms necessary to make those practices visible, accountable, and economically justified to stakeholders. Sustainable practices that are not communicated and financially quantified cannot be leveraged to strengthen social license, attract sustainability-linked financing, or inform strategic investment decisions. The T-BMC, by making this gap explicit and block-specific, offers a more actionable diagnostic than aggregate sustainability indices or single-dimension maturity models.
With respect to the instrument itself, the preliminary coherence evidence (Cronbach’s α = 0.94 overall) suggests that the 24 items collectively capture a coherent underlying construct. However, the exploratory nature of this evaluation, the pilot sample size (n = 17), and the exclusive reliance on internal consistency as a reliability measure preclude strong psychometric claims. Future research should address content validity through an independent formal CVI procedure, construct validity through Exploratory Factor Analysis (EFA) with larger samples (recommended minimum n = 100–120), and temporal stability through test–retest reliability assessment—the minimum standards required for newly developed assessment instruments.
These findings align with recent evidence confirming that social and environmental dimensions are often more developed than economic ones in early sustainability adoption stages. However, unlike previous models, the T-BMC allows direct mapping between sustainability pillars and business model logic, providing a more actionable managerial framework.

4.3. Sustainability Dashboard for a Generic Desalination Plant

To facilitate visual interpretation and decision-making, a Sustainability Dashboard was designed (see Figure 6). This tool integrates the results of the Tripartite BMC using three-dimensional traffic lights, where the top light represents the economic dimension, the middle the environmental, and the bottom the social. The intensity of the background color of each block varies according to the average score, indicating the level of perceived maturity (Likert score ranges: [3.25, 3.75], [3.75, 4.25], [4.25, 5.0]). The overall average of 3.96 is prominently displayed.
The high scores for Key Activities (4.27) and Value Propositions (4.10) suggest that companies in the sector are aware of the actions they must take in maintenance to contribute to sustainability and recognize the value these actions generate. However, this performance contrasts sharply with the lower scores for Channels (3.74) and Revenue Streams (3.78), highlighting a critical gap between ‘doing’ sustainable maintenance and ‘communicating’ its value and ‘capitalizing’ its benefits in an explicit and quantifiable manner.

4.4. Benchmarking Analysis

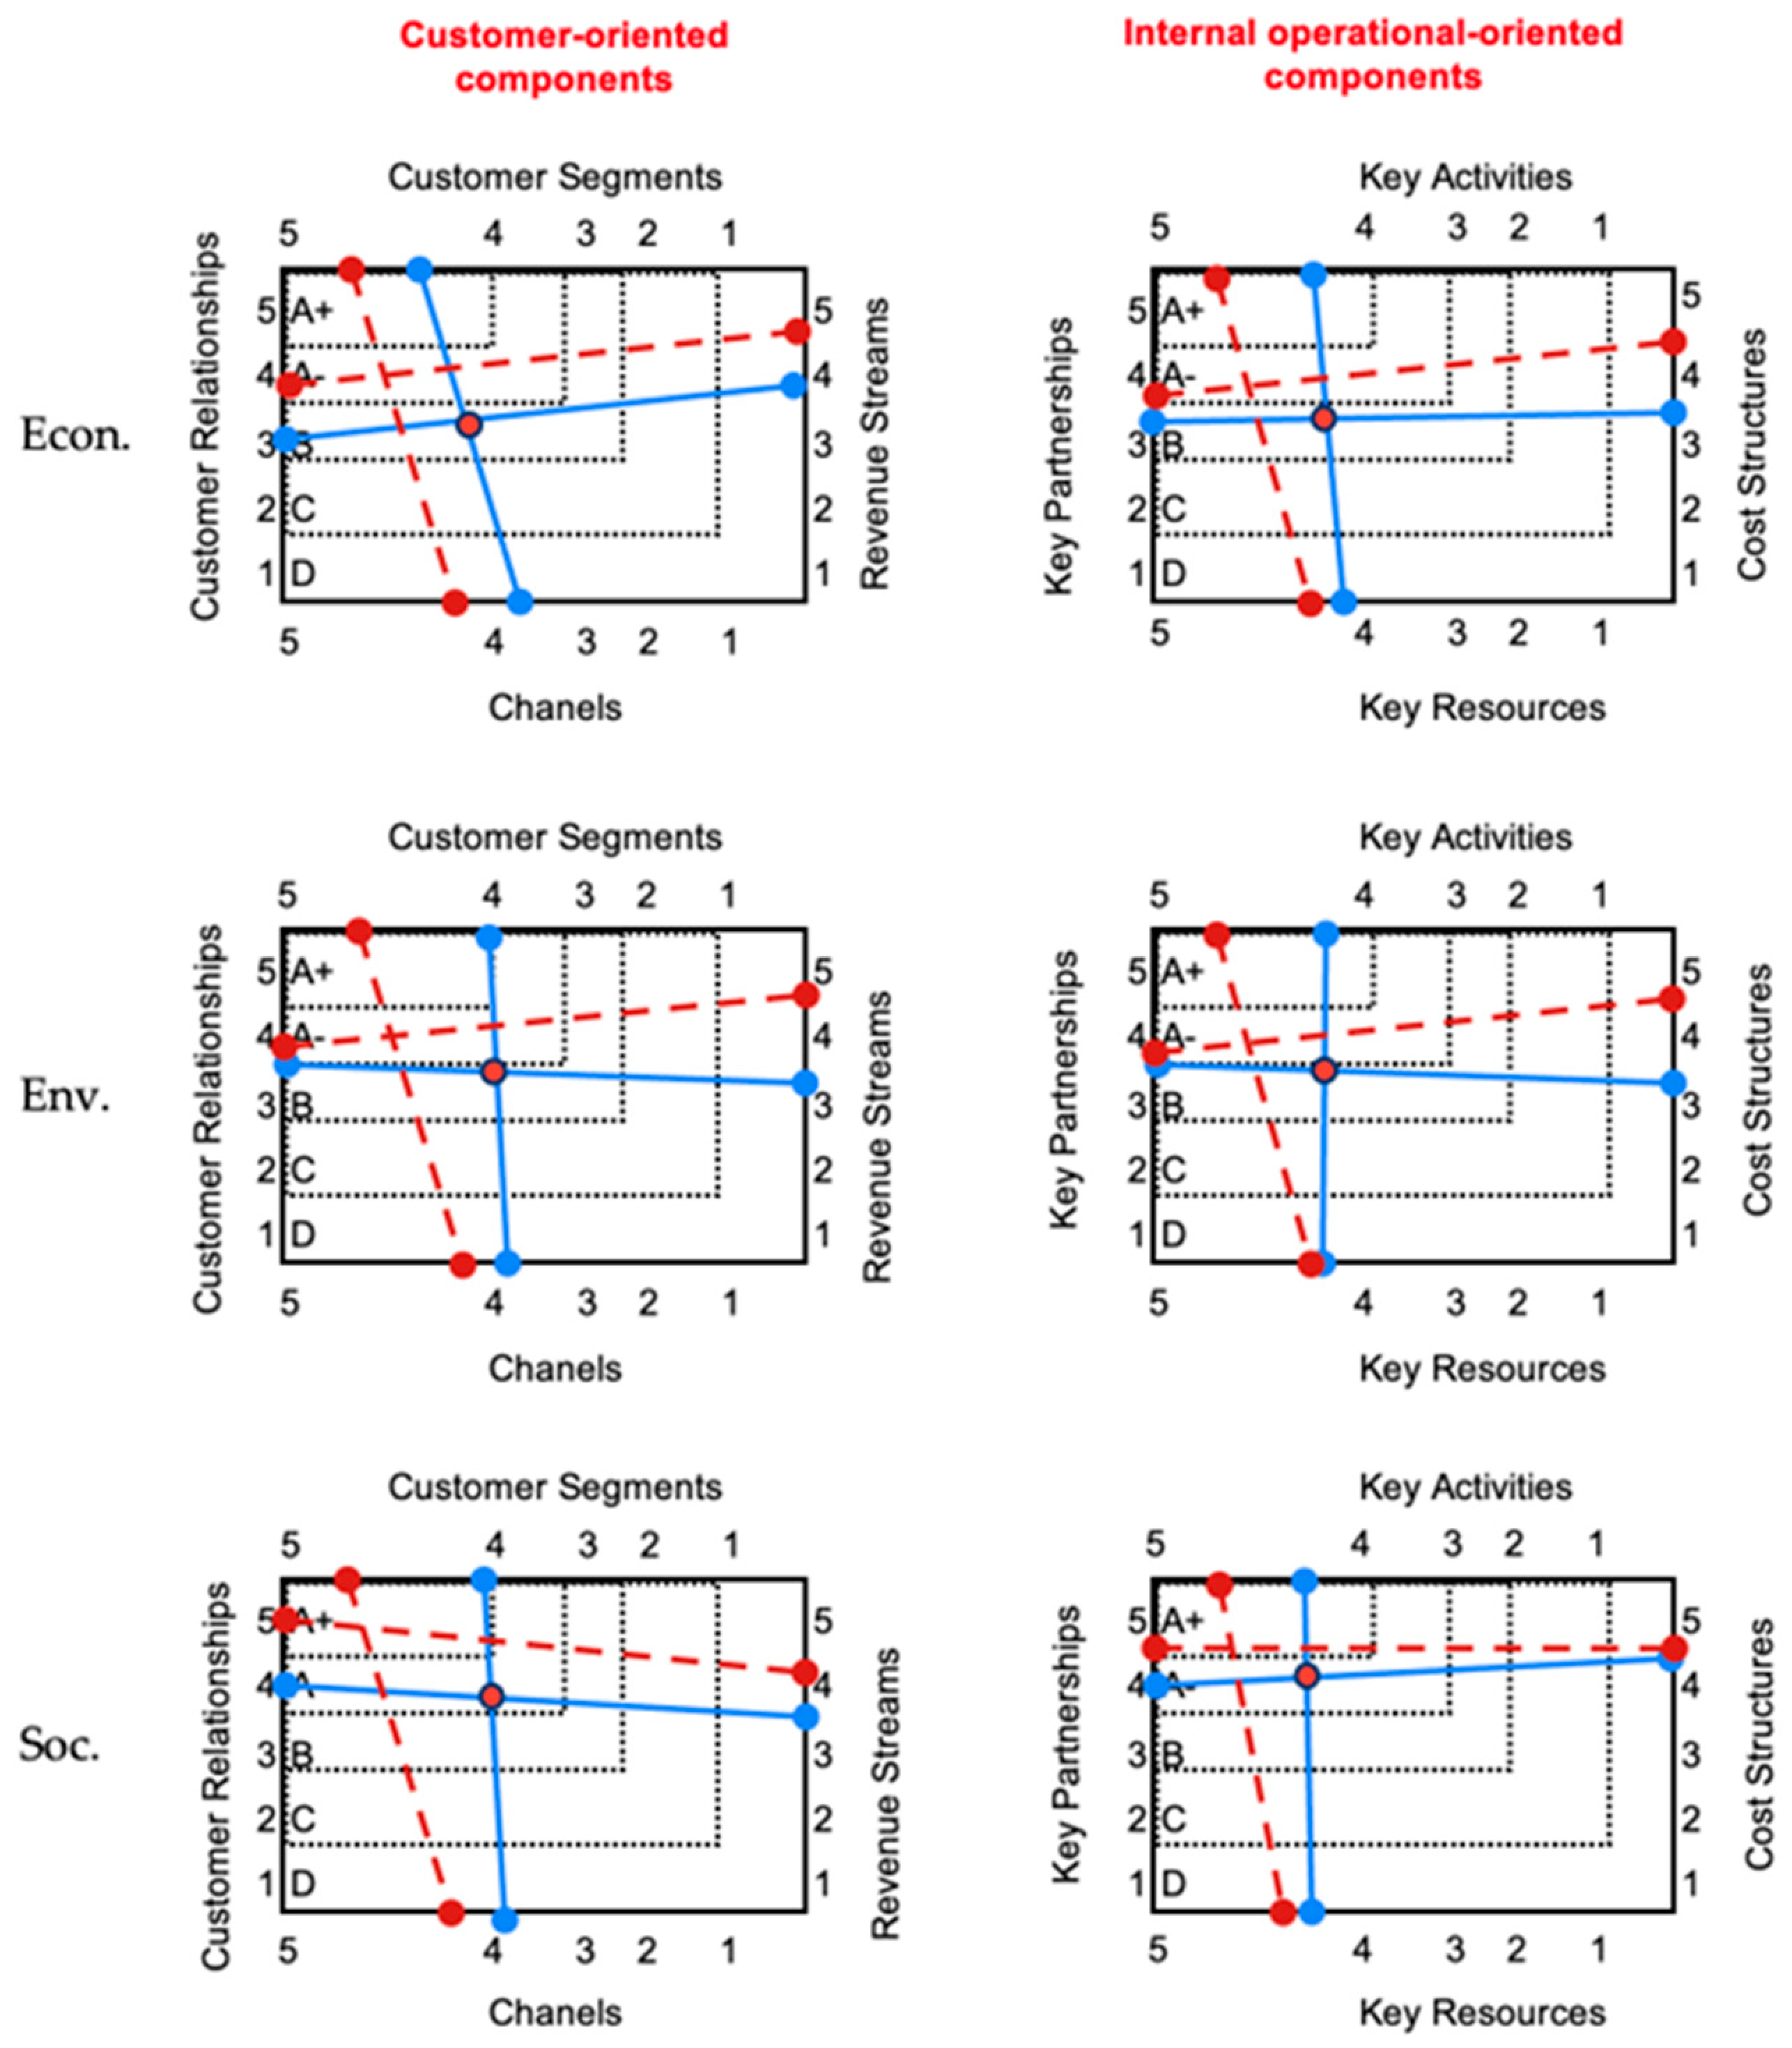
For the purposes of diagnostic assessment, the tripartite Business Model Canvas applied to maintenance can be conceptually structured into two principal domains: (a) customer-oriented components—customer segments, communication channels, customer relationships, and revenue streams—and (b) internal operational components—key activities, key resources, key partnerships, and cost structure. Centrally positioned is the value proposition, which functions as the integrative axis.
To facilitate the interpretation of benchmarking results, a categorical performance classification system is applied. The system comprises five levels: A+ (score ≥ 4.25): advanced sustainability integration; A (score 3.75–4.24): consolidated performance; A− (score 3.25–3.74): developing performance, moderate gap; B (score 2.75–3.24): incipient integration, significant gap; D (score < 2.75): critical underperformance. These thresholds are aligned with the Likert-scale interval ranges used in the Sustainability Dashboard and are intended as managerial reference categories rather than statistically derived cut-points (see Table 4).
Figure 7 presents a diagram that compares performance across the two groups of BMC components—namely, customer-oriented and internally focused operational components. The diagram distinguishes between customer-oriented and operationally oriented components of the BMC, offering a clear overview of performance levels across TBL dimensions. Each graph plots evaluation scores on a scale from 1 to 5, with the current assessment shown as a solid line and the benchmark as a dashed line, thereby making performance gaps easily identifiable. To identify improvement gaps in the sustainable performance of business models, it is essential to analyze the distance between the points corresponding to the current evaluation (blue line) and the benchmark or reference values (red line). A greater distance indicates a wider performance gap. The position of the component on each axis reveals where the deviation is occurring, whether in channels, key resources, partnerships, or other elements of the business model. Additionally, the dimension in which the gap is observed—economic, environmental, or social—helps clarify the nature of the underlying weakness.

4.5. Prescriptive Action Plans

The action plans follow a two-tier logic. The first tier comprises data-driven priority actions directly derived from the diagnostic results. Three blocks obtained the lowest scores and warrant immediate attention: (1) Channels (overall mean 3.74; economic sub-score 3.71) indicates that organisations lack mechanisms to quantify and internally communicate the economic value of sustainable maintenance—a targeted response is the implementation of Enterprise Asset Management (EAM) systems with financial reporting modules [8]; (2) Revenue Streams (mean 3.78; environmental sub-score 3.59) reveals that environmental benefits of maintenance are not monetised or reported—adoption of ISO 50001-aligned energy monitoring and carbon accounting tools can make these value streams visible [23]; (3) Cost Structure shows the lowest environmental sub-score among internally oriented components (3.53)—Life-Cycle Costing (LCC) combined with ISO 14001-compliant waste cost tracking directly addresses this gap [7].
The second tier comprises illustrative, non-exhaustive best-practice interventions across all BMC blocks and TBL dimensions, presented in Table 5 as a reference menu for organisations at different maturity stages.

5. Conclusions

Returning to the two research questions posed in Section 1.1, the findings of this study offer the following responses. With respect to the first question—how maintenance can be systematically conceptualised and assessed as a sustainable business function integrating the economic, environmental, and social dimensions of the Triple Bottom Line—the T-BMC provides a structured answer by reframing each of the nine building blocks of the Business Model Canvas through the lens of TBL sustainability. This adaptation yields 27 analytical elements that capture maintenance’s contribution to value creation, environmental responsibility, and social well-being simultaneously, enabling a holistic diagnosis that transcends traditional cost- and reliability-centred approaches. With respect to the second question—whether the adaptation of the BMC into a Tripartite framework can provide a practical instrument for evaluating the maturity of sustainable maintenance practices—the pilot results offer affirmative preliminary evidence. The instrument demonstrated strong internal coherence (Cronbach’s α = 0.94 overall), produced differentiated maturity profiles across the nine BMC blocks and three TBL dimensions, and was judged by participating experts as applicable and contextually relevant. However, given the exploratory nature of the pilot and the sample size constraints (n = 17), these findings constitute preliminary feasibility evidence rather than confirmatory psychometric validation.
This study responds to a critical gap in the literature: the absence of structured and transferable tools for assessing the maturity of sustainable maintenance practices from an integrated business perspective. By adapting the Business Model Canvas to the Triple Bottom Line, a novel methodological framework was developed that enables a multidimensional diagnosis of maintenance practices in relation to sustainability objectives. The proposed model captures the current maturity state of a maintenance organisation and highlights specific improvement opportunities across economic, environmental, and social dimensions, thereby laying the foundation for the future development of robust, quantitative sustainability indicators.
The introduction of the Sustainability Dashboard further strengthens the practical contribution of this research. As a managerial tool, the Dashboard supports rapid and intuitive visualization of sustainability performance, enabling decision-makers to identify weaknesses, prioritize corrective actions, and embed maintenance within a continuous improvement cycle.
By positioning maintenance as both a sustainability-driven activity and a sustainability-enabling function, the model offers a transferable framework applicable to different industrial contexts where infrastructure intensity and environmental impact are critical. From a managerial standpoint, the proposed T-BMC and its accompanying dashboard enable maintenance managers to identify sustainability gaps, prioritize investment, and communicate progress transparently to stakeholders, contributing to SDG 6, SDG 7, SDG 8, SDG 9, SDG 12, and SDG 13, reinforcing its relevance for sustainable industrial transformation.

Limitations and Future Directions

The exploratory nature of the pilot evaluation, the sample size (n = 17), and the reliance on perception-based responses restrict the generalisability of findings; however, results demonstrate that the instrument is feasible to apply in actual industrial situations. With 17 respondents, confidence intervals around the Cronbach’s alpha estimates are wide; results should therefore be interpreted as preliminary evidence of coherence rather than confirmatory validation.
Additionally, the benchmarking component of the T-BMC currently relies on aspirational targets set by the implementing organisation, as no sector-wide external benchmarks for sustainable maintenance maturity exist in the desalination industry. This limits the comparative power of the benchmarking chart to within-organisation longitudinal comparisons or bilateral plant-to-plant analyses. Future research should work toward establishing empirically grounded reference values through multi-plant, multi-sector studies, transforming the current target-gap analysis into true benchmarking against external performance norms.
The psychometric development of the instrument is also explicitly acknowledged as incomplete at this stage. Future research should conduct an independent formal CVI procedure with an expert panel, an Exploratory Factor Analysis (EFA) with a minimum sample of n = 100–120, and a test–retest reliability assessment. Additionally, future research should expand validation to larger and more diverse industrial samples, integrate objective performance data to complement expert perceptions, and apply multicriteria or AI-based analytical methods to enhance the predictive robustness of the maturity assessment framework.

Supplementary Materials

The following supporting information can be downloaded at: https://www.mdpi.com/article/10.3390/su18136656/s1, Table S1: Reviewer Comments and Actions Taken.

Author Contributions

Conceptualization, O.D.; methodology, O.D., C.S. and V.C.; software, V.C. and C.S.; validation, C.S., V.C. and L.V.A.; formal analysis, V.C., L.V.A. and O.D.; investigation, V.C.; resources, O.D.; data curation, V.C. and C.S.; writing—original draft preparation, V.C.; writing—review and editing, O.D., L.V.A. and C.S.; visualization, V.C.; supervision, O.D.; project administration, O.D. All authors have read and agreed to the published version of the manuscript.

Funding

This research received no external funding.

Institutional Review Board Statement

The study was conducted in accordance with the Declaration of Helsinki, and approved by the Institutional Review Board (or Ethics Committee) of the Bioethics and Biosafety Committee of the Pontificia Universidad Católica de Valparaíso (protocol code BIOEPUCV-H 868-2025 and 11 March 2025).

Informed Consent Statement

Informed consent was obtained from all subjects involved in the study.

Data Availability Statement

Data is unavailable due to privacy or ethical restrictions.

Acknowledgments

During the preparation of this manuscript/study, the authors used ChatGPT free for the purposes of translation into English part of the text. The authors have reviewed and edited the output and take full responsibility for the content of this publication.

Conflicts of Interest

The authors declare no conflicts of interest.

References

  1. Parida, A.; Kumar, U. Maintenance performance measurement (MPM): Issues and challenges. J. Qual. Maint. Eng. 2006, 12, 239–251. [Google Scholar] [CrossRef]
  2. Elimelech, M.; Phillip, W.A. The future of seawater desalination: Energy, technology, and the environment. Science 2011, 333, 712–717. [Google Scholar] [CrossRef] [PubMed]
  3. Panagopoulos, A.; Haralambous, K.-J.; Loizidou, M. Desalination brine disposal methods and treatment technologies—A review. Sci. Total Environ. 2019, 693, 133545. [Google Scholar] [CrossRef] [PubMed]
  4. Feo-García, J.; Pulido-Alonso, A.; Florido-Betancor, A.; Florido-Suárez, N.R. Cost studies of reverse osmosis desalination plants in the range of 23,000–33,000 M3/day. Water 2024, 16, 910. [Google Scholar] [CrossRef]
  5. Elkington, J.; Rowlands, I.H. Cannibals with forks: The triple bottom line of 21st century business. Altern. J. 1999, 25, 42. [Google Scholar]
  6. Osterwalder, A.; Pigneur, Y. Business Model Generation: A Handbook for Visionaries, Game Changers, and Challengers; John Wiley & Sons: Hoboken, NJ, USA, 2010. [Google Scholar]
  7. Holgado, M.; Macchi, M.; Fumagalli, L.; Milano, P. Maintenance business model: A concept for driving performance Improvement. Int. J. Strat. Eng. Asset Manag. 2015, 2, 159–176. [Google Scholar] [CrossRef]
  8. Franciosi, C.; Voisin, A.; Miranda, S.; Riemma, S.; Iung, B. Measuring maintenance impacts on sustainability of manufacturing industries: From a systematic literature review to a framework proposal. J. Clean. Prod. 2020, 260, 121065. [Google Scholar] [CrossRef]
  9. Alvez, A.; Aitken, D.; Rivera, D.; Vergara, M.; McIntyre, N.; Concha, F. At the crossroads: Can desalination be a suitable public policy solution to address water scarcity in Chile’s mining zones? J. Environ. Manag. 2020, 258, 110039. [Google Scholar] [CrossRef] [PubMed]
  10. Bourouni, K. Availability assessment of a reverse osmosis plant: Comparison between reliability block diagram and fault tree analysis methods. Desalination 2013, 313, 66–76. [Google Scholar] [CrossRef]
  11. Werner, M.; Schäfer, A.I. Social aspects of a solar-powered desalination unit for remote Australian communities. Desalination 2007, 203, 375–393. [Google Scholar] [CrossRef]
  12. Stokes, J.; Horvath, A. Life cycle energy assessment of alternative water supply systems (9 pp). Int. J. Life Cycle Assess. 2006, 11, 335–343. [Google Scholar] [CrossRef]
  13. Lee, K.; Jepson, W. Environmental impact of desalination: A systematic review of life cycle assessment. Desalination 2021, 509, 115066. [Google Scholar] [CrossRef]
  14. Karki, B.R.; Porras, J. Digitalization for sustainable maintenance services: A systematic literature review. Digit. Bus. 2021, 1, 100011. [Google Scholar] [CrossRef]
  15. Jasiulewicz-Kaczmarek, M.; Antosz, K.; Waszkowski, R.; Nielsen, I.; Čep, R. “Technology” as the fourth dimension of sustainable maintenance management. IFAC-PapersOnLine 2023, 56, 162–167. [Google Scholar] [CrossRef]
  16. Thompson, M.A.; Baker, R.; Yong, N.H. Technical and economic evaluation of an off-grid solar desalination system in Myanmar. J. Water Supply Res. Technol.-AQUA 2016, 65, 354–360. [Google Scholar] [CrossRef]
  17. Feo-García, J.; Ruiz-García, A.; Ruiz-Saavedra, E.; Melian-Martel, N. Cost assessment in SWRO desalination plants with a production of 600 M3/d in Canary Islands. Desalination Water Treat. 2016, 57, 22887–22893. [Google Scholar] [CrossRef]
  18. AL Mashrafi, S.; Diaz-Elsayed, N.; Benjamin, J.; Arias, M.E.; Zhang, Q. An environmental and economic sustainability assessment of a pressure retarded osmosis system. Desalination 2022, 537, 115869. [Google Scholar] [CrossRef]
  19. Madreiter, T.; Trajanoski, B.; Martinetti, A.; Ansari, F. Sustainable Maintenance: What are the key technology drivers for ensuring positive impacts of manufacturing industries? IFAC-PapersOnLine 2024, 58, 616–621. [Google Scholar] [CrossRef]
  20. Bouabid, D.A.; Hadef, H.; Innal, F. Maintenance as a sustainability tool in high-risk process industries: A review and future directions. J. Loss Prev. Process Ind. 2024, 89, 105318. [Google Scholar] [CrossRef]
  21. Ghaleb, M.; Taghipour, S. Assessing the impact of maintenance practices on asset’s sustainability. Reliab. Eng. Syst. Saf. 2022, 228, 108810. [Google Scholar] [CrossRef]
  22. Sari, E.; Ma’aram, A.; Shaharoun, A.M.; Chofreh, A.G.; Goni, F.A.; Klemeš, J.J.; Marie, I.A.; Saraswati, D. Measuring sustainable cleaner maintenance hierarchical contributions of the car manufacturing industry. J. Clean. Prod. 2021, 312, 127717. [Google Scholar] [CrossRef]
  23. Jasiulewicz-Kaczmarek, M.; Antosz, K. The concept of sustainable maintenance criteria assessment. In Advances in Production Management Systems. Artificial Intelligence for Sustainable and Resilient Production Systems; Springer: Cham, Switzerland, 2021; pp. 427–436. [Google Scholar]
  24. Patalas-Maliszewska, J.; Losyk, H. An approach to maintenance sustainability level assessment integrated with industry 4.0 technologies using fuzzy-TOPSIS: A real case study. Adv. Prod. Eng. Manag. 2022, 17, 455–468. [Google Scholar] [CrossRef]
  25. Olugu, E.U.; Wong, K.Y.; Chung Ee, J.Y.; Mammedov, Y.D. Incorporating sustainability and maintenance for performance assessment of offshore oil and gas platforms: A perspective. Sustainability 2022, 14, 807. [Google Scholar] [CrossRef]
  26. Franciosi, C.; Tortora, A.M.R.; Miranda, S. A maintenance maturity and sustainability assessment model for manufacturing systems. Manag. Prod. Eng. Rev. 2023, 14, 137–155. [Google Scholar] [CrossRef]
  27. Hauashdh, A.; Nagapan, S.; Jailani, J.; Gamil, Y. An integrated framework for sustainable and efficient building maintenance operations aligning with climate change, SDGs, and emerging technology. Results Eng. 2024, 21, 101822. [Google Scholar] [CrossRef]
  28. Saihi, A.; Ben-Daya, M.; As’ad, R. A hierarchical component model for sustainable performance measurement of maintenance practices: A fourth-order PLS-SEM approach. Comput. Ind. Eng. 2023, 185, 109699. [Google Scholar] [CrossRef]
  29. Saihi, A.; Ben-Daya, M.; As’Ad, R. An investigation of sustainable maintenance performance indicators: Identification, expert validation and portfolio of future research. IEEE Access 2022, 10, 124259–124276. [Google Scholar] [CrossRef]
  30. Alawaysheh, I.; Alsyouf, I. Environmental sustainability in maintenance management of public transport systems: Literature review. In Proceedings of the 2018 IEEE International Conference on Industrial Engineering and Engineering Management (IEEM); IEEE: New York, NY, USA, 2018; pp. 1125–1129. [Google Scholar]
  31. Jasiulewicz-Kaczmarek, M.; Żywica, P. The concept of maintenance sustainability performance assessment by integrating balanced scorecard with non-additive fuzzy integral. Eksploat. Niezawodn. 2018, 20, 650–661. [Google Scholar] [CrossRef]
  32. Vasić, S.; Orošnjak, M.; Brkljač, N.; Vrhovac, V.; Ristić, K. Identification of criteria for enabling the adoption of sustainable maintenance practice: An umbrella review. Sustainability 2024, 16, 767. [Google Scholar] [CrossRef]
  33. Franciosi, C.; Roda, I.; Voisin, A.; Miranda, S.; Macchi, M.; Iung, B. Sustainable maintenance performances and EN 15341:2019: An integration proposal. In Proceedings of the IFIP International Conference on Advances in Production Management Systems; Springer International Publishing: Cham, Switzerland, 2021; pp. 401–409. [Google Scholar]
  34. Barbieri, G.; Hernandez, J.D. Sustainability indices and RAM analysis for maintenance decision making considering environmental sustainability. Sustainability 2024, 16, 979. [Google Scholar] [CrossRef]
  35. Sagharidooz, M.; Soltanali, H.; Farinha, J.T.; Raposo, H.D.N.; de-Almeida-e-Pais, J.E. Reliability, availability, and maintainability assessment-based sustainability-informed maintenance optimization in power transmission networks. Sustainability 2024, 16, 6489. [Google Scholar] [CrossRef]
  36. Jasiulewicz-Kaczmarek, M.; Legutko, S.; Kluk, P. Maintenance 4.0 technologies—New opportunities for sustainability driven maintenance. Manag. Prod. Eng. Rev. 2020, 11, 74–87. [Google Scholar] [CrossRef]
  37. Bukowski, L.; Werbinska-Wojciechowska, S. Towards maintenance 5.0: Resilience-based maintenance in AI-driven sustainable and human-centric industrial systems. Sensors 2025, 25, 5100. [Google Scholar] [PubMed]
  38. Farsi, M.; Mishra, R.K.; Erkoyuncu, J.A. Industry 5.0 for sustainable reliability centered maintenance. In Proceedings of the 10th International Conference on Through-Life Engineering Services; SSRN: Rochester, NY, USA, 2021. [Google Scholar]
  39. Boone, H.; Boone, D. Analyzing likert data. J. Ext. 2012, 50, 48. [Google Scholar] [CrossRef]
  40. Joshi, A.; Kale, S.; Chandel, S.; Pal, D.K. Likert scale: Explored and explained. Br. J. Appl. Sci. Technol. 2015, 7, 396. [Google Scholar] [CrossRef]
Figure 1. The concept of sustainable maintenance.
Sustainability 18 06656 g001
Figure 2. The double role of maintenance in sustainability.
Sustainability 18 06656 g002
Figure 3. Proposed methodology.
Sustainability 18 06656 g003
Figure 4. Tripartite maintenance business model canvas.
Sustainability 18 06656 g004
Figure 5. Results of three participatory workshops.
Sustainability 18 06656 g005
Figure 6. Sustainability dashboard for the generic desalination plant.
Sustainability 18 06656 g006
Figure 7. Benchmarking chart.
Sustainability 18 06656 g007
Table 1. Breakdown of questions by segment of the tripartite BMC along with their objectives and indicators.
BMC SegmentTBL DimensionStatementGoalsKey Indicators
Customer SegmentsEconomicEquipment availability levels are continuously analyzed to ensure optimal operational performance.Evaluate operational availability monitoring and its impact.Asset availability, operational reliability, cost optimization.
EnvironmentalEnvironmental impacts associated with maintenance processes are continuously evaluated to identify and mitigate potential effects on customers and stakeholders.Determine the perception of stakeholders regarding the environmental impact of maintenance.Environmental impact, regulatory compliance.
SocialThe potential negative impacts of maintenance processes on individuals—including workers, desalinated water users, and nearby residents—are systematically assessed and managed.Understand the monitoring of the social impact of maintenance on people.Job security, community perception, quality of service.
Value PropositionsEconomicAt the corporate level, maintenance initiatives have contributed to higher asset availability and a reduction in overall operating costs.Evaluate the contribution of maintenance to economic efficiency.Asset availability, cost optimization, operational efficiency.
EnvironmentalThe maintenance policy has resulted in reduced energy consumption, generating a positive environmental effect.Analyze the effect of maintenance on energy efficiency and environmental mitigation.Energy efficiency, clean technologies, environmental impact.
SocialImprovements have been achieved in the duration and frequency of desalinated water service interruptions, enhancing service reliability for customers.Evaluate the improvement in the continuity and quality of the water service.Supply reliability, service continuity, MTBF, MTTR.
ChannelsEconomicInternal communication mechanisms are in place to report on sustainability outcomes related to maintenance, including achievements, identified gaps, and corrective action plans.Determine the existence of internal communication channels on sustainability.Internal communication, continuous improvement, strategic monitoring.
Environmental & SocialDedicated communication channels are maintained with external clients and stakeholders to address sustainability matters.Evaluate the existence of external channels of communication on sustainability.External communication, transparency, corporate responsibility.
Customer RelationshipsEconomic & EnvironmentalEnhanced economic efficiency and positive environmental outcomes in commercial operations have been observed as a direct result of maintenance-related improvements, and are communicated through shared organisational interfaces.Analyze the internal perception of the economic and environmental impact of sustainable maintenance through the same relational channels.Economic efficiency, environmental transparency, perceived value.
SocialWorker safety and integrity are prioritized through the continuous implementation and review of maintenance procedures.Evaluate the priority and monitoring of occupational safety and well-being.Job security, job satisfaction.
Revenue StreamsEconomicEffective maintenance strategies are implemented to fulfill their purpose while optimizing performance and reducing costs.Evaluate whether maintenance strategies generate tangible economic benefits.Operational efficiency, cost reduction, quantification of sustainable strategies.
EnvironmentalMaintenance strategies are implemented to achieve their objectives while minimizing energy consumption and environmental impact.Evaluate whether maintenance actions lead to a reduction in energy consumption and emissions.Energy efficiency, environmental management.
SocialContinuous training programs are provided to employees to maintain and improve professional competence.Analyze the company’s commitment to the development and well-being of human capital.Job satisfaction, training, investment in human capital.
Key ActivitiesEconomicThe maintenance department undertakes actions that generate direct financial benefits for the organization.Determine whether maintenance actions generate direct economic benefits.Operational efficiency, resource optimization.
EnvironmentalWaste generated by operational activities is properly managed in accordance with applicable regulations.Evaluate the effectiveness of waste management in the company.Waste management, environmental efficiency.
SocialMaintenance activities are continuously monitored to ensure that they contribute positively to the quality of desalinated water delivered to consumers.Analyze whether maintenance activities consider the social impact on end users.Service quality, social commitment, operational continuity.
Key ResourcesEconomic, Environmental & SocialAn appropriate portion of the budget is allocated to the acquisition of new tools and to staff training, ensuring optimal performance.Analyze the strategic allocation of budget to key resources for sustainability.Technological investment, job training, strategic management.
Key PartnersEconomicSupplier management practices are applied to minimize lead times for critical materials and components.Evaluate supplier management to optimize time and economic efficiency.Strategic partners, inventory management, operational availability.
EnvironmentalA significant proportion of key suppliers and partners hold recognized quality and environmental certifications.Determine whether the company establishes alliances with environmentally certified suppliers.Environmental management, environmental certification.
SocialMost external training providers possess quality and environmental certifications.Evaluate the quality and certification of personnel training institutions.Certified training, job security, professional development.
Cost StructureEconomicInvestment in sustainable maintenance practices has been shown to yield greater long-term profitability.Verify whether economic monitoring of maintenance costs translates into positive impact on profitability.Financial control, cost efficiency and strategic investment.
EnvironmentalOperating costs associated with waste management are regularly monitored to ensure efficiency and compliance.Evaluate whether the company controls the environmental costs associated with maintenance operations.Environmental management, operating costs and waste management.
SocialThe organization’s economic policy incorporates measures to promote employee welfare, including job stability, training, paid leave, and recreational programs.Analyze how the company structures its budget to ensure real investments in the social and occupational well-being of its employees.Workplace well-being and social responsibility.
Table 2. Descriptive statistics by triple bottom line dimension (n = 17).
TBL DimensionMeanMedianQ1Q3IQRMinMax
Economic3.884.003.005.002.0015
Environmental3.904.003.005.002.0015
Social4.104.003.004.001.0015
Overall (24 items)3.964.003.005.002.0015
Table 3. Scores of BMC components according to the proposed grouping.
BMC SegmentSustainability DimensionSub-ScoreBlock Average
Customer SegmentsEconomic4.414.08
Environmental3.88
Social3.94
Customer RelationshipsEconomic & Environmental (consolidated)3.41/3.943.90
Social4.35
ChannelsEconomic3.713.74
Environmental & Social (consolidated)3.76
Revenue StreamsEconomic3.883.78
Environmental3.59
Social3.88
Key ActivitiesEconomic4.184.27
Environmental4.24
Social4.41
Key ResourcesEconomic, Environmental & Social (consolidated)4.064.06
Key PartnersEconomic3.653.84
Environmental4.18
Social3.71
Cost StructureEconomic3.763.86
Environmental3.53
Social4.29
Value PropositionsEconomic3.884.10
Environmental3.88
Social4.53
Table 4. Sustainability benchmarking analysis.
Sustainability DimensionBMC OrientationCurrent (Blue Lines)Benchmark (Red Lines)
EconomicCustomer-orientedBA−
Internal operational-orientedBA−
EnvironmentalCustomer-orientedBA−
Internal operational-orientedA−A−
SocialCustomer-orientedA−A+
Internal operational-orientedA−A+
Table 5. Action plan based on identified sustainability gaps.
BMC ComponentEconomic DimensionSocial DimensionEnvironmental Dimension
Customer SegmentsPrioritize high-criticality systems using risk-based maintenance to reduce TCO.Deliver maintenance services ensuring water access for isolated coastal communities.Identify operational areas with higher potential for energy and chemical footprint reduction.
Value PropositionReduce TCO via RCM and condition monitoring.Guarantee potable water availability with minimum disruptions.Extend membrane and asset lifespan through preventive and predictive care.
ChannelsImplement EAM systems integrated with SCADA and digital work orders.Use multilingual interfaces in CMMS to improve communication with diverse technicians.Enable paperless workflows and remote inspections via drones or smart sensors.
Customer RelationshipsEstablish performance-based contracts tied to availability and energy efficiency.Ensure open reporting of plant incidents, near-misses, and safe work permit systems.Educate clients on the benefits of eco-efficient maintenance strategies.
Revenue StreamsDevelop MaaS models based on predictive analytics and uptime guarantees.Capture social value through workforce training and retention programs.Quantify and monetize reductions in carbon footprint and energy usage.
Key ResourcesDeploy cost-effective tools: thermography, vibration analysis, and mobile CMMS.Develop cross-trained teams skilled in HSE practices and ethical operations.Utilize certified biodegradable greases and solar-powered maintenance tools.
Key ActivitiesApply Lean Maintenance and TPM to reduce downtime and cost per m3.Conduct regular HSE drills and continuous learning programs.Integrate ISO 14001-compliant procedures for hazardous waste and brine disposal.
Key PartnersCollaborate with OEMs for predictive diagnostics and optimized spare parts contracts.Partner with local institutions to train and employ community members in technical roles.Develop green procurement policies with suppliers adhering to REACH and RoHS.
Cost StructureIncorporate Life-Cycle Costing (LCC) and reliability-based maintenance budgeting.Include costs of labor equity, safety training, and well-being provisions in the budget.Internalize water and energy footprints; use ISO 50001 and carbon accounting tools.
Disclaimer/Publisher’s Note: The statements, opinions and data contained in all publications are solely those of the individual author(s) and contributor(s) and not of MDPI and/or the editor(s). MDPI and/or the editor(s) disclaim responsibility for any injury to people or property resulting from any ideas, methods, instructions or products referred to in the content.