


Abstract
Cement manufacturing is a major source of carbon dioxide (CO2) emissions globally. Cement replacement materials are increasingly used to minimize the environmental impact of concrete production. In the present study, the mechanical and environmental performance of concrete mixtures containing fly ash and recycled glass powder as partial cement replacements at levels of 10%, 20%, and 30% were investigated. Workability, unit weight, compressive strength, and water permeability tests were conducted to evaluate the effects of replacements on concrete behavior. Carbon emissions decreased as the substitution ratio increased, with the highest reduction (28.9%) observed in the mixture containing 30% fly ash. Compressive strength values ranged from 21.9 to 27.0 MPa, indicating that all mixtures fell within the intended strength range. Two types of cement replacements—fly ash (FA) and recycled glass powder (GP)—were evaluated separately. Compared to GP mixtures, FA mixtures generally exhibited lower permeability (up to 50%) and better strength retention (up to 9.6 percentage points), though both materials contributed to reducing embodied carbon. The mixture containing 30% fly ash demonstrated the highest environmental efficiency, with a carbon intensity of 10.84 kg CO2/MPa, corresponding to a 19.2% reduction compared with the control. For recycled glass powder, the 20% replacement level offered the most balanced performance, while higher replacement ratios led to more pronounced strength losses. This study provides a direct comparison of FA and GP under identical mixture conditions using performance-normalized environmental indicators. The results indicate that, under the tested conditions, fly ash exhibits a better combination of carbon emission reduction and mechanical strength than recycled glass powder.
1. Introduction
The construction industry is a major contributor to global energy use, natural resource consumption, and carbon emissions, accounting for approximately 37% of global greenhouse gas emissions [1]. After water, concrete is the second most widely used construction material in the world. Its yearly global production is projected to be around 14 billion cubic meters [2]. However, its main binder, Portland cement, generates significant carbon emissions. Cement manufacture is one of the most carbon-intensive industrial processes, contributing around 7–8% of the world’s anthropogenic CO2 emissions [3,4]. To reduce cement consumption and environmental damage, partial substitution of Portland cement with recycled materials and industrial byproducts has become a widely adopted strategy. Fly ash (FA) and glass powder (GP) are among the most investigated recycled materials in sustainable concrete.
The pozzolanic characteristics of FA enable interaction with calcium hydroxide, leading to the formation of supplementary calcium–silicate–hydrate (C-S-H) gel during hydration. This process causes reduction in the connectivity of capillary pores, by improving long-term durability [5,6,7]. Moderate fly ash substitution ratios improve pore structure and reduce water infiltration, but elevated replacement levels may adversely affect early-age strength [8,9,10,11].
Globally, millions of tons of waste glass are generated annually, and when not recycled, a significant portion is disposed of in landfills. The use of powdered waste glass as a partial cement replacement is one way to utilize this waste [12,13,14,15,16,17]. The use of waste glass in the cement industry is beneficial not only for reducing cement demand but also for eliminating the need for melting energy, thereby cutting CO2 emissions [18]. By grinding glass powder to fine sizes, glass powder develops pozzolanic activity. Due to its fine nature, it enhances particle packing within the cement matrix and reacts with calcium hydroxide to produce additional C-S-H gel [19,20,21,22]. Previous studies indicate that replacement levels of 10–20% increase the compressive strength and decrease permeability. However, above these levels, workability decreases while the rate of gain in strength becomes constant [23,24,25,26,27]. Fineness is a key factor, as higher degrees of fineness improve reactivity and maintain high strength even at elevated replacement rates [25,26]. Similarly, glass powder has also been tested in alkali-activated systems. However, its performance appears more sensitive to mixture composition and curing conditions [27]. Glass powder exhibits a noticeable strength advantage during early curing stages. However, this difference tends to diminish with increasing curing time [28,29,30,31]. However, in most of these studies, FA and GP have been evaluated independently as cement replacements. Moreover, their mechanical and environmental performance has mostly been studied in isolation, without relating these parameters through performance-normalized indices [32].
Therefore, beyond material-level investigations, a systematic performance-based framework that directly relates environmental impact to mechanical performance is essential for individual FA and GP replacement systems. In parallel, the combined use of FA and GP has gained attention in the research community. According to Su et al. [33], GP in alkali-activated GP and FA blends increases its splitting tensile strength and toughness. Similarly, Yusuf et al. [34] observed improved structural stability in ternary concrete with equal amounts of FA and GP (10% each). Glass powder has been combined with other industrial byproducts in more advanced binder systems [35,36,37,38,39,40]. Despite these advances, most previous studies have focused either on isolated mechanical performance or on blended FA–GP systems without directly comparing the environmental performance efficiency of FA and GP under identical mixture design and curing conditions. Comparative analyses integrating mechanical and environmental performances for individual binary FA and GP systems—especially at medium to high replacement levels under typical field conditions and without chemical admixtures—remain limited. Only a few studies report performance-based indicators such as carbon dioxide emissions per unit compressive strength (kg CO2/MPa). Consequently, determining appropriate replacement levels and evaluating the trade-off between carbon reduction and structural performance remains difficult. Despite the growing interest in combined FA–GP systems [33,34,37,38,39], performance-normalized environmental assessments for individual FA and GP systems at equivalent substitution levels remain scarce, particularly under high w/c conditions without chemical admixtures. The replacement levels of 10%, 20%, and 30% were selected to align with ranges commonly investigated in the literature [12,13,14,24,25] and to enable a controlled pairwise comparison between the two materials under identical mixture conditions.
The novelty of this study lies in the performance-based comparison of FA and GP systems using combined mechanical and environmental indicators under identical mixture conditions. This is achieved in three specific ways. First, it combines mechanical performance with environmental impacts using performance-normalized indicators, specifically carbon intensity (kg CO2/MPa). To the best of our knowledge, this has been less frequently investigated systematically for binary FA and GP systems at w/c = 0.60 without chemical admixtures. Second, it examines the mechanical and environmental performance of FA and GP in high-water-to-cement-ratio systems without chemical admixtures. These conditions reflect real-world applications such as pavements, mass concrete, and leveling layers, where strength requirements are generally modest. Third, it provides recommendations on replacement levels that balance mechanical efficiency, durability, and carbon reduction. Finally, it applies two complementary analytical approaches—a Carbon Reduction Efficiency (CRE) index and a Carbon–Performance Quadrant framework—to evaluate the environmental–mechanical relationship in sustainable concrete mixtures. While combined FA–GP systems provide valuable information regarding material synergy, their exclusion in the present research is intentional, as the primary objective is to establish well-defined baseline benchmarks for individual materials. Based on the literature and the experimental design, the following hypotheses were formulated: (1) replacing cement with 20–30% fly ash will achieve embodied carbon reductions exceeding 15% relative to the control while maintaining compressive strength within 90% of the control at 28 days; (2) GP replacement will yield comparable carbon reductions to FA at equivalent substitution levels, but with greater strength penalties, particularly beyond 10% replacement; and (3) performance-normalized carbon intensity will improve consistently with increasing FA content, whereas GP mixtures will exhibit a less pronounced improvement due to the offsetting effect of strength loss.
2. Materials and Methods
In this study, the effects of recycled fly ash and glass powder on the fresh and hardened properties of concrete were compared. Concrete mixtures were prepared without using chemical admixtures. This simplified setup reveals the behavior of fly ash (FA) and glass powder (GP) more directly by eliminating the factors arising from chemical interactions. In particular, the study described here is limited to concrete mixtures with a relatively high water-to-cement ratio (w/c = 0.60). In practice, such mixtures are typically developed as low-strength concretes for field applications. The selected water–cement ratio of 0.60 indicates low-to-medium-strength concrete, often used for nonstructural purposes, such as pavements, mass concrete, and leveling layers. In addition, this ratio provides sufficient water content to ensure that pozzolanic reactions continue at early curing ages since replacement cementitious materials such as fly ash and glass powder require adequate moisture for secondary hydration products to develop. Although lowering the water–cement ratio would increase the baseline strength, it would be harder to identify the contribution of SCMs, because the strength range would be compressed, making differentiation between mixtures more difficult. This study does not target a specific strength class. Rather, the emphasis is placed on the effect of these replacement materials on important properties such as workability, unit weight, and compressive strength under representative conditions.
This study aims to evaluate the durability, mechanical, and environmental performance of concrete mixtures with FA and GP. Many previous studies have examined these aspects separately. In contrast, the present work combines structural performance with environmental efficiency.
To ensure a reliable basis for comparison, a mixture composed solely of Portland cement was utilized as the control group. Using this control as a reference, the effects of FA and GP were examined more clearly.
2.1. Design of Experiments
Tests began with a concrete mixture called Control, containing 100% cement, which served as the reference. Subsequently, mixtures were prepared with fly ash or glass powder as replacements for 10%, 20%, and 30% of the cement. As a result, there were seven mixture types in total. Cubic test specimens were cast for each type of mixture. The tests performed were related to the fresh and hardened properties of concrete. This experimental methodology enabled a consistent and comparative evaluation of the investigated concrete mixtures. In all concrete mixtures, the water-to-cement ratio was kept constant (approximately 0.60). The maximum aggregate size selected was less than 20 mm. The effect of mineral admixtures on concrete properties was investigated directly; therefore, no chemical additives were used. Concrete mixture proportions and materials are shown in Table 1.
Table 1.
Concrete mixture ingredients.
The choice of three replacement levels (10%, 20%, and 30%) was intentional and is commonly employed in supplementary cementitious materials research. These ratios denote practically relevant replacement levels corresponding to low, moderate, and high substitution levels. Recent studies evaluating recycled GP and FA systems have similarly employed comparable replacement intervals to evaluate mechanical and durability performance under controlled conditions [32,33,34]. The aim of this research was not to establish a highly refined optimization curve through numerous incremental replacement levels, but rather to compare performance trends and trade-offs between FA and GP under strictly identical conditions. Importantly, the experimental program investigates two independent material systems (FA and GP), with each mixture tested using five replicate specimens per condition. Statistical analysis was performed to evaluate the significance and reliability of differences between mixture groups. However, additional intermediate replacement levels may provide a more detailed assessment of transition behavior and are therefore recommended for future optimization studies.
The replacement type and level were considered when assigning names to the concrete mixtures under investigation. “Control” represents the reference mixture, consisting of pure cement with no replacement. The abbreviations “FA” and “GP” stand for fly ash and glass powder, respectively. Mixture names contained numbers equal to 10%, 20%, or 30%, depending on the cement replacement level. Thus, “GP-20” indicated that cement was replaced with 20% glass powder. The name “FA-10” indicated that the cement content was replaced with 10% of fly ash. Such a naming convention facilitates a comparative evaluation of the influence of different types and levels of replacement on concrete properties in fresh and hardened states.
2.2. Material Characterization and Specifications
2.2.1. Cement
The cement used in this study was a standard Portland cement used in structural concrete applications and obtained from Kyrgyzstan. The chemical composition was provided by the supplier. The main constituents include CaO (59.0–63.0%), SiO2 (21.0–22.0%), Al2O3 (4.5–6.0%), Fe2O3 (3.5–4.5%), MgO (1.5–3.5%), SO3 (up to 3.5%), and loss on ignition (LOI) up to 1.5%. These values indicate a conventional calcium-rich Portland cement composition.
2.2.2. Fly Ash
The fly ash used as a replacement cementitious material was obtained from MEDCEM Global (Istanbul, Turkey). The product, Eren Energy Dry Fly Ash, complies with EN 450-1 [41] requirements. The chemical composition of fly ash, given in Table 2, was determined by X-ray fluorescence (XRF) analysis. The fly ash is classified as low-calcium fly ash, with a combined SiO2 + Al2O3 + Fe2O3 content greater than 70%, loss on ignition of 1.0–3.0% (Category A), and 45 µm residue of 15–30% (Category N). The activity index satisfies EN 450-1 criteria, with values of ≥75% at 28 days and ≥85% at 90 days, respectively.
Table 2.
Chemical composition and physical properties of fly ash.
2.2.3. Glass Powder
The glass powder used as a replacement cementitious material was obtained from Aker Chemistry (Istanbul, Turkey). It was synthesized from waste recycled soda–lime glass (CAS No: 65997-17-3; EC No: 266-046-0). The raw glass was mechanically ground to produce glass powder for cement replacement.
Properties of glass powder are presented in Table 3. Glass powder was found to be silica-based (SiO2: 69.42%), and contained appreciable proportions of Na2O (12.31%) and CaO (8.27%). The loss on ignition (LOI) value of 16.18% is attributed to processing-related impurities rather than the combustibility of the glass matrix.
Table 3.
Chemical composition and physical properties of glass powder.
Glass powder is likely to demonstrate latent pozzolanic behavior in an alkaline medium due to its amorphous silica-rich structure and high surface area (72.83% < 50 µm).
2.2.4. Material Traceability and Reproducibility
All materials used in this study were sourced from industrial suppliers with documented technical specifications, ensuring full traceability of material properties. The chemical compositions and physical characteristics reported in this section were obtained directly from supplier documentation and verified against relevant standards (EN 450-1 and EN 451-2 [42] for fly ash). This level of material characterization ensures reproducibility of the experimental program under similar material conditions and provides a reliable basis for evaluating the mechanical, durability, and environmental performance of the concrete mixtures.
2.3. Sample Preparation and Curing Conditions
The experiments were conducted in the Construction Department Laboratory, Vocational School, Kyrgyzstan Turkey Manas University. The concrete mixtures were cast in 150 × 150 × 150 mm cube molds. Casting was carried out according to the TS EN 12390-2 [43]. The inner surfaces of the molds were oiled. To prevent segregation, concrete was placed in three layers. Each layer was compacted using a mechanical vibrator (Vommak Machinery, Ankara, Turkey. After casting, the molds were covered with a damp cloth and plastic sheeting to prevent moisture loss during setting. Specimens were removed from the molds after approximately 24 h and then cured in a water tank at 20 ± 2 °C for 28 days.
2.4. Test Methods
The following standard test methods were used to evaluate the properties of fresh and hardened concrete. Fresh concrete tests focused on key workability characteristics such as workability, ease of placement, and homogeneity. Hardened concrete tests were conducted to quantify the influence of additive materials on mechanical strength, durability, and water permeability. All tests have been performed based on the relevant EN and ASTM standards.
2.4.1. Fresh Concrete Tests
Unit weight was measured to assess the density of fresh concrete and placement quality. The slump test (TS EN 12350-2 [44]) was carried out to assess consistency and workability. Air content was measured using a pressure air meter, Testform CN196 Type B (Testform Material Testing Equipment, Ankara, Turkey), with the pressure compensation technique. The test procedure was based on EN 12350-7 [45], ASTM C231/C231M-17a [46], and DIN 1048 [47]. The workability test applied was the Vebe test (TS EN 12350-3 [48]) using a standard Vebe apparatus. It consisted of measuring, in seconds, the time required for the concrete to become fluid under vibration. In order to compare the behavior of different mixtures, the tests were carried out on fresh concrete, following standardized testing methods.
2.4.2. Hardened Concrete Tests
For the compressive strength test (TS EN 12390-3 [49]), 150 mm × 150 mm cubic specimens were tested after 28 days of curing at a loading rate of 0.6 ± 0.2 MPa/s. Compressive strength tests were conducted using an ALFA B-001/LCD/2 compression test machine (ALFA Testing Equipment, Ankara, Turkey). The machine has a maximum loading capacity of 2000 kN and a load measuring accuracy of ±1%. It is equipped with a digital LCD data acquisition system. This system facilitates automatic adjustment of the loading rate according to EN 12390-4 [50] and ASTM C39 [51] standards. Calibration of the equipment was carried out prior to testing following the manufacturer’s recommended five-point calibration protocol.
The Schmidt hammer test (TS EN 12504-2 [52]) was conducted to indirectly determine compressive strength using surface hardness measurement and uniformity checks. For the determination of rebound numbers, an N-type DRC ECTHA 1000 rebound hammer (DRC Srl, Ancona, Italy) was used. The technical specifications of the device are as follows: impact energy of 2.207 Nm, measurement range of 5–120 MPa, and accuracy of ±2 R units. Ten readings were taken from each specimen. The instrument was calibrated according to the manufacturer’s instructions prior to testing. Water permeability, which is a very important factor for determining durability, was determined based on TS EN 12390-8 [53] using the water permeability test method. In the tests, the water pressure applied to the specimen was 5 bar (0.5 MPa) for 72 h. After splitting the specimen, the water depth of penetration (mm) was found by calculation. The testing equipment used in this test is “Testform CN435 water permeability test equipment (Testform Material Testing Equipment, Ankara, Turkey)” along with constant pressure equipment (precision of ±0.01 MPa). There were three specimens for each mixture in the test results.
2.5. Data Recording and Statistical Analysis
All readings were recorded immediately after conducting each test. Compressive strength data were recorded electronically via the onboard data acquisition system of the ALFA B-001/LCD/2 compression testing machine and subsequently transferred to computer-based spreadsheets for further processing. Schmidt hammer rebound values, water penetration resistance measurements, and fresh concrete test data were recorded manually on pre-designed test forms during testing. Each reported value represents the arithmetic mean of five replicates, except for water permeability, where the mean of three replicates was used. Outliers were identified using the criterion of mean ± 2 standard deviations; no measurements were discarded based on this criterion. All raw data were retained, reviewed, and confirmed against test forms prior to statistical analysis to ensure consistency and accuracy of the reported results.
All statistical analyses were carried out using Microsoft Excel (Version 2019). A significance level of α = 0.05 was set for all tests. To evaluate how the mixture composition affected compressive strength, a one-way analysis of variance (ANOVA) was performed. This was followed by Tukey’s HSD post hoc test, which helped identify which specific groups differed significantly from one another. The effect size was expressed using eta-squared (η2), and the statistical power was also calculated to ensure that the experimental design was sufficiently robust.
3. Results and Discussion
3.1. Fresh Concrete Properties
3.1.1. Unit Weight, Slump, and Vebe Time
The unit weight of concretes with fly ash and glass powder was investigated. All mixtures had a high water-to-cement ratio (w/c = 0.60) and were prepared without chemical additives. To better understand the results, we considered not only the average unit weight but also the standard deviation and coefficient of variation (COV). Unit weights of prepared mixtures are given in Figure 1. A statistical analysis, shown in Table 4, was performed to evaluate the variability and reliability of the results. For all mixtures, the COV values were below 1%. This indicates that the results are statistically reliable and reproducible. It also shows that the mixtures were produced under controlled conditions, even without chemical admixtures. The variability in the measurements stayed within acceptable limits, as detailed in Table 4.
Figure 1.
The unit weights of mixtures.
Table 4.
The unit weights of concrete mixtures.
The control concrete exhibited the highest unit weight, while its low standard deviation and COV values indicated consistent performance in fresh concrete. This makes the control mixture a reference point for assessing variability in admixtures. In concrete mixtures containing fly ash, a gradual and limited decrease in unit weight was observed with increasing additive ratio. For FA-20, the decrease in standard deviation to 15.31 kg/m3 and the COV to 0.65% indicate that this mixture has a more uniform internal structure than the control concrete.
Due to the spherical particle shape and filling effect of fly ash, the void distribution between the concrete paste and the aggregate becomes more balanced. This reduces variability between measurements. In FA-30, the standard deviation was 18.79 kg/m3 with a COV of 0.80%. This indicates that limitations related to process ability and water distribution may arise at high substitution rates but are not excessive.
The reduction in unit weight was more significant in GP mixtures than in FA mixtures (Table 4). The progressive decline from GP-10 to GP-30 is attributed to the micro-filler effect of glass powder at low replacement levels, whereas at higher levels, increased water demand may affect internal homogeneity in the absence of chemical additives. Overall, it was observed that FA-20 and GP-10, in particular, offer a more stable, homogeneous, and predictable structure. These findings demonstrate that waste-based mineral admixtures affect not only the physical properties of concrete but also its production stability and internal structure homogeneity.
Slump and Vebe tests were conducted to quantitatively evaluate the effect of observed changes in unit weight and homogeneity on the properties of fresh concrete. These tests showed that admixtures play a decisive role in concrete workability. The workability properties of concrete mixtures produced with different admixtures were evaluated, and the results are given in Table 5.
Table 5.
The slumps and Vebe times of mixtures.
Slump and Vebe tests were conducted to evaluate the effects of replacement materials (FA and GP) on fresh concrete properties without chemical admixtures and with a high water/cement ratio (w/c = 0.60). Despite the high water-to-cement ratio, the absence of chemical admixtures limited fluidity, yet workability remained adequate.
The control concrete’s high unit weight indicates a stable fresh concrete performance and a compact internal structure. It has been observed that as the substitution ratio increases, the slump values of concrete mixtures containing fly ash increase while the Vebe times decrease regularly. This indicates that the spherical grain structure and ball-bearing effect of fly ash reduce internal friction, thereby increasing the fluidity of the concrete mixture. Among all mixtures, the highest slump value (207.9 mm) and the lowest Vebe time (1.5 s) were observed for FA-30, which is the closest to the workability range of self-compacting concrete (SCC). However, to classify the concrete as SCC, additional rheological characterization such as slump flow, J-ring, or V-funnel tests, which were beyond the scope of the present research, should be conducted.
Unlike fly ash, the workability of mixtures containing glass powder decreases as the substitution ratio increases, indicating a transition from plastic-medium to hard consistency. This trend can be attributed to the properties of glass powder. Because of its angular grain structure and high specific surface area, it increases the water requirement. As a result, in the absence of chemical additives, the flow of the concrete paste is restricted.
When unit weight and workability results are evaluated together, a strong relationship is observed between the performance of fresh concrete and the density of its internal structure. Figure 2 shows the relationship between slump and unit weight for FA and GP mixtures. As seen in the figure, fly ash mixtures maintained a relatively high unit weight while the slump increased significantly. In contrast, glass powder mixtures showed a steady decline in unit weight and slump as the replacement ratio increased. This confirms that the spherical shape of fly ash particles improves particle packing and flowability simultaneously, whereas the angular shape of glass powder restricts density and workability.
Figure 2.
Slump versus unit weight for mixtures (the symbol size indicates the replacement level).
Figure 3 presents the relationship between slump and Vebe time for FA and GP mixtures. It is evident in the graph that there exists an inverse relationship between slump and Vebe time. The fly ash mixtures exhibit a steeper negative slope, implying that even minor changes in slump result in substantial decreases in Vebe time. On the other hand, the glass powder mixtures exhibit a less pronounced trend, with higher Vebe times despite similar slump values, due to their lower fluidity. The fact that all COVs are below 1% suggests that the data are statistically sound.
Figure 3.
Vebe time versus unit weight for mixtures (the symbol size indicates replacement level).
From the analysis, it can be seen that fly ash improves the workability of concrete, but an increase in the percentage of glass powder in the mixture leads to a decrease in workability. The results indicate that it is important to consider the relationship between slump and Vebe, as well as average values, when evaluating the effect of waste-based mineral admixtures on fresh concrete properties.
3.1.2. Air Content
Air content plays a vital role in concrete performance, as it directly affects strength and workability. In this study, a compressed air measurement test was conducted to determine the air content of fresh concrete. The results are presented in Figure 4. The air content of the control concrete was approximately 2.0%. In the FA mixtures, the air content decreased gradually with increasing replacement level. It was 1.9%, 1.8%, and 1.7% for FA-10, FA-20, and FA-30, respectively. These represent an overall absolute decrease of approximately 0.3% in air content up to 30% fly ash replacement. The GP mixtures exhibited different behavior. The air content of the GP-10 mixture was approximately 2.0%, similar to the control concrete. However, for the GP-20 and GP-30 mixtures, the air content increased to approximately 2.1% and 2.5%, respectively.
Figure 4.
A comparison of air contents.
It has been observed that the replacement type and level significantly affect the air content. Despite the high water-to-cement ratio, fly ash caused a gradual decrease in air content. This may be due to better self-compaction and tighter particle packing. In contrast, glass powder increased air content at higher substitution ratios. This may be due to its increased ability to trap more air and the angular shape of the particles. These findings demonstrate that the physical characteristics of the additives significantly influence the behavior of fresh concrete.
The variations in air content may also affect the hardened concrete properties. Lower air contents of FA mixtures are generally related to a denser internal structure, which consequently reduces permeability and improves durability. Conversely, the higher air content found in GP-20 and GP-30 could partly explain their increased permeability and reduced compressive strength reported in later sections. This is because additional entrapped air can increase pore connectivity and reduce the effective load-bearing area of the cementitious matrix. Although a direct relation was not established in the present study, the agreement between the fresh and hardened concrete results indicates that air content may affect the overall performance.
3.2. Properties of Hardened Concrete
3.2.1. Compressive Strength
The 28-day compressive strength test was conducted (Figure 5).
Figure 5.
Experimental setup for the 28-day compressive strength test.
The compressive strength results presented in Figure 6 illustrate the effect of replacement materials on concrete strength. The strength of the control mixture was 27.0 MPa. This value is used as a reference for the analysis. In FA mixtures, compressive strength decreased gradually with higher substitution ratios. The response of FA-10 was quite similar to the control concrete, with a value of 26.8 MPa. For FA-20 and FA-30, the strengths were 25.6 MPa and 24.5 MPa, respectively. These results show a significant decrease compared with the control concrete.
Figure 6.
The 28-day compressive strength results of all mixtures.
It is known that fly ash exhibits slower pozzolanic reactivity than Portland cement, which leads to lower early-age strength but improved strength development at later ages. Therefore, the relatively lower compressive strength observed for FA-30 mixtures at 28 days should be interpreted with caution. Previous studies have shown that concrete containing high amounts of fly ash continues to gain strength after the 28-day standard strength test. An increase in strength is also seen on the 56th and 90th days. This is due to the pozzolanic reactions of fly ash that continue over time [54,55].
The reduction in the strength of mixtures containing glass powder was more pronounced. The GP-10 mixture exhibited a slight decrease compared with the control unit, with a strength of 26.2 MPa. As the glass powder substitution level increased to 20% and 30%, the strength declined to 23.4 and 21.9 MPa, respectively. In particular, the GP-30 mixture exhibited an approximate 19% strength loss relative to the control.
Overall, the results indicate that the 28-day compressive strength values decrease with increasing substitution ratio. The 28-day compressive strength values obtained for all mixtures range from 21.9 to 27.0 MPa. The range falls within the expected properties of low-to-medium-strength concrete at a w/c ratio of 0.60, confirming that cement replacement did not compromise the intended performance.
Figure 7 presents the relationship between air content and 28-day compressive strength for all mixtures. Overall, the results suggest that an increase in air content is associated with a reduction in compressive strength.
Figure 7.
Compressive strength versus air content.
Mixtures containing fly ash with lower air content (1.7–1.9%) generally exhibited higher strength, whereas mixtures incorporating glass powder with higher air content (2.1–2.5%) tended to show lower strength. Specifically, the GP-30 mixture emerged as the case with the highest air content and lowest strength.
In the graph, the symbol size represents the replacement level. It increases with the replacement level. The figure shows that as the replacement level increases, the air content tends to increase as well. This pattern is more noticeable in glass powder mixtures. Therefore, air content appears to play a significant role in the structure of fresh concrete.
In conclusion, the findings show that the replacement level and associated air content affect compressive strength. The strength reduction was less significant with fly ash, whereas a more pronounced decrease in strength was observed in glass powder mixtures as air content increased.
These findings imply that concrete performance is influenced by the type of replacement material used. The results show that at moderate substitution levels, fly ash can maintain strength performance within a relatively stable range, despite a possible reduction in early-age strength at higher levels of replacement. In contrast, glass powder may require more careful evaluation, especially at greater replacement levels.
3.2.2. Statistical Evaluation of Compressive Strength
A one-way analysis of variance (ANOVA) was conducted to investigate the effects of replacement type and replacement level on 28-day compressive strength. In this analysis, each mixture was treated as an independent group, namely, Control, FA-10, FA-20, FA-30, GP-10, GP-20, and GP-30. This method was applied such that each mixture was treated as a separate group in the ANOVA test to ensure statistical comparability between groups. The results are presented in Table 6. Five samples were prepared for each group, and 35 experiments were conducted in total. Statistical analysis indicates that the number chosen was sufficient (Table 6).
Table 6.
The results of a one-way ANOVA for compressive strength.
The conducted statistical analysis revealed that the mixture composition has a statistically significant effect on compressive strength (p < 0.001). The high F value (F = 43.95) indicates that differences between the mixture groups account for most of the variation in compressive strength, rather than random experimental variability.
The post hoc power analysis results are presented in Table 7. Statistical analysis further supported the adequacy of the experimental design. The one-way ANOVA confirmed statistically significant differences between the seven concrete mixtures (F(6, 28) = 43.95, p < 0.01), with a very large effect size (η2 = 0.904) and high statistical power (>0.999). Effect sizes were interpreted according to Cohen’s conventions [56]. These results indicate sufficient reliability of the experimental design and confirm that the number of specimens used in the study (n = 5 per group) provided adequate statistical power.
Table 7.
Post hoc statistical power analysis for one-way ANOVA factors.
To ascertain which particular groups exhibited significant differences, Tukey’s Honestly Significant Difference (HSD) test was conducted (α = 0.05). Table 8 only shows statistically significant comparisons for clarity.
Table 8.
Tukey HSD post hoc test.
FA and GP mixtures performed similarly at the 10% replacement level. There was no statistically significant difference between Control and FA-10 or GP-10 (p > 0.05). This suggests that both materials can be used at low replacement levels while maintaining strength. On the other hand, at higher substitution ratios, the performance differences became more visible. Significant reductions in compressive strength were observed for both materials compared with the control mixture, particularly at 20% and 30% replacement levels. The reduction was more pronounced in glass powder mixtures.
The Tukey HSD test results confirmed that both replacement type and replacement level significantly affected the 28-day compressive strength, as the differences between FA and GP mixes became more evident with increasing replacement levels.
Overall, the findings demonstrate that mixture composition strongly affects compressive strength. A gradual, relatively stable decrease in strength was observed in fly ash mixtures with increasing replacement levels. In contrast, the decrease has been more rapid in glass powder mixtures. This may be attributed to differences in pozzolanic activity and particle characteristics of the two materials, as extensively documented in previous research [5,6,19,20,21,22,25,26]. Although no microstructural investigation was presented in this study, similar trends have been linked to differences in hydration mechanism and particle packing in the literature.
3.3. Durability-Related Performance
3.3.1. Schmidt Test
The Schmidt hammer rebound test was conducted to confirm the results of the compressive strength tests. For both replacement materials, a good relationship between rebound number and compressive strength was observed, as shown in Figure 8 and Figure 9. This suggests the reliability of non-destructive measurements in evaluating compressive strength.
Figure 8.
The correlation between rebound number and compressive strength for FA mixtures.
Figure 9.
The correlation between rebound number and compressive strength for GP mixtures.
For FA-replaced mixtures, the relationship was obtained as (fc = 0.65R + 2.6, R2 ≈ 0.97). It is observed that the rebound number and compressive strength decreased gradually with increasing fly ash level. This indicates that the Schmidt test accurately captures the reduction in strength.
For GP-replaced concretes, the relationship was (fc = 0.92R − 6.3, R2 ≈ 0.93). The slope of GP mixtures is higher than that of FA mixtures. This suggests that surface hardness is more sensitive to changes in strength in GP mixtures. Rebound numbers decreased as the replacement ratio increased. This response was consistent with the compressive strength results. These variations in rebound number could be attributed to changes in matrix density and hydration properties resulting from reduced cement content, as evidenced by previous studies. However, no microstructural analysis was conducted in this study, and the inferences drawn are based on previously reported trends.
The higher slope value in the GP mixture indicates a greater influence of strength changes on the rebound value, which may be associated with differences in particle structure and adhesion properties. As reported in the literature, depending on particle size and distribution, glass powder can influence the internal structure of cementitious composites [19,21,28].
To summarize, the Schmidt test can be considered a useful field instrument for tracking changes in strength in mixtures containing recycled materials. However, its results must always be evaluated alongside conventional compressive strength tests.
3.3.2. Water Permeability
One of the most important factors affecting concrete durability is its water permeability. Concrete is naturally a porous material. These pores enable the penetration of water and harmful ions such as chloride and sulfate into the concrete. This may contribute to reinforcement corrosion and reduced service life. Therefore, evaluating the permeability of concrete that contains different replacement materials is extremely important. It should be noted that water permeability was the only durability indicator experimentally evaluated in this study. Other important durability parameters such as chloride penetration resistance, freeze–thaw performance, carbonation resistance, and drying shrinkage, were not directly investigated and require further investigation. Permeability test results presented in Table 9 demonstrated that replacement type and level significantly affect the permeability behavior of concrete. The water penetration depth of the control concrete was measured at 27.6 mm. This value was consistent with the tested concrete mixture. Moreover, the low values of standard deviation (1.66) and COV (6.01%) indicate stable test results.
Table 9.
Water permeability test results.
Figure 10 illustrates the permeability values of the tested mixtures. Fly ash generally reduced the depth of water penetration in the concrete. The lowest permeability value (18.4) was obtained in the FA-20 mixture. This behavior may be explained by improved particle packing and pozzolanic reactivity, which are known to reduce pore connectivity and improve matrix density in fly ash systems [5,6,19,20,21,22].
Figure 10.
The permeability results of all mixtures.
A slight improvement in the FA-30 mixture water penetration depth is noticeable. This behavior is likely associated with dilution effects at higher replacement levels. With greater substitution levels, there is not enough reactive binder. Under such conditions, the diluting effect begins to take effect. As a result, permeability increases. The COV in the FA mixtures ranges between 6 and 7%.
There was a marked increase in water penetration depth with increasing glass powder (GP) content. Although the GP-10 mix had nearly the same value for permeability compared with that of the control concrete mix, the permeability in the GP-20 and GP-30 mixtures was 35.3 and 44.66, respectively. The significant increases in permeability values for GP-20 and GP-30 can be attributed to several factors. First, high water demand caused by an elevated specific surface area has adversely affected workability and dispersibility. Second, the material’s low pozzolanic activity compared with fly ash has led to a less developed pore structure at 28 days. Third, previous studies have suggested that the angular morphology of glass powder particles may contribute to localized stress concentrations and micro-crack formation during mixing and hardening [21,25,39].
These findings indicate that the replacement level must be carefully controlled for glass powder mixtures. Lower substitution ratios may be more suitable for general applications. Higher levels require additional design considerations. COV values in the GP series are in the range of 6.5–10.5%. This demonstrates the statistical reliability of the results.
Overall, the results show that a unit’s durability depends on material type and replacement ratio. This effect is more visible because of the absence of chemical admixtures in the mixtures. Under these simplifications, the inherent behavior of each material becomes more clearly evident.
Figure 11 shows the relationship between the 28-day compressive strength and water permeability of the mixtures studied. In general, it was observed that as compressive strength increases, water penetration depth decreases; in other words, these parameters are inversely proportional. To better understand the trade-off between strength and durability, a Strength–Permeability Performance Index (SPPI) was calculated as the ratio of compressive strength (MPa) to water penetration depth (mm). Table 10 presents the SPPI values for each mixture. A higher SPPI means a better combination of mechanical strength and water penetration resistance. Among all mixtures tested, FA-20 had the highest SPPI (1.39 MPa/mm)—about 42% higher than the control mixture (0.98 MPa/mm). In contrast, GP-30 gave the lowest SPPI (0.49 MPa/mm), reflecting its lower strength and higher permeability. These findings further confirm that FA-20 provided the most balanced performance in terms of both strength and durability within the investigated mixture range.
Figure 11.
Compressive strength vs. water permeability (the symbol size indicates the replacement level).
Table 10.
Strength–Permeability Performance Index.
In the control concrete, the compressive strength was approximately 27 MPa, and the water penetration depth was 27.6 mm. It should be underlined that as the strength of FA replacement mixtures decreases, their permeability increases. In particular, the FA-20 mixture yielded the lowest permeability of 18.4 mm, with a strength of 25.6 MPa. This is consistent with the effects of pozzolanic reactions in fly ash systems, which have been reported to reduce pore connectivity and improve durability over time [5,6,7]. In the FA-30 mixture, a decrease in strength and an increase in permeability (22.1 mm) were observed. This finding showed that the binder effectiveness decreased at high substitution levels.
The relationship between strength and permeability is more pronounced in GP-replacement mixtures. While GP-10 performed close to the control concrete, the decrease in strength and increase in permeability were more evident in GP-20 and GP-30. The GP-30 mixture had the lowest compressive strength (21.9 MPa) and the highest water permeability (44.6 mm). This could be due to the higher replacement level of glass powder. Previous studies have reported that high amounts of glass powder may increase air voids and reduce the homogeneity of the matrix [25,30,57].
Such variations between the FA and GP mixtures may be attributed to their inherent reactivity and particle characteristics. Fly ash exhibits pozzolanic reactions over time, which enhances its long-term durability [5,6,7]. In contrast, the contribution of glass powder may result from its filler effect, along with some minor pozzolanic activity depending on particle size and curing conditions [19,20,21,22,25,26].
The above results show that compressive strength alone cannot be used to measure the performance of the concrete. Factors such as permeability should be considered when predicting future performance.
The permeability results are therefore analyzed together with related findings from the literature to provide a better understanding regarding the durability performance of FA and GP systems.
The lowest water permeability (18.4 mm) was found in the FA-20 mixture. This finding is consistent with the literature, showing that replacements with FA and GP increase durability against moisture penetration and chloride permeability. According to Schwarz and Neithalath [28], GP particles reduce chloride permeability better than FA particles when used in the same amount due to their greater reactivity and improved packing effect. A comprehensive review shows that recycled GP (in particular, 10–20% replacements) improves permeability and ingress properties due to its filling action and pozzolanic reaction, thus decreasing porosity and increasing long-term durability [38]. Recent research further indicates that GP addition improves freeze–thaw resistance, electrical resistivity, and durability performance [58].
As can be seen, these literature findings are generally consistent with the lower water permeability values observed in the present study, especially for the FA-20 mixture, which exhibited the most balanced durability-related performance among the investigated mixtures. While FA-30 could potentially benefit from pozzolanic maturation over prolonged periods, further testing is still required to make a final determination. The suggested durability implications of the present permeability results should be verified through complementary tests such as rapid chloride permeability (RCPT), freeze–thaw resistance, carbonation resistance, and drying shrinkage measurements in the future.
In addition to permeability, shrinkage behavior is another critical parameter influencing cracking potential and long-term durability of concrete. Since drying shrinkage was not experimentally investigated in this study, its potential effects are discussed based on previously reported literature to better contextualize the observed material behavior.
The incorporation of fly ash in concrete has been widely reported to reduce drying shrinkage, particularly at moderate to high replacement levels, which has been associated with its slower pozzolanic reaction, lower heat of hydration, and progressive pore refinement at later ages, as demonstrated in [59,60]. However, the extent of shrinkage reduction depends on factors such as curing conditions and mixture composition.
In contrast, the effect of glass powder on shrinkage is more complex. Chen et al. [61] reported that the incorporation of glass powder (GP) may contribute to reduced drying shrinkage in cementitious composites due to the filler effect of fine particles. In addition, the pozzolanic reaction with calcium hydroxide may promote pore refinement. Similarly, Ayub et al. [62] observed that glass powder can reduce shrinkage at low replacement levels by improving particle packing and overall matrix quality. However, this effect is highly dependent on particle size and may diminish under conditions of increased porosity or higher replacement levels.
Previous studies generally indicate that fly ash incorporation may reduce drying shrinkage under appropriate curing conditions. In contrast, higher glass powder replacement levels may increase susceptibility to shrinkage depending on factors such as porosity development and reduced workability. Further experimental validation is recommended to confirm these trends.
3.4. Environmental Performance
This study also examined the environmental performance of concrete mixtures from a life-cycle approach. This included the manufacturing, transportation, construction, and demolition processes. This approach provides a more realistic representation of environmental impact. In this context, the goal is to evaluate the environmental benefits of partial cement replacement with replacement materials. A controlled methodological approach is used to determine the maximum possible reduction in carbon emissions.
Emission factors were based on widely reported international average datasets. Region-specific industrial data were not considered. International average datasets are commonly used to compare the environmental performance of construction materials. In addition, performance-normalized indicators ensured that environmental improvements do not compromise structural performance. A sensitivity analysis was also conducted to evaluate key parameters and to improve transparency in the environmental assessment framework.
The results showed that increasing cement replacement consistently reduced embodied carbon. The highest reduction was achieved at the 30% replacement level. This reduction is primarily related to the lower cement content in the mixture. Cement production is the main source of carbon emissions in concrete systems. The sensitivity analysis confirmed that changes in emission factors affected absolute values but did not change the ranking of mixtures. This shows that the environmental findings are reliable.
3.4.1. Carbon Emissions
For each mixture, the total embodied carbon (EC) was calculated using the following equation:
where EC represents the total embodied carbon (kg CO2/m3), mi represents the mass of material i (kg/m3), and EFi represents the emission factor of material i (kg CO2/kg). The equation is applied separately for each replacement type, as shown below:
where mcem, mFA, mGP, and magg represent the masses of cement, fly ash, glass powder, and total aggregate, respectively. The emission factors used in the base case are averages from international environmental databases. They are commonly used in assessing concrete materials. The emission factors for cement, fly ash, and aggregate are provided from the Inventory of Carbon and Energy (ICE) database [63]. Specifically, the emission factors for cement, fly ash, and aggregate are 0.93, 0.008, and 0.005 kg CO2/kg, respectively. The emission factor for recycled glass powder (0.10 kg CO2/kg) was determined using the Tier 1 default emission factor method suggested in the IPCC guidelines [64]. This approach agrees with the energy-based estimation principle proposed by Meyer et al. [65]. In this study, recycled glass was regarded as a secondary material. Consequently, the emission factor reflects only the energy related to the collection and grinding processes. This means that emissions from primary production are excluded from the system boundary. This approach is consistent with the recycled-content approach in lifecycle assessment research.
The emission factor used for glass powder (0.10 kg CO2/kg) was based on a Tier 1 estimate reflecting the energy associated with waste glass processing and grinding. This value represents average processing conditions and does not explicitly account for regional variations in electricity generation or grinding equipment efficiency. As reported in previous LCA studies, emission factors for supplementary cementitious materials can vary depending on the regional energy mix and processing technology employed [17,66]. Therefore, the adopted factor should be interpreted as a representative average rather than a site-specific value.
To assess uncertainty in cement production emissions, the cement emission factor was varied by ±10% (0.81–0.99 kg CO2/kg). The sensitivity analysis confirmed that absolute EC values change proportionally with variations in the cement EF. However, the relative ranking of the mixtures remained unchanged. Cement content is therefore validated as the primary parameter governing carbon mitigation within the investigated system boundary.
Although the sensitivity analysis was performed for the cement emission factor, the stability of the mixture rankings under the investigated uncertainty range suggests that reasonable variations in the glass powder emission factor would be unlikely to alter the principal conclusions of this study.
3.4.2. Carbon Reduction Potential
To accurately evaluate the environmental benefit of cement replacement, the percentage reduction in embodied carbon relative to the control mixture was calculated using:
Table 11 presents the embodied carbon and CO2 reduction percentages for all mixtures at the cradle-to-gate boundary. In conclusion, increasing cement substitution in both material types reduced embodied carbon. FA-30 exhibited the greatest reduction (28.9%), followed by GP-30 (26.1%).
Table 11.
Embodied carbon (EC) and CO2 reduction rates of mixtures.
3.4.3. Transportation, Construction, and End-of-Life Parameters
The lifecycle was completed by adding construction and demolition processes to the cradle-to-gate boundary. In this context, the parameters presented in Table 12 were considered for stages other than material production.
Table 12.
Assumed parameters for lifecycle stages.
The values reported in Table 12 were selected based on commonly adopted assumptions and inventory data used in concrete life-cycle assessment studies. A transportation distance of 100 km was considered, which falls within the range typically reported for raw material and concrete delivery scenarios (50–150 km) in previous LCA studies of concrete production [67,68]. The transportation emission factor of 0.10 kg CO2/ton-km is consistent with values reported in the ICE Database [63] and the IPCC Guidelines for heavy-duty road freight transport [64]. Construction energy was assumed as 5 kWh/m3, representing energy consumption associated with concrete placement, vibration, and site operations, and is consistent with the simplified construction-stage assumptions commonly adopted in building and concrete LCA studies [66,68]. An electricity emission factor of 0.50 kg CO2/kWh was adopted as a representative global-average grid emission factor based on values reported by the International Energy Agency [69]. For the end-of-life stage, a demolition energy demand of 20 MJ/ton was adopted as a representative global-average assumption. Published studies indicate that demolition energy requirements may vary considerably depending on demolition technique, equipment efficiency, and waste processing practices, typically ranging from approximately 5 to 50 MJ/ton. Therefore, the selected value should be interpreted as a generic inventory parameter rather than a site-specific estimate. A recycling rate of 70% was adopted in accordance with the recovery targets for construction and demolition waste established by the European Union Waste Framework Directive [70], which is frequently used as a benchmark scenario in life-cycle assessment studies. Since these parameters may vary depending on project location, equipment efficiency, transport logistics, and waste management practices, they should be regarded as generic global-average assumptions rather than site-specific values. To evaluate the robustness of the results, a sensitivity analysis was additionally performed, demonstrating that the relative environmental ranking of the concrete mixtures remained unchanged despite variations in key emission factors. Based on the values shown in Table 12, the additional emissions for each stage, per unit volume of concrete, can be calculated as follows. The contribution of transportation is 23.53 kg CO2/m3 (2.353 ton/m3 × 100 km × 0.10 kg CO2/ton-km). The construction energy contributes 2.50 kg CO2/m3 (5 kWh/m3 × 0.50 kg CO2/kWh). For the demolition energy, the conversion from MJ to kWh was first performed by dividing the value of MJ by the ratio 1 kWh = 3.6 MJ, giving a value of 13.08 kWh/m3 (20 MJ/ton ÷ 3.6 × 2.353 ton/m3), equivalent to a gross emission of 6.54 kg CO2/m3. With the recycling rate of 70%, the contribution of demolition is 1.96 kg CO2/m3. Thus, the sum of stages yields 23.53 + 2.50 + 1.96 = 28.0 kg CO2/m3.
The assumed parameters for transport, construction, and end-of-life stages were selected based on commonly reported values in the concrete LCA literature [66,67]. To assess the sensitivity of the cradle-to-grave results to these assumptions, each parameter was varied independently by ±20% while keeping all other parameters constant. The resulting variation in embodied carbon ranged from ±0.39 to ±4.71 kg CO2/m3 depending on the parameter considered as shown in Table 13. Importantly, these variations were substantially smaller than the differences observed among the investigated mixtures. Moreover, because the additional lifecycle-stage emissions were applied uniformly across all mixtures, the relative ranking of the mixtures remained unchanged throughout the investigated sensitivity ranges, confirming the robustness of the cradle-to-grave conclusions despite the uncertainty associated with the assumed lifecycle parameters.
Table 13.
Sensitivity analysis of lifecycle stage parameters (±20%).
3.4.4. Embodied Carbon Results
Table 14 represents the total values of embodied carbon for all mixtures when the transportation, construction, and disposal emissions (28 kgCO2/m3) were added to the cradle-to-gate embodied carbon. The control mix had the largest total value of embodied carbon (362.47 kg CO2/m3), while the FA-30 mix had the smallest total value (265.66 kg CO2/m3), indicating a decrease of 26.7%. Among glass powder mixtures, GP-30 achieved a 24.0% reduction compared with the control. Transportation, construction, and disposal emissions accounted for approximately 8% of the total embodied carbon across all mixtures.
Table 14.
Embodied carbon and CO2 reduction percentages.
For comparison purposes, the findings of this study were compared with those available in the literature. Flower and Sanjayan [67] reported that the use of fly ash in lieu of cement reduces concrete CO2 emissions by 13–15% when the fly ash proportion is between 15% and 20%. The findings of [71] which reported similar trends in carbon emission reductions for fly ash-blended concrete, are consistent with the present findings. In this study, the mixture containing 20% fly ash (FA-20) achieved a 17.8% reduction in total embodied carbon, which closely matches the upper range of this benchmark. The mixture containing 30% fly ash (FA-30) achieved a 26.7% reduction, exceeding typical literature values due to the higher replacement level. The FA-10 mixture showed an 8.9% reduction, consistent with its lower replacement ratio. These results confirm that increasing fly ash content is an effective strategy for reducing the embodied carbon of concrete.
3.4.5. Carbon–Strength Efficiency Assessment
Although embodied carbon per cubic meter provides a direct environmental indicator, concrete is fundamentally a structural material. Therefore, environmental efficiency must be evaluated relative to mechanical performance. The functional unit in this analysis is 1 m3 of concrete with 28-day compressive strength. Carbon intensity (kg CO2/m3/Pa) is calculated by dividing embodied carbon (kg CO2/m3) by compressive strength (MPa).
The carbon intensity (CI) is obtained using the following formula:
where
CI—carbon intensity (kg CO2/m3/MPa);
EC—embodied carbon (kg CO2/m3);
fc—28-day compressive strength (MPa).
Carbon intensity (CI) is defined as the ratio of embodied carbon (kg CO2/m3) to the 28-day compressive strength (MPa). It is an efficiency-normalized measure that enables a fair comparison of environmental performance across different concrete mix designs. Habert et al. [72] demonstrated that normalizing environmental impacts by compressive strength (kg CO2/m3/MPa) is essential for the evaluation of concretes with varying strength classes. High-strength concretes may have higher absolute emissions, but their environmental impact per unit of mechanical performance is generally lower. This value normalizes the environmental impact according to mechanical capacity per unit volume. It is compatible with studies used in the field of sustainability. While other definitions exist, such as normalizing the value against strength and volume (e.g., EC/(fc × volume)), the current one was chosen because all samples used in this study had the same geometric configuration and loading conditions, allowing comparison only of their mechanical capabilities.
Lower CI values indicate greater environmental efficiency per unit structural capacity. Table 15 presents the performance-based carbon intensity results for all mixtures at the cradle-to-gate + construction + demolition stage. The control mixture exhibited the highest CI (13.42 kg CO2/MPa), while FA-30 achieved the lowest value (10.84 kg CO2/MPa).
Table 15.
Carbon intensity values normalized by compressive strength.
To provide an additional perspective on the CI values presented in Table 15, the classification system proposed by Damineli et al. [73] and subsequently used by Etxeberria [74] was adopted. According to this reference framework, based on international literature data, the average CI for ordinary concrete is approximately 7.1 kg CO2/m3/MPa, while CI values exceeding 13 kg CO2/m3/MPa indicate concretes without alternative binders and with high binder intensity. The minimum achievable CI is estimated to be between 1.5 and 2.0 kg CO2/m3/MPa.
In this respect, the control mixture (13.42 kg CO2/m3/MPa) falls into the >13 kg CO2/m3/MPa category due to its 100% Portland cement content. All fly ash mixtures lie below this threshold: FA-10 (12.32 kg CO2/m3/MPa), FA-20 (11.64 kg CO2/m3/MPa), and FA-30 (10.84 kg CO2/m3/MPa); the latter exhibits a 19.2% reduction compared with the control. In contrast, the glass powder mixtures (12.57–13.01 kg CO2/m3/MPa) have CI values at or above this threshold, which can be explained by the strength loss observed in this series. It should be noted that the CI values presented herein are higher than the average CI of 7.1 kg CO2/m3/MPa reported in the literature [73]. However, this is attributable to the moderate compressive strength range of the samples (21.9–27.0 MPa) and the relatively high water-to-cement ratio employed.
Environmental and structural performance should be interpreted together with mechanical performance. Concrete is often subjected to external loads; therefore, environmental indicators must be analyzed alongside strength. In this regard, carbon intensity helped to establish the connection between environmental efficiency and mechanical capacity. Lower carbon intensity shows better environmental efficiency per unit of strength.
The carbon intensity of concrete reduced with increasing replacement proportion in the fly ash group. FA-30 produced the best results among the mixtures regarding carbon intensity, demonstrating the environmental efficiency of a high proportion of replacement material.
On the other hand, the GP series had a very narrow range of carbon intensity values, at 12.73, 13.01, and 12.57 kg CO2/m3/MPa for GP-10, GP-20, and GP-30, respectively. Consequently, there was a seemingly steady trend in the GP series relative to the FA series. This could be attributed to two opposing effects. As the glass powder ratio increased, the embodied carbon and compressive strength decreased. The environmental gain from lower cement content was offset by strength loss. As a result, carbon intensity values remained relatively consistent across the GP series. In particular, GP-30 achieved the lowest embodied carbon level. However, its carbon intensity did not become too low due to strength loss.
However, the selection of an optimal mixture should not be based solely on environmental efficiency. The stability of mechanical performance should also be considered. Thus, the mixture with lower emissions is not necessarily characterized by high structural reliability. Intermediate levels of replacement might be appropriate.
3.4.6. Interpretation of Lifecycle Results
As depicted in Table 14 and Table 15, the control mixture exhibited the highest carbon intensity among all analyzed mixtures across all scenarios. Among the fly ash mixtures, carbon intensity decreased consistently with increasing replacement ratio. Thus, FA-30 achieved the lowest carbon intensity, corresponding to a 19.2% improvement compared with the control mixture.
In the glass powder mixtures, embodied carbon also decreased with increasing cement replacement. However, the reduction in compressive strength limited the carbon efficiency of these mixtures. This pattern persisted even under the sensitivity scenarios, indicating that strength loss is the primary factor constraining environmental efficiency in the glass powder series.
Considering absolute emission reduction, carbon efficiency, and overall lifecycle environmental impact, FA-30 clearly emerges as the most environmentally optimal mixture within the defined system boundary.
However, in actual applications, structural safety requirements or strength design considerations determine the type of material used in mixtures. In such cases, FA-20 may serve as a technically balanced option. Even though FA-20 fails to maximize carbon reduction, it maintains a conservative strength behavior while still ensuring significant environmental benefits.
In summary, the environmental benefits of increasing fly ash content were consistently reflected in the carbon intensity and embodied carbon analyses. The cement substitution ratio remains the main factor in reducing carbon emissions, with fly ash showing better performance than glass powder.
3.4.7. Carbon Reduction Efficiency Index and Carbon–Performance Quadrant Analysis
Carbon intensity normalizes embodied carbon with respect to compressive strength; however, it does not directly represent the relationship between carbon reduction and the associated reduction in mechanical performance. To further evaluate this relationship, the Carbon Reduction Efficiency (CRE) index was introduced as a complementary indicator:
where ΔEC and Δfc represent the reductions in embodied carbon (kg CO2/m3) and compressive strength (MPa), respectively, relative to the control mixture. Thus, higher CRE values indicate a better balance between environmental benefit and strength reduction. However, the metric should be considered cautiously when the strength loss approaches zero.
CRE = ΔEC/Δfc = (ECcontrol − ECmix)/(fc,control − fc,mix)
The CRE values are presented in Table 16 and Figure 12. In general, FA mixtures exhibited higher CRE values than GP mixtures. In particular, FA-20 achieved a CRE of 46.1 kg CO2/MPa, with a relatively limited strength loss of only 5.2%. In contrast, GP-20 yielded 16.1 kg CO2/MPa, with a strength loss of 13.3%, indicating a more efficient carbon–strength relationship for the FA mixture under comparable replacement levels. FA-10 exhibited a remarkably high apparent CRE (161.4 kg CO2/MPa); however, this value should be considered cautiously, because it results from a very small strength reduction (0.2 MPa). More broadly, the CRE index should be interpreted with caution when the difference in compressive strength between a mixture and the control is minimal, as small absolute strength differences may lead to amplified changes in the calculated index value. Therefore, the CRE index should not be considered in isolation but rather alongside complementary indicators, including carbon intensity and the Carbon–Performance Quadrant. The combined use of these metrics provides a more comprehensive evaluation of the sustainability–performance relationship and helps reduce the risk of over interpreting marginal differences between mixtures.
Table 16.
The Carbon Reduction Efficiency (CRE) index and associated performance metrics of all mixtures.
Figure 12.
The Carbon Reduction Efficiency (CRE) index for FA (blue bars) and GP (pink bars) concrete mixtures.
To further analyze the relationship between environmental sustainability and mechanical performance, a Carbon–Performance Quadrant Analysis is presented in Figure 13. In the graph, the x-axis represents the 28-day compressive strength, and the y-axis represents the total embodied carbon. The quadrant boundaries were defined using the control mixture as the reference condition (27.0 MPa and 362.47 kg CO2/m3). The quadrant approach is designed primarily as a comparative visualization tool within the investigated dataset rather than an absolute classification system.
Figure 13.
Carbon–Performance Quadrant Analysis of FA and GP concrete mixtures.
The four zones are defined as follows: Zone I (most favorable) represents high compressive strength (≥control) and low embodied carbon (<control), corresponding to the most desirable sustainability–performance balance. Zone II is characterized by reduced embodied carbon accompanied by lower compressive strength. Zone III (least favorable) corresponds to lower compressive strength (<control) and higher embodied carbon (≥control). Zone IV represents higher compressive strength (≥control) and higher embodied carbon (≥control), indicating structurally adequate but environmentally intensive mixtures.
Figure 13 shows that all replacement mixtures fall within Zone II. Within this region, FA-20 and FA-30 are positioned closest to the Zone I boundary, achieving the largest embodied carbon reductions (17.8% and 26.7%, respectively) while maintaining comparatively moderate strength losses (5.2% and 9.3%, respectively). By comparison, GP-20 and GP-30 exhibited greater reductions in strength for comparable levels of embodied carbon. No mixture reached Zone I, consistent with the partial cement replacement strategy and the experimental conditions adopted in this study. However, FA-20 and FA-30 approached the most favorable sustainability region more closely than the GP mixtures, indicating a more efficient combination of carbon reduction and mechanical performance. In particular, FA-20 achieved a reduction of 64.5 kg CO2/m3 relative to the control mixture while maintaining acceptable engineering performance. These results indicate potential environmental benefits if applied to commonly used low-to-medium-strength concrete systems.
Furthermore, the Carbon–Performance Quadrant and CRE analyses identify FA-20 as the most balanced replacement level among the mixtures investigated, providing a 17.8% reduction in embodied carbon while limiting the compressive strength loss to only 5.2%. This combination may be particularly attractive for low-to-medium-strength concrete applications such as pavements, mass concrete, and leveling layers. For the GP series, replacement levels above 10% were associated with progressively greater strength reductions relative to the environmental benefits obtained, suggesting a narrower performance window for practical implementation.
3.5. Limitations
Despite the detailed experimental and environmental analyses conducted in this study, there were some limitations to consider. The mechanical and durability properties of the specimens were analyzed at only one curing age (28 days), and this may not fully capture the material’s long-term performance. Additional tests at later curing ages (e.g., 56 and 90 days) may provide better insight into long-term strength development, especially for FA mixtures. A relatively high w/c ratio (0.60) and the lack of chemical additives were purposely selected to ensure the simplicity of the mixture design. However, variations in the mixture design can affect the results obtained. In addition, only three replacement levels (10%, 20%, and 30%) were analyzed to enable a controlled comparison between FA and GP systems under identical conditions. Additional intermediate replacement levels may provide a more detailed analysis of optimal replacement ratios. The emission factor used in the environmental impact calculation was based on international averages. No region-specific industrial data was employed. This was an intentional choice. However, due to the lack of local data, this might affect the accuracy of embodied carbon. In addition, generic lifecycle inventory parameters were adopted for the transportation, construction, and end-of-life stages. Therefore, regional variations in electricity generation, transport logistics, demolition practices, and recycling infrastructure were not explicitly considered, which may affect the accuracy of the absolute embodied carbon values. Nevertheless, the sensitivity analysis confirmed that these uncertainties do not alter the relative ranking of the mixtures. Furthermore, the environmental assessment focused exclusively on CO2 emissions and did not consider other impact categories, such as water consumption, acidification, eutrophication, and resource depletion. Therefore, the results should be interpreted as a comparative carbon-footprint assessment rather than a complete environmental life-cycle assessment. Finally, conclusions regarding mixture properties were based on macroscopic tests since micromechanics tests were not performed. Therefore, the results are specific to the tested mix design (w/c = 0.60, no admixtures) and should not be generalized to other concrete systems without further validation.
4. Conclusions
In this research, FA and GP were considered as partial replacements for cement at replacement rates of 10%, 20%, and 30%. The concrete mixtures were manufactured without chemical admixtures and with a relatively high w/c ratio (0.60). It was observed that the effect of partial cement replacement on concrete behavior depends on several factors, including the physical properties of the replacement material.
First, the workability of concrete was positively affected by using FA. The slump value increased, whereas the Vebe time decreased with increasing FA replacement. The spherical shape of FA particles reduced internal friction within the fresh concrete mixture. In contrast, workability decreased with increasing glass powder replacement.
Similar reductions in 28-day compressive strength were observed in concretes prepared with either FA or GP. However, the strength reduction in FA mixtures was more gradual than in GP mixtures, where more pronounced decreases were observed at 20% and especially 30% substitution ratios. At the 10% replacement level, the compressive strengths of FA and GP concretes remained comparable with those of the control mixture.
Regarding durability, FA replacement improved concrete impermeability up to an optimal replacement level of 20%. The FA-20 mixture exhibited the lowest water permeability value. In contrast, high replacement levels of glass powder increased concrete permeability.
From an environmental perspective, the use of fly ash and glass powder as partial cement replacements reduced the embodied carbon of the concrete mixtures.
Considering the cradle-to-gate, construction, and demolition phases, the control mixture exhibited the highest embodied carbon value of 362.47 kg CO2/m3. The mixtures containing 30% FA and 30% GP showed the lowest embodied carbon values, namely, 265.66 and 275.32 kg CO2/m3, respectively.
While the embodied carbon per unit volume decreased with the incorporation of FA and GP, environmental efficiency was more effectively evaluated using carbon intensity (CI), which relates embodied carbon to compressive strength. The CI results indicated that increasing FA replacement led to lower carbon intensity values. Accordingly, the FA-30 mixture exhibited the lowest CI value of 10.84 kg CO2/m3/MPa, corresponding to a 19.2% reduction compared with the control mixture (13.42 kg CO2/m3/MPa).
In contrast, the carbon intensity values of GP mixtures remained relatively stable, ranging from 12.57 to 13.01 kg CO2/m3/MPa. This behavior can be attributed to the simultaneous reduction in the embodied carbon and compressive strength with increasing glass powder content. The CRE analysis indicated that FA mixtures demonstrated a more efficient carbon–strength relationship than GP mixtures (e.g., FA-20: 46.1 vs. GP-20: 16.1 kg CO2/MPa). The quadrant analysis revealed that all mixtures fell within Zone II, with FA-20 and FA-30 closest to the Zone I boundary, indicating a comparatively balanced sustainability–performance behavior with substantial carbon reduction and relatively moderate strength loss. In contrast, GP mixtures exhibited greater mechanical penalties for comparable carbon reductions.
However, the present conclusions are based on 28-day performance results. Therefore, further studies are required to evaluate the long-term mechanical and environmental performance of these byproducts.
The findings of this study generally support the three hypotheses formulated at the outset. FA replacement at 20–30% led to a clear reduction in embodied carbon (19.3% for FA-20 and 28.9% for FA-30) while maintaining compressive strength within an acceptable range at 28 days. This confirms that moderate FA replacement can provide a favorable balance between environmental benefit and mechanical performance. Although GP replacement also reduced embodied carbon, its impact on compressive strength was more significant, particularly at higher replacement levels, indicating a less favorable overall performance compared to FA. In addition, carbon intensity results confirmed a consistent improvement with increasing FA content, whereas GP mixtures did not exhibit a comparable improvement due to simultaneous strength reductions.
From a practical perspective, a 20% FA replacement level appears to be the most balanced option for low-to-medium-strength concrete applications such as pavements, mass concrete, and leveling layers. At this level, mechanical and durability performance remain stable while environmental benefits are clearly achieved, particularly in terms of reduced permeability and lower carbon emissions. A 30% FA replacement may still be considered for applications prioritizing environmental performance, provided that long-term strength development is properly accounted for due to the slower pozzolanic reaction of fly ash. For glass powder, replacement levels around 10% are more appropriate when both mechanical and durability requirements must be satisfied, as higher ratios negatively affect performance under the studied conditions.
Overall, the use of industrial byproducts as partial cement replacements significantly influenced the mechanical, durability-related, and environmental performance of concrete and provided a practical framework for reducing embodied carbon in concrete production.
Author Contributions
Conceptualization, E.D. and G.K.; methodology, E.D., G.A. and G.K.; validation, E.D. and M.K.; formal analysis, E.D.; investigation, E.D., G.A., M.K. and G.K.; resources, G.A., M.K. and G.K.; data curation, G.A. and G.K.; writing—original draft preparation, E.D. and G.K.; writing—review and editing, E.D., G.A. and G.K.; visualization, E.D., G.A. and M.K.; supervision, E.D. All authors have read and agreed to the published version of the manuscript.
Funding
This research was funded by the Kyrgyz Turkish Manas University Department of Scientific Research Council, grant number KTMU-BAP-2024.FB.27.
Institutional Review Board Statement
Not applicable.
Informed Consent Statement
Not applicable.
Data Availability Statement
The data presented in this study are available on request from the corresponding author due to privacy restrictions.
Acknowledgments
The authors thank Medcem Global for providing the fly ash used in this study free of charge. The authors have reviewed and edited the output and take full responsibility for the content of this publication.
Conflicts of Interest
The authors declare no conflicts of interest.
References
- United Nations Environment Programme (UNEP). Building Materials and the Climate: Constructing a New Future. Nairobi, 2023. Available online: https://wedocs.unep.org/20.500.11822/43293 (accessed on 23 June 2026).
- Gillis, N.; Ramsköld, A. How to Decarbonize Concrete and Build a Better Future. World Economic Forum 2023. Available online: https://www.weforum.org/stories/2023/02/decarbonize-concrete-build-better-future-energy/ (accessed on 23 June 2026).
- Strunge, T.; Küng, L.; Sunny, N.; Shah, N.; Renforth, P.; Van der Spek, M. Finding least-cost net-zero CO2 strategies for the European cement industry using geospatial techno-economic modelling. RSC Sustain. 2024, 10, 3054–3076. [Google Scholar] [CrossRef] [Scilit]
- Dunster, A.; Marriott, E. Lower carbon dioxide cements and concretes: Bringing new materials into UK industrial use. Proc. Inst. Civ. Eng.-Struct. Build. 2023, 176, 972–985. [Google Scholar] [CrossRef] [Scilit]
- Nayak, D.K.; Abhilash, P.P.; Singh, R.; Kumar, R.; Kumar, V. Fly ash for sustainable construction: A review of fly ash concrete and its beneficial use case studies. Clean. Mater. 2022, 6, 100143. [Google Scholar] [CrossRef] [Scilit]
- Fraay, A.L.A.; Bijen, J.M.; de Haan, Y.M. The reaction of fly ash in concrete a critical examination. Cem. Concr. Res. 1989, 19, 235–246. [Google Scholar] [CrossRef] [Scilit]
- Yu, Z.; Ni, C.; Tang, M.; Shen, X. Relationship between water permeability and pore structure of Portland cement paste blended with fly ash. Constr. Build. Mater. 2018, 175, 458–466. [Google Scholar] [CrossRef] [Scilit]
- Marceau, M.L.; Gajda, J.; VanGeem, M.G. Use of Fly Ash in Concrete: Normal and High-Volume Ranges; PCA R&D Serial No. 2604; Portland Cement Association: Skokie, IL, USA, 2002. [Google Scholar]
- da Silva, S.R.; Andrade, J.J.D.O. A Review on the Effect of Mechanical Properties and Durability of Concrete with Construction and Demolition Waste (CDW) and Fly Ash in the Production of New Cement Concrete. Sustainability 2022, 14, 6740. [Google Scholar] [CrossRef] [Scilit]
- Yazıcı, H.; Arel, H.S. Effects of fly ash fineness on the mechanical properties of concrete. Sadhana 2012, 37, 389–403. [Google Scholar] [CrossRef] [Scilit]
- Zabihi-Samani, M.; Mokhtari, S.P.; Raji, F. Effects of fly ash on mechanical properties of concrete. J. Appl. Eng. Sci. 2018, 12, 35–40. [Google Scholar] [CrossRef] [Scilit]
- Mohajerani, A.; Vajna, J.; Cheung, T.H.H.; Kurmus, H.; Arulrajah, A.; Horpibulsuk, S. Practical recycling applications of crushed waste glass in construction materials: A review. Constr. Build. Mater. 2017, 156, 443–467. [Google Scholar] [CrossRef] [Scilit]
- Jiang, Y.; Ling, T.C.; Mo, K.H.; Shi, C. A critical review of waste glass powder—Multiple roles of utilization in cement-based materials and construction products. J. Environ. Manag. 2019, 242, 440–449. [Google Scholar] [CrossRef] [Scilit] [PubMed]
- Dong, W.; Li, W.; Tao, Z. A comprehensive review on performance of cementitious and geopolymer concretes with recycled waste glass as powder, sand or cullet. Resour. Conserv. Recycl. 2021, 172, 105664. [Google Scholar] [CrossRef] [Scilit]
- Kumari, S.; Agarwal, S.; Khan, S. Micro/nano glass pollution as an emerging pollutant in near future. J. Hazard. Mater. Adv. 2022, 6, 100063. [Google Scholar] [CrossRef] [Scilit]
- Barret, J.; Cooper, T.; Hammond, G.P.; Pidgeon, N. Industrial energy, materials and products: UK decarbonisation challenges and opportunities. Appl. Therm. Eng. 2018, 136, 643–656. [Google Scholar] [CrossRef] [Scilit]
- Del Rio, D.D.F.; Sovacool, B.K.; Foley, A.M.; Griffiths, S.; Bazilian, M.; Kim, J.; Rooney, D. Decarbonizing the glass industry: A critical and systematic review of developments, sociotechnical systems and policy options. Renew. Sustain. Energy Rev. 2021, 155, 111885. [Google Scholar] [CrossRef] [Scilit]
- Amin, M.; Agwa, I.S.; Mashaan, N.; Mahmood, S.; Abd-Elrahman, M.H. Investigation of the physical mechanical properties and durability of sustainable ultra-high performance concrete with recycled waste glass. Sustainability 2023, 15, 3085. [Google Scholar] [CrossRef] [Scilit]
- Kamali, M.; Ghahremaninezhad, A. Effect of glass powders on the mechanical and durability properties of cementitious materials. Constr. Build. Mater. 2015, 98, 407–416. [Google Scholar] [CrossRef] [Scilit]
- Aliabdo, A.A.; Abd Elmoaty, A.E.M.; Aboshama, A.Y. Utilization of waste glass powder in the production of cement and concrete. Constr. Build. Mater. 2016, 124, 866–877. [Google Scholar] [CrossRef] [Scilit]
- Mirzahosseini, M.; Riding, K.A. Influence of different particle sizes on reactivity of finely ground glass as supplementary cementitious material (SCM). Cem. Concr. Compos. 2015, 56, 95–105. [Google Scholar] [CrossRef] [Scilit]
- Xu, J.; Zhan, P.; Zhou, W.; Zuo, J.; Shah, S.P.; He, Z. Design and assessment of eco-friendly ultra-high performance concrete with steel slag powder and recycled glass powder. Powder Technol. 2023, 419, 118356. [Google Scholar] [CrossRef] [Scilit]
- Kim, J.; Yi, C.; Zi, G. Waste glass sludge as a partial cement replacement in mortar. Constr. Build. Mater. 2015, 75, 242–246. [Google Scholar] [CrossRef] [Scilit]
- Islam, G.S.; Rahman, M.; Kazi, N. Waste glass powder as partial replacement of cement for sustainable concrete practice. Int. J. Sustain. Built Environ. 2017, 6, 37–44. [Google Scholar] [CrossRef] [Scilit]
- Du, H.; Tan, K.H. Properties of high volume glass powder concrete. Cem. Concr. Compos. 2017, 75, 22–29. [Google Scholar] [CrossRef] [Scilit]
- Vijayakumar, G.; Vishaliny, H.; Govindarajulu, D. Studies on glass powder as partial replacement of cement in concrete production. Int. J. Emerg. Technol. Adv. Eng. 2013, 3, 153–157. [Google Scholar]
- Celik, A.I.; Tunc, U.; Bahrami, A.; Karalar, M.; Othuman Mydin, M.A.; Alomayri, T.; Ozkılıç, Y.O. Use of waste glass powder toward more sustainable geopolymer concrete. J. Mater. Res. Technol. 2023, 24, 8533–8546. [Google Scholar] [CrossRef] [Scilit]
- Schwarz, N.; Neithalath, N. Influence of a fine glass powder on cement hydration: Comparison to fly ash and modeling the degree of hydration. Cem. Concr. Res. 2008, 38, 429–436. [Google Scholar] [CrossRef] [Scilit]
- Schwarz, N.; Cam, H.; Neithalath, N. Influence of a fine glass powder on the durability characteristics of concrete and its comparison to fly ash. Cem. Concr. Compos. 2008, 30, 486–496. [Google Scholar] [CrossRef] [Scilit]
- Wattanapornprom, R.; Stitmannaithum, B. Comparison of properties of fresh and hardened concrete containing finely ground glass powder, fly ash, or silica fume. Eng. J. 2015, 19, 35–47. [Google Scholar] [CrossRef] [Scilit]
- Zhu, J.; Meng, X.; Wang, B.; Tong, Q. Experimental Study on Long-Term Mechanical Properties and Durability of Waste Glass Added to OPC Concrete. Materials 2023, 16, 5921. [Google Scholar] [CrossRef] [Scilit] [PubMed]
- Moreira, O.; Camões, A.; Malheiro, R.; Ribeiro, M. High-volume glass powder concrete as an alternative to high-volume fly ash concrete. Sustainability 2025, 17, 4142. [Google Scholar] [CrossRef] [Scilit]
- Su, Q.; Liang, X.; Xu, J. Multi-scale regulation of mechanical properties and micro-damage evolution in green concrete activated by glass powder-fly ash composite system. Constr. Build. Mater. 2025, 492, 143051. [Google Scholar] [CrossRef] [Scilit]
- Yusuf, M.O.; Al-Sodani, K.A.A.; Adewumi, A.A.; Abdulkareem, M.; Alateah, A.H. Strength and microstructural characteristics of fly ash-waste glass powder ternary blended concrete. Materials 2025, 18, 4483. [Google Scholar] [CrossRef] [Scilit] [PubMed]
- Rashidian-Dezfouli, H.; Rangaraju, P.R. Comparison of strength and durability characteristics of a geopolymer produced from fly ash, ground glass fiber and glass powder. Mater. Constr. 2017, 67, e136. [Google Scholar] [CrossRef] [Scilit]
- Sironiya, S.; Jamle, S.; Verma, M.P. Experimental investigation on fly ash & glass powder as partial replacement of cement for M-25 grade concrete. Int. J. Sci. Adv. Res. Technol. 2017, 3, 322–324. [Google Scholar]
- Ibrahim, K.I.M. Recycled waste glass powder as a partial replacement of cement in concrete containing silica fume and fly ash. Case Stud. Constr. Mater. 2021, 15, e00630. [Google Scholar] [CrossRef] [Scilit]
- Siad, H.; Lachemi, M.; Sahmaran, M.; Mesbah, H.A.; Hossain, K.M.A. Use of recycled glass powder to improve the performance properties of high volume fly ash-engineered cementitious composites. Constr. Build. Mater. 2018, 163, 53–62. [Google Scholar] [CrossRef] [Scilit]
- Singh, R.P.; Mohanty, B. Effect of waste glass powder on the durability and microstructural properties of fly ash-GGBS based alkali activated concrete containing 100% recycled concrete aggregate. Constr. Build. Mater. 2024, 7, 138024. [Google Scholar] [CrossRef] [Scilit]
- Baikerikar, A.; Mudalgi, S.; Ram, V.V. Utilization of waste glass powder and waste glass sand in the production of eco-friendly concrete. Constr. Build. Mater. 2023, 377, 131078. [Google Scholar] [CrossRef] [Scilit]
- EN 450-1; Fly Ash for Concrete—Definition, Specifications and Conformity Criteria. European Committee for Standardization: Brussels, Belgium, 2012.
- EN 451-2; Method of Testing Fly Ash—Part 2: Determination of Fineness by Wet Sieving. European Committee for Standardization: Brussels, Belgium, 2017.
- TS EN 12390-2; Testing Hardened Concrete—Part 2: Making and Curing Specimens for Strength Tests. Turkish Standards Institution: Ankara, Turkey, 2019.
- TS EN 12350-2; Testing Fresh Concrete—Part 2: Slump Test. Turkish Standards Institution: Ankara, Turkey, 2019.
- EN 12350-7; Testing Fresh Concrete—Part 7: Air Content—Pressure Methods. European Committee for Standardization: Brussels, Belgium, 2019.
- ASTM C231/C231M-17a; Standard Test Method for Air Content of Freshly Mixed Concrete by the Pressure Method. ASTM International: West Conshohocken, PA, USA, 2017.
- DIN 1048; Testing Concrete—Testing of Hardened Concrete (Specimens Prepared in Mould). Deutsches Institut für Normung: Berlin, Germany, 1991.
- TS EN 12350-3; Testing Fresh Concrete—Part 3: Vebe Test. Turkish Standards Institution: Ankara, Turkey, 2019.
- TS EN 12390-3; Testing Hardened Concrete—Part 3: Compressive Strength of Test Specimens. Turkish Standards Institution: Ankara, Turkey, 2019.
- EN 12390-4; Testing Hardened Concrete—Part 4: Compressive Strength—Specification for Testing Machines. European Committee for Standardization: Brussels, Belgium, 2019.
- ASTM C39/C39M-20; Standard Test Method for Compressive Strength of Cylindrical Concrete Specimens. ASTM International: West Conshohocken, PA, USA, 2020.
- TS EN 12504-2; Testing Concrete in Structures—Part 2: Non-Destructive Testing—Determination of Rebound Number. Turkish Standards Institution: Ankara, Turkey, 2021.
- TS EN 12390-8; Testing Hardened Concrete—Part 8: Depth of Penetration of Water Under Pressure. Turkish Standards Institution: Ankara, Turkey, 2019.
- Ramezanianpour, A.A.; Malhotra, V.M. Effect of curing on the compressive strength, resistance to chloride-ion penetration and porosity of concretes incorporating slag, fly ash or silica fume. Cem. Concr. Compos. 1995, 17, 125–133. [Google Scholar] [CrossRef] [Scilit]
- Sun, J.; Shen, X.; Tan, G.; Tanner, J.E. Compressive strength and hydration characteristics of high-volume fly ash concrete prepared from fly ash. J. Therm. Anal. Calorim. 2019, 136, 1563–1575. [Google Scholar] [CrossRef] [Scilit]
- Cohen, J. Statistical Power Analysis for the Behavioral Sciences, 2nd ed.; Lawrence Erlbaum Associates: Hillsdale, NJ, USA, 1988. [Google Scholar]
- Mansour, M.A.; Ismail, M.H.B.; Imran Latif, Q.B.A.; Alshalif, A.F.; Milad, A.; Bargi, W.A.A. A systematic review of the concrete durability incorporating recycled glass. Sustainability 2023, 15, 3568. [Google Scholar] [CrossRef] [Scilit]
- Aziminezhad, M.; Bediwy, A.; Mohamedelhassan, E. Durability performance of low-carbon concrete incorporating optimized ratio of multiple waste materials (glass powder, biomass fly ash, and shredded rubber). Results Eng. 2025, 27, 106392. [Google Scholar] [CrossRef] [Scilit]
- Wang, L.; Yu, Z.; Liu, B.; Zhao, F.; Tang, S.; Jin, M. Effects of fly ash dosage on shrinkage, crack resistance and fractal characteristics of face slab concrete. Fractal Fract. 2022, 6, 335. [Google Scholar] [CrossRef] [Scilit]
- Zhang, Y.; Liu, X.; Xiao, Z.; Yuan, W.; Xu, Y.; Yao, Z.; Liu, Z.; Si, R. Early-age cracking of fly ash and GGBFS concrete due to shrinkage, creep, and thermal effects: A review. Materials 2024, 17, 2288. [Google Scholar] [CrossRef] [Scilit] [PubMed]
- Chen, X.; Chen, H.; Tan, W. Effect of glass powder on the mechanical and drying shrinkage of glass-fiber-reinforced cementitious composites. Case Stud. Constr. Mater. 2022, 17, e01587. [Google Scholar] [CrossRef] [Scilit]
- Ayub, T.; Jamil, T.; Ayub, A.; Khan, A.U.R.; Mehmood, E.; Sheikh, M.D. Effect of glass powder on the compressive strength and drying shrinkage behavior of OPC- and LC3-50-based cementitious composites of various strengths. Adv. Mater. Sci. Eng. 2024, 2024, 8860083. [Google Scholar] [CrossRef] [Scilit]
- Hammond, G.; Jones, C. The Inventory of Carbon and Energy (ICE); University of Bath: Bath, UK, 2011. [Google Scholar]
- Intergovernmental Panel on Climate Change (IPCC). 2006 IPCC Guidelines for National Greenhouse Gas Inventories; Institute for Global Environmental Strategies (IGES): Hayama, Japan, 2006. [Google Scholar]
- Meyer, C.; Egosi, N.; Andela, C. Concrete with waste glass as aggregate. In Recycling and Reuse of Glass Cullet; Thomas Telford Publishing: London, UK, 2001; pp. 179–188. [Google Scholar] [CrossRef] [Scilit]
- Petek Gursel, A.; Masanet, E.; Horvath, A.; Stadel, A. Life-cycle inventory analysis of concrete production: A critical review. Cem. Concr. Compos. 2014, 51, 38–48. [Google Scholar] [CrossRef] [Scilit]
- Flower, D.J.M.; Sanjayan, J.G. Green house gas emissions due to concrete manufacture. Int. J. Life Cycle Assess. 2007, 12, 282–288. [Google Scholar] [CrossRef]
- Marceau, M.L.; Nisbet, M.A.; VanGeem, M.G. Life Cycle Inventory of Portland Cement Concrete; PCA R&D Serial No. SN3011; Portland Cement Association: Skokie, IL, USA, 2007. [Google Scholar]
- International Energy Agency. Emissions Factors 2023; IEA: Paris, France, 2023; Available online: https://www.iea.org/data-and-statistics/data-product/emissions-factors-2023 (accessed on 1 June 2024).
- European Parliament; Council of the European Union. Directive 2008/98/EC on Waste. Off. J. Eur. Union 2008, L 312, 3–30. [Google Scholar]
- Thorne, J.; Bompa, D.V.; Funari, M.F.; Garcia-Troncoso, N. Environmental impact evaluation of low-carbon concrete incorporating fly ash and limestone. Clean. Mater. 2024, 12, 100242. [Google Scholar] [CrossRef] [Scilit]
- Habert, G.; Arribe, D.; Dehove, T.; Espinasse, L.; Le Roy, R. Reducing environmental impact by increasing the strength of concrete: Quantification of the improvement to concrete bridges. J. Clean. Prod. 2012, 35, 250–262. [Google Scholar] [CrossRef] [Scilit]
- Damineli, B.L.; Kemeid, F.M.; Aguiar, P.S.; John, V.M. Measuring the eco-efficiency of cement use. Cem. Concr. Compos. 2010, 32, 555–562. [Google Scholar] [CrossRef] [Scilit]
- Etxeberria, M. Evaluation of eco-efficient concretes produced with fly ash and uncarbonated recycled aggregates. Materials 2021, 14, 7499. [Google Scholar] [CrossRef] [Scilit] [PubMed]
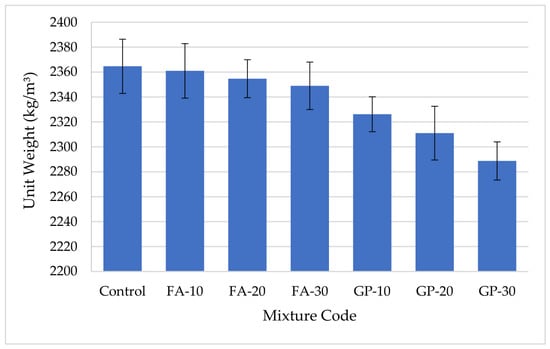
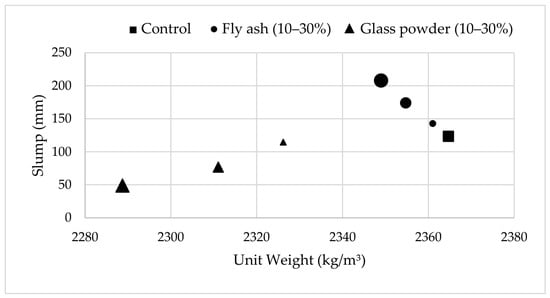
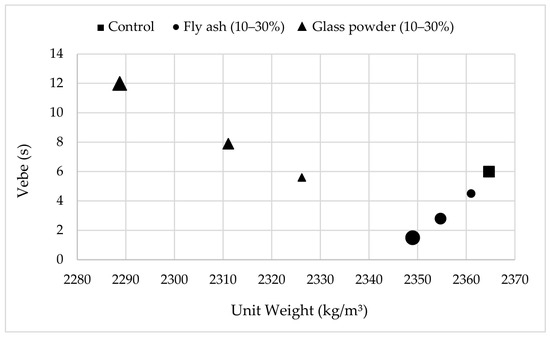
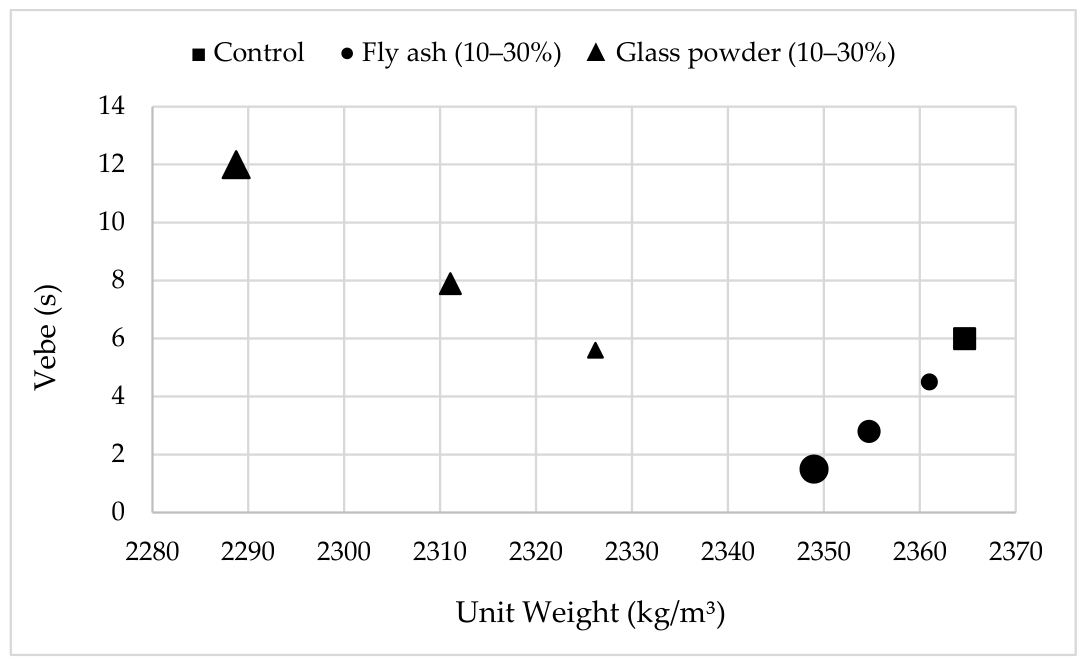
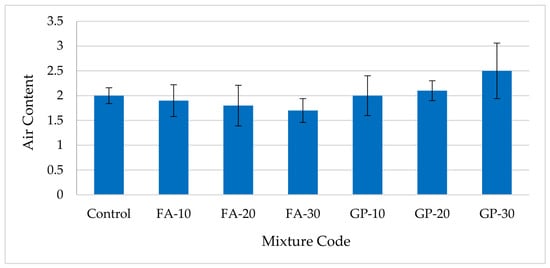
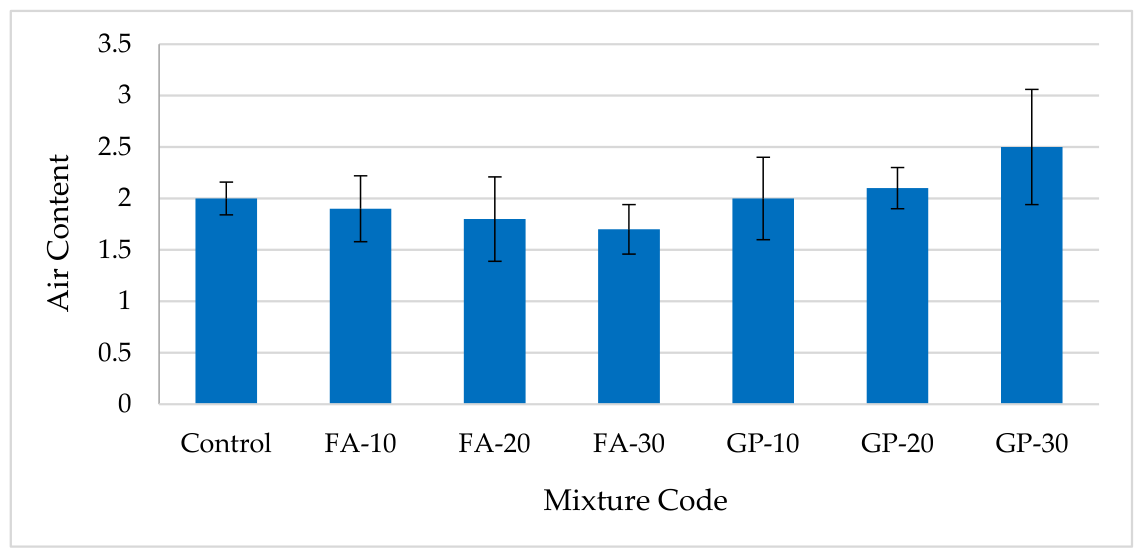
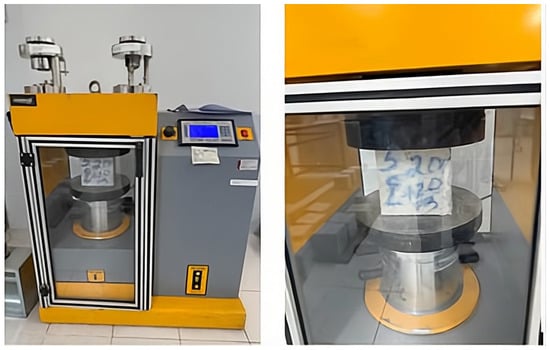
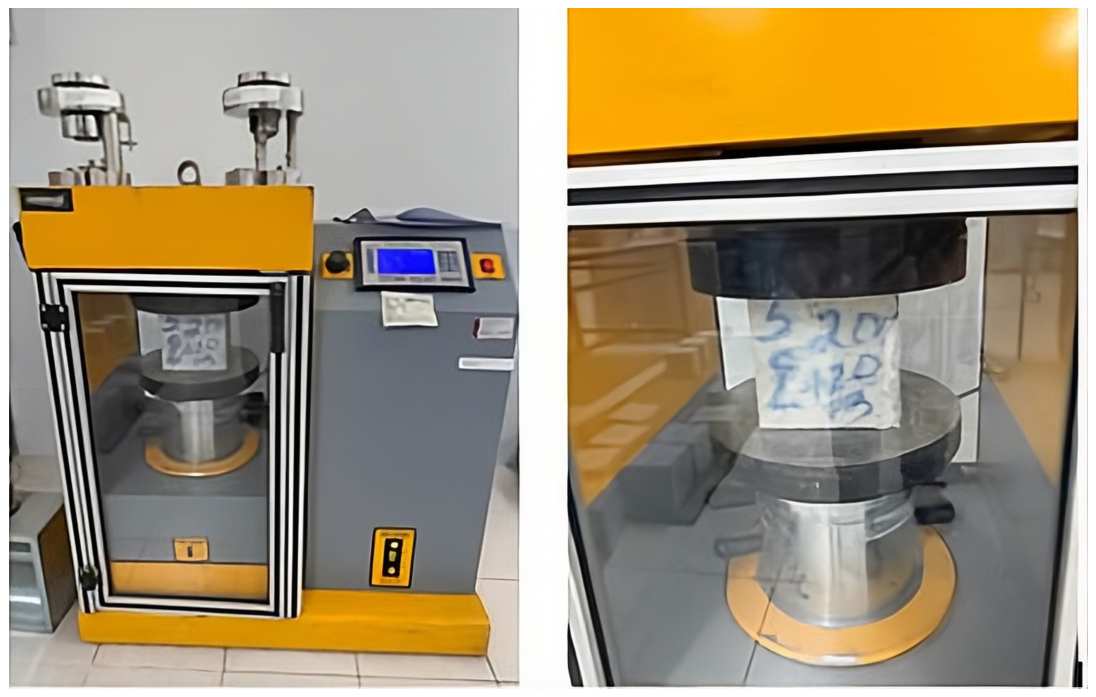
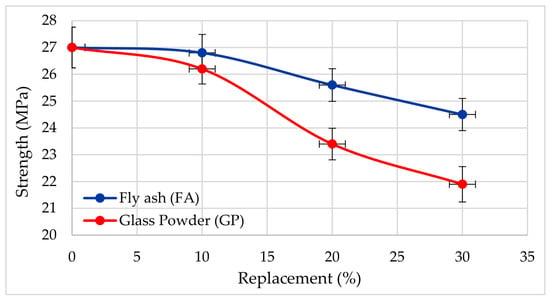
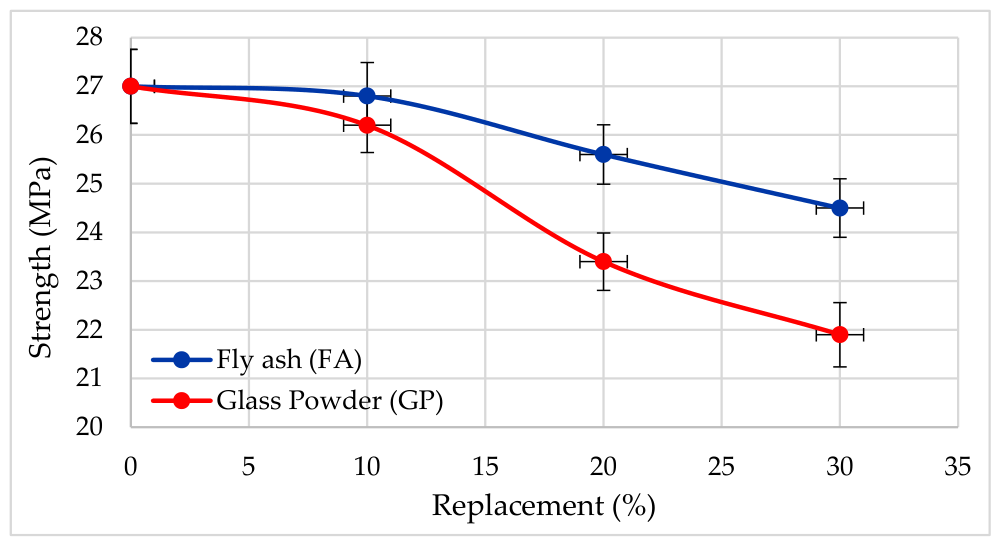
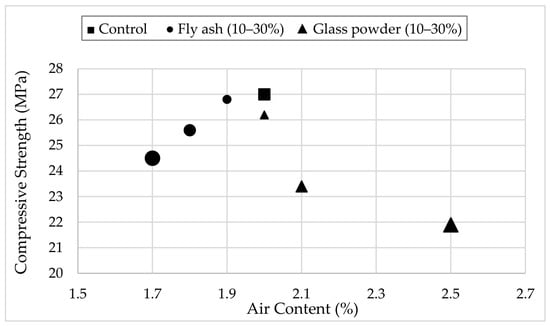
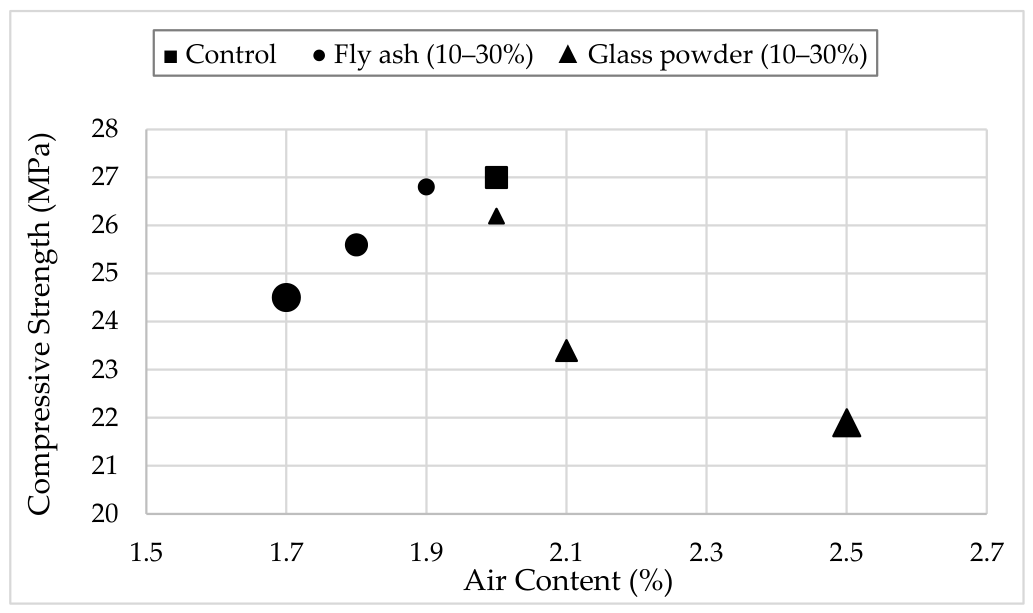
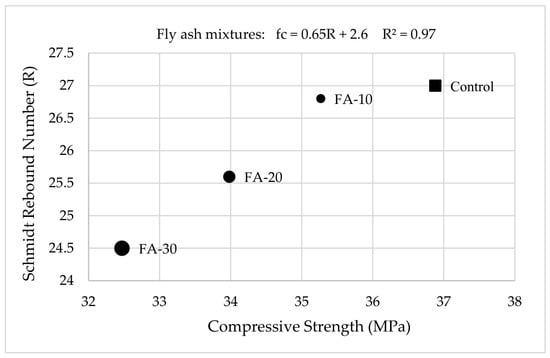
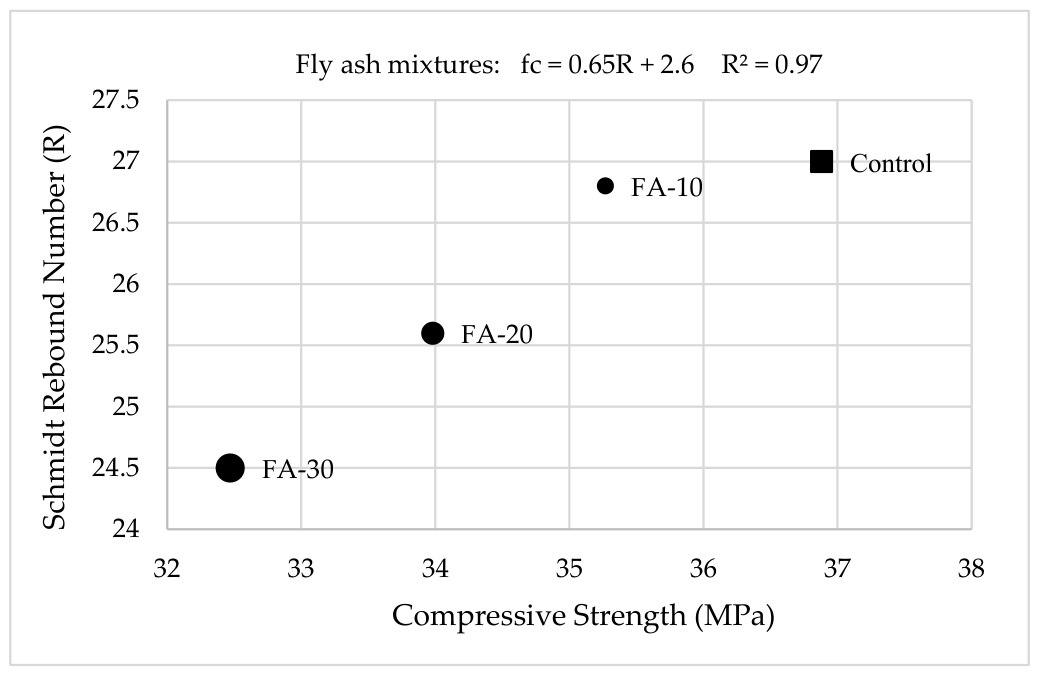
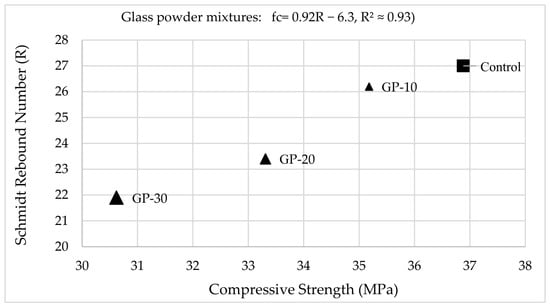
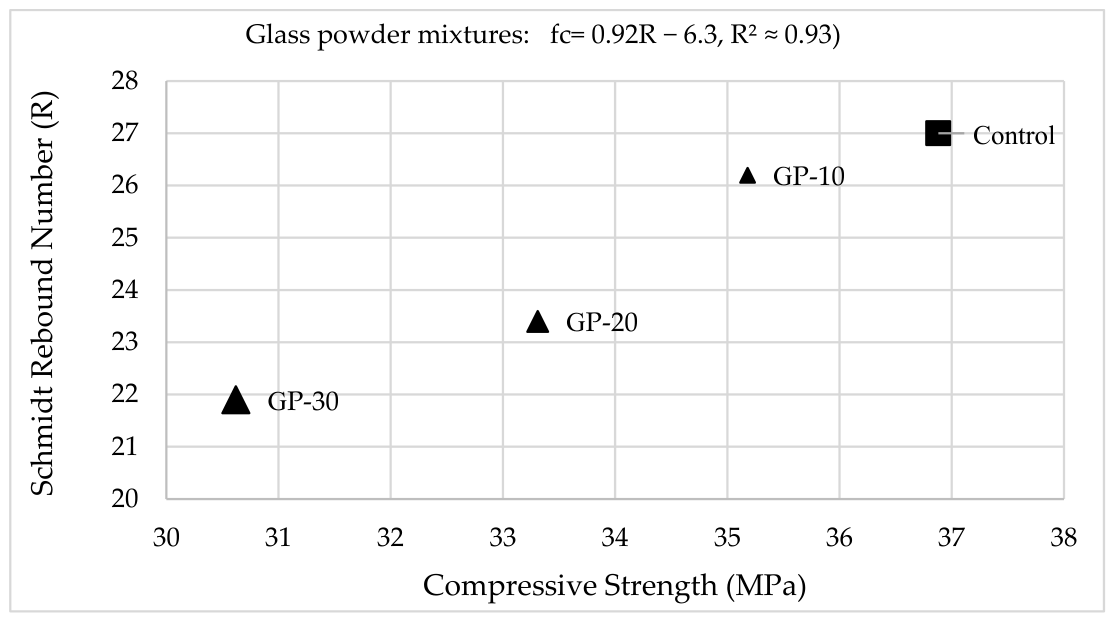
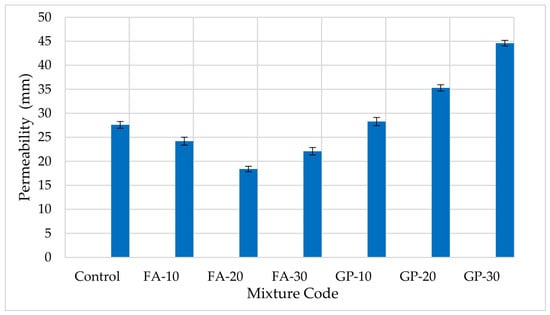
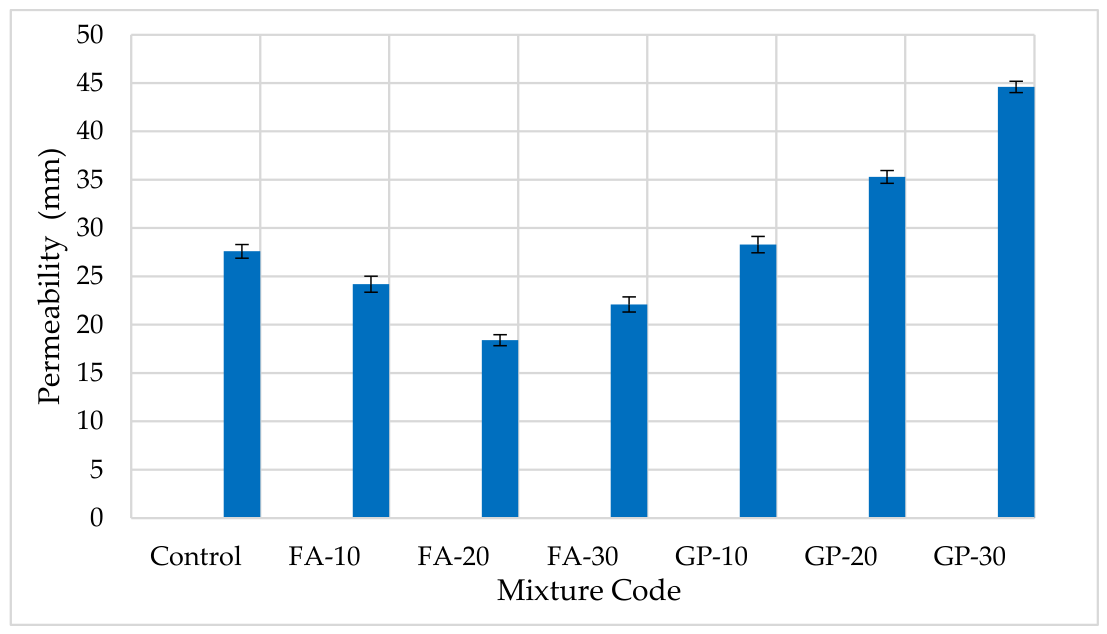
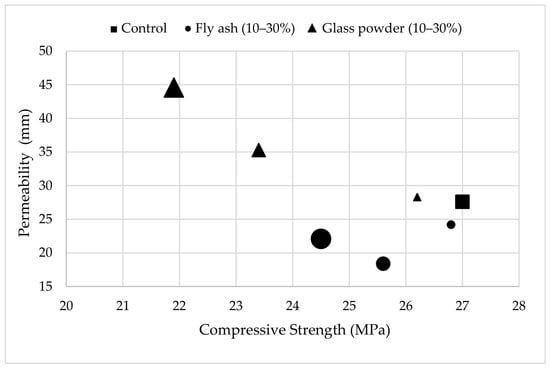
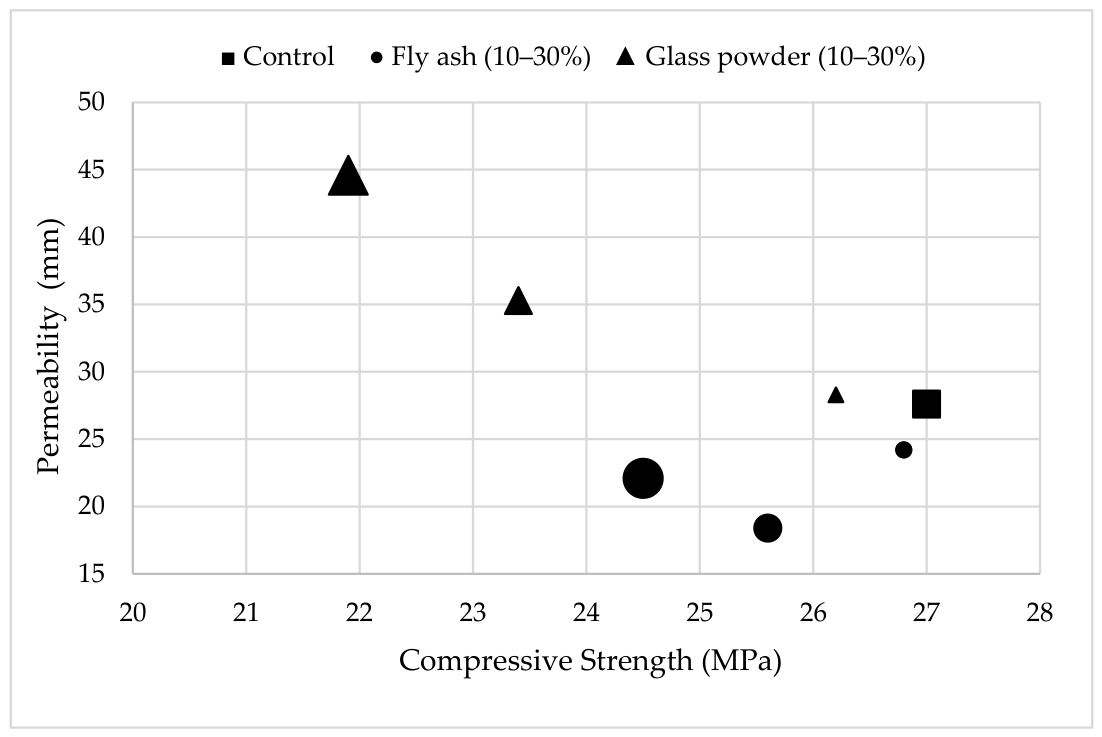
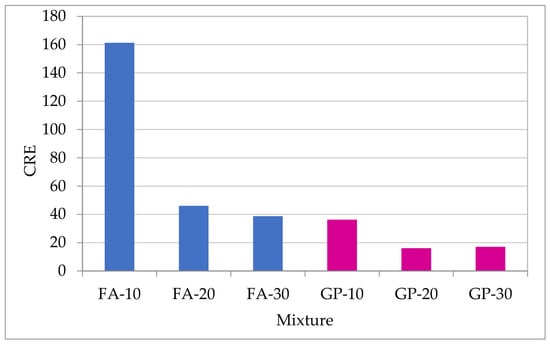
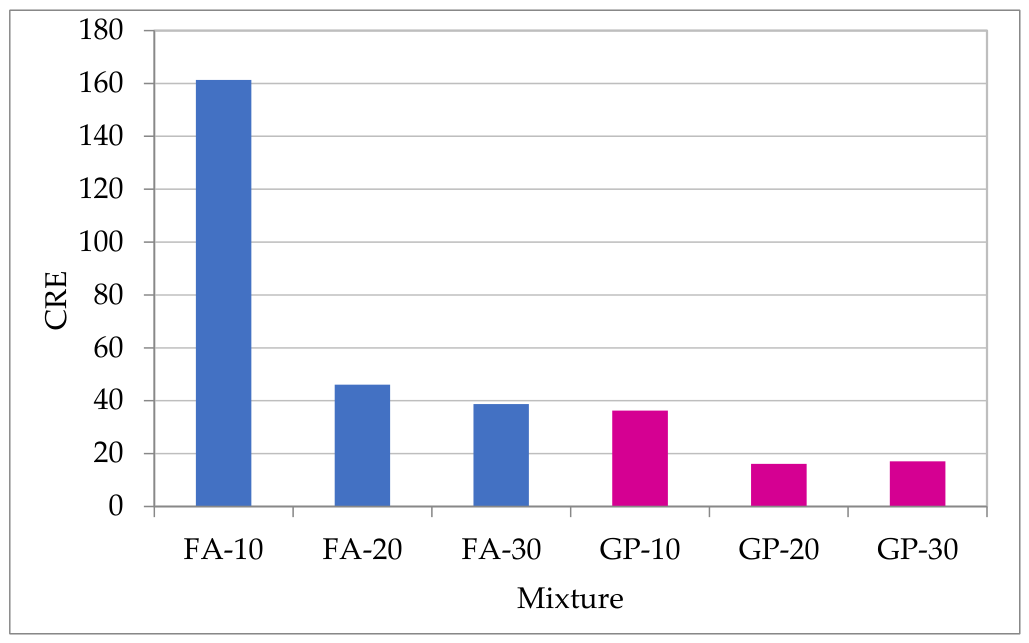
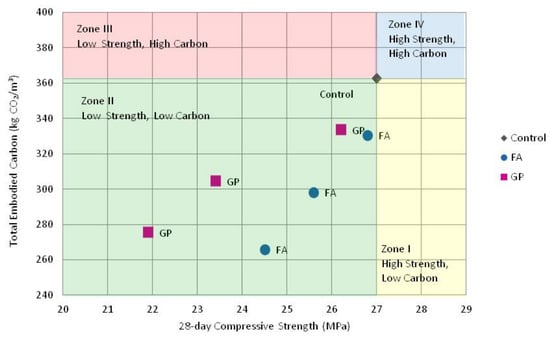

Disclaimer/Publisher’s Note: The statements, opinions and data contained in all publications are solely those of the individual author(s) and contributor(s) and not of MDPI and/or the editor(s). MDPI and/or the editor(s) disclaim responsibility for any injury to people or property resulting from any ideas, methods, instructions or products referred to in the content. |
© 2026 by the authors. Licensee MDPI, Basel, Switzerland. This article is an open access article distributed under the terms and conditions of the Creative Commons Attribution (CC BY) license.