1. Introduction
Walkability is a crucial urban metric linked to vibrant cities, population health, social interaction, and sustainable transportation. Research demonstrates that walkable environments correlate with increased physical activity, reduced car reliance, greater social cohesion, and strong economic growth, contributing to more livable and sustainable urban areas [
1,
2]. Walkability assessments are integral to contemporary urban planning, transport policies, and public health studies. Various assessment tools and indices have emerged to measure walkability at macro and micro scales, focusing on physical features of streets, like sidewalk continuity, land-use mix, safety, comfort, and aesthetics. These tools often employ structured checklists or scoring systems to evaluate pedestrian-friendly environments [
3,
4,
5]. Walkability tools like PEDS, MAPS, SPACES, and SWAT are widely used and validated in Westernized cities across Europe, North America, and Australia, contributing toward standardized measurement [
6].
However, these tools may not accurately capture the unique conditions of GCC cities, such as extreme heat, cultural norms, privacy concerns, and religious spaces like mosques. Applying these tools directly to GCC contexts could lead to misleading walkability assessments and overlook critical local barriers to walking [
7]. Existing walkability tools often fail to account for GCC-specific factors like extreme thermal conditions, cultural influences on walking habits, privacy issues, and the role of mosques in urban settings [
8,
9]. Consequently, this oversight risks producing skewed walkability assessments for GCC cities, potentially disregarding environmental and cultural challenges faced by pedestrians when walking.
GCC cities’ urban contexts are distinct, characterized by central commercial streets with high pedestrian demand from retail, services, and religious activities. However, these areas face challenges such as extreme summer temperatures, insufficient shading, and auto-oriented street designs [
10,
11]. Cultural norms surrounding privacy, gender-based use of space, and social constructs influence pedestrian behavior in GCC cities, necessitating context specific walkability audits. Further, the rapid rate of urban redevelopment with a blend of both traditional and modern commercial architecture creates diverse streetscapes, further complicating the evaluation process. Traditional walkability audits do not capture these complexities [
12]. These circumstances require the creation of a walkability audit tool that is clearly based on the socio-cultural and climatic specificities of GCC cities instead of being adapted after the existing models [
13]. Physical infrastructure measurement should not be the only feature of a context-sensitive tool; there should also be an understanding of how pedestrians perceive, prioritize, and navigate commercial streets in local conditions [
14]. The use of user-derived importance weights and culturally indicative attributes is thus necessary to generate actionable and policy-relevant walkability assessments [
15].
The present paper proposes the design and validation of the Central Street Walkability Audit Tool (Commercial-Central Street Walkability Audit Tool-GCC). The instrument was created to accomplish three primary purposes: (1) to enable planners, urban designers, and transport professionals to have a systematic and helpful checklist for the assessment of walkability in central commercial streets in GCC cities; (2) to combine the opinions of people using the tool by weighting indicators of walkability based on their perceived importance; and (3) to demonstrate acceptable inter-rater reliability [
16], meaning that other assessors in the field may implement the instrument under real-life circumstances. CCSWAT-GCC was developed through a rigorous multi-stage embedded mixed-methods approach [
17]. Synthesis of evidence was undertaken using a systematic literature review, a two-round expert Delphi process to determine content validity, and a survey of the population to determine indicator weights based on perceived importance and satisfaction. The stages informed the development of a weighted scoring system and an interpretable framework of walking grading. The last step was an inter-rater reliability (IRR) test conducted across several commercial street areas using kappa statistics and percentage agreement as measures [
18,
19].
As the previous phases of the research program studied the identification of indicators, expert opinions, and people’s views in detail, the paper is devoted to the construction of the CCSWAT-GCC, the weighting and scoring methodology, and the outcomes of the IRR analysis. General conceptual debates and the entire Delphi and population survey results are thus cited and summarized rather than copied verbatim. Through this, the paper provides a validated context-sensitive tool for walkability auditing that can further methodological practice and applied urban planning research in GCC cities.
In addition to bridging gaps in context, the creation of an effective, user-weighted walkability audit instrument is especially significant for evidence-based decision-making in GCC cities, where the trend of large-scale urban investments is shifting towards central commercial districts. In the absence of a measurement tool that captures local interests and conditions, walkability evaluation may become symbolic rather than functional, with little use in setting priorities for street-level interventions. A tested audit tool allows municipalities and planning authorities to compare the current situation and observe the effects of incremental design and policy interventions over time [
20].
The reliability of measurements is also of paramount importance [
21,
22]. Multidisciplinary teams that apply walkability audit tools include planners, engineers, consultants, and municipal staff with a range of training levels [
23]. In this kind of environment, the effectiveness of audit results in terms of credibility and usefulness for policy-making may be compromised by unequal interpretations of the indicators. The establishment of inter-rater reliability is thus a prerequisite for the shift from a conceptual framework of a walkability tool to an effective planning tool [
24,
25]. By showing that there is a reasonable consensus among independent raters, it can be concluded that any differences in walkability scores reflect real-life situations rather than the subjectivity of the assessor.
The CCSWAT-GCC enhances walkability measurement by combining context-specific indicators, weighted public input, and formal reliability testing, thereby improving walkability measurement compared to checklist-based auditing. The instrument provides walkability as a measured, comparative, and policy-relevant construct in GCC commercial streets. In this way, it offers a basis for more sensitive pedestrian-based planning, data-driven city-form decision-making, and discussion of the broader topic of how global urban sustainability paradigms can be adapted to the regional context, taking into account social, cultural, and climatic factors.
Historically, Arab and Muslim cities, including GCC urban areas, were organized according to the distinct hierarchy of streets and open space, shifting from semi-privacy to the fully-open space that was dominated by institutional and commercial activities. Streets in this hierarchy were the most important open spaces of social life, which facilitated social interaction, culture, and economic exchange [
26]. The modern trends of urban development and growing motorization have undermined this traditional purpose of the streets, reviving the popularity of walkable environments as an element of larger sustainability programs. Walkability audit tools have, in turn, become a viable tool that can be used to assess the state of walkability in a systematic manner that highlights strong and weak areas and identifies priority areas to improve the situation. The CCSWAT-GCC is based on this context, incorporating the history and current state, and has potential to be an informative and reliable assessment tool to help GCC authorities examine and improve the walkability of central commercial streets and therefore lead to the revitalization of streets as functional, social, and cultural responsive public spaces. This paper contributes to the walkability assessment research in several ways. First, it builds a context-sensitive walkability audit tool that has a particular focus on commercial streets in GCC cities, with the added dimension of climatic and cultural aspects that are frequently not considered in the current tools. Second, it presents a public-weighted indicator system, which considers local perceptions of the importance of walkability. Third, it empirically confirms the tool by inter-rater reliability testing in actual conditions in a hot climate. Lastly, the research offers a viable and scaled framework that can be used to facilitate evidence-based urban planning and policy intervention in the GCC cities.
2. Literature Review and Methodological Framework
This study employs a multi-stage mixed-methods research design to develop and validate a walkability audit tool tailored for GCC commercial streets.
2.1. Literature Review
Combining qualitative and quantitative methods to ensure the tools’ validity, contextual relevance, and reliability, the study integrates systematic evidence synthesis, expert consensus, user-based weighting, and reliability testing in a consistent instrument development framework. This sequential design grounds walkability indicators in theory, local context, and real-world empirical testing, promoting consistent implementation.
Recent studies in Asian contexts have also contributed to walkability assessment, particularly in high-density urban environments such as China and Japan, where factors such as mixed land use, pedestrian infrastructure, and transit accessibility have been extensively examined [
27,
28,
29].
Developing an Evaluation System for Measuring Walkability
Evaluating walkability necessitates a distinct methodological framework that accommodates various spatial scales [
30]. Over time, diverse disciplines within social sciences, public health, urban planning, architecture, and transport engineering have developed numerous methods of constructing these frameworks, including auditing tools, level-of-service inventories, social surveys, and GIS analyses [
31,
32].
The initial walkability literature was dominated by engineering-focused approaches, which focused the consideration on pedestrian flow, capacity, and volume but put relatively little emphasis on the experiential and contextual needs of pedestrians [
33]. Consequently, there was a lot of literature on the macro-level features of the built environment, including street connectivity, land-use mix, block size, and intersection density [
1]. These macro-level features have been assessed extensively using GIS-based processes in terms of how they relate to walking behavior [
34,
35,
36]. Nevertheless, one of the longstanding weaknesses of this literature is that it focuses on broad-scale spatial measures without paying enough attention to the finer details, which are the street-level characteristics that directly influence the everyday experiences of pedestrians. There is growing evidence that the urban environment’s micro-level factors, such as the quality of the sidewalks and their levels of comfort and safety, have a significant effect on the behaviors of pedestrians and their decisions of routes [
35].
To address these shortcomings, the last twenty years have also seen the development of design-based methods of measuring walkability, with the most prominent being walkability audit tools. Walking audits offer a methodology that is systematic and organized in assessing the micro-scale characteristics of the environment that are usually not described at a macro-level, such as pathway width, surface condition, wayfinding signage, shading, and maintenance [
37]. Thus, quantitative ratings are usually followed by qualitative observations in the form of audit tools that make it possible to more effectively estimate pedestrian environments. They have been extensively used to inform urban design interventions, policy development, and public health interventions to better the walking conditions of various user groups [
38].
Many walkability audit tools exist, including the Irvine Minnesota Inventory (IMI) in the United States [
39], the Systematic Pedestrian and Cycling Environment Scan (SPACES) in Australia [
40], the Pedestrian Environment Data Scan (PEDS), the Microscale Audit of Pedestrian Streetscapes (MAPS), the Scottish Walkability Assessment Tool (SWAT), and the Walking Suitability Index of the Territory (T-WSI). These applications mainly measure physical features of the street environment, such as the continuity and width of the sidewalks, crossings, structure of the buildings, block size, traffic exposure, and parking facilities [
32]. The other tools, including the Maryland Inventory of Urban Design Qualities (MIUDQ), place more emphasis on the perceptual and experiential characteristics of urban design, and it can be said that it enables the evaluation of walking environments to be performed beyond the realm of mere physical measures [
41]. As a result, the majority of modern audit tools include objective and subjective scales of walkability [
42].
In order to completely assess walkability, thus it is also required that not only the physical properties of the built environment be assessed, but also the perceptions of pedestrians to the built environments should be assessed, since perception is that mediates the association between objective conditions and walking behavior [
43]. Simultaneously, it is indicated that there could be more contextual variables that contribute to pedestrian behavior that are otherwise unaccounted in conventional measurement systems [
44]. Although numerous instruments to measure walkability have been constructed to offer solutions to various urban settings and research purposes, most of them have been constructed and tested in non-GCC environments. This way, their direct implementation to GCC cities, marked by specific cultural norms, weather patterns, and urban patterns, is methodologically constrained, which explains the necessity of a context-specific walkability audit instrument that would be applied to GCC commercial streets.
2.2. Methodological Framework
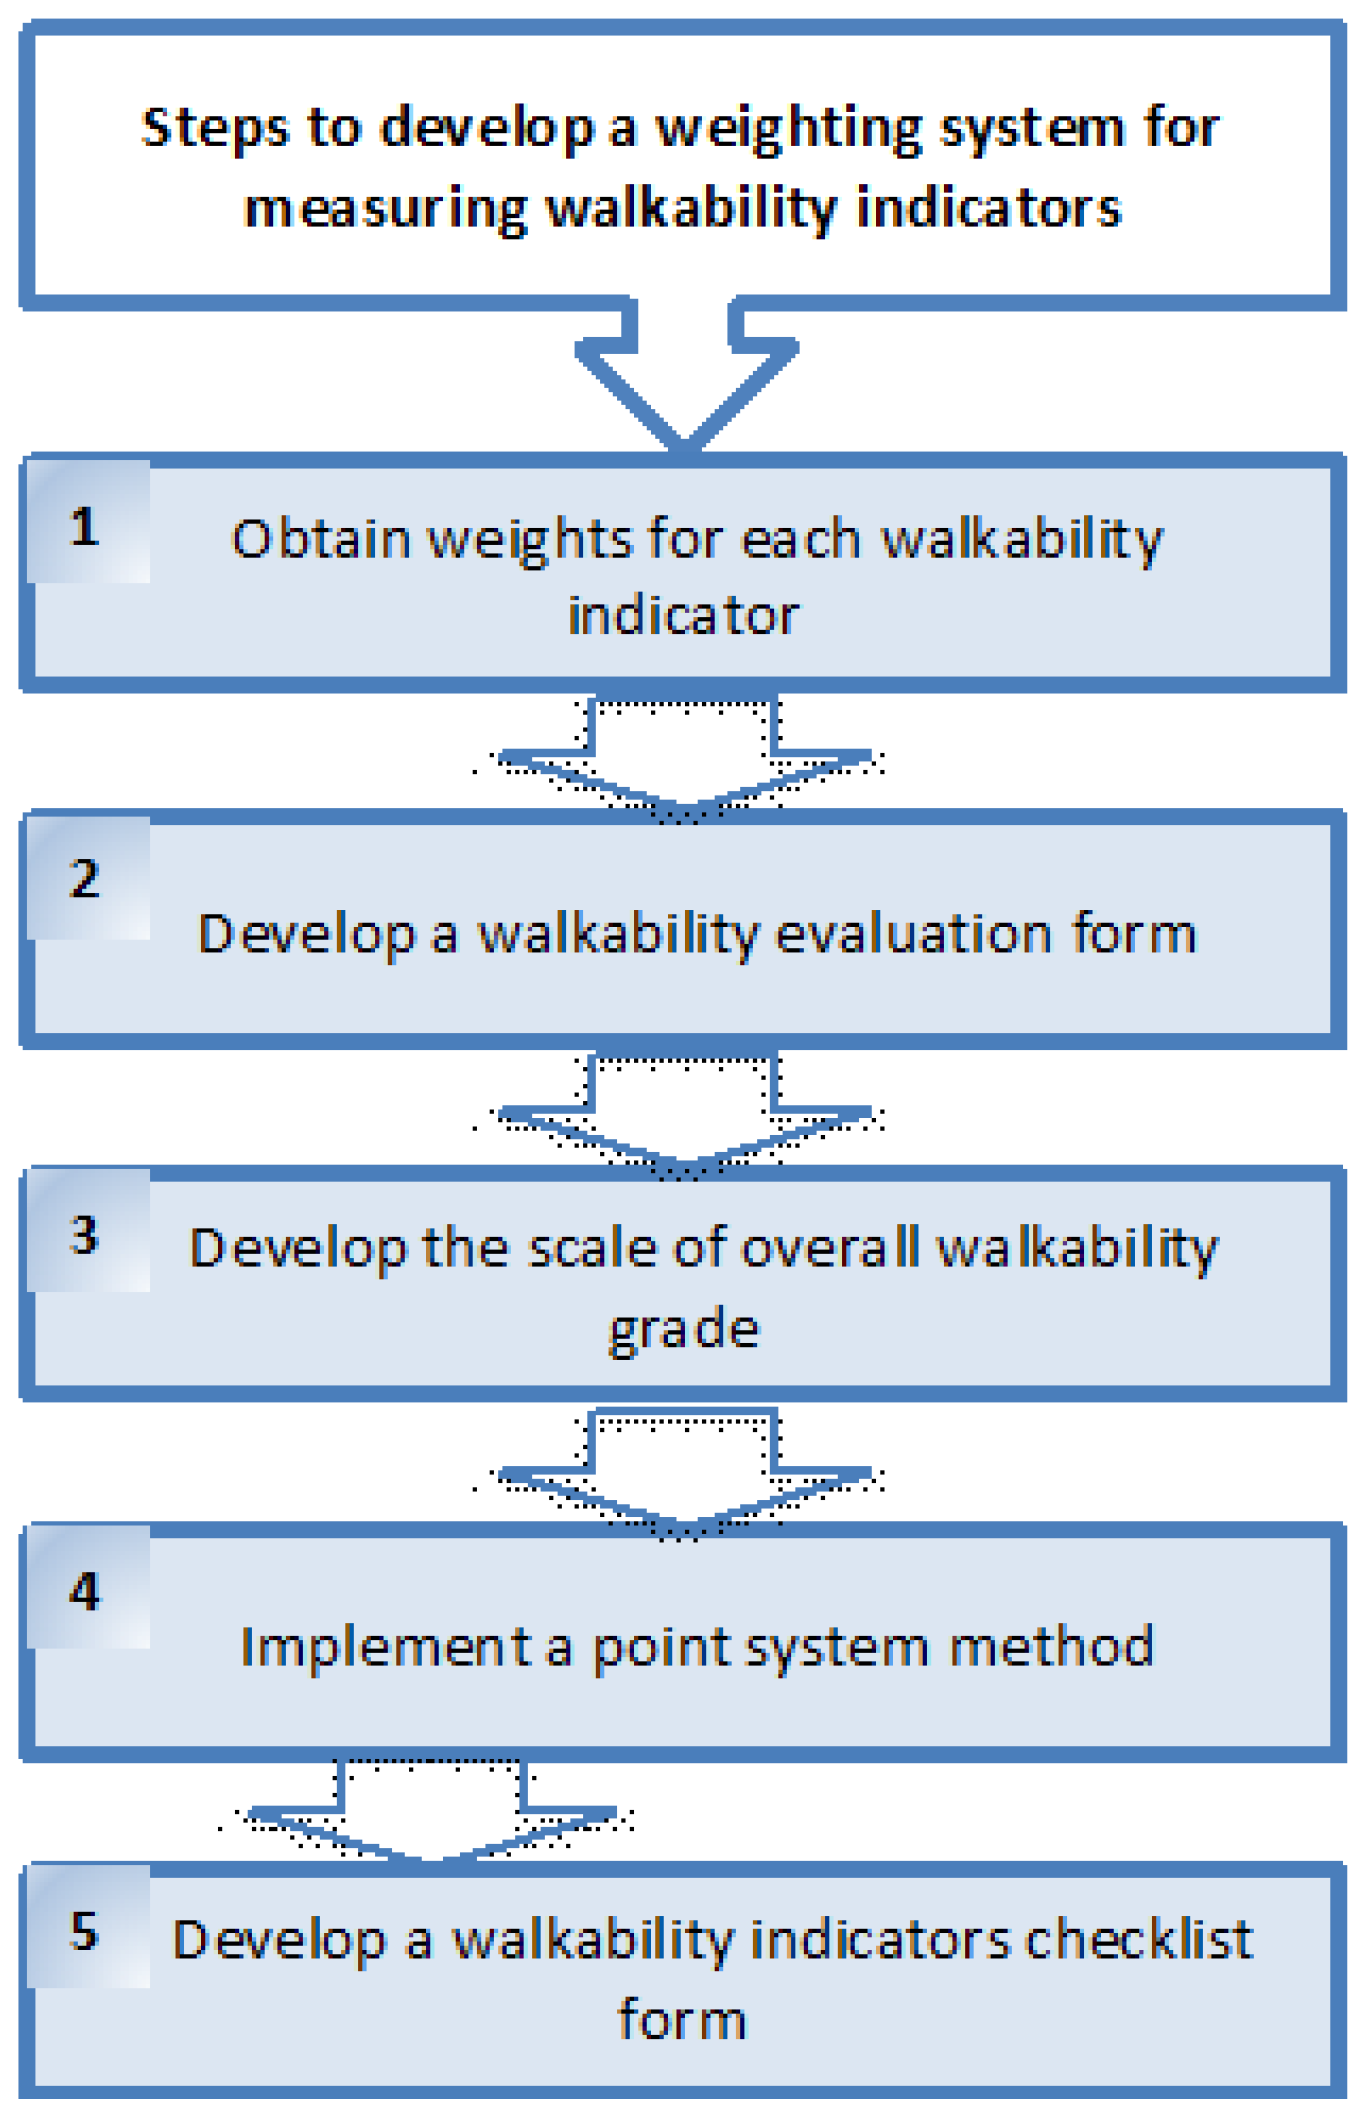
To properly develop a weighted system for walkability indicators involves a structured process. The five steps are outlined in
Figure 1. These steps ensure a systematic approach to assigning importance levels to various walkability indicators.
The expert sample was selected based on professional experience in urban planning and related fields, ensuring relevance to the study context. The public survey sample was selected to include individuals familiar with commercial streets in Riyadh. While probability sampling was not feasible, efforts were made to ensure diversity in respondents’ backgrounds and experiences.
Because the direction of desirability is different among indicators (i.e., some indicators are positively related to walkability and others are negatively related to walkability), a standardization process was implemented in order to achieve consistency in scoring. All the indicators were converted into a single scale, with high values always reflecting the better walkability conditions. In case of indicators which are negatively related (e.g., noise level, air pollution), reverse scoring was used before aggregation.
Operational definitions of each indicator were created to make the field audits clear and consistent. An example of this is the accessibility of a mosque, meaning the proximity of a mosque or a prayer facility within walking distance, and the accessibility of the facility on foot. Gender-friendly spaces refer to the perceived safety, comfort, and inclusivity of public spaces to all users, including with regard to visibility, lighting, and social environment, not the supply of segregated facilities. Detailed descriptions and guidance were provided to raters through the audit manual.
Although the weighting system is based on mean importance scores, it is acknowledged that dispersion in responses may influence the robustness of the weighting results. However, this approach is widely used in perception-based studies due to its simplicity and interpretability. In this study, standard deviation values were also examined to ensure that no indicator exhibited extreme variability that could undermine its relevance. Future research may consider incorporating consensus-based thresholds or alternative weighting approaches to further refine the robustness of the model.
It is worth noting that the scoring system is provided in two complementary forms to ensure clarity. The relative contribution of each indicator is calculated as the normalized weighting system (WES), which is in the range of 0 to 1. This normalized score then transforms into the Overall Walkability Evaluation Score (OWES), which is expressed as a point-based scale with a range of 0 to 300 to facilitate interpretation and grading in practice (A-F scale). These formulations are therefore based on the same underlying scoring system in normalized and scaled form, and not two different methods.
Although the detailed procedures of the literature review, Delphi survey, and public survey are reported in prior work, a concise summary is provided here to ensure the methodological transparency and self-contained nature of this study.
2.2.1. Obtaining Weights for Each Walkability Indicator
The procedure for indicator weight selection and assignment is generally considered an important methodological choice in composite index construction and it is, transparently and objectively, supposed to be influenced by clear and objective principles for choosing weights [
45,
46]. In this research, the weights of the indicators were obtained based on the answers to a questionnaire given to residents of Riyadh, which is considered representative of the population, and based on this analysis, objective and systematic results were obtained regarding the subject of walkability, and the probability of researcher-induced or perception-related bias was reduced to the lowest level possible at the same time [
47]. This strategy makes the walkability scores more legitimate and practical as the process of weighting them is based on empirical user data.
Simultaneously, it is also admitted that the task of weight generation presupposes normative judgment because the concept of weighting presupposes the attribution of relative values to various attributes. This is the reason why assigning importance to the process should include, in an explicit way, the views of people experiencing the walking environment. To make sure that the instrument represents lived pedestrian realities as opposed to abstract theoretical assumptions, it is then necessary to develop a walkability audit tool where the perceived significance of each indicator is assessed.
It is known that the perceived relative significance of walkability indicators differs within cultural, climatic, and socio-demographic contexts. Cues that are very powerful determinants of pedestrian behavior in cold weather conditions can be perceived differently in warm weather conditions where the importance of thermal comfort and shading is more dominant. Moreover, in the same cultural environment, walkability perceptions might also vary based on demographic attributes like age and gender. Public-derived weights should consequently be incorporated in such a way that the audit tool can be more adaptive to contextual variability and will be more responsive to the varied needs of pedestrian populations.
Public perception was used to generate the relative importance or weight of each of the walkability indicators in the audit tool using the following equation:
where Cli represents the composite indicator (normalized value) of the case of indicator i, IR represents the importance rating of each indicator, IRs represents the summation of importance rating of all indicators, k represents the number of indicators (49 indicators) and j represents the number of participants (302 participants). The composite indicator (CI
i) of each of the walkability indicators for central-GCC-area commercial streets was also computed, and each indicator was categorized based on five walkability features as presented in
Table 1.
Several indicators included in the CCSWAT-GCC are context-specific and reflect the unique socio-cultural and climatic characteristics of GCC cities. These include accessibility of mosques/prayer spaces, gender-sensitive spatial considerations, thermal comfort provisions such as shading and heat-resistant materials, and the presence of climate-adaptive street furniture. Such indicators are rarely incorporated in conventional walkability tools developed in temperate regions, highlighting the contextual contribution of this study.
2.2.2. Walkability Evaluation Form
The Walkability Evaluation Form, being a pre-designed database, was created to facilitate the calculation of overall walkability values created by the audit tool. The database will integrate all 49 indicators in the fieldwork audit form and will give a systematic platform on which the field observations will be consolidated and processed. After data collection, the scores that were used to indicate data during field audits were copied out of the fieldwork forms onto the relevant fields in the Walkability Evaluation Form.
The values of composite indicators based on the perceptions of the residents of Riyadh were computed and initially recorded in the database to indicate the relative significance of each indicator. After that, the ratings given to each street block in the field were input into neighboring columns. It is possible to combine the indicator weights and field-based scoring of the evaluation scores to calculate one composite measure of the walkability at street level. In this regard, the overall walkability evaluation score (OWES) was computed based on the equation below:
OWES denotes the overall score from the walkability evaluation, CIi denotes the composite indicator (normalized) of indicator i, IESi denotes the indicator evaluation score of indicator i, and k denotes the count of indicators (49 indicators).
The last step of the audit process is the transfer of the Overall Walkability Evaluation Score (OWES) into an overall walkability grade (OWLK) by means of attributing the calculated score to a pre-established grade point scale. By doing this, the continuous OWES value can be interpreted in a clear and policy-relevant way and it will be easier to compare the street segments and to prioritise interventions. By means of this grading methodology, the audit tool is capable of allowing an empirical evaluation of the walkability of central commercial streets in the GCC cities in general.
Table 2 shows the walkability evaluation form.
2.2.3. Overall Walkability Grade Scale
Walkability measurement lacks a single standard due to its multifaceted nature (REF). A walkability assessment covers a wide range of physical, perceptual, and behavioral measures. Common approaches, like Pedestrian Level of Service (PLOS) [
48], adapt the larger Level of Service (LOS) framework that was initially applied to assess the conditions of vehicular traffic [
49,
50]. LOS traditionally prioritizes vehicles due to the emphasis on street capacity, traffic volume, and flow characteristics. This has resulted in service-level measures, which focus uniquely on pedestrians being the major street users, being relatively underdeveloped [
51].
This shortcoming displays the multifaceted nature of pedestrian environment assessment, which is more complex than the vehicle one because of the multiplicity of pedestrian requirements, behavioral patterns, and perceptions [
33]. Although street volume and capacity metrics are still important ingredients in the process of capturing the features of the service level, they still are not enough to reflect the pedestrian experience. Qualitative dimensions, which include perceived comfort, safety and movement ease, are essential in influencing the behavior of pedestrians, and should be included in pedestrian-based assessments [
52]. This is why recent studies point to the incorporation of PLOS with walkability assessments to offer a more efficient means of assessing street design characteristics and to confirm the expanded consideration of walkability issues [
48].
A useful walkability audit tool, thus, must include not only an identification of the indicators of interest, but also a system of interpretable grades that would project the measurements of the conditions to meaningful levels of walkability of particular street segments. The walkability grading scale in the current paper is based on modifications of pedestrian-oriented service-level models incorporated in the Highway Capacity Model (HCM) and its associated guidelines by the Florida Department of Transportation (FDOT) [
52]. This scale also includes the principles applied in the assessment of PLOS within the general LOS assessment framework.
The empirical research conducted recently contributes to the usefulness of this kind of adapted grading method. Indicatively, Raad [
33] has used a scaled version of service level to assess qualitative and quantitative variables that affect footpath conditions for pedestrians in Australia. The tool was empirically viable and responsive to environmental changes in the walking experience by combining both objective and subjective indicators of the pedestrian experience. In line with this evidence, the addition of quantitative and qualitative measures into a graded walkability framework will increase the capacity of audit tools to capture real pedestrian experiences and will aid in more subtle and valid assessment results [
53].
A qualitative point-based grading system (based on the Highway Capacity Manual (HCM) scale) was used to regress the scores in the walkability evaluation process into a service level in this study. The use of the HCM-based point system is a standardized and generally recognized method of evaluating the conditions of pedestrians, which increases the transparency and the comparability of the evaluation outcomes. The grading scheme consists of six levels of walkability, A to F, that reflect different levels of walking quality, including excellent walking conditions to very poor walking conditions, as summarized in
Table 3.
The cumulative condition of the audited segments of a street in the form of a score in points are reflected in the Overall Walkability Evaluation Score (OWES). OWES values in the proposed system will be between 0 and 250, which are the lowest and the highest possible values, respectively. The individual scores on the indicators are initially obtained and entered into the Walkability Evaluation Form
Table 3 and then the overall OWES is obtained by using the point-system method. The resultant OWES is then converted into its respective HCM-based walkability grade.
2.3. Overview of the Multi-Stage Development Process
The CCSWAT-GCC was developed in a logical multi-stage manner. To begin with, a systematic and narrative literature review was conducted to find a preliminary pool of 111 walkability indicators. Second, a two-round Delphi survey among walkability experts was conducted to develop content validity and reach an agreement on indicator relevance, leading to a final set of indicators (38 participants in Round 1 and 27 in Round 2). Third, residents of Riyadh with familiarity with the central commercial streets (n = 302) were surveyed on their perceptions of importance and satisfaction levels for each indicator. This is based on the previous preparation steps, which entailed the formulation of a weighted and point-based scoring system that combined the importance values determined by people with field-based evaluation data to form a composite measure of walkability.
The last stage involved an inter-rater reliability (IRR) test, in which six trained raters rated six commercial street sections in central Riyadh using the audit tool. A prior work provides all the methodological information and findings from the first three stages; however, in this paper, they are summarized, and the latter two stages were the main focus because it was during these two stages that the structure of CCSWAT-GCC and its reliability performance were institutionalized and assessed.
2.4. Indicator Reduction and Selection (Delphi Summary)
From the initial pool of 111 indicators identified through a systematic literature review and local studies, the two-round Delphi process focused on 49 indicators across five domains: Cultural (e.g., privacy, proximity to mosques), Functional (e.g., continuity of footpath, crossings), Safety (e.g., lighting, CCTV presence), Aesthetic (e.g., façade quality), and Comfort (e.g., shade, seating). The Delphi used median ratings and interquartile range (IQR) thresholds to determine consensus and retention [
8].
2.5. Public Weighting Survey
A web-based social-network recruitment survey (respondent-driven sampling) of 302 residents rated:
These data were used to compute a Relative Importance Index (RII) and a composite importance metric for each indicator. The weighting approach is described below.
2.6. Weighting and Point-System Scoring
The tool applies a two-stage numerical approach:
- 1.
Indicator weight calculation: For each indicator i, a normalized weight was computed from the public survey importance values. Weights were scaled so that .
- 2.
Indicator score: Each item in the audit is scored in the field by raters using discrete ordinal scales (for example: 0 = poor, 1 = fair, 2 = good, 3 = excellent) or dichotomous presence/absence where applicable.
A point system translates observed ratings into a standardized indicator score in the range [0,1]. The street-level Walkability Evaluation Score (WES) for a segment is then:
To aid interpretation, WES values were then converted into an overall walkability grade using a grade scale (e.g., Excellent, Good, Moderate, Poor) with clearly defined thresholds.
2.7. Walkability Checklist and Field Guidelines
The CCSWAT-GCC comprises three pages: (1) contextual and street metadata, (2) the 49-item checklist with scoring rubrics and guidance, and (3) a summary scoring sheet and space for notes. A short field manual clarifies scoring rules, item definitions and examples, and recommends pre-field training procedures for raters.
2.8. Inter-Rater Reliability (IRR) Test
Walkability audits always involve subjective judgement by raters, especially on indicators that pertain to comfort, safety and perceptual attributes of the pedestrian environment. This kind of subjectivity may affect the results of the audit and create variability in measurement, which is why the formal testing of reliability is necessary. Inter-rater reliability (IRR) is a measure that determines how consistent the assessments of independent raters are towards the same attributes, and thus, is an essential measure of the measurement strength of an audit tool [
40]. When used in the context of this study, IRR shows how well the CCSWAT-GCC measures walkability conditions when used by different assessors. By showing reasonable reliability, to the extent that if the same parts of the street were to be assessed again, it would be likely to generate similar results, enhances the validity of the audit findings and thus their ability to influence policy decisions surrounding the implementation and prioritization of walkability.
One of the most common methods of IRR measurement is to measure the rate of agreement between raters, which refers to the percentage of the same ratings given to the same indicators expressed as a percentage of the responses given by the raters [
54]. Although this approach offers a clear measure of concordance, it fails to distinguish the difference between agreement that results from chance and agreement. To overcome this, kappa statistics are often used, as they explicitly correct chance agreement and provide an estimate of reliability that is less conservative than with other statistics like alpha and tau-a [
40]. Kappa statistics are especially appropriate when the measure is categorical or ordinal, which is typical of walkability audit tools [
55,
56].
Other researchers have posited that, provided raters are adequately trained and the likelihood of chance agreement is minimal, percentage agreement may suffice as an acceptable indicator of IRR [
57]. Still, the combined use of percentage agreement and Fleiss’ kappa provides a robust assessment of reliability, as it accounts for chance agreement and captures subtle differences in rater interpretation, thereby revealing variability across indicators [
58]. To this end, this study employs both percent agreement and Fleiss’ kappa to assess the IRR of the CCSWAT-GCC.
Table 4 provides a summary of selected studies that have implemented IRR testing in street-level walkability and pedestrian environment audit instruments.
Given that multiple raters (n = 6) were involved in the audit process, Fleiss’ Kappa statistic was employed to assess inter-rater reliability. Unlike Cohen’s Kappa, which is suitable for two raters, Fleiss’ Kappa allows for the evaluation of agreement among multiple raters and is therefore appropriate for this study.
One of the most critical aspects of IRR testing is the selection and training of raters, as the variability in their interpretation can significantly influence audit results. In this case, six raters with professional experience in urban planning were employed in the current study. All raters were residents and employed in Riyadh and were well-conversant with the chosen commercial street segments, which were situated in the central part of the city. Knowledge of the local context was thought to be significant in order to give an informed and realistic interpretation of culture and climatically specific indicators.
Since the researcher was in Australia during the data collection period, all the training programs were done through a video conferencing platform. Proper training of the raters was supposed to enhance the uniformity of ratings and thus lead to better IRR results [
58]. Each rater was provided with a full auditing package consisting of elaborate guidelines on the indicators, a presentation explaining the format of the audit tool, photographs of the selected segments of the street, and a map showing the boundaries of the segments before the training sessions.
The training was provided to each rater in an individual session some 5 days after training materials were distributed and after ensuring that the quality of the video calls was good. The sessions took about an hour and included an introduction of the research goals and a clear explanation of each indicator with its scoring criteria in a detailed manner with visual illustrations. The trainer also encouraged raters to ask questions during the session and all questions and clarifications raised during the session were compiled and made available to the rest of the raters through email so that they would understand things in the same way.
After the training, the raters were given an elaborate guide on how to carry out the field audit, and an actual date to collect the data was prescribed. Raters were asked to make more visits to the street on two days where extreme climate conditions were to be taken into consideration, and also to perform audits in the late afternoon or evening. The auditing process was completed by all raters within the stipulated duration, except one rater who had a slight delay owing to work commitments. All raters completed the entire auditing process in one week, and no more than two visits were made to each street segment. Each audit took an average of 20 min for each block. Raters had the choice to record their responses either on paper or in an electronic survey format that was conducted on the Key Survey platform of their choice.
3. Data Collection
The inter-rater reliability test used data from July 2022, focusing on six segments of a 2 km commercial street in a GCC city. These segments, chosen from 12, represented typical central city commercial areas. The average length of each street was approximately between 300 and 350 m.
The sample of the survey, which was conducted among the population, was 302 people who were conversant with the commercial streets of Riyadh. Purposive and convenience sampling were used together to approach the participants and make sure that the respondents had some previous experience with the study areas. We tried to involve people from varying socio-demographic groups and with different degrees of street usage. Although not all of the potential participants agreed to participate, the ultimate sample size can be seen as sufficient in a perception-based study and consistent with related walkability studies.
The study areas chosen have a diversity of commercial street conditions in terms of land use intensity, the level of pedestrian activity, and the nature of traffic conditions. This difference was designed to embrace different walkability experiences in the core location of Riyadh and make the weighting process more solid.
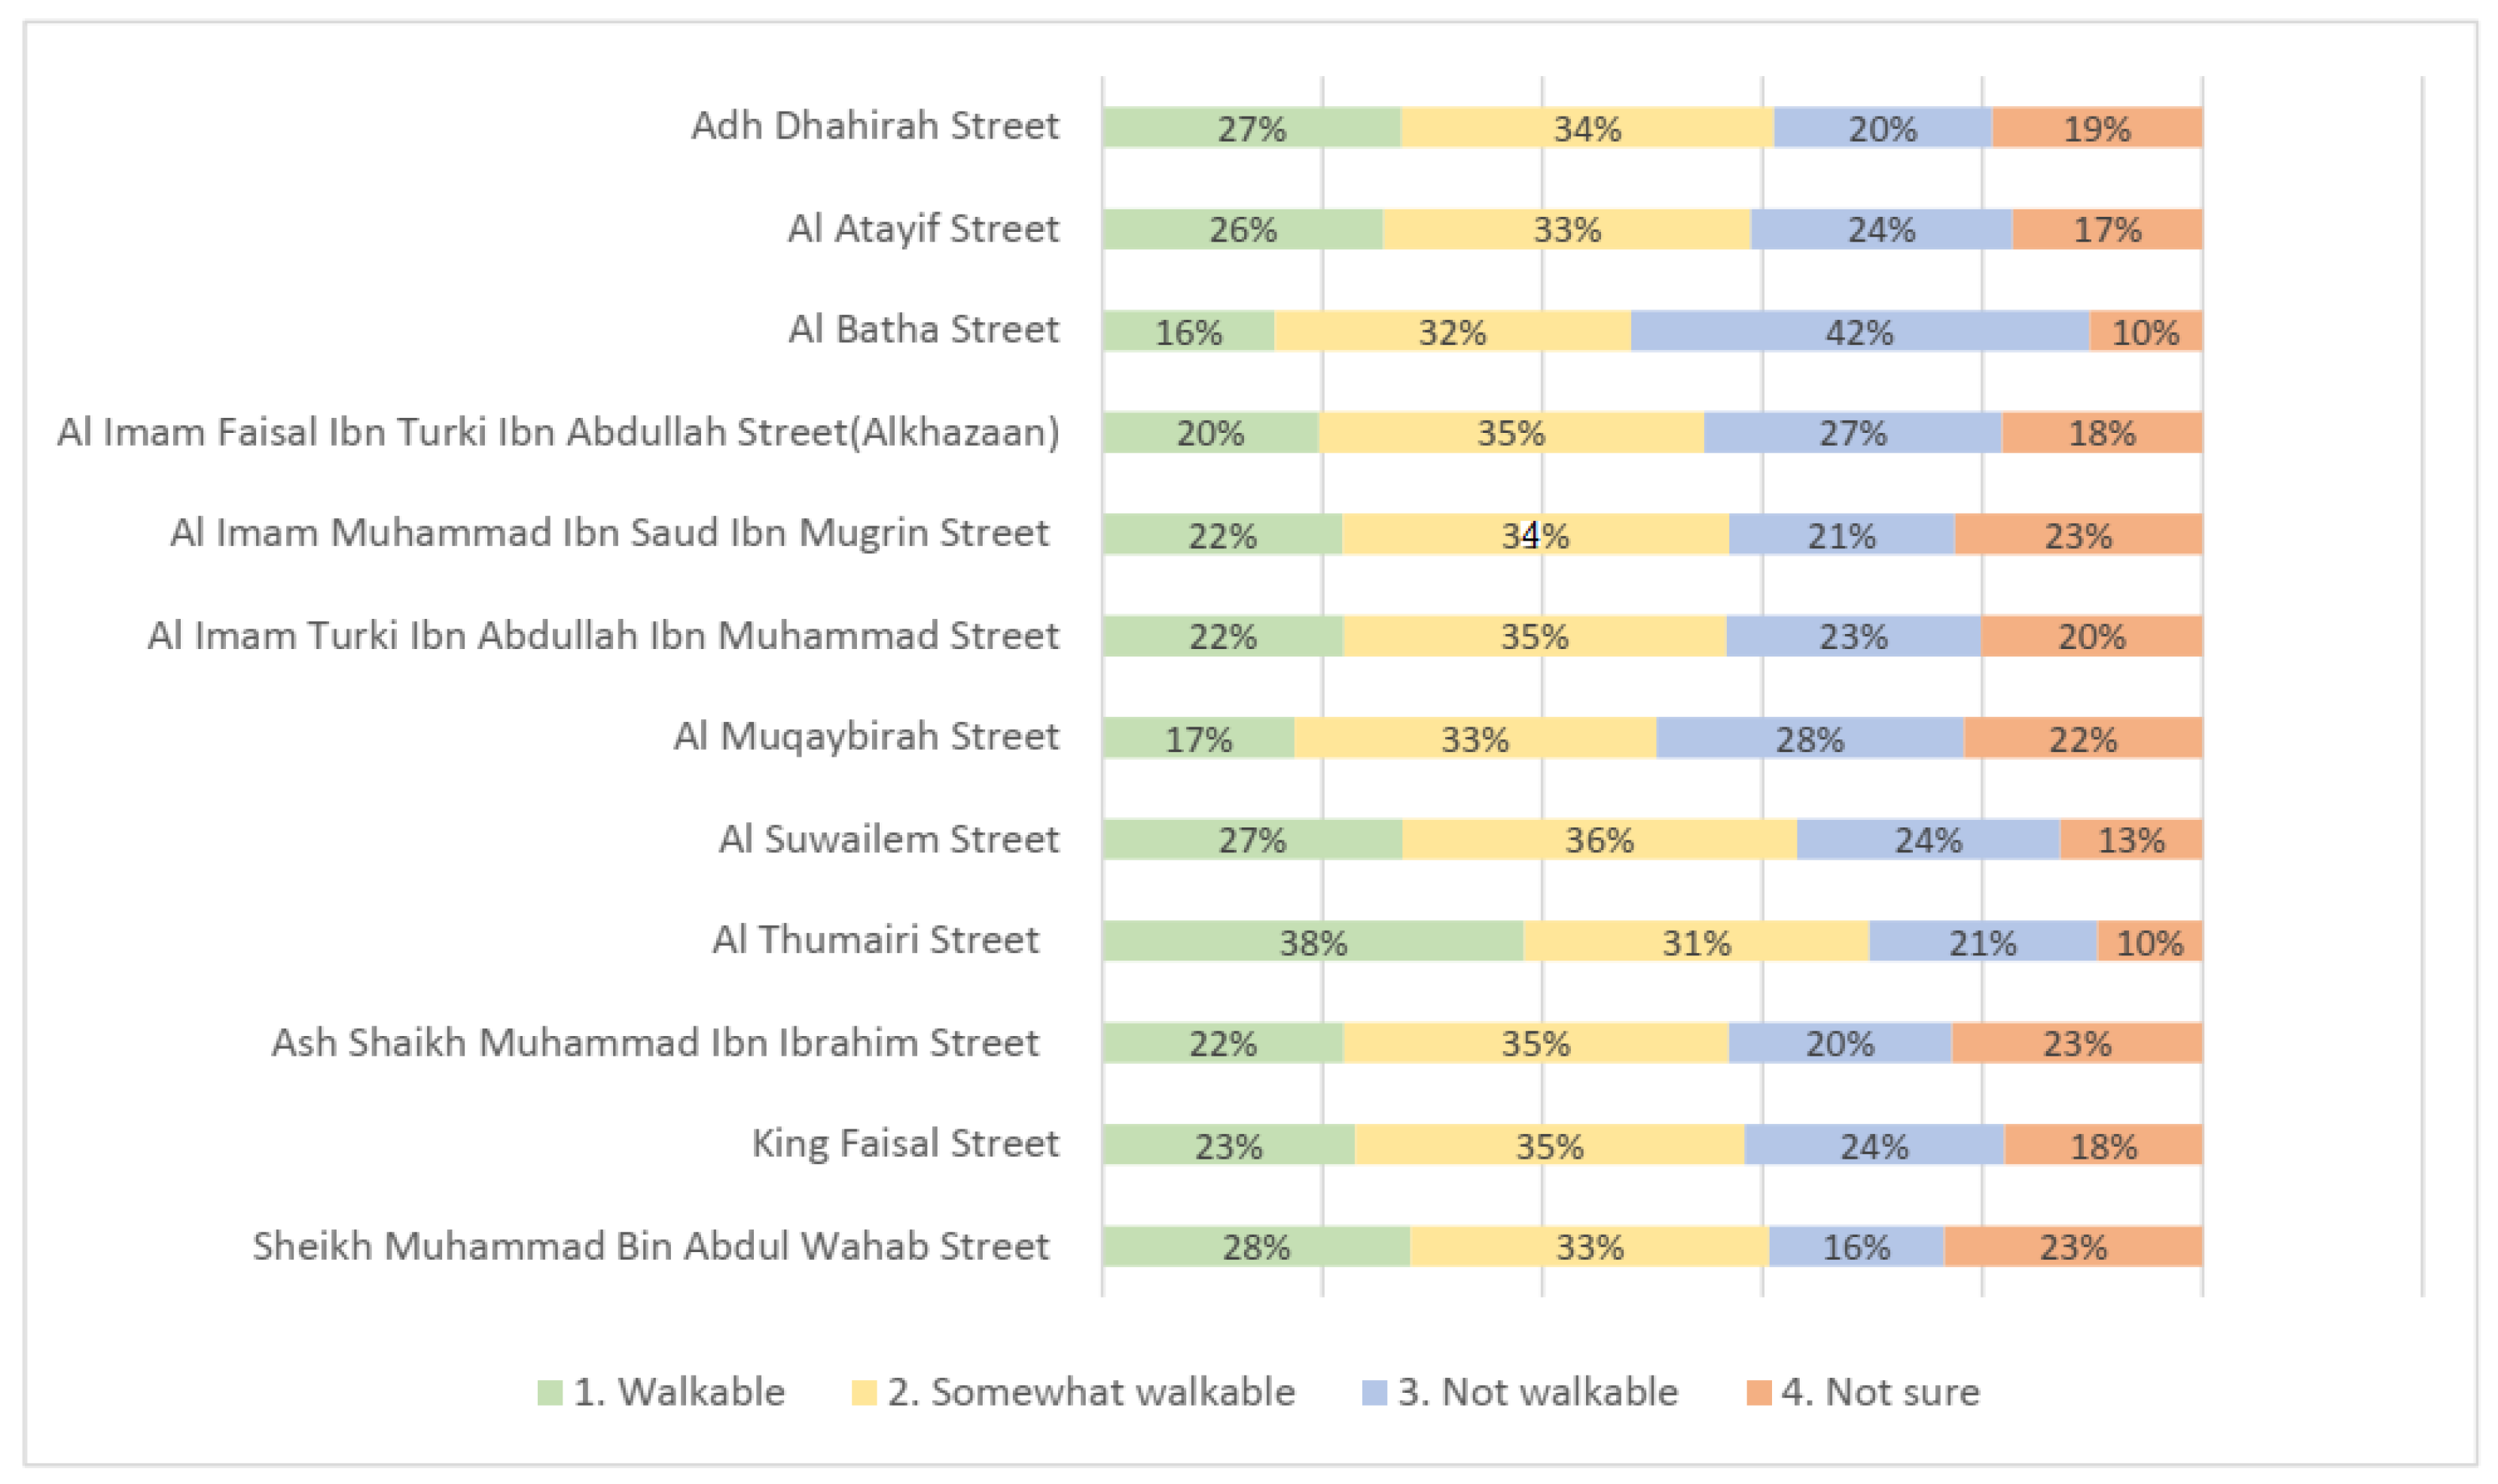
Street segment selection was based on public walkability ratings, reflecting the most and the least popular walkable streets. The six segments were selected in a purposeful way (see
Figure 2). This methodology was used to make sure that the audit tool included a diverse range of walkability conditions. Each segment used in the selection was audited and measured using all the indicators included in the CCSWAT-GCC.
To reduce the chances of temporal and environmental variation, all the raters were requested to perform the audits in the late afternoon and early evening hours when pedestrian presence is generally high in cities with hot climates as a result of the daytime thermal conditions. This was the right time, especially considering the fact that the period of data collection was the summer month of July, when the daytime temperatures were at their peak. A uniform time of data collection was useful in creating consistency in the observed pedestrian behavior and environmental conditions among all audited segments.
The demographic characteristics of respondents were also recorded to ensure sample representativeness. The sample included a diverse distribution in terms of gender, age groups, and socio-economic backgrounds. These characteristics were considered to capture variations in walkability perceptions across different population segments.
4. Analysis
To establish the level of consistency in ratings obtained through the CCSWAT-GCC, inter-rater reliability (IRR) was measured to assess the consistency of ratings given by multiple assessors. The reliability analysis was done at two levels: initially, to determine the overall reliability of the audit instrument, and secondly, to determine the level of agreement that was related to each of the walkability indicators. This two-step method allowed for a thorough analysis of the internal consistency of the tool as well as the reliability of the elements that make it up to be conducted.
The two complementary statistical measures that were used to quantify IRR were the percentage agreement and Fleiss’ kappa. The agreement, expressed as a percentage, was applied to explain the relative rating that the raters gave, which directly and intuitively measures concordance. Nevertheless, because percentage agreement lacks consideration of possible agreement by chance, Fleiss’ kappa was also used to offer a lower and stronger estimate of the reliability of categorical multi-rater data. A combination of these two measures has been found to explain variability in indicators even when raters differed slightly among themselves [
58]. The IBM SPSS Statistics (Version 28.0) was used to compute the statistics of Fleiss’ kappa.
In order to read percent agreement, read qualitative thresholds were used. The level of agreement of 75 percent or above was defined as good reliability, the range of 60–74 percent was used as moderate reliability and below 60 percent was termed as fair to poor reliability [
62]. Fleiss further interpreted the kappa values with the assistance of the classification suggested by Landis and Koch [
51], such that a value between 0.01 and 0.20 would be slight agreement, 0.21–0.40 would be fair, 0.41–0.60 would be moderate, 0.61–0.80 would be substantial, and 0.81–0.99 would be almost perfect. This interpretive framework is also frequently used in research that demonstrates the validity of walkability and pedestrian environment audit instruments [
55,
56,
63].
The statistics on IRR that emerged were then subject to these qualitative levels of agreement, as in
Table 5. This analytical framework offers a foundation for assessing the reliability and applicability of the CCSWAT-GCC in measuring walkability on the commercial streets of central locations in the GCC cities.
5. Results
The findings of the inter-rater reliability test are described in two sections to give a thorough evaluation of the CCSWAT-GCC’s performance. First, the reliability findings are given at the street-segment scale. This allows an assessment of the consistency of ratings in various commercial street settings. Second, the research provides the reliability of single items in the audit tool to measure the consistency of each indicator among raters. Such a two-level reporting system allows for the evaluation of the general strength of the tool in its application to specific streets and the validity of the indicators that compose it. The subsection below gives the results of the IRR assessment for every audited street segment.
5.1. IRR Results for Each Street Segment
The total analysis of IRR showed moderate to high consistency in the six audited street segments. The mean percentage agreement of the raters was 81.21 percent with a Fleiss’ kappa of kappa = 0.581. At the street-segment level, three out of six segments showed moderate, and the other three segments, completed by raters, showed a high degree of agreement. When the 49 audit indicators were added together in all the segments, the median of the kappa values was in the moderate agreement range.
The mean percentage agreement of the 49 indicators within each street segment, as summarized in
Table 6, ranges from 74.1% to 85.0%, with corresponding kappa values ranging from 0.453 to 0.667, indicating moderate to high interrater agreement. Al-Batha Street (Segment = 3 W) had the highest agreement (85%), and the lowest agreement (74.1%) was in Al Thumairi Street (Segment = 8 N).
5.2. IRR Results for the CCSWAT-GCC Items
Most of the CCSWAT-GCC audit items exhibited reasonable IRR as indicated by kappa values and percentage agreement, see
Table 7. These results were derived from reliability testing conducted by six raters across six commercial street segments in central Riyadh. From the audit tool’s 49 indicators, 29 received kappa values exceeding a value of 0.40, which is a moderate to substantial agreement. Indicators in this range can be for such examples as heat-resistant pavement, protection of pedestrians against the dangers of traffic accidents, pedestrian crossings, traffic calming devices, landmarks, open spaces in the city, and public toilets.
Four indicators had perfect agreement between raters and kappa values of 1.00 and 100 percent agreement. These measurements were the proximity to mosques/prayer rooms, the size of pedestrian paths, transportation amenities, and road speed. Another specificity of such indicators is that they are mostly objective; in other words, those that are associated with physical characteristics like the width of pedestrian paths and the speed of traffic. Moreover, the high consensus of access to mosques testifies to the high number of mosques in the main trade centers of Riyadh. The difference between agreement regarding some indicators can also be explained by the fact that the city was not fully developed in terms of its public transport infrastructure during the time of data collection, which affected the raters in their capacity to consistently measure some of the features that are related to public transport.
Conversely, two indicators, the security cameras (CCTV) and the perceived noise level, demonstrated low reliability, with percentage agreement below 60% and kappa values under 0.40, suggesting poor inter-rater reliability. Less reliable indicators were more prone to a higher level of subjective judgment and could have been evaluated based on the time of the day and the contextual circumstances in which audits were performed. Overall, many more subjective indicators showed a relatively lower level of reliability, such as cleanliness and maintenance of streets and paths, the supply of canopies and shelters, outdoor thermal comfort, and perceived air pollution.
Moreover, three of the indicators gave negative kappa values, implying a lower level of agreement than what chance would have demonstrated. Nonetheless, two of these indicators showed a high percentage agreement between raters, with agreement levels of 94.4 percent between streets and footpaths, and 83.3 percent in commercial zones or business activities. Low or negative kappa values do not automatically imply low observed agreement but could occur in circumstances when the ratings are highly skewed across categories. Negative kappa values, though uncommon, have been reported in prior walkability audit studies (REF) and are generally interpreted as a methodological limitation of kappa-based reliability, particularly in contexts with high agreement rates or uniformly rated items, rather than an indication of inherently unreliable measurement.
The fact that the Kappa value is negative for only a small number of indicators may be due to the impact of prevalence and bias, whereby the distribution of responses is highly skewed and affects the statistics despite high levels of agreement. This is one of the limitations of Kappa statistics and does not necessarily imply low agreement. To overcome this limitation, future applications can take into consideration complementary reliability measures.
6. Discussion
This study demonstrates that the CCSWAT-GCC is a reliable and practicable audit tool, particularly given its high number of indicators. The reliability testing conducted on commercial streets in central Riyadh provided moderate to substantial inter-rater agreement, indicating consistent application across evaluators in a real-world urban environment. These findings suggest that the CCSWAT-GCC is a robust instrument for assessing walkability in the commercial areas across GCC cities.
Several pragmatic issues were encountered during the reliability testing process, including recruiting qualified raters, conducting remote rater training, and carrying out audits under extreme summer heat in Riyadh with daytime temperatures reaching approximately 43 °C. In spite of these limitations, the implemented mitigation measures, including systematic training courses, distinct auditing policies, and field audits in the late afternoon and evening hours, were effective in providing acceptable reliability results. Such conditions represent real-world implementation challenges in the GCC cities, hence support even but not undermine the external validity of results.
Notably, the CCSWAT-GCC audit findings for the selected street segments were relatively consistent with public perceptions of walkability identified in earlier assessments presented in this paper. The fact that the results of the expert-based audit are convergent with user perceptions gives further evidence of the construct validity of the tool. To the author’s knowledge, the CCSWAT-GCC is the first walkability audit tool specifically developed and empirically validated to reflect the climatic, cultural, and functional characteristics of commercial streets in GCC cities.
Although this study focused on the development and reliability testing of the audit tool, future research could incorporate sensitivity analysis to examine the relative influence of individual indicators on overall walkability scores. Such analysis would further enhance the analytical depth and policy relevance of the tool.
The development of the CCSWAT-GCC followed a systematic, context-sensitive process. It began with a comprehensive review of the global walkability literature to identify potential indicators, followed by expert consultation to refine and localize them for GCC contexts. These were further validated through public input to establish priority weighting, ensuring alignment with local lived experiences. The final phase involved designing the audit structure, scoring system, and reliability testing processes, including rater training and detailed auditing instructions. This multi-stage approach increases the tool’s methodological rigor and supports its practical application for planners and policymakers aiming to improve walkability in GCC commercial streets.
7. Conclusions
This study successfully developed and validated the CCSWAT-GCC, addressing a critical gap in the existing walkability assessment tools, which are largely designed for non-GCC cities. The CCSWAT-GCC offers a context-sensitive, empirically grounded framework that incorporates the climatic, cultural and functional characteristics unique to Gulf region cities, offering a more relevant and reliable tool for evaluating walkability in central commercial areas.
The inter-rater reliability testing indicated moderate to substantial agreement across both street segments and individual audit indicators. Most indicators showed acceptable reliability, with the greatest concurrence on objective features. A few of the subjective indicators, such as perceived noise and CCTV presence, demonstrated lower reliability, consistent with findings from prior walkability studies, highlighting opportunities to refine operational definitions and rater training in future applications. The alignment between audits and public perceptions further supports the tool’s construct validity and its practical utility for assessing walkability in urban contexts.
While this study focused primarily on the development and reliability testing of the CCSWAT-GCC, formal validation against behavioral or health-related outcomes was beyond its scope. Future research is needed to examine the external validity of the tool by correlating walkability scores with pedestrian activity levels, modal choice, and public health indicators. Nevertheless, the alignment observed between audit results and public perception provides preliminary support for the construct validity of the tool.
In addition to its methodological contribution, the CCSWAT-GCC offers practical value for urban planners, transport professionals, and policy makers in GCC cities. It enables systematic identification of street-level walkability assets and gaps, supporting evidence-based interventions to improve pedestrian environments. As a decision-support tool, it can guide walkability-oriented urban development in alignment with broader sustainability, public health, and livability goals. Future studies could explore the tool’s applicability across diverse GCC urban typologies to assess its generalizability. Longitudinal studies may evaluate changes in walkability following urban interventions, while refinements to subjective indicators could improve sensitivity. Overall, this study established a robust foundation for context-specific walkability assessment and pedestrian-oriented planning in hot climate urban settings.
It is recommended that GCC countries consider integrating the CCSWAT-GCC into national urban development strategies and street renewal guidelines. Establishing periodic walkability audits using this tool could support continuous monitoring and improvement of pedestrian environments in rapidly evolving urban contexts.
Limitations
This study has several limitations. The inter-rater reliability test was conducted in a single city, limiting geographical generalizability. Additionally, data collection occurred during extreme summer temperatures, which may have influenced rater conditions and fieldwork feasibility.
In addition, the study is limited by the use of a single-city case (Riyadh) and a relatively small number of audited street segments, which may affect the generalizability of the findings across different GCC urban contexts. The use of non-probability sampling for the public survey may also introduce potential bias. Furthermore, variations in urban form across GCC cities suggest that further testing is required to confirm the tool’s transferability.