Article

Research on the Carbon Emissions and Costs Between Prefabricated and Traditional Cast In Situ Buildings Based on BIM


1
School of Electric Power, Civil Engineering and Architecture, Shanxi University, Taiyuan 030006, China
2
Centre for Energy (M473), The University of Western Australia, 35 Stirling Highway, Perth, WA 6009, Australia
*
Author to whom correspondence should be addressed.
Sustainability 2026, 18(12), 6174; https://doi.org/10.3390/su18126174
Submission received: 6 May 2026 / Revised: 5 June 2026 / Accepted: 6 June 2026 / Published: 16 June 2026
(This article belongs to the Section Green Building)

Abstract

An integrated building information model (BIM) was constructed based on embodied carbon emissions (CEs) and a cost assessment framework to evaluate the environmental and economic performance of prefabricated buildings (PBs) and traditional cast in situ buildings (TBs) during the materialization stage. BIMs and carbon emission factor (CEF) methods were combined to quantify material consumption, embodied CEs, and construction costs under identical building conditions. An eight-story residential shear wall structure was selected as a case study, and carbon was analyzed across different stages. Sensitivity and uncertainty analyses were incorporated to evaluate the robustness of the accounting results under different transportation, electricity emission, and regional production scenarios. The results indicated that prefabricated construction exhibited lower embodied carbon emissions and improved economic performance compared with traditional cast in situ construction. The material production stage was identified as the dominant carbon source, while electricity-related emission factors had the strongest influence on the accounting results. The proposed framework provides a transferable methodological pathway for low-carbon building assessment and sustainable decision making in prefabricated residential construction.

1. Introduction

In the 20th century, the greenhouse effect became a serious problem that now threatens human survival and development due to the rapid development of global industrialization and technology. Carbon emissions rose sharply from 14.8 Gt to 31.3 Gt, of which 63% originated from industrial activities between 1972 and 2011—a period that had a profound impact on climate change [1]. In this context, the construction sector is a major contributor to global resource depletion, accounting for 36% of global energy use and 39% of greenhouse gas emissions [2]. In China, a steady annual increase in construction-related emissions has been observed since 2017; these emissions now account for approximately half of the national total, thereby hindering the country’s ability to meet its dual-carbon targets [3]. Since the dual-carbon goals were proposed in 2020, the State Council and various ministries have successively issued a series of standards, norms, and policies to vigorously promote CE reduction in the construction industry [4]; this has become a key issue that must be solved to explore the sustainable development path of the construction industry and effectively reduce CEs [5].
PB has been widely used in recent years in China because of its significant advantages in improving construction efficiency, ensuring project quality, and enhancing cost-effectiveness [6]. According to the Ministry of Housing and Urban–Rural Development, the new construction area of PBs in China reached 740 million square meters in 2021, an increase of 18% compared to 2020, accounting for 24.5% of the country’s new construction area [7]. PB is characterized by component prefabrication and on-site assembly, unlike TB [8]. This approach can significantly reduce material waste and waste generation during on-site construction through factory-standardized production of prefabricated components. The amount of waste in formwork, plastering, and concrete engineering is significantly reduced, and the entire construction process can reduce approximately 85% of construction waste, which has great potential for carbon reduction [9]. From an international perspective, the application of PB in developed countries has matured over time. For example, the proportion of PB technology applied in new buildings is 12–16% in Japan [10], and the proportion of new PBs in Sweden is more than 80% [11]. This latter proportion exceeds the 15% seen in many developed countries [12], and the Chinese Government has also actively promoted PB development, requiring that the share of new PBs reaches 30% by 2030 to meet the dual-carbon goals.
As the core digital management technology in architecture, BIM can be applied to building foundation design and project management at all stages, providing data support for accurate analysis and quantitative calculation of building CEs [13]. By constructing a parametric digital model of a building, the foundation can be laid for specialized analyses, such as component-level deepening design, material selection, energy consumption simulation, and cost accounting [14]. In a BIM, the building’s functional attributes and structural characteristics are integrated to form a digital carrier for visual presentation, interdisciplinary collaboration, construction process simulation analysis, and low-carbon scheme optimization design [15].
In recent years, BIM technology has also been widely applied to energy consumption analysis and environmental performance evaluation during the construction and materialization stages of buildings [16]. It can be simulated and quantitatively evaluated for the energy consumption generated during on-site construction by integrating material characteristics, equipment operating parameters, transportation information, and construction process data into BIMs [17]. Compared with traditional estimation approaches, BIM-based analysis enables more accurate identification of energy-intensive processes and major CE sources during the materialization stage [18].
In the field of PB, the application value of BIM technology is particularly prominent. Researchers can quickly obtain specific information, such as component specification parameters and material consumption of PBs in the modeling stage, and extract accurate estimates of engineering quantities and the CE-related data from the model according to the project stage and model complexity using BIM technology [19]. In particular, the deep integration of BIM and computer simulation technologies provides technical support for the quantitative assessment of the carbon footprint of PB [20].

2. Literature Review

2.1. Research Status of Building Carbon Emissions (CEs)

The measurement range of building lifecycle CEs is extensive, covering emissions from various stages, including the production, transportation, construction, operation, demolition, and recycling stages of building materials [21]. Zhang et al. categorized the building lifecycle into three main stages: materialization, operation, and demolition [22]. The materialization stage specifically includes the three phases of material production, transportation, and on-site construction.
Both domestic and international researchers have conducted extensive research on the construction of CEs. Lu M et al. [23] investigated the calculation of embodied CEs in buildings using a ‘design-oriented‘ method throughout the entire architectural design process. They concluded that different design stages require corresponding calculation methods to achieve accurate emission reduction. Xu H et al. [24] examined the CEs of a three-story prefabricated teaching building in China by applying an improved lifecycle assessment (LCA) framework. This study examined various factors, including load rates, human energy consumption, and construction delays. It was found that CEs during the production stage accounted for 85% of the total emissions. While transportation and construction CEs are significant, the primary sources of CEs are raw materials and machinery. Myint N N et al. [25] quantified the embodied CEs of a residential building in Myanmar during the material production and transportation stages using the material quantification and CE factor methods in BIM. The study concluded that low-carbon materials could reduce the embodied carbon of materials by 40% and transportation CEs by 39%. In this case, material embodied carbon accounted for 84% of the total, while transportation accounted for 16%; Gao H et al. [26] evaluated data from 57 residential buildings in Xi’an City to characterize the lifecycle CEs in cold regions. Their analysis revealed that innovation reduces the CEs generated by heating, cooling, ventilation, and lighting in the operation stage, while the CEs related to material mining, manufacturing, transportation, construction, maintenance, and demolition in the materialization stage have been increasing, and the materialization stage has a higher CE potential reduction than the building operation and maintenance stage.

2.2. Research Status of Building Information Modelling (BIM)

BIM is a digital model that extends 3D geometric data into multidimensional information [27]. As a data repository, it integrates various information related to building geometry, spatial relationships, material lists, geographic information, and project schedules [28]. BIM can provide comprehensive, reliable, and easily accessible information and clarify the responsibilities and obligations for stakeholders [29]. It can be used throughout the design and project stages of the building lifecycle [30]. The data provided by BIM support analysis of the structure, materials, energy, cost, and especially the calculation and analysis of energy consumption and CEs [31].
Researchers at home and abroad have studied BIMs for building CEs. Arenas N F et al. [32] conducted a systematic literature review of BIM applications, examining negative impacts and mitigation measures, particularly in infrastructure construction. Existing digital tools are helpful for developing low-carbon technologies. Sun H et al. [33] used the automatic calculation function of BIM to calculate the CEs of tunnel materials and main equipment, providing a case reference and guidance for low-carbon measurement studies. Huang Z et al. [34] developed a refined BIM-based method for calculating CEs in PB field construction. Using the construction process as the functional unit and a preset CE factor database, they conducted field verification on a multi-story steel-framed building in the north to support low-carbon optimization of the construction scheme. Heydari M H et al. [35] proposed and evaluated a BIM-based framework using Revit and Dynamo to study embodied carbon across the whole lifecycle of buildings and the CEs during the operational stage. Applied to the case study, the framework reduced CEs by an average of 24.92%.

2.3. Research Gaps and Contributions

Although extensive studies have examined building CEs and BIM-based assessment methods, several limitations remain in existing research. Most previous studies have focused on PBs or TBs separately, whereas comparative analyses using the same building prototype are rare. Consequently, the comparability and reliability of existing findings have often been limited by differences in building functions, structural systems, geographical locations, and prefabrication rates.
In addition, embodied CEs and construction costs during the materialization stage have seldom been evaluated within an integrated analytical framework. Although BIM technology has been widely applied in engineering quantity extraction, lifecycle management, and CE estimation, its integration with CEF methods and cost estimation platforms remains underdeveloped. Moreover, the relationships among material consumption, transportation organization, construction processes, CEs, and economic performance have not been systematically clarified in previous studies.
To address these research gaps, a BIM-integrated CE and cost assessment framework was established in this study to enable comparative analysis of PBs and TBs during the materialization stage under identical building conditions. Compared with existing BIM-carbon assessment studies, the methodological advancement of this research is mainly reflected in three aspects:
(1)
Identical architectural functions, structural systems, and engineering conditions were adopted for both prefabricated and cast in situ construction scenarios, thereby effectively reducing the interference caused by external variables and improving the reliability and comparability of the assessment results.
(2)
BIM technology, CEF methodology, and cost estimation approaches were integrated within a unified analytical framework, enabling the coordinated quantitative evaluation of embodied CEs and construction costs during the materialization stage.
(3)
CE characteristics associated with material production, transportation, and on-site construction stages were systematically identified and comparatively analyzed, allowing dominant emission sources and key influencing mechanisms to be quantitatively clarified.
Overall, the proposed framework improves the systematic integration and comparability of BIM-based embodied carbon assessments and provides methodological support for low-carbon building design, prefabricated construction management, and sustainable decision making in the construction industry. Therefore, this study conducted quantitative calculations and comparative analyses of CEs and construction costs during the materialization stage, under both prefabricated and cast in situ construction conditions for the same building, using BIM models and the CEF methodology. This paper is organized as follows: In Section 2, there is a literature review on building carbon emissions and BIM models. In Section 3, a model for carbon emissions and costs in buildings is established. In Section 4, the analysis of the carbon in different stages, sensitivity, and uncertainty is discussed. Finally, the findings and future research directions are presented in the Conclusion.

3. Establishment of a Model on Carbon Emissions and Costs in Buildings

3.1. Carbon Emission Factor (CEF)

The CEF refers to coefficients for energy consumption, material consumption, and carbon dioxide emissions, which quantify the CEs of activities at different stages of building development [36]. According to the different sources of CEs, CEFs can be divided into four types: energy, building materials, transportation, and others. This study summarizes the Building Carbon Emission Calculation Standard (GB/T 51366-2019) [37] and currently published papers [38] and sorts the required CE factor data, as shown in Table 1. Considering the actual construction conditions of the selected case project, electricity and diesel were identified as the dominant energy consumption sources during the materialization stage and were, therefore, incorporated into the CE accounting boundary.

3.2. Calculation of Carbon Emission

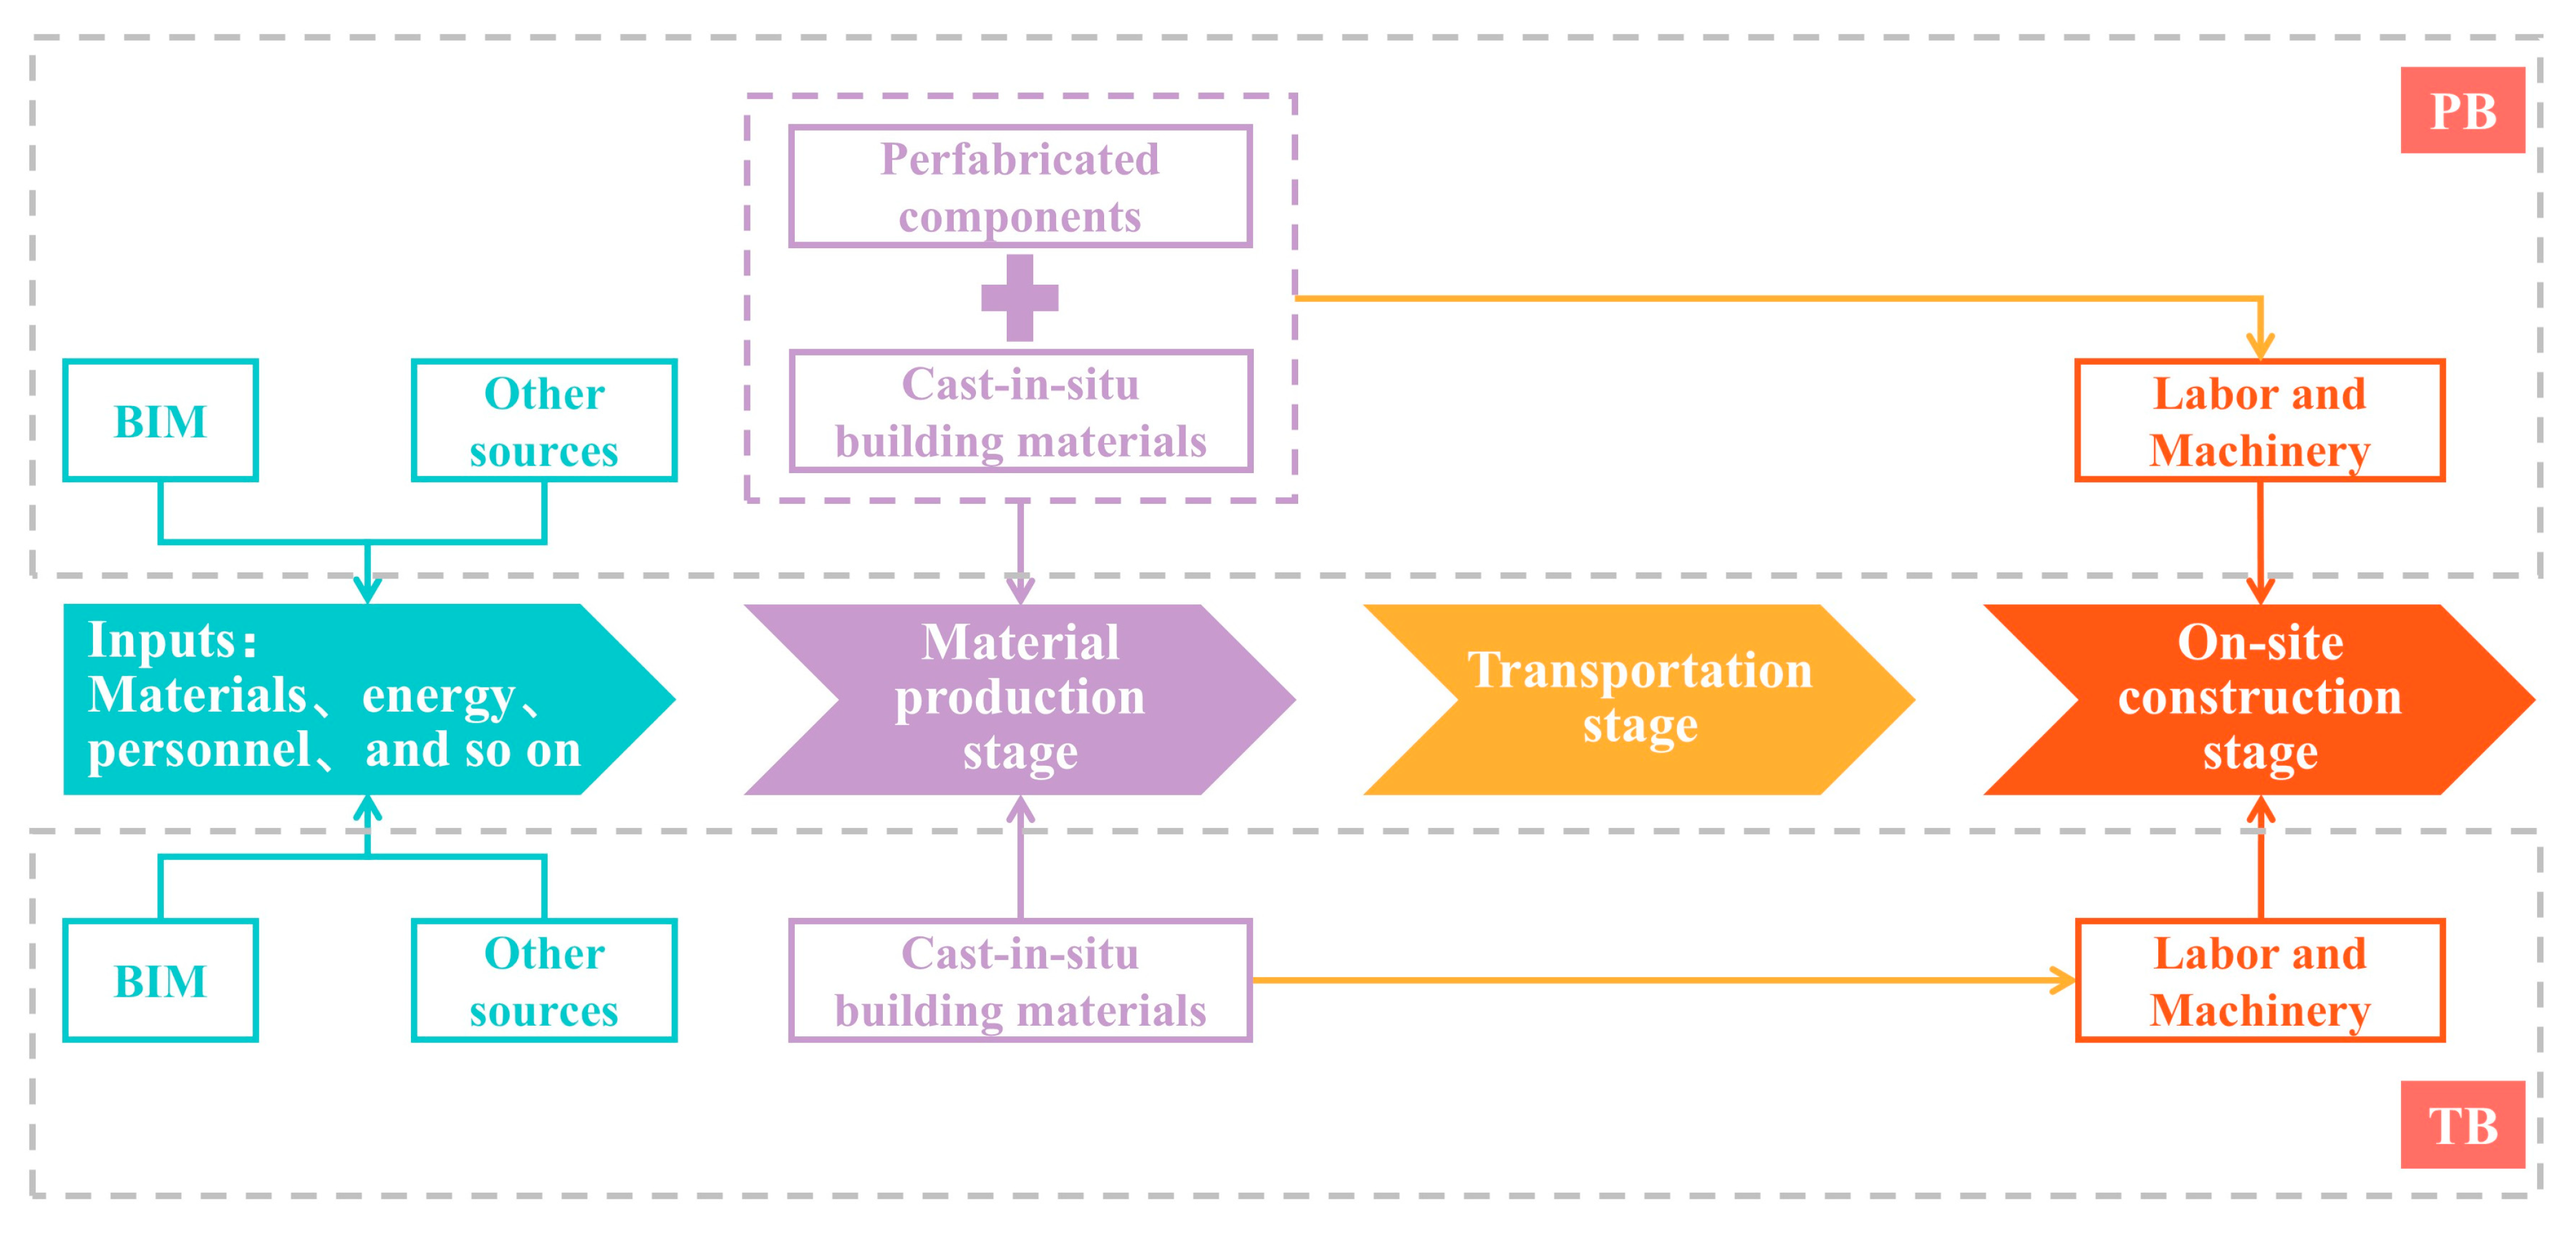
According to the division standard for the building time boundary, the materialization stage is divided into three main stages: material production, transportation, and on-site construction (Figure 1). The material production stage includes the component production stage, and the transportation stage includes the component transportation stage. The main sources of CEs in each stage were analyzed, and the corresponding calculation model was established. The calculation formula for CEs in the materialization stage is as follows:
C t o t a l = C M + C T + C C
where Ctotal is the total amount of CEs in the materialization stage, CM is the CEs in the material production stage, CT is the CEs in the transportation stage, and CC is the CEs in the on-site construction stage.

3.2.1. Calculation of Carbon Emissions in the Material Production Stage

CEs in the material production stage are generated by the production of raw building materials [39]. Currently, building materials include cast in situ building materials and prefabricated components [40]. In this study, the subscripts T and P were used to distinguish between TB and PB, respectively. Among them, the CEs of TB in the building material production stage are CMT, while the CEs of PB are CMP. In this study, it was calculated using the following formula:
C M T = i = 1 n M T i × E T i
where CMT is the CEs in the material production stage for TB, MTi is the number of building materials of type i, and ETi is the CEF of the ith building material.
C M P = C M P 1 + C M P 2
C M P 1 = i = 1 n M P i × E P i
C M P 2 = i = 1 n P P i × E P s c , i × E F P i
where CMP is the CEs in the material production stage for PB; CMP1 is the CEs for PB cast in situ materials; CMP2 is the CEs for PB components; MPi is the number or amount of building materials of type i; EPi is the CEF of the ith building material; PPi is the number or amount of components of type i; EPsc,i is the energy consumption of the ith component per unit volume of production; and EFPi is the CEF of the ith energy.

3.2.2. Calculation of Carbon Emissions in the Transportation Stage

The transportation stage involves moving construction materials from the material processing plant to the construction site. For PB, the transportation of prefabricated components is included in this stage [41]. The CEs generated during the transportation of building materials are mainly determined by energy consumption, including transportation type, transportation distance, and equipment type. The calculation formula is as follows:
C T T = i = 1 n M T i × L T i × E T i V
where CTT is the CEs in the transportation stage for TB; MTi is the number or amount of building materials of type i; LTi is the average transportation distance of the ith building material; ETiV is the CEF of the vehicle used to transport building material i.
C T P = C T P 1 + C T P 2
C T P 1 = i = 1 n M P i × L P i × E P i V
C T P 2 = j = 1 n i = 1 m ( L P i , j × G P i ) × E P i
where CTP is the CEs in the transportation stage for PB; CTP1 is the CEs of the transportation of building materials for PB; CTP2 is the CEs of components transportation for PB; MPi is the number or amount of building materials of type i; LPi is the average transportation distance of the ith building material; EPiV is the CEF of the vehicle used for transporting the building material i; GPi is the number or amount of components of type i; EPi is the CEF of the ith component; LPi,j is the average transportation distance of the ith component under the jth transportation mode.

3.2.3. Calculation of Carbon Emissions in the On-Site Construction Stage

During the construction of the cast in situ part, the CEs mainly originate from the mechanical operations at the construction site and the work of the workers there [42]. The calculation formula is as follows:
C C = i = 1 n Q C i × E F i + Q r × F r
where CC is the CEs of PB or TB in the on-site construction stage; QCi is the shifts in the ith type of machinery (mechanical shift) in the on-site construction stage; EFi is the CEF of the ith type of machinery; Qr is labor days (workday); and Fr is the labor CEF.

3.3. Development of the Building Cost Estimation Model

The cost during the materialization stage primarily comprises three aspects. Production costs are the expenditures associated with manufacturing building materials, and for prefabricated components, these are the costs of factory production. Transportation costs cover the expenses of delivering building materials to the construction site. For prefabricated elements, these costs include transportation from the factory to the site after production and curing are complete. Construction costs are the expenses incurred by on-site workers performing construction and installation activities in accordance with the project’s construction plans and specifications [43].
To ensure consistency and comparability between PBs and TBs, a unified accounting methodology and consistent pricing basis were adopted for cost assessment during the materialization stage. The construction cost evaluation was conducted using fixed pricing standards and market price information with the same calculation period for both PBs and TBs. By applying a standardized pricing boundary, the influence of short-term market price fluctuations on the comparison could be effectively reduced, thereby allowing differences in construction modes, material consumption, and construction organization to be more accurately identified. Under this accounting framework, identical cost composition structures were adopted for both PBs and TBs, and the detailed cost components are presented in Table 2.
In this study, the cost estimation for the materialization stage was conducted using the Glodon Cloud Costing Platform (GCCP 6.0). First, the bill of quantities exported from Glodon modeling software was imported into the costing platform. Pricing was then performed in accordance with the Code of Bills of Quantities and Valuation for Construction Works (GB 50500-2024) [44] for valuation and with the 2018 edition of the Chongqing Valuation Quota for Building and Decoration Works for the quota. The applied rates were set at 10.32% for statutory charges, 9% for value-added tax and 12% for surtaxes.

3.4. The Model Assembly

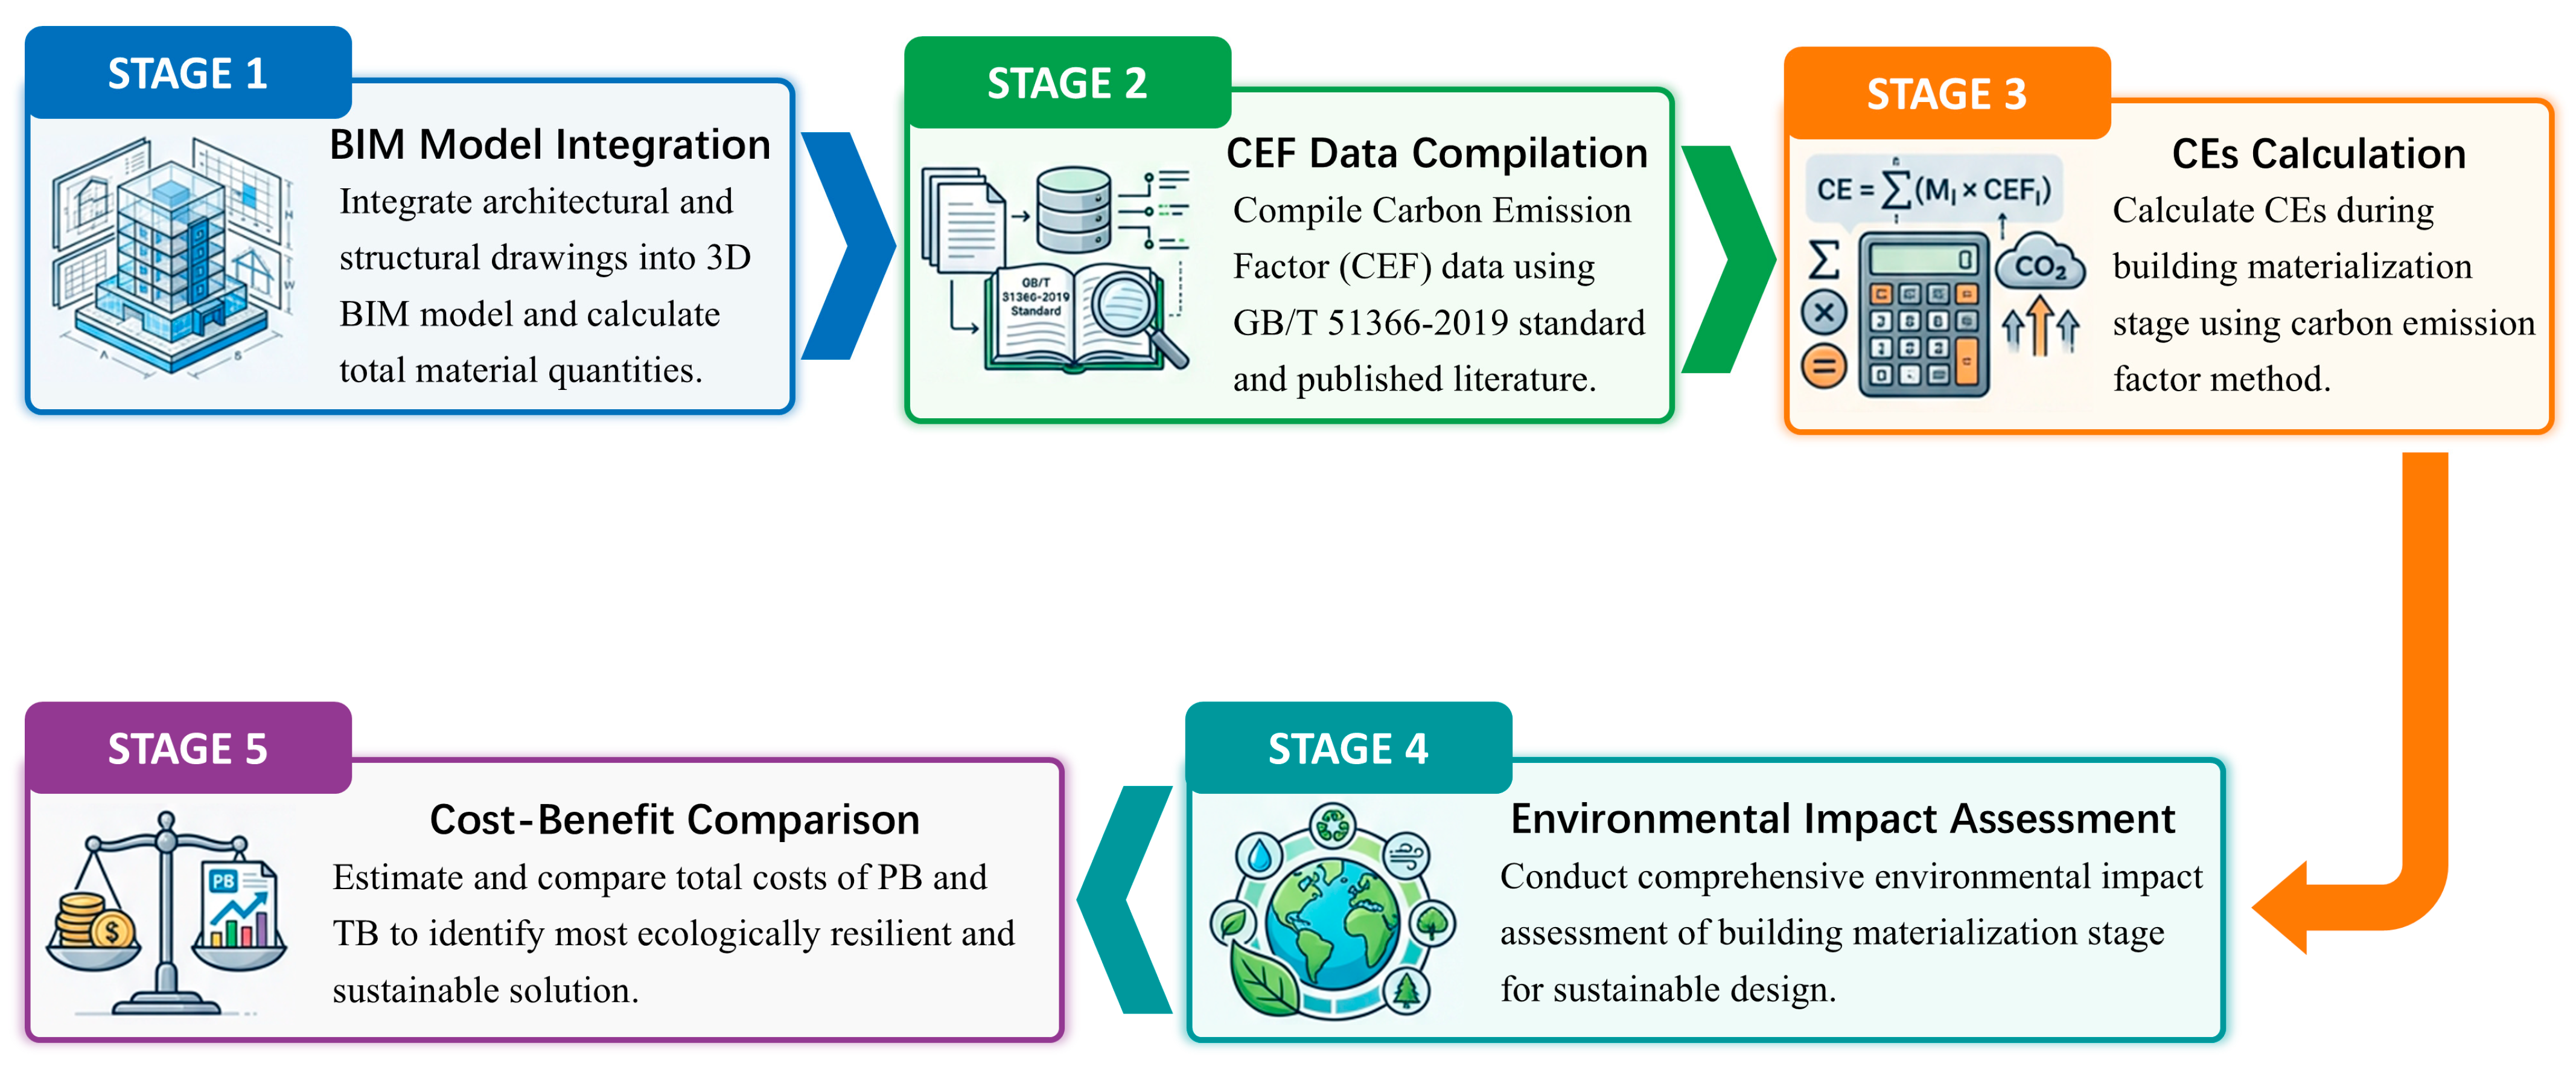
This study evaluated the embodied CEs of PBs during the materialization stage and compared with them those of TBs. Since the CEs at each stage were calculated based on precise quantification of building materials, accurate extraction of material quantities was considered a prerequisite for embodied carbon assessment during the materialization stage [45]. To ensure the reliability and systematic integration of the proposed assessment framework, the model construction and analytical process were implemented in five stages, as illustrated below.
Based on the architectural and structural drawings, detailed 3D BIM models of both PB and TB were established. Through parametric modeling and digital information integration, engineering quantities, component specifications, material consumption data, and construction information were accurately extracted. The BIM models served as the core data platform for subsequent CE and cost calculations.
The required CEF database was systematically compiled in accordance with the Building Carbon Emissions Calculation Standard (GB/T 51366-2019) [37] and validated against the literature. The CE accounting boundary included the material production, transportation, and on-site construction stages. Electricity and diesel were identified as the dominant energy consumption sources during the materialization stage and were incorporated into the accounting framework.
A CE calculation model based on the CEF methodology was established. BIM-derived engineering quantities were integrated with material, transportation, and energy-related CEFs to calculate the embodied CEs generated at each stage of the materialization process. The model included material production emissions, transportation emissions, and construction equipment operation emissions.
A comprehensive environmental impact assessment was conducted to compare the CE characteristics of PBs and TBs during the materialization stage. The quantitative analysis identified the dominant emission sources, critical materials, and major energy consumption processes, thereby providing scientific support for low-carbon optimization and sustainable construction decision making.
A cost assessment framework was established based on unified pricing standards and calculation boundaries. Production, transportation, and on-site construction costs were calculated for both PBs and TBs systematically. By integrating BIM with cost analysis, the environmental and economic performance of the two construction modes was compared to identify a more sustainable and low-carbon construction solution comprehensively.
By integrating BIM, CEF approach and cost estimation, a systematic assessment framework was established. The proposed framework enables coordinated evaluation of CEs and construction costs during the materialization stage and provides practical support for sustainable building design and prefabricated construction management. The workflow of the research methodology is illustrated in Figure 2.

4. Case Study

4.1. Description of the Building

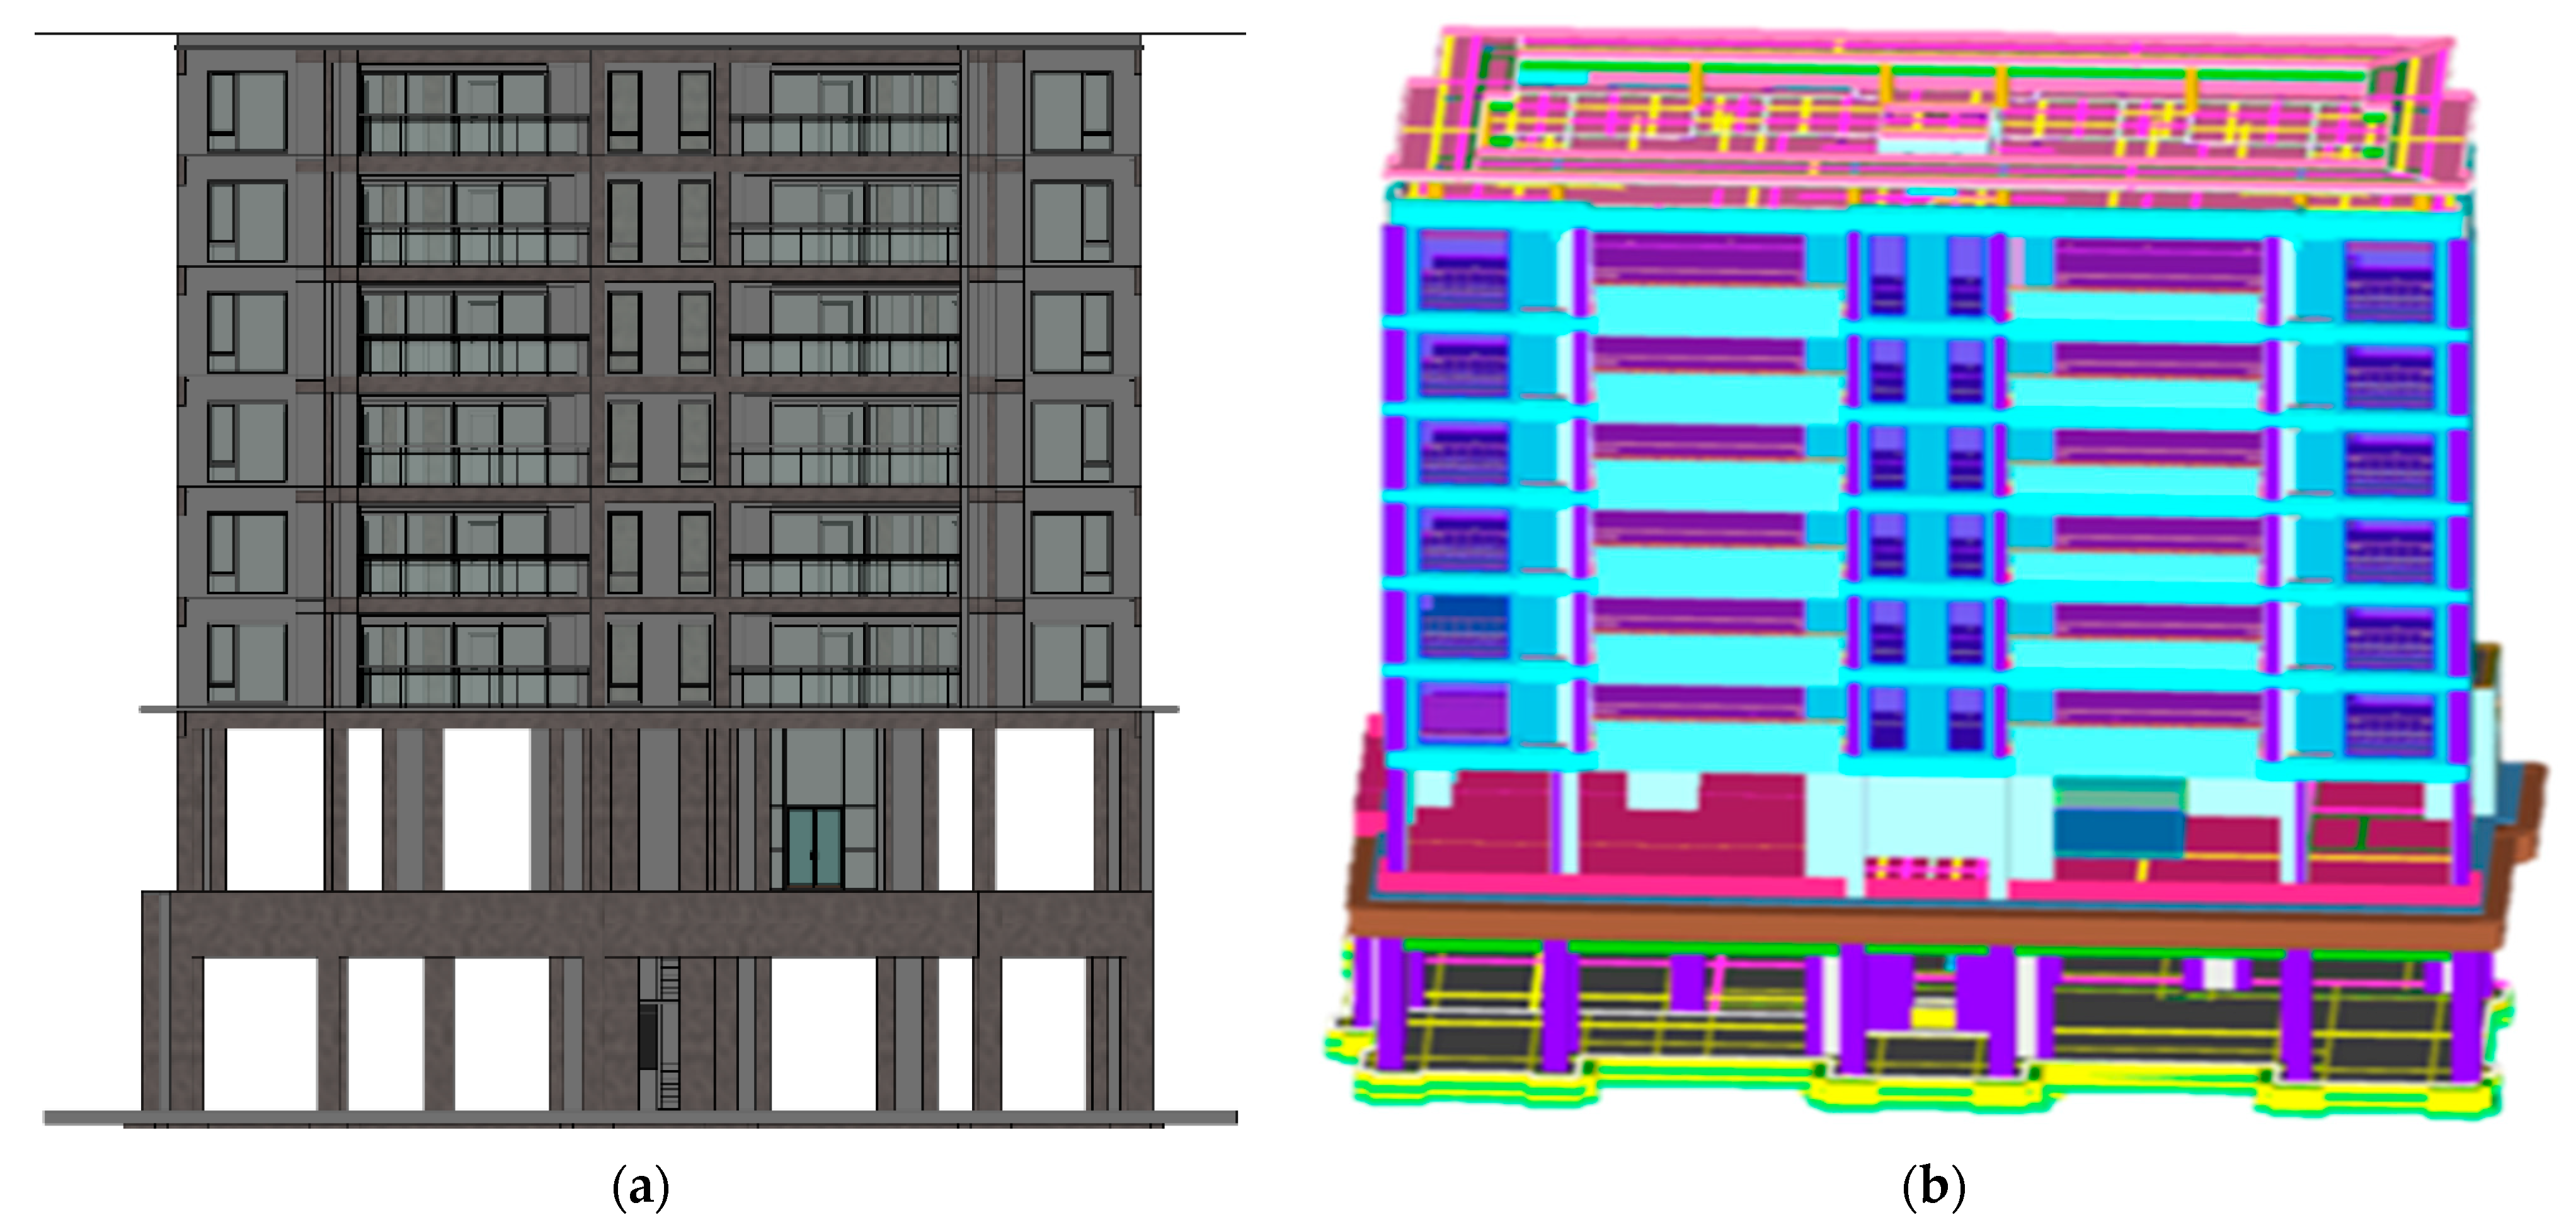
It is an eight-story residential structure with a shear wall structural system. The building has a total height of 26.00 m, eight above-ground floors and one underground level, with a total floor area of 1831.62 m2. The typical story height is 3 m. Its prefabrication ratio is 37.6%, and the prefabricated components include composite slabs, prefabricated staircases, and ALC slabs. Because of its moderate structural complexity, standardized residential layout, and typical prefabricated construction characteristics, the project was considered representative of medium-rise residential buildings commonly developed in China. Complete engineering data were available for BIM modeling, CE accounting, and cost estimation. The BIM model of the case building and the building structure calculation diagram are presented in Figure 3.

4.2. Extraction of the Building Materials

To accurately determine the amount of building materials, BIM tools can be used to obtain a detailed list of construction quantities. The inventory mainly contains important properties such as the volume, area, and type of various materials, which provide data support for subsequent CE calculations of buildings [46]. The specific amounts of building materials extracted from the BIM model are listed in Table 3.

4.3. Analysis of Carbon Emissions

4.3.1. Material Production Stage

The CE data for the building material production stage were primarily derived from the material quantity list exported from the BIM model and calculated using Equations (2)–(5), with detailed results presented in Table 4. The calculations indicate that the main CE drivers in this stage are concrete and steel reinforcements. For the PB, the corresponding emissions are 490,767.90 kg CO2 and 409,757.40 kg CO2, respectively, while for the TB, they are 590,536.90 kg CO2 and 487,702.80 kg CO2, respectively. Other materials, including masonry blocks, cement, and aluminum alloy windows and doors, also contributed to emissions, and the distribution of CEs among building materials showed significant variation.

4.3.2. Transportation Stage

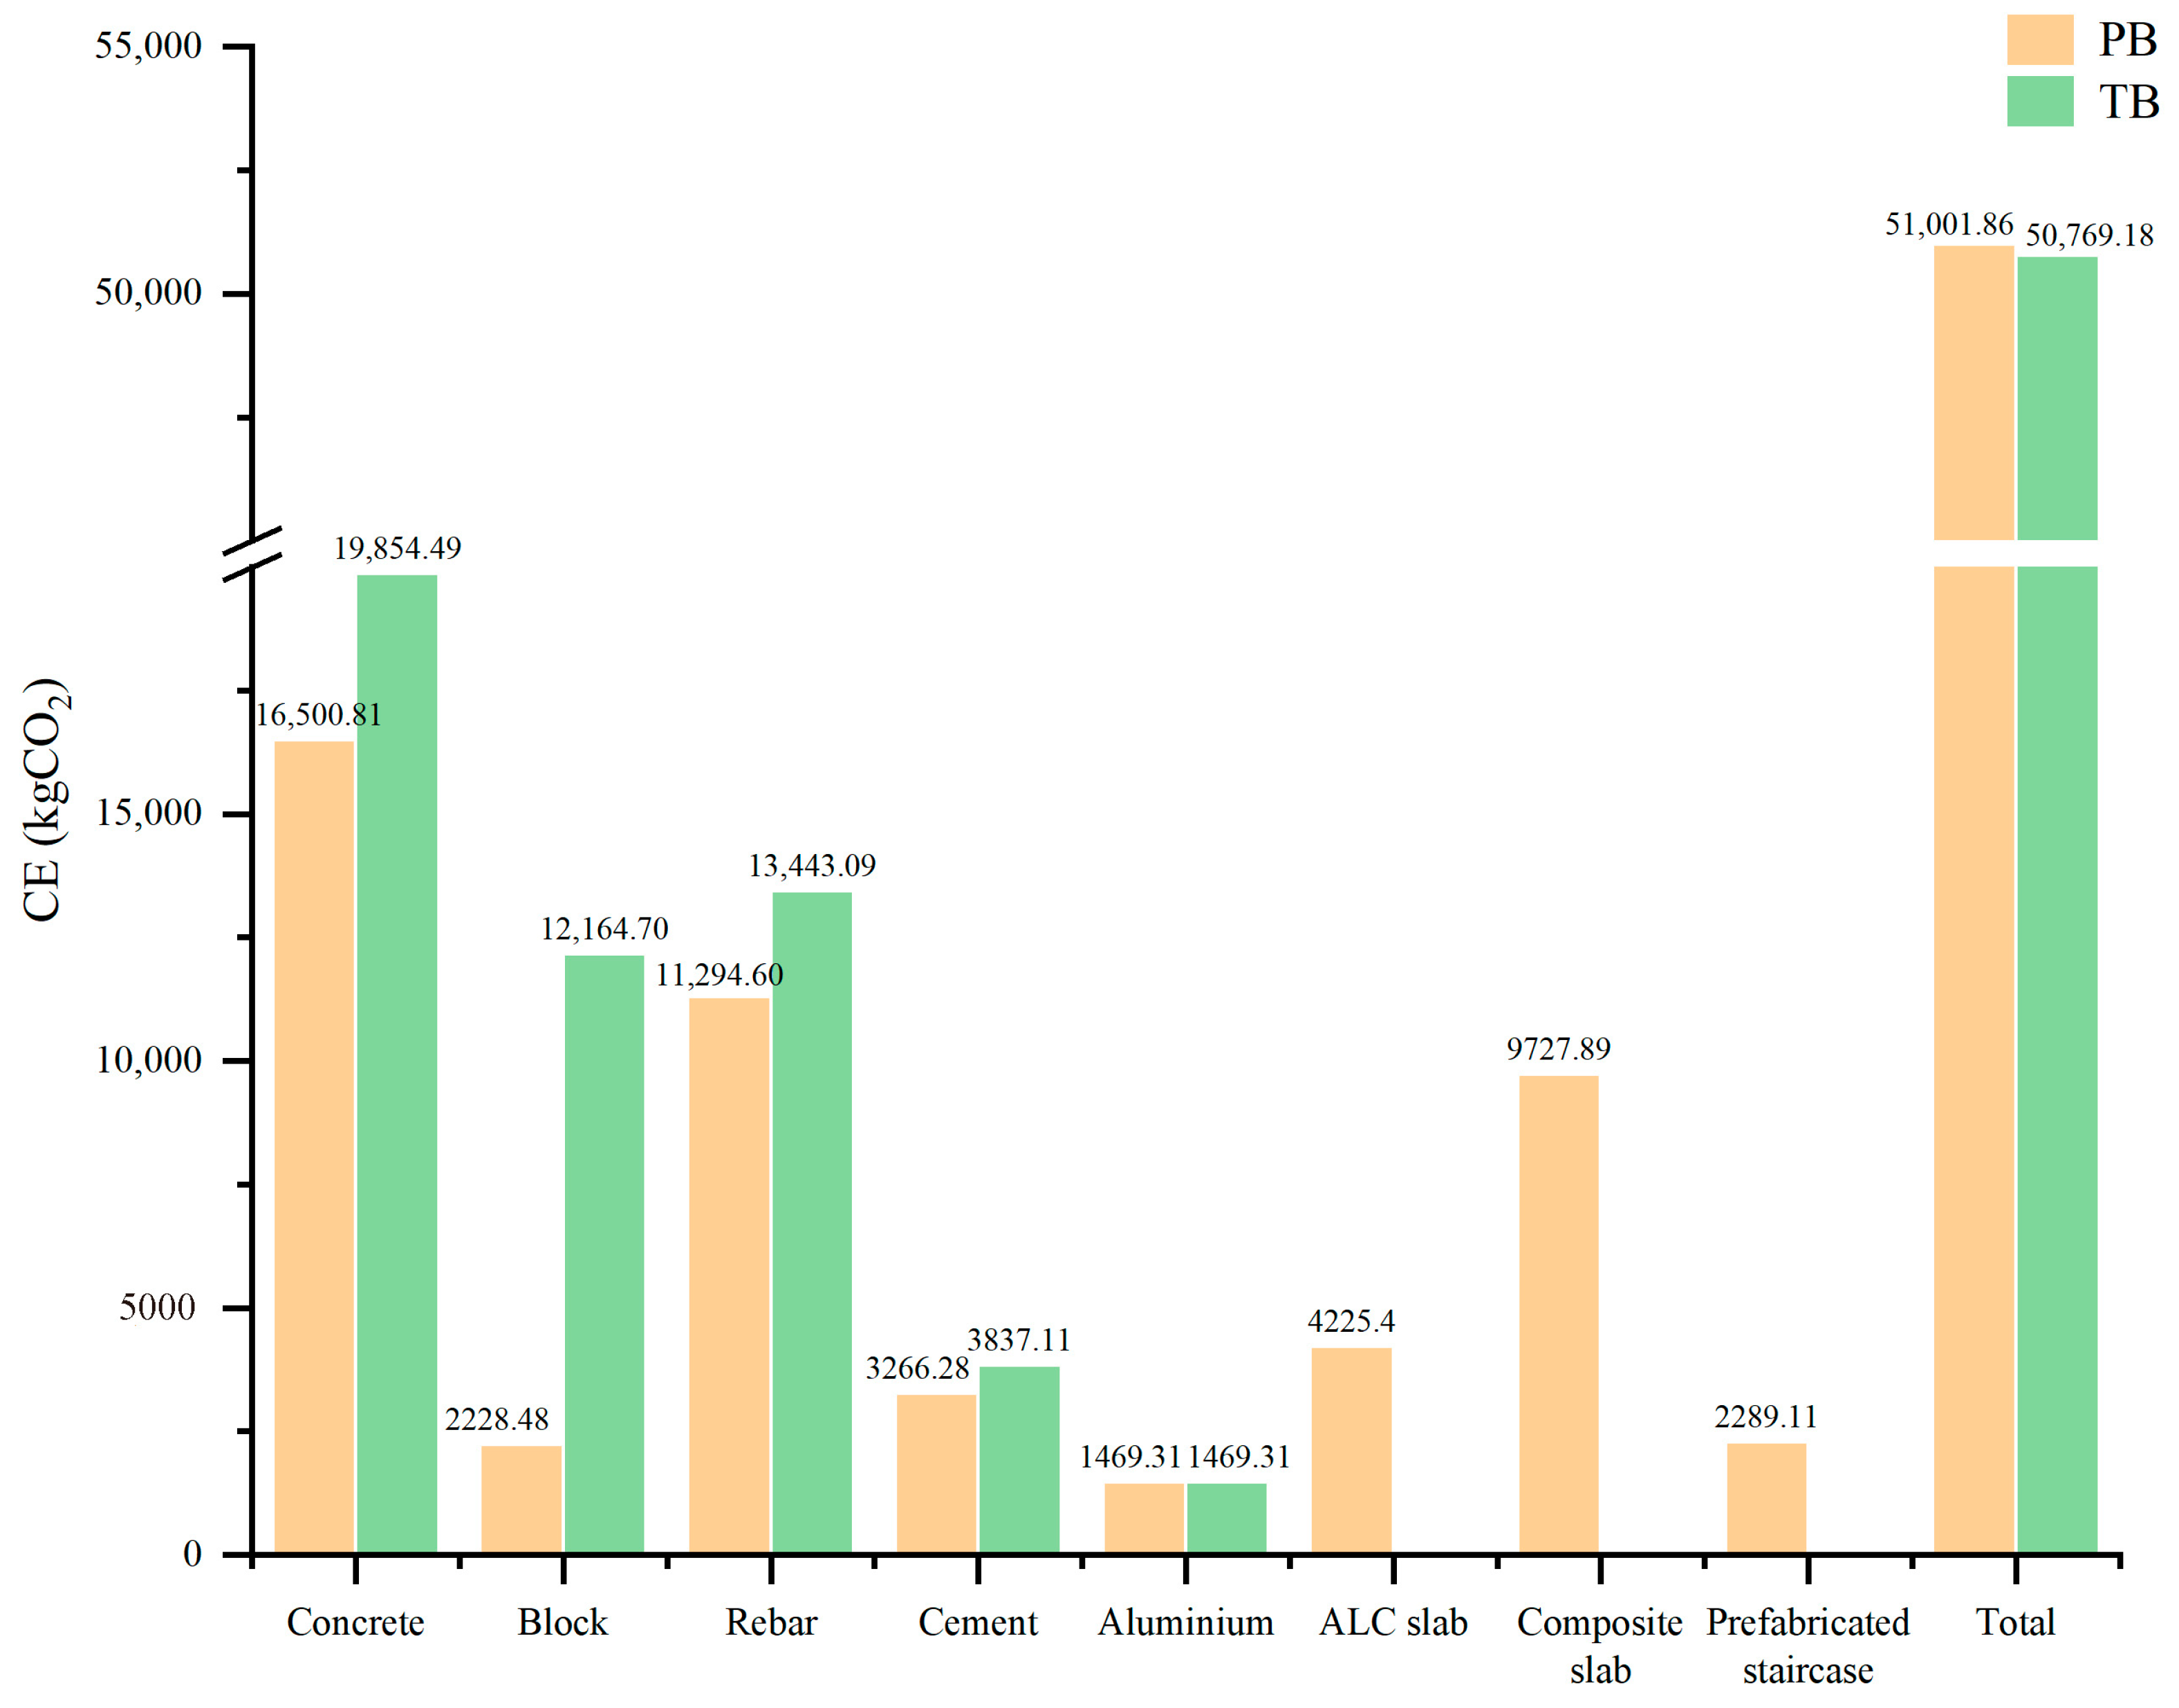
For the CE accounting in the building material transportation stage, this study uniformly adopted heavy-duty gasoline and diesel trucks. Transportation distances were set according to the Building Carbon Emissions Calculation Standard (GB/T 51366-2019) [37], with 40 km for concrete and 500 km for other materials. These assumptions were further based on regional material supply characteristics and engineering practice in Chongqing. Owing to the limited setting time and delivery requirements of ready-mixed concrete, concrete materials are generally supplied by local commercial batching plants in urban districts and adjacent suburban areas. Therefore, 40 km was considered representative of the average delivery radius under typical local construction conditions. By contrast, materials, such as steel reinforcement, cement, aluminum products, and prefabricated components, are commonly transported through medium- to long-distance regional supply chains because manufacturing enterprises are unevenly distributed in western China. Consequently, 500 km was adopted for other construction materials to reflect practical logistics and procurement conditions in Chongqing. The transportation CEs for each material were calculated using Equations (6)–(9), and the detailed results are presented in Table 5. In the PB, transportation emissions for precast composite slabs and concrete were relatively high, at 9727.89 kg CO2 and 16,500.81 kg CO2, respectively. In contrast, for the TB, transportation emissions for concrete and steel reinforcement were most prominent at 19,854.97 kgCO2 and 13,443.09 kgCO2, respectively.

4.3.3. On-Site Construction Stage

For the CEs accounting for the on-site construction stage, the quantities of labor and construction machinery inventory were determined from foundational data, such as component parameters and construction process logic exported from the BIM model, together with field survey information. This ensured the systematicness and accuracy of the data sources. Emissions at this stage were calculated using Equation (10), which accounts for the energy consumption of labor operations and the fuel consumption of construction machinery, thereby providing a holistic reflection of the CE levels associated with on-site construction activities.
The calculation results show that the CEs during the on-site construction stage are 36,787.90 kg CO2 for the PB (Table 6) and 37,531.93 kg CO2 for the TB (Table 7). The slightly lower emissions from the PB primarily stem from its reduced volume of on-site work and higher degree of construction integration, which improve machinery utilization efficiency and lower the carbon intensity per unit of construction activity.

5. Discussion

5.1. Analysis of Carbon Emissions in the Material Production Stage

The CEs generated were systematically compared between PBs and TBs during the material production stage. Previous research conducted by Sun et al. [47] demonstrated that CEs during the material production stage could be reduced by approximately 15.8% through the adoption of prefabricated construction. In the present study, a relatively low reduction rate was observed, mainly due to the lower prefabrication rate adopted in the case project.
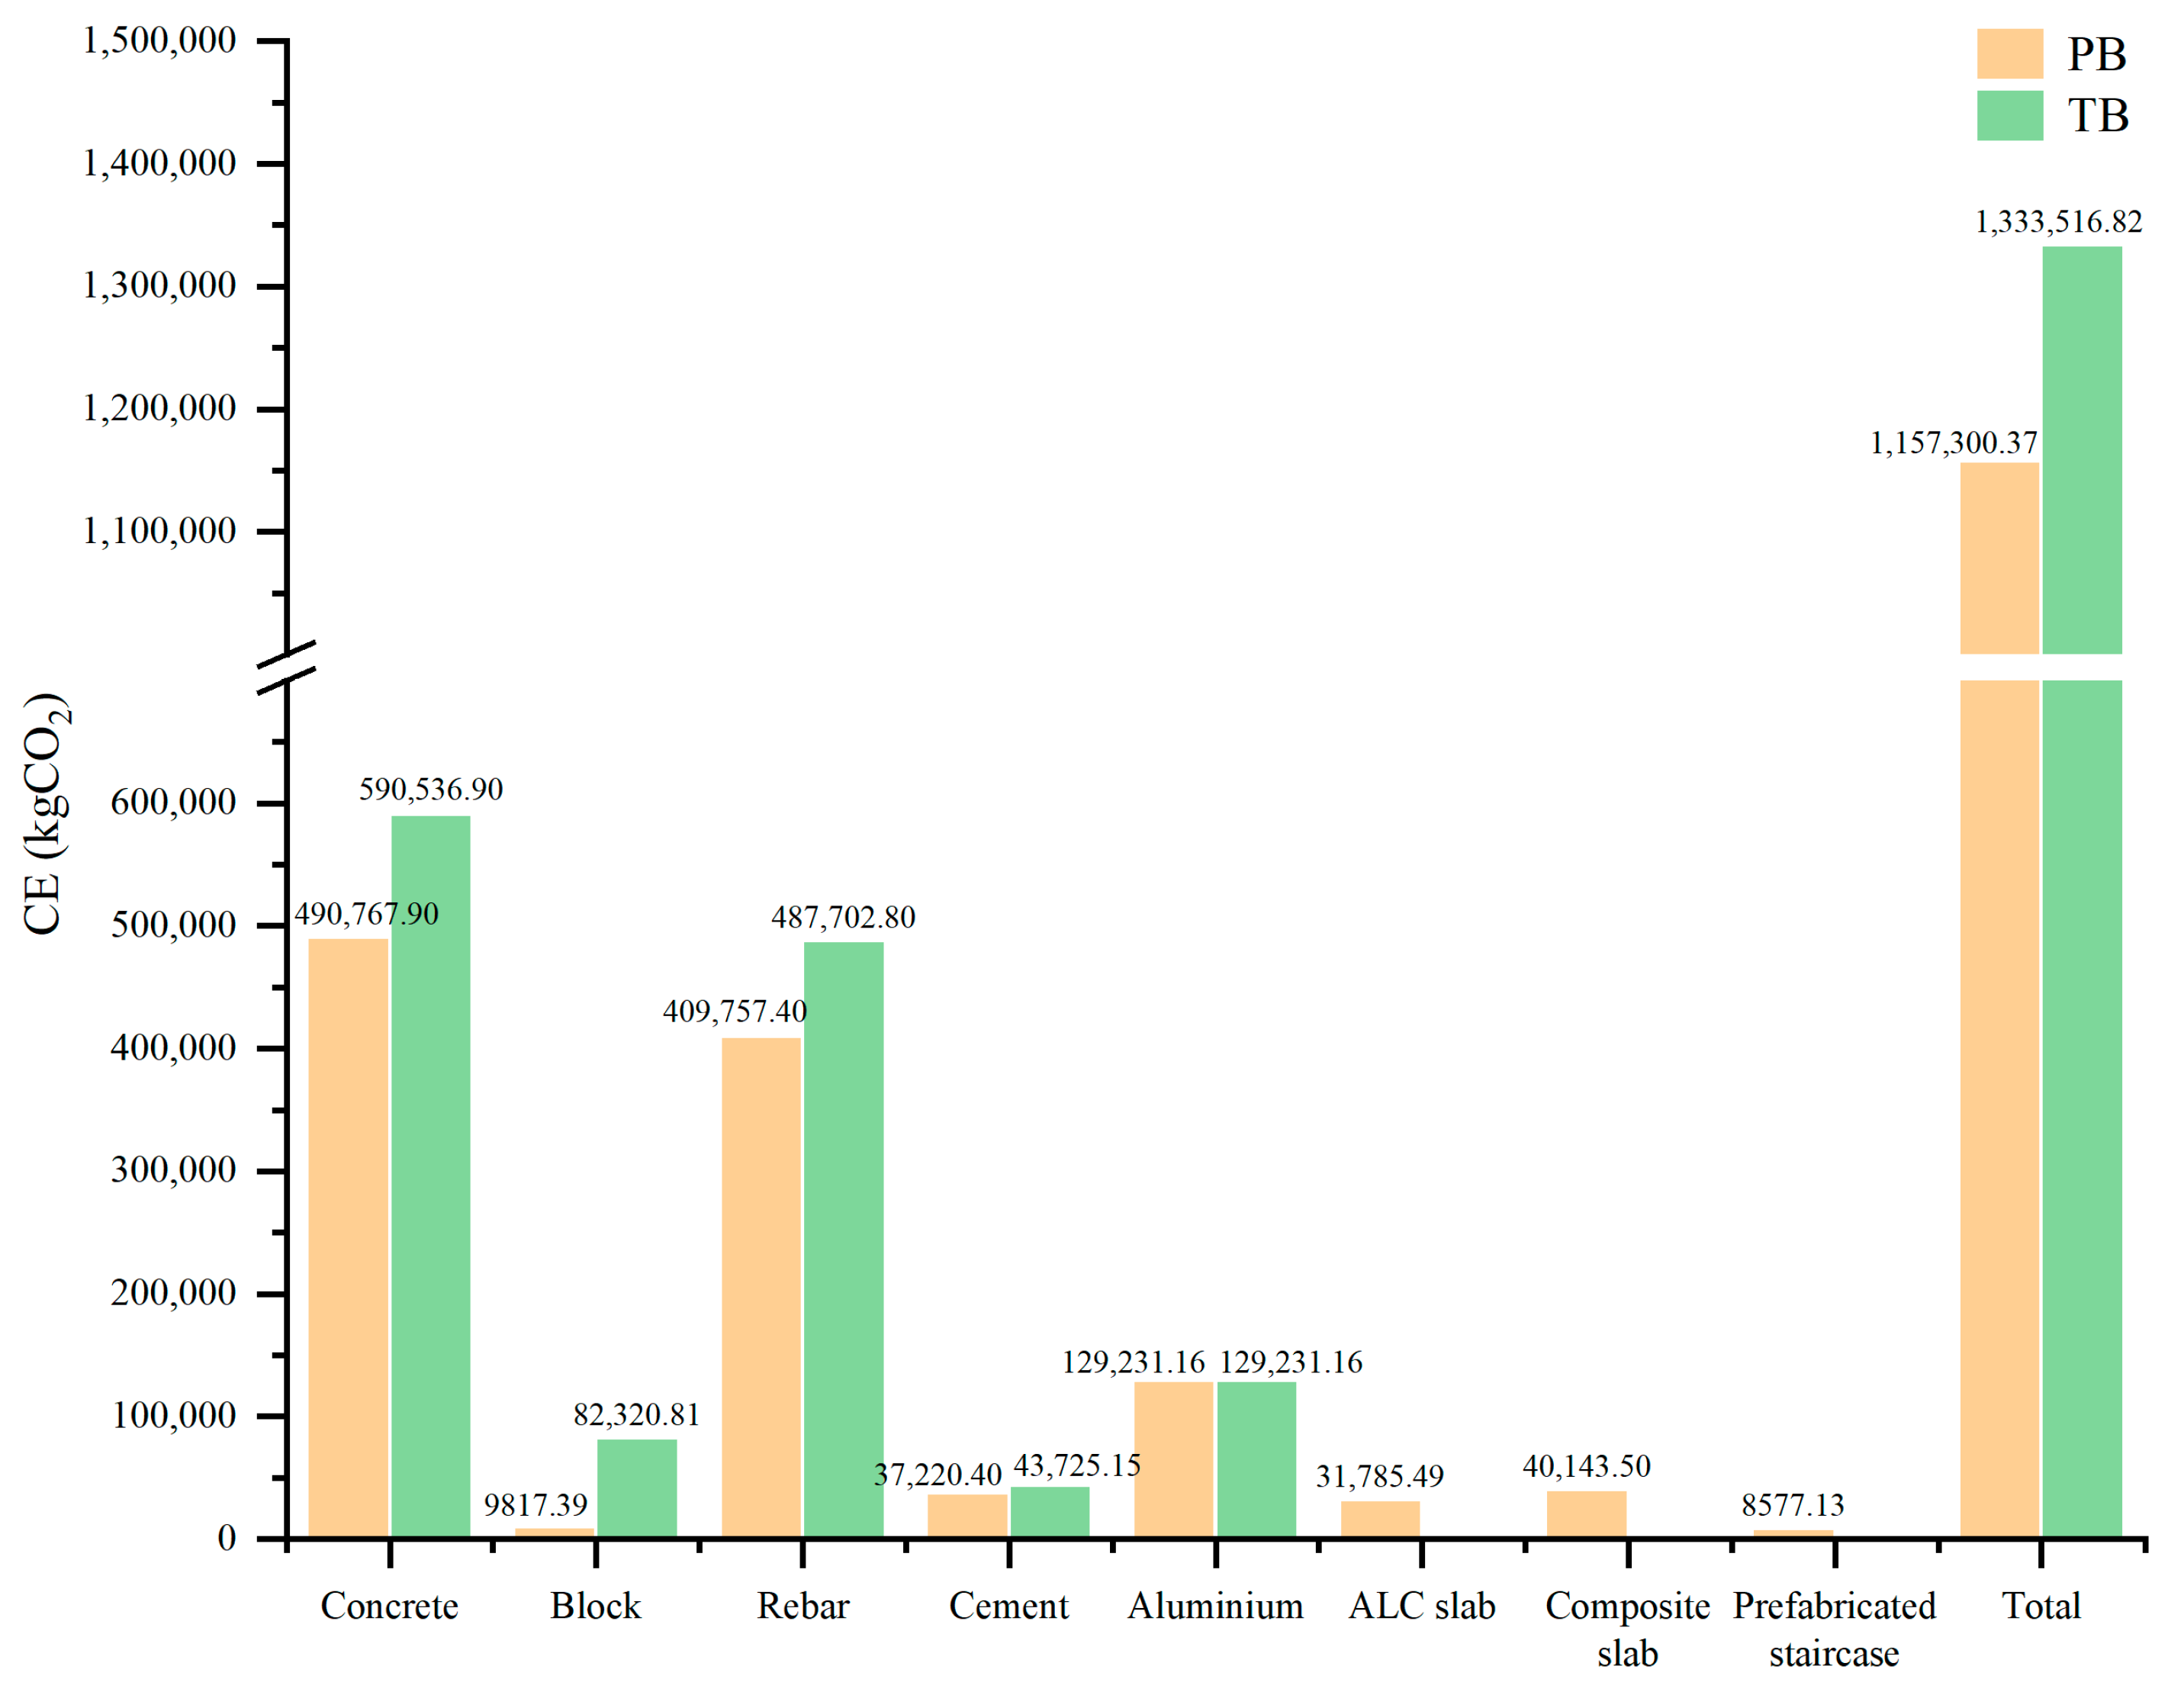
As illustrated in Figure 4, the total CEs generated were calculated as 1,333,516.82 kgCO2 for the TB and 1,157,300.37 kgCO2 for the PB during the material production stage. The results indicate that the PB achieved a CE reduction of approximately 13.21% relative to the TB during this stage. This difference was primarily caused by variations in material composition, construction organization, and production processes between the two construction modes.
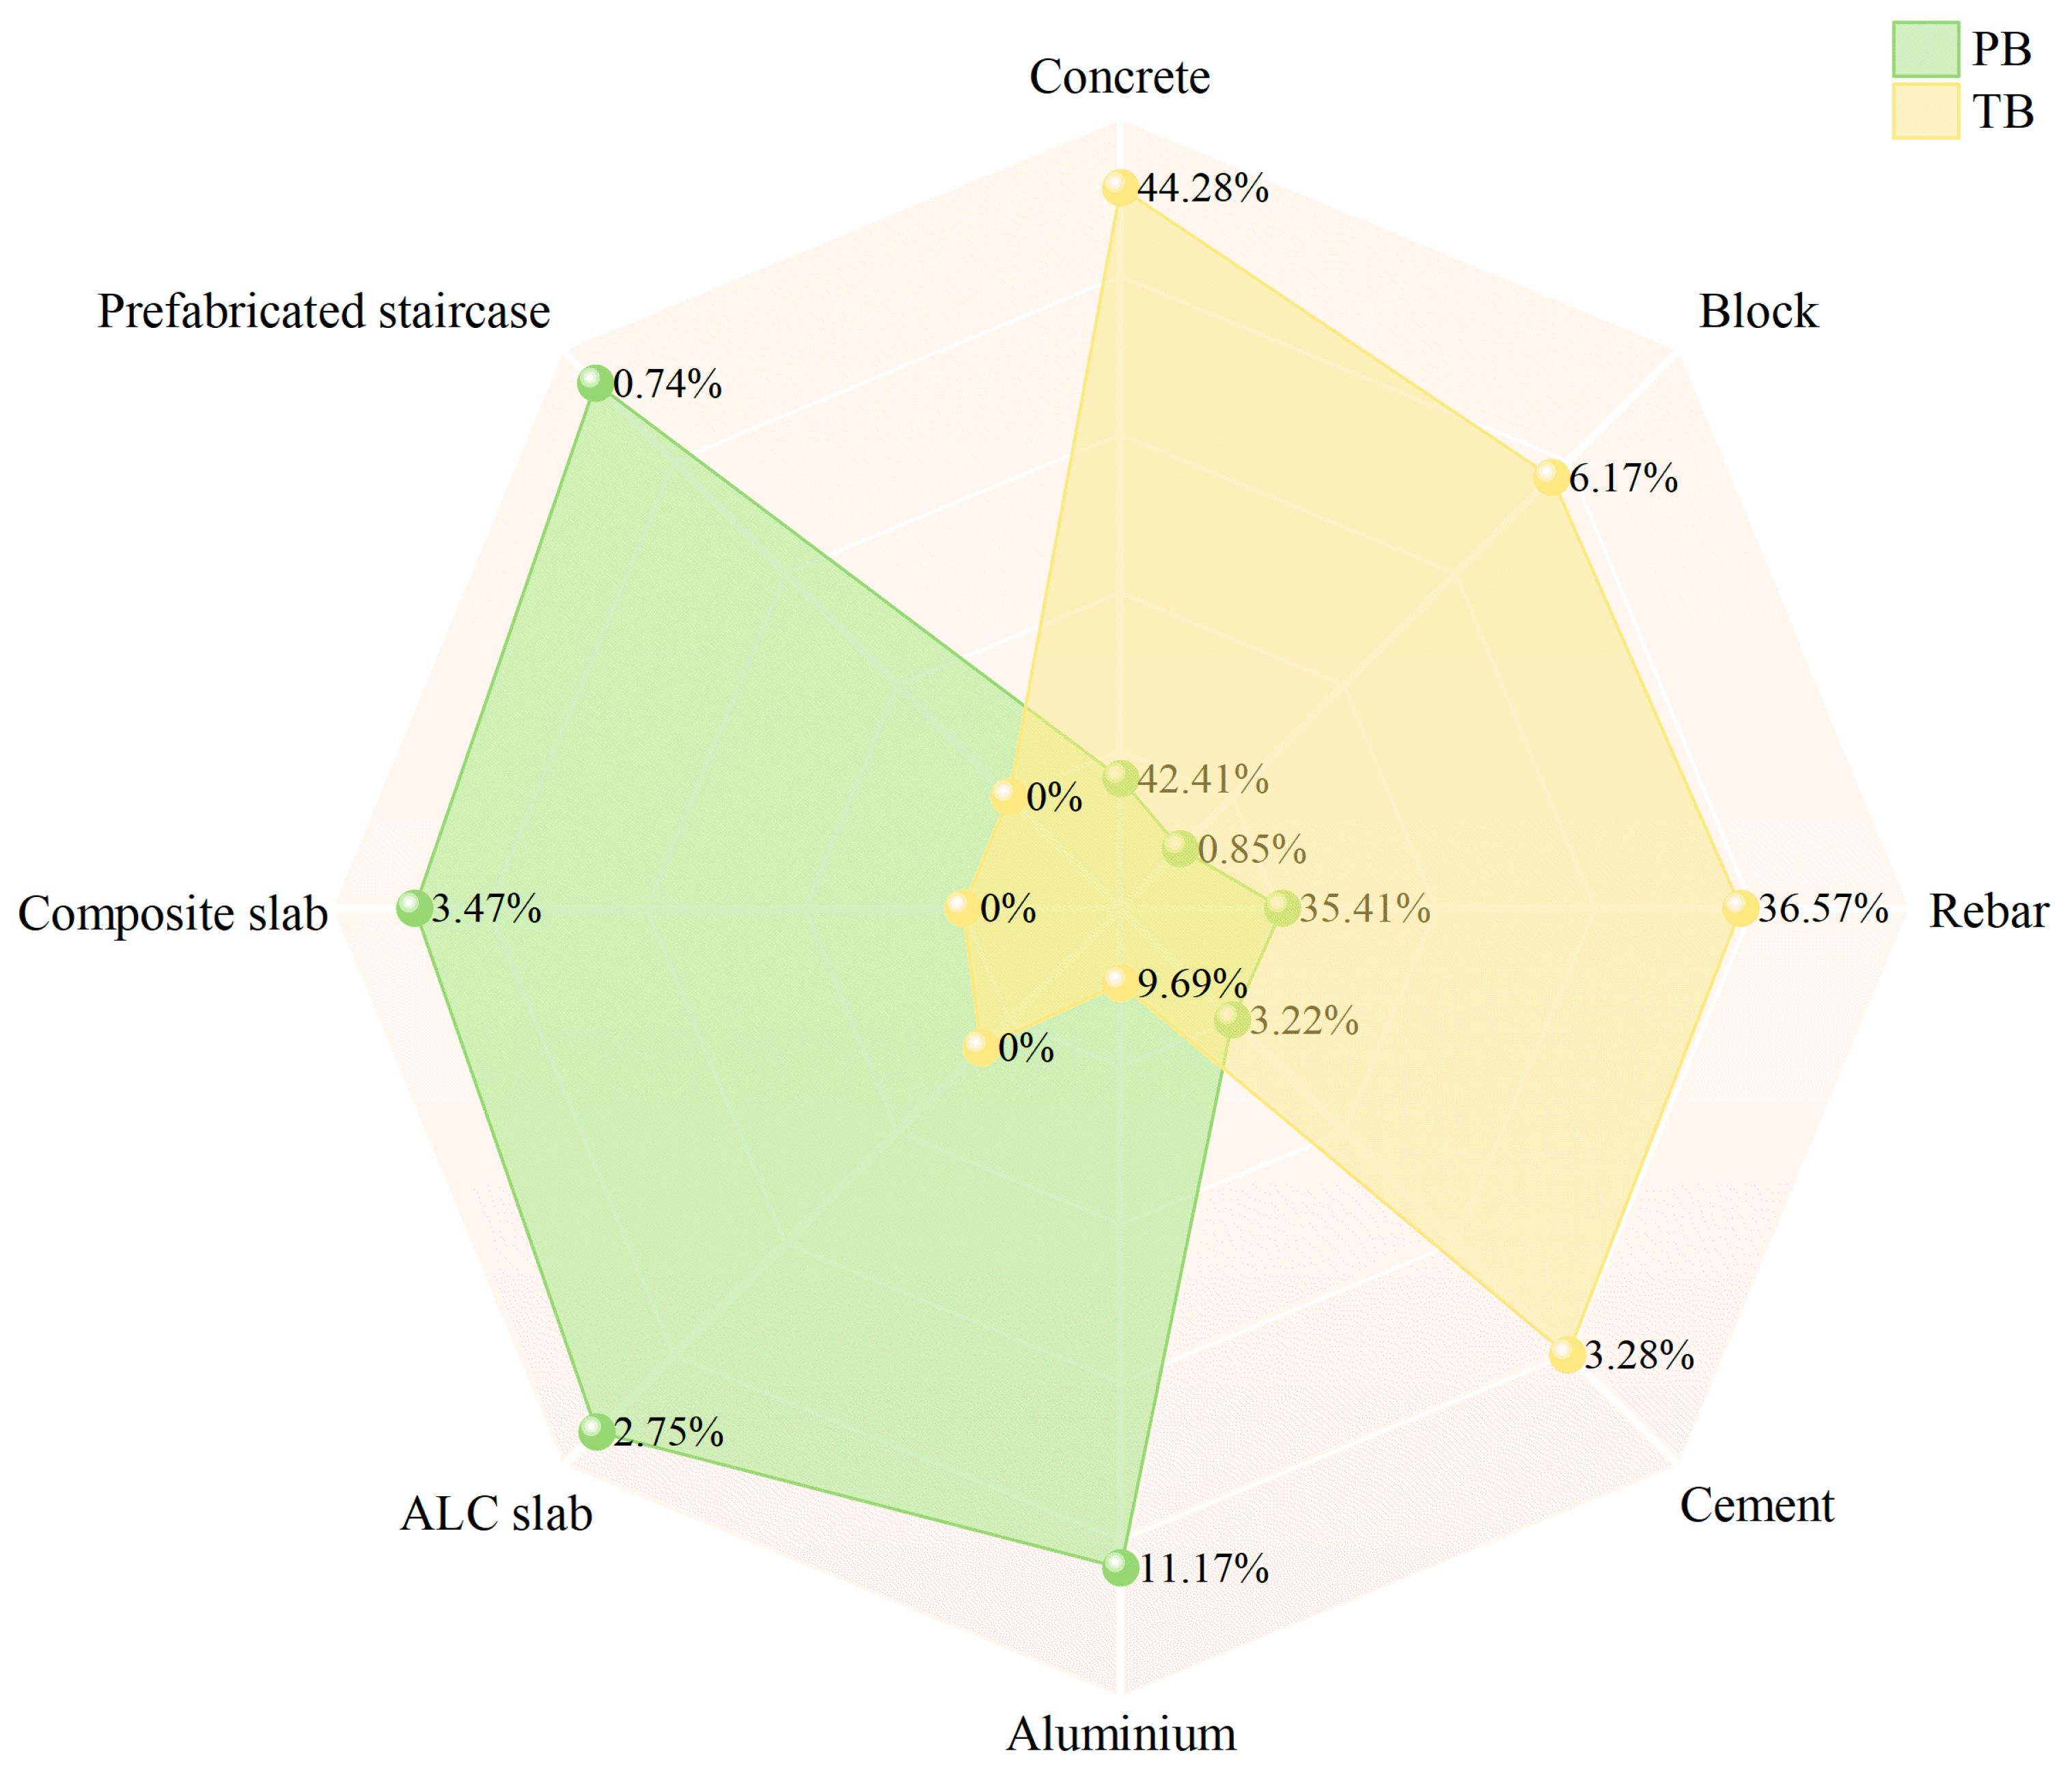
Further analysis of Figure 5 revealed that concrete and steel reinforcement were identified as the dominant CE sources in both building types. In the TB, concrete accounted for the largest share of emissions, at 44.28% of total material production emissions, whereas in the PB, the corresponding proportion decreased to 42.41%. This reduction was mainly attributed to the standardized factory production of prefabricated components, which reduced concrete waste, and replaced part of the cast in situ concrete demand by industrialized prefabricated elements.
Prefabricated components, as a unique emission source in the PB, accounted for 6.96% of total material production emissions. These emissions came not only from raw material consumption but also from energy use during factory production. Significant emission reduction advantages were still observed for enclosure and auxiliary materials. In particular, the CEs generated by masonry blocks decreased from 82,320.81 kgCO2 in the TB to 9817.39 kgCO2 in the PB, representing an approximately 88.07% reduction. This reduction was primarily due to the large-scale application of industrialized enclosure systems, including prefabricated ALC slabs.
The results further indicate that concrete and steel reinforcement are the primary contributors to embodied CEs during material production. Therefore, targets were implemented for these materials: In steel production, reduce CEs through process optimization, increased use of recycled scrap steel, and clean-energy steelmaking technologies. In concrete production, reduce cement content through mix proportion optimization, and use recycled aggregates from construction waste to partially replace natural aggregates. These measures are expected to support embodied carbon reduction during the material production stage.

5.2. Analysis of Carbon Emissions in the Transportation Stage

Deng et al. [48] reported that the difference in CEs during the building material transportation stage between PBs and TBs was approximately 3.5%, whereas the present study identified a substantially smaller difference of less than 0.5%. This discrepancy is mainly attributed to the additional transportation demand associated with prefabricated components within Chongqing’s regional supply, which offsets the carbon reduction achieved, reducing the use of conventional cast in situ materials.
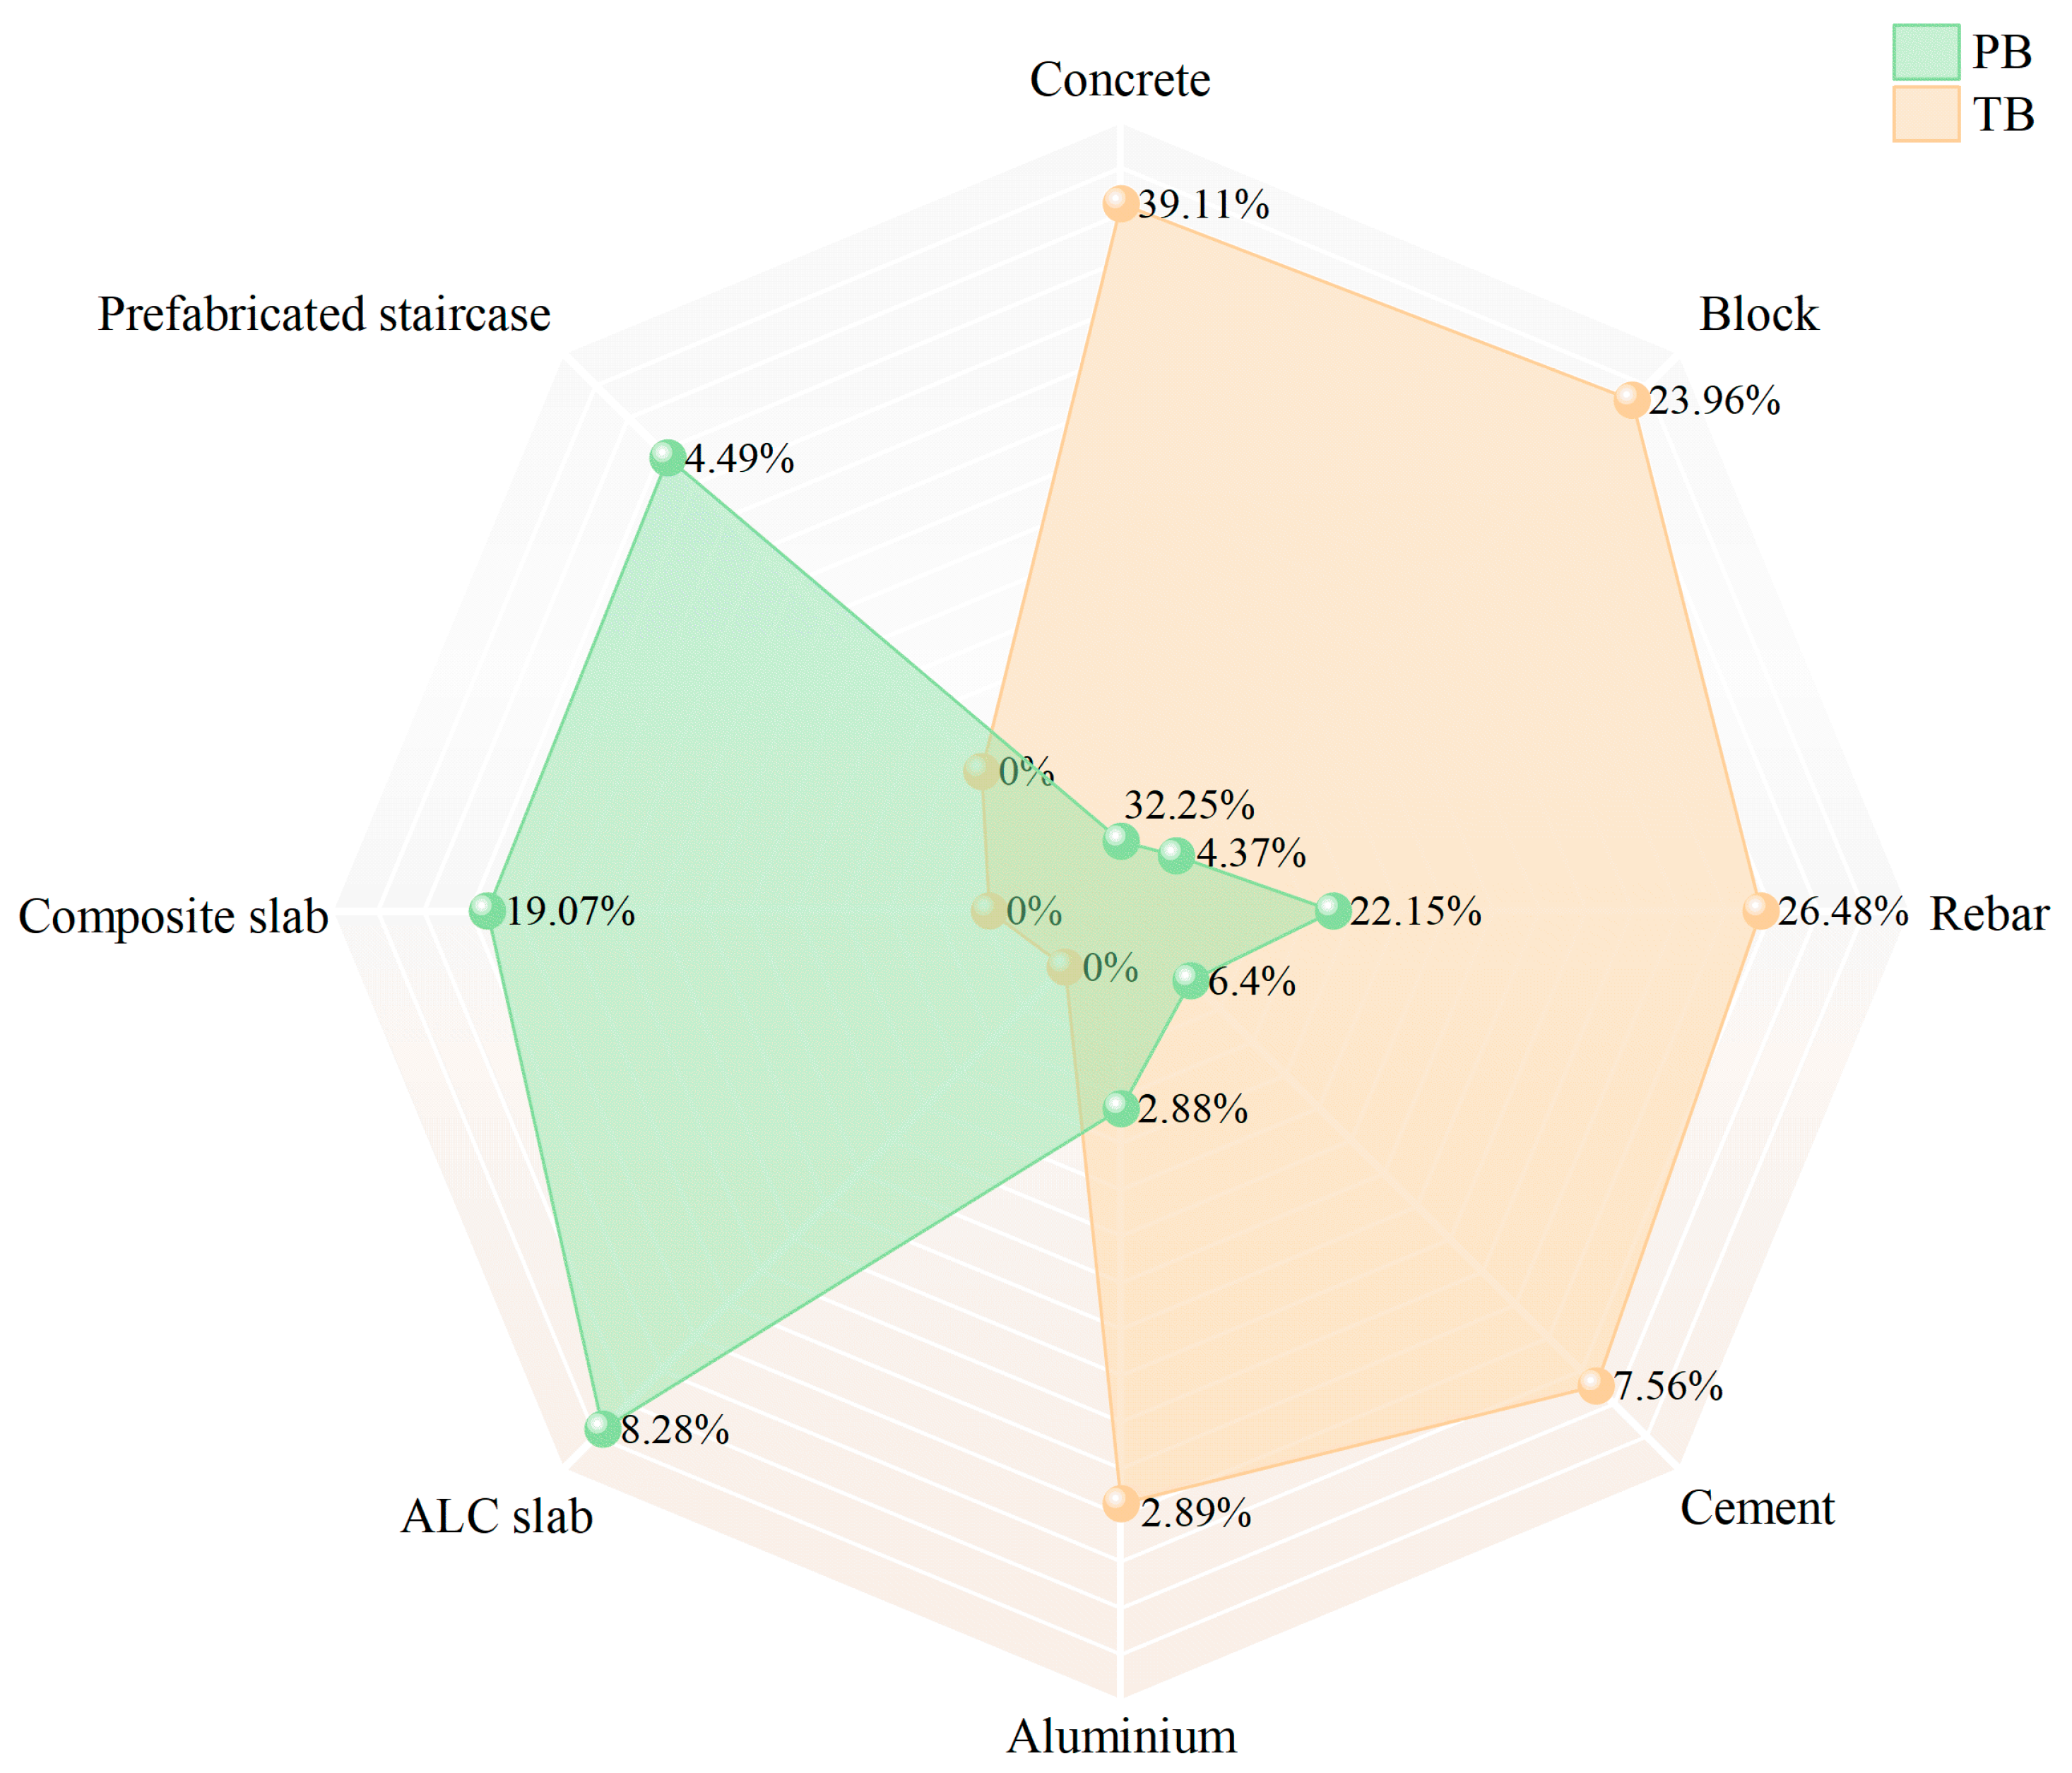
As illustrated in Figure 6, the transportation-stage CEs were 51,001.86 kgCO2 for the PB and 50,769.18 kgCO2 for the TB, an absolute difference of only 232.68 kgCO2. These findings indicate nearly equivalent transportation-stage carbon emissions under the project conditions. As shown in Figure 7, transportation emissions in the TB were mainly dominated by concrete and steel reinforcement, accounting for 39.11% and 26.48% of total transportation emissions, respectively. In the PB, these proportions decreased to 32.35% and 22.15%, respectively, indicating that transportation demand for conventional bulk construction materials was effectively reduced by adopting prefabricated construction methods.
However, additional transportation emissions were generated by prefabricated components during the PB logistics process. Prefabricated components collectively accounted for 31.84% of total transportation emissions, with composite slabs contributing the largest share, followed by ALC slabs and prefabricated staircases. These findings suggest that transportation emissions in PBs are strongly driven by component volume, material density, and regional transportation organization patterns. Although transportation emissions associated with prefabricated components increased to some extent, this increase was largely offset by significant emission reductions during material production. Consequently, PBs showed an overall carbon reduction advantage during the materialization phase.
Based on these findings, transportation-related carbon reduction strategies should be further optimized. Priority should be given to lightweight and low-carbon materials where engineering conditions permit. Transportation distances should then be minimized by establishing localized supply chains and increasing the use of regional materials. Transportation efficiency may be improved through route optimization and integrated logistics management systems. Furthermore, the application of clean-energy freight vehicles, including electric and hydrogen-powered trucks, is recommended to further reduce fossil fuel consumption and transportation-stage carbon emissions.

5.3. Comparative Analysis of Total Carbon Emissions in the Materialization Stage

The total CEs generated during the materialization stage were calculated by integrating emissions from material production, transportation, and on-site construction stages. As shown in Table 8, the total CEs for the PB and TB were 1,245,090.13 kgCO2 and 1,421,817.93 kgCO2, respectively. A total reduction of 176,727.80 kgCO2 was achieved by the PB, corresponding to a reduction rate of 12.43%. The majority of the emission reduction came from the material production stage, which accounted for approximately 99.7% of the total reduction. This finding indicates that the carbon reduction advantage of prefabricated construction mainly comes from reduced material waste, standardized factory production, and improved resource utilization efficiency.
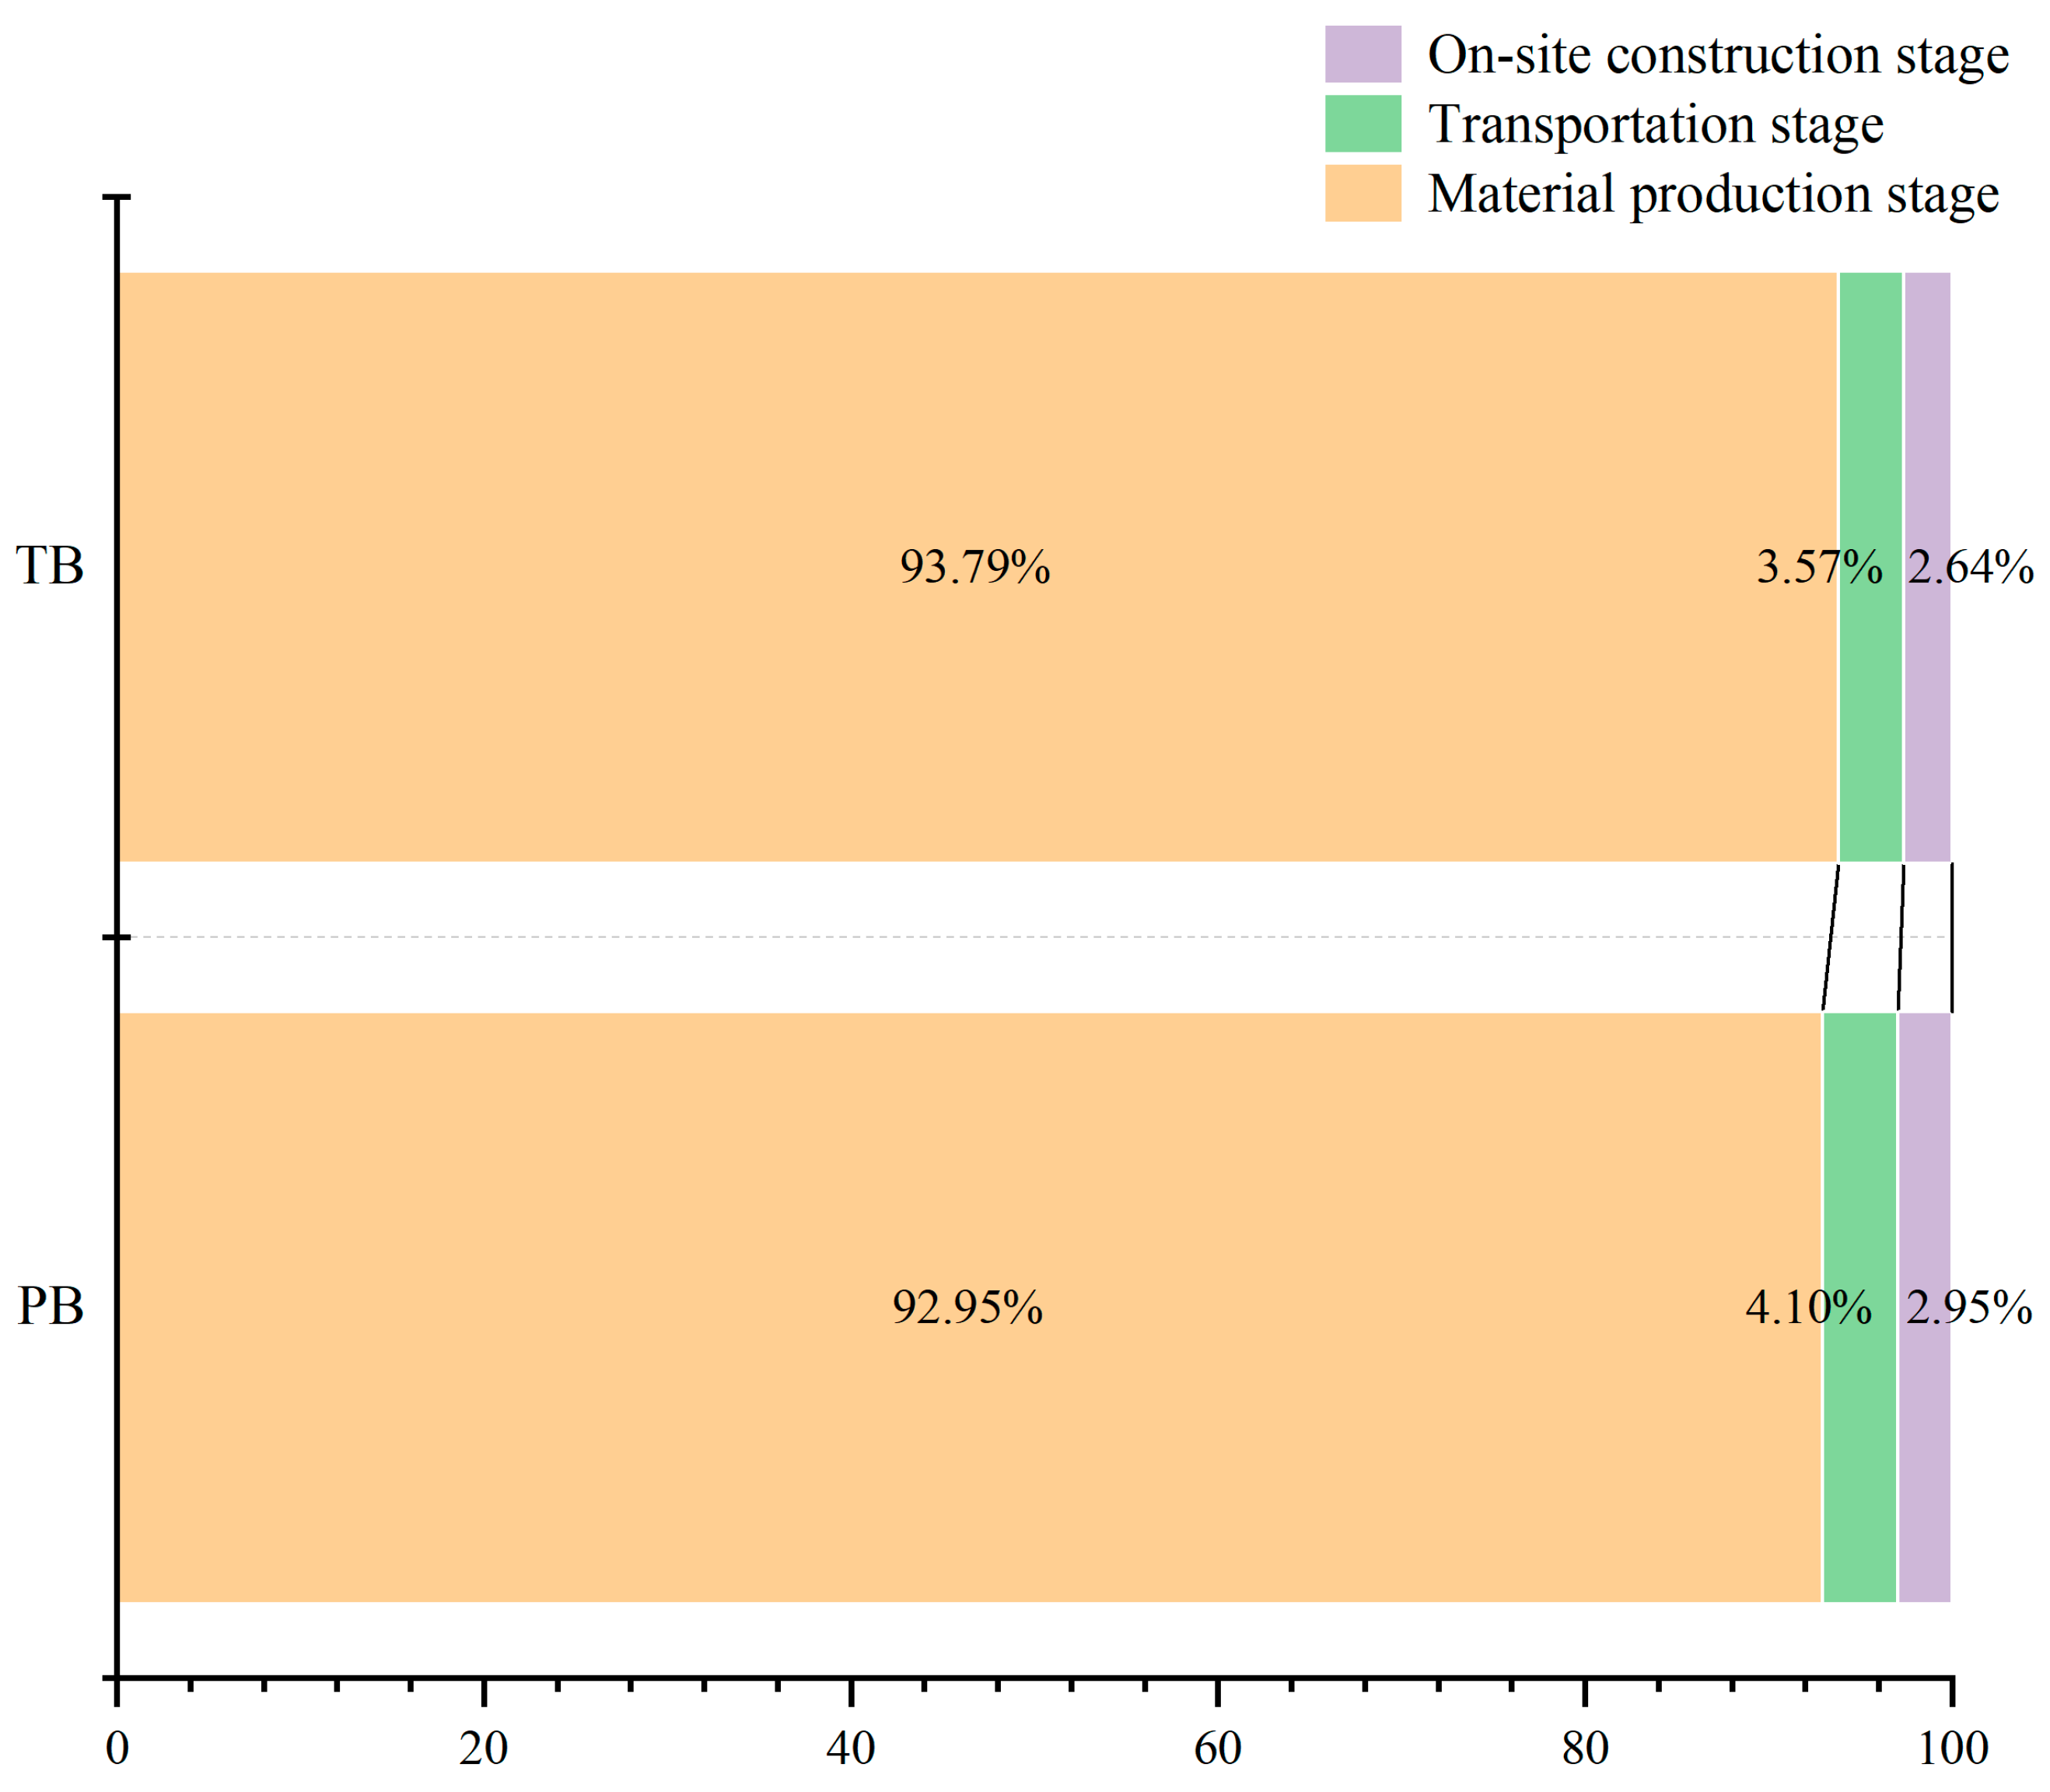
As illustrated in Figure 8, the material production stage dominated total embodied CEs in both construction modes, accounting for 92.95% in the PB and 93.79% in the TB. Similar conclusions have been widely reported in previous studies [49], in which the material production stage was identified as the primary contributor to embodied CEs during materialization. The transportation and on-site construction stages together contributed less than 8% in both modes. Although transportation emissions were slightly higher in the PB due to component delivery requirements, this increase was offset by the substantial reductions achieved during material production.
The results demonstrate that embodied carbon reduction strategies should prioritize low-carbon material production and supply chain optimization. Meanwhile, improvements in transportation organization and construction management are also required to further enhance the environmental performance of prefabricated buildings.

5.4. Sensitivity and Uncertainty Analysis

In the established carbon accounting framework, fixed values were adopted for several key parameters, including transportation distances, electricity and diesel CEFs, construction equipment efficiency, and regional material production conditions. However, these parameters are inherently influenced by temporal dynamics, geographical characteristics, and variability in industrial production, which may introduce uncertainty into the results of the embodied carbon assessment. Therefore, a sensitivity and uncertainty analysis was conducted to evaluate the robustness and reliability of the proposed BIM-based carbon accounting framework.

5.4.1. Decomposition of Carbon Emissions and Elasticity Analysis

To evaluate the sensitivity of the established carbon accounting framework, the total CEs for the PB and the TB were decomposed into stage-specific and parameter-sensitive components using the baseline data presented in Table 4, Table 5, Table 6, Table 7 and Table 8. The elasticity coefficient was defined as the percentage variation in total CEs induced by a 10% change in a specific parameter.
For the PB, total CEs during the materialization stage were calculated as 1,245,090.13 kgCO2. As summarized in Table 9, the electricity emission factor had the greatest impact, reaching 478,205.03 kgCO2 and accounting for 38.41% of total emissions, with an elasticity coefficient of 3.841%. The diesel emission factor affected 119,952.04 kg CO2, representing 9.63% of total emissions, and an elasticity coefficient of 0.963%. Transportation distances for concrete and other materials accounted for 16,500.81 kg CO2 and 34,501.05 kg CO2, representing 1.325% and 2.771% of total emissions, respectively. Emissions from construction machinery operations totaled 19,506.88 kg CO2, accounting for 1.566% of total emissions.
For the TB, the total CEs during the materialization stage were calculated to be 1,421,817.93 kg CO2. As presented in Table 10, the electricity emission factor remained the dominant parameter, affecting 548,779.43 kg CO2 and accounting for 38.60% of total emissions, with an elasticity coefficient of 3.860%. The affected emissions associated with the diesel emission factor were calculated as 137,567.95 kg CO2, representing 9.28% of total emissions. The transportation distances of concrete and other materials accounted for 19,854.97 kg CO2 and 30,914.21 kg CO2, respectively, representing 1.396% and 2.174% of total emissions. Meanwhile, emissions from construction machinery operation were quantified at 19,588.97 kg CO2, representing 1.378% of total emissions.

5.4.2. Sensitivity Analysis

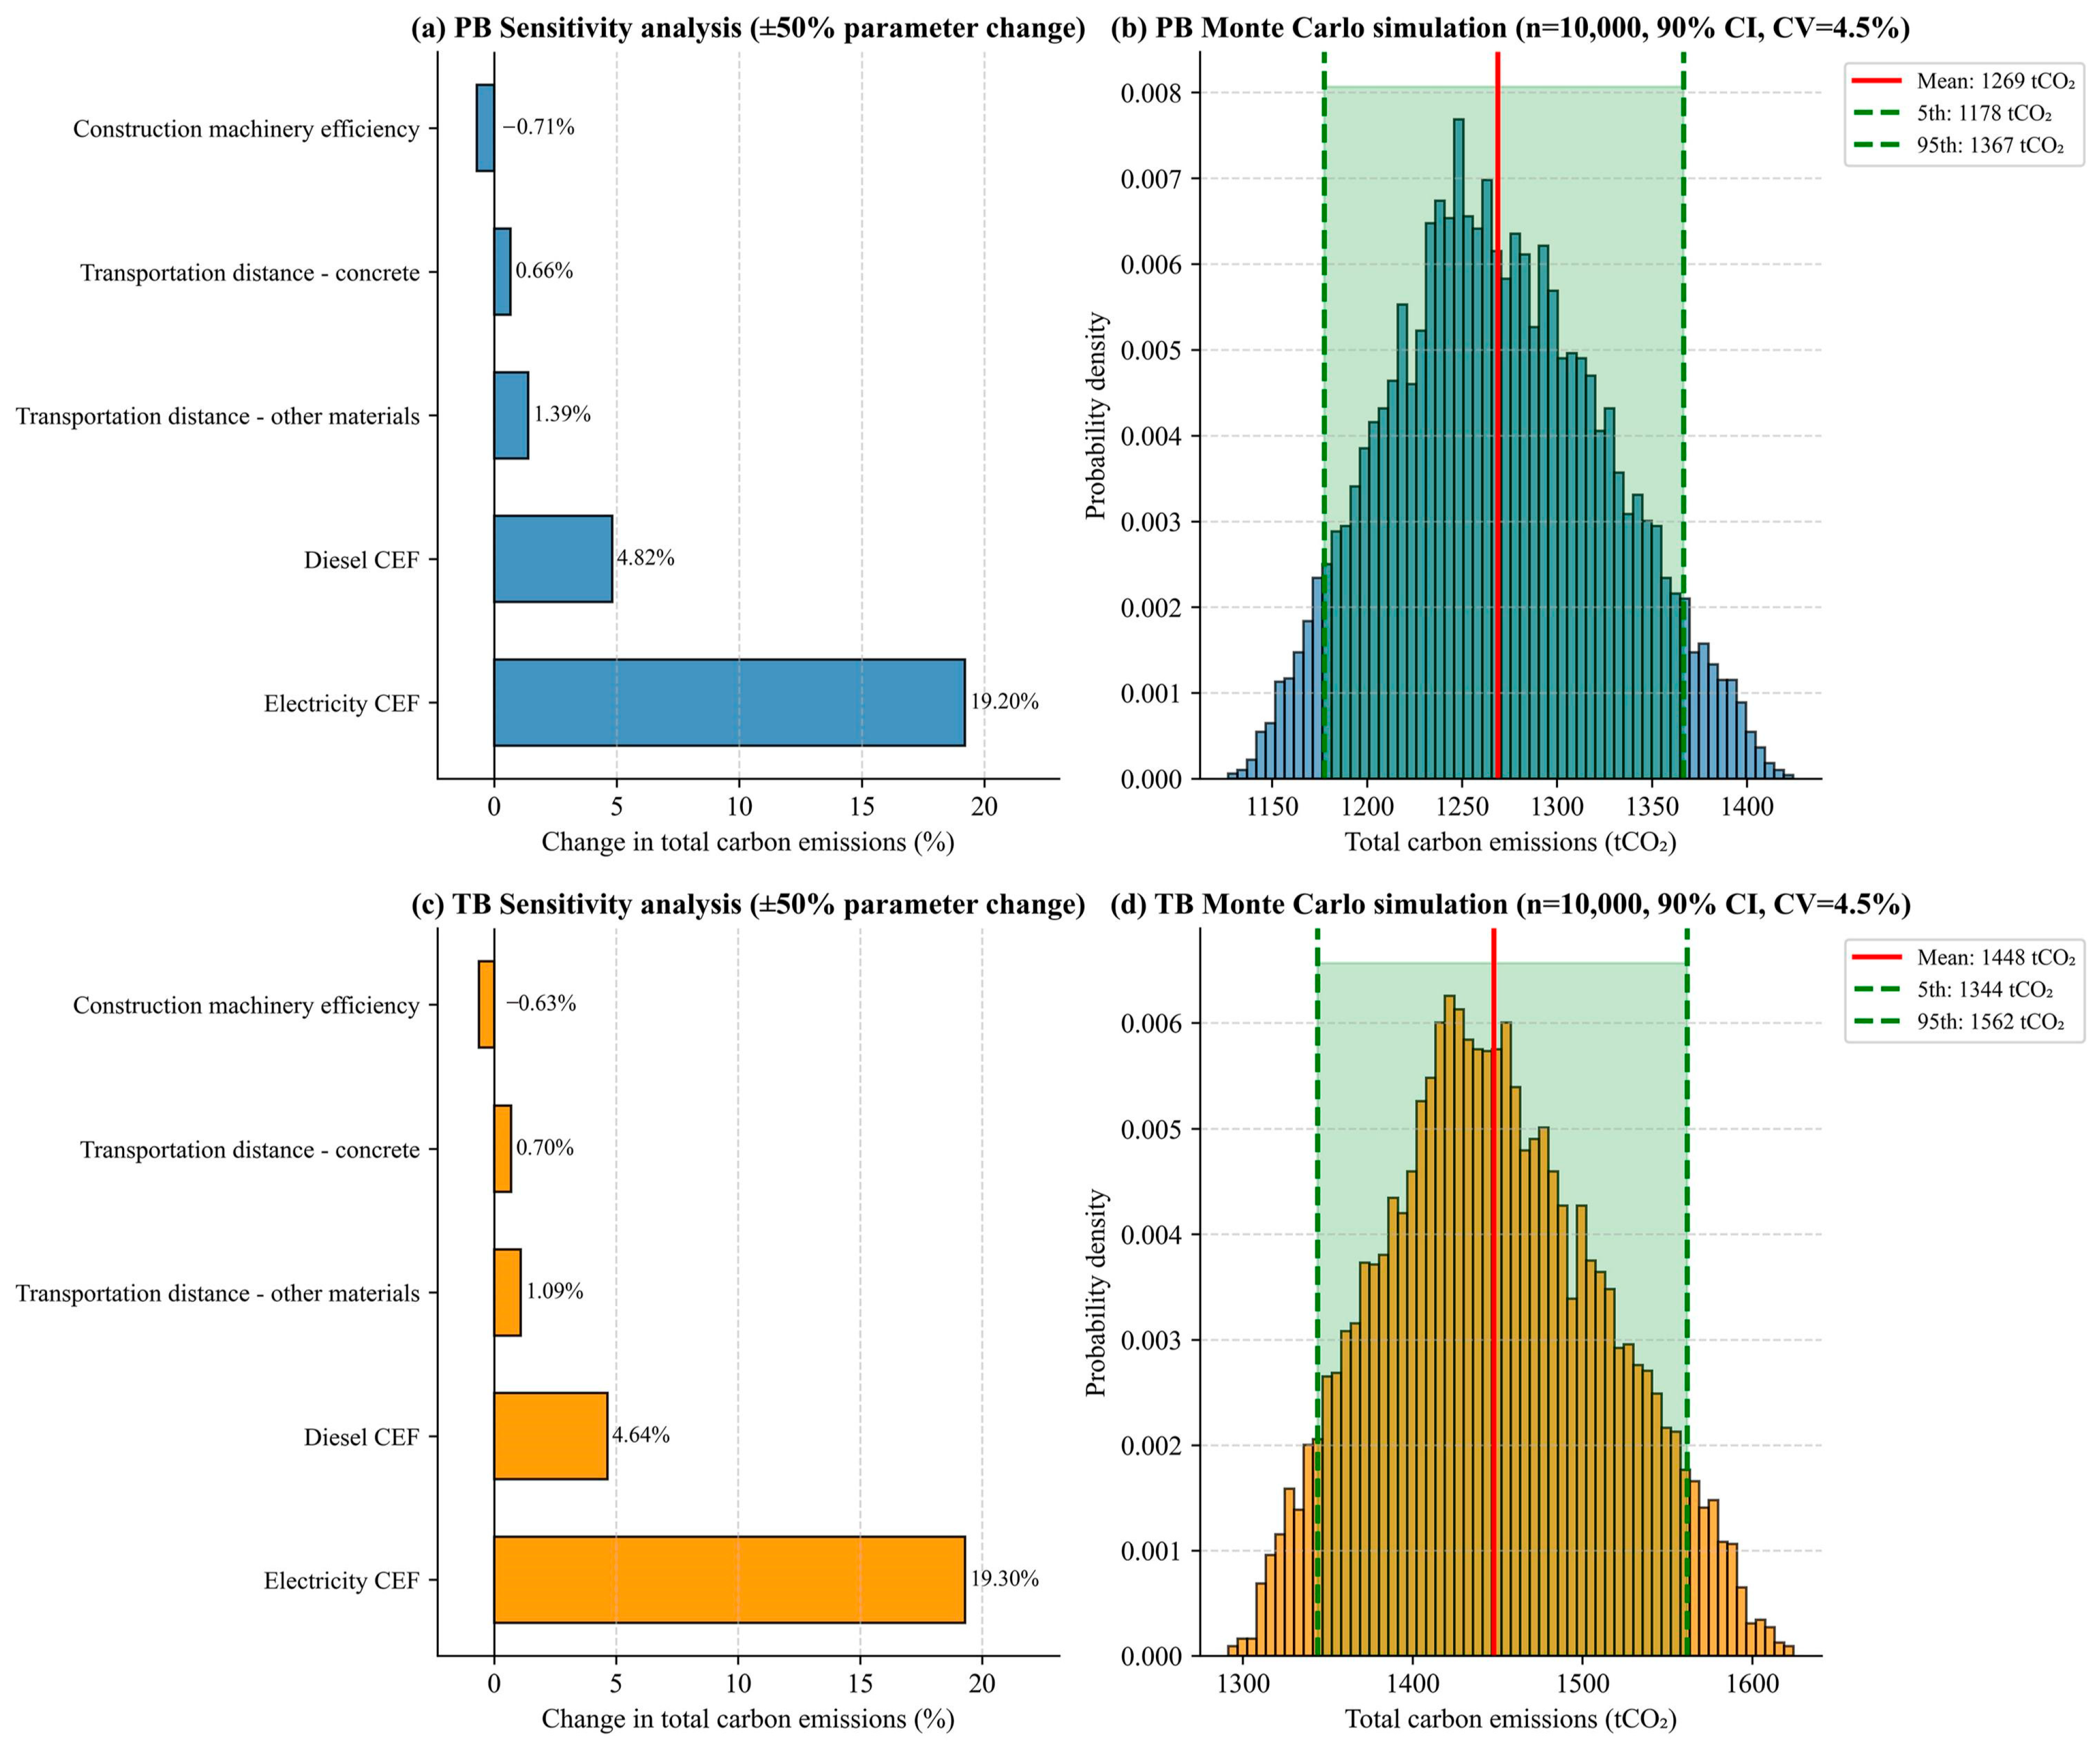
The sensitivity analysis for the PB and the TB under a ±50% parameter variation is illustrated in Figure 9a and Figure 9c, respectively.
For the PB, the electricity emission factor showed the greatest sensitivity, resulting in a 19.20% change in total CEs with a 50% increase in the parameter. The diesel emission factor was the second most influential parameter, accounting for 4.82% of the variation in total emissions. By contrast, the transportation distances of other materials and concrete induced relatively small variations of +1.39% and +0.66%, respectively. In addition, improvements in the efficiency of construction machinery led to a 0.71% decrease in total CEs.
A similar sensitivity pattern was observed for the TB. As shown in Figure 9c, the electricity emission factor remained the dominant parameter, accounting for 19.30% of the variation in total CEs. The diesel emission factor caused a 4.64% variation, whereas the transportation distances of other materials and concrete resulted in comparatively smaller changes of 1.09% and 0.70%, respectively. Meanwhile, improvements in construction machinery reduced total emissions by 0.63%.
Overall, the sensitivity analysis showed that total CEs during the materialization stage were most sensitive to the electricity emission factor, followed by the diesel emission factor. Transportation distance and construction machinery efficiency showed comparatively limited sensitivity. Sensitivity distributions were highly consistent between the PB and the TB, indicating that the dominant parameters influencing embodied CEs remained similar across construction modes.

5.4.3. Uncertainty Propagation via Monte Carlo Simulation

To evaluate the combined influence of multiple uncertain parameters on embodied CEs, Monte Carlo simulations with 10,000 iterations were conducted for both the PB and the TB. The probability distributions of total CEs are presented in Figure 9b,d.
For the PB, the simulation in Figure 9b indicates that the total CEs approximately followed a normal distribution. The mean total emissions were 1269 tCO2. The 90% confidence interval, corresponding to the 5th and 95th percentiles, ranged from 1178 tCO2 to 1367 tCO2. In addition, the coefficient of variation was 4.5%, indicating relatively stable performance under parameter uncertainty. For the TB, the simulation in Figure 9d shows that the mean total CEs reached 1448 tCO2. The 90% confidence interval ranged from 1344 tCO2 to 1562 tCO2, and the coefficient of variation was 4.5%. Compared with the PB, the TB showed higher embodied CEs across the entire probability distribution.
Notably, the 90% confidence intervals of the PB and TB did not overlap. The upper boundary of the PB confidence interval remained lower than the lower boundary of the TB confidence interval. This result indicates that the carbon reduction advantage of the prefabricated construction mode remained statistically robust despite simultaneous uncertainties in transportation distance, electricity, diesel emission factors, and construction machinery efficiency.
Furthermore, the relatively low coefficients of variation obtained for both building types demonstrate that the proposed accounting framework yielded stable and reproducible estimates, even when multiple uncertain parameters were considered simultaneously within realistic ranges of variation.

5.5. Cost Comparation Between PB and TB

The costs during the materialization phase were systematically estimated and compared for PBs and TBs. As shown in Table 11, the total construction cost of the PB was CNY 5,845,775.84, whereas the corresponding cost of the TB was CNY 6,029,700.40. Compared with the TB, the PB achieved a cost reduction of CNY 183,924.56, corresponding to a 3.05% reduction. These results indicate that the prefabricated construction mode offers both carbon reduction benefits and a degree of economic advantage during the materialization phase.
Further analysis of the cost composition revealed that work package costs constituted the dominant proportion in both construction modes, accounting for approximately 70.4% of total costs in the PB and 70.8% in the TB. This was the main source of the overall economic benefit, as a cost reduction of CNY 153,948.99 was achieved in the PB. Modest reductions were also observed in temporary works and general service costs, statutory charges, and taxes. Although prefabricated components increased procurement and transportation costs, the overall construction cost was effectively reduced because on-site labor demand, material consumption, and temporary construction expenditures decreased. These findings show that the economic advantage of PBs mainly comes from standardized production processes, improved construction efficiency, and reduced material waste during on-site operations.
The results indicate that integrating BIM technology with prefabricated construction methods can promote the coordinated optimization of environmental and economic performance. Therefore, to further enhance the economic competitiveness of PBs, integrated collaborative design based on BIM technology should be strengthened during the design stage. This would optimize component segmentation schemes and improve standardization levels, helping control material consumption and production costs. It would also enhance coordination among the design, production, and construction stages, reducing rework and on-site modifications resulting from design inconsistencies.
In the construction stage, one should adopt lean construction management strategies to optimize prefabricated construction processes and improve equipment utilization efficiency. In addition, further reductions in on-site idle time, material waste, and resource consumption could be achieved through refined schedule coordination and digital management approaches. Information-based management tools are also expected to support dynamic optimization of construction schedules, costs, and quality performance, thereby further enhancing the overall benefits of prefabricated construction.

5.5.1. Detailed Breakdown of Prefabrication-Related Costs

The total materialization-stage cost of the PB was calculated as CNY 5,845,775.84, which was 3.05% lower than that of the TB. To identify the primary contributors to the observed cost difference, the work package costs extracted from the BIM model were further decomposed into several major construction subcategories, linking the cost gap to these categories. The quantities of materials and construction works were obtained from the BIM-based quantity takeoff results presented in Table 3, and unit prices were derived from the Chongqing Construction and Installation Valuation Quota (2018 Edition). The breakdown is summarized in Table 12.
As shown in Table 12, although additional expenditures were incurred for the supply and installation of prefabricated components, significant cost reductions were achieved in concrete works, formwork systems, and masonry-related construction activities. The total cost reduction was mainly attributed to a decrease in on-site construction workload and a reduction in conventional wet operations.

5.5.2. Analysis of Labor Savings

To further evaluate the influence of prefabrication on construction labor demand, analyze the labor workday extracted from Table 6 and Table 7. First, calculate the total on-site labor input: the PB required 8348.32 workdays, whereas the TB required 8668.10 workdays, a reduction of 319.78 workdays (3.69%). Then, based on the average local construction labor wage of 220 CNY/workday reported in the Chongqing Construction Cost Gazette (2022), estimate the direct on-site labor expenditure as CNY 1,836,630 for the PB and CNY 1,906,982 for the TB. Finally, the corresponding labor cost reduction reached approximately CNY 70,352 during the materialization stage.
However, additional factory labor demand was generated by the production of prefabricated components. According to production efficiency data collected from local prefabrication plants in Chongqing, the manufacturing processes of composite slabs, prefabricated staircases, and ALC slabs required approximately 420 factory workdays in total. Using an average factory labor wage of 200 CNY/workday, the corresponding factory labor cost was estimated as CNY 84,000.
Consequently, the PB’s total labor-related expenditure was slightly higher than the TB’s, with a net increase of approximately CNY 13,648 (0.72%). Nevertheless, the labor structure was substantially transformed, as labor demand was shifted from labor-intensive on-site operations toward standardized factory production processes.

5.5.3. Analysis of the Cost of Factory Production

The costs of factory production of prefabricated components were analyzed using supplier quotations and local prefabrication market data. The total cost of supply and installation for prefabricated components was estimated at CNY 1,392,800, including approximately CNY 484,025 attributable to direct factory production. The composition of factory production costs mainly included raw materials, mold depreciation, labor input, energy consumption, and quality control expenditures. Raw material consumption accounted for the largest share of factory production costs, at approximately 62%, followed by labor expenditure (14%), mold depreciation and maintenance (12%), energy consumption (8%), and quality management costs (4%).
The relatively high proportion of supplier profit and intermediate transportation expenditure indicated that the current prefabricated construction supply chain in Chongqing has not yet reached full market maturity. Therefore, it may be achieved in future projects through industrial standardization, mass production, and supply chain optimization, thereby delivering additional economic benefits.

6. Conclusions

The findings indicate that prefabricated construction has clear potential to reduce embodied CEs during the materialization stage while improving overall economic performance. The material production stage was the dominant source of embodied CEs in both construction modes, whereas transportation and on-site construction contributed comparatively little. These results suggest that optimization efforts should mainly focus on material consumption patterns, low-carbon manufacturing technologies, and the decarbonization level of industrial electricity systems in the construction industry. Sensitivity and uncertainty analyses revealed that the results are more strongly influenced by electricity-related carbon factors than by transportation distance or construction equipment efficiency. They also indicate that the proposed assessment framework is sufficiently robust and applicable for comparative building-level carbon analysis, as the comparative environmental advantage of prefabricated construction remained stable across different parameter variation scenarios.
Several important implications are evident for policymakers and industry stakeholders. Policy measures aimed at promoting low-carbon electricity systems and green building material production may achieve greater emission reduction effects than transportation-oriented interventions alone. Consequently, localized carbon accounting parameters and regionalized emission databases are recommended for future engineering applications and policymaking processes. In addition, the findings provide practical guidance for developers, contractors, and prefabricated component manufacturers to optimize material selection, production organization, and construction planning for more sustainable construction practices.
Although the quantitative results came from a specific residential shear wall structure project in Chongqing, the conclusions have broader engineering significance for reinforced concrete residential buildings under similar urbanization and industrialization conditions. The dominant contribution of material production emissions, the sensitivity to electricity carbon intensity, and the environmental advantages of prefabrication are likely to apply to comparable construction projects in rapidly urbanizing regions.
There are some limits in this research: because CEFs and transportation assumptions were derived from national standards, published literature, and regional engineering practice rather than project-specific measured data, the assessment is less directly tied to project conditions. In addition, operational and end-of-life-stage impacts were not quantitatively incorporated into the present assessment boundary. Therefore, future research will consider integrating dynamic regional carbon databases, real-time transportation tracking, operational energy monitoring, and lifecycle optimization models to improve the accuracy and applicability of BIM-based embodied carbon assessment frameworks.

Author Contributions

The authors confirm contribution to the paper as follows: study conception and design: Y.Y. and X.Y.; data collection: Y.S. and B.P.J.; analysis and interpretation of results: S.W., X.C. and D.Z.; draft manuscript preparation: Y.Y. All authors have read and agreed to the published version of the manuscript.

Funding

This research was supported by the China Scholarship Council (CSC) (Grant Number: 202308140128) and the Fundamental Research Program of Shanxi Province (Project Number: 202203021212486).

Institutional Review Board Statement

Not applicable.

Informed Consent Statement

Not applicable.

Data Availability Statement

The data were derived from the drawings of the selected case projects.

Conflicts of Interest

The authors declare no conflicts of interest.

References

  1. Zhao, S.Y.; Qu, X.R.; Zhao, X.J. The carbon emissions of prefabricated building in urban renewal: Assessment and emission reduction path. Energy Build. 2025, 341, 115830. [Google Scholar] [CrossRef] [Scilit]
  2. Cai, K.H.; Wang, H.X.; Wang, J.S.; Bai, J.; Zuo, J.; Chan, K.; Lai, K.; Song, Q. Mitigating lifecycle GHG emissions of building sector through prefabricated light-steel buildings in comparison with traditional cast-in-place buildings. Resour. Conserv. Recycl. 2023, 194, 107007. [Google Scholar] [CrossRef] [Scilit]
  3. Zhang, X.C.; Li, Y.T.; Chen, H.L.; Yan, X.; Liu, K.H. Characteristics of embodied carbon emissions for high-rise building construction: A statistical study on 403 residential buildings in China. Resour. Conserv. Recycl. 2023, 198, 107200. [Google Scholar] [CrossRef] [Scilit]
  4. Ding, Y.; Zhang, D.L.; Lv, J. Comparison of the applicability of city-level building energy consumption quota methods. Energy Build. 2022, 261, 111933. [Google Scholar] [CrossRef] [Scilit]
  5. Lin, Z.; Li, X.L.; Lin, M.S.; Zhang, T.H.; Guo, Q.; Lin, L. Analysis of carbon emission associated with composite air source heat pumps in buildings. Case Stud. Therm. Eng. 2025, 69, 106033. [Google Scholar] [CrossRef] [Scilit]
  6. Li, X.J.; Xie, W.J.; Xu, L.; Li, L.L.; Jim, C.Y.; Wei, T.B. Holistic life-cycle accounting of carbon emissions of prefabricated buildings using LCA and BIM. Energy Build. 2022, 266, 112136. [Google Scholar] [CrossRef] [Scilit]
  7. Fan, J.S.; Liu, Y.S.; Zhou, L.; Zhao, K.R.; Cai, S.C. Prefabricated building policy and low-carbon transformation of China’s construction industry. Energy Build. 2025, 347, 116328. [Google Scholar] [CrossRef] [Scilit]
  8. Ferdous, W.; Bai, Y.; Ngo, T.D.; Manalo, A.; Mendis, P. New advancements, challenges and opportunities of multi-storey modular buildings–A state-of-the-art review. Eng. Struct. 2019, 183, 883–893. [Google Scholar] [CrossRef] [Scilit]
  9. Razzaq, A.; Sharif, A.; Najmi, A.; Tseng, M.L.; Lim, M.K. Dynamic and causality interrelationships from municipal solid waste recycling to economic growth, carbon emissions and energy efficiency using a novel bootstrapping autoregressive distributed lag. Resour. Conserv. Recycl. 2021, 166, 105372. [Google Scholar] [CrossRef] [Scilit]
  10. Luo, T.; Xue, X.L.; Wang, Y.N.; Xue, W.R.; Tan, Y.T. A systematic overview of prefabricated construction policies in China. Clean. Prod. 2021, 280, 124371. [Google Scholar] [CrossRef] [Scilit]
  11. Navaratnam, S.; Ngo, T.; Gunawardena, T.; Henderson, D. Performance review of prefabricated building systems and future research in Australia. Buildings 2019, 9, 38. [Google Scholar] [CrossRef] [Scilit]
  12. Masood, R.; Roy, K. Review on prefabricated building technology. Technology 2022, 4, 24–30. [Google Scholar] [CrossRef] [Scilit]
  13. Kim, S.; Namgung, H.; Oh, K.; Lee, J.; Jeong, K.; Hong, T.; Kong, M. BIM-IGL: A BIM-based framework for automated conceptual design integrating generative design and life cycle assessment. Energy Build. 2025, 347, 116401. [Google Scholar] [CrossRef] [Scilit]
  14. Gao, H.; Sun, M.S.; Zuo, L.; Liang, Y.W. An LCA-BIM-GIS integrated model for net carbon emission quantification of buildings. Build. Eng. 2026, 120, 115392. [Google Scholar] [CrossRef] [Scilit]
  15. Marek, J.; Darja, K. The digital twin on a residential housing in the Czech Republic on the BIM platform and its importance for the circular economy. Structures 2025, 78, 109180. [Google Scholar] [CrossRef] [Scilit]
  16. Yin, L.; Zhong, R.Y.; Besklubova, S.; Yang, Y.; Wang, J.; Qin, W. Off-site construction logistics in the context of smart BIM: Current practice, challenges and future perspectives. Comput. Ind. Eng. 2026, 216, 111967. [Google Scholar] [CrossRef] [Scilit]
  17. Hasselsteen, L.; Otovic, A.P.; Birgisdóttir, H.; Kanafani, K. Linking predictive modelling of site-level resource use with life cycle assessment of construction-phase emissions for managing carbon limits. Dev. Built Environ. 2026, 25, 100875. [Google Scholar] [CrossRef] [Scilit]
  18. Liu, Q.; Li, S.; Liu, Z.; Li, H. A BIM-Driven Dynamic LCA Framework for Net Carbon Accounting of Buildings: A Case Study in Hot-Summer Region of China. Sustainability 2026, 18, 4682. [Google Scholar] [CrossRef] [Scilit]
  19. Alvi, S.A.; Kumar, H.; Khan, R.A. Integrating BIM with carbon footprint assessment of buildings: A review. Mater. Today Proc. 2023, 93, 497–504. [Google Scholar] [CrossRef] [Scilit]
  20. Abuhussain, M.A.; Waqar, A.; Khan, A.M.; Othman, I.; Alotaibi, B.S.; Althoey, F.; Abuhussain, M. Integrating Building Information Modeling (BIM) for optimal lifecycle management of complex structures. Structures 2024, 60, 105831. [Google Scholar] [CrossRef] [Scilit]
  21. Xiong, L.; Wang, M.Q.; Mao, J.; Huang, B. A review of building carbon emission accounting methods under low-carbon building background. Buildings 2024, 14, 777. [Google Scholar] [CrossRef] [Scilit]
  22. Zhang, X.C.; Wang, F.L. Life-cycle assessment and control measures for carbon emissions of typical buildings in China. Build. Environ. 2015, 86, 89–97. [Google Scholar] [CrossRef] [Scilit]
  23. Lu, M.; Luo, Z.X.; Cang, Y.J.; Zhang, N.; Yang, L. Methods for calculating building-embodied carbon emissions for the whole design process. Fundam. Res. 2025, 5, 2187–2198. [Google Scholar] [CrossRef] [Scilit]
  24. Xu, H.J.; Kim, J.I.; Chen, J.Y. Improved framework for estimating carbon emissions from prefabricated buildings during the construction stage: Life cycle assessment and case study. Build. Environ. 2025, 272, 112599. [Google Scholar] [CrossRef] [Scilit]
  25. Myint, N.N.; Shafique, M. Embodied carbon emissions of buildings: Taking a step towards net zero buildings. Case Stud. Constr. Mat. 2024, 20, e03024. [Google Scholar] [CrossRef] [Scilit]
  26. Gao, H.; Yang, L.; Wang, X.; Zhang, L.; Wang, Q.; Wu, K. Research on Carbon Emission Pre-Assessment of Residential Buildings in Xi’an City during the Scheme Design Stage. Buildings 2024, 14, 2171. [Google Scholar] [CrossRef] [Scilit]
  27. Ding, L.Y.; Zhou, Y.; Akinci, B. Building Information Modeling (BIM) application framework: The process of expanding from 3D to computable nD. Autom. Constr. 2014, 46, 82–93. [Google Scholar] [CrossRef] [Scilit]
  28. Ullah, H.; Zhang, H.; Huang, B.; Gong, Y. BIM-Based Digital Construction Strategies to Evaluate Carbon Emissions in Green Prefabricated Buildings. Buildings 2024, 14, 1689. [Google Scholar] [CrossRef] [Scilit]
  29. Safari, K.; AzariJafari, H. Challenges and opportunities for integrating BIM and LCA: Methodological choices and framework development. Sustain. Cities Soc. 2021, 67, 102728. [Google Scholar] [CrossRef] [Scilit]
  30. Gourlis, G.; Kovacic, I. Building Information Modelling for analysis of energy efficient industrial buildings—A case study. Renew. Sustain. Energy Rev. 2017, 68, 953–963. [Google Scholar] [CrossRef] [Scilit]
  31. Succar, B. Building information modelling framework: A research and delivery foundation for industry stakeholders. Autom. Constr. 2009, 18, 357–375. [Google Scholar] [CrossRef] [Scilit]
  32. Arenas, N.F.; Shafique, M. Recent progress on BIM-based sustainable buildings: State of the art review. Dev. Built Environ. 2023, 15, 100176. [Google Scholar] [CrossRef] [Scilit]
  33. Sun, H.W.; Park, Y. CO2 emission calculation method during construction process for developing BIM-based performance evaluation system. Appl. Sci. 2020, 10, 5587. [Google Scholar] [CrossRef] [Scilit]
  34. Huang, Z.J.; Zhao, Y.; Zhou, H.; Tang, H.; Luo, A.; Lu, P.; Wang, Y.; Lin, B. Automating refined on-site construction carbon emissions calculation for prefabricated buildings based on BIM: Model development and validation. Environ. Impact Assess. Rev. 2025, 115, 107970. [Google Scholar] [CrossRef] [Scilit]
  35. Heydari, M.H.; Heravi, G. A BIM-based framework for optimization and assessment of buildings’ cost and carbon emissions. Build. Eng. 2023, 79, 107762. [Google Scholar] [CrossRef] [Scilit]
  36. Oh, M.; Jang, K.M.; Kim, Y. Empirical analysis of building energy consumption and urban form in a large city: A case of Seoul, South Korea. Energy Build. 2021, 245, 111046. [Google Scholar] [CrossRef] [Scilit]
  37. GB/T 51366-2019; Standard for Building Carbon Emission Calculation. The Ministry of Housing and Urban-Rural Development of China: Beijing, China, 2019.
  38. Abousaeidi, M.; Pignatta, G.; Nazarian, N.; Ghadiri, S.B. Balancing thermal comfort, construction feasibility, carbon emissions, and cost: Multi-criteria evaluation of passive retrofits for high-rise social housing. Energy Build. 2026, 359, 117269. [Google Scholar] [CrossRef] [Scilit]
  39. Zhang, F.; Wen, B.; Niu, D.T.; Li, A.B.; Zhou, J.; Hu, X.; Lv, Y. Lifecycle carbon emissions of reinforced concrete Buildings: Assessment and mitigation Priorities. Build. Eng. 2025, 114, 114230. [Google Scholar] [CrossRef] [Scilit]
  40. Xu, A.Y.; Zhu, Y.Y.; Wang, Z.P. Carbon emission evaluation of eight different prefabricated components during the materialization stage. Build. Eng. 2024, 89, 109262. [Google Scholar] [CrossRef] [Scilit]
  41. Gao, H.; Wang, D.L.; Du, X.X.; Zhaom, Z.W. An LCA-BIM integrated model for carbon-emission calculation of prefabricated buildings. Renew. Sustain. Energy Rev. 2024, 203, 114775. [Google Scholar] [CrossRef] [Scilit]
  42. Zhang, A.S.; Zhou, X.F.; Wang, F.L.; Yang, J. A multiobjective optimisation and display framework for time-cost-carbon emissions in building materialisation phase based on nD BIM concept. Build. Eng. 2025, 103, 111993. [Google Scholar] [CrossRef] [Scilit]
  43. Shu, Z.; Zhou, Y.L.; Liu, W.H.; Li, H.; Li, Z.; Hu, Q. Multi-objective optimization approach for timber-concrete hybrid shear wall building structures considering construction cost and carbon emissions. Structures 2025, 78, 109221. [Google Scholar] [CrossRef] [Scilit]
  44. GB/T 50500-2024; Standard for Bills of Quantities and Valuation for Construction Works. The Ministry of Housing and Urban-Rural Development of China: Beijing, China, 2024.
  45. Cabeza, L.F.; Rincón, L.; Vilariño, V.; Pérez, G.; Castell, A. Life cycle assessment (LCA) and life cycle energy analysis (LCEA) of buildings and the building sector: A review. Renew. Sustain. Energy Rev. 2014, 29, 394–416. [Google Scholar] [CrossRef] [Scilit]
  46. Cai, L.; Kang, Z.Q.; Wang, S.P.; Chang, S.S.; Yang, K.; Xia, X. Efficiency improvement in automated carbon emissions assessment: An empirical study of a BIM-LCA multi-module integrated system. Build. Eng. 2025, 114, 114339. [Google Scholar] [CrossRef] [Scilit]
  47. Sun, S.; Niu, J.G. Research on Carbon Emissions Assessment and Countermeasures for Prefabricated Buildings. Manag. Eng. 2025, 39, 55–60. [Google Scholar] [CrossRef]
  48. Deng, X.Y.; Sun, W.; Zhang, B. Comprehensive Analysis of Carbon Emissions and Costs in the Whole Life Cycle of Prefabricated Buildings: A Case Study of a Public Building in Xinghua City. Manag. Eng. 2025, 39, 49–54. [Google Scholar] [CrossRef]
  49. Qiu, Y.C. Carbon efficiency study of precast concrete components in the building materialization phase. Shanxi Archit. 2023, 49, 29–34. [Google Scholar] [CrossRef]
Figure 1. The computational framework of building materialization stage.
Sustainability 18 06174 g001
Figure 2. Overall research methodology and technical procedure.
Sustainability 18 06174 g002
Figure 3. (a) Building BIM model; (b) building structure calculation diagram.
Sustainability 18 06174 g003
Figure 4. CEs of material production stage.
Sustainability 18 06174 g004
Figure 5. The proportion of CEs of material in the material production stage.
Sustainability 18 06174 g005
Figure 6. CE intensity of transportation stage.
Sustainability 18 06174 g006
Figure 7. The proportion of CEs of material in the transportation stage.
Sustainability 18 06174 g007
Figure 8. Comparison of CE ratio of PB and TB in materialization stage.
Sustainability 18 06174 g008
Figure 9. Sensitivity analysis (left) and Monte Carlo simulation (right) for (a,b) the PB and (c,d) the TB.
Sustainability 18 06174 g009
Table 1. Carbon emission factor.
Factor TypeNamesCEFUnits
Energy TypeElectricity0.5227kgCO2/kWh
Diesel fuel3.100kgCO2/kg
Building Materials TypeConcrete295.00kgCO2/m3
Block341.00kgCO2/m3
Rebar2340.00kgCO2/t
Cement735.00kgCO2/t
Aluminum alloy doors and windows194.00kgCO2/m2
Autoclaved Lightweight Concrete (ALC) slab281.41kgCO2/m2
Composite slab692.01kgCO2/m2
Prefabricated staircase576.42kgCO2/m2
Transport Tools TypeHeavy-duty gasoline-powered freight vehicle (10 t capacity)0.104kgCO2/(t·km)
Heavy-duty diesel freight vehicle (18 t capacity)0.129kgCO2/(t·km)
OthersLabor2.07kgCO2/workday
Table 2. Composition of costs in the materialization stage.
No.Cost ItemComponents
1Work Package Costs (Bill of Quantities Items)
  • Foundation/Piling Works
  • Masonry Works
  • Reinforced Concrete Works, etc.
2Temporary Works and General Service Costs (Preliminaries/General Requirements)
  • Technical Provisional Works
  • Organizational and Site Management Costs
3Statutory Charges (Government & Administrative Fees)
4Taxes
  • Value-Added Tax
  • Surtax/Additional Levies
  • Environmental Protection Tax
5Total Materialization Stage CostSum of Items 1 to 4
Table 3. The amount of building materials extracted by the BIM model.
TypeNamesQuantitiesUnits
PBConcrete1663.62m3
Block28.79m3
Rebar175.11t
Cement50.64t
Aluminum alloy doors and windows666.14m2
ALC slab112.95m3
Composite slab58.01m3
Prefabricated staircase14.88m3
TBConcrete2001.82m3
Block241.41m3
Rebar208.42t
Cement59.49t
Aluminum666.14m2
Table 4. CE table of PB and TB material production stages.
NamesCEs of PB/(kgCO2)CEs of TB/(kgCO2)
Concrete490,767.90590,536.90
Block9817.3982,320.81
Rebar409,757.40487,702.80
Cement37,220.4043,725.15
Aluminum129,231.16129,231.16
ALC slab31,785.49-
Composite slab40,143.50-
Prefabricated staircase8577.13-
Total1,157,300.371,333,516.82
Table 5. CE table of PB and TB transportation stages.
NamesCEs of PB/(kgCO2)CEs of TB/(kgCO2)
Concrete16,500.8119,854.97
Block2228.4812,164.70
Rebar11,294.6013,443.09
Cement3266.283837.11
Aluminum1469.311469.31
ALC slab4225.40-
Composite slab9727.89-
Prefabricated staircase2289.11-
Total51,001.8650,769.18
Table 6. CE table of the PB construction machinery operation.
NamesUnitsQuantitiesCEFs
/[kgCO2/Unit]
CEs
/(kgCO2)
Laborworkday8348.322.0717,281.02
Autocraneshift14.1189.551263.42
Tower craneshift49.72184.499172.36
Portal craneshift0.2852.6114.69
Autotruckshift26.38111.792948.71
Tip lorryshift0.5218.999.87
Construction elevatorsshift37.2925.22940.34
Belt conveyershift3.8813.7953.57
Mortar mixershift7.305.1337.46
Bar straightenershift25.997.09184.29
Bar cuttershift30.9619.13592.13
Bar bendershift99.067.63755.57
Woodworking circular sawshift5.1914.3074.21
Ac weldershift53.2957.373056.99
Butt weldershift5.3472.70388.49
Electrode dry ovenshift3.703.9914.78
Total36,787.90
Table 7. CE table of TB construction machinery operation.
NamesUnitsQuantitiesCEFs
/[kgCO2/Unit]
CEs
/(kgCO2)
Laborworkday8668.102.0717,942.96
Autocraneshift14.1189.551263.42
Tower craneshift49.72184.499172.36
Autotruckshift26.38111.792948.71
Tip lorryshift0.2218.994.14
Construction elevatorsshift37.2925.22940.34
Mortar mixershift6.255.1332.06
Bar straightenershift27.177.09192.64
Bar cuttershift24.4019.13466.81
Bar bendershift103.167.63786.87
Woodworking circular sawshift4.9814.3071.16
Ac weldershift53.2957.373056.99
Butt weldershift8.7072.70632.28
Electrode dry ovenshift5.313.9921.19
Total37,531.93
Table 8. Comparative analysis of CEs during the materialization stage.
StageCEs of PB
/kgCO2
CEs of TB
/kgCO2
CEs Increment
/kgCO2
Material production stage1,157,300.371,333,516.82176,216.45
Transportation stage51,001.8650,769.18−232.68
On-site construction stage36,787.9037,531.93744.03
Total1,245,090.131,421,817.93176,727.80
Table 9. Elasticity coefficients of embodied carbon emissions for the PB.
ParameterSensitive Emission ComponentsAffected Emissions/kgCO2Share of Total Emissions/%Elasticity
Electricity emission factor40% of material production + electricity-driven on-site machinery478,205.0338.41%3.841%
Diesel emission factor10% of material production + diesel-driven on-site machinery119,952.049.63%0.963%
Transportation distance of concreteConcrete transport emissions16,500.811.325%0.1325%
Transportation distance of other materialsOther-material transport emissions34,501.052.771%0.2771%
Construction machinery efficiencyElectricity- and diesel-driven on-site machinery19,506.881.566%0.1424%
Table 10. Elasticity coefficients of embodied carbon emissions for the TB.
ParameterSensitive Emission ComponentsAffected Emissions/kgCO2Share of Total Emissions/%Elasticity
Electricity emission factor40% of material production + electricity-driven on-site machinery548,779.4338.60%3.860%
Diesel emission factor10% of material production + diesel-driven on-site machinery137,567.959.28%0.928%
Transportation distance of concreteConcrete transport emissions19,854.971.396%0.1396%
Transportation distance of other materialsOther-material transport emissions30,914.212.174%0.2174%
Construction machinery efficiencyElectricity- and diesel-driven on-site machinery19,588.971.378%0.1252%
Table 11. Cost comparison between the PB and the TB during the materialization stage.
Cost ItemPB Cost
/CNY
TB Cost
/CNY
Cost Difference
/CNY
Work Package Costs4,116,765.364,270,714.35153,948.99
Temporary Works and General Service Costs1,071,950.831,080,817.458866.62
Statutory Charges121,763.31126,030.344267.03
Taxes535,296.34552,138.2616,841.92
Total5,845,775.846,029,700.40183,924.56
Table 12. Detailed breakdown of work package costs for PB and TB (CNY).
Cost Sub-CategoryPBTBDifference
On-site concrete works1,018,2001,505,600−487,400
Rebar works884,5001,052,500−168,000
Prefabricated component supply and installation1,392,800-+1,392,800
Masonry and finishing works412,600868,300−455,700
Formwork and scaffolding408,665844,314−435,649
Total work package costs4,116,7654,270,714−153,949
Disclaimer/Publisher’s Note: The statements, opinions and data contained in all publications are solely those of the individual author(s) and contributor(s) and not of MDPI and/or the editor(s). MDPI and/or the editor(s) disclaim responsibility for any injury to people or property resulting from any ideas, methods, instructions or products referred to in the content.