Article

Coordinated Urban Sustainable Development from a Multidimensional Efficiency Perspective: Spatiotemporal Evolution and Nonlinear Drivers Across Chinese Cities


1
School of Art, Shandong University of Science and Technology, Qingdao 266590, China
2
Faculty of Environmental Engineering, Graduate School of Environmental Engineering, The University of Kitakyushu, Kitakyushu 808-0135, Japan
3
School of New Energy, Yulin University, Yulin 719000, China
4
School of Architecture and Design, Harbin Institute of Technology, Harbin 150001, China
*
Author to whom correspondence should be addressed.
Sustainability 2026, 18(12), 6082; https://doi.org/10.3390/su18126082
Submission received: 11 May 2026 / Revised: 5 June 2026 / Accepted: 10 June 2026 / Published: 12 June 2026
(This article belongs to the Section Sustainable Urban and Rural Development)

Abstract

Urban sustainable development increasingly depends on interactions among multiple urban subsystems, yet existing studies often overlook cross-regional linkages and nonlinear development processes. This study investigates the coordinated development of urbanization, smart development, resilience, and low-carbon transition (USRL) from an efficiency perspective. Using panel data from 278 Chinese cities during 2010–2023, this work integrates the Super-SBM model, the Local–Tele Coupling Coordination Degree (LTCCD) framework, Dagum Gini decomposition, and machine learning techniques to examine the spatiotemporal evolution, spatial disparities, and driving mechanisms of coordinated development. The results show that coordinated development improved steadily over time, although subsystem evolution remained uneven, with resilience lagging behind other dimensions. Regional disparities gradually narrowed, but inter-regional differences remained the dominant source of spatial inequality. Innovation intensity, industrial upgrading, and high-quality foreign investment positively contributed to coordinated development, whereas fiscal and financial factors exhibited nonlinear effects. Interaction analysis further revealed that coordinated development is shaped by the combined influence of multiple drivers rather than by individual factors alone. Our findings suggest that urban sustainable development is jointly influenced by subsystem coordination, cross-regional interactions, and nonlinear development dynamics, highlighting the importance of integrating local and tele-coupling processes in urban sustainability research.

1. Introduction

Cities are important places where economic growth, social development, environmental governance, and technological innovation converge, making them a key stage for advancing sustainable development goals [1]. However, rapid urbanization, while bringing significant economic and social benefits, is also accompanied by increased energy consumption and carbon emissions. These processes not only exacerbate global climate change but also trigger a series of interconnected challenges, including glacial melting, extreme weather events, ecological degradation, and social inequality, which increasingly constrain the realization of sustainable urban development [2,3,4]. As these challenges become increasingly complex and interconnected, relying on a single-dimensional development path or isolated policy interventions is no longer sufficient. Instead, urban sustainability increasingly depends on the coordinated operation and dynamic interaction of multiple urban systems. This understanding has prompted scholars and policymakers to move beyond sector-specific development strategies and towards a more comprehensive and systematic approach to governance. This transformation is reflected in global initiatives such as the Paris Agreement and the United Nations Sustainable Development Goals (SDGs), which emphasize the importance of building a resilient, low-carbon, inclusive, and sustainable urban future [5]. Therefore, understanding how different urban systems interact, co-evolve, and jointly shape sustainable development outcomes has become a core challenge for sustainability science and urban policy research.
Urban sustainability depends on more than economic growth or environmental protection alone. Recent research has increasingly emphasized the need to integrate urbanization, digital transformation, resilience, and low-carbon transition within a unified sustainability framework [6,7,8,9]. At the same time, advances in digital technologies and green innovation are reshaping how cities allocate resources, manage environmental pressures, and respond to external shocks [10,11]. These developments have encouraged scholars to view cities as complex and interconnected systems rather than collections of independent sectors [12,13]. Sustainable development therefore depends not only on the performance of individual subsystems but also on how these subsystems interact, adapt, and evolve together over time.
Despite growing attention to multidimensional urban sustainability, important research gaps remain. (1) Most existing studies focus on individual dimensions of sustainability or a limited set of subsystem interactions, providing only a partial understanding of how multiple urban systems jointly shape sustainable development outcomes. (2) While coupling coordination approaches have generated valuable insights into interactions within cities, they provide limited evidence regarding how cities influence one another through spatial linkages, factor flows, and spillover effects [14,15]. As regional integration deepens, such cross-regional interactions are becoming increasingly important for understanding urban development dynamics. (3) Urban sustainability is shaped by complex feedback among economic, technological, social, and environmental processes. These relationships are often nonlinear, yet they are commonly examined using linear analytical frameworks [16]. Together, these limitations hinder a more comprehensive understanding of how coordinated development emerges through both local subsystem interactions and cross-regional spatial linkages. Methodologically, the measurement of coordinated development has also evolved from conventional Coupling Coordination Degree (CCD) models toward more refined analytical approaches. The CCD framework has been widely used to evaluate interactions among multiple subsystems. However, it has been criticized for its tendency to overestimate coordination levels and its limited ability to distinguish heterogeneous development states. To address these limitations, the Coupling Coordination Assessment (CCA) model improves the sensitivity and discriminatory power of coordination measurement. Nevertheless, both CCD and CCA primarily focus on interactions within individual spatial units and provide limited consideration of cross-regional linkages. As urban development is increasingly shaped by inter-city factor flows, spatial spillovers, and regional integration, there is a growing need for analytical frameworks capable of simultaneously capturing local interactions and tele-coupling processes across cities.
In response to these research challenges, this study develops an efficiency-oriented urbanization–smartness–resilience–low-carbon (USRL) framework to explore the coordinated development of multidimensional urban systems. Using panel data for 278 Chinese cities from 2010 to 2023, the analysis investigates temporal evolution, spatial differentiation, and driving mechanisms from both local and cross-regional perspectives. To achieve this objective, the study integrates the LTCCD framework, spatial inequality decomposition, and machine learning-based interpretation methods. Compared with previous studies, the present research offers three main advances: (1) It conceptualizes urban sustainability as an integrated coordination process involving urbanization, smart development, resilience, and low-carbon transition, thereby providing a multidimensional perspective on urban system evolution. (2) It extends conventional coordination analysis by explicitly considering tele-coupling relationships among cities and examining their implications for coordinated development. (3) It identifies nonlinear response patterns among major driving factors through interpretable machine learning techniques, enriching current understanding of the mechanisms associated with urban sustainability transitions.

2. Data Sources and Indicator System

2.1. Study Area

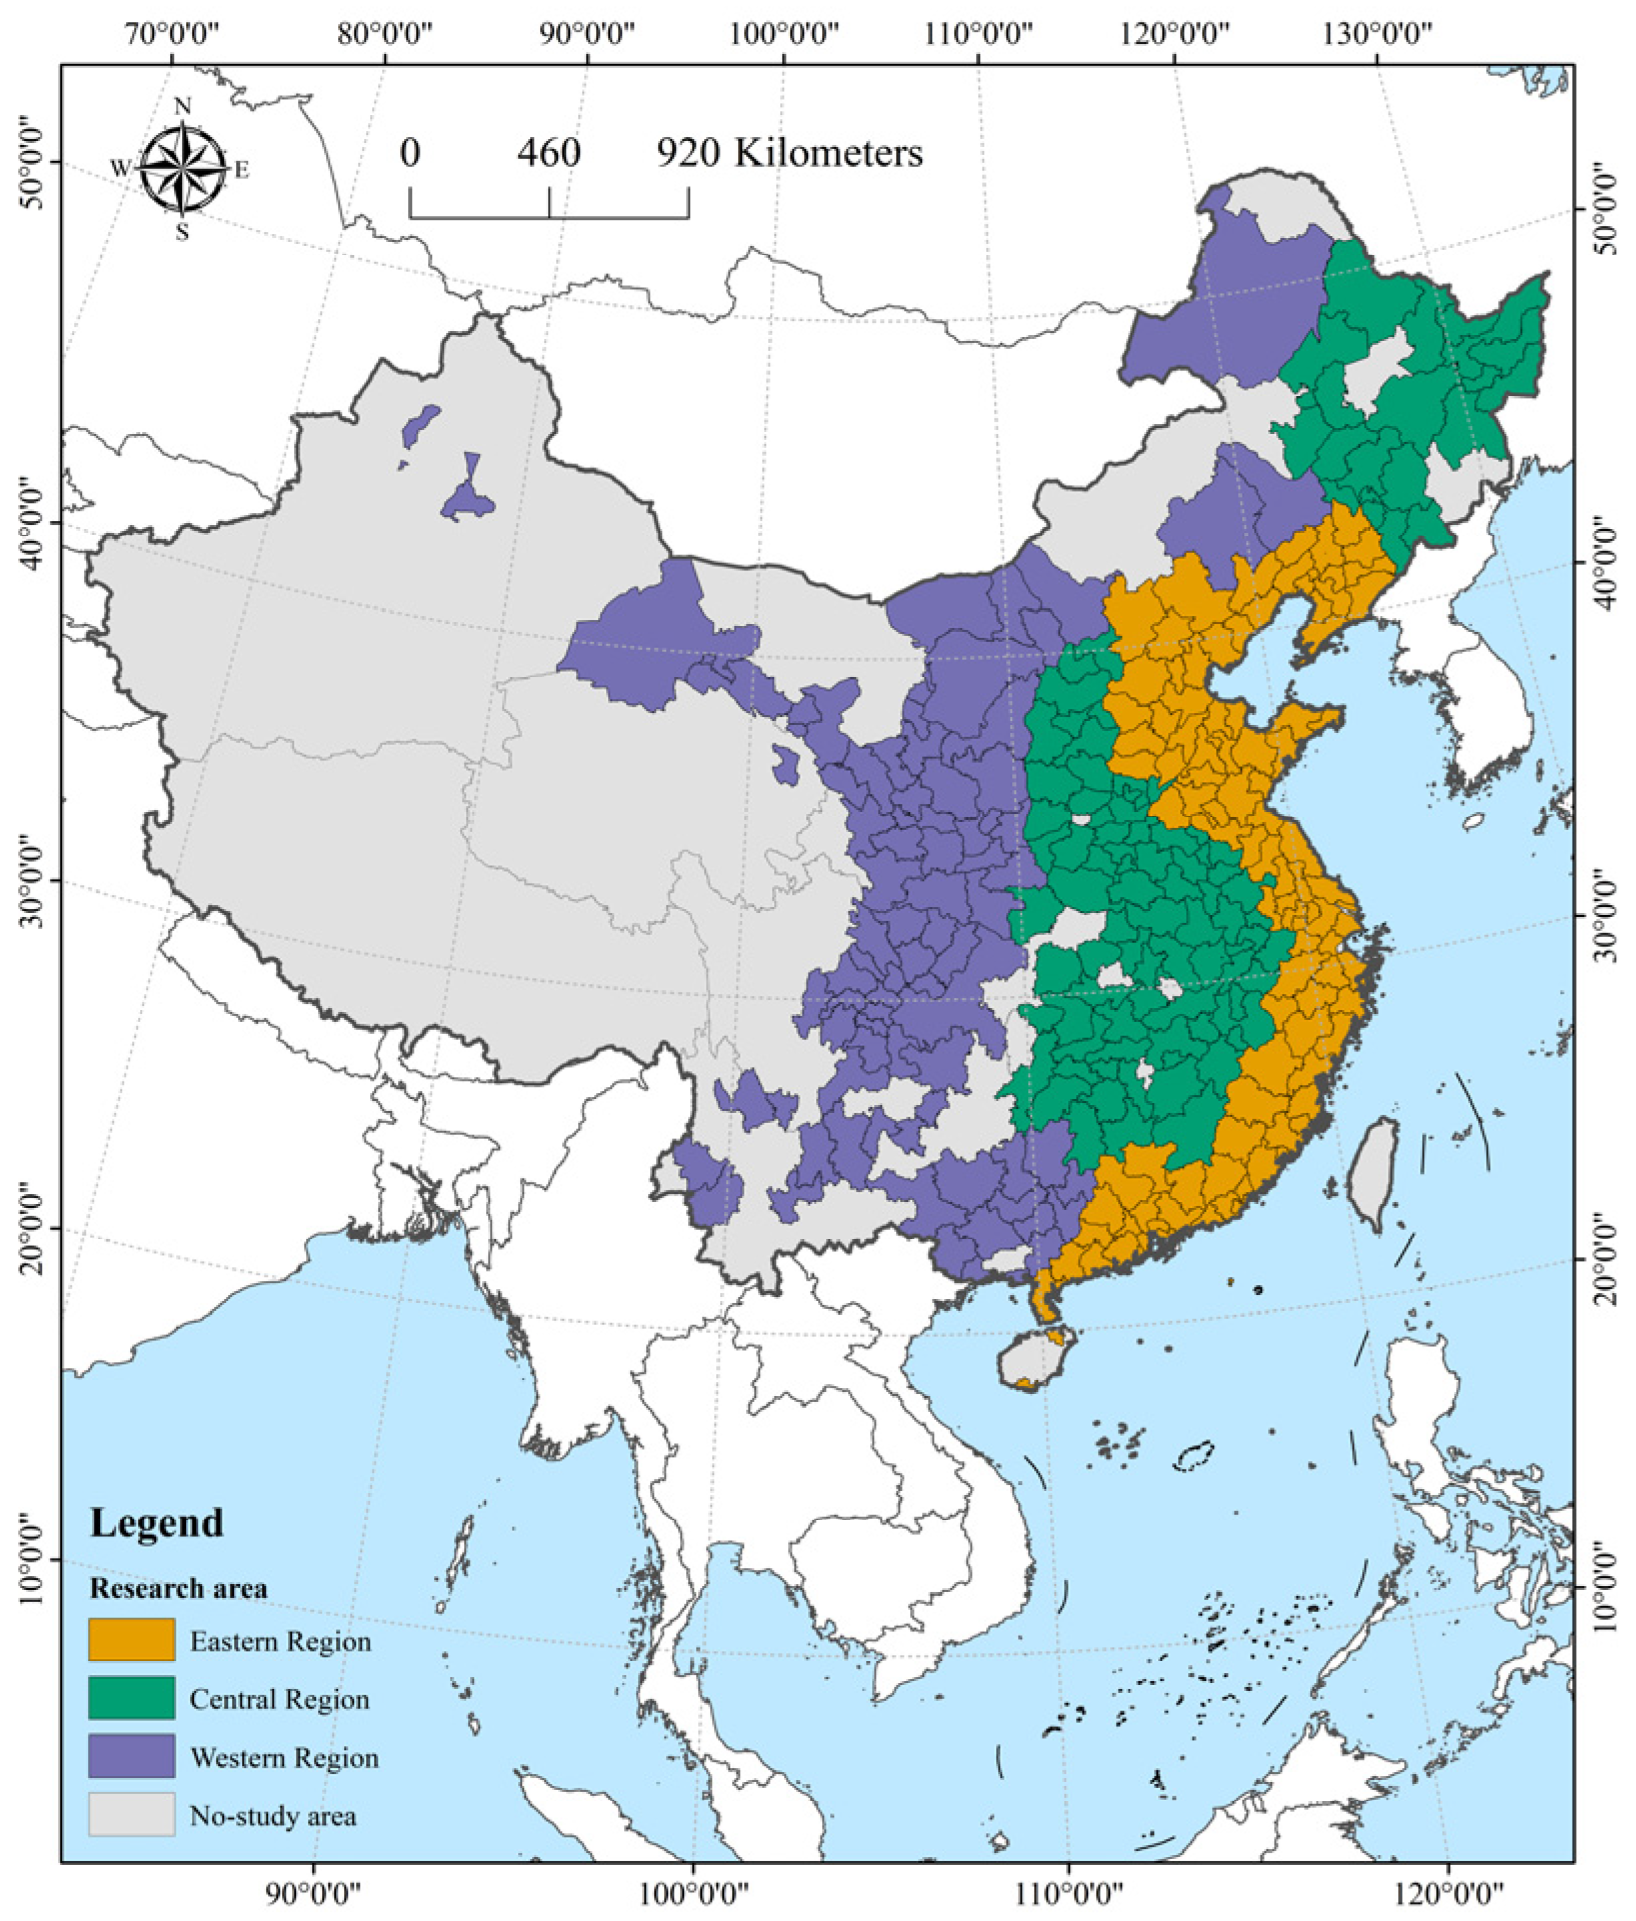
The study focuses on 278 prefecture-level cities in China during the period 2010–2023 (Figure 1). Owing to pronounced differences in economic development, urban expansion, technological advancement, and environmental conditions, Chinese cities provide a diverse empirical setting for exploring the coordinated development of the urbanization–smart development–resilience–low-carbon (USRL) system. The sample encompasses cities distributed across the country’s principal urban agglomerations and strategic development corridors, thereby capturing a wide range of regional characteristics. To examine potential spatial heterogeneity, the cities are categorized into eastern, central, and western regions according to the classification commonly adopted in previous studies [17]. The spatial location of the study area is shown in Figure 1.

2.2. Theoretical Framework of Efficiency-Oriented USRL System Development

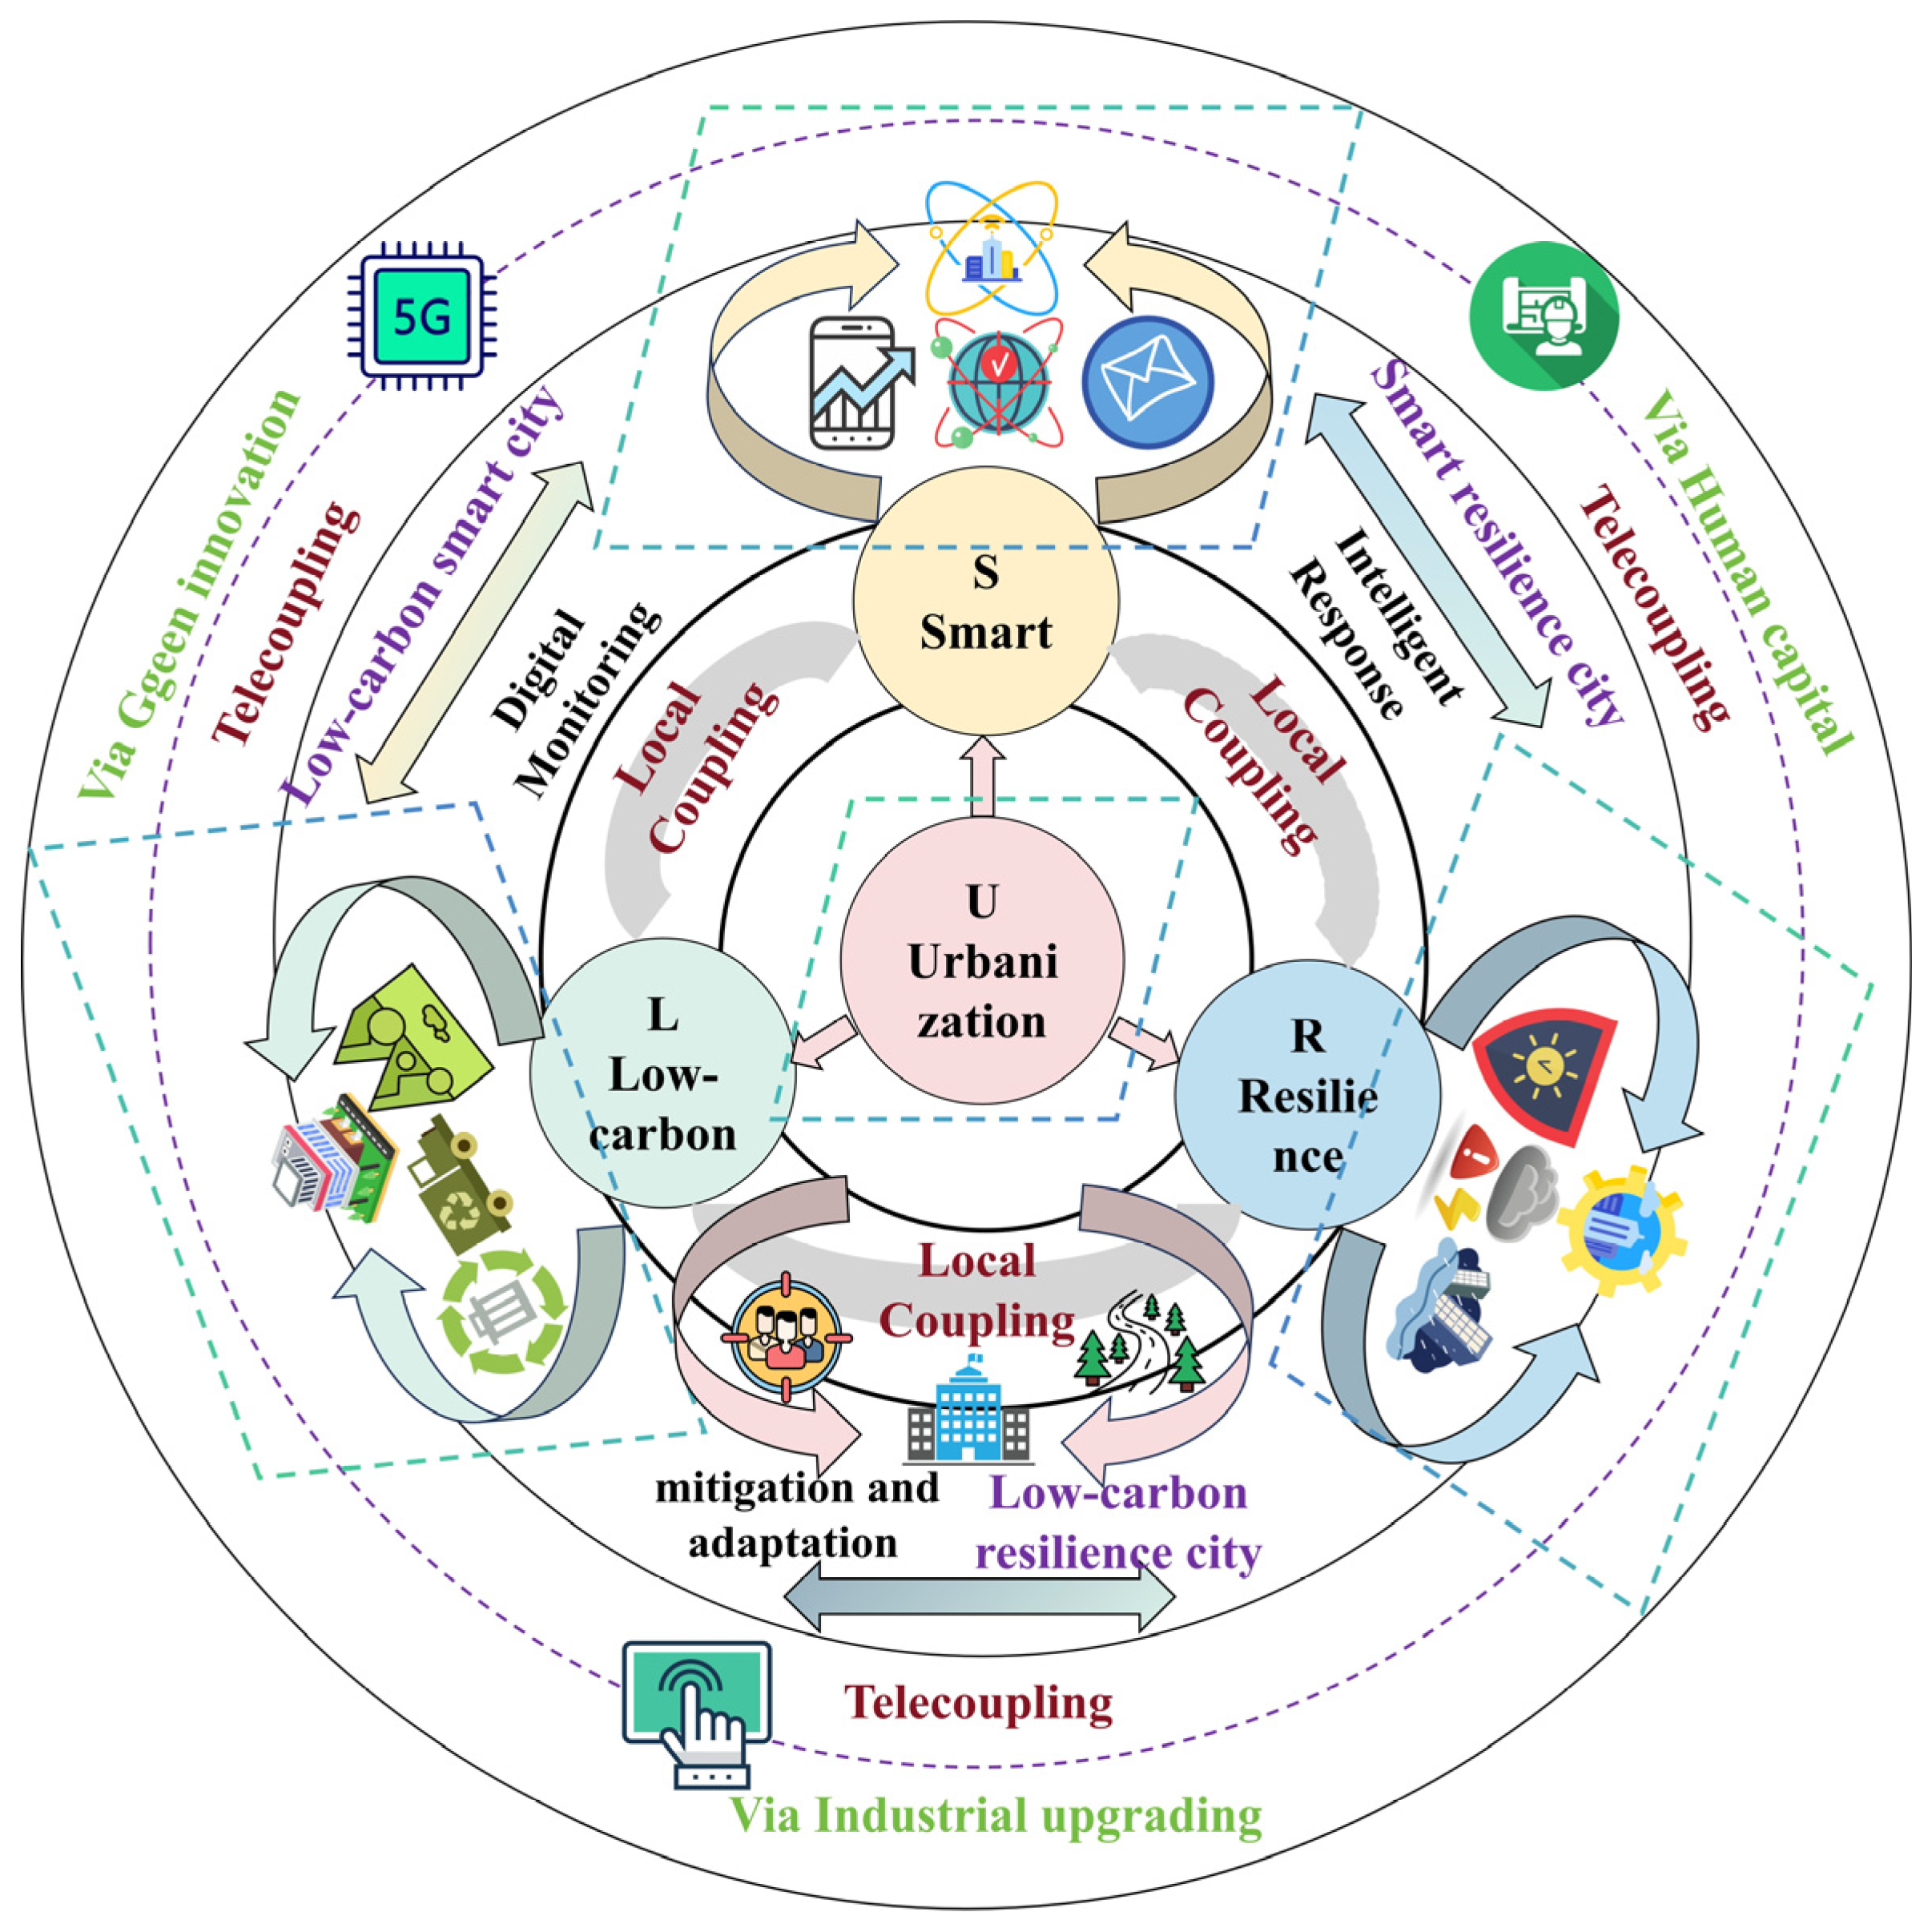
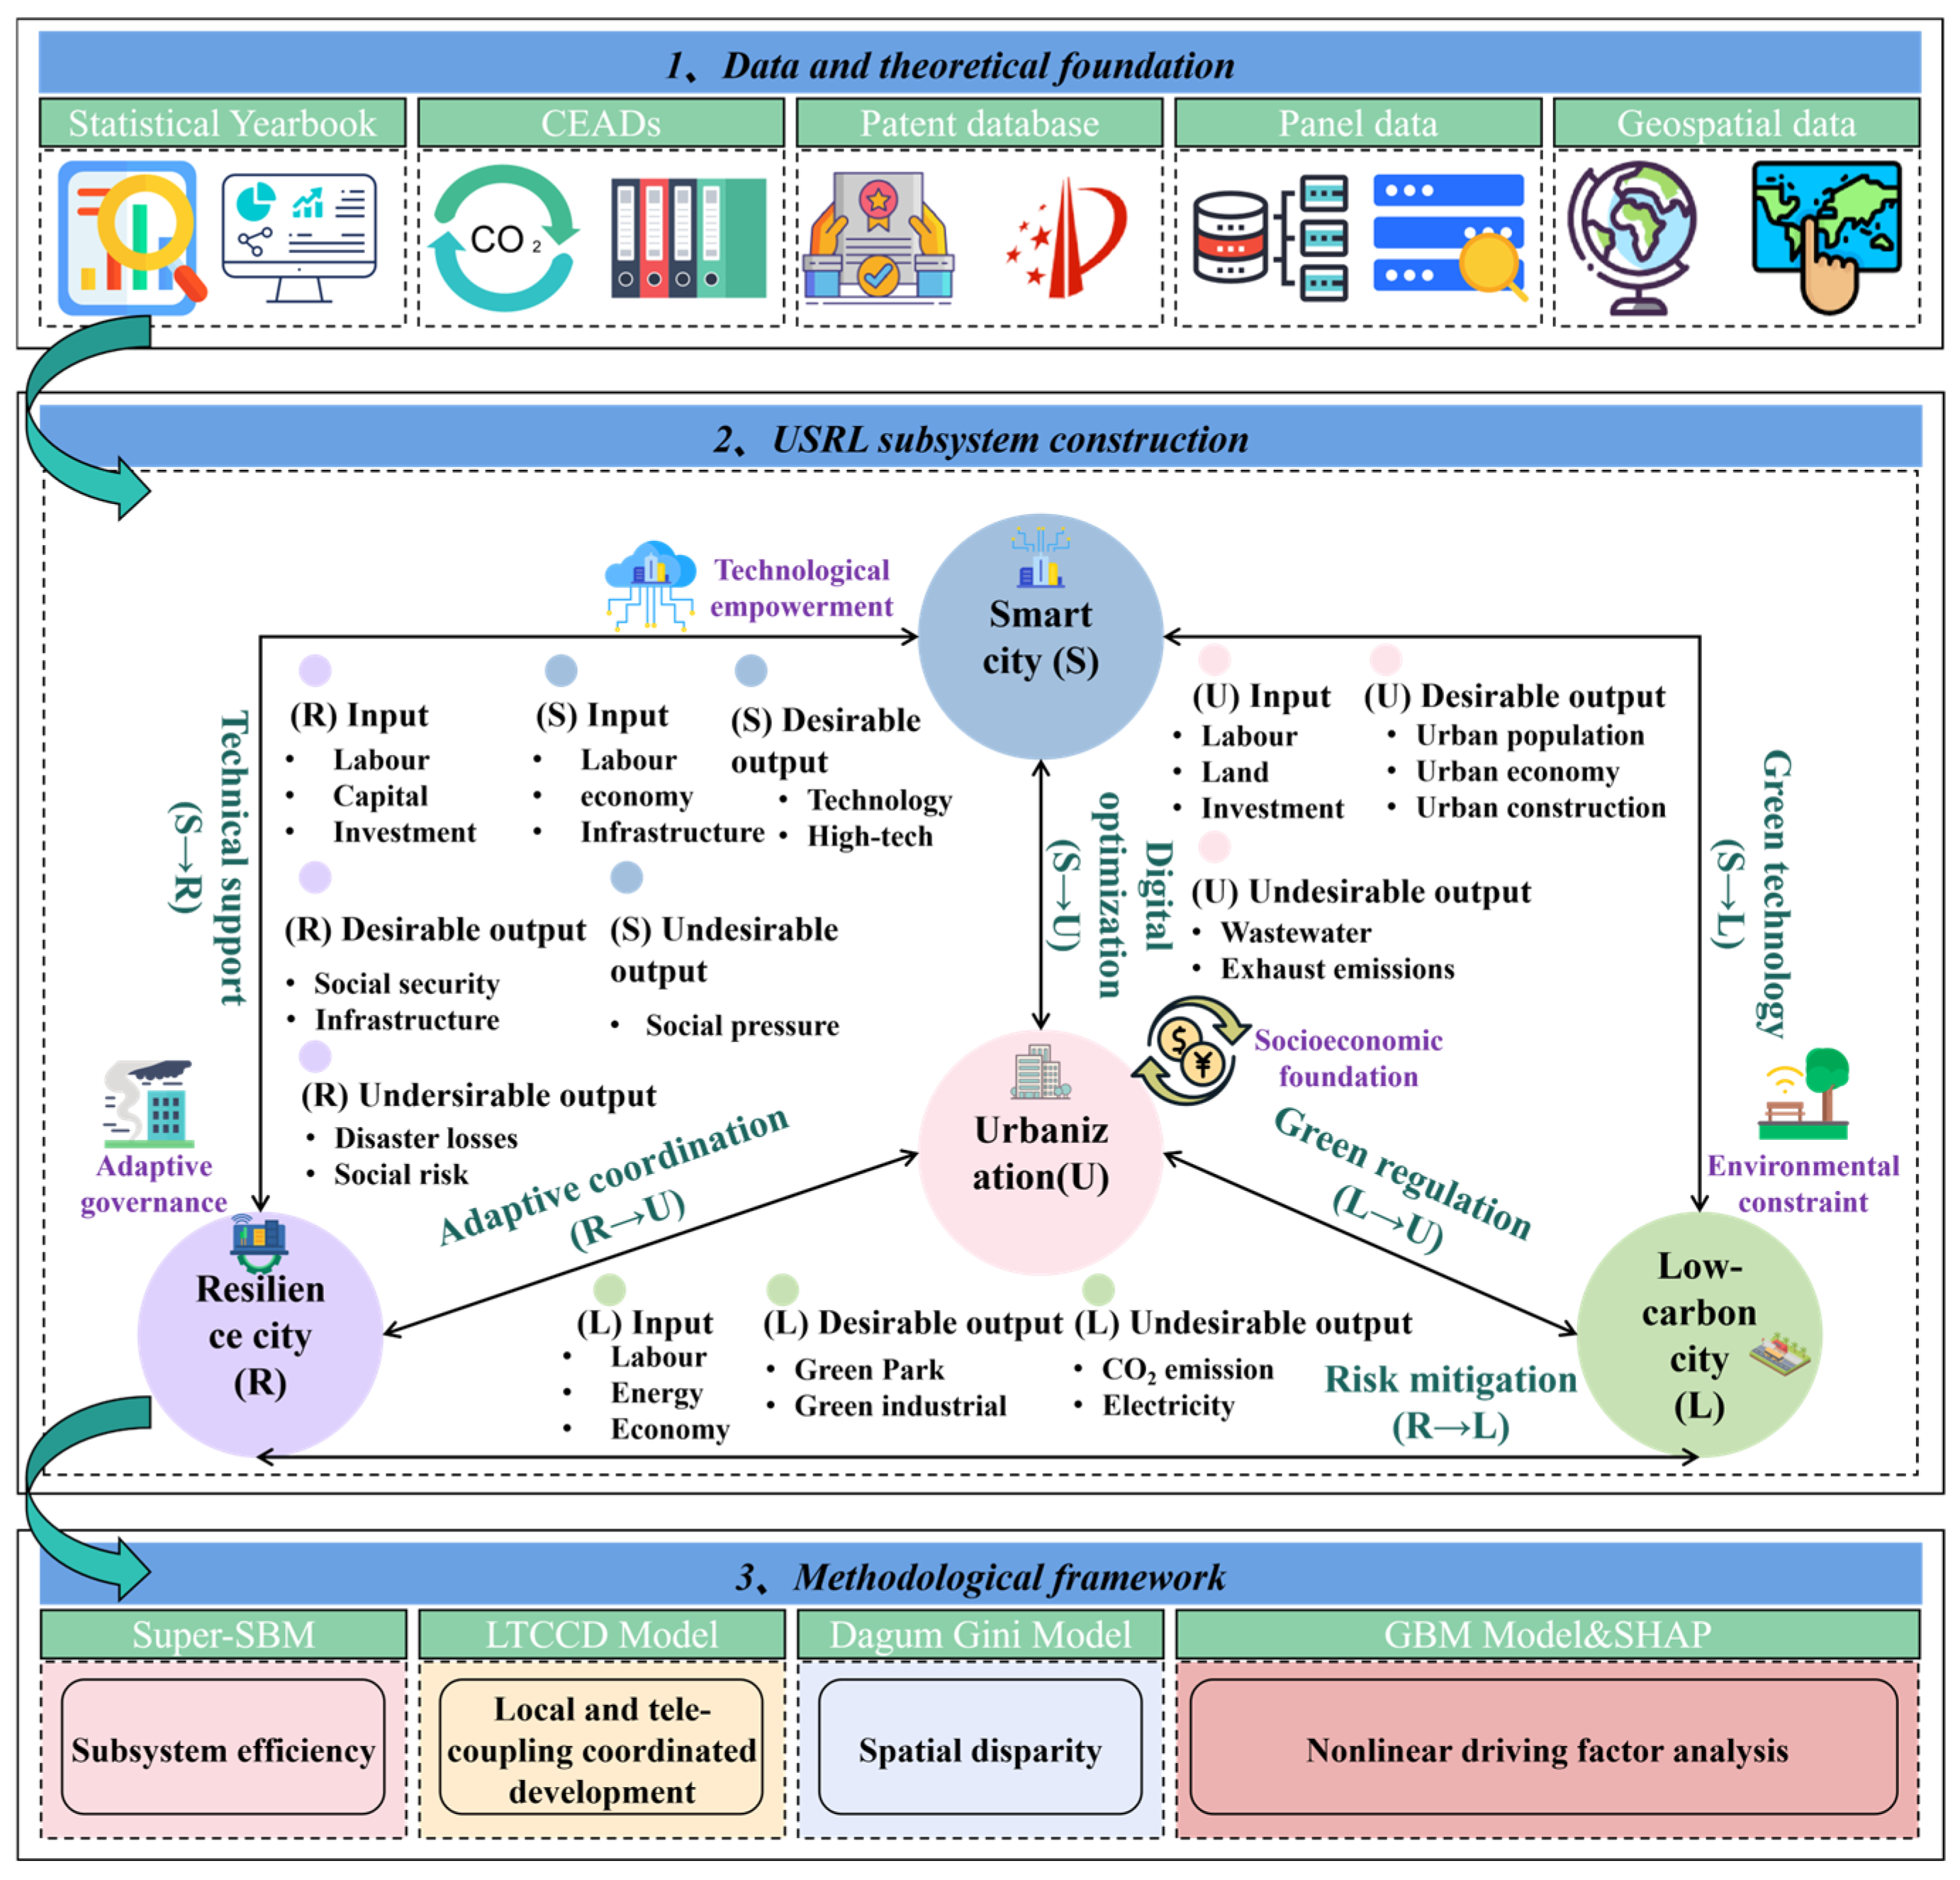
Urban sustainable development emerges from interactions among multiple urban systems rather than from the optimization of any single dimension [18]. Drawing on urban sustainability theory and the SDGs, this study develops an urbanization–smartness–resilience–low-carbon (USRL) framework to capture the multidimensional processes underlying sustainable urban development [19,20]. As shown in Figure 2, the framework links subsystem interactions, factor transformation processes, and efficiency outcomes within a unified analytical perspective. The framework comprises four interrelated subsystems: urbanization, smart development, resilience, and low-carbon transition. Together, these subsystems shape how cities mobilize resources, respond to environmental and socioeconomic challenges, and pursue sustainable development pathways. Following an input–output perspective, labor, capital, energy, technology, and human resources are treated as key production factors. Through the operation of the four subsystems, these inputs are transformed into desirable outcomes, such as economic development, social welfare, environmental improvement, and technological progress, while also generating undesirable outcomes, including carbon emissions and environmental pressures [21]. Urban system efficiency is therefore defined as the ability to maximize desirable outcomes while minimizing undesirable outcomes under given resource constraints.
The framework further conceptualizes coordinated development through two complementary forms of interaction: local coupling and tele-coupling [22]. Local coupling describes interactions among subsystems within a city. For example, smart development can enhance resilience through intelligent monitoring and response systems, while low-carbon initiatives can strengthen resilience through ecological governance and climate adaptation. At the same time, urbanization provides the socioeconomic foundation for technological upgrading and green transformation, facilitating the coordinated evolution of the entire system. Tele-coupling captures interactions between cities arising from the movement of technology, capital, information, and human resources. In the USRL framework, these cross-regional interactions are primarily transmitted through channels such as green innovation, human capital mobility, and industrial upgrading. Through these pathways, technological knowledge, skilled labor, and advanced production factors can diffuse across regions, generating spatial spillovers that influence development trajectories beyond local boundaries. As urban systems become increasingly interconnected, coordinated development depends not only on local subsystem interactions but also on cross-regional linkages. Building on this perspective, the coordinated development of the USRL system is assessed as an efficiency-based process shaped by both local and tele-coupling interactions. Subsystem efficiencies provide the foundation for evaluating coordinated development, while the LTCCD framework captures the extent to which these efficiencies evolve in a balanced and mutually reinforcing manner across space. Compared with conventional coupling coordination approaches that primarily focus on intra-city relationships, this framework explicitly incorporates inter-city interactions and spatial spillover effects, providing a broader perspective for understanding urban sustainable development.

2.3. Indicator System for Evaluating USRL Subsystem Efficiency

To quantify the efficiency of the USRL system, this study develops an indicator framework grounded in urban sustainability theory, input–output theory, and SDGs. Consistent with the efficiency-oriented perspective adopted in this study, indicator selection emphasizes the transformation of resource inputs into desirable and undesirable outputs rather than providing a comprehensive assessment of urban development. Indicators were selected according to three principles: theoretical relevance, input–output consistency, and long-term data comparability across Chinese cities. The resulting indicator system is presented in Table 1.
The urbanization subsystem focuses on the efficiency of economic development and urban construction. Inputs capture labor, land, and fiscal resources, while outputs reflect population concentration, economic performance, and urban development outcomes. Environmental pollution indicators are incorporated as undesirable outputs to account for the ecological costs associated with urban expansion [23,24,25,26,27,28]. The smart development subsystem evaluates the efficiency of technological advancement and digital transformation. Inputs represent human resources, digital infrastructure, and technological investment. Desired outputs capture innovation performance and high-tech development, while unemployment is included as an undesirable output to reflect potential social pressures associated with technological transformation [29,30,31,32,33]. The resilience subsystem assesses the efficiency with which cities convert governance, infrastructure, and socioeconomic resources into resilience outcomes. Desired outputs represent social security and infrastructure support capacity, whereas undesirable outputs capture social risks and disaster-related losses. This design emphasizes resilience, governance, and resource transformation efficiency rather than a comprehensive assessment of all resilience dimensions [34,35,36,37,38,39]. The low-carbon subsystem measures the efficiency of green development and carbon reduction. Inputs include labor, energy consumption, and capital investment. Desired outputs reflect ecological improvement and green economic transformation, while carbon emissions and electricity consumption are treated as undesirable outputs to capture environmental costs associated with urban development [40,41,42,43,44,45,46]. Together, these indicators provide a unified basis for evaluating the efficiency of the four USRL subsystems and support subsequent analyses of coordinated development under the LTCCD framework.

2.4. Data Source

The empirical dataset was assembled using information from national statistical publications and specialized databases. Variables reflecting economic development, energy consumption, infrastructure provision, and social conditions were mainly extracted from the China Urban Statistical Yearbook, China Energy Statistical Yearbook, and the Statistical Bulletin of National Economic and Social Development. Patent statistics were acquired from the China National Intellectual Property Administration, and carbon emission records were obtained from the China Emission Accounts and Datasets (CEADs). In line with existing research [47], industrial robot density was derived according to the following procedure:
R o b o t i t = s = 1 s e m p l o y s i t e m p l o y i t R o b o t s t e m p l o y s t
In the above equation, i represents the city, s represents the industry, t represents the year, and R o b o t s t represents the number of robots installed in the industrial sector. e m p l o y s t represents the size of the labor force in the industrial sector. e m p l o y i t represents the total number of workers. e m p l o y s i t represents the number of workers employed in the industrial sector.

3. Methodology

Figure 3 presents the overall analytical framework of this study. The framework consists of three interconnected components: data and theoretical foundations, USRL subsystem interactions, and methodological analysis. (1) The framework integrates multiple data sources, including statistical yearbooks, CEADs, patent databases, panel data, and geospatial information. Based on the USRL framework and efficiency-oriented evaluation principles, an indicator system is constructed to measure the urbanization, smart development, resilience, and low-carbon subsystems. (2) The framework conceptualizes urban sustainable development as the outcome of interactions among the four USRL subsystems. Urbanization provides the socioeconomic foundation, smart development drives technological advancement, resilience supports adaptive governance, and low-carbon transition constrains environmental impacts. Through local and tele-coupling processes, these subsystems jointly shape the coordinated development of urban systems. (3) A set of complementary methods is employed to evaluate subsystem efficiency, coordinated development, spatial disparities, and nonlinear driving mechanisms. The Super-SBM model measures subsystem efficiencies, the LTCCD model assesses coordinated development under local and tele-coupling interactions, the Dagum Gini coefficient examines spatial disparities, and the GBM-SHAP framework identifies nonlinear and interactive effects among key drivers. The main symbols and definitions used in the subsequent models are summarized in Table 2.

3.1. Simplified Super-SBM Model

This study evaluates the performance of urbanization, smart development, resilience, and low-carbon subsystems through an efficiency-based framework. Because the production process involves multiple inputs as well as desirable and undesirable outputs, efficiency estimation is conducted using the Super-SBM approach [48]. The method incorporates non-radial slack adjustments and permits ranking among frontier observations, thereby improving the identification of efficiency differences across cities. To capture variations in production scale, a variable returns-to-scale specification is adopted [49]. The corresponding model is expressed as follows:
ρ * = min 1 m i = 1 m x ¯ i x i 0 1 S 1 + S 2 r = 1 S 1 y r g y r 0 g + r = 1 S 2 y r b y r 0 b
s . t . x ¯ j = 1 , k n θ j x j , y ¯ g j = 1 , k n θ j y j g , y ¯ b j = 1 , k n θ j y j b x ¯ x 0 , y ¯ g y 0 g , y ¯ b y 0 b , y ¯ g 0 , θ 0
Here, ρ * represents the target efficiency value of the decision-making unit (DMU), and ρ * 1 indicates that the DMU is DEA efficient, where ρ * <   1 indicates inefficiency. A larger value of ρ * corresponds to a higher efficiency level. x i o , y r 0 g , and y r 0 b represent the input, desirable output, and undesirable output of the DMU at time t , respectively.
m , S 1 , and S 2 denote the numbers of input indicators, desirable outputs, and undesirable outputs, respectively. x ¯ i , y ¯ r g , and y ¯ b g represent the projected input, desirable output, and undesirable output vectors after slack adjustment. θ j denotes the intensity variable used to construct the production frontier, while x ¯ i 0 , y ¯ r 0 g , and y ¯ r 0 b denote the slack variables for inputs, desirable outputs, and undesirable outputs, respectively. In addition, the VRS assumption is satisfied through the convexity constraint j = 1 n θ j = 1 .

3.2. LTCCD Model

The Coupling Coordination Degree (CCD) model is widely used to assess the coordinated development of multiple systems through the coupling degree (C), comprehensive development index (T), and coordination degree (D). However, conventional CCD models primarily focus on interactions within the same spatial unit and fail to account for interregional linkages and spatial spillover effects. To address this shortcoming, this study employs the Local and Tele-Coupling Coordination Degree (LTCCD) model combined with an inverse-distance weighting scheme to capture spatial interactions among cities [50,51]. Within this framework, local coupling describes interactions among urbanization, smart development, resilience, and low-carbon subsystems within a city, whereas tele-coupling represents cross-city interactions driven by the flow of technology, capital, information, and other production factors, whose influence diminishes with geographic distance. By simultaneously incorporating local and tele-coupling effects, the LTCCD model enables a more comprehensive evaluation of coordinated development across both intra-city and inter-city dimensions. The model is specified as follows:
C U E 1 , U E 2 , U E 3 , U E 4 = U E 1 × U E 2 × U E 3 × U E 4 4 U E 1 + U E 2 + U E 3 + U E 4 4
In this formula, U E 1 , U E 2 , U E 3 , and U E 4 represent the development efficiencies of urbanization, smart city development, resilience, and low-carbon development, respectively. The value C U E 1 , U E 2 , U E 3 , U E 4 represents the coupling degree of the city’s four-dimensional system. During the calculation process, values U E 1 , U E 2 , U E 3 , and U E 4 must first be standardized to ensure that they fall within the range of 0 to 1. Subsequently, the comprehensive development index and the coupling coordination degree are calculated. This paper assumes that all urban subsystems have equal importance, as detailed below:
T = i = 1 n α i × U E i
α 1 = α 2 = α 3 = α 4 = 1 4
D = C × T
Building on the CCD model, this paper employs the spatial inverse-distance weighting interpolation method to calculate the local coupling and tele-coupling coefficients of the USRL system and to derive the combined short- and long-range coupling coefficient through weighting. The local coupling and tele-coupling coefficients are defined as follows:
C s i = μ C 1 + λ C 2
C 1 = C U E 1 i , U E 2 i , U E 3 i , U E 4 i
C 2 = k = 1 , k i n W i k × C t e l e i , k + k = 1 , k i n W k i × C t e l e k , i 2
C t e l e i , k = 4 U E 1 i × U E 2 k × U E 3 k × U E 4 k 4 U E 1 i + U E 2 k + U E 3 k + U E 4 k
In the above equation, C s i represents the local coupling and tele-coupling degrees of the USRL system. This paper assumes that the weights of local coupling and tele-coupling are equally important for the dynamic coordinated development of the USRL system. Thus, μ = λ = 0.5 corresponds to this. i represents a specific urban area, n represents the number of urban areas, and k is an integer ranging from 1 to n , where k 1 . C t e l e i , k denotes the tele-coupling interaction between a boundary of an urban area i and k other urban areas. W i k is a weight based on the inverse distance weighting method, defined as follows:
W i k = d i k p k = 1 n d i k p
In the above equation, d i k represents the distance between the regional administrative center of City i and that of City k . p represents the distance–decay coefficient in the inverse-distance weighting process. A larger p value indicates a stronger distance–decay effect, meaning that nearby cities exert greater spatial influence while long-range interactions weaken more rapidly. Conversely, smaller p values imply slower spatial attenuation and stronger long-distance interaction effects. A larger value places greater emphasis on nearby cities and weakens long-distance interactions more rapidly, whereas a smaller value implies slower spatial attenuation and stronger long-range effects. Following existing literature, this study sets p = 2 to balance local and tele-coupling interactions [52].
The local coupling and tele-coupling comprehensive development index comprises the local coupling comprehensive development index and the tele-coupling comprehensive development index, defined as follows:
T s i = μ T 1 + λ T 2
T 1 = T U E 1 i , U E 2 i , U E 3 i , U E 4 i
T 2 = k = 1 , k i n W i k × T t e l e i , k + k = 1 , k i n W k i × T t e l e k , i 2
T t e l e i , k = 4 U E 1 i × U E 2 k × U E 3 k × U E 4 k 4 U E 1 i + U E 2 k + U E 3 k + U E 4 k
In the above equation, T s i represents the comprehensive development index for both local coupling and tele-coupling interactions within the USRL system. μ = λ = 0.5 indicates that the contribution coefficients of the local coupling and tele-coupling comprehensive development indices are equally weighted. T 1 represents the local coupling comprehensive development index of the USRL system, and T 2 represents the tele-coupling comprehensive development index of the USRL system. T t e l e i , k represents the tele-coupling interactions between the boundary of a given urban area and other systems in other urban areas.
D s i = C s i × T s i
In the above equation, C s i represents the local coupling and tele-coupling degrees of the USRL system, T s i represents the local coupling and tele-coupling comprehensive development index of the USRL system, and D s i represents the local coupling and tele-coupling coordination degree of the USRL system. D s i is divided into ten levels based on numerical value, as follows (Table 3):

3.3. Dagum Gini Coefficient Model

The spatial differentiation of coordinated development in the USRL system is evaluated using the Dagum Gini decomposition framework. Unlike a single inequality measure, this approach separates total disparity into within-region effects, between-region effects, and trans-variation components, thereby revealing the internal composition of regional differences. This feature provides a more detailed representation of the spatial disparity structure. The model can be expressed as follows:
G = j = 1 k h = 1 k i = 1 n j r = 1 n h y j i y h r / 2 n 2 y ¯
Y ¯ h Y ¯ j Y ¯ k
Under the Dagum decomposition approach, total inequality is attributed to three underlying sources: disparities within regions, disparities across regions, and the trans-variation effect. The mathematical relationship among these components is specified as follows:
G j j = 1 2 Y ¯ j i = 1 n j r = 1 n j y j i y j r n j 2
G j h = i = 1 n j r = 1 n h y j i y h r n j n h Y j + Y h
G w = j = 1 k G j j P j S j
G n b = j = 2 k h = 2 j = 1 G j h P j S h + P h S j D j h
G t = j = 2 k h = 1 j 1 G j h P j S h + P h S j 1 D j h
D j h = d j h P j h d j h + P j h
d j h = 0 d F j y 0 y y x d F h x
P j h = 0 d F j y 0 y y x d F j x
In these equations, P j = n j / n and S j = n j Y ¯ j n μ represent the cumulative distributions of system efficiency for regions j and h . The statistic d j h characterizes the magnitude of efficiency differences between the two regional groups based on their expected sample values. Meanwhile, P j h denotes the first-order moment of the trans-variation term, describing the expected value generated from the pooled observations of the two regions.

3.4. Machine Learning Models

3.4.1. Model Selection

To explore the nonlinear drivers of coordinated development in the USRL system, this study employs interpretable machine learning methods [53]. Eight explanatory variables representing innovation, talent reserves, economic openness, and industrial upgrading are selected as potential driving factors, as detailed in Appendix Table A1. To identify the most suitable model, performance is evaluated using prediction accuracy and interpretability criteria. Root Mean Square Error (RMSE) is adopted as the primary evaluation metric, with lower RMSE values indicating better predictive performance.
R M S E = 1 N i = 1 N y j y ^ i 2
R a d j 2 = 1 1 R 2 N 1 N k 1
R 2 = 1 i = 1 N y i y ^ i 2 i = 1 N y i y ¯ 2
In the above expression, R 2 represents the proportion of variation in the dependent variable accounted for by the model. Higher R 2 values indicate better predictive performance and stronger consistency between model estimates and observed data. Here, y i ¯ refers to the sample mean of the observed values, and the computation of the corresponding error term is provided in Equation (30).
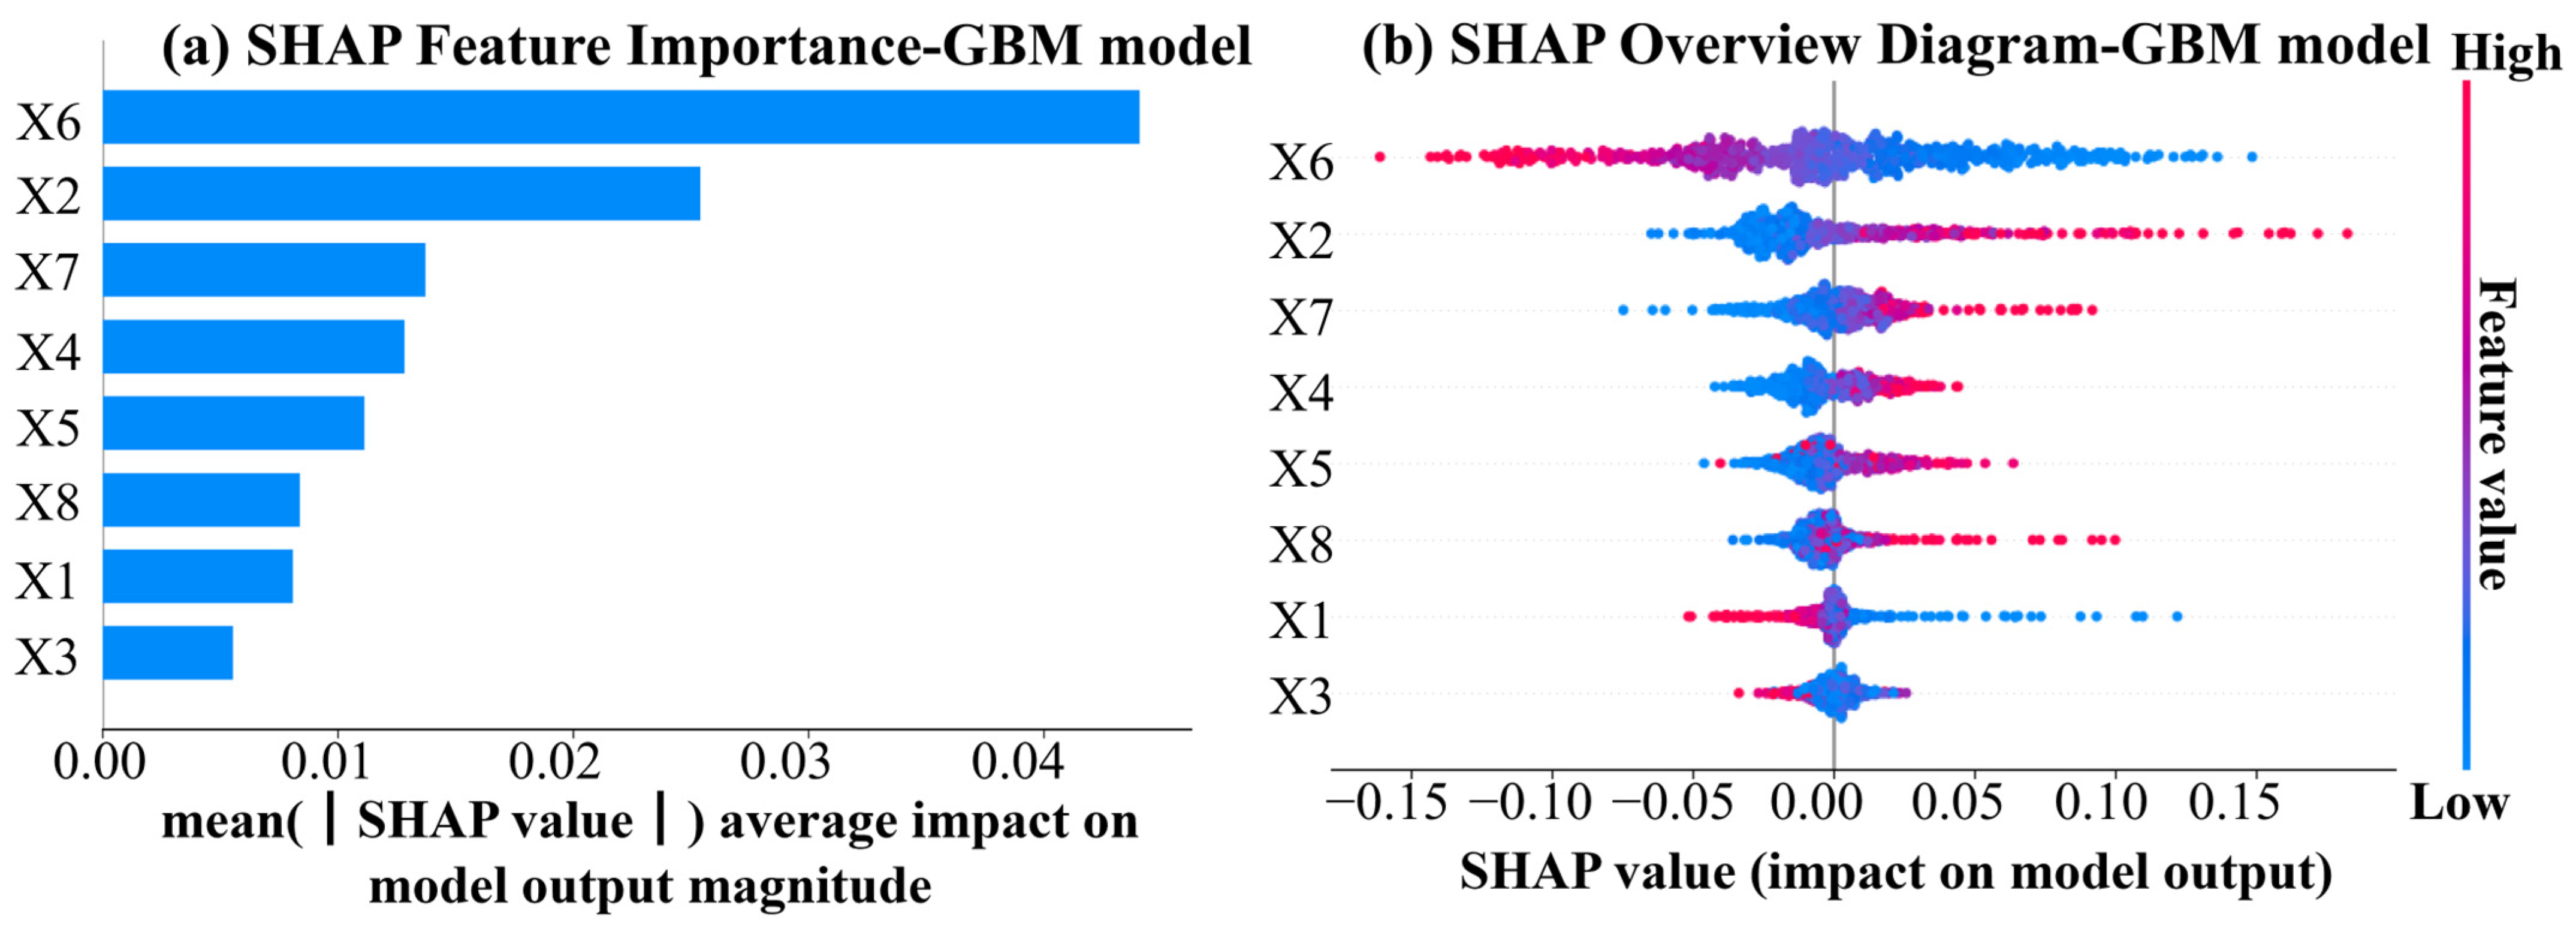
The panel dataset was chronologically divided into a training set (2010–2019) and a testing set (2020–2023) to facilitate robust model evaluation. To avoid temporal information leakage associated with random sampling, a rolling-origin time-series cross-validation procedure was adopted, in which the training window was progressively expanded and validated on subsequent observations. Hyperparameter tuning was conducted using the Optuna framework combined with time-series cross-validation, improving search efficiency and model generalization. The optimal GBM hyperparameter configuration is reported in Appendix Table A2. The optimized parameter settings for all candidate machine learning models are reported in Appendix Table A3. Among the evaluated algorithms, GBM exhibited the strongest predictive performance and was selected as the benchmark model for subsequent interpretation. Feature importance estimates derived from the GBM model are illustrated in Figure 4, with the five leading variables retained for subsequent analysis.

3.4.2. SHAP

To improve the interpretability of the machine learning results, the SHAP framework is applied to quantify the contribution of individual factors to coordinated development in the USRL system. Derived from cooperative game theory, SHAP decomposes model predictions by assigning contribution values to explanatory variables according to their marginal effects across all possible feature combinations. The approach provides interpretable insights at both the overall and individual observation levels, enabling the evaluation of variable importance and their influence on prediction outcomes. In this study, SHAP values are employed to identify the relative importance of driving factors and to characterize their nonlinear relationships with coordinated development. The SHAP value can be calculated as follows:
ϕ i = s M i S ! N S 1 ! N f S i f S
In Equation (31), the SHAP value φ i quantifies the contribution of feature i to the prediction outcome. The calculation is based on the change in model output generated by introducing the feature into different feature subsets. Here, N denotes the full set of explanatory variables, and S refers to any subset excluding feature i . The term S represents the size of subset S , whereas f S and f S i denote the corresponding prediction results without and with the inclusion of feature i , respectively. The combinational weighting factor assigns contributions across all feasible feature subsets in accordance with the Shapley allocation rule.
In addition, the additive nature of SHAP enables each prediction value to be decomposed into the sum of individual feature contributions and a baseline component, which can be written as follows:
y ^ = ϕ 0 + i = 1 n ϕ i
In Equation (32), y ^ represents the predicted outcome of observation i , whereas ϕ 0 = E f X denotes the reference prediction obtained from the training dataset. The term i = 1 n ϕ i captures the cumulative contribution of all features to the deviation of the prediction from the reference value. This additive representation enables the prediction outcome to be decomposed into feature-specific effects while maintaining coherence between local explanations and the overall model structure.
The SHAP value ϕ i captures the directional contribution of feature i to the model output relative to the baseline prediction. Positive values indicate that the feature shifts the prediction toward a higher outcome, whereas negative values indicate a reduction in the predicted value. The absolute value of ϕ i provides a quantitative measure of the feature’s contribution strength. Based on this additive attribution mechanism, the prediction equation can be further expressed as follows:
y ^ = ϕ 0 + ϕ s u m
The term ϕ s u m = i = 1 n ϕ i represents the aggregate departure of the prediction from the baseline value resulting from the combined effects of all features. Analysis of SHAP values enables the contribution of individual factors to the USRL system efficiency to be quantified and compared. Consequently, the relative importance of different drivers and their influence patterns on coordinated development can be systematically identified.

4. Results

For spatial visualization, the natural breaks (Jenks) classification method is applied to the subsystem efficiency and coordinated development values of the USRL system. This approach maximizes within-class homogeneity while enhancing the identification of spatial clustering patterns and regional disparities.

4.1. Evolution of the Spatiotemporal Characteristics of USRL System Subsystem Efficiency

4.1.1. Evolution of Urbanization Efficiency

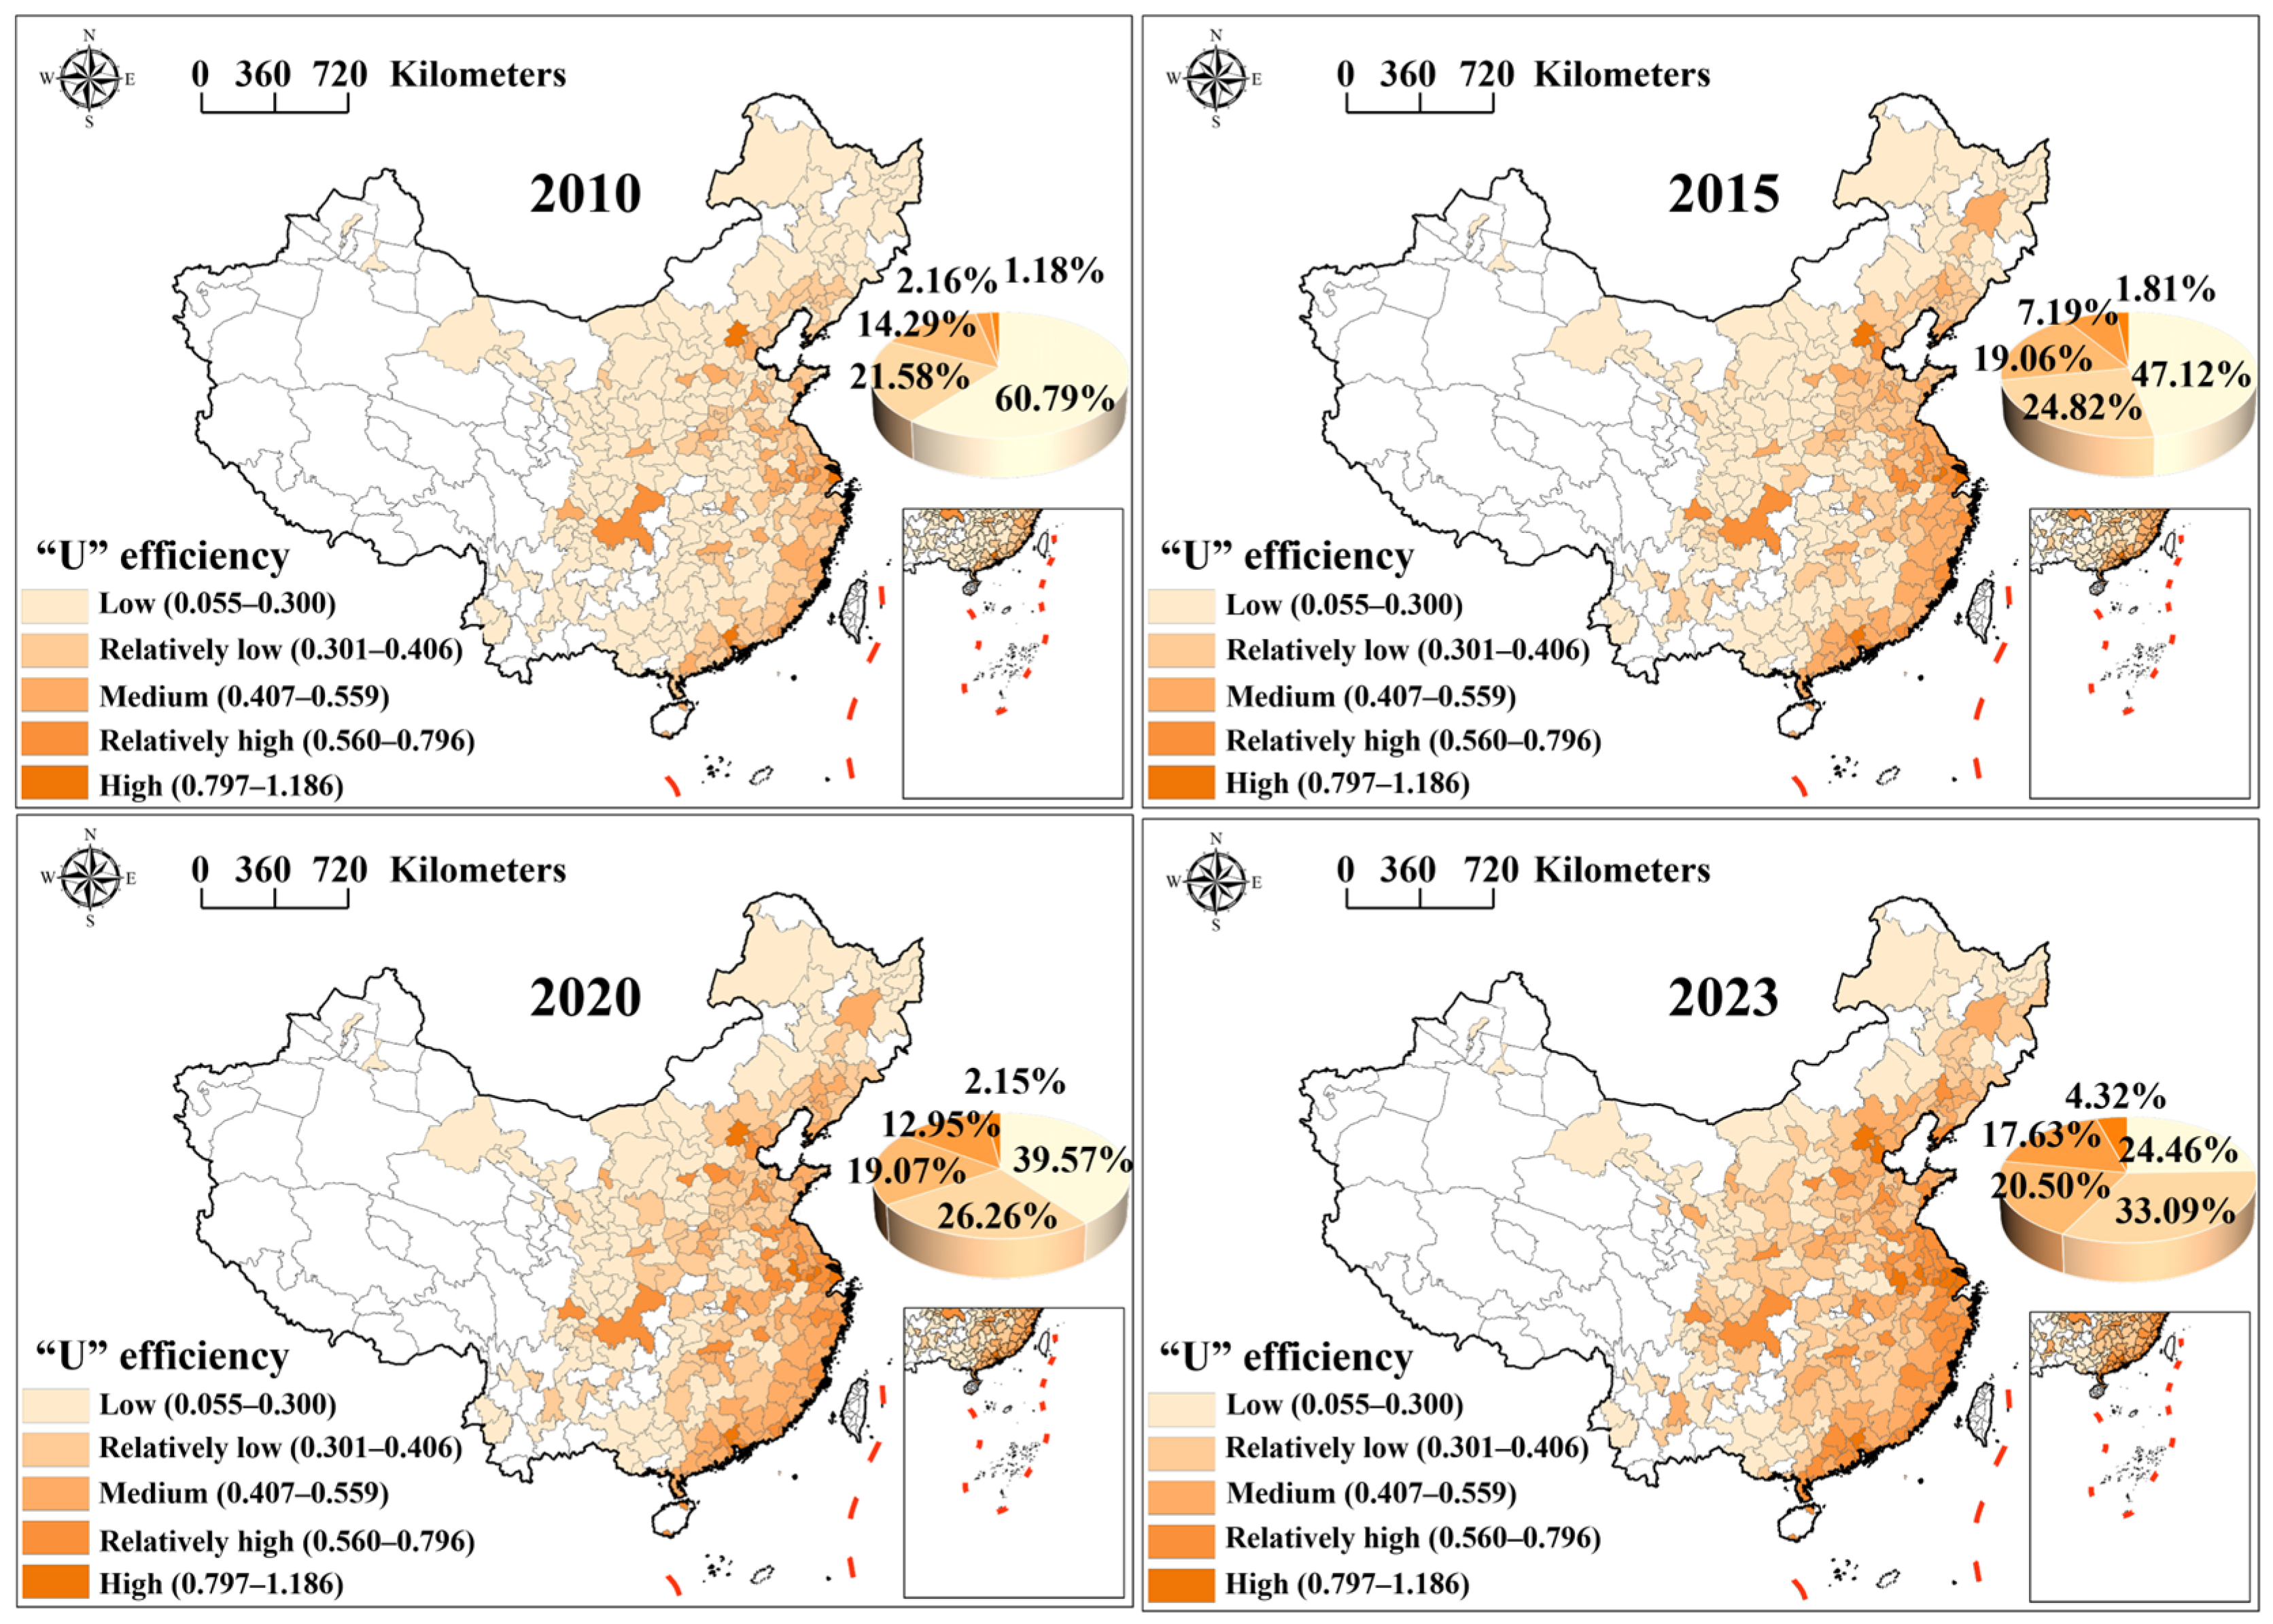
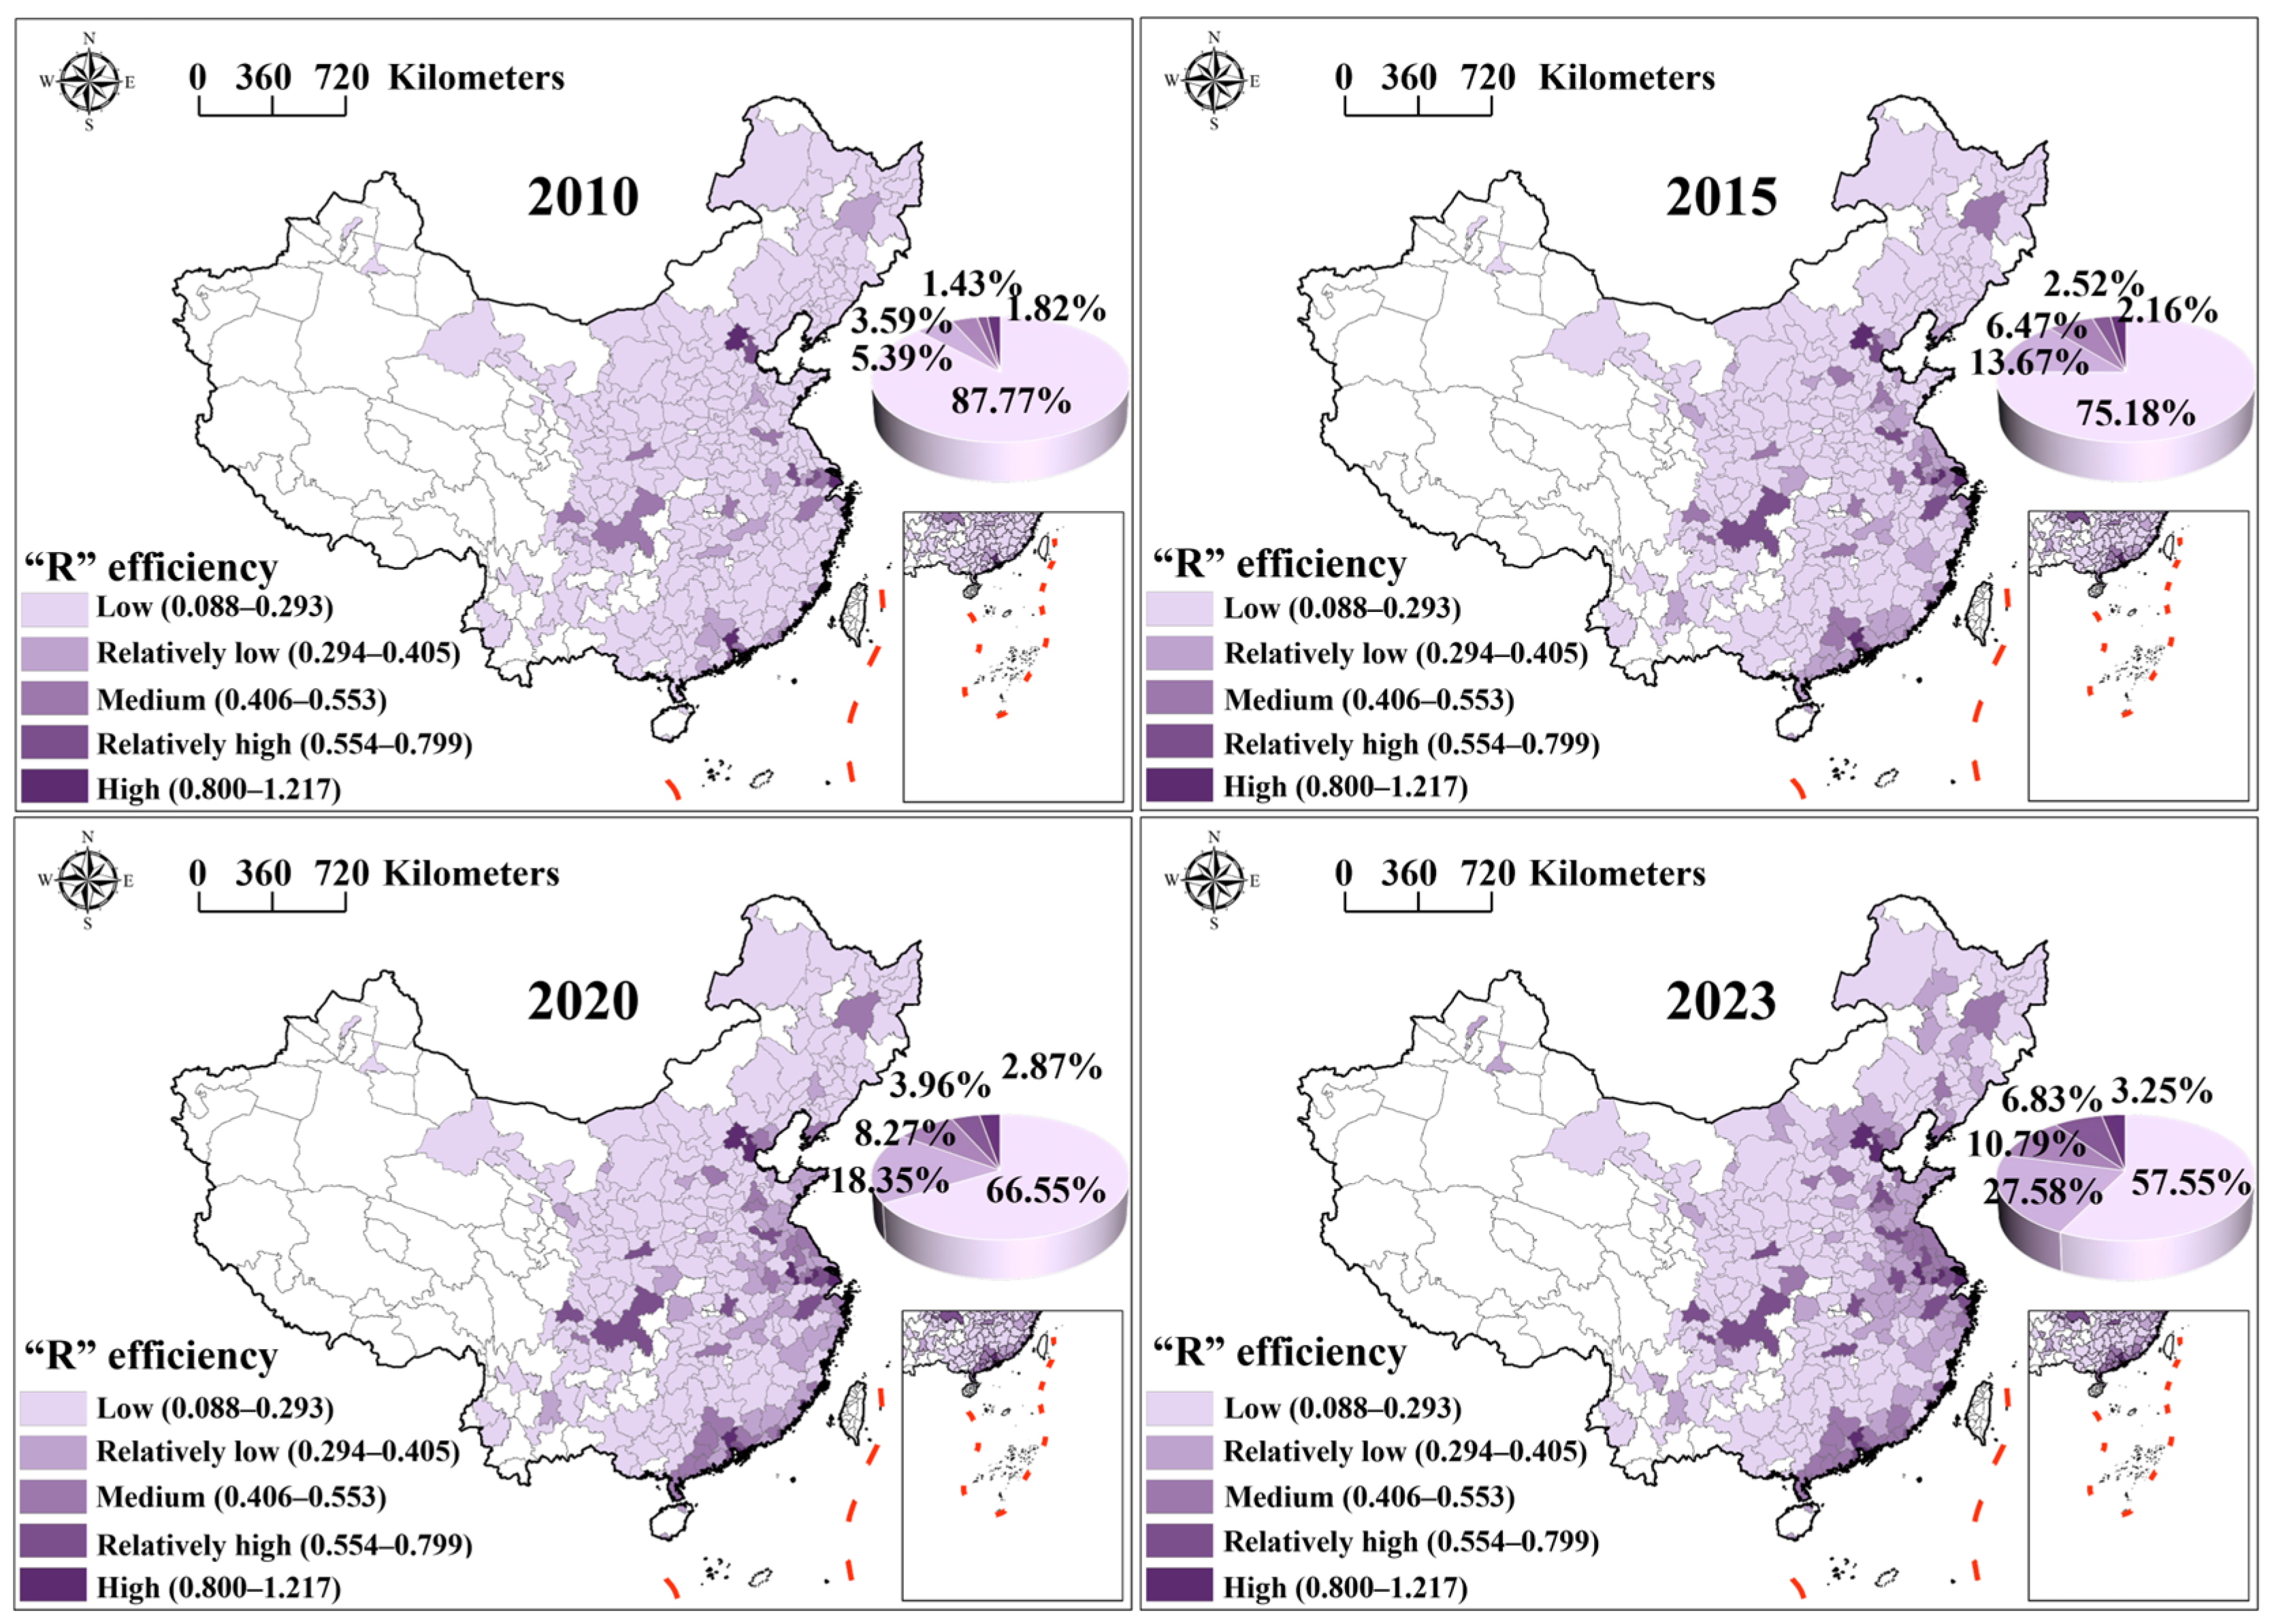
Figure 5 presents the evolution of urbanization efficiency across Chinese cities between 2010 and 2023. The results indicate a continuous improvement in efficiency levels over time. The proportion of low-efficiency cities declined from 60.79% in 2010 to 24.46% in 2023, while the shares of medium-, relatively high-, and high-efficiency cities increased steadily. Consequently, cities characterized by medium or higher efficiency became the dominant group by the end of the study period. Spatially, urbanization efficiency displayed an evident process of concentration and expansion. In 2010, relatively high- and high-efficiency cities were mainly distributed within several coastal urban agglomerations. Over time, these concentration areas broadened geographically, leading to a more extensive distribution of higher-efficiency cities. By 2023, high-efficiency areas were no longer confined to the eastern coastline but had expanded into parts of central and southwestern China, forming several contiguous zones of relatively high efficiency. Despite the overall upward trend, a pronounced regional differentiation persisted. Cities with higher urbanization efficiency remained concentrated in eastern China, whereas lower-efficiency cities were predominantly located in western and northeastern regions. The resulting spatial configuration suggests a stable east–west gradient in urbanization efficiency throughout the study period.

4.1.2. Evolution of Smart City Efficiency

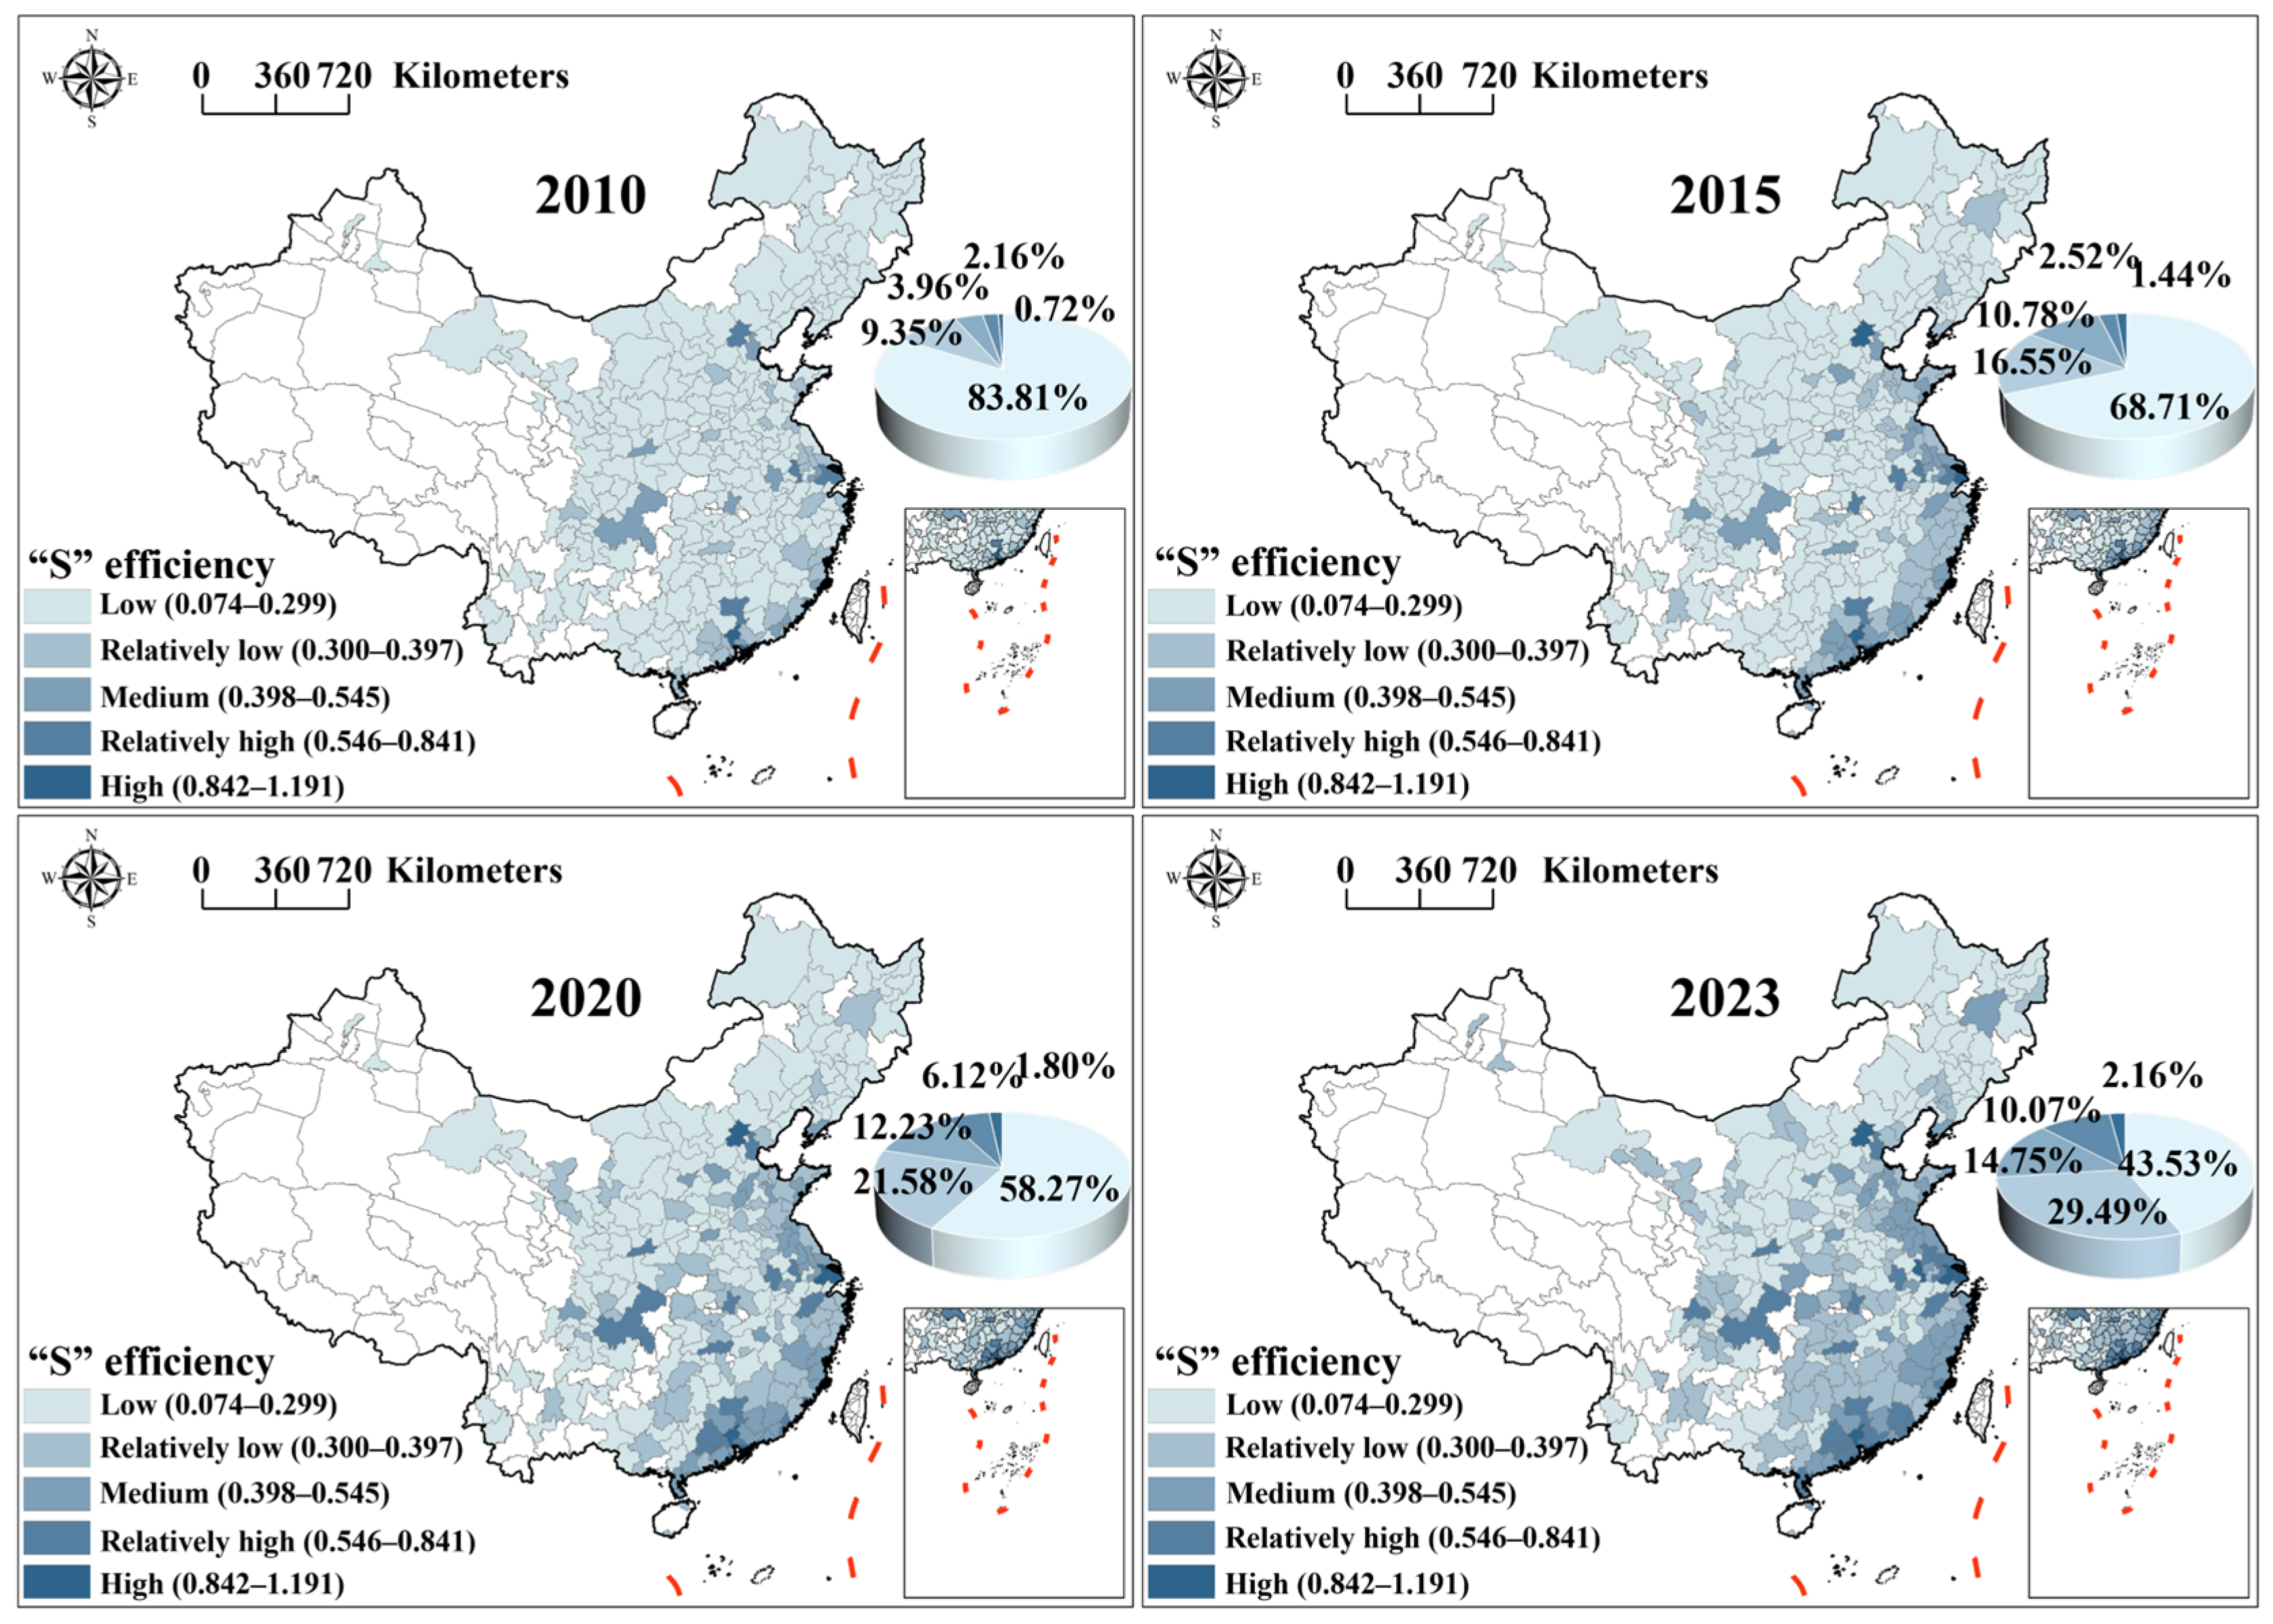
Figure 6 presents the spatiotemporal evolution of smart city efficiency across Chinese cities from 2010 to 2023. Overall, smart city efficiency improved substantially during the study period. The proportion of low-efficiency cities declined from 83.81% in 2010 to 43.53% in 2023, while the shares of medium-, relatively high-, and high-efficiency cities increased steadily over time. Spatially, smart city efficiency exhibited a clear concentration pattern. In 2010, relatively high- and high-efficiency cities were mainly distributed in several major metropolitan areas. As the study period progressed, these cities expanded beyond their initial locations and became increasingly concentrated. By 2023, a prominent high-efficiency belt had formed along the eastern coastal region, while the Yangtze River Economic Belt emerged as another area characterized by relatively high efficiency levels. Despite the overall improvement, regional disparities remained evident. High-efficiency cities were predominantly located in eastern China, whereas relatively low-efficiency cities were more frequently distributed across parts of central and western China. Overall, the spatial distribution of smart city efficiency displayed a clear pattern of regional differentiation throughout the study period.

4.1.3. Evolution of Resilient City Efficiency

Figure 7 presents the spatiotemporal evolution of resilience efficiency across Chinese cities from 2010 to 2023. Overall, resilience efficiency exhibited a steady upward trend during the study period, as reflected by the continuous decline in the proportion of low-efficiency cities and the gradual expansion of medium- and high-efficiency cities. From the perspective of spatial distribution, resilience efficiency displayed a pronounced spatial imbalance characterized by an east–west gradient. Cities with relatively high and high efficiency were primarily concentrated in eastern coastal regions and major urban agglomerations, particularly the Yangtze River Delta, Pearl River Delta, and several provincial capitals. In contrast, most cities in western China remained within the low- or relatively low-efficiency categories throughout the study period. Although higher-efficiency areas gradually expanded inland, their spatial concentration in economically developed regions remained evident.
Regarding the distribution of efficiency levels, the share of low-efficiency cities decreased substantially from 87.77% in 2010 to 57.55% in 2023. Meanwhile, the proportions of relatively low-, medium-, relatively high-, and high-efficiency cities increased from 3.59%, 5.39%, 1.43%, and 1.82% to 27.58%, 10.79%, 6.83%, and 3.25%, respectively. These changes indicate a gradual transition of cities from lower efficiency levels toward higher categories over time. Nevertheless, low-efficiency cities still accounted for more than half of the sample in 2023, suggesting that resilience efficiency remained generally low despite the observed improvement.

4.1.4. Evolution of Low-Carbon City Efficiency

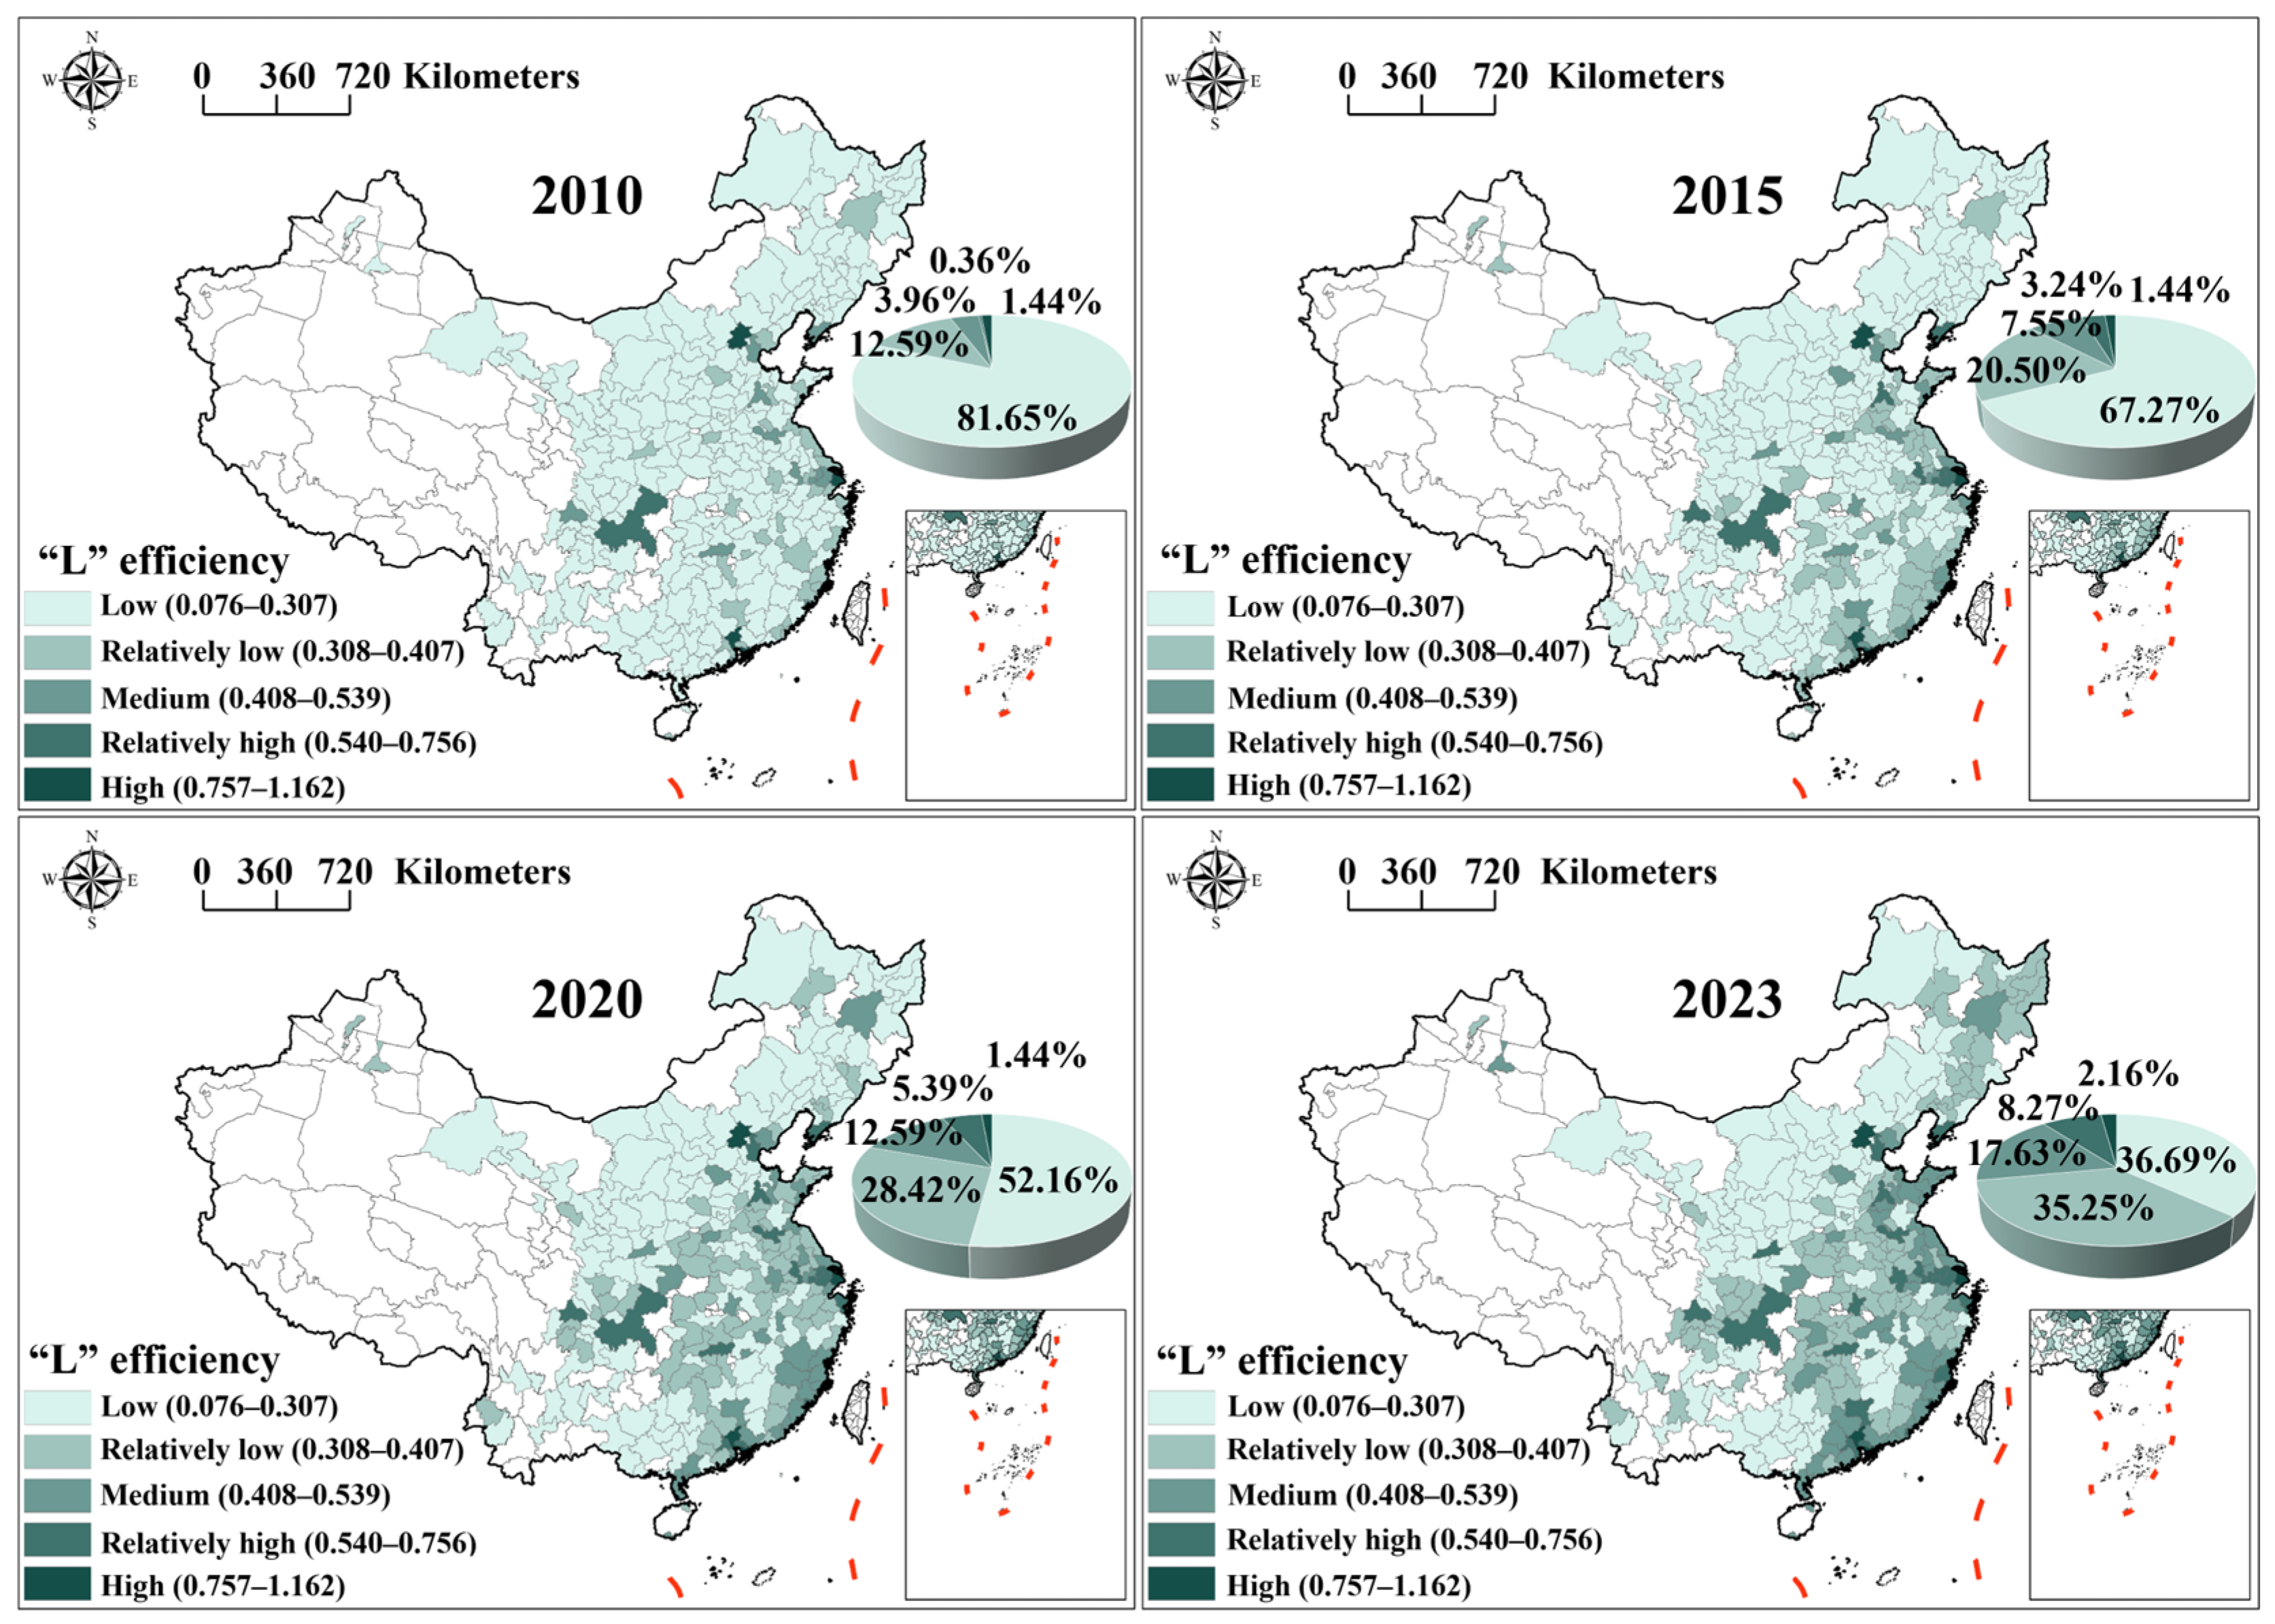
Figure 8 presents the spatiotemporal evolution of low-carbon efficiency across Chinese cities from 2010 to 2023. Overall, low-carbon efficiency improved substantially during the study period, as evidenced by the continuous decline in the proportion of low-efficiency cities and the gradual expansion of medium- and higher-efficiency categories. Spatially, low-carbon efficiency exhibited a clear east–west differentiation pattern. Cities with relatively high and high efficiency were predominantly concentrated in the eastern coastal regions and major urban agglomerations, including the Yangtze River Delta, Pearl River Delta, and Beijing–Tianjin–Hebei region. In contrast, most cities in western and inland China remained within the low- and relatively low-efficiency categories. Over time, higher-efficiency areas gradually expanded from coastal regions toward central China, indicating an increasing spatial diffusion of low-carbon development performance.
Regarding the distribution of efficiency levels, low-efficiency cities accounted for 81.65% of the sample in 2010 but declined markedly to 36.69% by 2023, representing a reduction of 44.96 percentage points. Meanwhile, the shares of relatively low- and medium-efficiency cities increased from 12.59% and 3.96% to 35.25% and 17.63%, respectively. The proportion of relatively high-efficiency cities rose from 0.36% to 8.27%, while high-efficiency cities increased from 1.44% to 2.16%. These results indicate a pronounced upward shift in the distribution of low-carbon efficiency, with an increasing number of cities transitioning from lower to higher efficiency categories over time.

4.2. Evolution of USRL System Efficiency Based on LTCCD Model

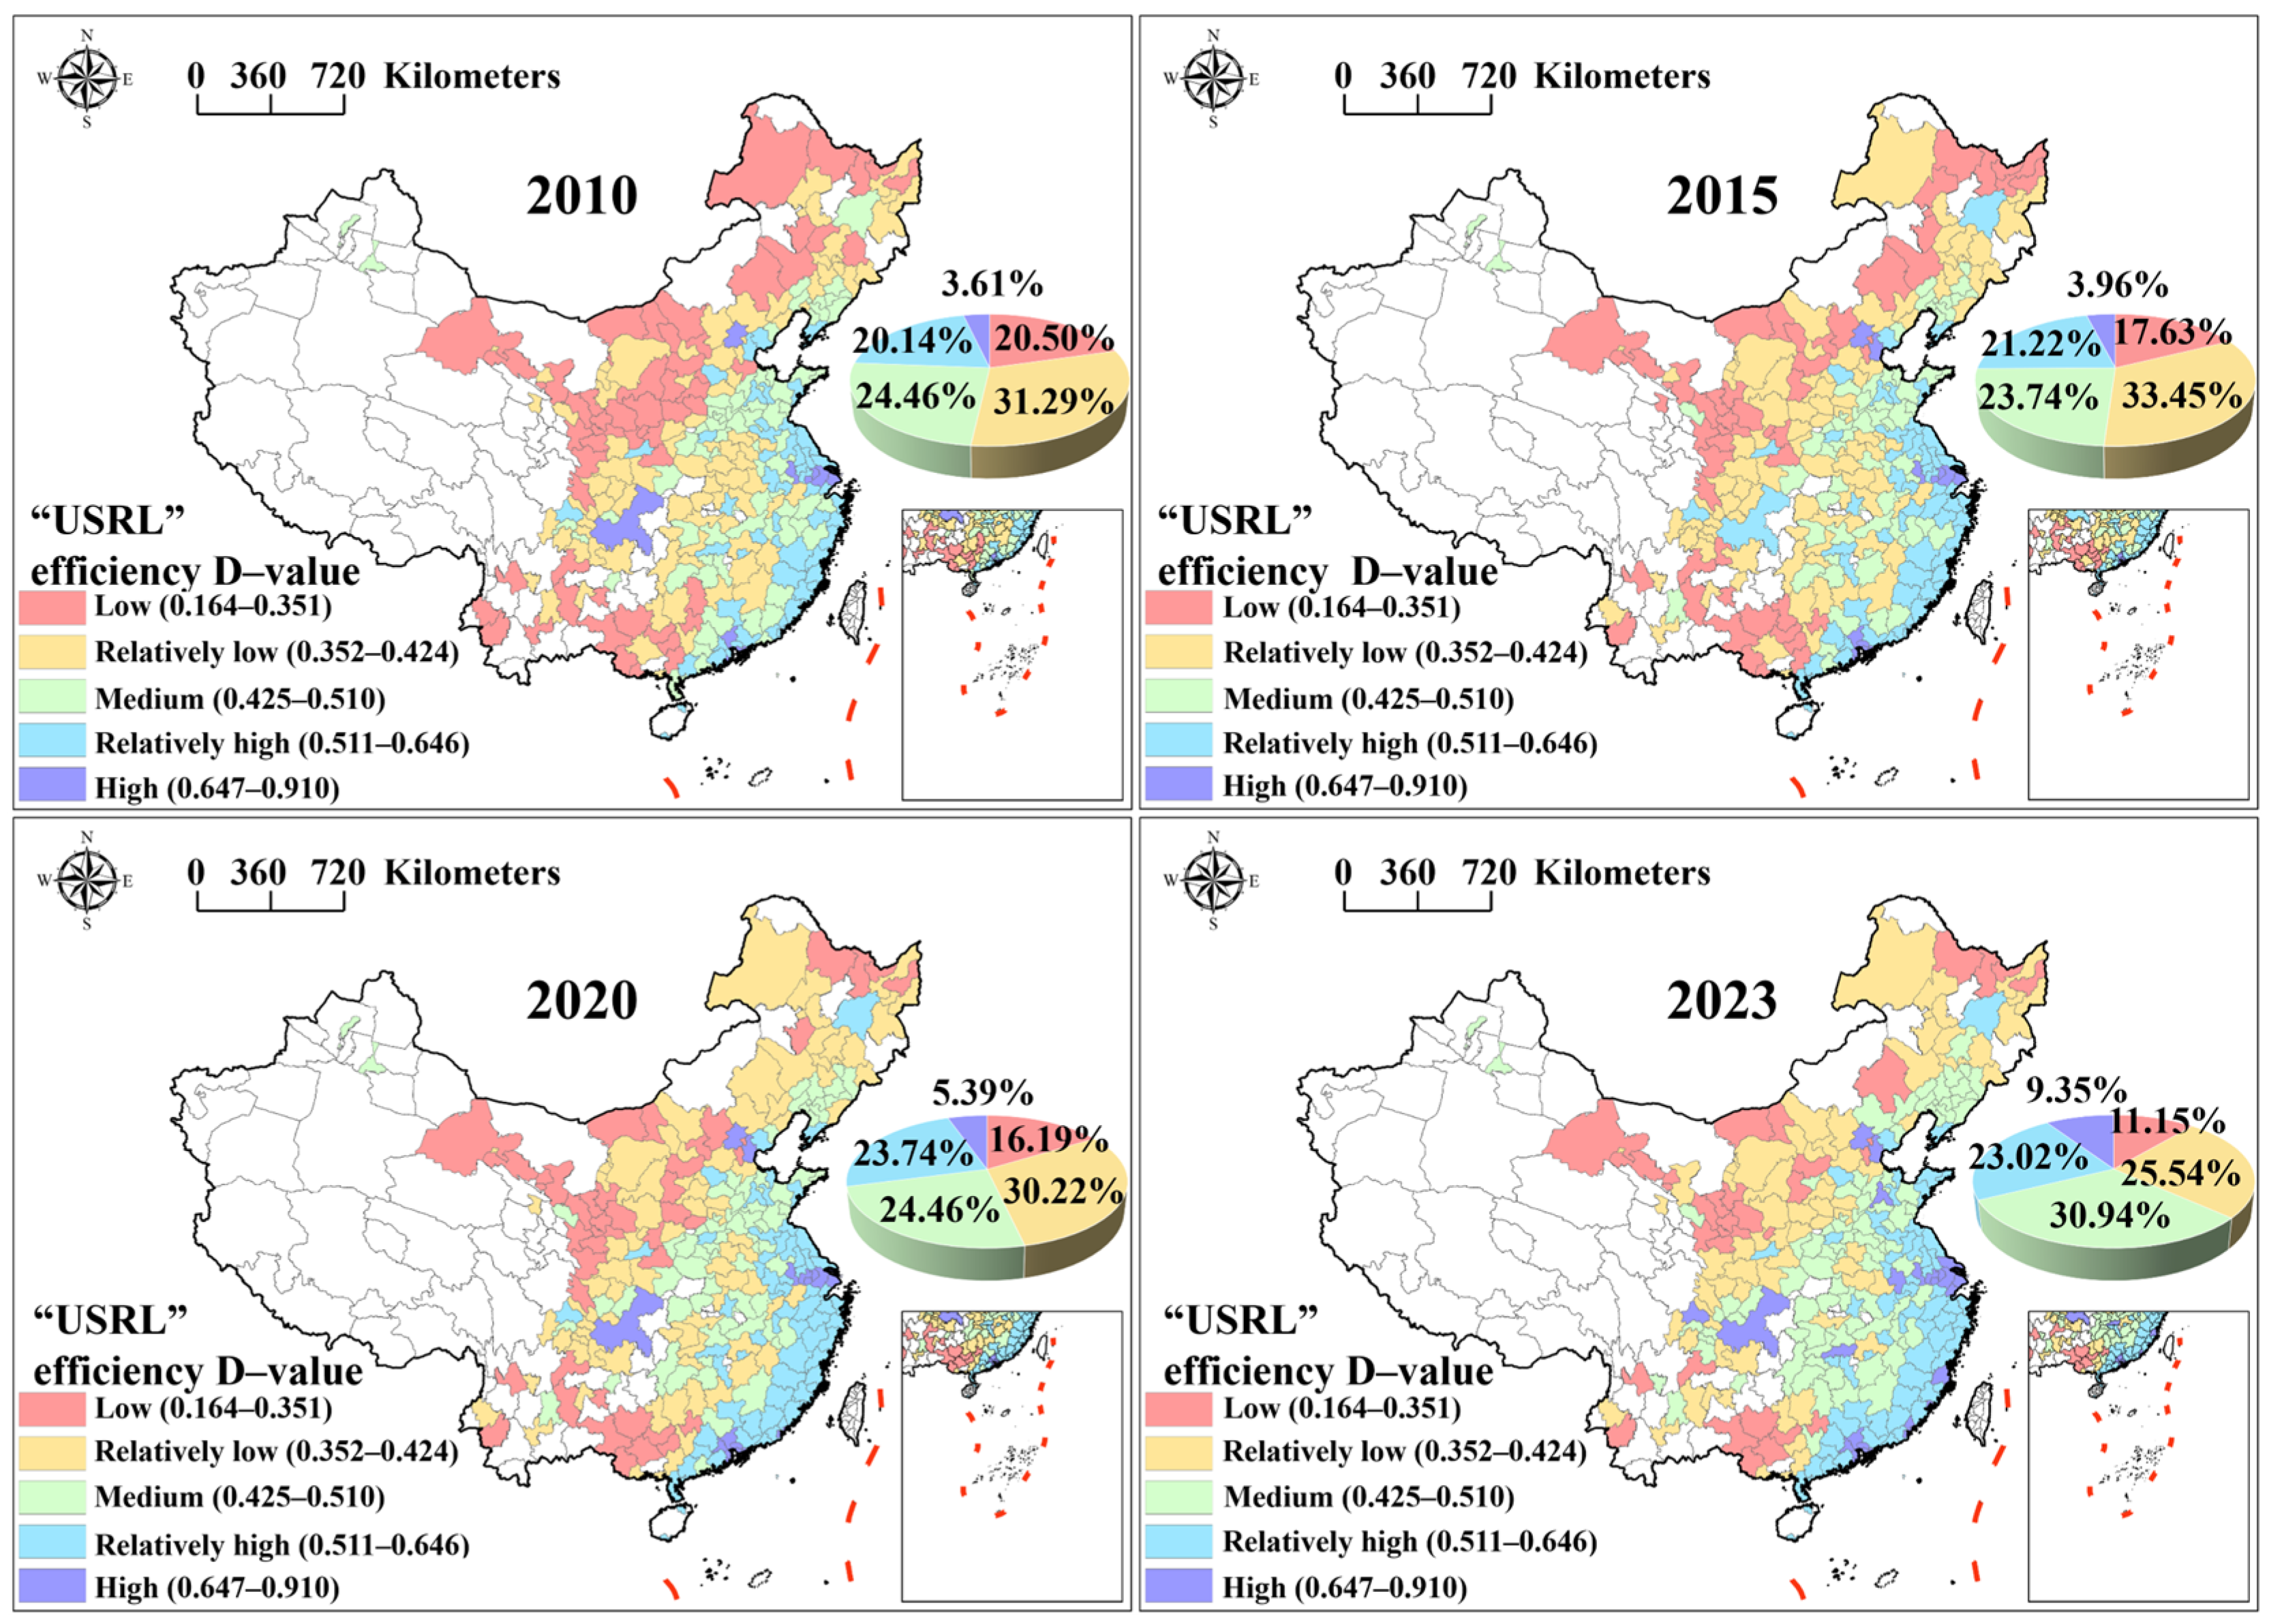
Figure 9 presents the spatiotemporal evolution of coordinated development in the USRL system based on the LTCCD framework. Overall, the coordination level improved steadily between 2010 and 2023. The proportion of cities classified as relatively high and high coordination increased from 23.75% to 32.37%, while the share of low-coordination cities declined from 20.50% to 11.15%, indicating a gradual enhancement in subsystem synergy and integrated urban development. Spatially, coordinated development evolved from a scattered pattern toward a more contiguous and clustered configuration. High-coordination cities were initially concentrated in major urban agglomerations, including the Beijing–Tianjin–Hebei, Yangtze River Delta, and Pearl River Delta regions. Over time, these areas expanded and became increasingly connected with surrounding cities, contributing to the formation of broader coordination corridors across central China. Despite the overall improvement, a clear spatial gradient remained, with higher coordination levels concentrated in eastern China and relatively lower levels persisting in parts of western and northeastern China.

4.3. Spatial Disparity Decomposition of Coordinated Development

4.3.1. Overall Spatial Disparities Based on the Dagum Gini Coefficient

Table 4 reports the Dagum Gini decomposition of coordinated development in the USRL system. Overall, spatial inequality followed a pattern of initial fluctuation followed by gradual convergence. The total Gini coefficient increased marginally from 0.136 in 2010 to 0.139 in 2012 and subsequently declined to 0.131 in 2023, indicating a moderate reduction in spatial disparities over time. The decomposition results demonstrate that inequality was primarily driven by differences between regions. Throughout the study period, the contribution of inter-regional disparities (Gb) remained the largest component, accounting for more than 63% of total inequality and substantially exceeding the contributions of intra-regional disparities (Gw) and trans-variation intensity (Gt). In contrast, Gw consistently contributed around 24–25%, while Gt accounted for approximately 10–12%, suggesting that local variation and regional overlap exerted relatively limited influences on the overall disparity pattern. Notably, although the magnitude of total inequality gradually decreased, the underlying structure of disparity remained largely unchanged. The persistence of the dominant Gb component implies that coordinated development in the USRL system continues to be constrained primarily by uneven development across regions rather than disparities within regions. Therefore, reducing inter-regional development gaps may represent the most effective pathway toward achieving more balanced and integrated USRL development nationwide.

4.3.2. Decomposition of Spatial Disparities

Table 5 reports the regional decomposition results of coordinated development in the USRL system. Overall, the three major regions displayed a tendency toward internal convergence during the study period, although the extent of improvement varied considerably. The western region recorded the largest reduction in intra-regional disparity, whereas the central region maintained the most balanced development pattern throughout the study period. In comparison, changes in the eastern region were relatively modest, reflecting a stable but persistent level of internal heterogeneity. Regional differences, however, remained more pronounced than within-region disparities. The eastern–western regional pair consistently exhibited the highest Gini coefficient, indicating that the development gap between these two regions continued to dominate the spatial structure of inequality. Although disparities among all regional pairs generally declined over time, the reduction was substantially stronger for the eastern–central and central–western pairs than for the eastern–western pair. Taken together, these findings reveal an asymmetric convergence pattern in USRL coordinated development. While cities within individual regions became increasingly similar in their coordination performance, the process of inter-regional convergence proceeded at a much slower pace. Consequently, the east–west development gradient remained the principal source of spatial inequality, suggesting that reducing structural differences across regions is essential for achieving more balanced and integrated USRL development in China.

4.4. Driving Mechanisms of Coordinated Development

4.4.1. Nonlinear Effects of Individual Factors

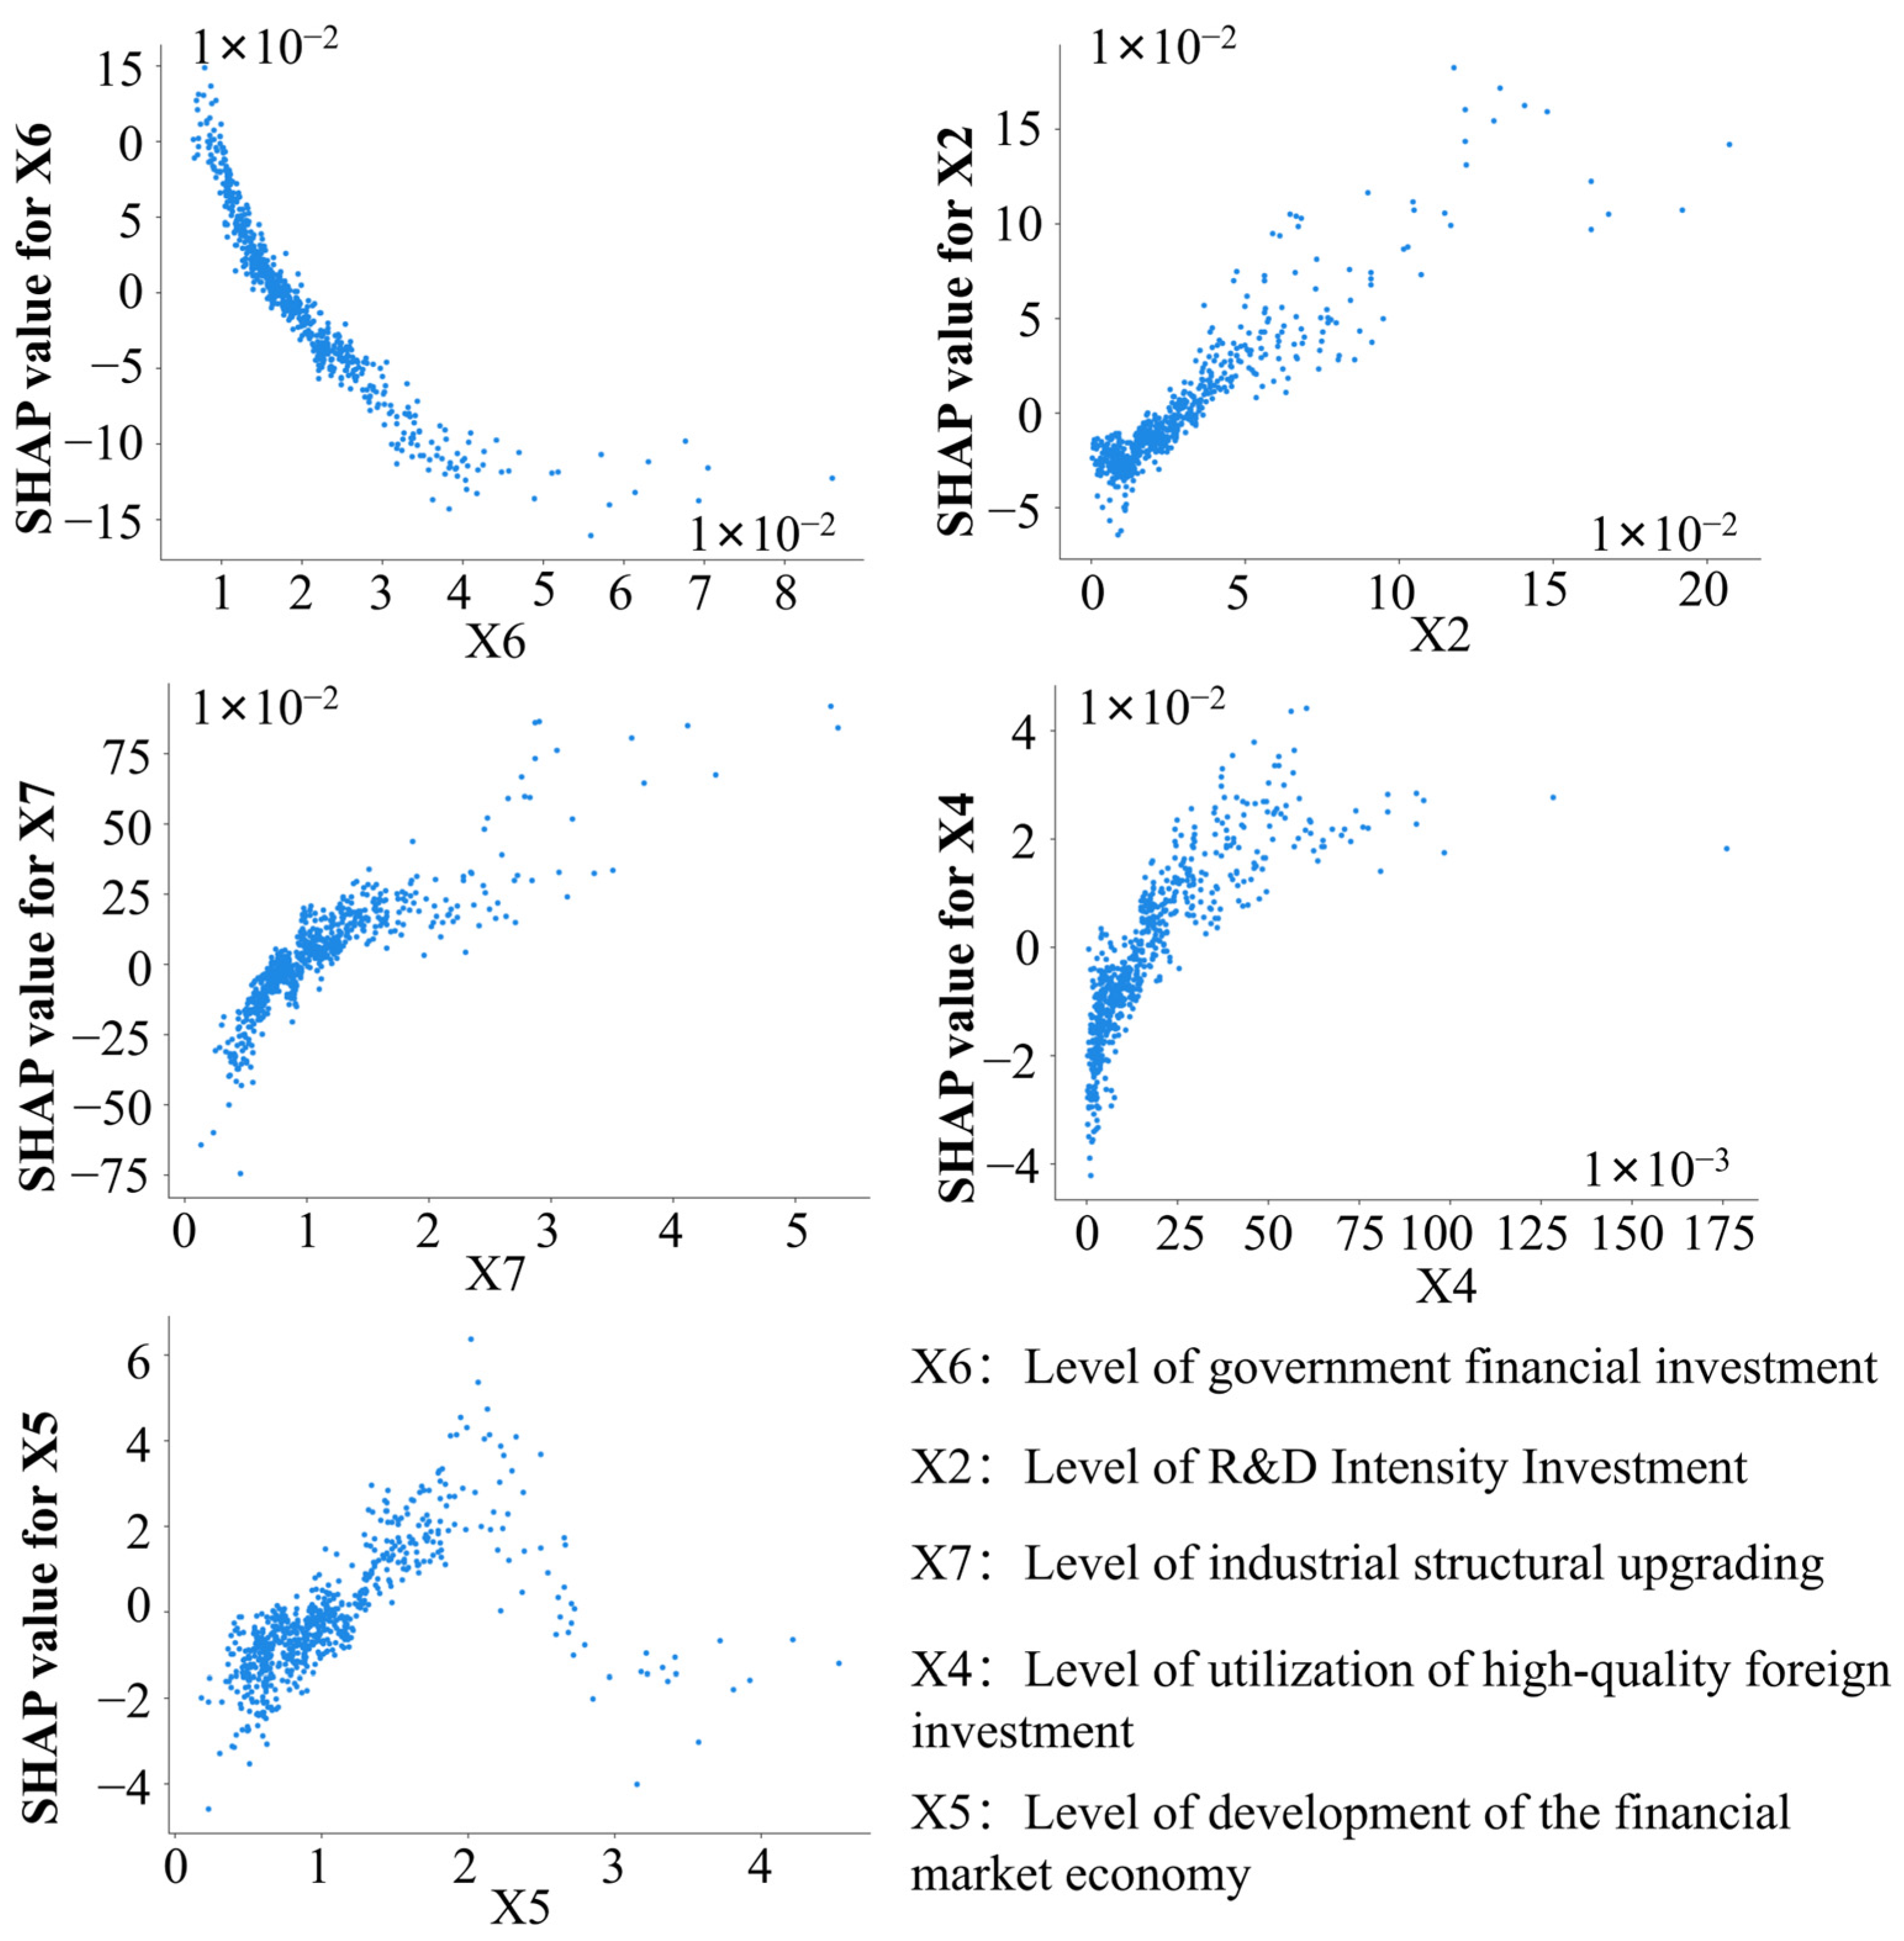
Figure 10 illustrates the SHAP response curves of the principal factors influencing coordinated development in the USRL system. The results show substantial variation in both the magnitude and direction of factor effects, highlighting the nonlinear characteristics of coordinated development. R&D intensity (X2) maintains a positive relationship with coordinated development throughout most of its distribution range. Industrial structural upgrading (X7) and high-quality foreign investment (X4) also exhibit positive effects, although their SHAP values increase at a slower rate as factor levels rise. Financial market development (X5) presents an inverted U-shaped pattern, with SHAP values increasing initially and declining after a threshold is reached. In contrast, government fiscal investment (X6) shows a predominantly negative relationship, with SHAP values decreasing continuously across its value range. Taken together, the SHAP results demonstrate that different driving factors exhibit distinct nonlinear response patterns. Positive effects are observed for R&D intensity, industrial upgrading, and high-quality foreign investment, whereas financial and fiscal factors display more complex nonlinear relationships with coordinated development.

4.4.2. Interactive Effects of Driving Factors

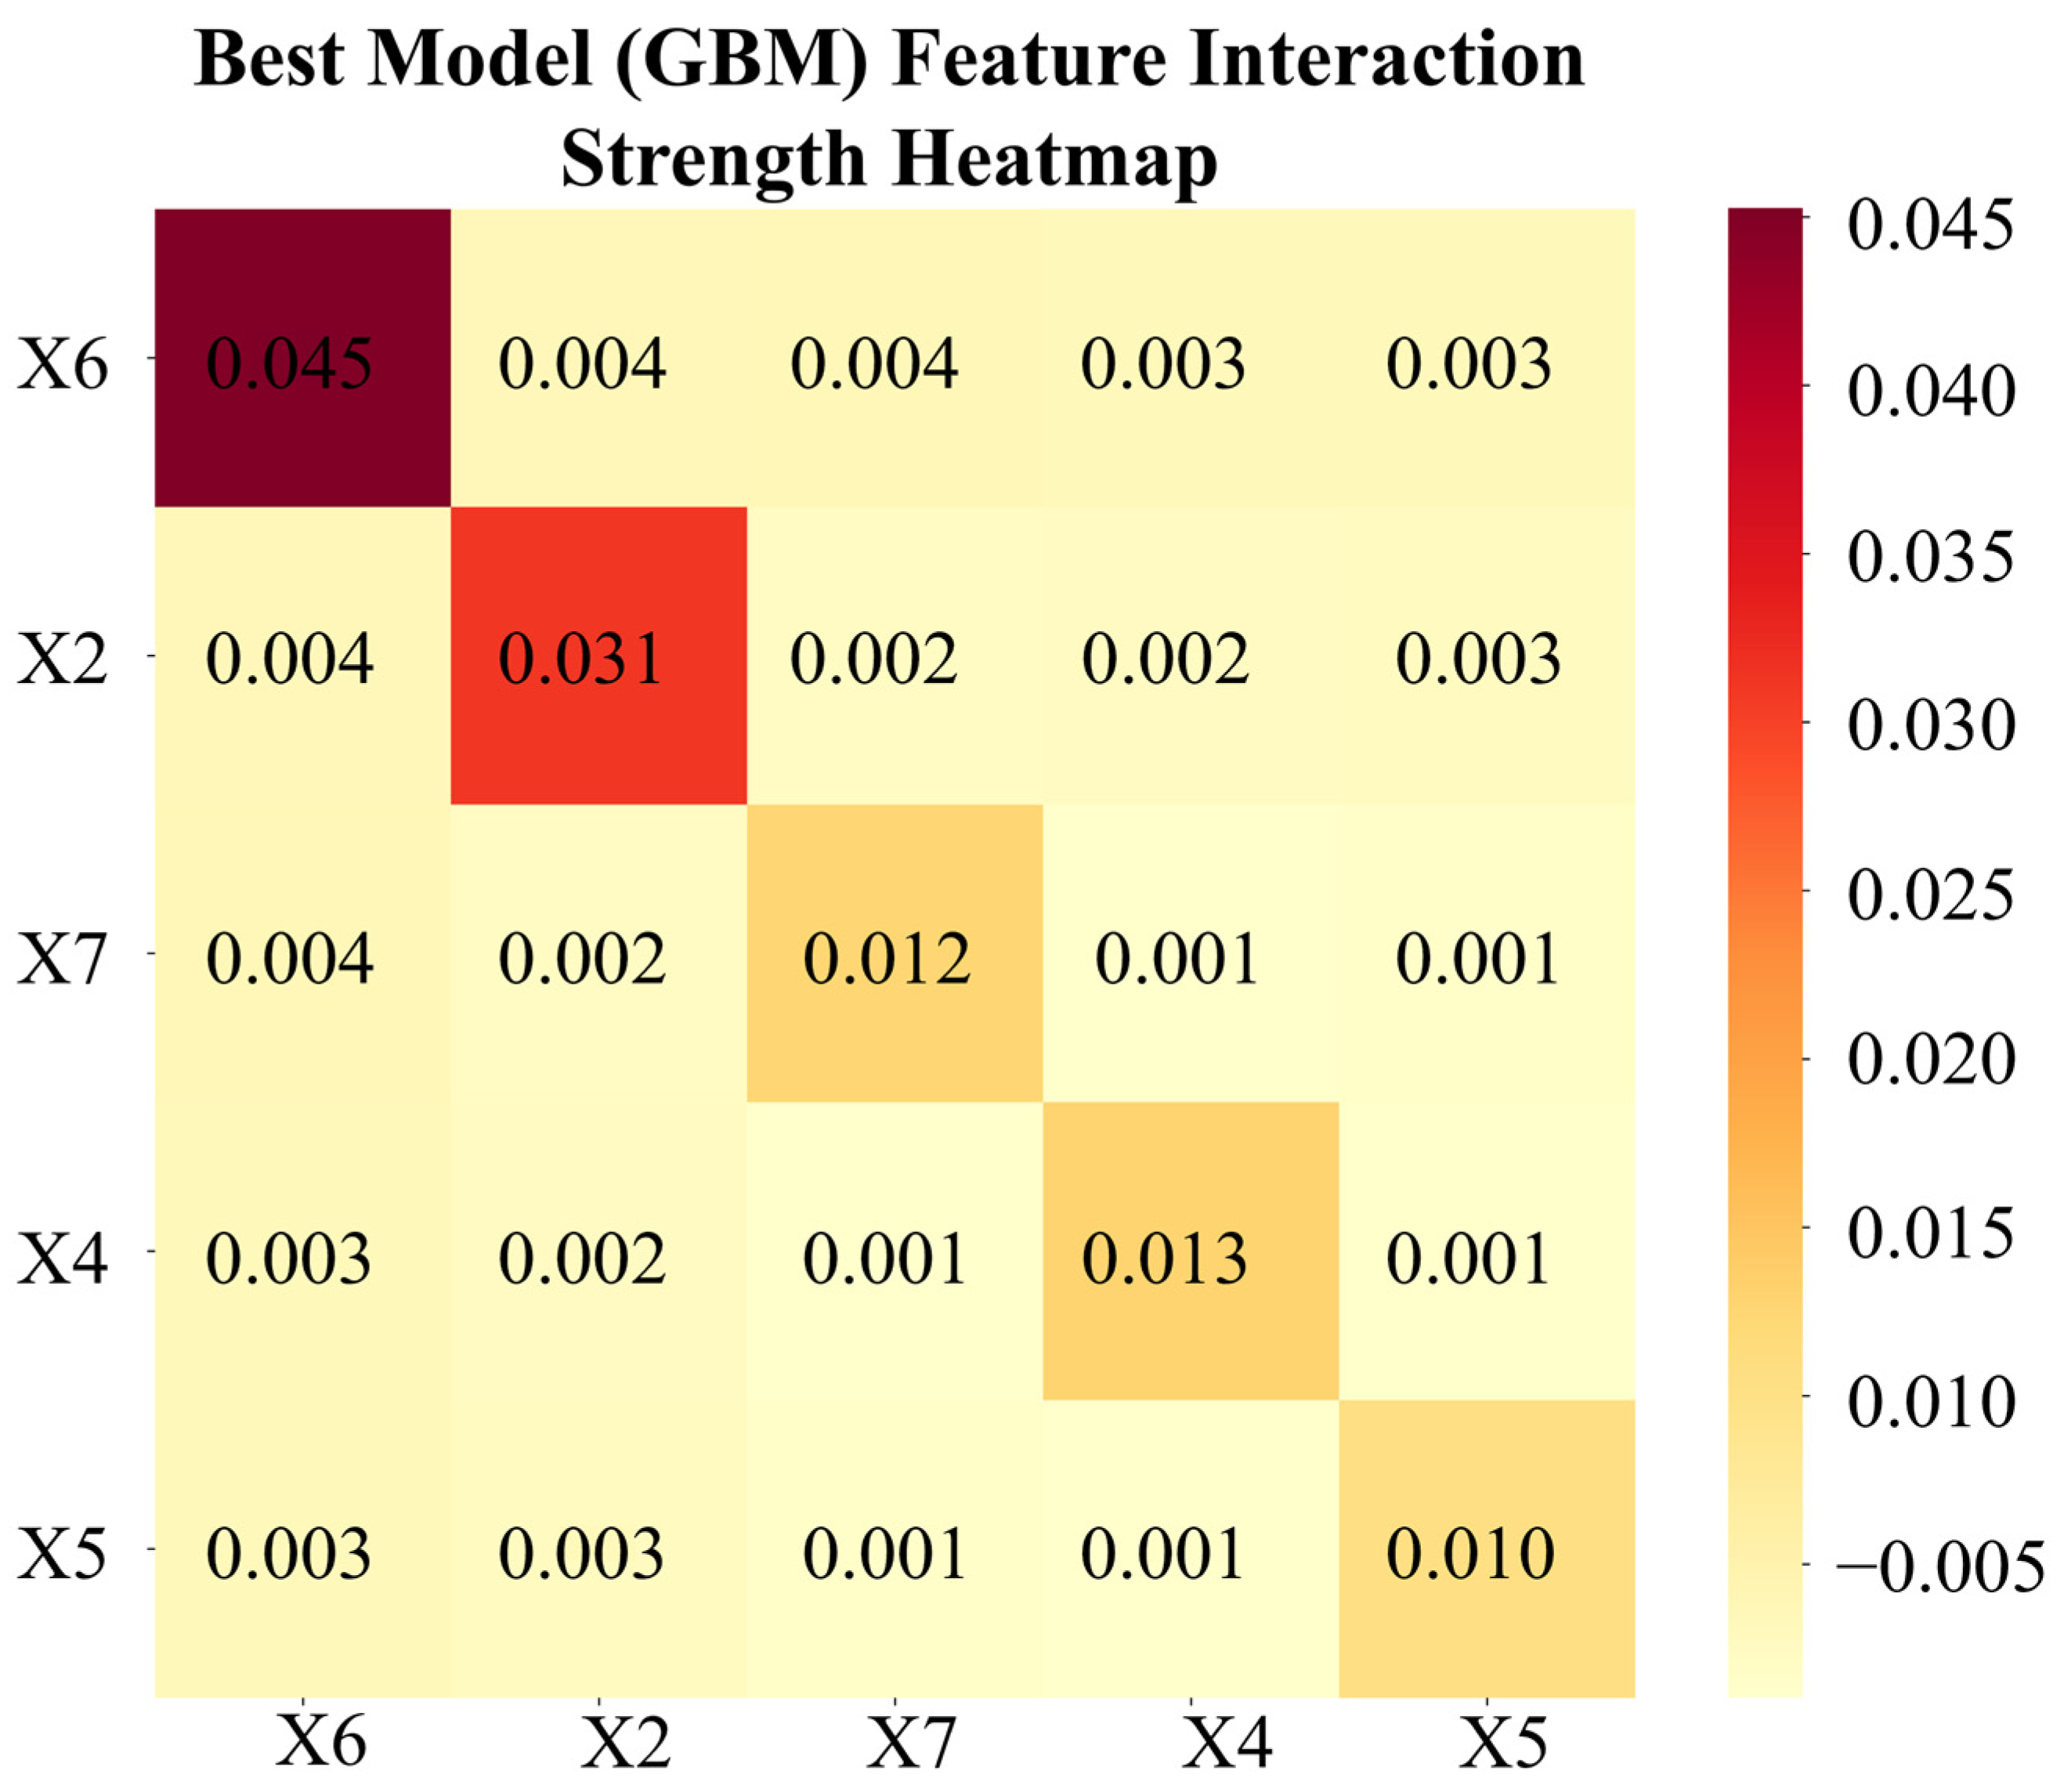
Figure 11 presents the interaction strengths among key driving factors based on the GBM model. Overall, the results indicate that individual factor effects were substantially stronger than interaction effects. The diagonal values, representing the main effects of individual variables, were considerably larger than the off-diagonal values, suggesting that the coordinated development of the USRL system was influenced primarily by the independent contributions of key factors rather than by strong interaction effects. Among the interaction terms, the combination of government fiscal investment (X6) and R&D intensity (X2) exhibited the highest interaction strength, followed by the interactions between fiscal investment and industrial structural upgrading (X7), as well as between fiscal investment and financial market development (X5). Although these interactions were stronger than other factor combinations, their magnitudes remained relatively modest compared with the corresponding main effects. In contrast, interactions involving industrial structural upgrading (X7), high-quality foreign investment utilization (X4), and financial market development (X5) were generally weak. This finding suggests that these factors contributed to coordinated development largely through their individual effects rather than through strong synergistic relationships with other variables. Overall, the interaction structure was characterized by dominant main effects and relatively limited interaction effects. While certain factor combinations exhibited complementary relationships, the coordinated development of the USRL system was primarily driven by the independent influence of key factors.

4.4.3. Nonlinear Interactions Among Key Driving Factors

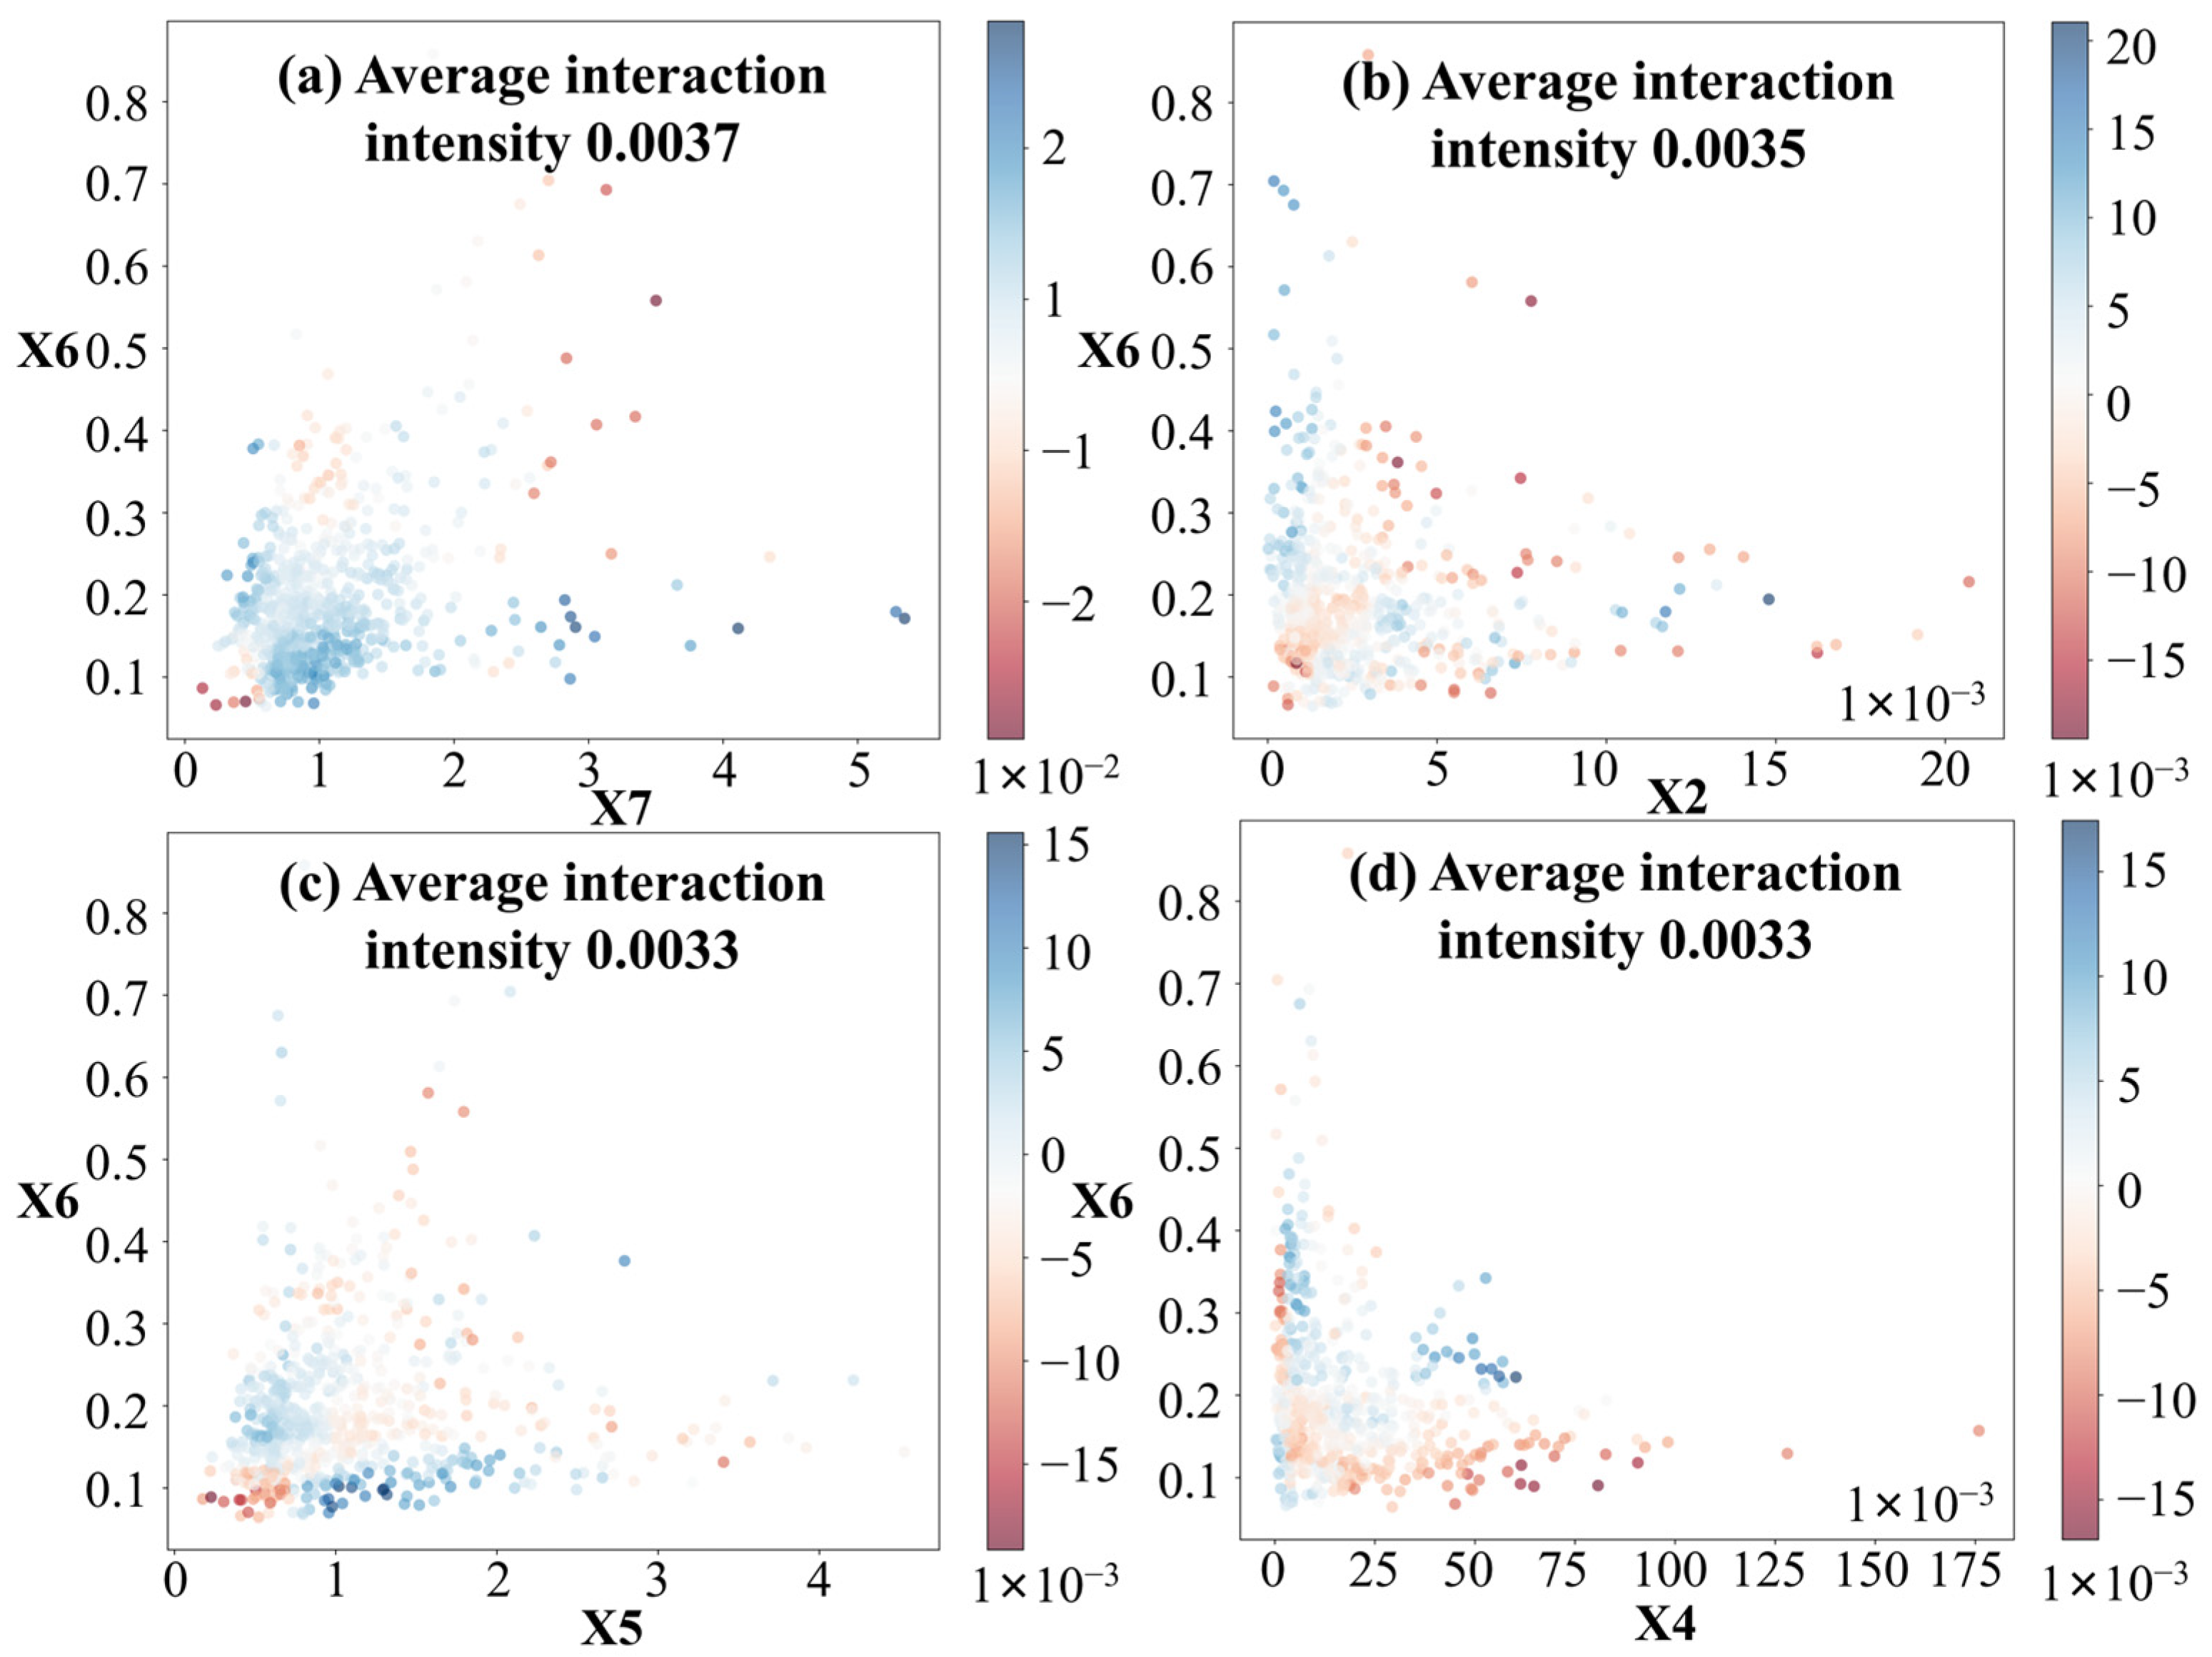
To further examine the interaction mechanisms among key driving factors, Figure 12 presents SHAP interaction dependence plots for several representative factor combinations involving government fiscal investment (X6). Overall, the results reveal pronounced nonlinear interaction patterns, indicating that the effects of key drivers on coordinated development vary according to the levels of interacting factors. The interactions between fiscal investment and R&D intensity (X2), industrial structural upgrading (X7), financial market development (X5), and high-quality foreign investment utilization (X4) all exhibit heterogeneous response patterns. In general, the interaction effects become more evident as factor levels increase, suggesting that the contribution of one factor may vary depending on the development stage of another factor. Among the examined combinations, the interactions involving fiscal investment and innovation-related factors display relatively stronger clustering in higher-value regions, indicating a closer association between these drivers in promoting coordinated development. At the same time, substantial dispersion remains visible across all interaction plots, suggesting considerable heterogeneity among cities. The interaction patterns therefore do not follow a uniform trajectory but vary across different development contexts. Overall, the results indicate that the coordinated development of the USRL system is shaped by complex nonlinear interactions among key drivers rather than by simple additive effects alone.

5. Discussion

This study advances the understanding of urban sustainable development by examining the coordinated evolution of urbanization, smart development, resilience, and low-carbon transition from an efficiency perspective. The findings suggest that coordinated development is not only shaped by interactions among local subsystems but is also strongly influenced by cross-regional spatial linkages. By integrating the LTCCD framework, Dagum Gini decomposition, and interpretable machine learning techniques, this study reveals the spatially embedded and nonlinear nature of coordinated development. The results further indicate that urban sustainability emerges through the combined effects of local optimization, inter-city interactions, and heterogeneous driving mechanisms. Building on these findings, the following sections discuss the added value of the LTCCD framework, the underlying mechanisms of spatial convergence and regional disparities, and the nonlinear drivers shaping coordinated development.

5.1. Added Value of the LTCCD Framework: Understanding Coordinated Development Through Local and Tele-Coupling Interactions

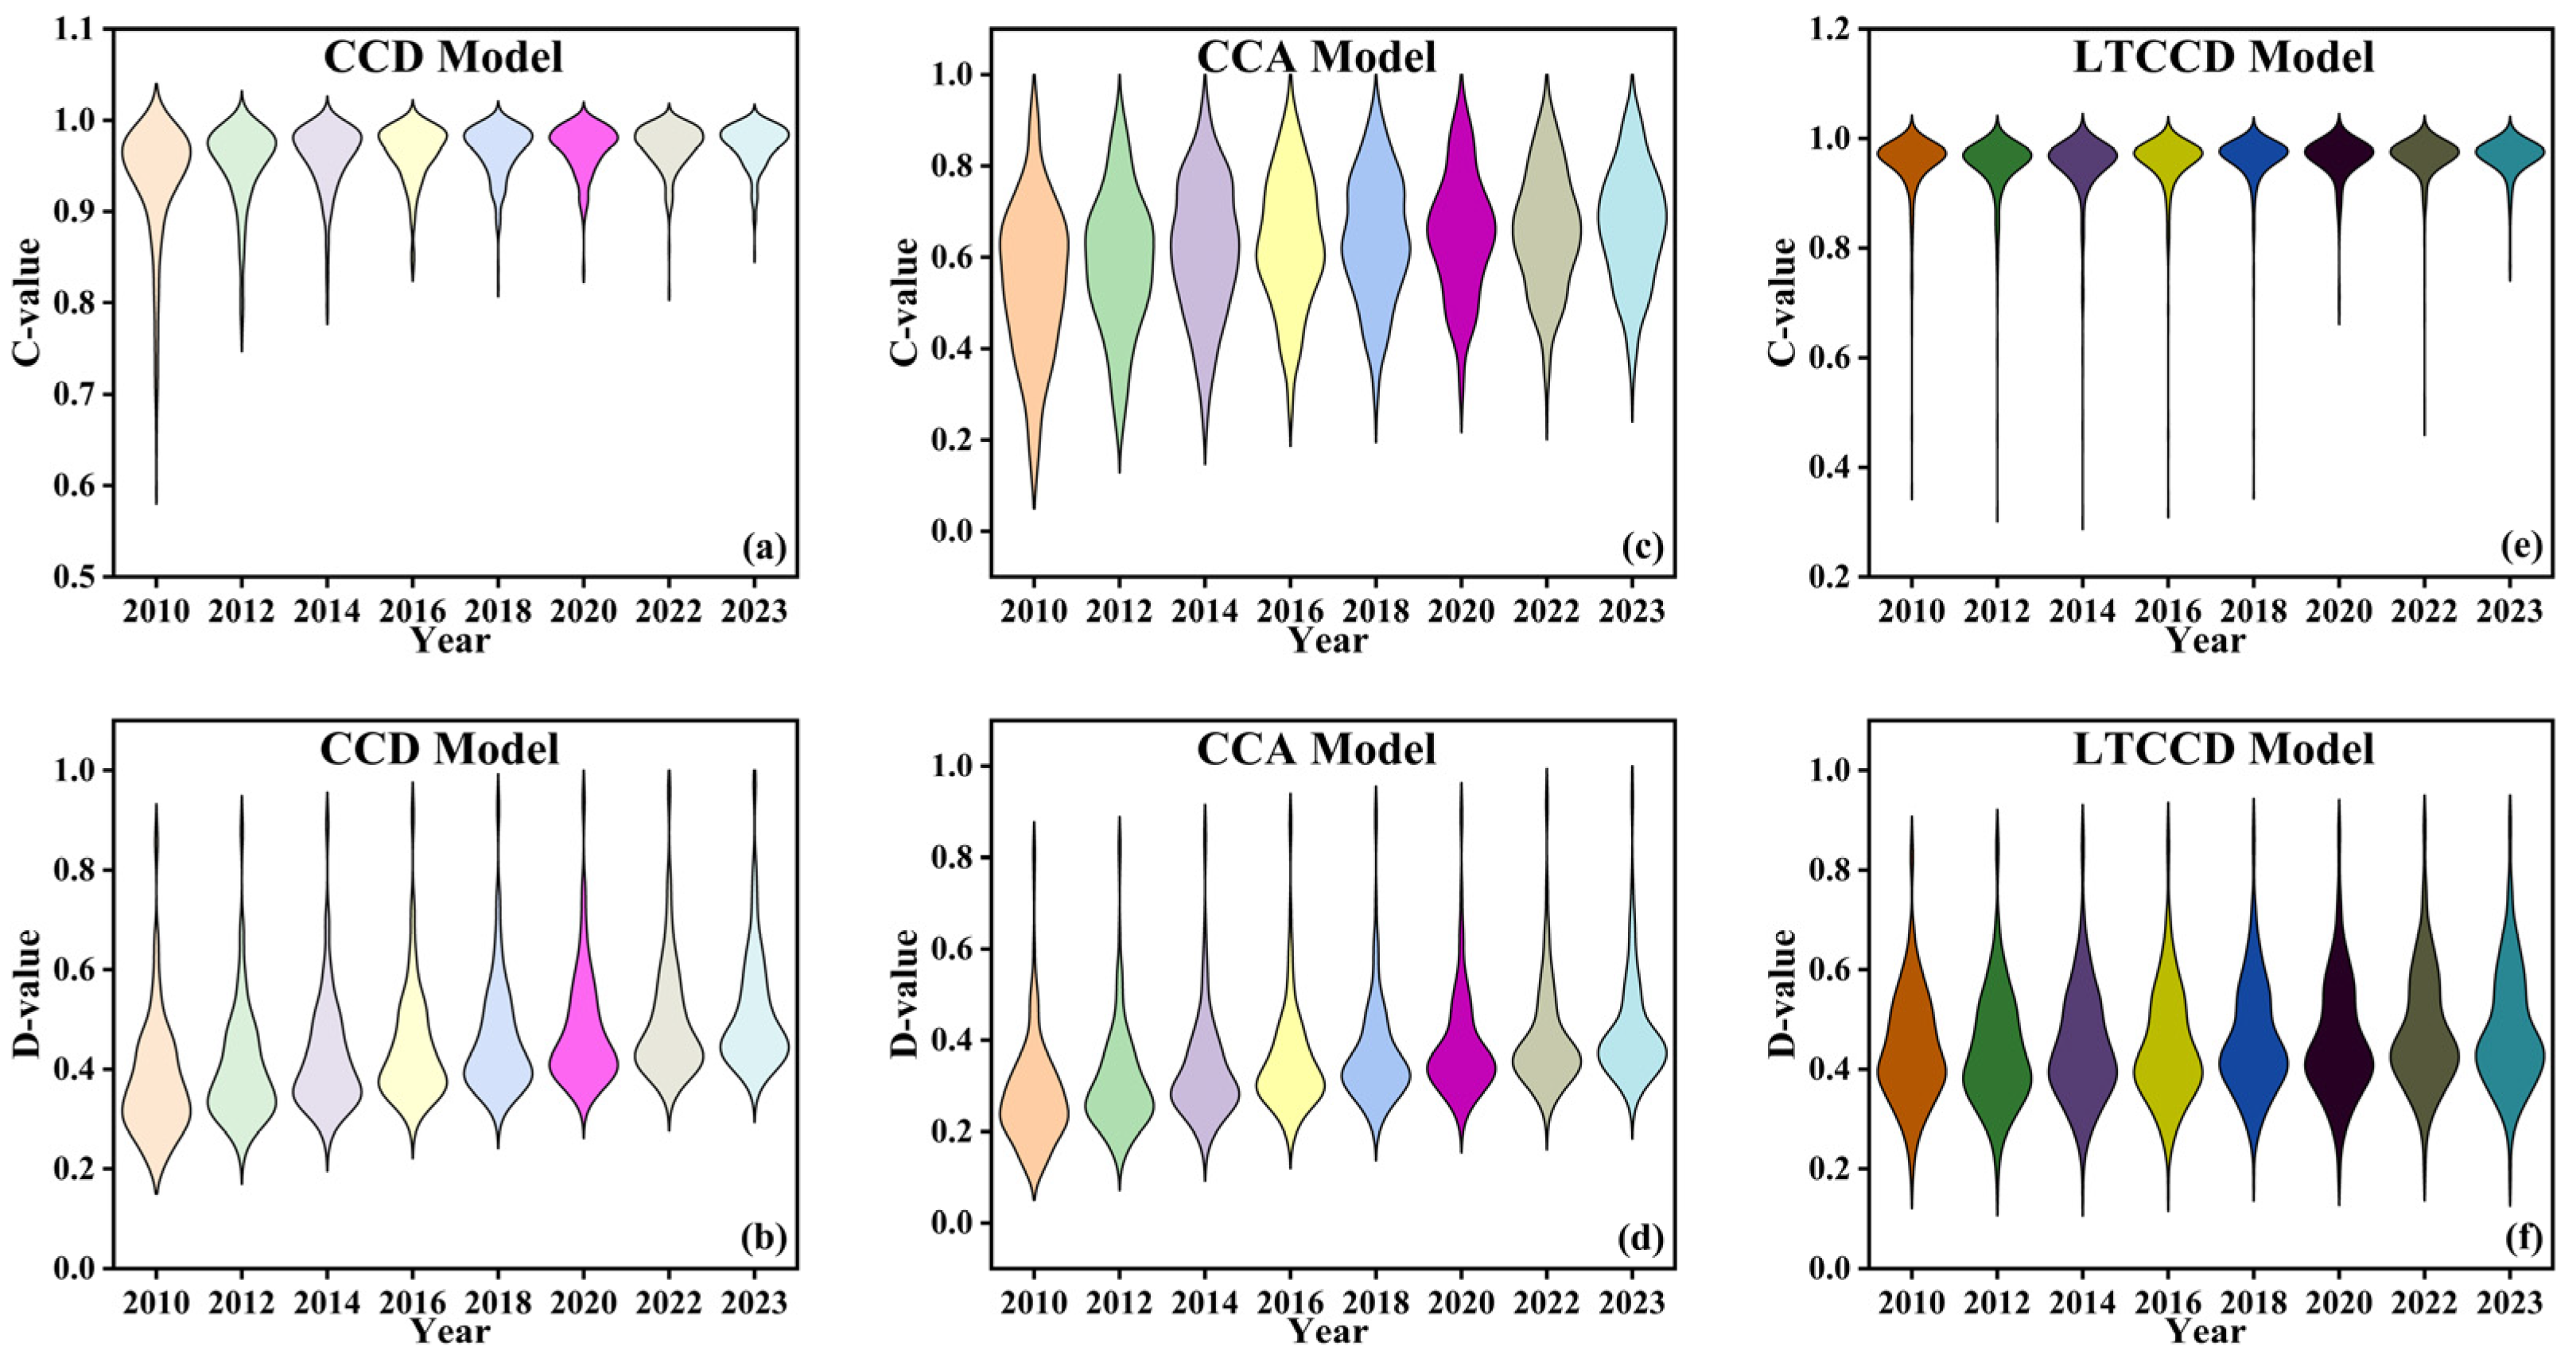
The comparative analysis of the CCD, CCA, and LTCCD models suggests that the assessment of coordinated development is highly sensitive to the underlying analytical framework. Although all three models reveal a general improvement in the coordinated development of the USRL system, they differ substantially in their ability to characterize spatial heterogeneity and reveal the structural complexity of urban system evolution. Rather than representing alternative measurement techniques, these models embody different assumptions regarding how coordination emerges within and across cities (Figure 13).
The CCD model primarily emphasizes the intensity of coupling among subsystems and therefore tends to produce relatively concentrated coordination distributions. While this framework effectively captures the overall degree of subsystem interaction, it may overlook latent imbalances among subsystems and reduce the visibility of heterogeneous development trajectories. This observation is broadly consistent with previous studies suggesting that conventional coupling coordination approaches may overestimate coordination levels by focusing on aggregate coupling intensity rather than structural differences within complex systems [54]. By contrast, the CCA model improves discriminatory power by generating more dispersed coordination distributions, thereby providing greater sensitivity to developmental heterogeneity and stage-specific differences across cities [55]. However, both approaches largely treat cities as spatially independent units and therefore remain limited in their ability to capture the influence of inter-city interactions. The LTCCD framework extends existing approaches by explicitly incorporating both local coupling and tele-coupling interactions through a distance–decay mechanism. From the perspective of tele-coupling theory, urban development increasingly occurs within interconnected networks of factor flows, technological exchanges, and regional collaboration rather than within isolated administrative boundaries. Under such conditions, coordinated development is shaped not only by internal subsystem interactions but also by the intensity and structure of external spatial linkages. The LTCCD results reveal more pronounced low-coordination tails and stronger distributional heterogeneity than those identified by the CCD and CCA models, suggesting that spatial interactions may amplify existing development differences and generate uneven coordination outcomes across cities. These findings indicate that local optimization alone cannot fully explain the evolution of urban sustainability; instead, coordinated development emerges from the combined influence of internal efficiency improvements and external spatial interactions.
This finding contributes to the growing literature on multidimensional urban sustainability by extending the analytical focus from intra-city coordination to cross-regional coordination processes [56,57]. Existing studies have largely conceptualized urban systems as self-contained entities, emphasizing subsystem interactions within individual cities. In contrast, the present study suggests that urban coordination should be understood as a spatially embedded process that unfolds simultaneously across local and regional scales. By incorporating tele-coupling effects, the LTCCD framework provides a more comprehensive representation of the mechanisms through which cities exchange resources, diffuse innovation, and respond to regional development dynamics. More broadly, the results imply that sustainable urban development is increasingly dependent on the ability of cities to participate in wider regional networks. As regional integration deepens and factor mobility accelerates, the capacity to establish effective cross-regional linkages may become as important as local subsystem optimization. Therefore, incorporating spatial coupling mechanisms into coordinated development analysis is not merely a methodological refinement but a necessary step toward understanding the evolving nature of urban sustainability in an increasingly interconnected world [58].

5.2. Spatial Convergence and Persistent Regional Disparities in Coordinated Development

The results suggest that the coordinated development of the USRL system is characterized by a dual process of gradual convergence and persistent spatial inequality. Although overall coordination levels improved and regional disparities narrowed over time, spatial heterogeneity remained evident. This finding implies that urban sustainable development is not a simple linear process of convergence. Instead, it appears to emerge through the interaction between diffusion mechanisms that promote regional integration and structural forces that reinforce existing development advantages.
From the perspective of regional development theory, the observed convergence may be associated with the gradual diffusion of economic activities, technological knowledge, and institutional practices from leading regions to surrounding areas. As transportation infrastructure, digital connectivity, and regional integration initiatives continue to improve, barriers to inter-city interaction are reduced, allowing cities to benefit from wider networks of resource exchange and knowledge spillovers. This process may partially explain the increasing coordination levels observed across a broader range of cities. Similar patterns have been reported in studies emphasizing the role of regional integration and spatial spillovers in promoting more balanced urban development trajectories [59,60]. However, the persistence of the east–west gradient suggests that convergence remains constrained by path-dependent development processes. Regions with early advantages in economic development, innovation capacity, and infrastructure investment tend to accumulate additional benefits over time, generating cumulative effects that are difficult for lagging regions to overcome. Consequently, while less-developed regions may gradually improve their coordination levels, the relative advantages of leading regions often remain intact. This interpretation is consistent with the logic of cumulative causation and uneven development, which emphasizes that regional disparities may persist even under conditions of overall growth and convergence [61,62].
The Dagum decomposition results further indicate that inter-regional disparities remain the dominant source of spatial inequality. These findings highlight that coordinated development is shaped not only by local subsystem performance but also by broader regional structures. In other words, urban sustainability should be understood as a spatially embedded process in which development outcomes are influenced by a city’s position within wider regional networks. Cities located in economically dynamic regions may benefit from stronger knowledge flows, factor mobility, and collaborative opportunities, whereas cities in peripheral regions may face structural disadvantages that limit their ability to achieve comparable coordination levels [63,64]. More broadly, these findings suggest that the evolution of coordinated development in the USRL system is entering a new stage. Rather than being driven primarily by localized growth, future improvements may increasingly depend on the capacity of cities to participate in cross-regional networks and benefit from inter-city interactions. Therefore, strengthening regional connectivity, enhancing knowledge diffusion, and promoting collaborative governance may become increasingly important for reducing persistent spatial inequalities and advancing sustainable urban development [65].

5.3. Nonlinear Driving Mechanisms of Coordinated Development

The GBM–SHAP analysis suggests that coordinated development in the USRL system is shaped by multiple interacting drivers rather than by the linear accumulation of individual factors. In particular, innovation capacity, industrial upgrading, and high-quality external resources appear to play a central role in facilitating coordinated development. These findings imply that sustainable urban development increasingly depends on the ability of cities to enhance technological capabilities, optimize economic structures, and integrate into wider innovation and investment networks.
The substantial contribution of innovation-related variables reinforces the argument that technological progress functions as a critical catalyst connecting economic development, environmental sustainability, and urban resilience. Drawing upon innovation diffusion theory, technological advancement enhances not only production efficiency but also the dissemination and application of low-carbon technologies, digital governance instruments, and adaptive management approaches. Through these channels, innovation can generate synergistic benefits across multiple urban subsystems, thereby facilitating a higher degree of systemic coordination. This interpretation accords with previous studies highlighting the pivotal role of innovation in supporting urban sustainability transitions and low-carbon development trajectories [66,67]. Another noteworthy observation is the nonlinear influence of several fiscal and financial variables on coordinated development. Their effects are not uniformly positive; instead, the magnitude and direction of their contributions vary across different developmental circumstances. Such evidence indicates that the developmental value of resource inputs depends not solely on the quantity of resources available but also on the institutional settings and developmental conditions under which those resources are utilized. This pattern is consistent with the complex adaptive systems perspective, which emphasizes that development outcomes frequently arise from nonlinear feedback mechanisms rather than from simple proportional relationships between inputs and outputs. Under this framework, additional fiscal support or financial investment may generate heterogeneous outcomes depending on local governance effectiveness, innovation capacity, and structural characteristics [68,69].
The interaction analysis further demonstrates that coordinated development is shaped by the combined effects of multiple drivers rather than by isolated determinants. Although the explanatory power of interaction effects is generally weaker than that of the corresponding main effects, the findings indicate that innovation-related factors maintain particularly strong connections with other dimensions of urban development. This highlights the necessity of viewing urban sustainability as an integrated evolutionary process in which technological advancement, economic transformation, and institutional adaptation co-evolve. Instead of functioning independently, these elements may either reinforce or limit one another under different developmental conditions. More generally, the nonlinear relationships identified in this study provide additional support for understanding coordinated development as an emergent characteristic of complex urban systems. Sustainable urban development is unlikely to result from the expansion of any single development factor alone. Rather, it appears to depend on the dynamic interplay among technological innovation, structural upgrading, resource allocation efficiency, and institutional support mechanisms. By uncovering these nonlinear and interactive relationships, the present study extends existing research and demonstrates that the evolution of coordinated development is characterized by both multidimensional interdependence and substantial heterogeneity across cities and stages of development [70].

5.4. Limitations and Prospects

The findings of this study should be interpreted within several methodological and empirical boundaries. (1) The analysis focuses exclusively on prefecture-level cities in China. Although this provides a valuable context for examining multidimensional urban coordination, variations in institutional settings, governance systems, and development stages may affect the transferability of the results to other geographical contexts. Extending the analysis to international or cross-regional settings would provide additional evidence regarding the broader applicability of the proposed framework. (2) The construction of the USRL system emphasizes efficiency-based measurement. While this approach improves consistency and comparability across cities and over time, some dimensions associated with urban sustainability, including governance quality, institutional resilience, and social adaptive capacity, remain only partially represented. Future studies may benefit from integrating emerging data sources and more diverse sustainability indicators to capture these aspects more effectively. (3) The LTCCD framework relies on assumptions regarding spatial interaction patterns and distance–decay relationships. Although these assumptions enable the incorporation of tele-coupling effects, alternative specifications may yield different spatial coordination outcomes. Further research could explore the robustness of the results using alternative spatial structures and investigate the interaction mechanisms among cities through complementary spatial analytical methods. Notwithstanding these limitations, the study contributes an integrated perspective for assessing the coordinated development of multidimensional urban systems. Future investigations that combine broader spatial coverage, multidimensional datasets, and advanced spatial modeling techniques may provide deeper insights into the processes governing urban sustainability transitions.

6. Conclusions and Policy Recommendations

6.1. Conclusions

This study assessed the coordinated development of the urbanization–smart development–resilience–low-carbon (USRL) system using an integrated framework that combines efficiency measurement, spatial coordination analysis, inequality decomposition, and machine learning-based interpretation.
(1)
The coordination level of the USRL system increased steadily over the study period, although subsystem performance remained heterogeneous. Efficiency improvements were more evident in urbanization, smart development, and low-carbon transition, while resilience exhibited relatively limited progress.
(2)
Coordinated development displayed increasing spatial integration. High-coordination cities expanded beyond traditional coastal growth poles and gradually formed more connected regional structures. However, inter-regional differences remained the dominant source of spatial inequality, indicating persistent regional development gradients.
(3)
The response patterns of key driving factors were strongly nonlinear. Innovation-related factors, industrial upgrading, and high-quality foreign investment generally promoted coordinated development, whereas financial and fiscal factors exhibited varying effects across different development stages.
Overall, the results suggest that coordinated urban development emerges from the interaction of multiple subsystems, cross-regional connections, and heterogeneous development drivers. Incorporating tele-coupling processes and nonlinear factor effects provides a broader understanding of how multidimensional urban systems evolve and coordinate across space and time.

6.2. Policy Recommendations

Based on the empirical findings of this study, three policy recommendations are proposed to support the coordinated development of multidimensional urban systems:
(1)
Promote differentiated innovation-driven development strategies. The results indicate that innovation capacity, industrial upgrading, and high-quality external investment are important drivers of coordinated development. However, their effects vary across development stages and regional contexts. Therefore, policy interventions should move beyond uniform approaches and adopt differentiated development strategies. Regions with stronger innovation foundations should focus on enhancing technological breakthroughs, digital governance, and innovation diffusion, while less-developed regions should prioritize industrial transformation, human capital development, and the absorption of advanced technologies and external investment. In particular, eastern cities should emphasize innovation, efficiency, and technological leadership by directing fiscal resources toward R&D activities and emerging technologies. In contrast, western cities should prioritize strengthening basic fiscal investment in infrastructure, public services, and human capital to enhance their capacity to absorb innovation resources and support long-term coordinated development. Such differentiated strategies may help improve subsystem coordination while avoiding inefficient resource allocation.
(2)
Strengthen cross-regional coordination and spatial connectivity. The LTCCD results suggest that coordinated development is shaped not only by local subsystem interactions but also by cross-regional linkages. Consequently, policy efforts should place greater emphasis on strengthening inter-city collaboration, factor mobility, and knowledge exchange. This can be achieved through the development of regional innovation networks, integrated digital infrastructure, and collaborative governance mechanisms across urban agglomerations. Enhancing connectivity between core cities and surrounding areas may facilitate the diffusion of innovation, technology, and managerial resources, thereby improving the overall coordination capacity of urban systems.
(3)
Reduce persistent regional disparities through collaborative governance. Although regional disparities have gradually narrowed, inter-regional differences remain the dominant source of spatial inequality. Addressing these structural disparities requires stronger coordination mechanisms across regions. In particular, policies should support the sharing of innovation resources, infrastructure connectivity, and institutional cooperation between more-developed and less-developed regions. Rather than focusing solely on local development objectives, governments should promote collaborative governance arrangements that encourage cross-regional cooperation and balanced development. Such efforts may contribute to reducing long-term spatial inequalities and fostering more integrated and sustainable urban development.

Author Contributions

Data curation, investigation, resources, writing—original draft, writing—review and editing, software, visualization, X.L.; writing—original draft, project administration, formal analysis, writing—original draft, S.X.; formal analysis, writing—original draft, data curation, Y.Z.; formal analysis, writing—original draft, writing—review and editing, P.L.; methodology, writing—review and editing, X.M.; software, formal analysis, D.Q.; methodology, software, J.F.; software, data curation, F.L.; software, formal analysis, J.Y.; conceptualization, writing—review and editing, H.F. All authors have read and agreed to the published version of the manuscript.

Funding

This research was funded by the Qingdao Municipal Social Science Planning Research Project Fund in 2022, Project No.: QDSKL2201128.

Institutional Review Board Statement

Not applicable.

Informed Consent Statement

Not applicable.

Data Availability Statement

The original contributions presented in this study are included in the article. Further inquiries can be directed to the corresponding author.

Conflicts of Interest

The authors declare no conflicts of interest.

Appendix A

Super-SBM Model

The coordinated development of the USRL system is evaluated on the basis of subsystem efficiency. Given the presence of multiple inputs, desirable outputs, and undesirable outputs, we employ the Super-SBM model to estimate the efficiency of the urbanization, smart development, resilience, and low-carbon subsystems [48]. The model accounts for input–output slacks and enables discrimination among efficient decision-making units. To accommodate heterogeneity across cities, variable returns to scale (VRS) are assumed [49]. The model is specified as follows:
Suppose that each decision-making unit employs m inputs to produce S 1 desirable outputs and S 2 undesirable outputs. The associated input and output vectors can be formulated as follows:
X = x 1 , x 2 , x 3 x n R m × n
Y g = y 1 g , y 2 g , y 3 g y n g R S 1 × n
Y b = y 1 b , y 2 b , y 3 b y n b R S 2 × n
Let all input and output vectors be positive. The feasible production set can then be defined as follows:
P = x , y g , y b x X θ , y g Y g θ , y b Y b θ , θ 0
Considering the presence of undesirable outputs in decision-making unit x 0 , y 0 g , y 0 b the corresponding model can be expressed as follows:
ρ = 1 1 m i = 1 m S i x i 0 1 + 1 S 1 + S 2 r = 1 S 1 S r g y r 0 g + r = 1 S 2 S r b y r 0 b
s . t . x 0 = X θ + S y 0 b = Y b θ S b y 0 g = Y g θ S g S 0 , S b 0 , S g 0
Equation (A5) provides the efficiency measure ρ 0 , 1 for the decision-making unit. For computational convenience, the model may be reformulated into the following equivalent expression:
τ = min t 1 m i = 1 m S i x i 0
s . t . t + 1 S 1 + S 2 r = 1 S 1 S r g y r 0 g + r = 1 S 2 S r b y r 0 b = 1 x 0 t = X μ + S y 0 b t = Y b μ S b y 0 g t = Y g μ S g S 0 , S b 0 , S g 0 μ 0 , t 0
A limitation of the conventional SBM model is that several decision-making units may be evaluated as fully efficient, thereby restricting comparative analysis among frontier performers. To overcome this limitation, a super-efficiency SBM model is adopted, allowing efficiency scores to exceed 1 and providing greater differentiation among efficient units. The model is specified as follows:
ρ * = min 1 m i = 1 m x ¯ i x i 0 1 S 1 + S 2 r = 1 S 1 y r g y r 0 g + r = 1 S 2 y r b y r 0 b
s . t . x ¯ j = 1 , k n θ j x j , y ¯ g j = 1 , k n θ j y j g , y ¯ b j = 1 , k n θ j y j b x ¯ x 0 , y ¯ g y 0 g , y ¯ b y 0 b , y ¯ g 0 , θ 0
Here, ρ * represents the target efficiency value of the decision-making unit, and ρ * 1 indicates that the decision-making unit is effective. ρ * < 1 represents the existence of efficiency loss; the closer its value is to 0, the greater the loss, and the greater the potential for improvement. x i o , y r 0 g , and y r 0 b represent the input, expected output, and undesired output of the i decision-making unit at time point r , respectively. m is the number of input factors. S 1 and S 2 represent the number of expected and undesired outputs.
Table A1. Description of influencing factors.
CategoryMeasuring IndicatorsAbbreviationMeaningUnit
Innovation and developmentThe proportion of green patents grantedPGPGReflecting the level of low-carbon technology development%
Research and development funding as a percentage of general budget expenditureR&DFPReflecting the level of support the research and development %
Talent reservesNumber of universities students per 10,000 peopleNUSPReflecting the level of region human capital innovation and developmentPersons
Economic openingThe proportion of total foreign investment actually utilized in the regional economyPTFIReflects the actual of high-quality foreign investment utilization%
Year-end loan balance of financial institutions as a percentage of regional economyYLFPReflecting the level of development of regional financial markets%
The proportion of government general budget in regional economic developmentPGGBReflecting the level of government financial support/
Industrial upgradingThe proportion of tertiary industry to the secondary industry in the economyPTTSReflecting the level of industrial structure upgrading and development/
Per capita urban road construction areaPURCAReflecting the level of urban infrastructure developmentm2/Person
Note: “PGGB” reflects the level of government financial support for development, calculated as government budgetary amount/regional GDP. “PTTS” reflects the level of industrial structure upgrading and is calculated as the proportion of the tertiary industry economy/the proportion of the secondary industry economy.
Table A2. Optimal parameter values for the GBM model.
ParametersDetailed DescriptionNumerical Value
N_estimatorsNumber of boosting interactions (number of trees)810
Max_depthMaximum depth of individual trees10
Min_samples_splitMinimum number of samples to split a node17
Min_samples_leafMinimum number of samples per leaf3
Learning_rateBoosting the learning rate, controlling the contribution of each tree0.011
subsampleSubsample ratio of the training data used for each tree0.675
Table A3. Comparison of the predictive capabilities of different machine learning models.
ModelR2_TrainR2_TestRMSE_TrainRMSE_Test
GBM0.9878143890.7171161660.0124159220.061210575
RF0.9573160670.6905037360.0232374030.064025075
XGBoost0.8209319350.6616939970.0475953360.066938695
LGBM0.9652218620.6719667650.0209753150.063873569
Adaboost0.6514601170.5950151650.0664020620.073238893
Catboost0.9807916920.7052322340.0155883410.064414061

References

  1. Yuan, L.; Zhang, X.; Song, Z.; Li, Y.; Zang, P.; Liu, M. Toward urban sustainability: Assessing SDG11.2 via functional zone analysis in five Chinese cities. npj Urban Sustain. 2026, 6, 60. [Google Scholar] [CrossRef]
  2. Wu, M.; Zheng, K.; Chen, J.; Zhang, J.; Li, M.; Wu, S. Assessing elderly walkability to urban parks using mobility analysis and multi-source data: A case study of central Fuzhou, China. Sci. Rep. 2026, 16, 13685. [Google Scholar] [CrossRef]
  3. He, S.; Wang, T.; Spicer, R.A.; Farnsworth, A.; Mulch, A.; Widdowson, M.; Zhang, Q.; Cai, F.; Valdes, P.J.; Wang, C.; et al. Back to an ice-free future: Early Cretaceous seasonal cycles of sea surface temperature and glacier ice. Sci. Adv. 2025, 11, eadr9417. [Google Scholar] [CrossRef]
  4. Min, X.Z.; Zhang, X.; Xie, Z.Y.; Nikolaev, A.; Vorkamp, K.; Ma, J.M.; Reiersen, L.O.; Li, L.; Cai, M.H.; Ren, N.Q.; et al. Organic chemicals of Arctic concern in Russian coastal seas. Sci. Bull. 2025, 71, 946–959. [Google Scholar] [CrossRef]
  5. Tolliver, C.; Keeley, A.R.; Managi, S. Green bonds for the Paris agreement and sustainable development goals. Environ. Res. Lett. 2019, 14, 064009. [Google Scholar] [CrossRef]
  6. Wang, D.; Chen, S. Synergistic action on mitigation and adaptation pilot policies to enhance low-carbon resilience of Chinese cities. Nat. Cities 2025, 2, 812–824. [Google Scholar] [CrossRef]
  7. Tan, H.; Guo, Z.; Yan, J.; Zhang, D.; Chen, Y.; Zhang, H. Advancing low-carbon smart cities: Leveraging UAVs-enabled low-altitude economy principles and innovations. Renew. Sustain. Energy Rev. 2025, 222, 115942. [Google Scholar] [CrossRef]
  8. Umeike, R.; Dao, T.; Crawford, S. State-of-the-art review of resilient smart cities: Progress and challenges. Urban Gov. 2025, 5, 222–239. [Google Scholar] [CrossRef]
  9. Zhou, D.; Dai, H. Provincial sustainable development in China from a multidimensional perspective: Regional differences, dynamic evolution, spatial effects, and convergence. Sustainability 2025, 17, 215. [Google Scholar] [CrossRef]
  10. Huang, S.H.; Wu, T.E.; Huang, S.H.; Lai, C.H.; Yang, Q.L. Toward greener welding manufacturing: Real-time CO2 estimation and weld quality optimization. Int. J. Adv. Manuf. Technol. 2026, 143, 6745–6756. [Google Scholar] [CrossRef]
  11. Lan, C.; Li, X.; Peng, B.; Li, X. Unlocking urban ecological resilience: The dual role of environmental regulation and green technology innovation. Sustain. Cities Soc. 2025, 128, 106466. [Google Scholar] [CrossRef]
  12. Ulker Senkulak, B.; Kanoglu, A.; Ozcevik, O. Simurg_cities conceptual model: Multi-dimensional and multi-layer performance-based assessment of urban sustainability at the city level. Chall. Sustain. 2025, 13, 425–444. [Google Scholar] [CrossRef]
  13. Adeel, A.; Shivaji, P.P.; Patil, S.T.; Ahadi, A. Low-Carbon and Climate-Resilient Cities. In Climate Change and Sustainable Development; CRC Press: Boca Raton, FL, USA, 2025; pp. 193–206. [Google Scholar]
  14. Hassan, A.M.; Lee, H. Toward the sustainable development of urban areas: An overview of global trends in trials and policies. Land Use Policy 2015, 48, 199–212. [Google Scholar] [CrossRef]
  15. Luo, T.; Zhong, T. Simulating the Effects of Future Urban Expansion on Ecosystem Services: A Spatial Spillover Analysis. Land Degrad. Dev. 2026, 37, 2529–2544. [Google Scholar] [CrossRef]
  16. Ma, Z.; Zhang, P. Myth of the digital economy: Can it continually contribute to a low-carbon status and sustainable development? Environ. Impact Assess. Rev. 2025, 110, 107688. [Google Scholar] [CrossRef]
  17. Li, H.; Sun, Z.; Chen, Y. Spatiotemporal heterogeneity and driving factors of sustainable development in 286 Chinese cities based on the hybrid weighted comprehensive evaluation model. Sustain. Cities Soc. 2025, 135, 107004. [Google Scholar] [CrossRef]
  18. Zhang, Y.; Zhang, Y.; Fukuda, H.; Liu, P.; Lai, X. Exploring the multilevel coordinated development characteristics and obstacle mechanisms of the smart city–urbanization–low-carbon city system. J. Urban Manag. 2025, 15, 801–821. [Google Scholar] [CrossRef]
  19. Hayvon, J.C. Disability in sustainability theories, models, and frameworks: A scoping review guided by the international classification of functioning and the sustainable development goals. Sustain. Sci. Pract. Policy 2025, 21, 2497141. [Google Scholar] [CrossRef]
  20. Kaiser, Z.A.; Deb, A. Sustainable smart city and Sustainable Development Goals (SDGs): A review. Reg. Sustain. 2025, 6, 100193. [Google Scholar] [CrossRef]
  21. Zhang, Y.; Lai, X.; Zhang, Y.; Liu, P.; Fukuda, H. Revealing the multi-level comprehensive development efficiency and influencing factors of the smart city–urbanization–low-carbon city system: A case study of key cities in China. Sustain. Cities Soc. 2025, 132, 106820. [Google Scholar] [CrossRef]
  22. Li, C.; Wu, Y.; Qiao, W.; Gao, B.; Wu, Y.; Wang, M.; Zheng, K. Mechanisms of Spatiotemporal Interactions Between Urbanization and Ecosystem Health in Plateau-mountain Urban Areas: Insights from Central Yunnan Urban Agglomeration, China. Chin. Geogr. Sci. 2026, 36, 879–896. [Google Scholar] [CrossRef]
  23. Wang, Y.; Liang, H.; Dong, L.; Zhu, Y.; Wang, Y. Harmonizing new-type urbanization and eco-efficiency: Spatial–temporal coupling coordination in the Yangtze River Economic Belt. Environ. Dev. Sustain. 2025, 1–40. [Google Scholar] [CrossRef]
  24. Zhang, T.; Tan, Y.; Robinson, G.M.; Bai, W. China’s new-style urbanization and its impact on the green efficiency of urban land use. Sustainability 2025, 17, 2299. [Google Scholar] [CrossRef]
  25. Hsi, D.L.; Chen, S.H.; Wang, S.W. Urban actions toward energy efficiency and carbon reduction—An empirical study under the urbanization dynamics. Environ. Dev. Sustain. 2025, 27, 30119–30134. [Google Scholar] [CrossRef]
  26. Guney, E.; Sogut, Y.; Demirtas, N.; Koseoglu, Y.; Sanver, C. Harmonising progress: Assessing the impact of economic freedom, economic growth, urbanisation and environmental protection expenditures on load capacity in selected European union countries. Environ. Sci. Eur. 2025, 37, 51. [Google Scholar] [CrossRef]
  27. Cai, A.; Guo, R.; Zhang, Y.; Wang, L.; Lin, R.; Wu, H.; Huang, R.; Zhang, J.; Wu, J. Assessing urban carbon health in China’s three largest urban agglomerations: Carbon emissions, energy-carbon emission efficiency and carbon sinks. Appl. Energy 2025, 383, 125326. [Google Scholar] [CrossRef]
  28. Bi, S.; Zhang, Z.; Yan, Z.; Appolloni, A. Promoting Urban Sustainable Development: Underground Wastewater Treatment Plant Alleviates Urban Air Pollution. Sustain. Dev. 2026, 1–23. [Google Scholar] [CrossRef]
  29. Jiang, Y.; Sun, J. Does smart city construction promote urban green development? Evidence from a double machine learning model. J. Environ. Manag. 2025, 373, 123701. [Google Scholar] [CrossRef]
  30. Valencia-Arias, A.; Rojas, E.M.; Pineda, V.G.; Agudelo-Ceballos, E.; Rodriguez, L.d.R.C.; Requejo, C.C.E.; Cardona-Acevedo, S.; Londoño-Celis, W.; Adan, T.E.A. Research trends on sustainable development in smart cities. Discov. Sustain. 2025, 6, 369. [Google Scholar] [CrossRef]
  31. Zhuo, Z.; Ye, J.; Wang, Y.; Chen, H.; Liang, B. Smart cities, smarter land use? Unveiling the efficiency gains from China’s digital urban transformation. Ecol. Indic. 2025, 171, 113151. [Google Scholar] [CrossRef]
  32. Liu, Q.; Wan, P. Greening the urban landscape: Smart city initiatives and pollution reduction in China. Systems 2025, 13, 165. [Google Scholar] [CrossRef]
  33. Gu, Q.; Sing, M.C.; Jefferies, M.; Kanjanabootra, S. Bridging the gap between smart cities and sustainability: Current practices and future trends. Cities 2025, 159, 105799. [Google Scholar] [CrossRef]
  34. Khajuria, A.; Verma, P. Circular economy for “blue skies” in building resilient cities—Towards the UN 2030 Agenda for sustainable development goals. Front. Sustain. 2025, 6, 1479452. [Google Scholar] [CrossRef]
  35. Tong, B.; Liu, H.; Zhu, J.; Wang, Y.; Mei, T.; Kou, M. Exploring safety research progress and prospects for the sustainable development of resilient cities. Buildings 2025, 15, 505. [Google Scholar] [CrossRef]
  36. Kochskämper, E.; Glass, L.M.; Haupt, W.; Malekpour, S.; Grainger-Brown, J. Resilience and the Sustainable Development Goals: A scrutiny of urban strategies in the 100 Resilient Cities initiative. J. Environ. Plan. Manag. 2025, 68, 1691–1717. [Google Scholar] [CrossRef]
  37. Suleimany, M.; Gonbad, M.R.S.; Naghibizadeh, S.; Niri, S.D. Artificial intelligence as a tool for building more resilient cities in the climate change era: A systematic literature review. In Artificial Intelligence and Machine Learning Applications for Sustainable Development; CRC Press: Boca Raton, FL, USA, 2025; pp. 60–81. [Google Scholar]
  38. Maihaiti, G.; Hunjra, A.I.; Alharbi, S.S.; Zhao, S. Climate-resilient cities for green innovation in enterprises: New perspective based on Fintech. Int. Rev. Econ. Financ. 2025, 101, 104251. [Google Scholar] [CrossRef]
  39. Majlingova, A.; Kádár, T.S. From risk to resilience: Integrating climate adaptation and disaster reduction in the pursuit of sustainable development. Sustainability 2025, 17, 5447. [Google Scholar] [CrossRef]
  40. Li, Y.; Chen, H.; Yu, P.; Yang, L. Development and challenges of low-carbon cities in China: Current situation, influencing factors, and sustainability strategies. Buildings 2025, 15, 350. [Google Scholar] [CrossRef]
  41. Wang, S.; Xiao, S.; Zhang, Q.; Sun, M. How can low-carbon city construction enhance urban economic resilience? A mechanism analysis based on industrial agglomeration and technological innovation effects. J. Knowl. Econ. 2025, 16, 4102–4124. [Google Scholar] [CrossRef]
  42. Jia, Y.; Huang, Y.; Zhou, J.; Sun, J. Construction of evaluation indicator system and analysis for low-carbon economy development in Chengdu City of China. Systems 2025, 13, 573. [Google Scholar] [CrossRef]
  43. Wang, B.; Yu, T. Sustainable development through urban agglomeration green and low-carbon logistics: Efficiency insights from China’s urban agglomeration. Environ. Dev. Sustain. 2026, 28, 10071–10096. [Google Scholar] [CrossRef]
  44. Han, H.; Gu, R.; Yang, Y. Impacts of low-carbon city pilot policy on ecological well-being performance across Chinese cities: A spatial difference-in-difference analysis. Sustain. Cities Soc. 2025, 118, 105864. [Google Scholar] [CrossRef]
  45. Zhang, H.; Qiu, S.; Lin, J.; Li, B.; Liang, C.; Wang, Y.; Qi, Z.; Jiang, H.; Cao, D.; Liu, D. Are cities navigating towards low carbon? A comparative view of China and globe. Sustain. Futures 2025, 9, 100697. [Google Scholar] [CrossRef]
  46. Lai, X.; Li, F.; Zhang, Y.; Liu, P.; Feng, J.; Chi, J.; Wang, X.; Fukuda, H. Bridging Effect–Efficiency Gaps in Low-Carbon Resilient Cities: Evidence on Synergistic Development and Nonlinear Drivers from Chinese Cities. Sustainability 2026, 18, 2126. [Google Scholar] [CrossRef]
  47. Yan, X.; Sun, T. Artificial intelligence development and carbon emission intensity: Evidence from industrial robot application. Sustainability 2025, 17, 3867. [Google Scholar] [CrossRef]
  48. Wang, L.; Li, Z.; He, R.; Yun, Y. Study on Rail Transit Transfer Efficiency Based on Input-Oriented Three-Stage Super-Efficiency SBM and Output-Oriented ML Index Models. Sustainability 2026, 18, 2329. [Google Scholar] [CrossRef]
  49. Ma, M.; Yang, Y.; Ma, Y.; Wang, Z. Evaluation and heterogeneity of the green total factor productivity of Shandong Province, China: A super-SBM and GML analysis. Sci. Rep. 2025, 15, 21901. [Google Scholar] [CrossRef] [PubMed]
  50. Liu, Y.; Xu, W.; Wang, L.; Lu, N.; Kou, W.; Ou, G.; Wang, H.; He, J.; Gao, X. A novel methodology for poverty evaluation and spatiotemporal coupling coordination between poverty and eco-environment quality: A case study in the Yunnan-Guizhou Plateau, China. Ecol. Indic. 2025, 181, 114436. [Google Scholar] [CrossRef]
  51. Zhao, X.; Tan, S.; Li, Y.; Khan, S. Quantitative analysis of local coupling and telecoupling mechanism between urbanization and ecological environment quality based on multi-source remote sensing data. Ecol. Indic. 2025, 173, 113345. [Google Scholar] [CrossRef]
  52. Xie, A.; Zhang, F.; Ding, Y.; Chen, J.; Yang, P.; Peng, G. Exploring the Dynamic Local and Tele-Coupling Coordination Mechanism of the Ecosystem Services Supply–Demand and Its Driving Forces: Taking China’s Yangtze River Economic Belt as an Example. Land Degrad. Dev. 2025, 36, 3178–3193. [Google Scholar] [CrossRef]
  53. Xu, B.; Zheng, Y.; Li, W.; Gao, X.; Gong, D.; He, J.; Fan, Z. Handling multiobjective optimization problems with complex constraints: A constraints grouping-based approach. IEEE Trans. Syst. Man Cybern. Syst. 2025, 55, 3866–3880. [Google Scholar] [CrossRef]
  54. Zhang, L.; Fang, C.; Zhu, C. Coupling coordination and decoupling effects: Measuring the interaction between urban agglomeration ecosystems and urbanization. Cities 2026, 171, 106788. [Google Scholar] [CrossRef]
  55. Wang, Y.; Song, M.; Han, Y.; Wang, Y. Multi-scale coupling measurement and driving factor analysis between carbon emission from energy consumption and ecological environment—The case study of Pearl River Delta urban agglomeration. Sustain. Cities Soc. 2025, 127, 106425. [Google Scholar] [CrossRef]
  56. Gong, M.; Yu, K.; Zhou, C.; Liu, Z.; Xu, Z.; Xu, M.; Qu, S. SDG space: Revealing the structure and complementarities among sustainable development goals in China. Fundam. Res. 2025, 5, 360–369. [Google Scholar] [CrossRef]
  57. Ge, K.; Wang, Y.; Liu, X.; Hu, L.; Ke, S.; Jiang, X.; Zhang, W. Spatial effects and influence mechanisms of urban land use green transition on urban carbon emissions. Ecol. Indic. 2025, 172, 113261. [Google Scholar] [CrossRef]
  58. Zheng, J.; Guo, M.; Lo, K. Shaping sustainability: Circular economy development through digital technology innovation. J. Innov. Knowl. 2025, 10, 100784. [Google Scholar] [CrossRef]
  59. Guo, L.; Tang, M.; Wu, Y.; Bao, S.; Wu, Q. Government-led regional integration and economic growth: Evidence from a quasi-natural experiment of urban agglomeration development planning policies in China. Cities 2025, 156, 105482. [Google Scholar] [CrossRef]
  60. Chen, S.; Du, Y.; Liu, Y. Regional Integration and Urban Green and Low-Carbon Development: A Quasi-Natural Experiment Based on the Expansion of the Yangtze River Delta Urban Agglomeration. Sustainability 2025, 17, 3621. [Google Scholar] [CrossRef]
  61. Sha, A.; Zhang, J.; Pan, Y.; Zhang, S. How to recognize and measure the impact of phasing urbanization on eco-environment quality: An empirical case study of 19 urban agglomerations in China. Technol. Forecast. Soc. Change 2025, 210, 123845. [Google Scholar] [CrossRef]
  62. Luo, J.; Ma, W.; An, S.; Zhang, Z.; Fu, Y.; Huang, H.; Chang, G. Coupling analysis of multi-systems urbanization: Evidence from China. Ecol. Indic. 2025, 170, 112977. [Google Scholar] [CrossRef]
  63. Yu, C.; Shen, W.; Zhang, Z. Assessing progress toward sustainable development in China and its impact on human well-being. Environ. Impact Assess. Rev. 2025, 110, 107729. [Google Scholar] [CrossRef]
  64. Liu, X.; Jia, X.; Lyu, K.; Guo, P.; Shen, J.; Wang, G. Towards sustainable development: The spatial spillover effects of low-carbon city pilot policy on urban energy transition. Environ. Dev. Sustain. 2025, 27, 26913–26946. [Google Scholar] [CrossRef]
  65. Liang, J.; Qiao, C. The impact of digital economy on urban green and low-carbon development: Mechanism and spatial spillover effect. Front. Sustain. Cities 2025, 7, 1591826. [Google Scholar] [CrossRef]
  66. Pricopoaia, O.; Cristache, N.; Lupașc, A.; Iancu, D. The implications of digital transformation and environmental innovation for sustainability. J. Innov. Knowl. 2025, 10, 100713. [Google Scholar] [CrossRef]
  67. Sun, J.; Chen, D. Green credit, tourism technology innovation, and sustainable development of tourism. Int. Rev. Econ. Financ. 2025, 99, 104004. [Google Scholar] [CrossRef]
  68. Islam, H. Nexus of economic, social, and environmental factors on sustainable development goals: The moderating role of technological advancement and green innovation. Innov. Green Dev. 2025, 4, 100183. [Google Scholar] [CrossRef]
  69. Elhassan, T. Green technology innovation, green financing, and economic growth in G7 countries: Implications for environmental sustainability. Econ.-Innov. Econ. Res. J. 2025, 13, 69–91. [Google Scholar] [CrossRef]
  70. Feng, Y.; Li, G. Urban growth dynamics and hierarchical effects: An analysis through multidimensional scaling. Int. J. Urban Sci. 2025, 1–26. [Google Scholar] [CrossRef]
Figure 1. Research area.
Sustainability 18 06082 g001
Figure 2. USRL system theoretical framework connection.
Sustainability 18 06082 g002
Figure 3. Analytical framework of the study.
Sustainability 18 06082 g003
Figure 4. SHAP-based feature importance ranking in the GBM model.
Sustainability 18 06082 g004
Figure 5. Spatiotemporal evolution of urbanization subsystem efficiency.
Sustainability 18 06082 g005
Figure 6. Spatiotemporal evolution of smart city subsystem efficiency.
Sustainability 18 06082 g006
Figure 7. Spatiotemporal evolution of resilience city subsystem efficiency.
Sustainability 18 06082 g007
Figure 8. Spatiotemporal evolution of low-carbon city subsystem efficiency.
Sustainability 18 06082 g008
Figure 9. Spatiotemporal evolution of coordinated development in the USRL system.
Sustainability 18 06082 g009
Figure 10. Analysis of single nonlinear driving factors.
Sustainability 18 06082 g010
Figure 11. Interaction strength heatmap of key driving factors.
Sustainability 18 06082 g011
Figure 12. SHAP interaction effects among key driving factors.
Sustainability 18 06082 g012
Figure 13. (af) Comparison of coordinated development distributions under the CCD, CCA, and LTCCD models.
Sustainability 18 06082 g013
Table 1. Input-output indicator system of the USRL system efficiency.
SubsystemIndicator TypeVariableDescriptionUnitReferences
Urbanization subsystemInputLabor inputUrban population size10,000 Persons[23]
Land useUrban construction areaKm2[24]
Social capital investmentGeneral public budget expenditure10,000 Yuan[23,24]
Desirable outputUrban people developmentUrban population densityPerson/km2[25]
Economic developmentTotal regional economic development10,000 Yuan[26]
Urban construction developmentUrban construction area as a percentage of the urban area%[27]
Undesirable outputWastewater dischargeTotal industrial wastewater dischargeTons[28]
Exhaust emissionsTotal industrial sulfur dioxide emissionsTons[28]
Smart city subsystemInputLabor inputNumber of scientific research and technology practitioner10,000 Persons[29]
Infrastructure inputTotal number of mobile phones at the end10,000 Persons[30]
Economic developmentTotal investment of science and technology10,000 Per-sons[30]
Desirable outputTechnological achievementsTotal number of patents granted at the endPiece[31]
High-tech development achievementsIndustrial robot installation densityPiece/Persons[32]
Undesirable outputSocial stability pressureNumber of unemployed registeredPersons[33]
Resilient city subsystemInputLabor inputTotal number of employees in public facilities management and social security services10,000 Persons[34]
Capital investmentTotal stock of social capital10,000 Yuan[35]
Economic inputTotal retail sales of consumer goods10,000 Yuan[35]
Desirable outputSocial securityNumber of people enrolled in pension, medical and unemployment insurance10,000 Persons[36]
Infrastructure protectionUrban drainage pipeline construction lengthKm2[37]
Undesirable outputSocial risk pressureUrban residents’ unemployment rate%[38]
Severity of disaster lossesDirect economic losses from disaster/Total regional GDP%[39]
Low-carbon city subsystemInputLabor inputTotal number of employees in the secondary industryPersons[40]
Energy inputTotal urban energy consumptionTce[40]
Economic investmenTotal fixed asset investment of the whole society10,000 Yuan[41]
Desirable outputGreen developmentUrban green space areaKm2[42]
Green infra-structure constructionGreen coverage rate of built-up area%[43]
Green economic transformationThe proportion of the third industry /the proportion of the secondary industry%[44]
Undesirable outputGreenhouse gasTotal CO2 emissionsTons[45]
Electricity consumptionTotal electricity consumption of the whole society10,000 kWh[46]
Table 2. Main symbols and definitions.
SymbolDefinition
UE1Urbanization efficiency
UE2Smart city efficiency
UE3Resilience efficiency
UE4Low-carbon efficiency
CCoupling degree
TComprehensive development index
DCoordination degree
pDistance–decay coefficient
WijSpatial inverse-distance weight
Table 3. Classification of local coupling and tele-coupling coordination levels.
Coupling Coordination DegreeGradeCoordination Level
[0.0~0.1)1Extreme incoordination
[0.1~0.2)2High incoordination
[0.2~0.3)3Moderate incoordination
[0.3~0.4)4Mild incoordination
[0.4~0.5)5Basic coordination
[0.5~0.6)6Low coordination
[0.6~0.7)7Moderate coordination
[0.7~0.8)8Favorable coordination
[0.8~0.9)9Excellent coordination
[0.9~1.0]10High-quality coordination
Table 4. Dagum Gini coefficient decomposition of coordinated development in the USRL system.
YearsGini CoefficientContribution Rate (%)
TotalGwGbGtGw (%)Gb (%)Gt (%)
20100.1360.0340.0860.01825.05463.15211.794
20120.1390.0350.0880.01624.49663.44111.582
20140.1370.0340.0880.01624.99763.66611.357
20160.1360.0330.0880.01524.26564.70611.029
20180.1340.0330.0870.01424.62764.92510.448
20200.1320.0320.0870.01324.24265.9099.849
20220.1310.0320.0850.01424.42764.88510.688
20230.1310.0320.0840.01524.42764.12211.451
Table 5. Regional decomposition of spatial disparities in the coordinated development of the USRL system.
YearsGini Coefficient with the GroupInter-Group Gini Coefficient
Eastern
Region
Central
Region
Western
Region
E&C
Region
E&W
Region
C&W
Region
20100.1060.0920.1160.1360.2040.123
20120.1060.0930.1120.1420.2090.122
20140.1070.0880.1080.1380.2080.121
20160.1080.0870.1030.1390.2070.119
20180.1060.0840.0960.1350.2050.116
20200.1050.0870.1000.1320.2030.114
20220.1040.0850.0930.1310.2010.113
20230.1040.0850.0910.1300.2010.111
Disclaimer/Publisher’s Note: The statements, opinions and data contained in all publications are solely those of the individual author(s) and contributor(s) and not of MDPI and/or the editor(s). MDPI and/or the editor(s) disclaim responsibility for any injury to people or property resulting from any ideas, methods, instructions or products referred to in the content.