1. Introduction
Urban freight distribution constitutes an essential component of city functioning, as it supplies the commercial activities, services, households, and institutions that sustain everyday urban life. However, this system also generates pressure on mobility, road space, curbside management, and urban sustainability, especially when delivery, loading, and unloading operations are not properly integrated into transport planning. The literature on city logistics argues that urban logistics should be understood as an integrated system in which carriers, businesses, authorities, road infrastructure, and public space users interact [
1]. In this sense, the management of urban freight distribution cannot be limited to the private efficiency of delivery, but must also consider its effects on congestion, emissions, noise, road safety, and the quality of urban space [
2]. Accordingly, loading and unloading operations should be analyzed not only as logistics activities, but also as processes that interact directly with curbside allocation, public space use, and sustainable urban transport planning.
The growth of urban commerce, the expansion of on-demand consumption, and the increase in last-mile deliveries have intensified the pressure of freight distribution on central urban areas. Several recent reviews agree that the last mile is one of the most costly, inefficient, and environmentally sensitive stages of the supply chain, due to its operational fragmentation, high delivery frequency, and dependence on motorized transport [
3,
4,
5]. This phenomenon has been reinforced by changes in consumption patterns, commercial digitalization, and the growing demand for rapid deliveries, which increase the presence of delivery vehicles in dense urban areas. Although several operational and technological solutions have been proposed for last-mile logistics, their effectiveness depends on local conditions, regulatory capacity, and the availability of empirical data to evaluate their spatial and operational consequences [
6,
7]. Therefore, UFD planning requires localized empirical evidence and methods capable of capturing both operational patterns and their spatial effects.
One of the most persistent problems in UFD is the limited availability, location, and management of suitable spaces for loading and unloading. In studies applied to Latin American cities, the lack of loading and unloading areas has been identified as one of the main problems perceived by stakeholders involved in urban freight transport [
8]. Unloading zones are recognized as a frequent solution for organizing logistics operations, but their effectiveness depends on their accessibility, level of service, distance to establishments, and degree of occupancy [
9]. At the same time, curbside management has become a critical issue, because the same space must serve parking, active mobility, public transport, delivery, urban services, and commercial activities [
10,
11]. Consequently, the absence of technical criteria for locating, sizing, and regulating loading and unloading bays tends to generate informal operations, roadway stops, pedestrian obstruction, and conflicts with traffic.
The literature shows that there is no single universal solution to urban logistics problems, but rather a set of measures whose effectiveness depends on the territorial, regulatory, and operational context. Interventions include loading and unloading zones, time windows, access restrictions, consolidation centers, microhubs, low-emission vehicles, digitalization, dynamic curbside management, and public–private coordination [
12,
13,
14]. However, these measures may generate divergent effects: for example, vehicle restrictions may reduce emissions in certain areas but shift operations to less controlled times, routes, or zones; similarly, the creation of bays may improve organization but be insufficient if it is not accompanied by enforcement, signage, and demand management. Therefore, the assessment of urban freight interventions requires multidimensional and evidence-based approaches that integrate operational performance, spatial conditions, public-space impacts, and sustainability-related criteria [
15,
16].
The analysis of UFD requires combining direct observation, georeferenced data, operational indicators, and spatial tools capable of identifying activity concentrations. In this field, performance and sustainability indicators make it possible to translate complex operational conditions into comparable measures to support public and private decision-making [
17,
18]. In addition, the identification of spatial patterns through concentration, clustering, and accessibility analyses facilitates the detection of critical areas where logistics pressure, informality, and conflicts are spatially localized. However, many empirical applications still remain descriptive and do not fully connect field observations with spatial clustering, prioritization criteria, and infrastructure-oriented estimates. A relevant gap therefore lies in developing spatial-operational frameworks that can transform observed loading and unloading operations into planning criteria for curbside freight management [
19,
20].
This gap is especially relevant in medium-sized cities and Latin American contexts, where urban logistics often operates with limited data availability, less specific regulation, and greater pressure on consolidated urban centers. International studies on UFD have more frequently focused on large metropolitan areas, developed economies, or logistics systems with greater institutional capacity, while intermediate cities have received less empirical attention. In Latin America and the Caribbean, logistics challenges are associated with limited infrastructure, low digitalization, congestion, operational informality, and weaknesses in coordination among public and private actors [
21,
22]. Recent research in Latin American cities shows that loading and unloading problems are reflected in a lack of regulation, infrastructure shortages, inadequate occupation of road space, and conflicts in central commercial corridors [
23]. In this context, medium-sized cities provide an appropriate setting for examining UFD because they combine concentrated commercial activity, limited curbside capacity, and planning systems that often lack detailed freight data.
The sizing of loading and unloading bays remains an open methodological problem in UFD planning. Although there is consensus that the supply of spaces should be related to operational demand, service time, accessibility, and vehicle behavior, sufficient observational data are not always available to estimate requirements realistically. A frequent risk is to use accumulated survey volumes as if they represented daily demand, which can oversize infrastructure and reduce the applicability of recommendations. In contrast, estimating capacity based on average daily operations, operational duration, and productivity scenarios provides a better approximation of the conditions of a typical operating day. This perspective is consistent with recent approaches that recommend using empirical data, freight surveys, and functional analysis to understand urban freight demand and design context-sensitive interventions [
24]. Nevertheless, such estimates should be interpreted as planning-oriented approximations rather than definitive engineering designs, since they depend on assumptions regarding operating windows, turnover, enforcement, curb availability, and local regulatory conditions.
In the case of Loja, Ecuador, UFD takes place in a medium-sized city with a strong concentration of commercial and service activities in its consolidated urban area. Supply operations for minimarkets, warehouses, retail stores, market areas, and HORECA establishments generate daily loading and unloading demand that competes for curbside space, parking areas, and the roadway. Despite its relevance for urban mobility and local economic activity, there is limited scientific evidence on the location of these operations, their occupancy times, the types of conflicts they generate, and the number of bays required to serve them under operational criteria. This lack of evidence makes it difficult to move from reactive or isolated measures toward spatially prioritized UFD management. Consequently, the case of Loja makes it possible to address an empirical and methodological gap that is relevant to medium-sized Latin American cities with similar urban structures.
The general objective of this study is to develop and apply a spatial-operational framework to characterize urban freight distribution operations in a medium-sized Latin American city, identify patterns of conflict and informality, estimate loading and unloading bay requirements, and prioritize intervention zones for sustainable UFD management in Loja, Ecuador. To this end, a quantitative, observational, exploratory–descriptive, and correlational study was conducted, based on 642 valid records of real georeferenced loading and unloading operations. The methodology integrated data cleaning and reclassification, descriptive and inferential analysis, logistic models, the calculation of an operational sustainability risk/pressure index, spatial analysis using DBSCAN, logistics pressure and sustainable transport priority indices, and a corrected bay estimation based on average daily demand. The main results indicate a high concentration of operations in specific clusters, a predominance of light trucks, frequent use of paid parking areas and roadways, a relevant presence of operational conflicts, and spatial differences in logistics pressure and intervention priority. This methodological strategy links an operational diagnosis with spatially explicit planning criteria, while recognizing that the resulting recommendations require local validation before implementation.
The scope of the study focuses on loading and unloading operations observed within the urban area of Loja and does not seek to estimate the entirety of regional, interurban, or long-distance flows associated with the logistics system. Its scientific contribution lies in proposing a reproducible framework that combines georeferenced field data, composite indicators, cluster analysis, functional bay estimation, and spatial intervention scenarios. More specifically, the contribution is threefold: first, it provides empirical evidence on UFD operations in a medium-sized Latin American city; second, it integrates DBSCAN clustering with operational and priority indicators to identify differentiated freight pressure areas; and third, it proposes a planning-oriented bay estimation procedure based on average daily operations rather than accumulated survey demand. Overall, the study offers a methodological basis that may support sustainable UFD planning in comparable urban contexts, provided that local data, operational constraints, and regulatory conditions are considered.
2. Materials and Methods
2.1. Study Design
The study was conducted using a quantitative, observational, non-experimental design with an exploratory–descriptive and correlational scope, integrating spatial analysis applied to urban freight distribution (UFD) in a medium-sized Latin American city. The exploratory component made it possible to characterize operational patterns that are still poorly documented in intermediate urban contexts; the descriptive component systematized variables related to vehicle type, operation duration, location, loading and unloading site, type of goods transported, and conflicts generated; while the correlational component assessed associations between operational variables, public space use, informality, and conflict occurrence. Given the observational and non-probabilistic nature of the study, the results are interpreted as an empirical and planning-oriented characterization of observed UFD operations, rather than as a statistically representative estimate of all freight movements in the city.
This design is appropriate for urban logistics studies because UFD is a territorially localized, operational, and multifactorial phenomenon in which loading and unloading demand, curbside use, traffic disruptions, and occupation of public space must be analyzed in an integrated manner. Recent literature on urban freight transport highlights the need to develop methodological approaches that combine empirical data, operational indicators, spatial planning, and sustainability criteria to support decision-making in city logistics [
8,
15].
The general objective of the study was to develop and apply a spatial-operational framework to characterize urban freight distribution operations in a medium-sized Latin American city, identify patterns of conflict and informality, estimate loading and unloading bay requirements, and prioritize intervention zones for sustainable UFD management in Loja, Ecuador.
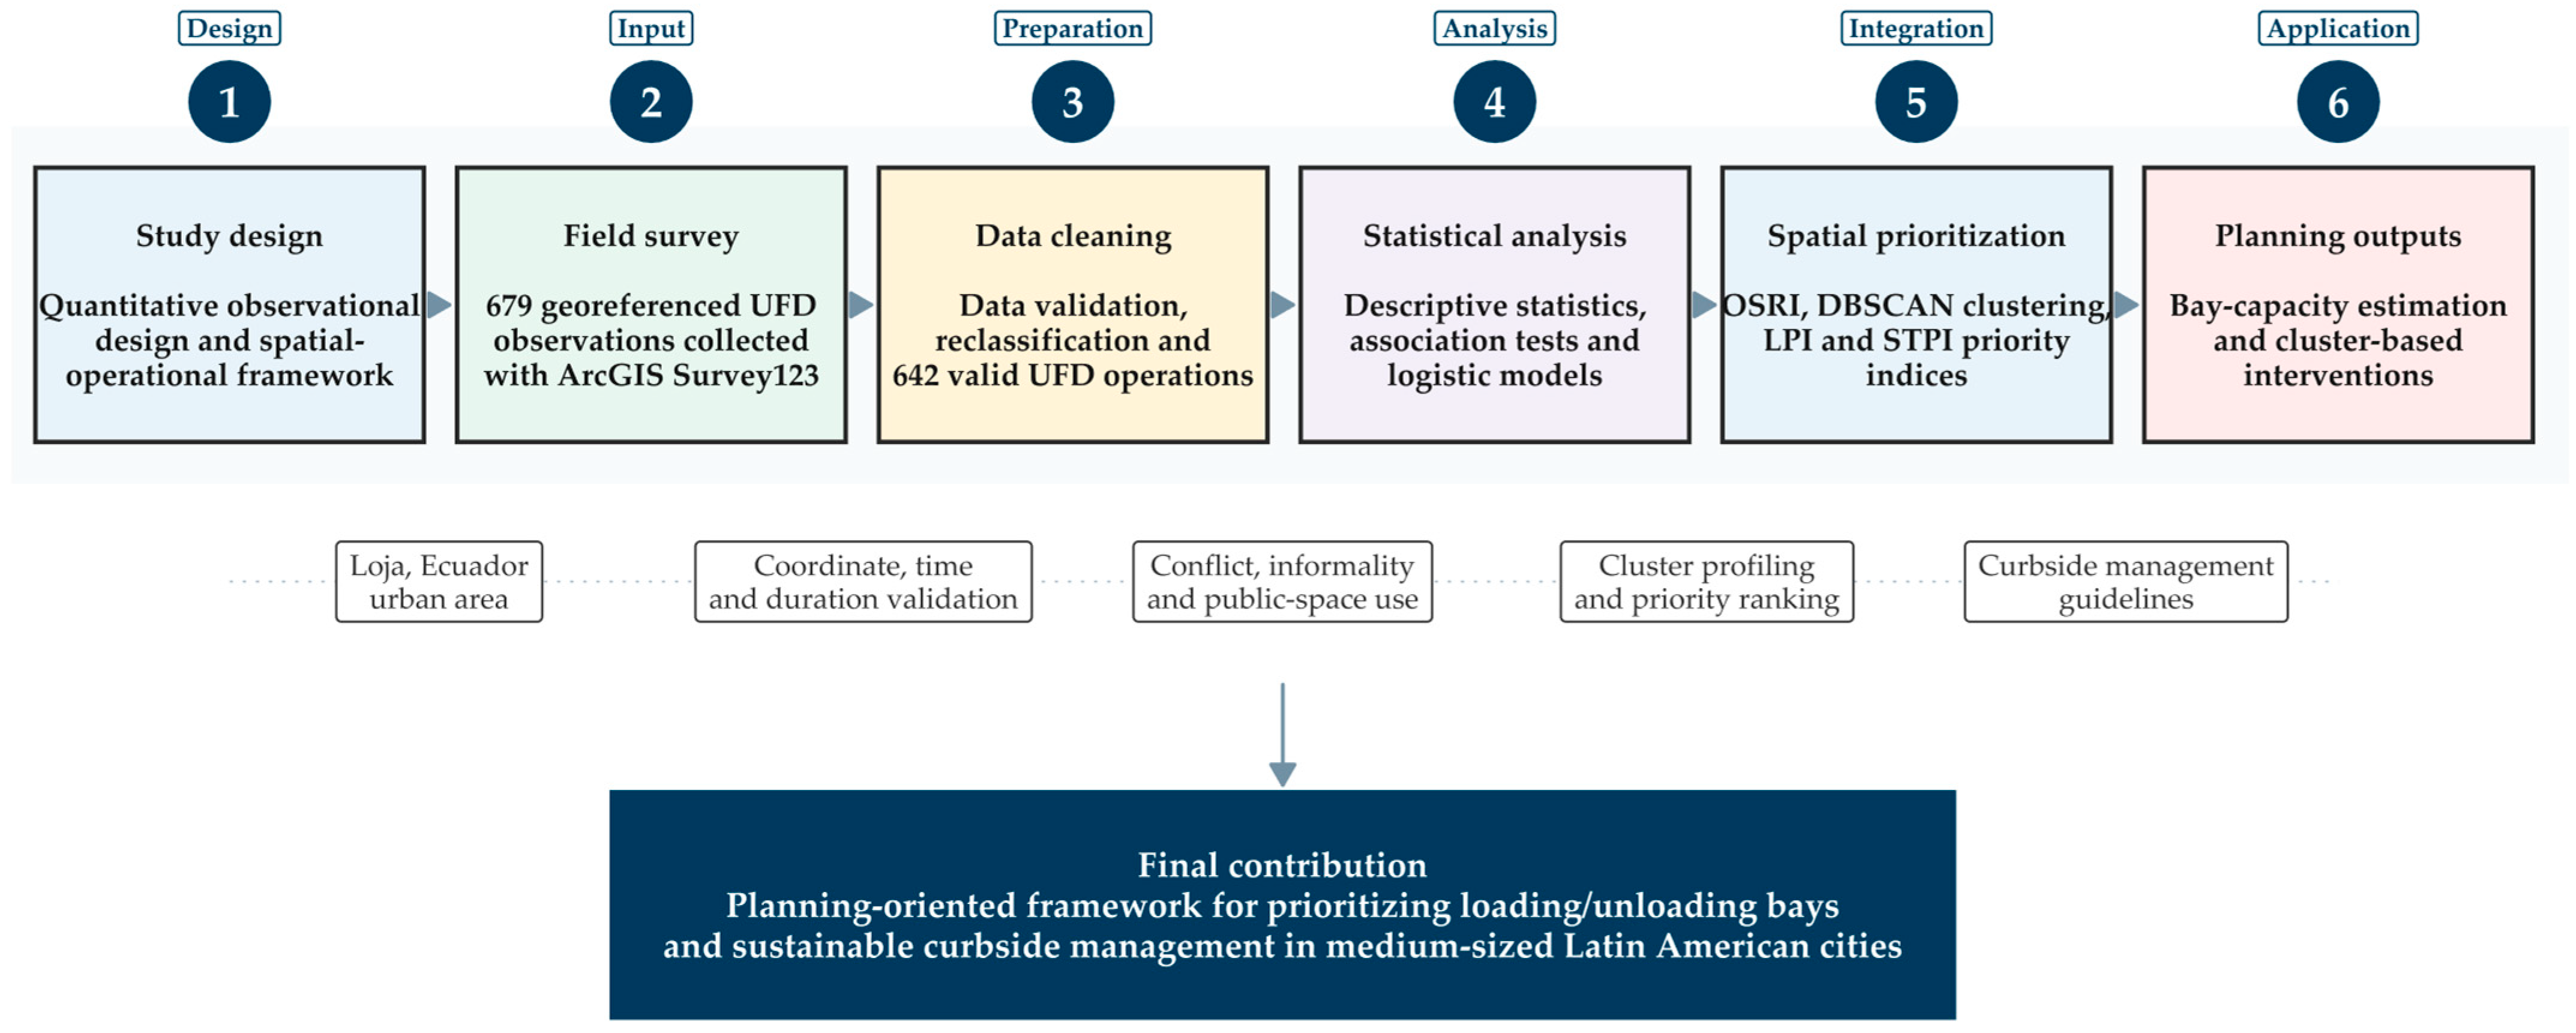
To improve the readability of the methodological sequence,
Figure 1 summarizes the research workflow followed in this study. The diagram shows the progression from the observational study design and georeferenced field data collection to data cleaning, statistical analysis, spatial prioritization, bay-capacity estimation, and cluster-based intervention scenarios.
2.2. Study Area
The study was conducted in the city of Loja, Ecuador, considered a medium-sized Latin American city due to its urban scale, monocentric structure, and concentration of commercial and service activities in its consolidated urban area. Loja was selected as a case study because of the presence of daily logistics dynamics associated with the supply of minimarkets, warehouses, retail stores, market areas, HORECA establishments, and other commercial activities, in a context where loading and unloading operations frequently compete for the use of road space and curbside areas.
The analysis area was delimited using an urban zone polygon as the spatial reference boundary. All georeferenced records were compared against this urban boundary to ensure that the operations included corresponded to the study area. For the spatial analysis, a geographic file in shapefile format containing the urban polygon of the city of Loja, Ecuador, was used. This layer made it possible to define the study area and filter the spatial observations considered in the analysis. Initially, the polygon was standardized to the WGS84 geographic coordinate system to facilitate cartographic visualization and ensure compatibility with the coordinates collected in the field. It was then reprojected to UTM Zone 17S in order to perform metric calculations of distance, proximity, and spatial clustering with greater precision.
2.3. Study Period
The data collection covered UFD operations observed between 15 May 2023 and 1 May 2026. The extended observation period was used to consolidate a broad field database of real loading and unloading operations under normal operating conditions, including weekdays, weekends, non-holiday periods, and different daily time windows. Field observations were intentionally distributed across morning, midday, afternoon, and evening periods in order to capture peak and off-peak freight activity, as well as operations associated with different establishment types and urban locations. No observations were intentionally collected during exceptional events, major holidays, or atypical disruptions that could substantially alter regular freight behavior.
For temporal processing, the variables used included operation date, start time, end time, decimal time, time slot, and time of day. The start time used for analysis was constructed robustly from three possible sources: the directly recorded time, the decimal time, and the time extracted from the datetime field. This decision sought to reduce temporal information loss and ensure greater consistency in the hourly classification of operations. Although the study period spans several years, the analysis treats the records as observed UFD operations under comparable urban conditions. Potential temporal changes in traffic regulation, construction works, land use, or delivery behavior are acknowledged as limitations and are not interpreted as longitudinal effects.
2.4. Sample Description
The initial database consisted of 679 records of urban freight distribution operations. After the data cleaning process, 37 records were removed, equivalent to 5.45% of the original database, because they presented invalid conditions or atypical durations. The final sample consisted of 642 valid records, equivalent to a retention rate of 94.55%. All records included in the final database had valid coordinates, operation date, valid start time, and valid duration.
The inclusion criteria were: records corresponding to freight loading or unloading operations within the urban area of Loja; availability of valid geographic coordinates; existence of operation start and end times; calculable operational duration; identification of vehicle type, type of goods, type of establishment or operational location, loading/unloading site, and disrupted activity; and final classification as a record suitable for analysis. The exclusion criteria were: records outside the urban spatial range, records without valid coordinates, records without start or end time, records with invalid or atypical duration, records with invalid photographic evidence, and records classified in the cleaning database as unsuitable for final analysis.
The sample was non-probabilistic and consisted of observations of real UFD operations recorded in the field. This approach is suitable for exploratory and applied urban logistics studies, where the main objective is not to estimate population parameters through strict probabilistic inference, but to characterize operational, spatial, and functional patterns of urban supply activities. To strengthen the analytical coverage of the sample, field observations included peak and off-peak periods, weekdays and weekends, different commercial environments, and several types of establishments, including minimarkets, warehouses, retail stores, market areas, HORECA establishments, and other commercial locations. Therefore, the sample provides a diverse empirical basis for identifying spatial-operational patterns, although it should not be interpreted as a probabilistic representation of the entire freight system of Loja.
2.5. Data Collection Instrument
The information was collected using a georeferenced digital survey designed in ArcGIS Survey123 to record urban freight distribution operations in the field. ArcGIS Survey123 is a form-based solution that allows users to create, share, collect, and analyze surveys through web or mobile devices, including validation and field data capture capabilities [
25]. The instrument made it possible to collect operational, temporal, spatial, and functional information for each observed operation. The form structure included fields for record identification, creation date, editing date, start time, end time, photograph of the activity, vehicle type, type of establishment served, type of goods transported, site used for loading or unloading, disrupted activity, geographic coordinates, operation date, start time, end time, duration, time slot, time of day, coordinate validation, temporal validation, duration validation, cleaning status, and final analysis status.
The main variables of the instrument were: vehicle type, with categories such as light truck, medium truck, heavy truck, pickup truck, van, motorcycle, and bicycle; type of establishment or operational location, including warehouses, minimarkets, supermarkets, retail stores, HORECA, pharmacies, households, offices, and others; type of goods, classified as perishable food, non-perishable food, inventory merchandise, and other goods; loading or unloading site, including paid parking areas, roadway, sidewalk, bus stop, no-parking zone, and others; and disrupted activity, with categories related to vehicular circulation, pedestrian movement, parking areas, absence of disruption, or other types of impact.
The instrument also made it possible to record geographic location through longitude and latitude, which allowed the database to be integrated into the spatial analysis. The incorporation of georeferenced data is relevant for UFD studies because loading and unloading operations are highly dependent on the immediate urban environment, curbside use, and the location of commercial establishments. In recent studies on urban logistics and freight transport, the integration of spatial and operational data has been used to identify critical operation zones and improve the planning of loading and unloading spaces [
9].
2.6. Application Procedure
The data collection procedure was based on direct observation and digital recording of loading and unloading operations carried out in the urban area of Loja. Each operation was recorded as an independent unit of analysis. During the observation, the start and end times of the operation, photograph, vehicle type, establishment or activity served, type of goods transported, site occupied to perform the operation, and the possible disruption generated on vehicular circulation, pedestrian movement, or other urban activities were recorded.
The duration of each operation was obtained from the difference between the end time and the start time. The coordinates made it possible to locate each operation within the urban system and subsequently filter the points located within the spatial boundary of analysis. When open-ended responses existed in “other” categories, they were retained during the cleaning phase and subsequently reclassified into homogeneous analytical categories.
The procedure was intended to capture real operating conditions rather than declarative scenarios. Therefore, the study was not limited to the perceptions of users or carriers but incorporated observational evidence of loading and unloading activities. This approach allows for a more precise description of the interaction between logistics operations, road space use, informality, and associated conflicts.
2.7. Data Cleaning, Processing, and Preparation
Data cleaning and preparation were carried out in R using a reproducible processing workflow. First, the original database was imported into Excel format, and column names were normalized to facilitate computational handling. Subsequently, a dictionary of original and cleaned column names was created and exported as a traceability record.
Temporal variables were processed using a safe date-time parsing function capable of recognizing multiple date-time formats and correcting decimal separators. Operation duration was converted to a numeric format, and geographic coordinates were transformed into numeric longitude and latitude values. Likewise, categorical variables underwent text cleaning, removal of underscores, standardization of spaces, conversion to lowercase, and removal of accents. In cases where the main response corresponded to “other”, the value was replaced by the corresponding open-ended response whenever available.
Categorical reclassification was performed using explicit rules based on text patterns. Vehicle type was grouped into analytical categories such as light truck, medium truck, heavy truck, pickup truck, van, motorcycle, taxi, light vehicle, bicycle/tricycle, handcart, or unspecified vehicle. Loading and unloading sites were reclassified as formal loading/unloading zones, paid parking zones, roadway, sidewalk, taxi zone, bus stop, private/off-street area, and other specific sites. Similarly, types of establishments, goods, and disrupted activity were reclassified. These rules were implemented in the main scripts to ensure consistency and reproducibility.
Derived variables were then constructed. The general conflict variable distinguished between operations without disruption and operations with some type of impact. Specific binary variables were created for vehicular conflict and pedestrian conflict. An operational formality variable was also generated, classifying operations as formal, semi-formal, informal, off-street, or other/undetermined, according to the loading and unloading site. Operations carried out on the roadway, sidewalk, taxi zone, or bus stop were classified as critical use of public space. In addition, proxy variables for motorization and low-emission vehicles were created, distinguishing motorized vehicles from non-motorized or manually operated means.
The operational sustainability risk index (OSRI) was constructed as a composite indicator through the weighted linear aggregation of six normalized variables. This index does not represent a direct measurement of CO
2 emissions or the total environmental impact of urban freight distribution; rather, it was defined as an operational proxy intended to synthesize conditions of urban pressure, conflict, informality, critical use of public space, operation duration, and motorization. For this reason, the OSRI should be interpreted more precisely as an operational sustainability risk/pressure proxy, rather than as a direct sustainability performance indicator. The construction of the index was based on methodological criteria proposed for composite indicators, which recommend defining a clear conceptual framework, selecting relevant variables, normalizing indicators, and establishing a transparent weighting scheme before final aggregation [
26]. In this study, the OSRI was formulated as follows:
where
represents the normalized operation duration index,
the level of general conflict,
observed informality,
critical use of public space,
the occurrence of operations during peak periods, and
motorized vehicle status. The assigned weights correspond to a transparent methodological decision of the study. Duration and conflict received the highest weights because they directly reflect curb occupation time and interference with other road users, which are two central dimensions of operational pressure in loading and unloading activities. Informality and critical use of public space were also weighted substantially because they capture the degree to which operations deviate from regulated curbside use and affect shared urban space. Peak-period operation and motorization were assigned lower weights because they act as aggravating conditions rather than the primary source of operational pressure. In this regard, the OSRI makes it possible to integrate multiple dimensions of urban logistics performance into a synthetic measure, useful for comparing zones, identifying critical areas, and guiding intervention scenarios for more sustainable urban freight distribution management. Nevertheless, because the weighting scheme was not calibrated through expert elicitation or a full global sensitivity analysis, the index is used as an exploratory prioritization tool. The stability of the OSRI, LPI, and STPI under alternative weighting schemes is therefore addressed as a limitation and proposed as a future methodological extension using global sensitivity analysis techniques. Recent applications in urban transport and urban design show that variance-based global sensitivity analysis can quantify both first-order effects and total-order interaction effects among explanatory variables, providing a useful framework for testing the robustness of prioritization models [
27,
28].
2.8. Statistical Analysis
The statistical and spatial analysis was performed in R 4.5.3, using RStudio 2026.01.1 Build 403 as the integrated development environment. A reproducible workflow was implemented and organized into six main components: descriptive analysis, inferential analysis, logistic modeling, spatial analysis, calculation of composite indicators, and estimation of loading and unloading bay capacity. The processing included the use of packages such as readxl, writexl, openxlsx, dplyr, tidyr, stringr, lubridate, janitor, ggplot2, scales, forcats, sf, dbscan, broom, rstatix, gt, webshot2, svglite, pROC, and MASS, among others.
The descriptive analysis included absolute frequencies and percentages for categorical variables, as well as mean, standard deviation, median, 25th, 75th, and 90th percentiles, and minimum and maximum values for continuous variables. The operational duration of loading and unloading activities was analyzed globally and stratified by vehicle type, operation site, day of the week, spatial cluster, and risk level. Likewise, the hourly distribution was obtained from the robust start time of each operation, completing the 0to 23 h series to avoid omissions in time slots without records and to ensure a continuous representation of the temporal behavior of urban freight distribution.
The inferential analysis considered chi-square tests to assess associations between categorical variables, such as vehicle type, loading and unloading site, operational formality, risk level, and conflict occurrence. As a complement, Cramer’s V was calculated to estimate the effect size of the identified associations. To compare differences in operation duration and operational risk among more than two groups, Kruskal–Wallis tests were applied, due to the asymmetric distribution of operational times and the presence of extreme values, which are frequent conditions in urban logistics operation studies.
Binary logistic regression models were estimated to explain the occurrence of general conflict and the classification of high operational sustainability risk. The models included operational predictors such as scaled duration, vehicle type, loading and unloading site, informality, time of day, and day of the week. The results were expressed through odds ratios, standard errors, z values,
p values, and 95% confidence intervals. The discriminatory performance of the models was evaluated using ROC curves and the area under the curve (AUC), using the pROC package, developed for the analysis and comparison of ROC curves in R [
29].
The logistic model for general conflict was interpreted as an exploratory explanatory model of operational conditions associated with conflict occurrence. In contrast, the logistic model for high operational sustainability risk was not treated as an independent validation of the OSRI, because some predictors are conceptually related to variables used in the construction of the index. This second model was included only as an exploratory consistency analysis to examine how operational variables behave in relation to the high-risk classification. Therefore, no causal interpretation or independent validation claim was derived from this model.
2.9. Spatial Analysis and DBSCAN Clusters
The spatial analysis was performed using the georeferenced points of UFD operations. First, records with valid coordinates were transformed into spatial objects with the WGS84 reference system. A spatial filter was then applied to retain only observations located within the urban boundary of Loja. For distance and spatial clustering calculations, the geometries were transformed to UTM Zone 17S, a metric system suitable for measurements in meters in the Ecuadorian context.
Spatial concentrations were identified using the DBSCAN algorithm, with a neighborhood radius of 75 m and a minimum of five points. This technique was selected because it identifies dense point clusters without requiring a predefined geometric shape for the clusters, and also classifies as noise those points that do not meet the minimum density threshold. This feature is especially useful in urban environments, where loading and unloading operations may form irregular concentrations around commercial corridors, intersections, or economic activity zones. DBSCAN was originally proposed as a density-based algorithm for discovering clusters of arbitrary shape in spatial databases with noise [
30].
The selection of the 75 m radius was based on a previous spatial sensitivity analysis using alternative radii of 50, 75, 100, and 150 m. The 75 m radius was adopted as the main scale of analysis because it provided a balance between excessive fragmentation at smaller radii and excessive aggregation at larger radii. At 50 m, clusters tended to be more fragmented, and a higher number of points remained classified as spatial noise, reducing their usefulness for defining practical intervention areas. At 100 m and 150 m, nearby concentrations tended to merge, which reduced spatial specificity for locating loading and unloading interventions. The 75 m radius therefore offered an intermediate scale that preserved operationally distinguishable clusters while maintaining sufficient spatial continuity for planning purposes. Recent studies on urban mobility and freight transport have used spatial clustering approaches to identify logistics demand zones, stopping points, or critical operation areas, supporting their application in UFD analysis [
16].
For each cluster, operational and spatial indicators were calculated: total number of operations, mean duration, median, P75 and P90, general conflict rate, vehicular conflict rate, pedestrian conflict rate, informality rate, critical public space use rate, motorization rate, low-emission vehicle rate, mean sustainability risk, dominant vehicle, and dominant site and goods. These indicators made it possible to build a comparative profile of the clusters and served as the basis for the logistics pressure and sustainable transport priority indices.
2.10. Methodological Construction of the Logistics Pressure and Sustainable Transport Priority Indices
At the cluster level, two composite indicators developed for this study were constructed: the logistics pressure index (LPI) and the sustainable transport priority index (STPI). These indices were designed to synthesize, on a common scale, the operational, spatial, and sustainability-related conditions associated with urban freight distribution. Demand was represented by the average daily number of operations observed per cluster, rather than by the total accumulated number of operations over the entire survey period. This methodological decision made it possible to avoid infrastructure oversizing and to represent a more realistic average daily operating condition.
The logistics pressure index was calculated through weighted linear aggregation of normalized variables, according to the following expression:
where
represents the normalized index of average daily operations,
the general conflict rate,
the vehicular conflict rate,
the pedestrian conflict rate,
the normalized P75 duration index, and
the informality rate.
The sustainable transport priority index was calculated using the same weighted linear aggregation approach, additionally incorporating mean operational sustainability risk as a specific prioritization dimension:
where
represents the normalized mean operational sustainability risk index. The values of both indices were normalized between 0 and 1. Subsequently, clusters were classified into low, medium, high, or very high priority levels according to the value of the sustainable transport priority index. The construction of these integrated indicators is consistent with composite indicator and multicriteria analysis approaches applied to the sustainability of urban freight transport, in which variable selection must respond to criteria of relevance, data availability, comprehensibility, feasibility, and usefulness for planning. In particular, Ayadi et al. [
16] support the need to select multidimensional indicators to assess the sustainability of urban freight transport, while the OECD and JRC provide the methodological basis for the normalization, weighting, and aggregation of composite indicators [
26].
Because the LPI and STPI were constructed for planning-oriented prioritization, their weights were defined according to the operational relevance of each variable and the availability of field data. However, the study recognizes that alternative weighting schemes may modify the magnitude of the index values and, potentially, the ranking of clusters. Therefore, the indices should be interpreted as transparent prioritization tools rather than definitive measures of sustainability performance. Future work should apply global sensitivity analysis to test the robustness of priority rankings under alternative weighting schemes and model assumptions, following recent applications of variance-based sensitivity analysis in urban planning and transport modeling [
27,
28].
2.11. Methodological Approach for Estimating Loading and Unloading Bay Capacity
The estimation of bay capacity was performed using an operational model based on the average daily number of operations observed per cluster. For each cluster, the total number of observed operations, the number of days with valid records, and the average daily number of operations were first calculated:
where
is the average daily number of operations in cluster
,
is the total number of observed operations in the cluster, and
is the number of observed days with valid records. This approach is based on the operational principle that the capacity of loading and unloading infrastructure depends on the relationship between operational demand, the occupation or service time of each operation, and the time window available to serve them, a criterion used in recent studies on the location, sizing, and management of urban loading/unloading spaces [
8,
9].
The required number of bays was then estimated under different duration criteria:
where
represents the number of bays required for cluster
, under duration criterion
and scenario
;
corresponds to the mean, median, P75, or P90 duration of operations in the cluster;
is the daily operating window considered, set at 240 min; and
is the productivity factor of the scenario. The 240 min window was defined as a planning assumption representing a four-hour effective period of concentrated loading and unloading activity within the observed daytime freight operation patterns. This assumption does not imply that freight activity occurs only during four hours per day; rather, it defines a standardized effective service window for comparing bay requirements across clusters and weekdays. The choice is consistent with curbside management practices that regulate loading zones through time restrictions and maximum dwell times, commonly around 30 min for commercial loading or short-term loading spaces, as reported in loading zone studies and curb management guidance [
31,
32]. Therefore, assuming a 240 min effective window is equivalent to evaluating a controlled operating period capable of accommodating several sequential loading/unloading cycles per bay under regulated dwell-time conditions. The use of a fixed operating window allows the model to translate observed average daily demand and service duration into comparable infrastructure requirements, while recognizing that the final operating schedule should be adjusted according to local regulations, enforcement capacity, and observed peak-period demand.
Three productivity scenarios were defined to account for uncertainty in bay use, turnover, enforcement, and operational inefficiencies: baseline, with , representing full theoretical availability of the service window; operational, with , representing moderate losses due to maneuvering, access friction, imperfect turnover, and short periods of non-availability; and conservative, with , representing stronger inefficiencies associated with weak enforcement, unauthorized occupation, longer maneuvering times, or irregular use of the curbside space. The ceiling function was applied to ensure that the estimated number of bays covered the average daily demand under each operating condition.
The estimation of loading and unloading bays is consistent with the literature on loading/unloading zones, which recognizes these areas as a frequent solution for improving the sustainability of urban freight transport and reducing problems associated with the lack of adequate infrastructure. In particular, studies on unloading zones have noted that an insufficient number of available spaces may affect operational efficiency and curbside management [
9]. Consequently, the equation used in this study should be understood as a study-specific operational formulation, adapted to the empirical context of Loja and intended for preliminary planning. It does not replace detailed curbside engineering design because it does not explicitly model queuing, real-time peak accumulation, vehicle size heterogeneity, exact curb supply, walking distance to establishments, or enforcement behavior. These aspects should be incorporated in future implementation studies before final infrastructure deployment.
2.12. Spatial Intervention Scenarios
Based on the sustainable transport priority index, the logistics pressure index, bay requirements, conflict rates, informality, and critical use of public space, spatial intervention scenarios were constructed. For each cluster, the main operational problem was identified using a decision rule based on the comparison between vehicular conflict, pedestrian conflict, and informality. When vehicular conflict was dominant, the problem was classified as traffic interference; when pedestrian conflict was predominant, it was classified as pedestrian safety exposure; and when informality was higher than the other indicators, it was classified as informal curbside operation.
Based on this classification, differentiated intervention strategies were assigned: bay allocation and operational regulation, formalization of bays and curbside control, pedestrian protection measures, time-window management, signage, monitoring, and periodic review. Finally, planning relevance was classified as immediate intervention, short-term intervention, medium-term intervention, or monitoring priority. This approach makes it possible to translate spatial and operational indicators into urban planning criteria applicable to UFD management.
2.13. Ethical Considerations
The study was conducted in accordance with the principles of the Declaration of Helsinki and the Ecuadorian Organic Law on Personal Data Protection, ensuring participant anonymity and the exclusive use of aggregated data. Under the standardized procedures of the Human Research Ethics Committee of the Universidad Técnica Particular de Loja (CEISH-UTPL), ethical review and approval were waived for this study, as it was classified as “research without risk” due to its observational, anonymous, and non-invasive nature. Consequently, when interaction with participants or establishment representatives occurred, informed consent was obtained prior to data collection, emphasizing the voluntary, confidential, and academic nature of participation. The records were processed without personally identifiable information, and the results are presented only in aggregated form.
Additionally, the authors declare that generative artificial intelligence tools were used solely to support the improvement of wording, clarity, coherence, and linguistic review of some sections of the manuscript. These tools were not used to generate data, modify results, perform statistical analyses, or replace the academic interpretation of the authors. Full responsibility for the final content, methodological procedures, analyses performed, and conclusions of the study rests entirely with the authors.
3. Results
3.1. Data Cleaning and Analytical Sample Construction
The initial database consisted of 679 records of urban freight distribution operations observed within the urban area of Loja. After the data cleaning process, 37 records were removed, equivalent to 5.45% of the original database, due to invalidity criteria or atypical durations. Consequently, the final sample used for analysis consisted of 642 valid records, representing a retention rate of 94.55%.
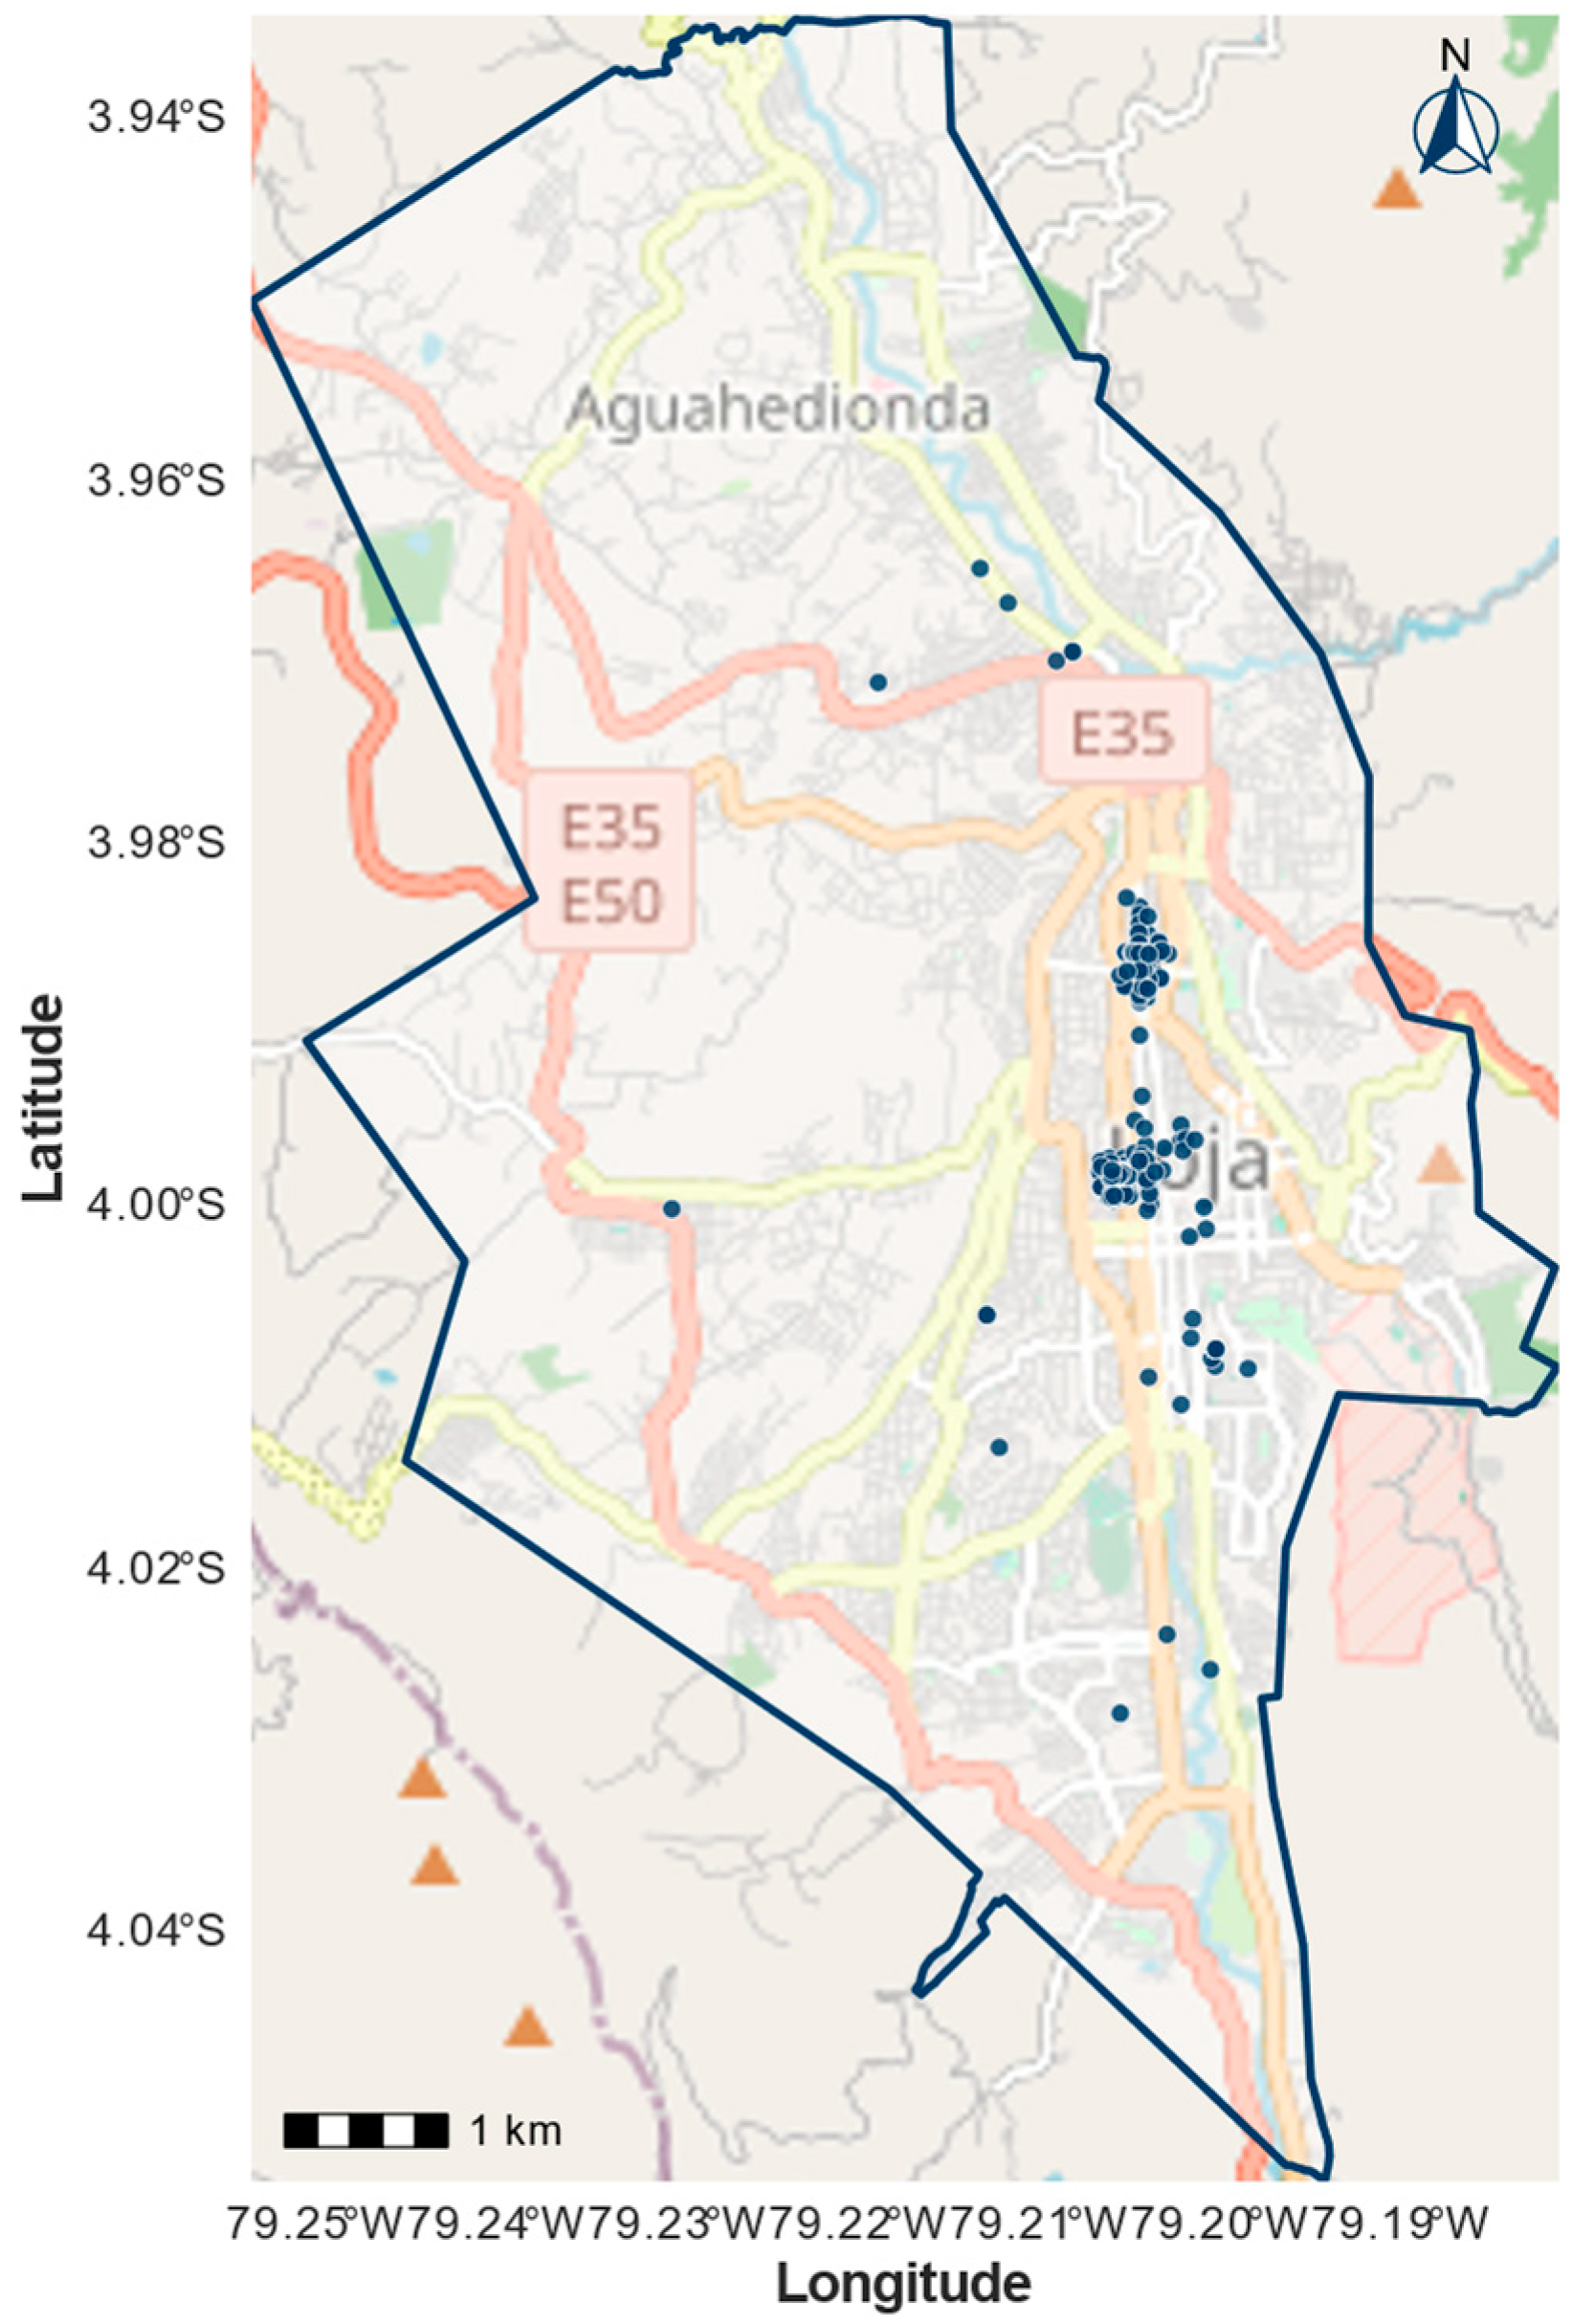
All 642 final records had valid coordinates, valid start time, valid duration, and valid operation date. Spatial validation confirmed that all georeferenced points were located within the urban boundary used for the study. In the spatial analysis, 608 points were assigned to clusters using DBSCAN with a 75 m radius, while 34 points were classified as spatial noise.
The general distribution of survey points within the urban area is presented in
Figure 2, which shows the spatial location of the recorded operations in relation to the urban boundary of Loja.
3.2. Operational Characterization of Loading and Unloading Activities
The average duration of loading and unloading operations was 31.41 min, with a standard deviation of 32.23 min. The median was 19.20 min, while the 75th percentile reached 44.75 min and the 90th percentile reached 80.92 min. These values indicate a distribution combining short-duration operations with a group of activities involving longer occupation times.
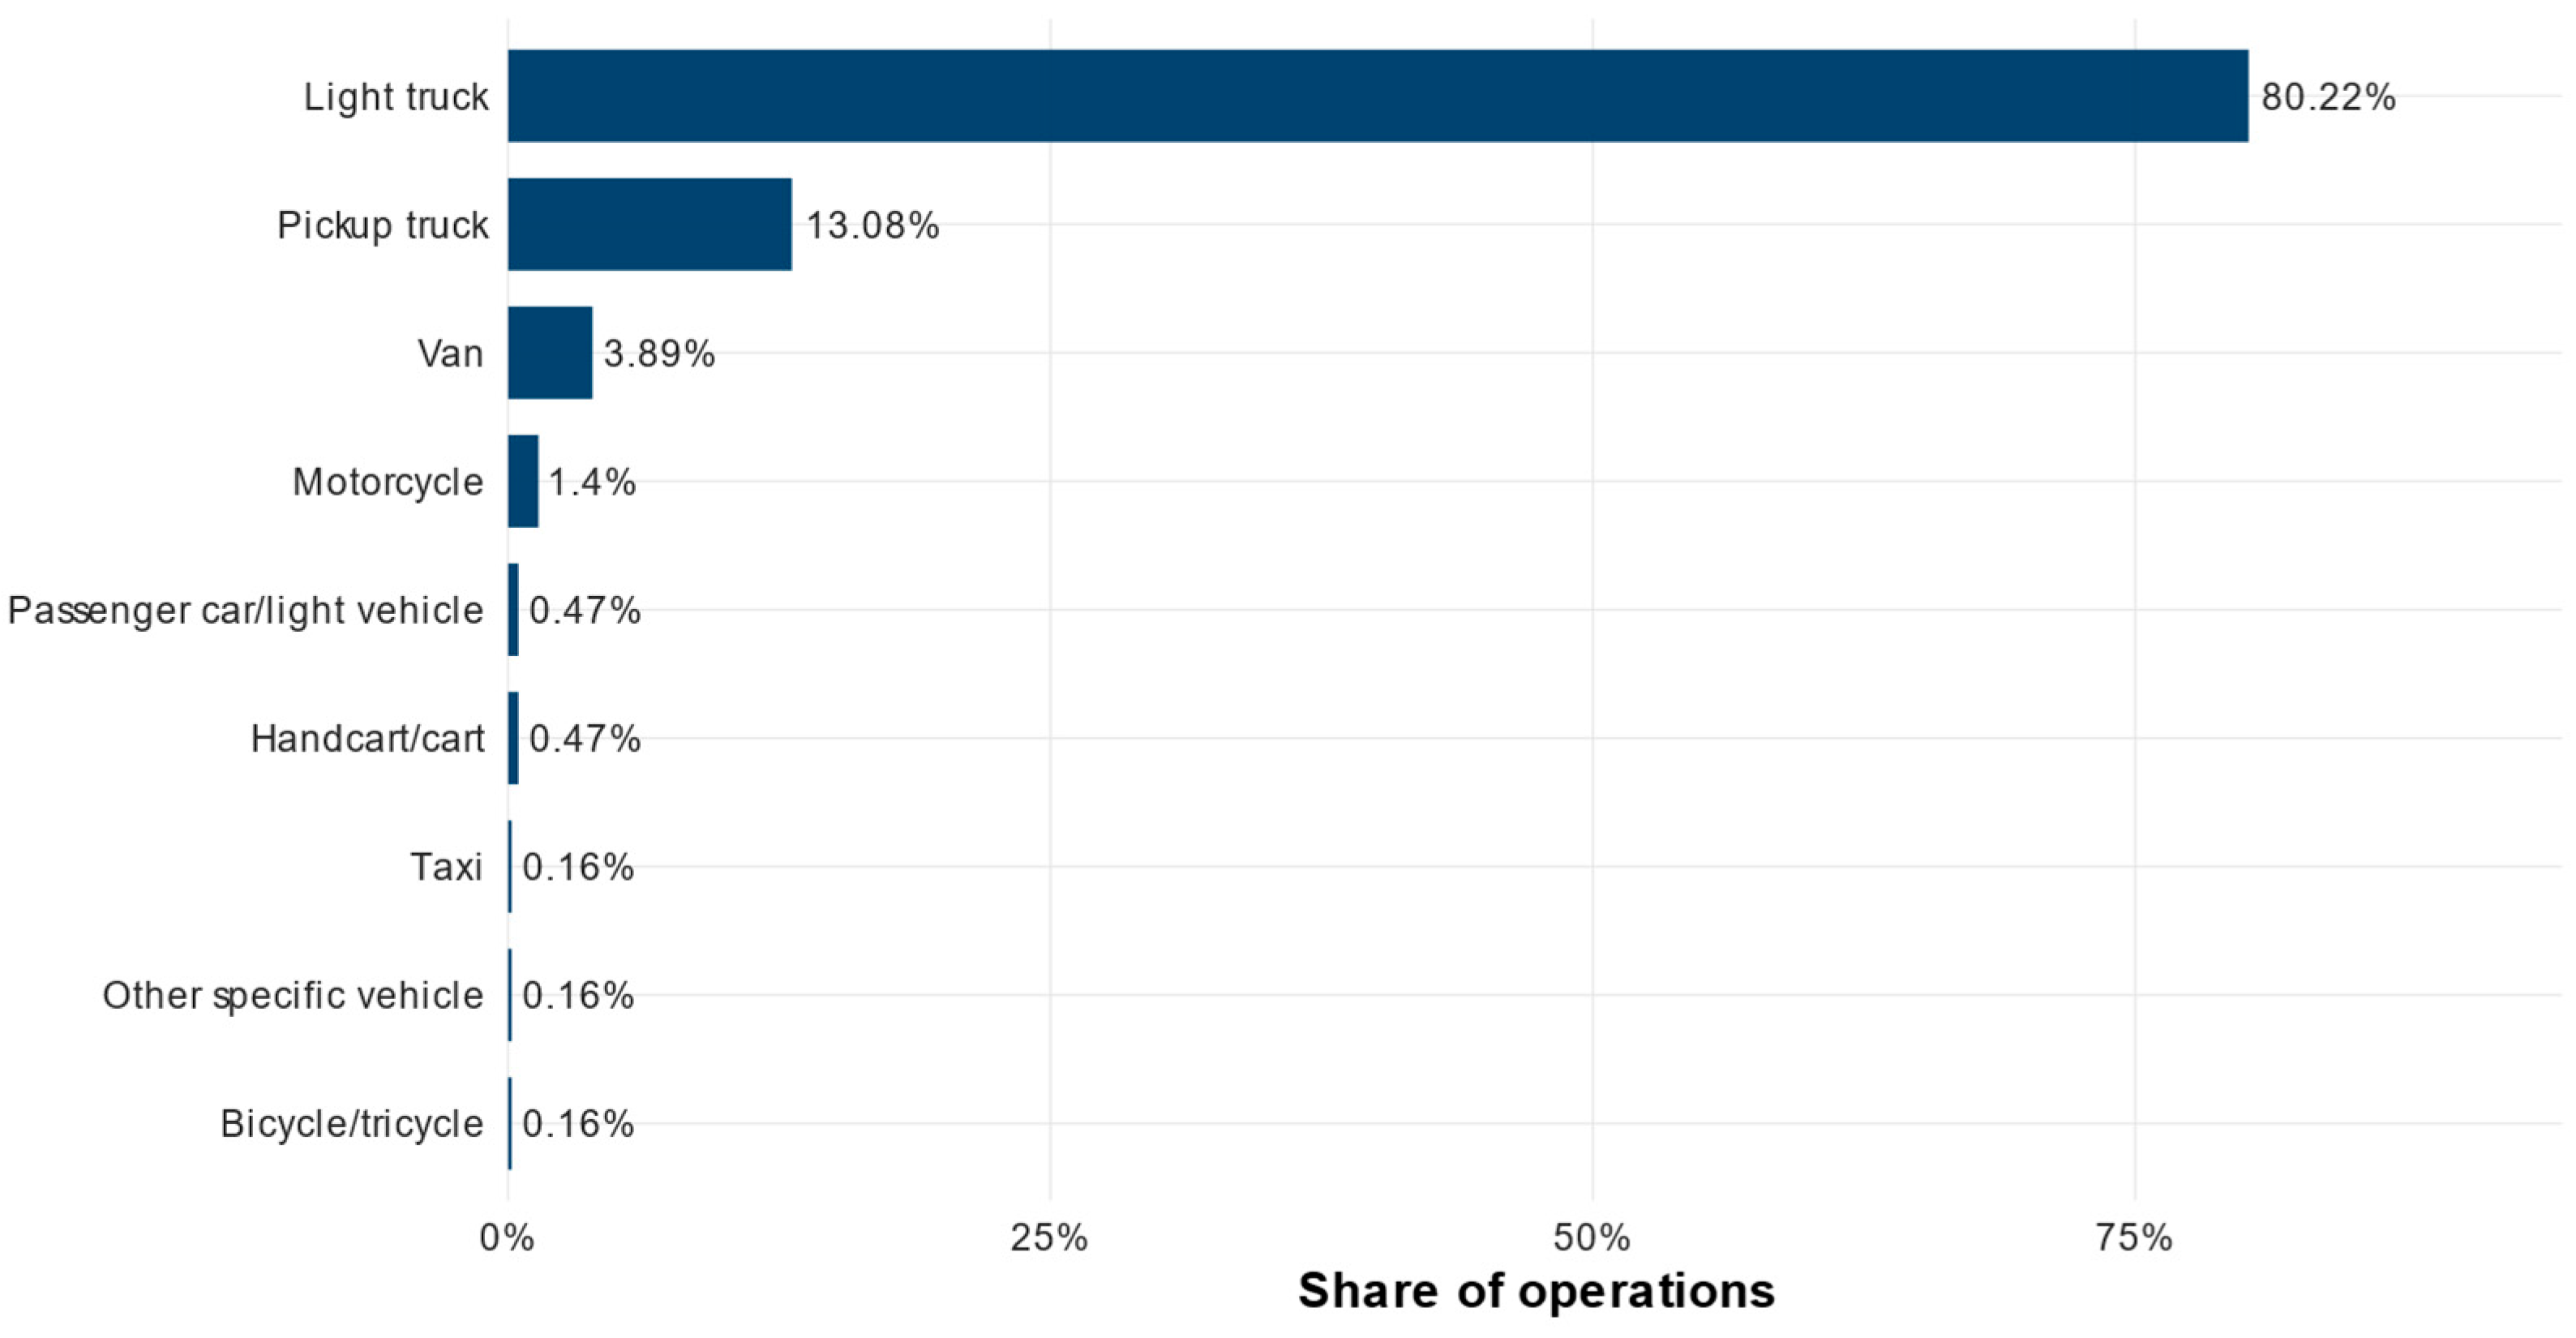
Regarding vehicle type, the predominant category was light truck, with 515 records, equivalent to 80.22% of the total. This was followed by pickup trucks, with 84 records and a share of 13.08%. Vans represented 3.89%, while motorcycles accounted for 1.40%. The remaining categories presented shares below 1%.
Figure 3 shows the distribution of vehicle types used in the observed operations, highlighting the high concentration of activities carried out by light trucks.
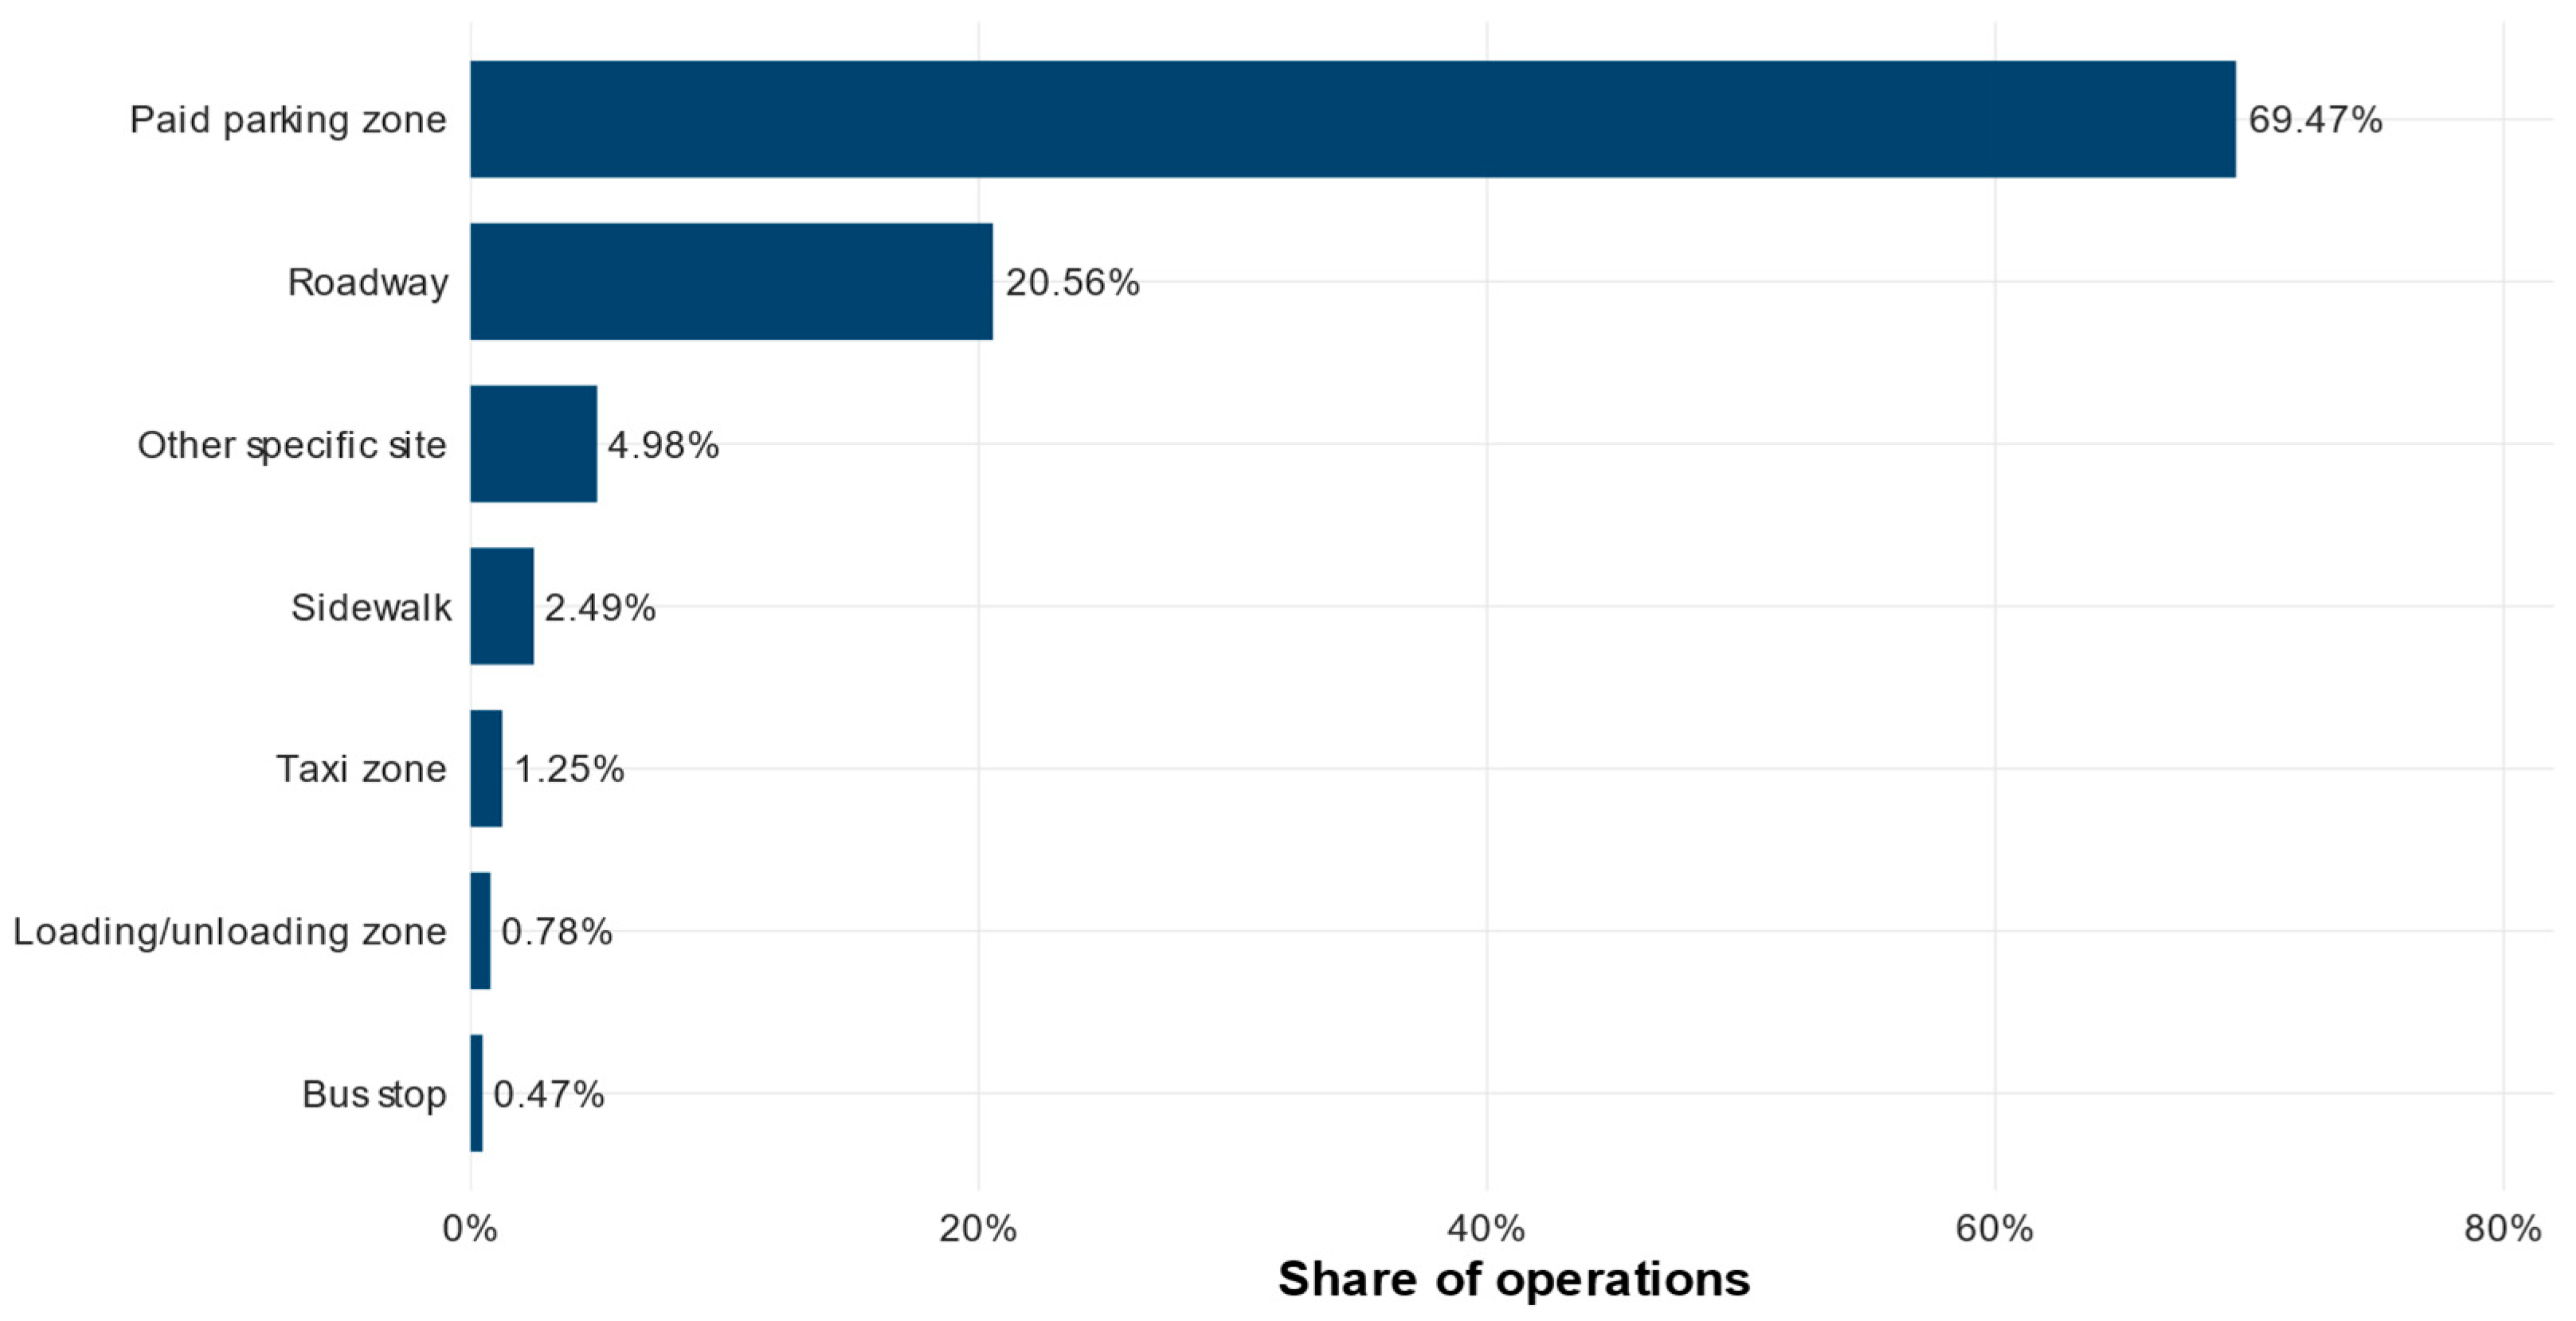
With respect to the site where operations were carried out, the most frequent category was paid or metered parking zones, with 446 records, equivalent to 69.47% of the total. Operations carried out directly on the roadway represented 20.56%, while other specific sites accounted for 4.98%. Sidewalks represented 2.49%, taxi zones 1.25%, formal loading and unloading zones 0.78%, and bus stops 0.47%.
The graphical distribution of loading and unloading sites is presented in
Figure 4, where the predominance of operations carried out in paid parking zones can be observed, followed by roadway operations.
Regarding the type of establishment served, as shown in
Table 1, operations were mainly concentrated in minimarkets, with 238 records, equivalent to 37.07%. Warehouses represented 29.13%, retail stores 19.00%, other commercial establishments 7.01%, market areas 5.92%, HORECA establishments 1.56%, and unspecified cases 0.31%.
Regarding the type of goods transported, as shown in
Table 2, perishable food products were predominant, with 445 records, equivalent to 69.31% of the total. General merchandise represented 27.10%, while other goods accounted for 2.80%. Beverages, hardware/construction goods, and unspecified goods presented shares below 1%.
3.3. Temporal Distribution of Operations
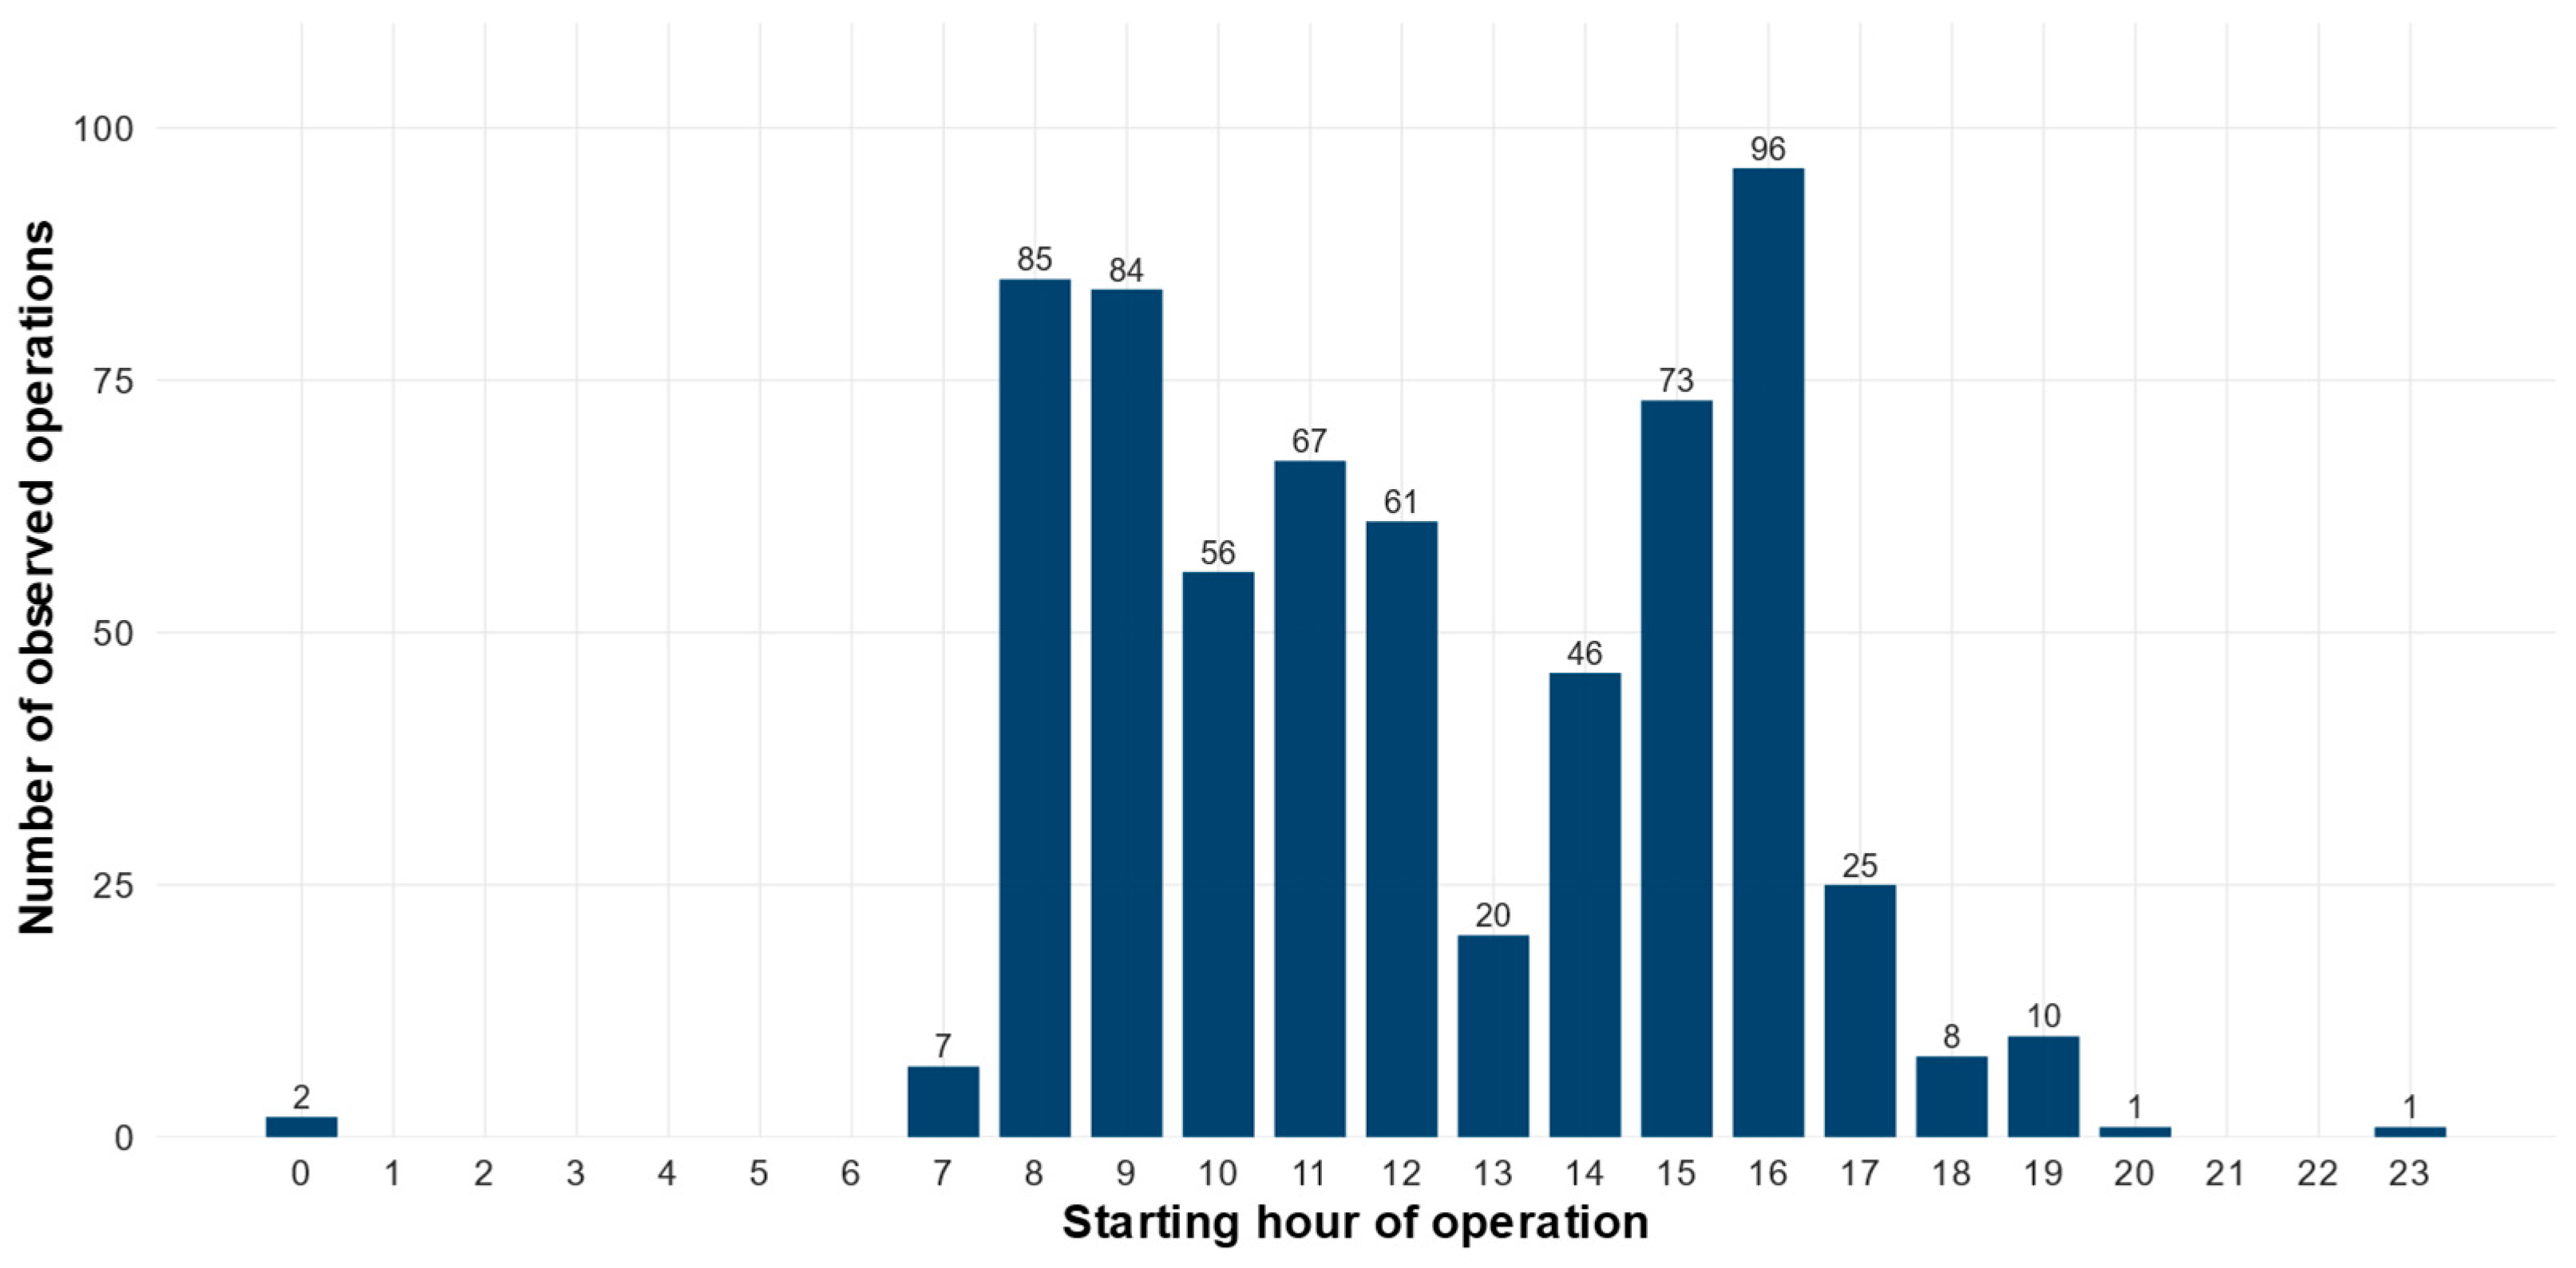
The hourly distribution of operations showed a higher concentration during the morning and afternoon. The hour with the highest number of records was 16:00, with 96 operations, equivalent to 14.95% of the total. Relevant concentrations were also observed at 8:00, with 85 operations, and at 9:00, with 84 operations. The period between 8:00 and 16:00 accumulated most of the recorded activities. The hourly distribution is presented graphically in
Figure 5, which identifies the concentration of operations during daytime hours and the maximum value recorded at 16:00.
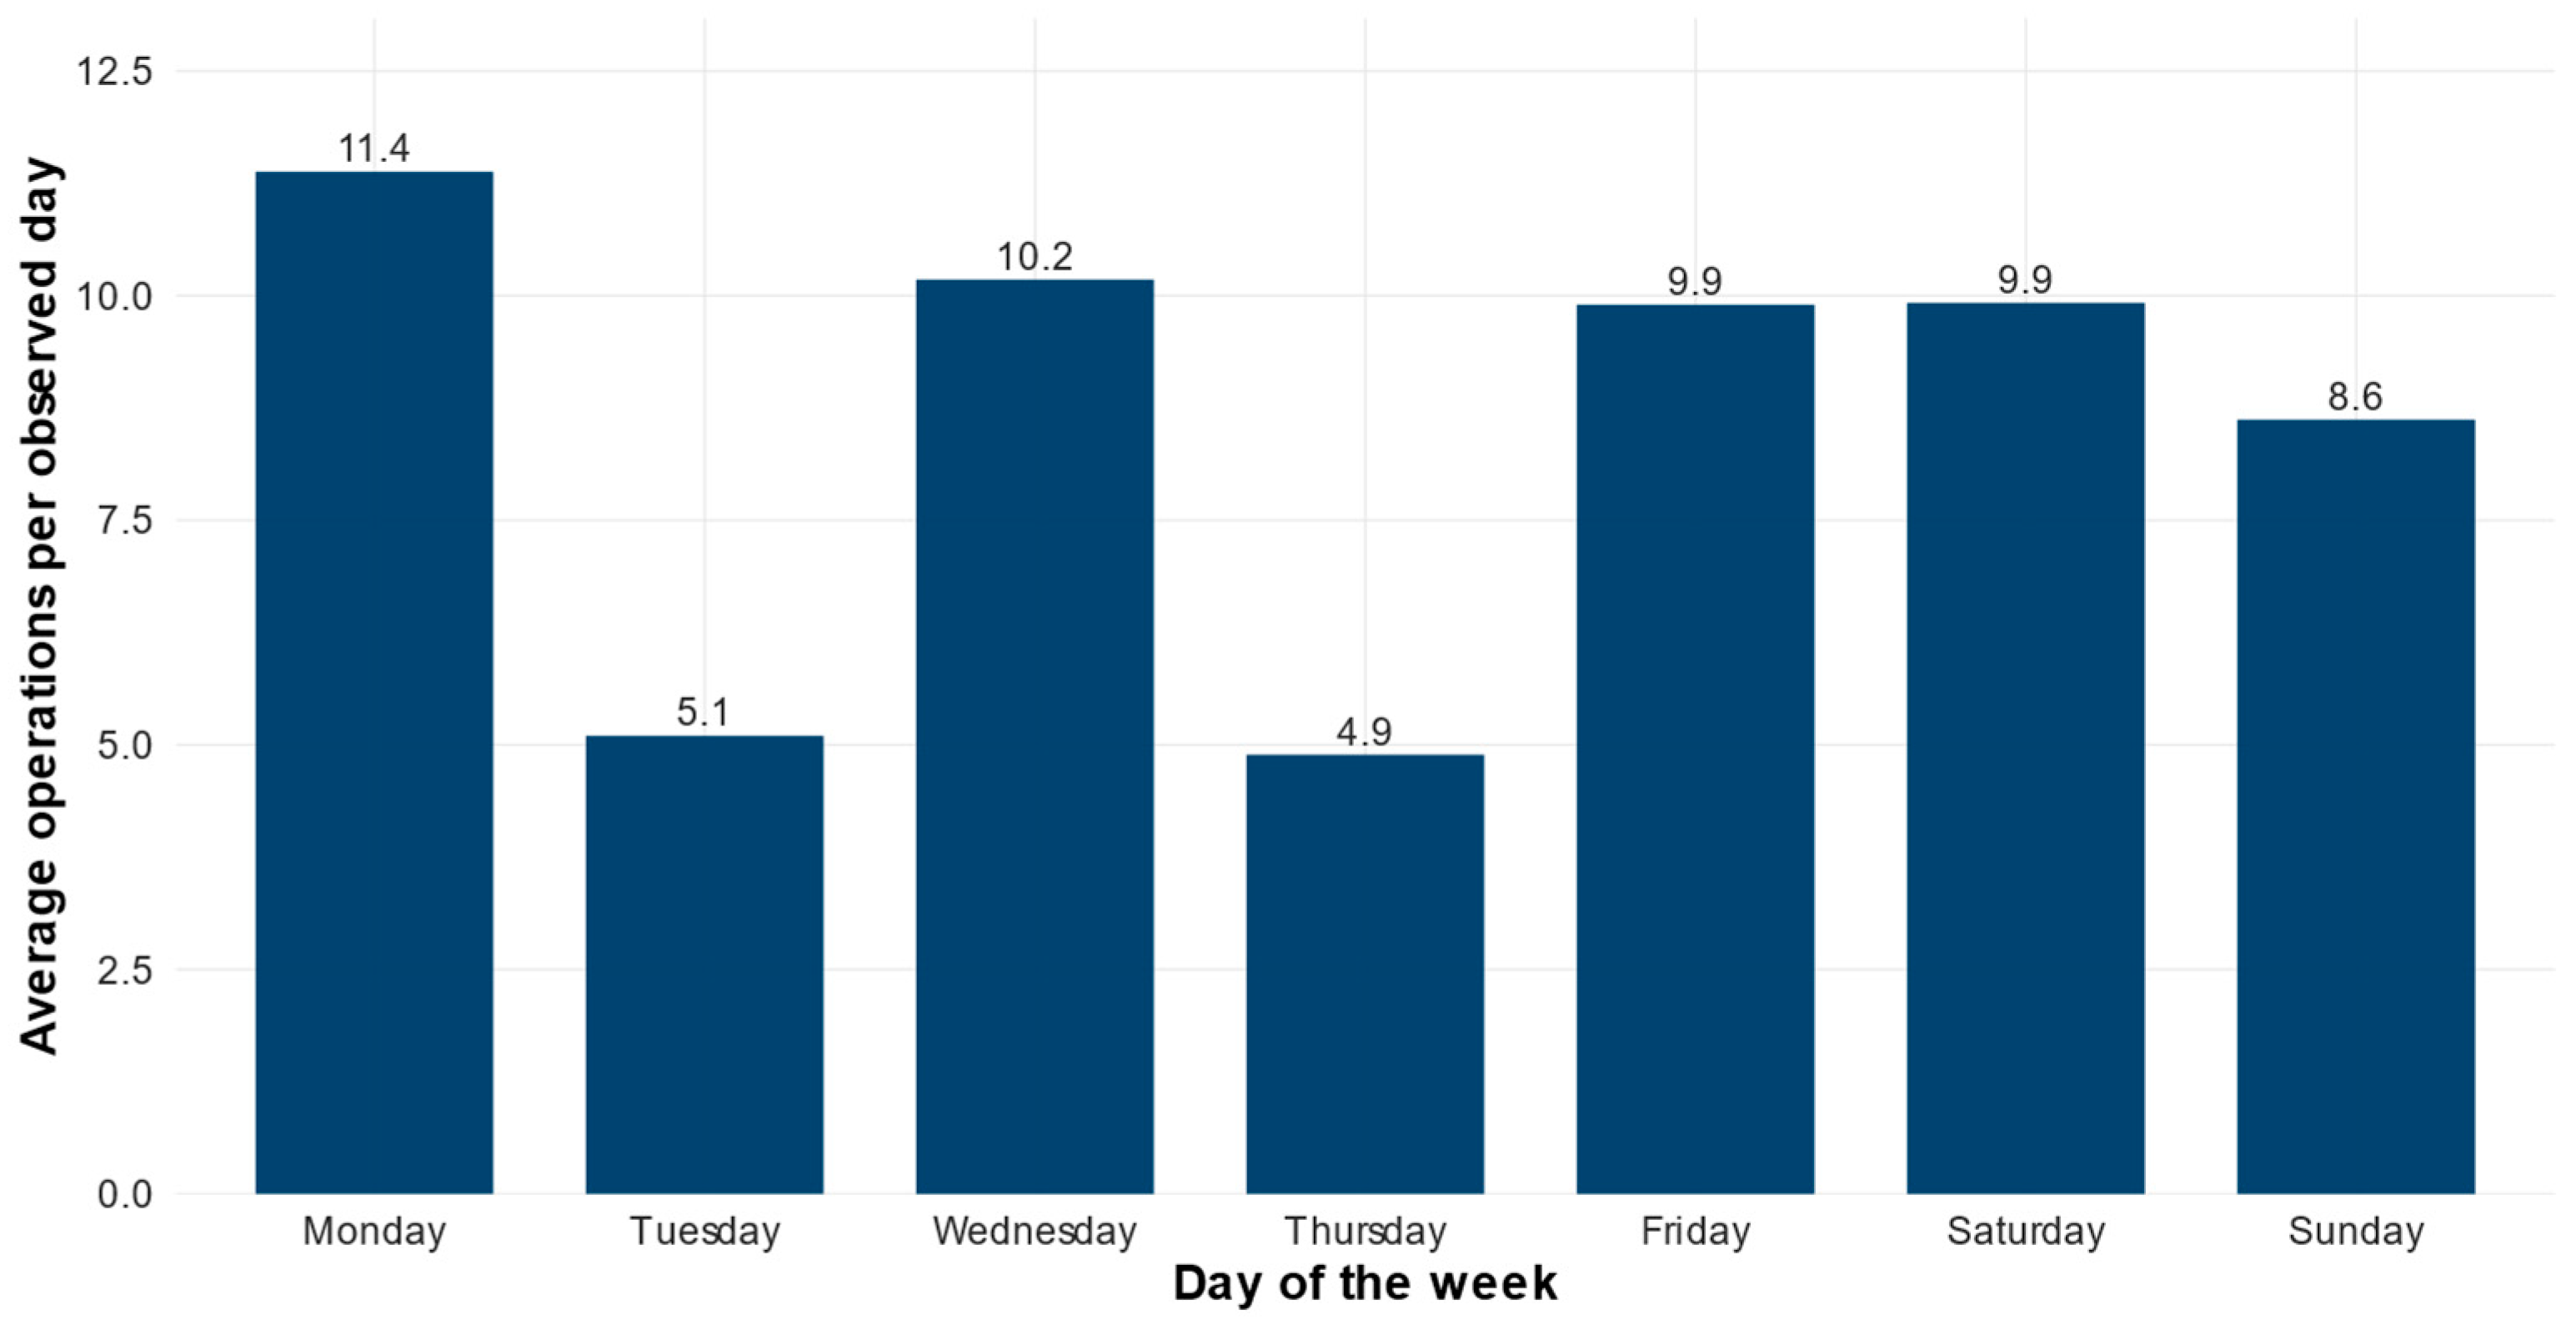
The weekday analysis showed that Monday presented the highest total number of operations, with 148 records, and also the highest average number of operations per observed day, with 11.38 operations/day. This was followed by Wednesday, with 112 operations and 10.18 operations/day, and Saturday, with 119 operations and 9.92 operations/day. Thursday recorded the lowest total volume, with 44 operations.
The variation in the average number of operations per observed day is presented in
Figure 6, which summarizes the relative activity intensity for each day of the week.
3.4. Operational Conflicts, Informality, and Use of Public Space
Table 3 indicates that 83.62% of operations presented some type of conflict or disruption. When disaggregated by type of impact, vehicular conflicts represented 22.62%, and pedestrian conflicts also represented 22.62%. In the detailed classification, conflicts classified as “other” represented 38.32%, followed by pedestrian and vehicular conflicts, both with 22.59%. Operations without conflict represented 16.36%.
The joint analysis between the operation site and conflict is presented in
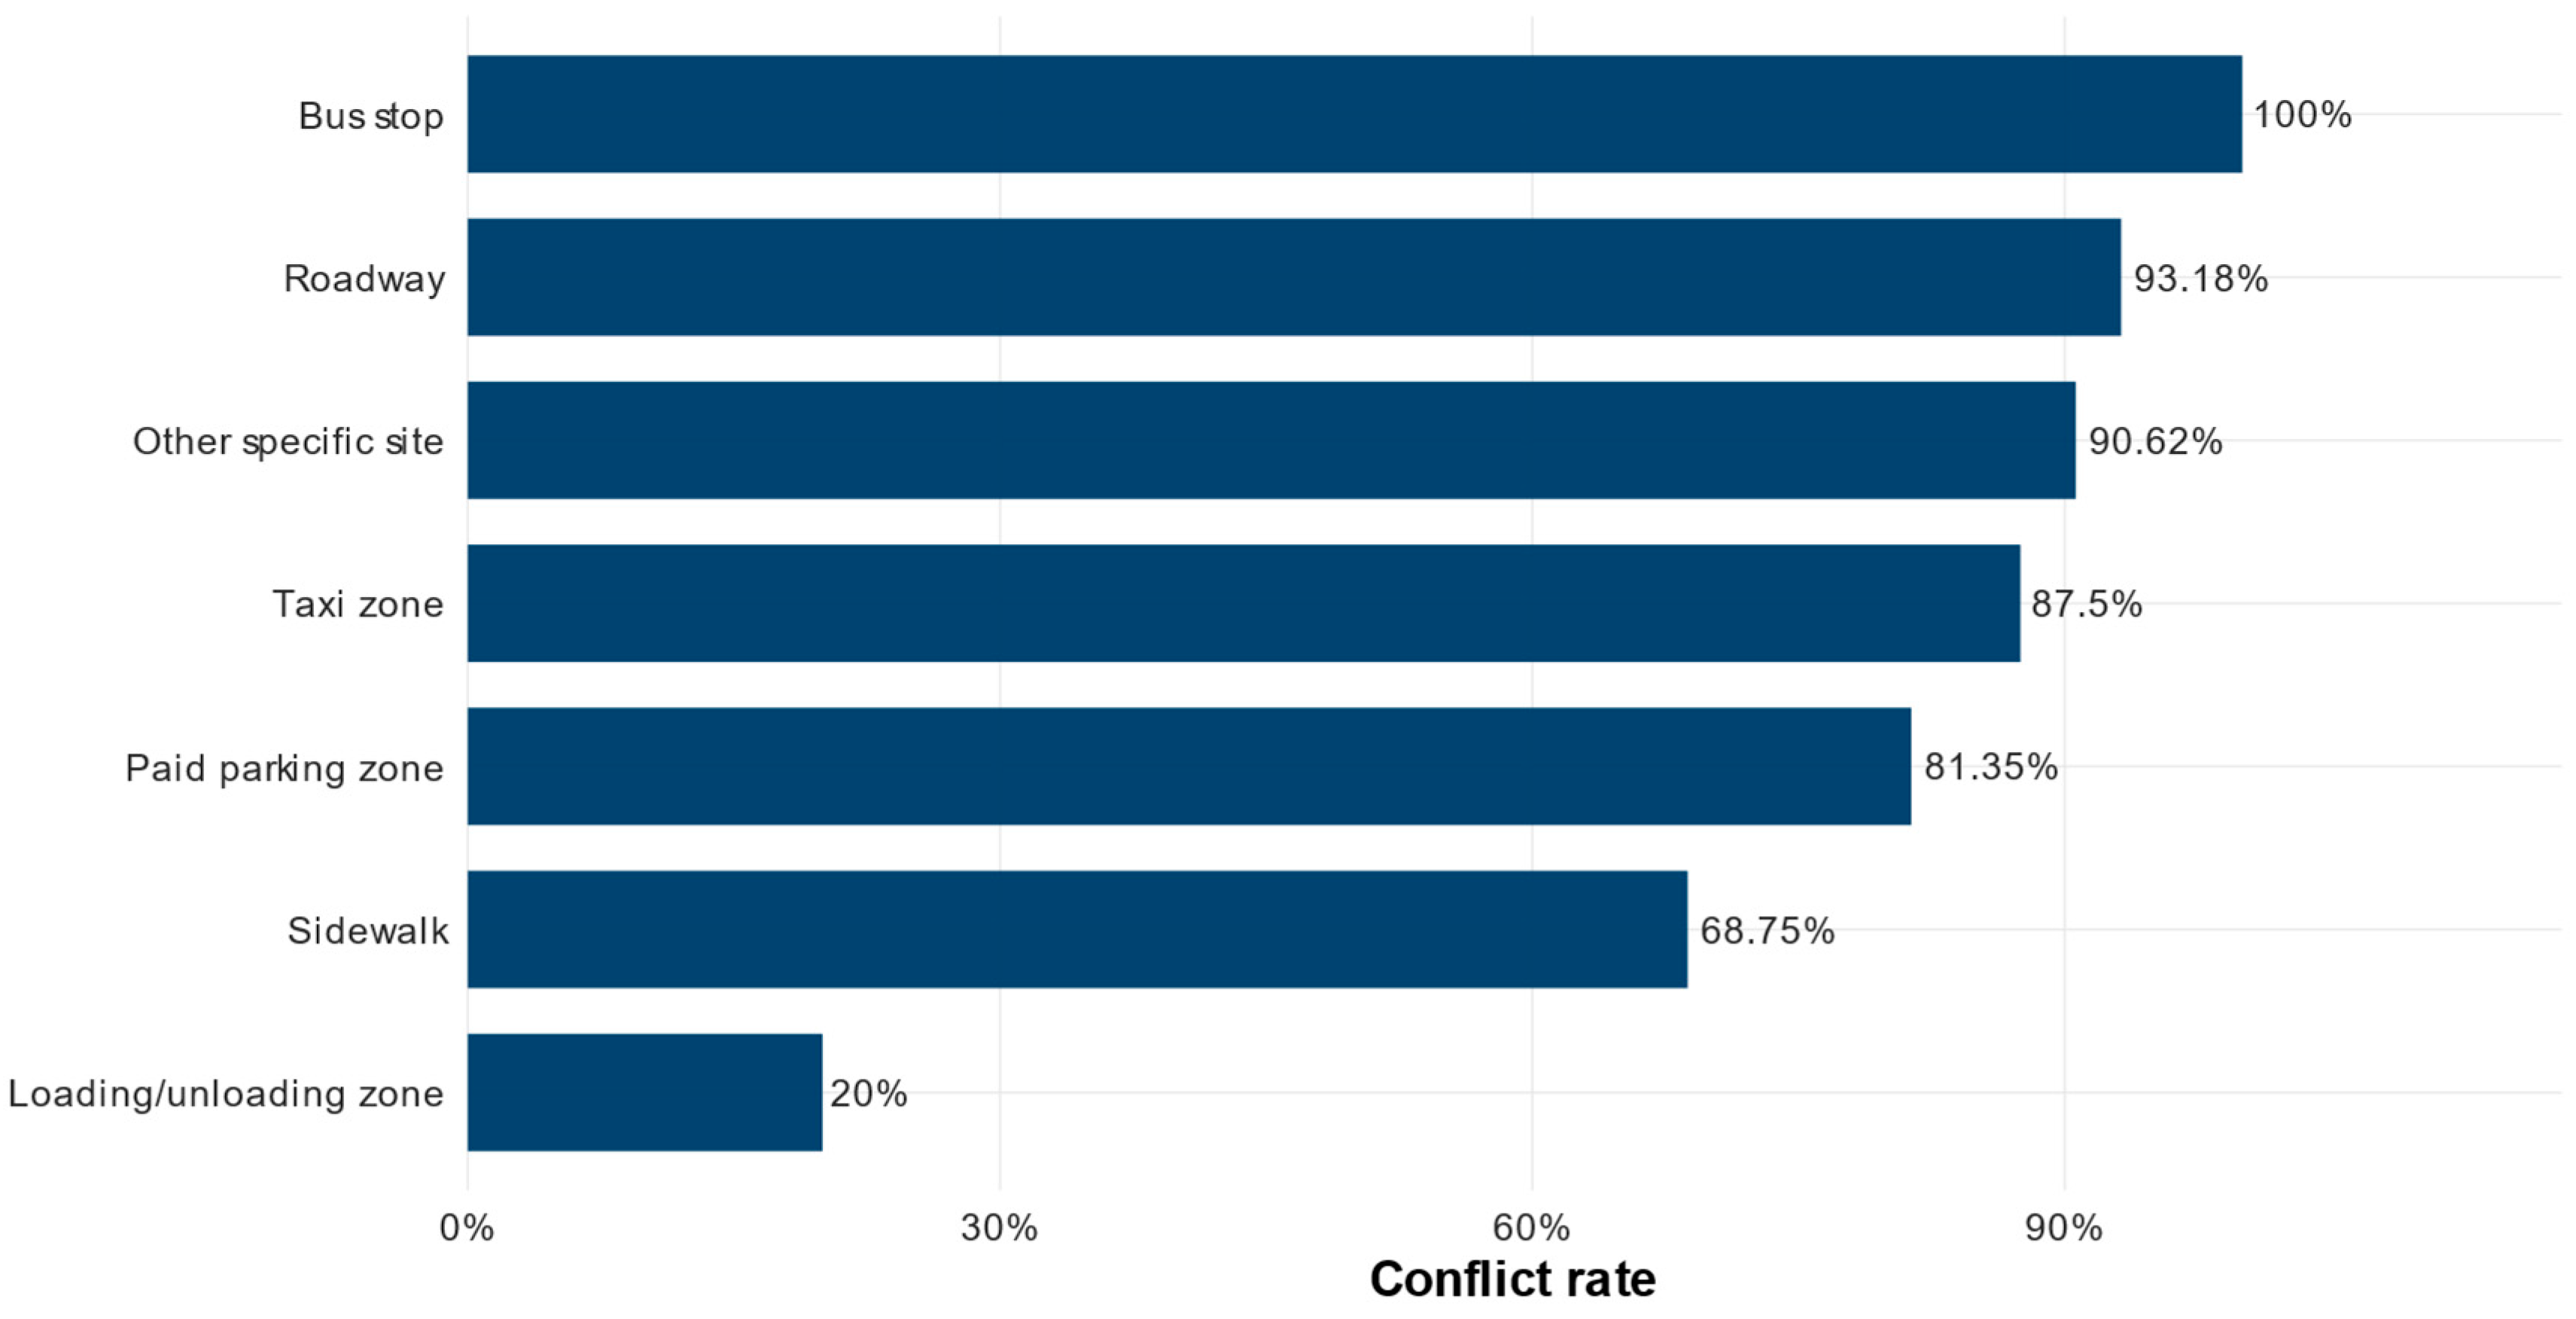
Table 4. Operations carried out at bus stops recorded a conflict rate of 100%, although with only three observations. Roadway operations presented a conflict rate of 93.18%, with a vehicular conflict rate of 88.64%. Taxi zones recorded a conflict rate of 87.50%, while paid parking zones recorded a conflict rate of 81.35%.
The conflict rate by site type is represented in
Figure 7, showing the variation in conflict incidence according to the space used for the operation.
Table 5 shows that, in terms of formality, semi-formal operations were predominant, with 446 records, equivalent to 69.47%. Informal operations represented 24.77%, while operations classified as other or undetermined cases accounted for 4.98%. Formal operations represented only 0.78% of the total.
The critical public-space use indicator reached 26.07%, coinciding with the percentage of informal operations. This group includes operations carried out on the roadway, sidewalk, taxi zones, or bus stops. In contrast, operations carried out in paid parking zones and formal loading and unloading zones were classified as non-critical from the perspective of direct public-space use.
3.5. Operational Sustainability Risk/Pressure Index
The operational sustainability risk/pressure index shown in
Table 6 presented a mean value of 0.451. This index should be interpreted as an operational proxy of urban logistics pressure, rather than as a direct measurement of environmental sustainability, emissions, or energy performance. According to the classification generated, 51.09% of operations were located at the medium-risk level, 17.45% at high risk, 13.40% at low risk, and 12.93% at very high risk. In addition, 5.14% of records remained unclassified.
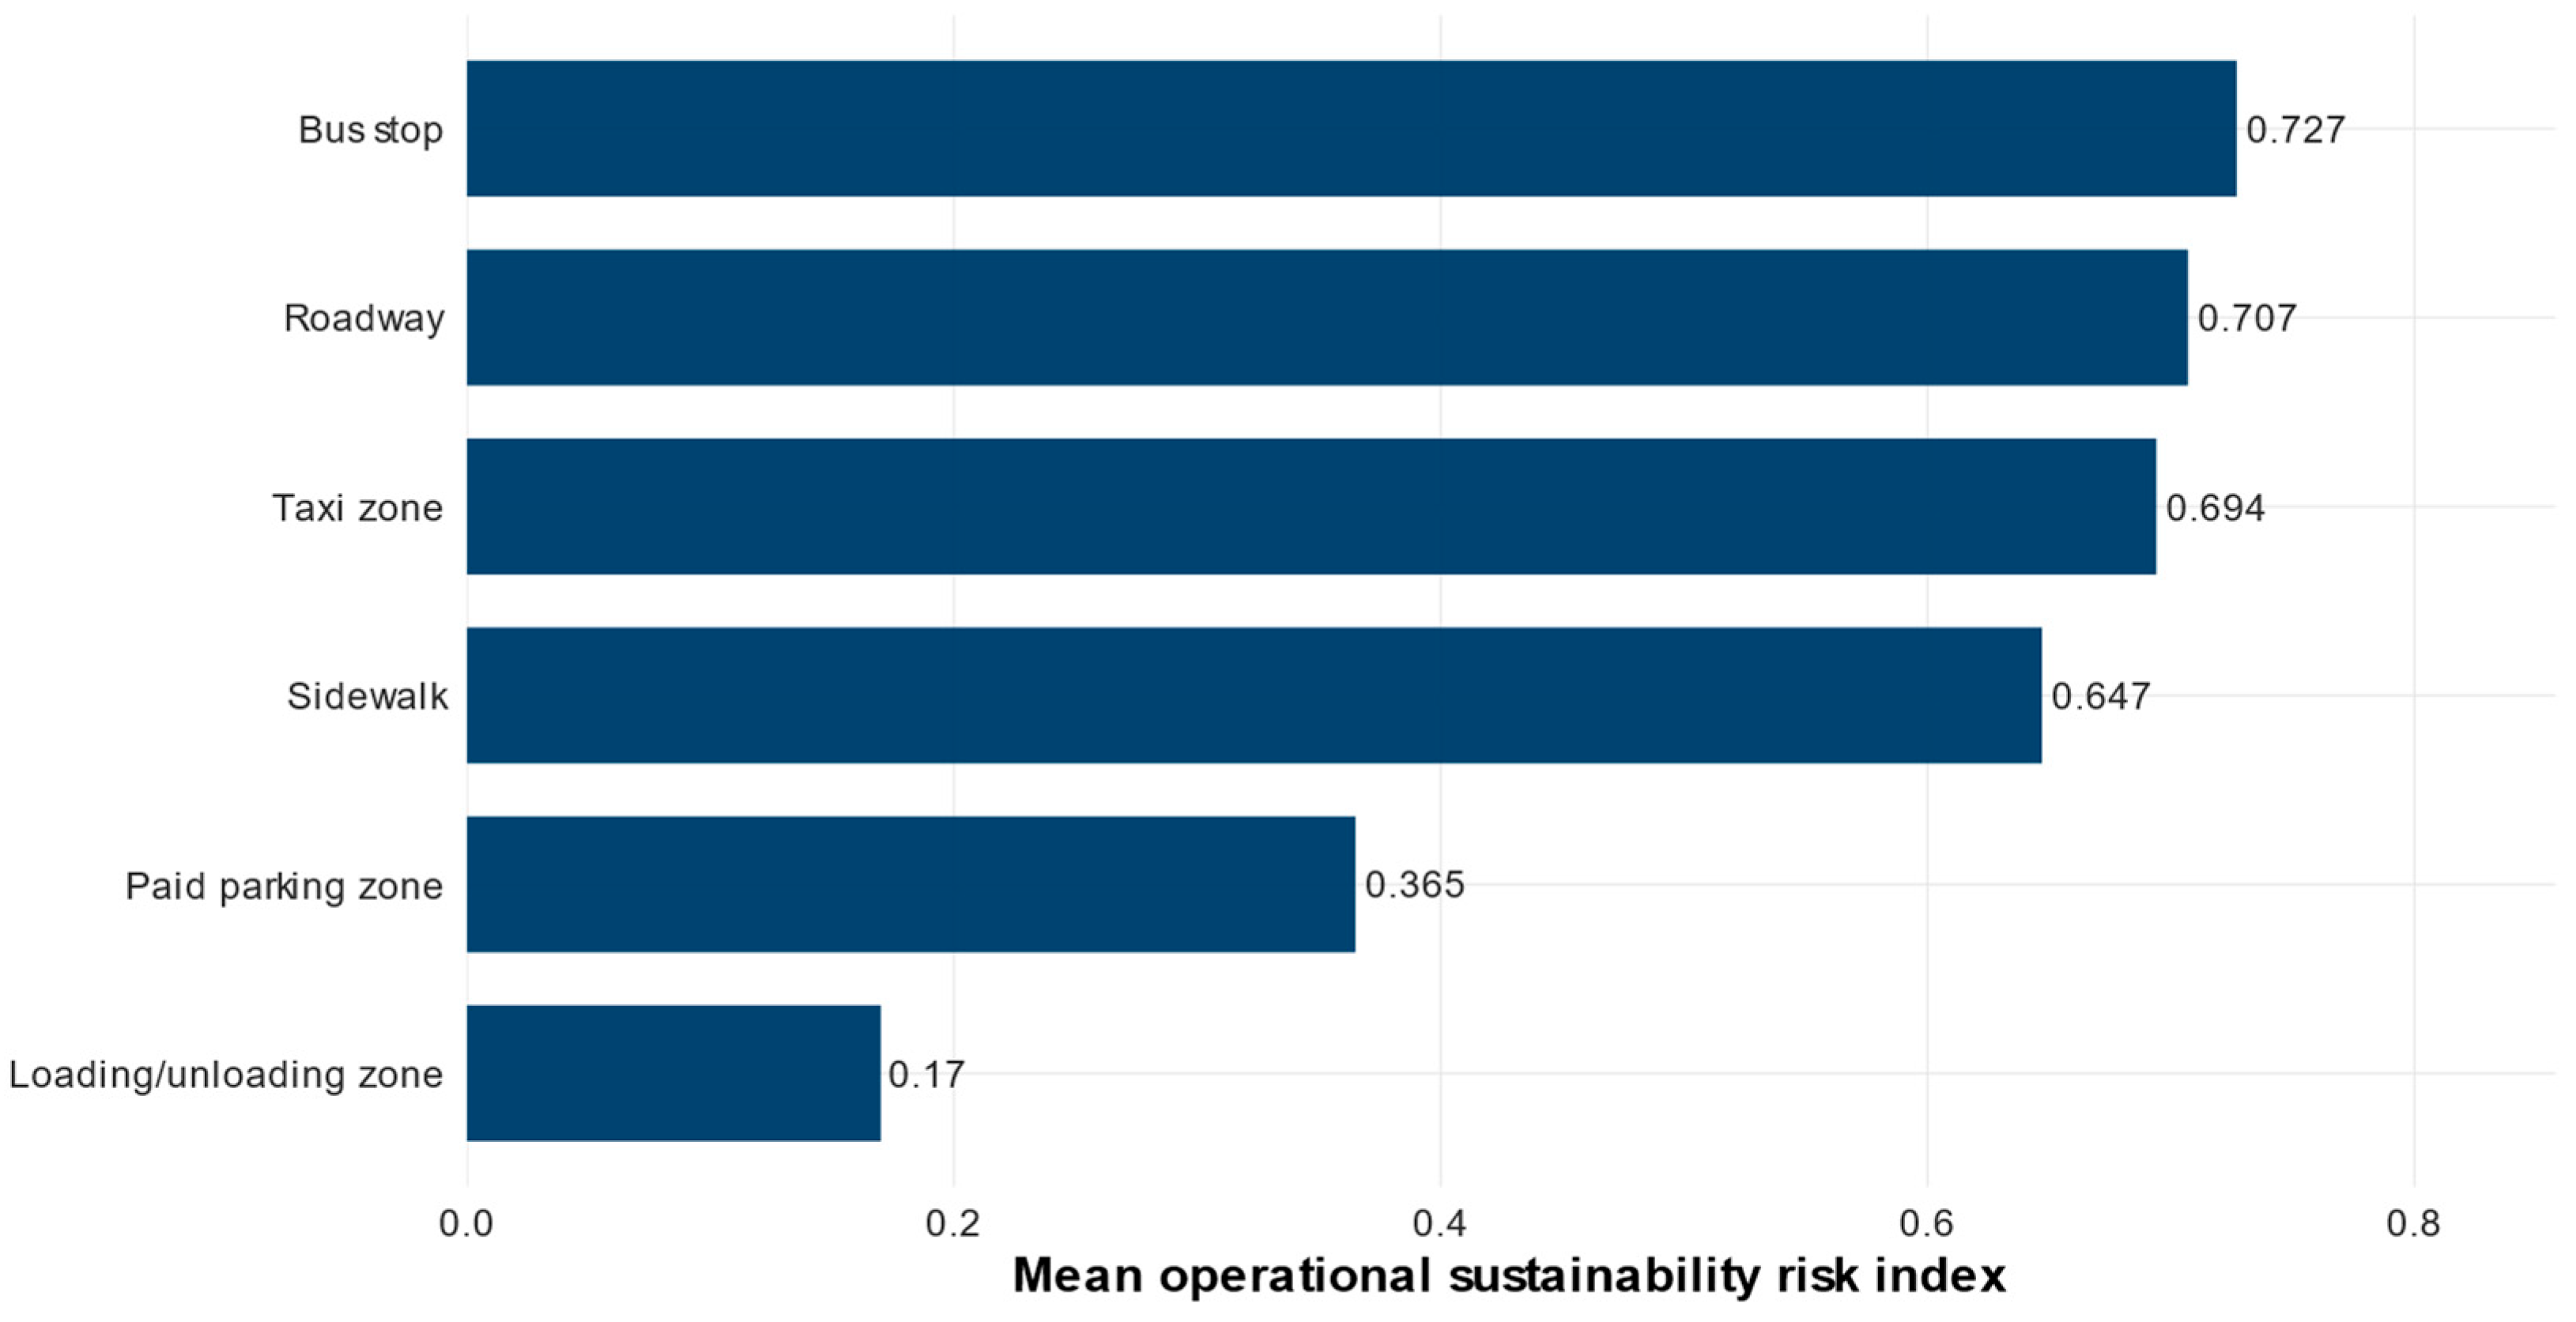
The distribution of the risk index by loading and unloading site is presented in
Figure 8. This figure summarizes the variation in mean risk according to the type of space used for the operation.
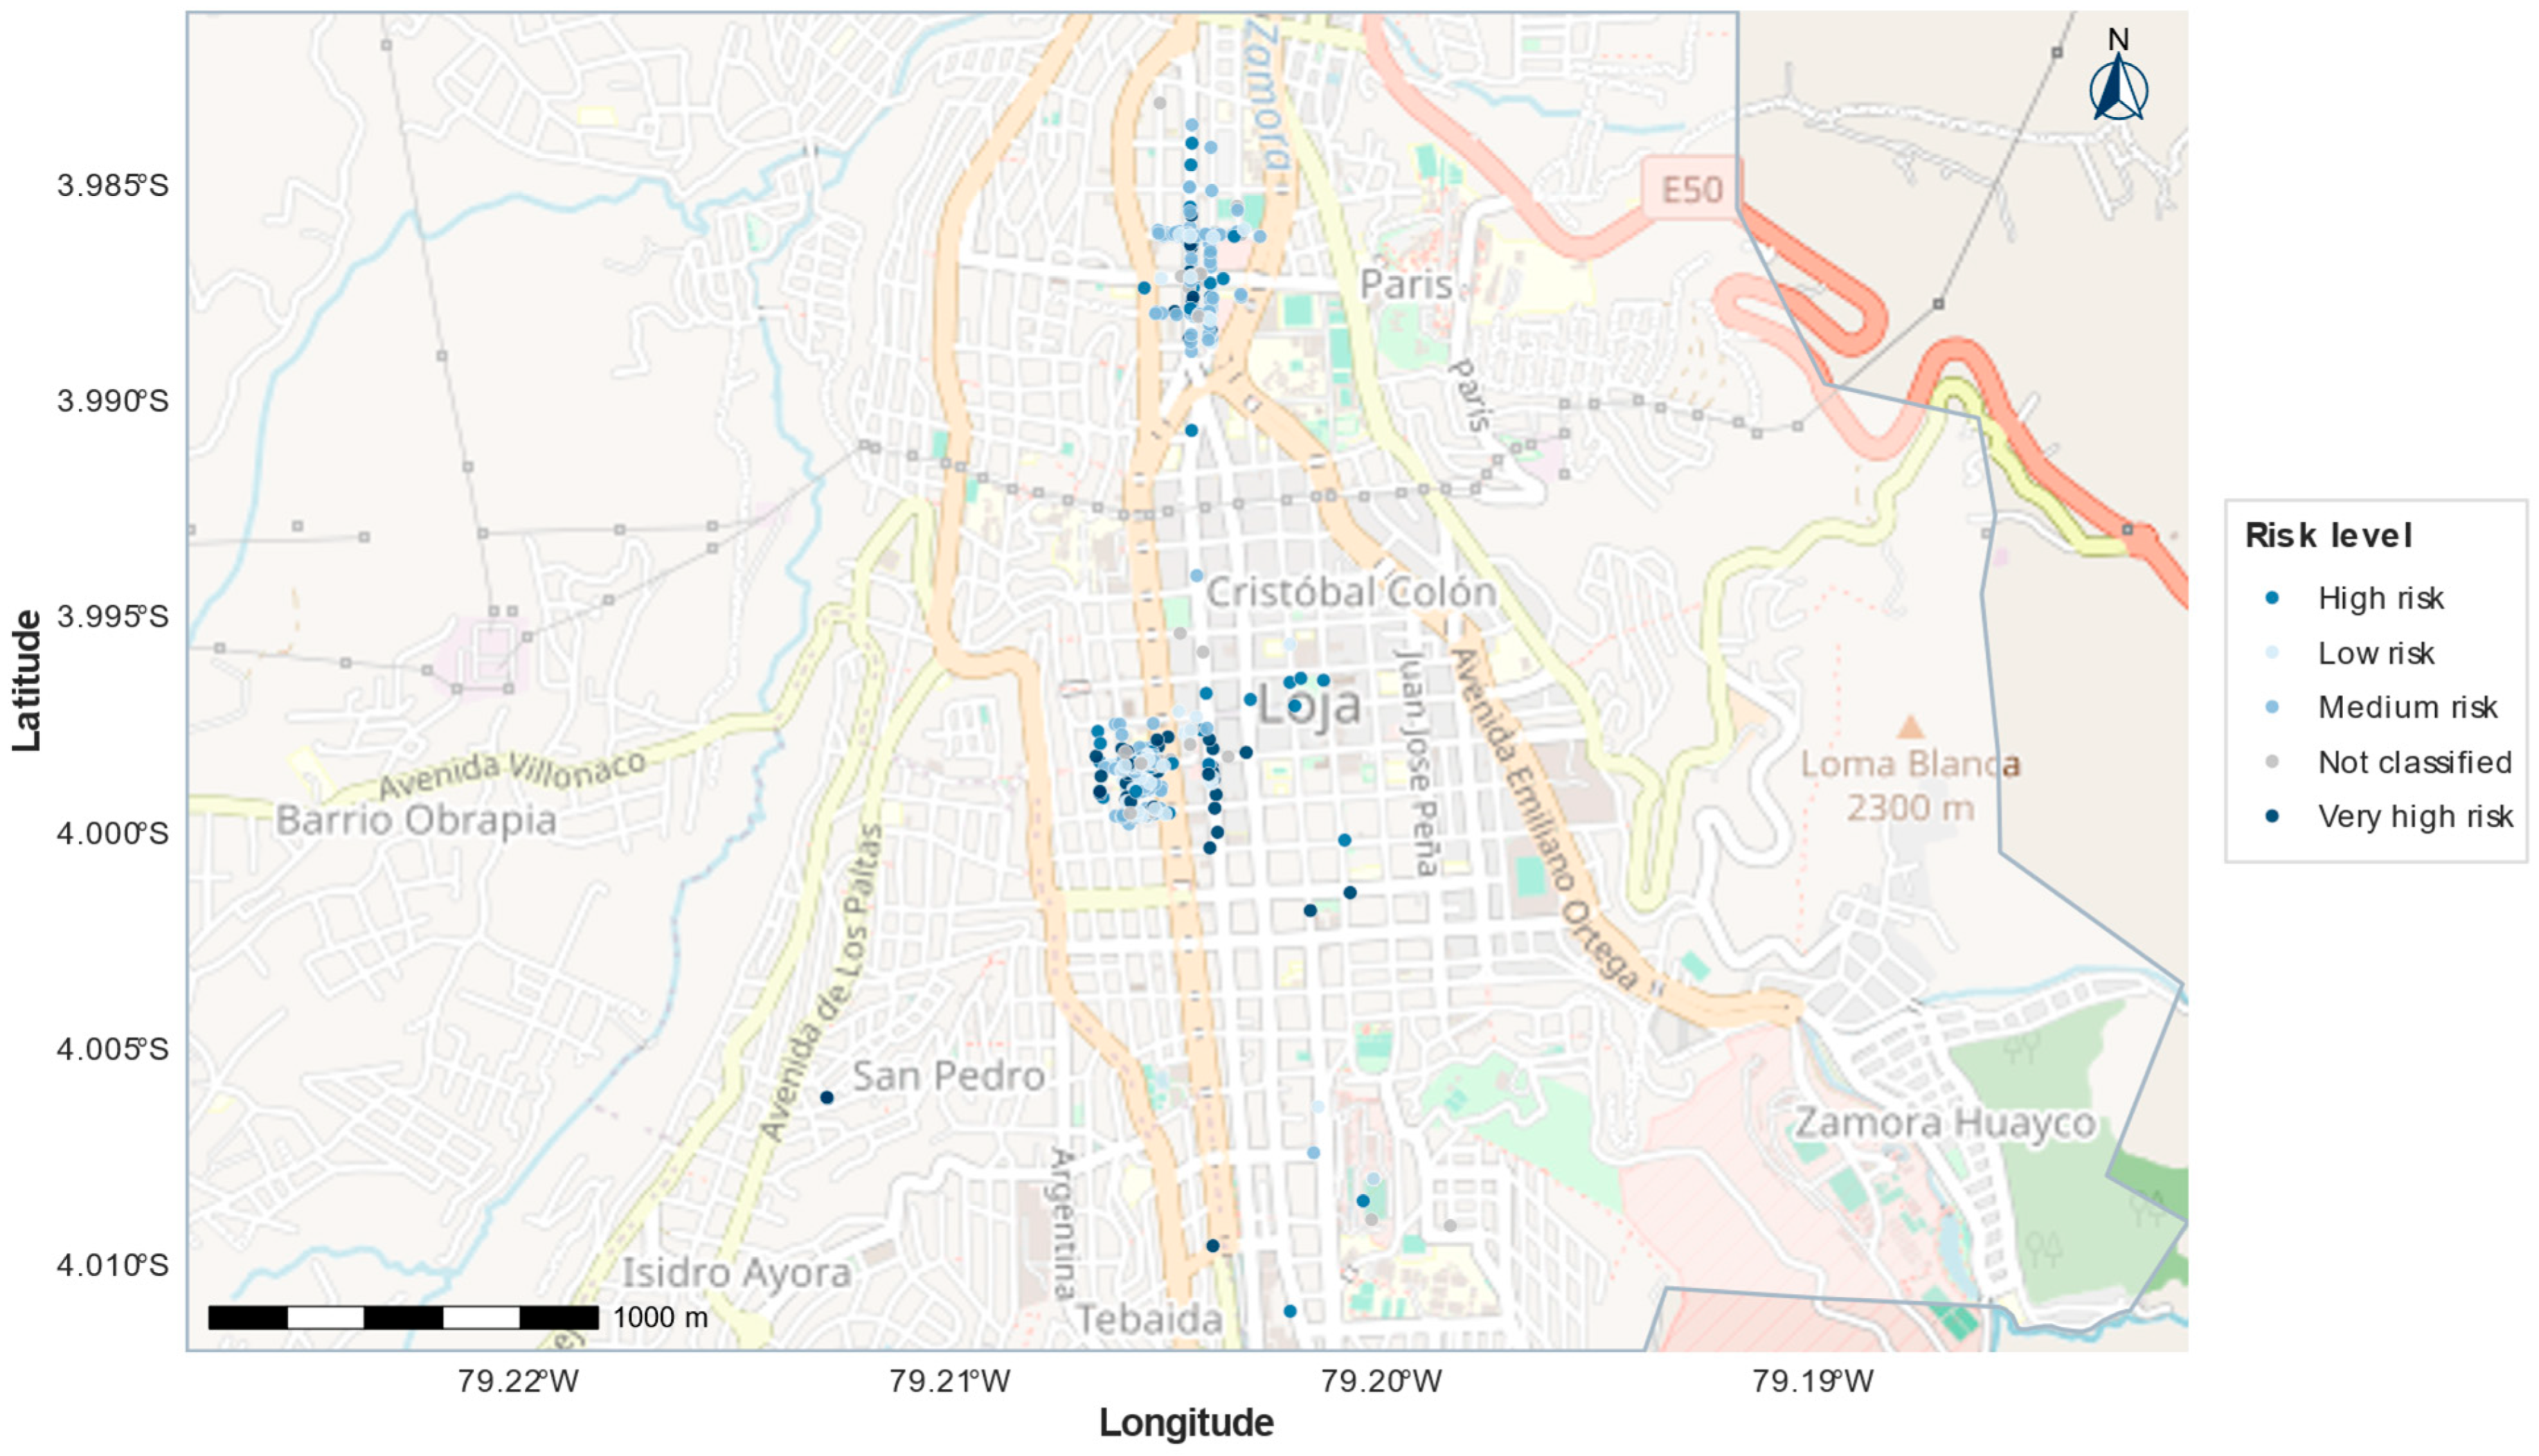
The spatial distribution of risk levels is presented in
Figure 9, where operation points are located according to the classification of the operational sustainability risk index.
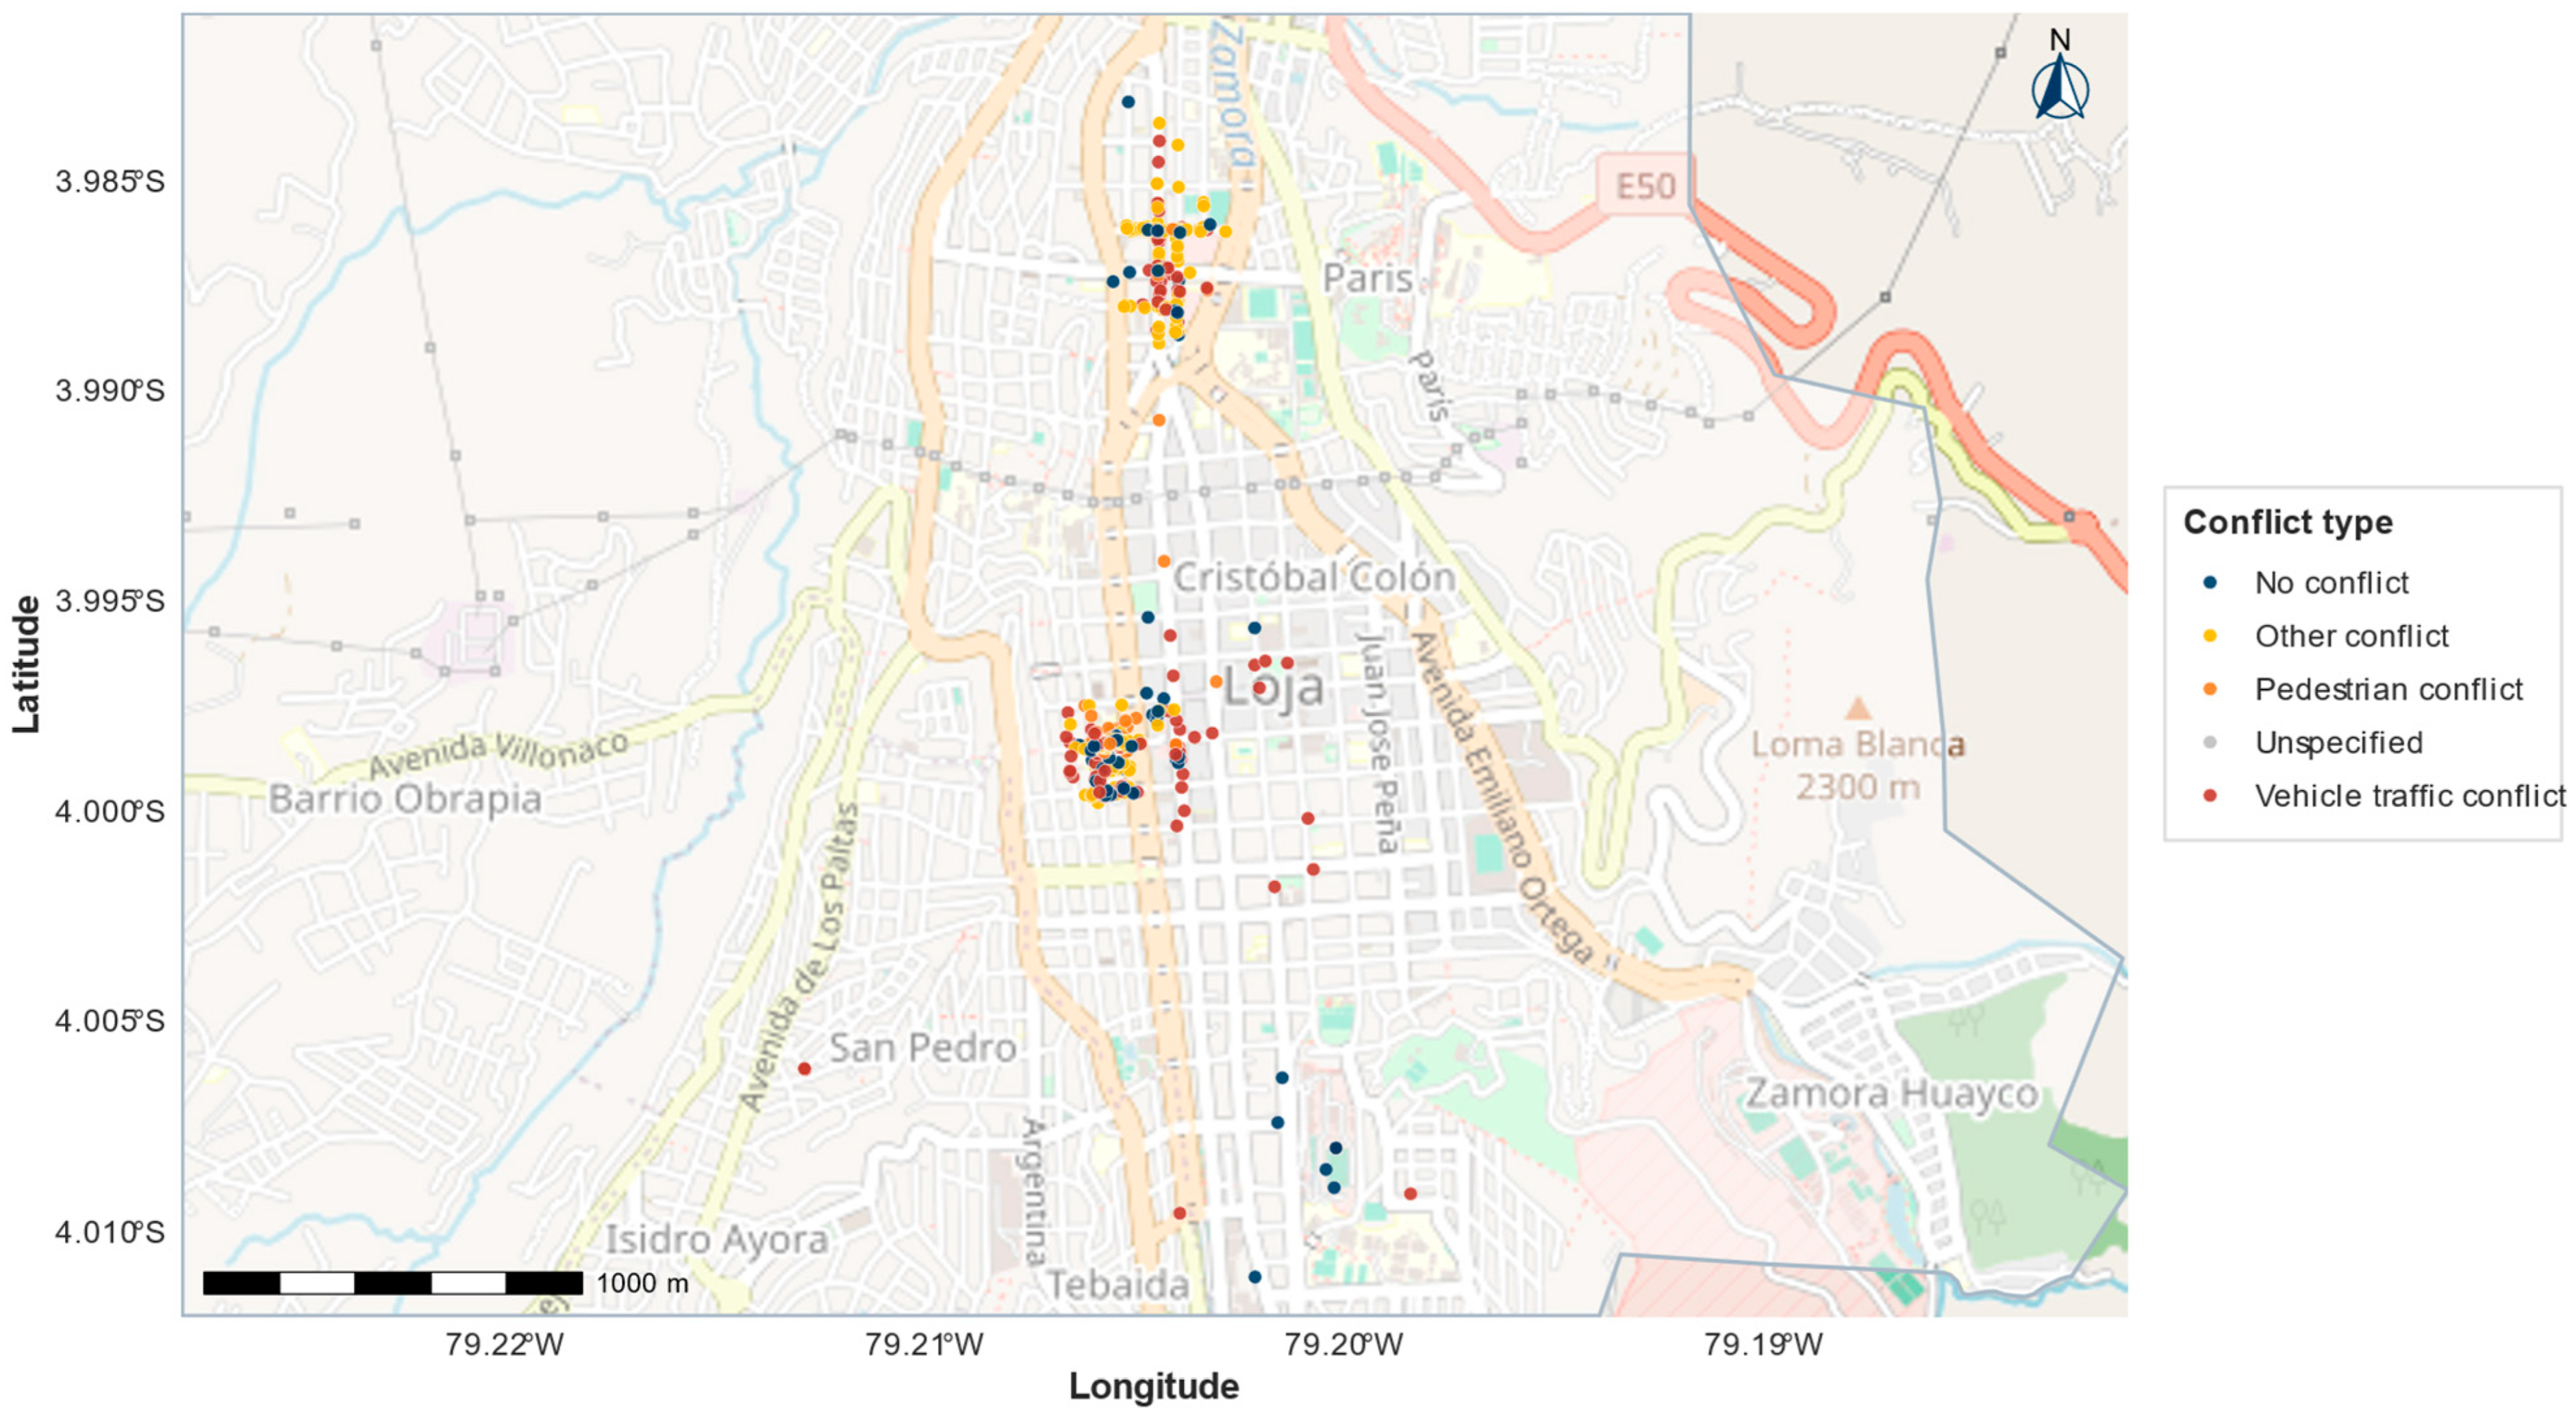
The spatial distribution of vehicular and pedestrian conflicts is presented in
Figure 10, which distinguishes between vehicular traffic conflicts, pedestrian conflicts, other conflicts, operations without conflict, and unspecified cases.
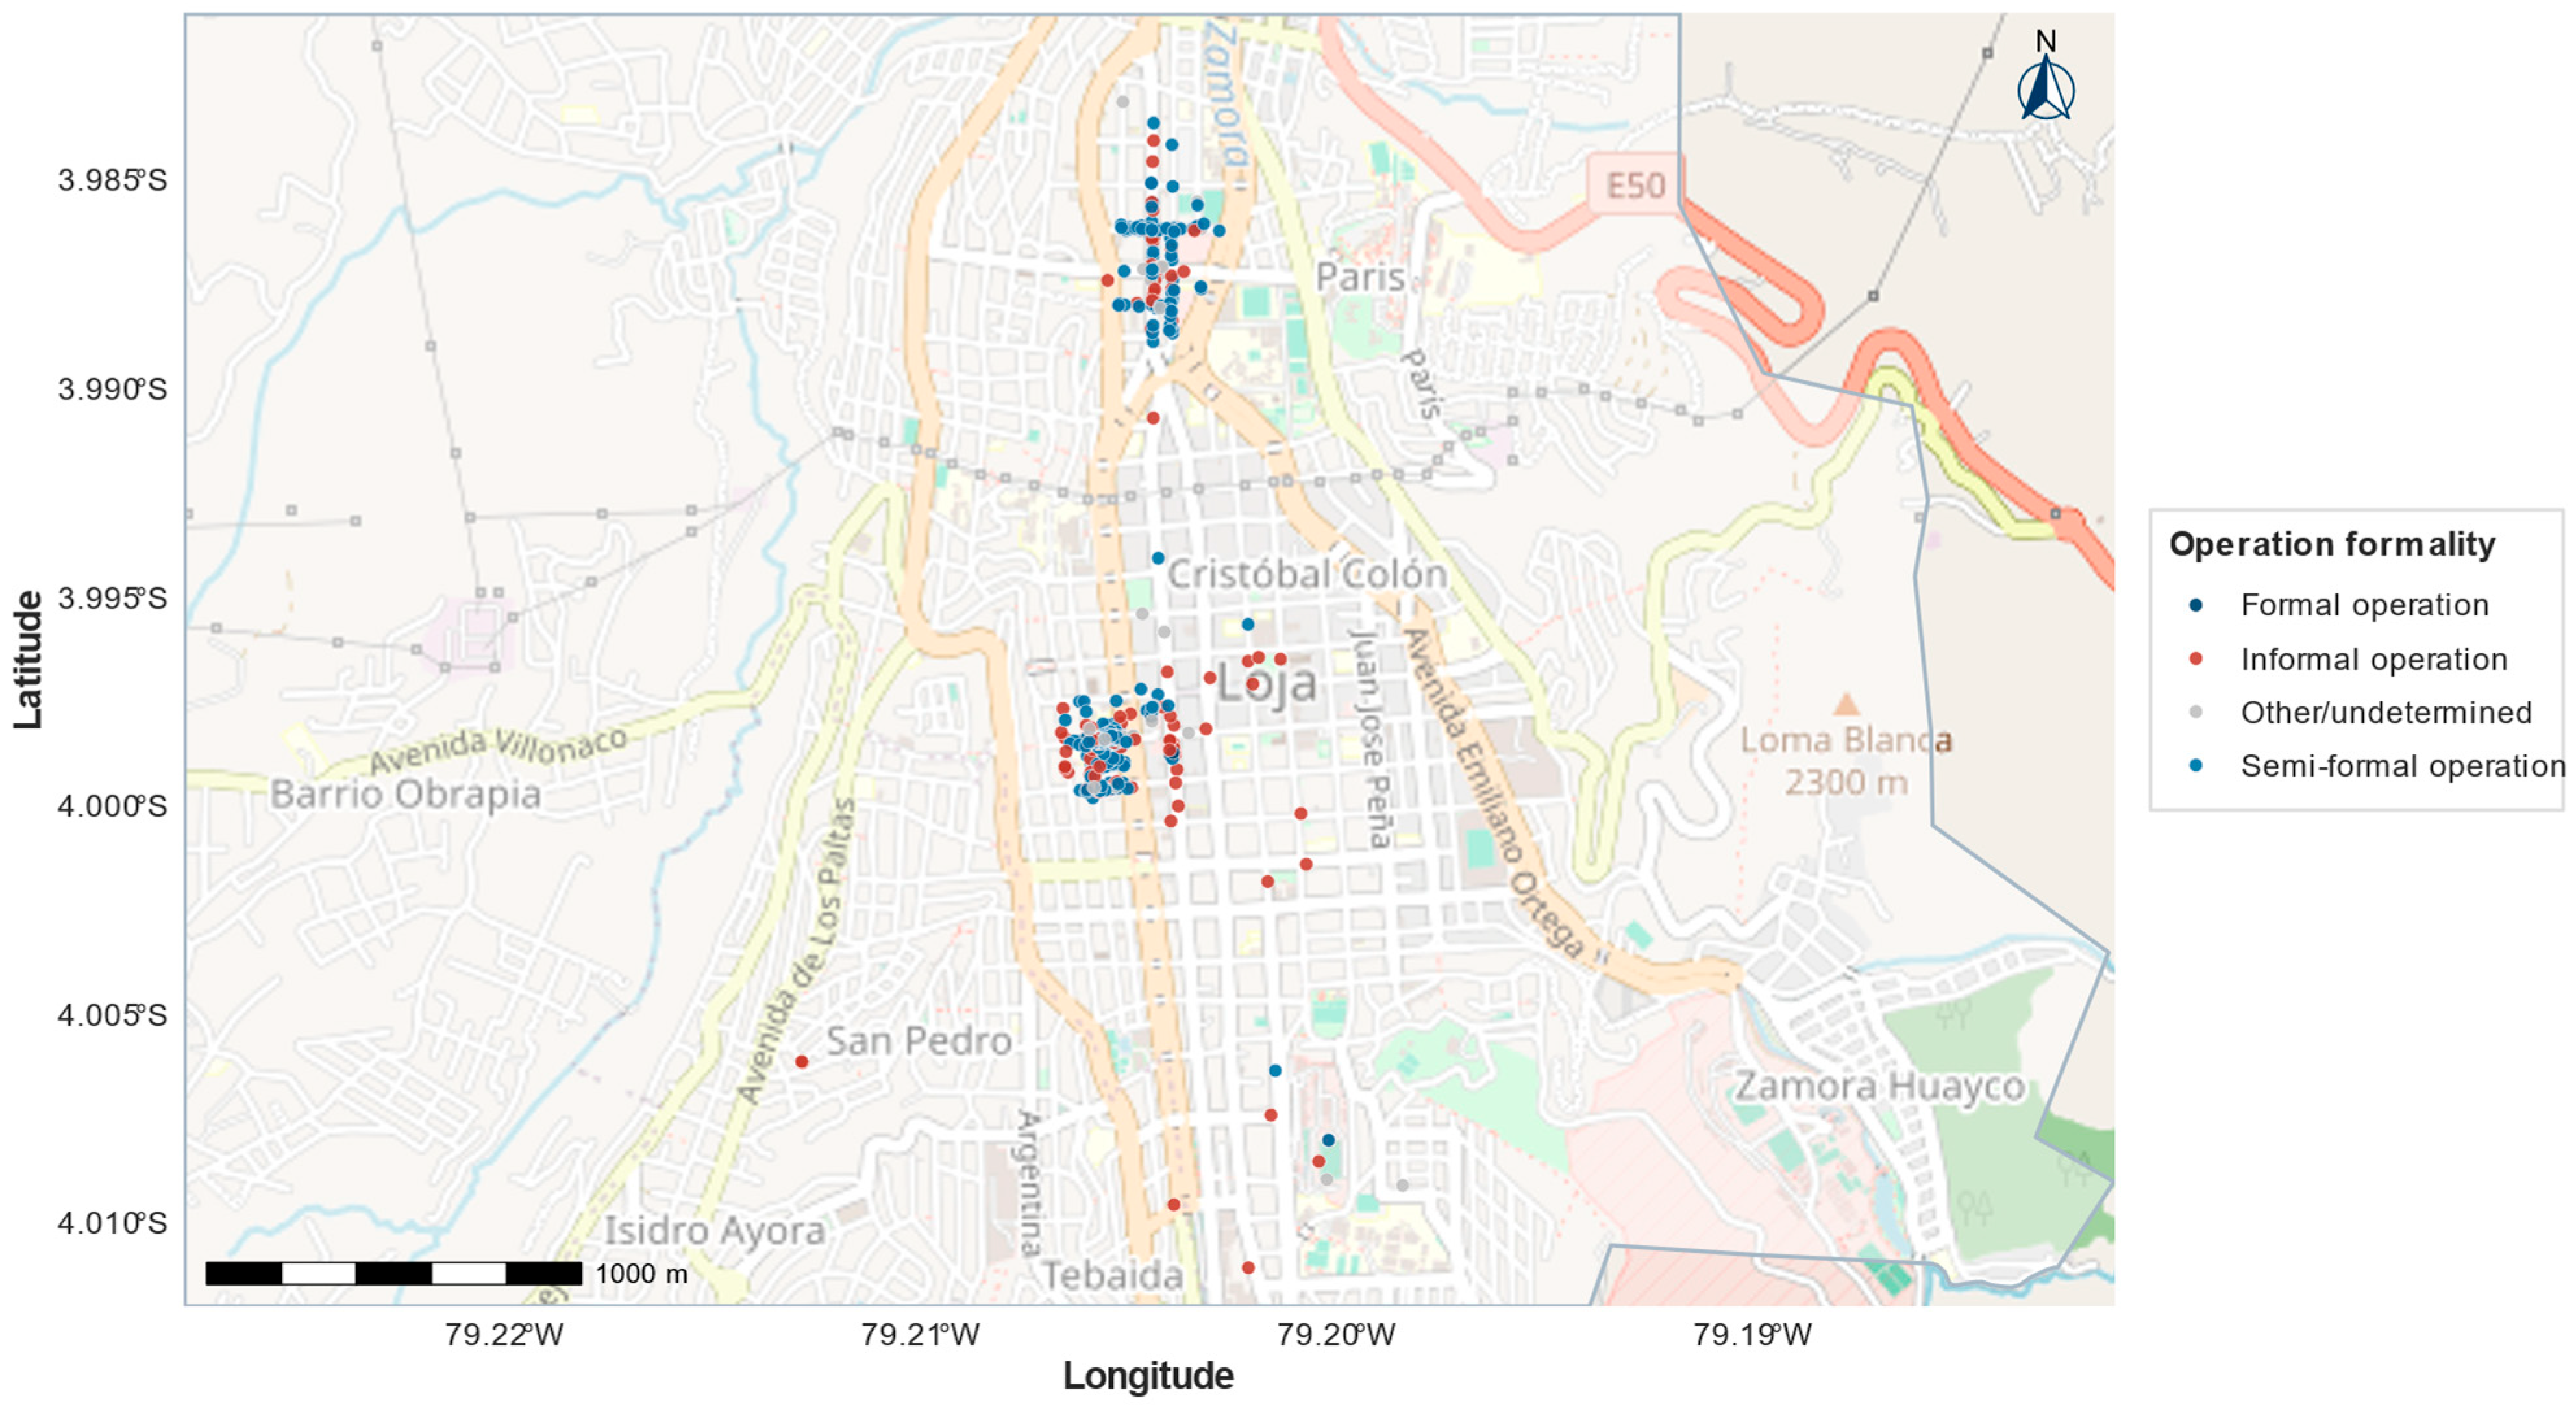
The spatial distribution of operation formality is shown in
Figure 11, differentiating formal, semi-formal, informal, and other cases.
3.6. Statistical Associations and Explanatory Models
As shown in
Table 7, the chi-square association tests revealed statistically significant relationships between loading/unloading site and general conflict, χ
2 = 29.67, df = 6,
p < 0.001, with Cramer’s V = 0.215. A significant association was also observed between loading/unloading site and vehicular conflict, χ
2 = 475.10, df = 6,
p < 0.001, with Cramer’s V = 0.861. The association between loading/unloading site and pedestrian conflict was also significant, χ
2 = 63.45, df = 6,
p < 0.001, with Cramer’s V = 0.315. Likewise, operation formality showed a significant association with general conflict, χ
2 = 23.20, df = 3,
p < 0.001, with Cramer’s V = 0.190.
Table 8 shows that the Kruskal–Wallis tests revealed statistically significant differences in operation duration by vehicle type, H = 47.29, df = 8,
p < 0.001; loading/unloading site, H = 167.15, df = 6,
p < 0.001; and weekday, H = 49.78, df = 6,
p < 0.001. Significant differences were also identified in the operational sustainability risk index according to operation formality, H = 327.12, df = 2,
p < 0.001, and loading/unloading site, H = 327.57, df = 5,
p < 0.001.
The logistic model explaining the occurrence of general conflict presented an AUC of 0.802. In the model, scaled duration showed an odds ratio of 3.322, with p < 0.001. Informal operation presented an odds ratio of 29.592, with p = 0.032. Regarding model fit, the AIC was 505.18, the BIC was 598.91, and McFadden’s pseudo-R2 was 0.190.
Table 9 and
Table 10 show the logistic model for conflict occurrence in UFD operations and the fit indicators of the conflict model.
Table 11 shows the exploratory logistic model for the classification of high operational sustainability risk/pressure. This model presented an AUC of 0.989; however, this value should be interpreted with caution because some predictors are conceptually related to the variables used to construct the composite index. Therefore, the model is not presented as an independent validation of the OSRI, but as an exploratory consistency analysis of the operational conditions associated with high-risk classification. Scaled duration recorded an odds ratio of 19.659, with
p < 0.001. In the adjustment by weekday, Wednesday, Friday, and Saturday presented statistically significant coefficients with respect to the reference category in the model.
3.7. Spatial Clusters of UFD Operations
The DBSCAN sensitivity analysis evaluated radii of 50, 75, 100, and 150 m, using a minimum of five points. The purpose of this comparison was to assess whether the selected spatial scale produced clusters that were useful for planning without excessive fragmentation or excessive aggregation. As shown in
Table 12, the 75 m radius provided an intermediate solution, identifying three main clusters, 608 grouped points, and 34 points classified as noise, equivalent to 94.70% of grouped observations. Smaller radii tended to increase fragmentation and spatial noise, while larger radii tended to merge nearby concentrations, reducing the spatial specificity required for locating loading and unloading interventions. Therefore, the 75 m radius was retained as the main scale for the spatial-operational analysis.
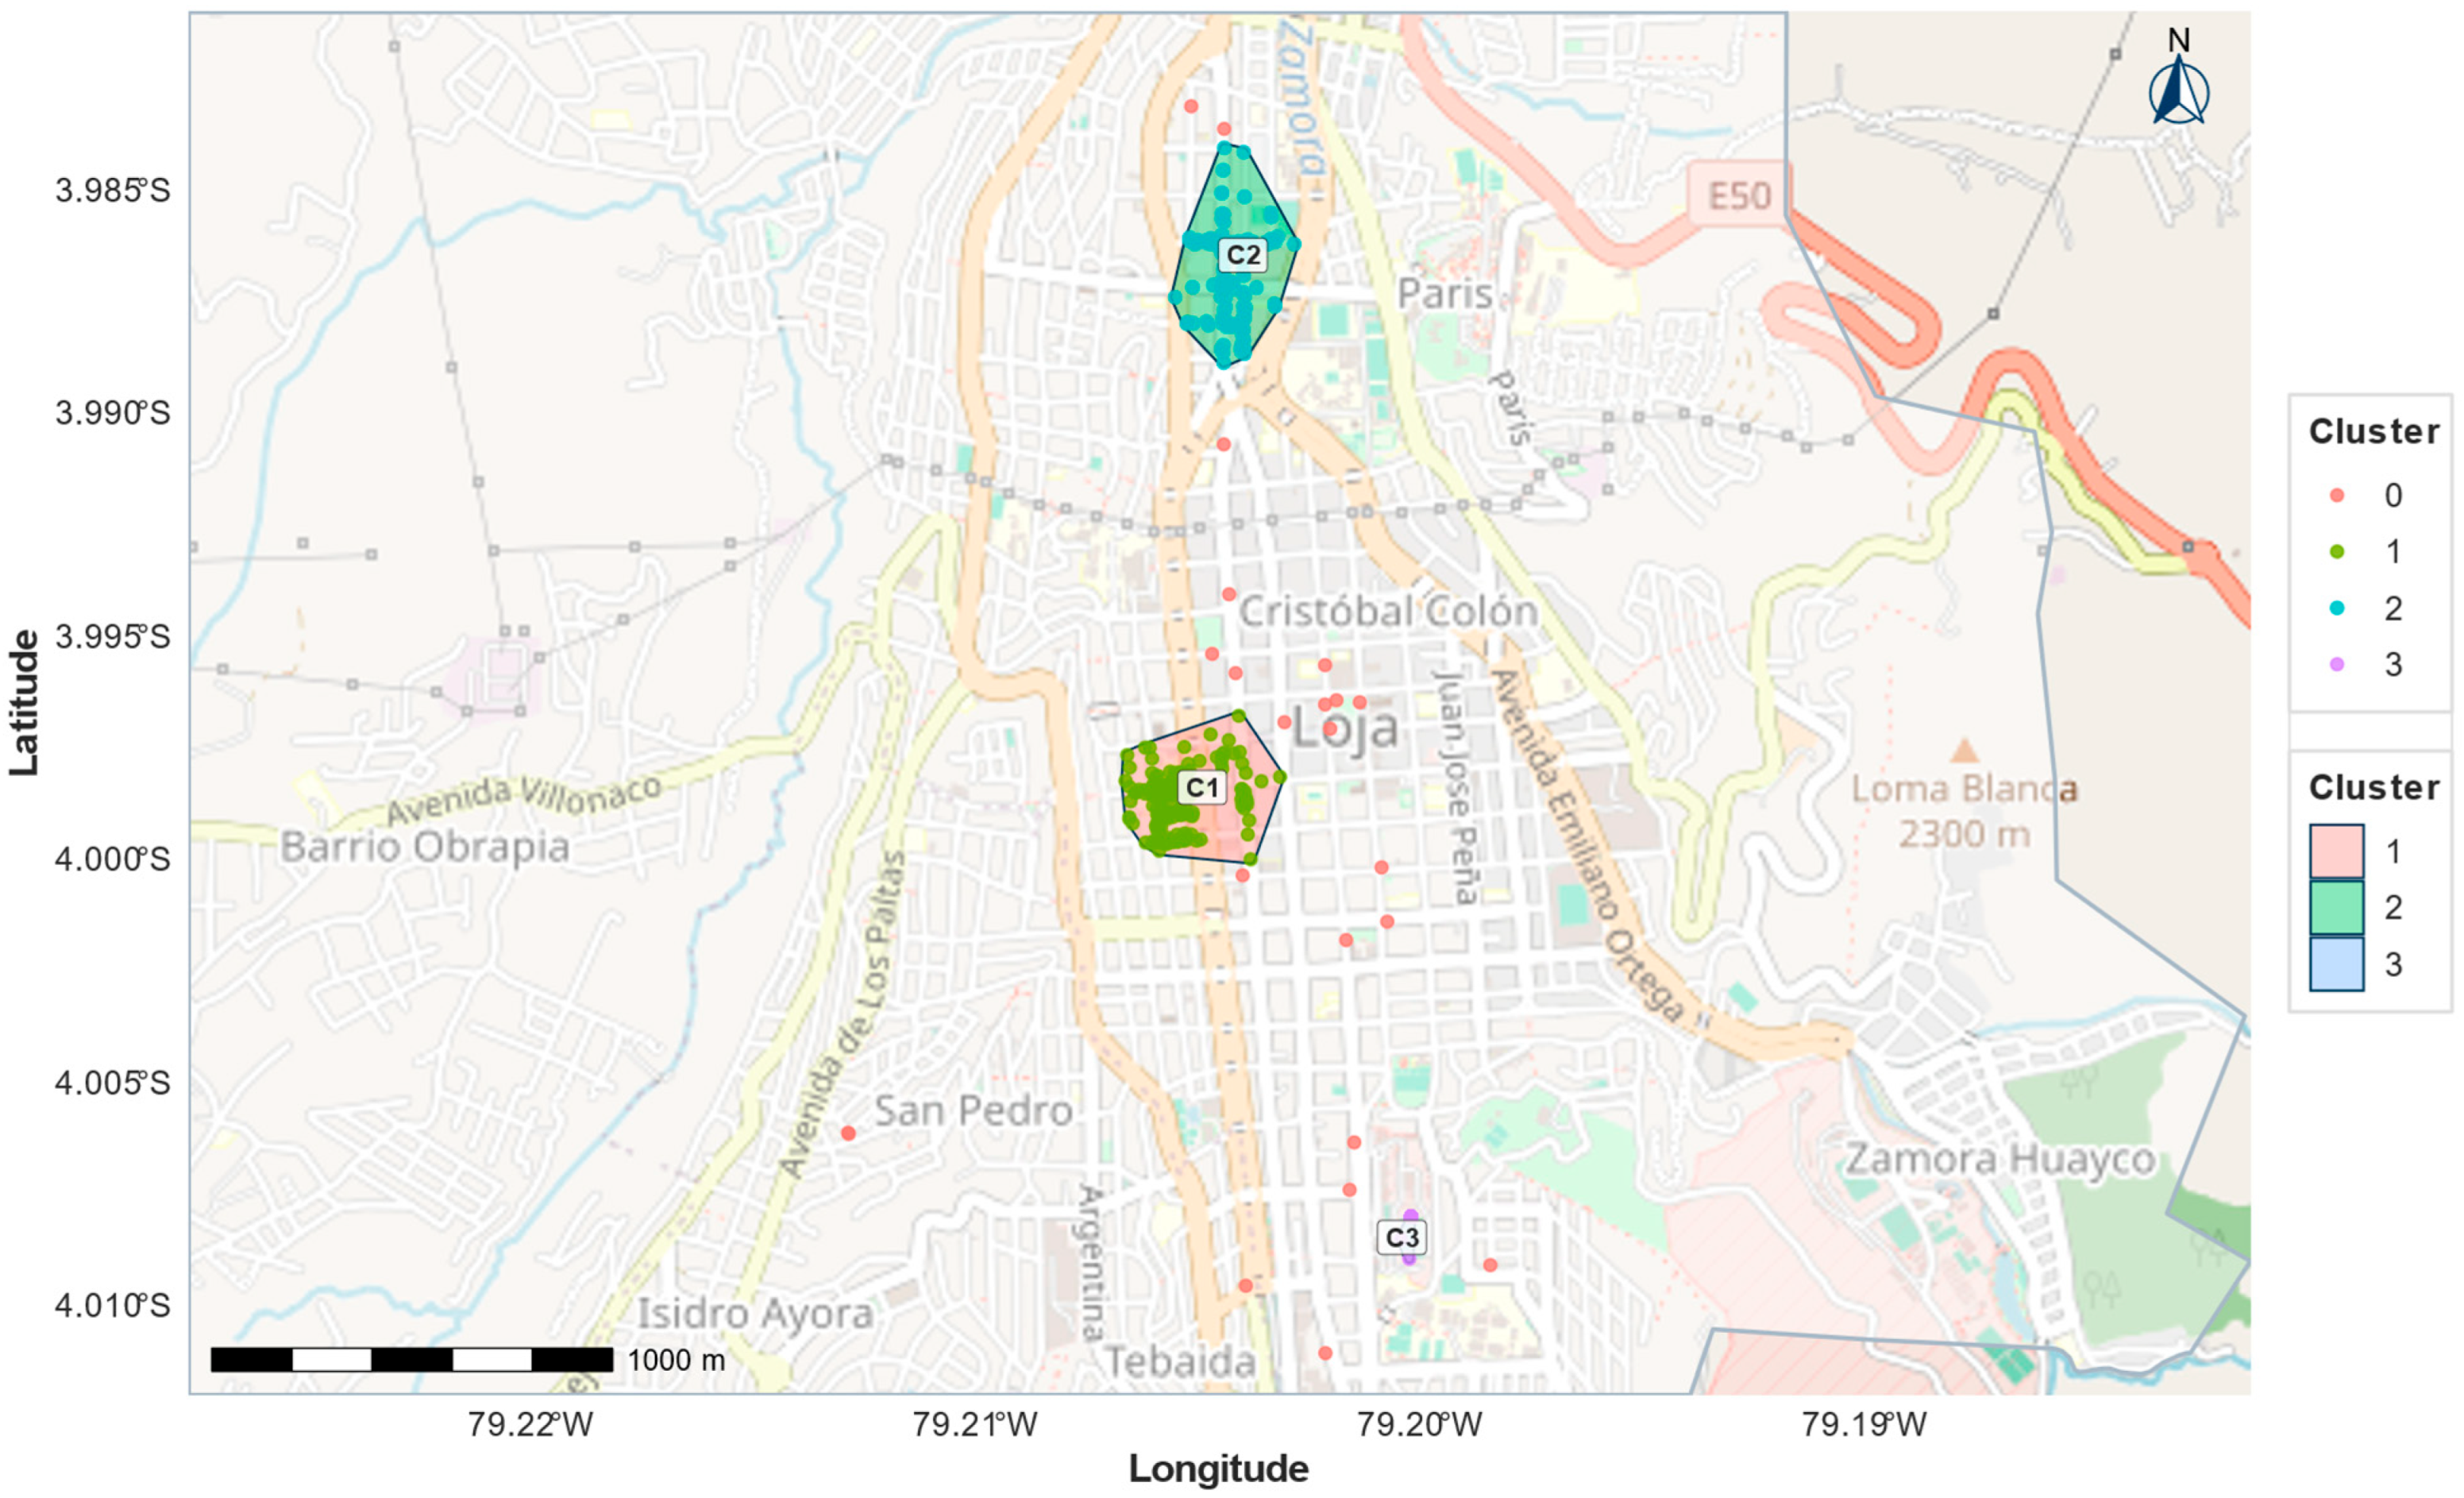
The spatial distribution of DBSCAN clusters is shown in
Figure 12, which identifies the main spatial concentrations of loading and unloading operations within the urban area.
The operational profile of the clusters is presented in
Table 13 and
Table 14. Cluster 1 recorded 440 operations, with a mean duration of 36.97 min, a median of 22.08 min, and a P75 of 60 min. Its conflict rate was 84.51%, and its mean sustainability risk was 0.444. Cluster 2 recorded 138 operations, with a mean duration of 18.27 min, median of 15 min, and a P75 of 25.75 min; its conflict rate was 92.03%, and its mean risk was 0.430. Cluster 3 grouped 30 operations, with a mean duration of 19.52 min, a median of 9.50 min, and a P75 of 30 min; its conflict rate was 60.00%, and its mean risk was 0.550.
3.8. Logistics Pressure Index and Sustainable Transport Priority Index
As shown in
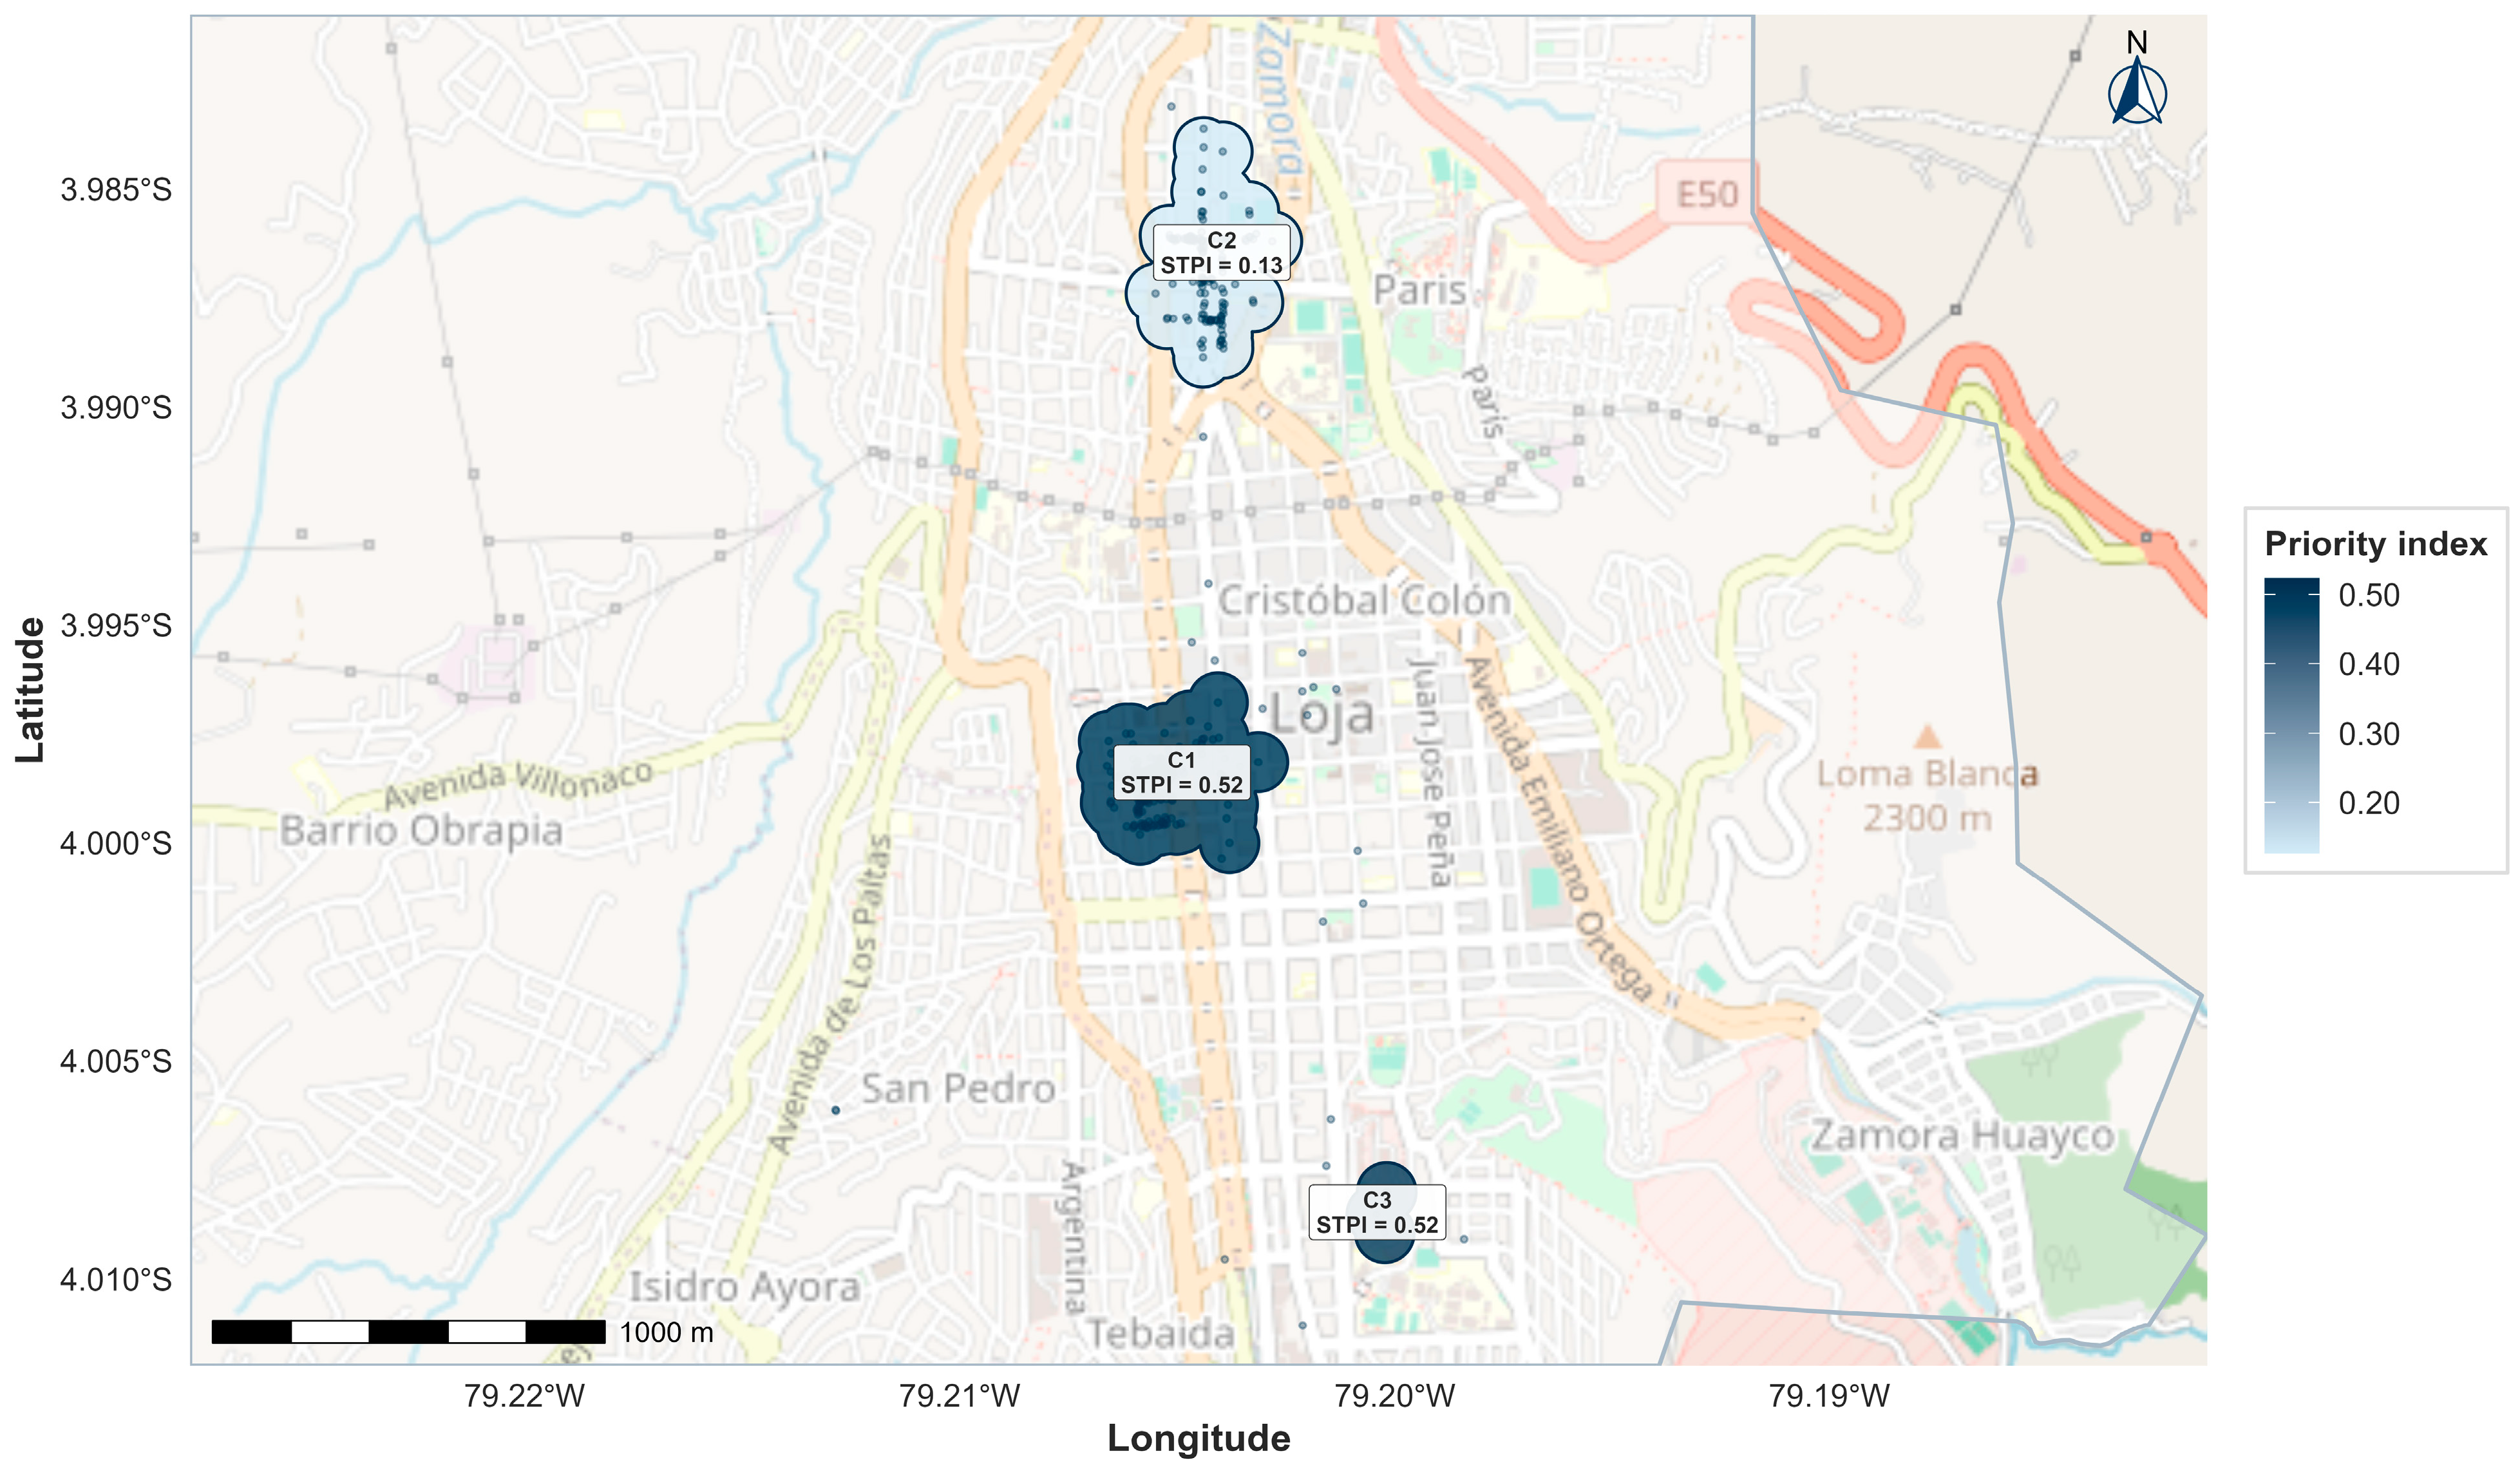
Table 15, the logistics pressure index and the sustainable transport priority index were calculated at the cluster level. Cluster 1 presented the highest logistics pressure index, with a value of 0.703, and a sustainable transport priority index of 0.523, classified as high priority. Cluster 3 presented a logistics pressure index of 0.270 and a priority index of 0.515, also classified as high priority. Cluster 2 presented a logistics pressure index of 0.442 and a priority index of 0.223, classified as low priority. Because the LPI and STPI are composite planning-oriented indices, the priority levels should be interpreted as relative rankings among the observed clusters rather than definitive classifications of sustainability performance.
The spatial distribution of the logistics pressure index is presented in
Figure 13, where the differentiated behavior of the main clusters can be observed.
3.9. Estimation of Loading and Unloading Bay Capacity
The cluster-level capacity model was calculated based on the average daily number of operations observed in each cluster. To this end, the total number of operations in each cluster was divided by the number of days with valid records, thus obtaining average daily demand. Under this criterion, the operational scenario, defined with a productivity factor of φ = 0.85 and an operating window of 240 min, estimated bay requirements based on different duration criteria: mean, median, P75, and P90. This capacity estimation should be interpreted as a preliminary planning approximation. It translates observed average daily operations and service duration into comparable bay requirements, but it does not explicitly model queuing, real-time peak accumulation, exact curbside supply, walking distance to establishments, vehicle size heterogeneity, or enforcement behavior.
In
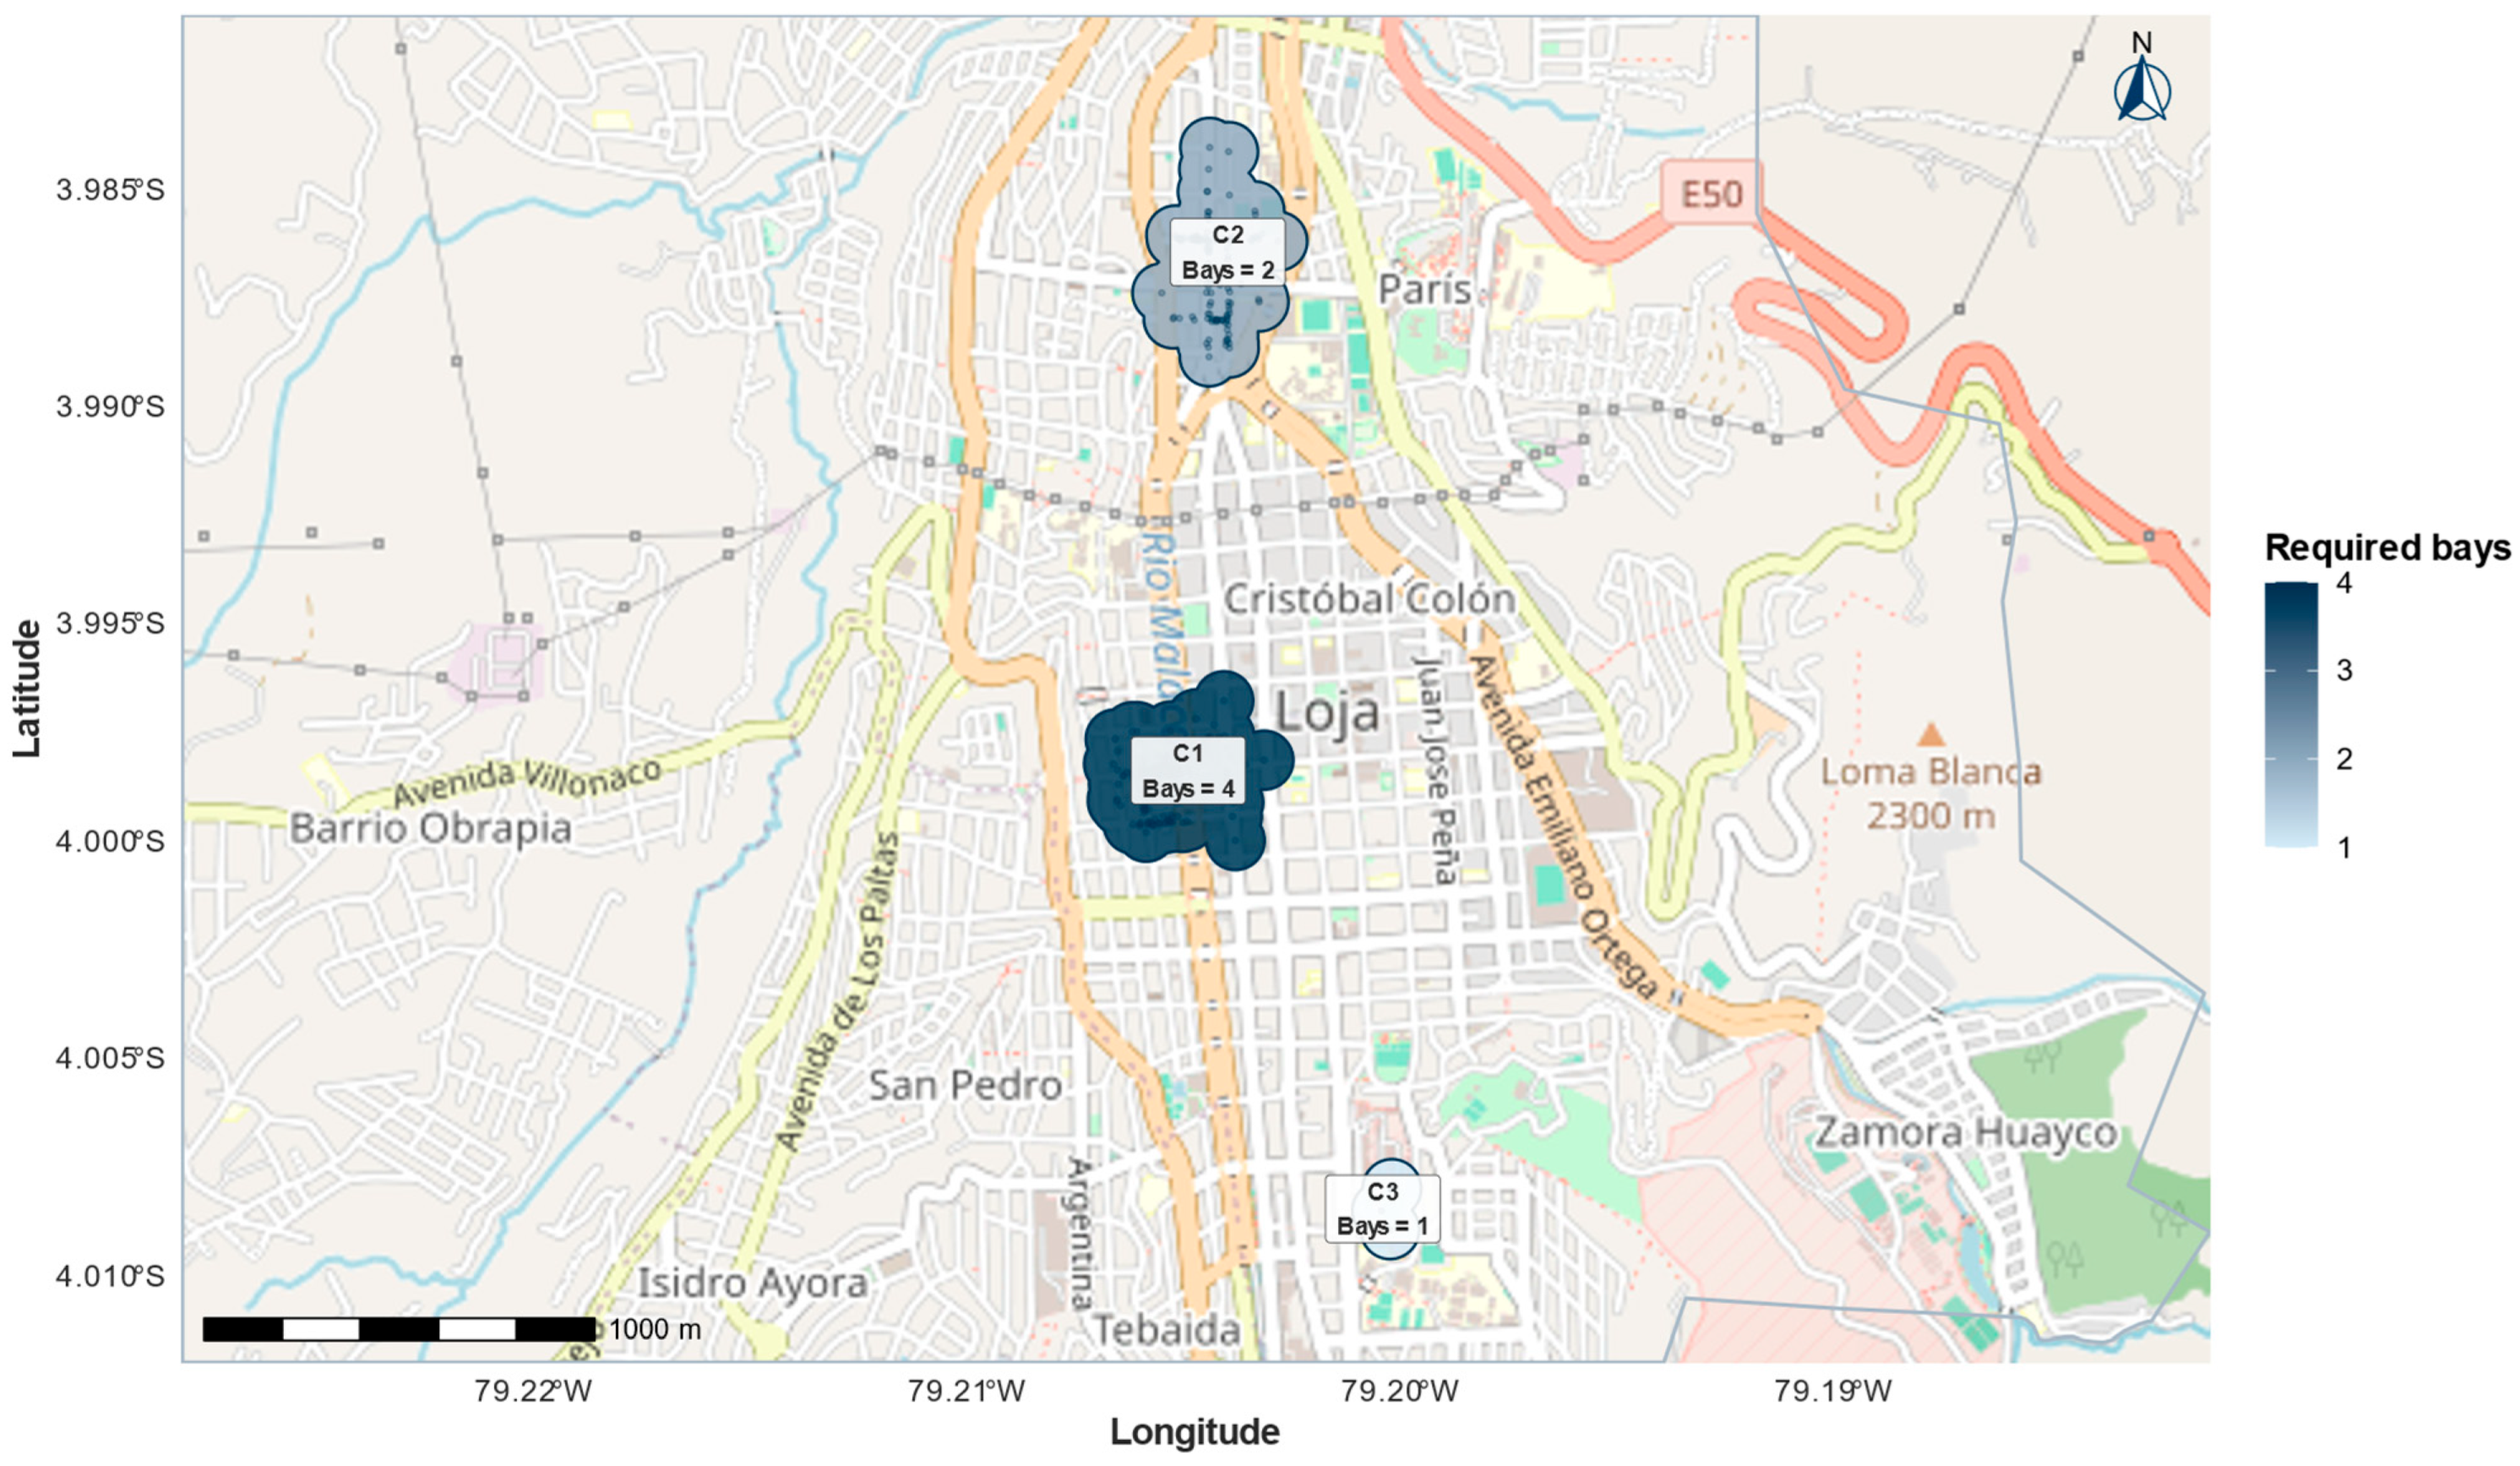
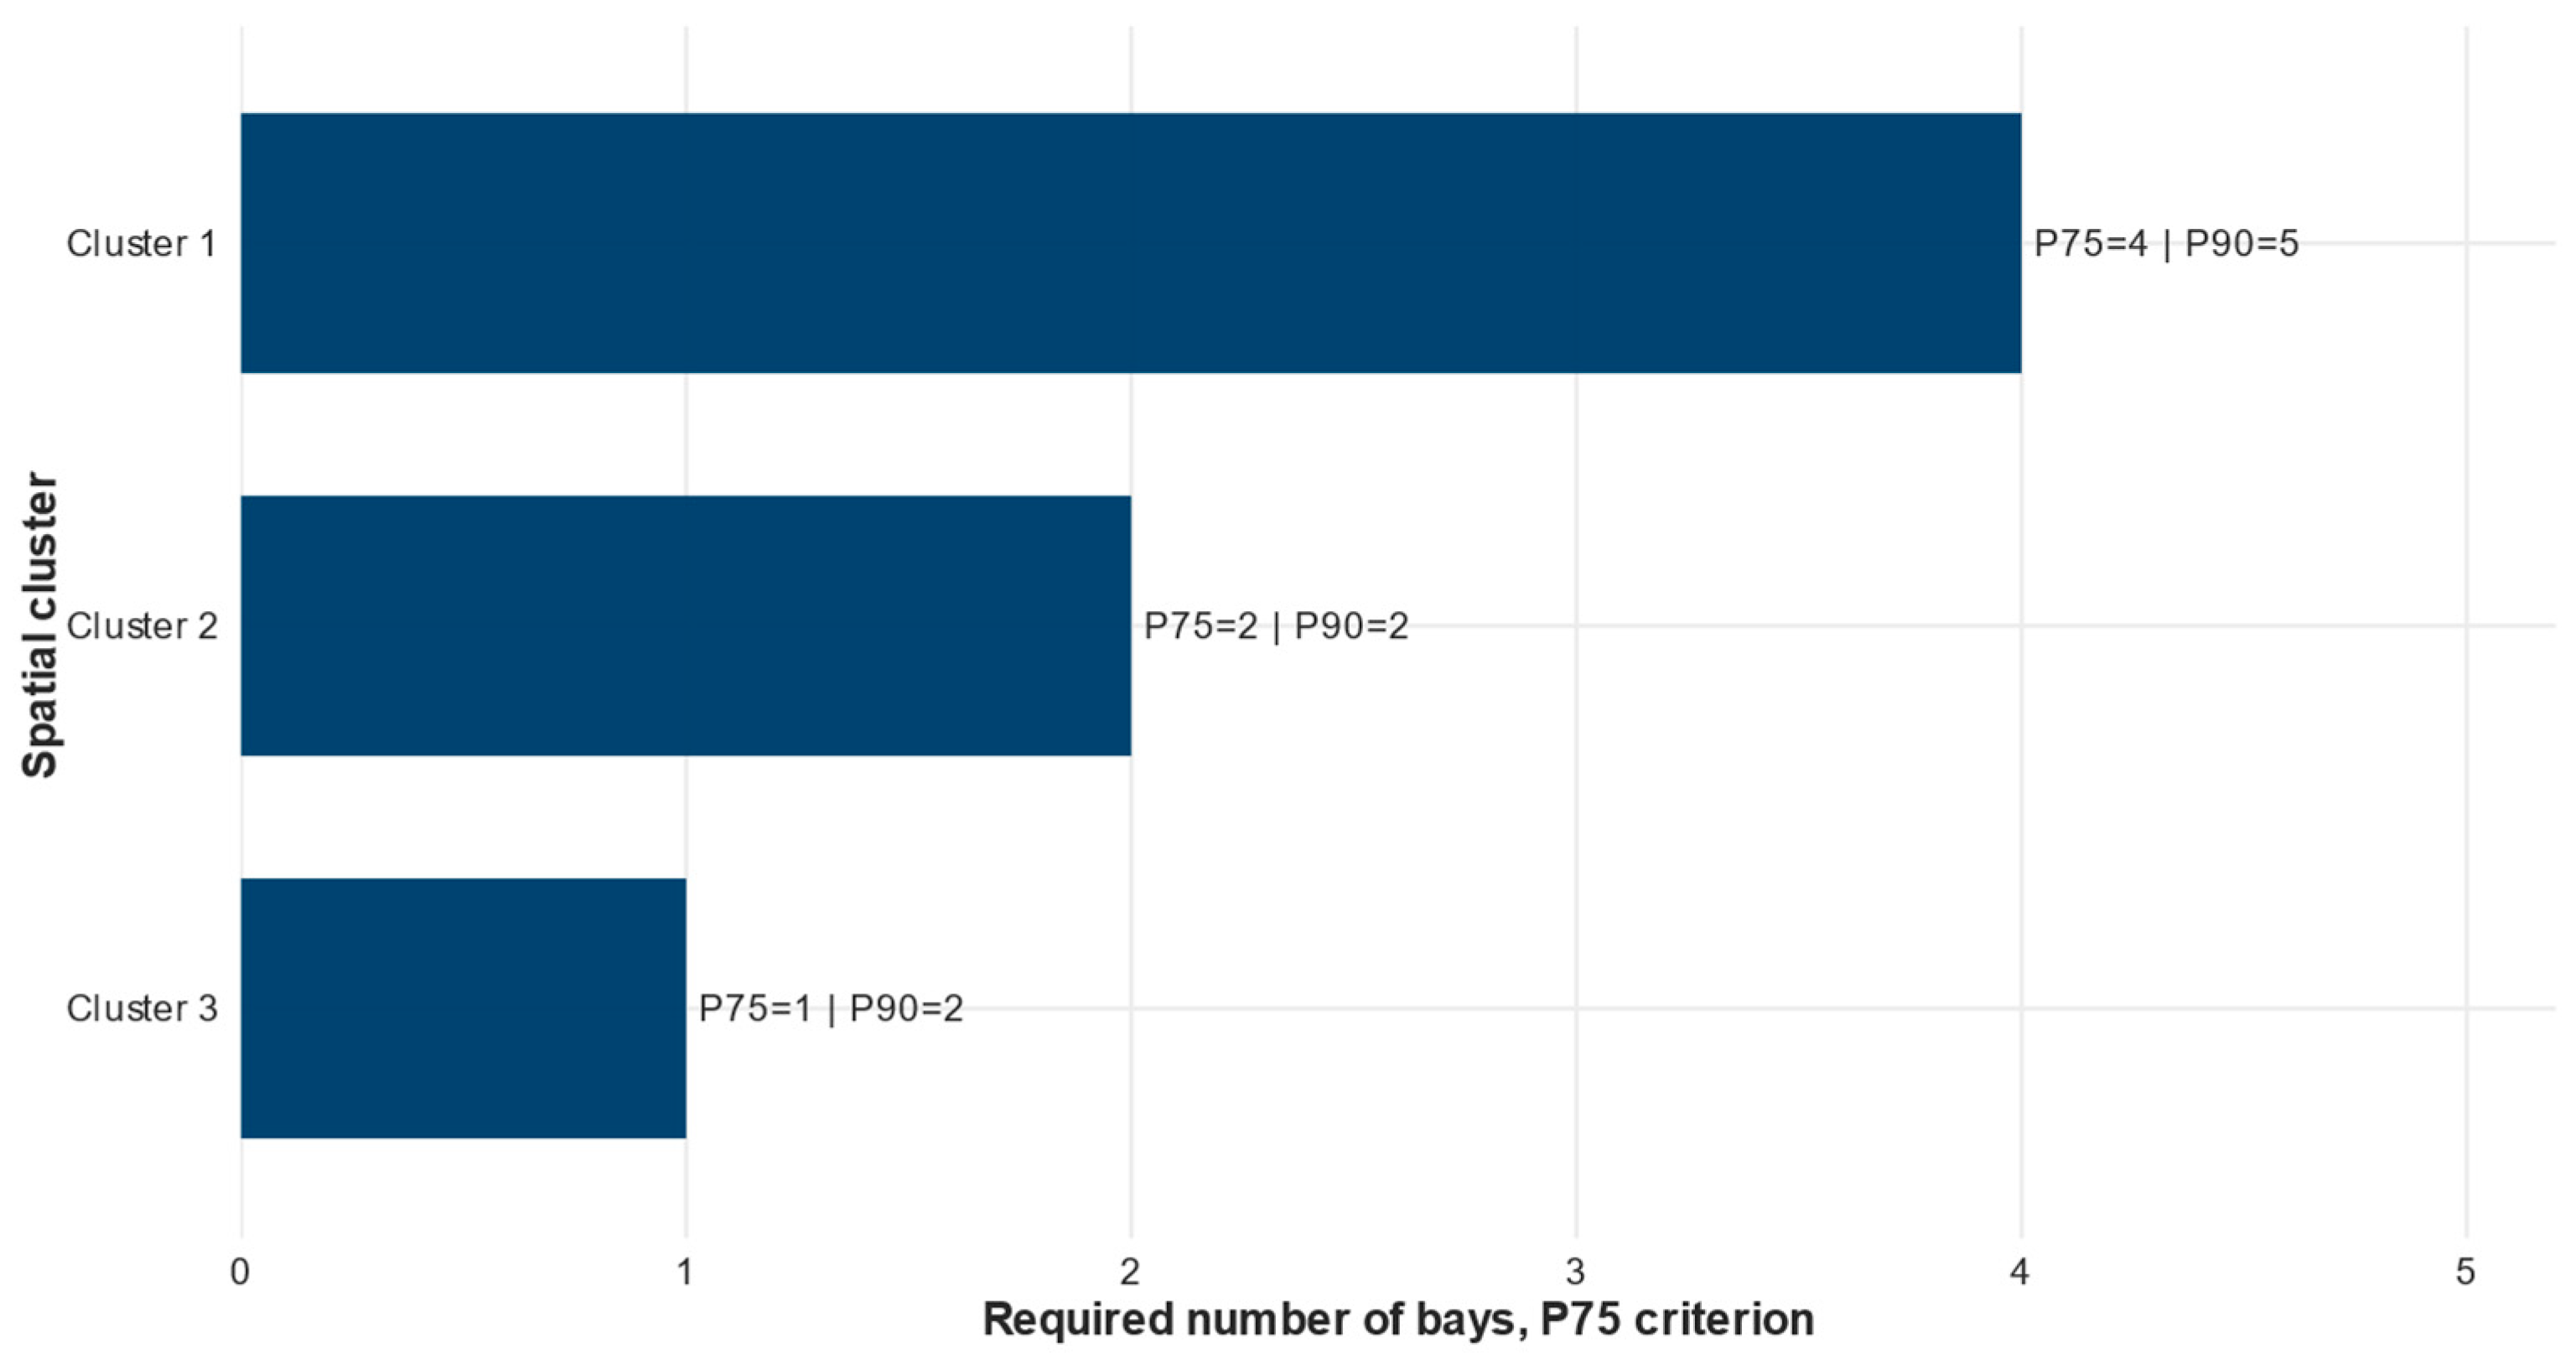
Table 16, the operational scenario shows that Cluster 1 presented an average of 10.48 daily operations and required 4 bays under the P75 criterion and 5 under the P90 criterion. Cluster 2 presented an average of 8.12 daily operations and required 2 bays under P75 and 2 under P90. Cluster 3 presented an average of 3.75 daily operations and required 1 bay under P75 and 2 bays under P90.
The spatial representation of required bays by cluster is presented in
Figure 14. This figure was calculated under the operational scenario, using the P75 criterion and average daily demand by cluster.
The estimated capacity by average observed day is presented in
Table 17. This table maintains the logic of average daily demand by weekday, allowing comparison of operational bay requirements for a typical observed day. This complementary analysis is retained because it provides a temporal reading of bay demand across weekdays and helps distinguish daily operational variation from cluster-based spatial prioritization.
The relationship between clusters and bay requirements is additionally presented in
Figure 15, developed from the cluster-level capacity model based on average daily demand.
3.10. Intervention Scenarios for Sustainable UFD Management
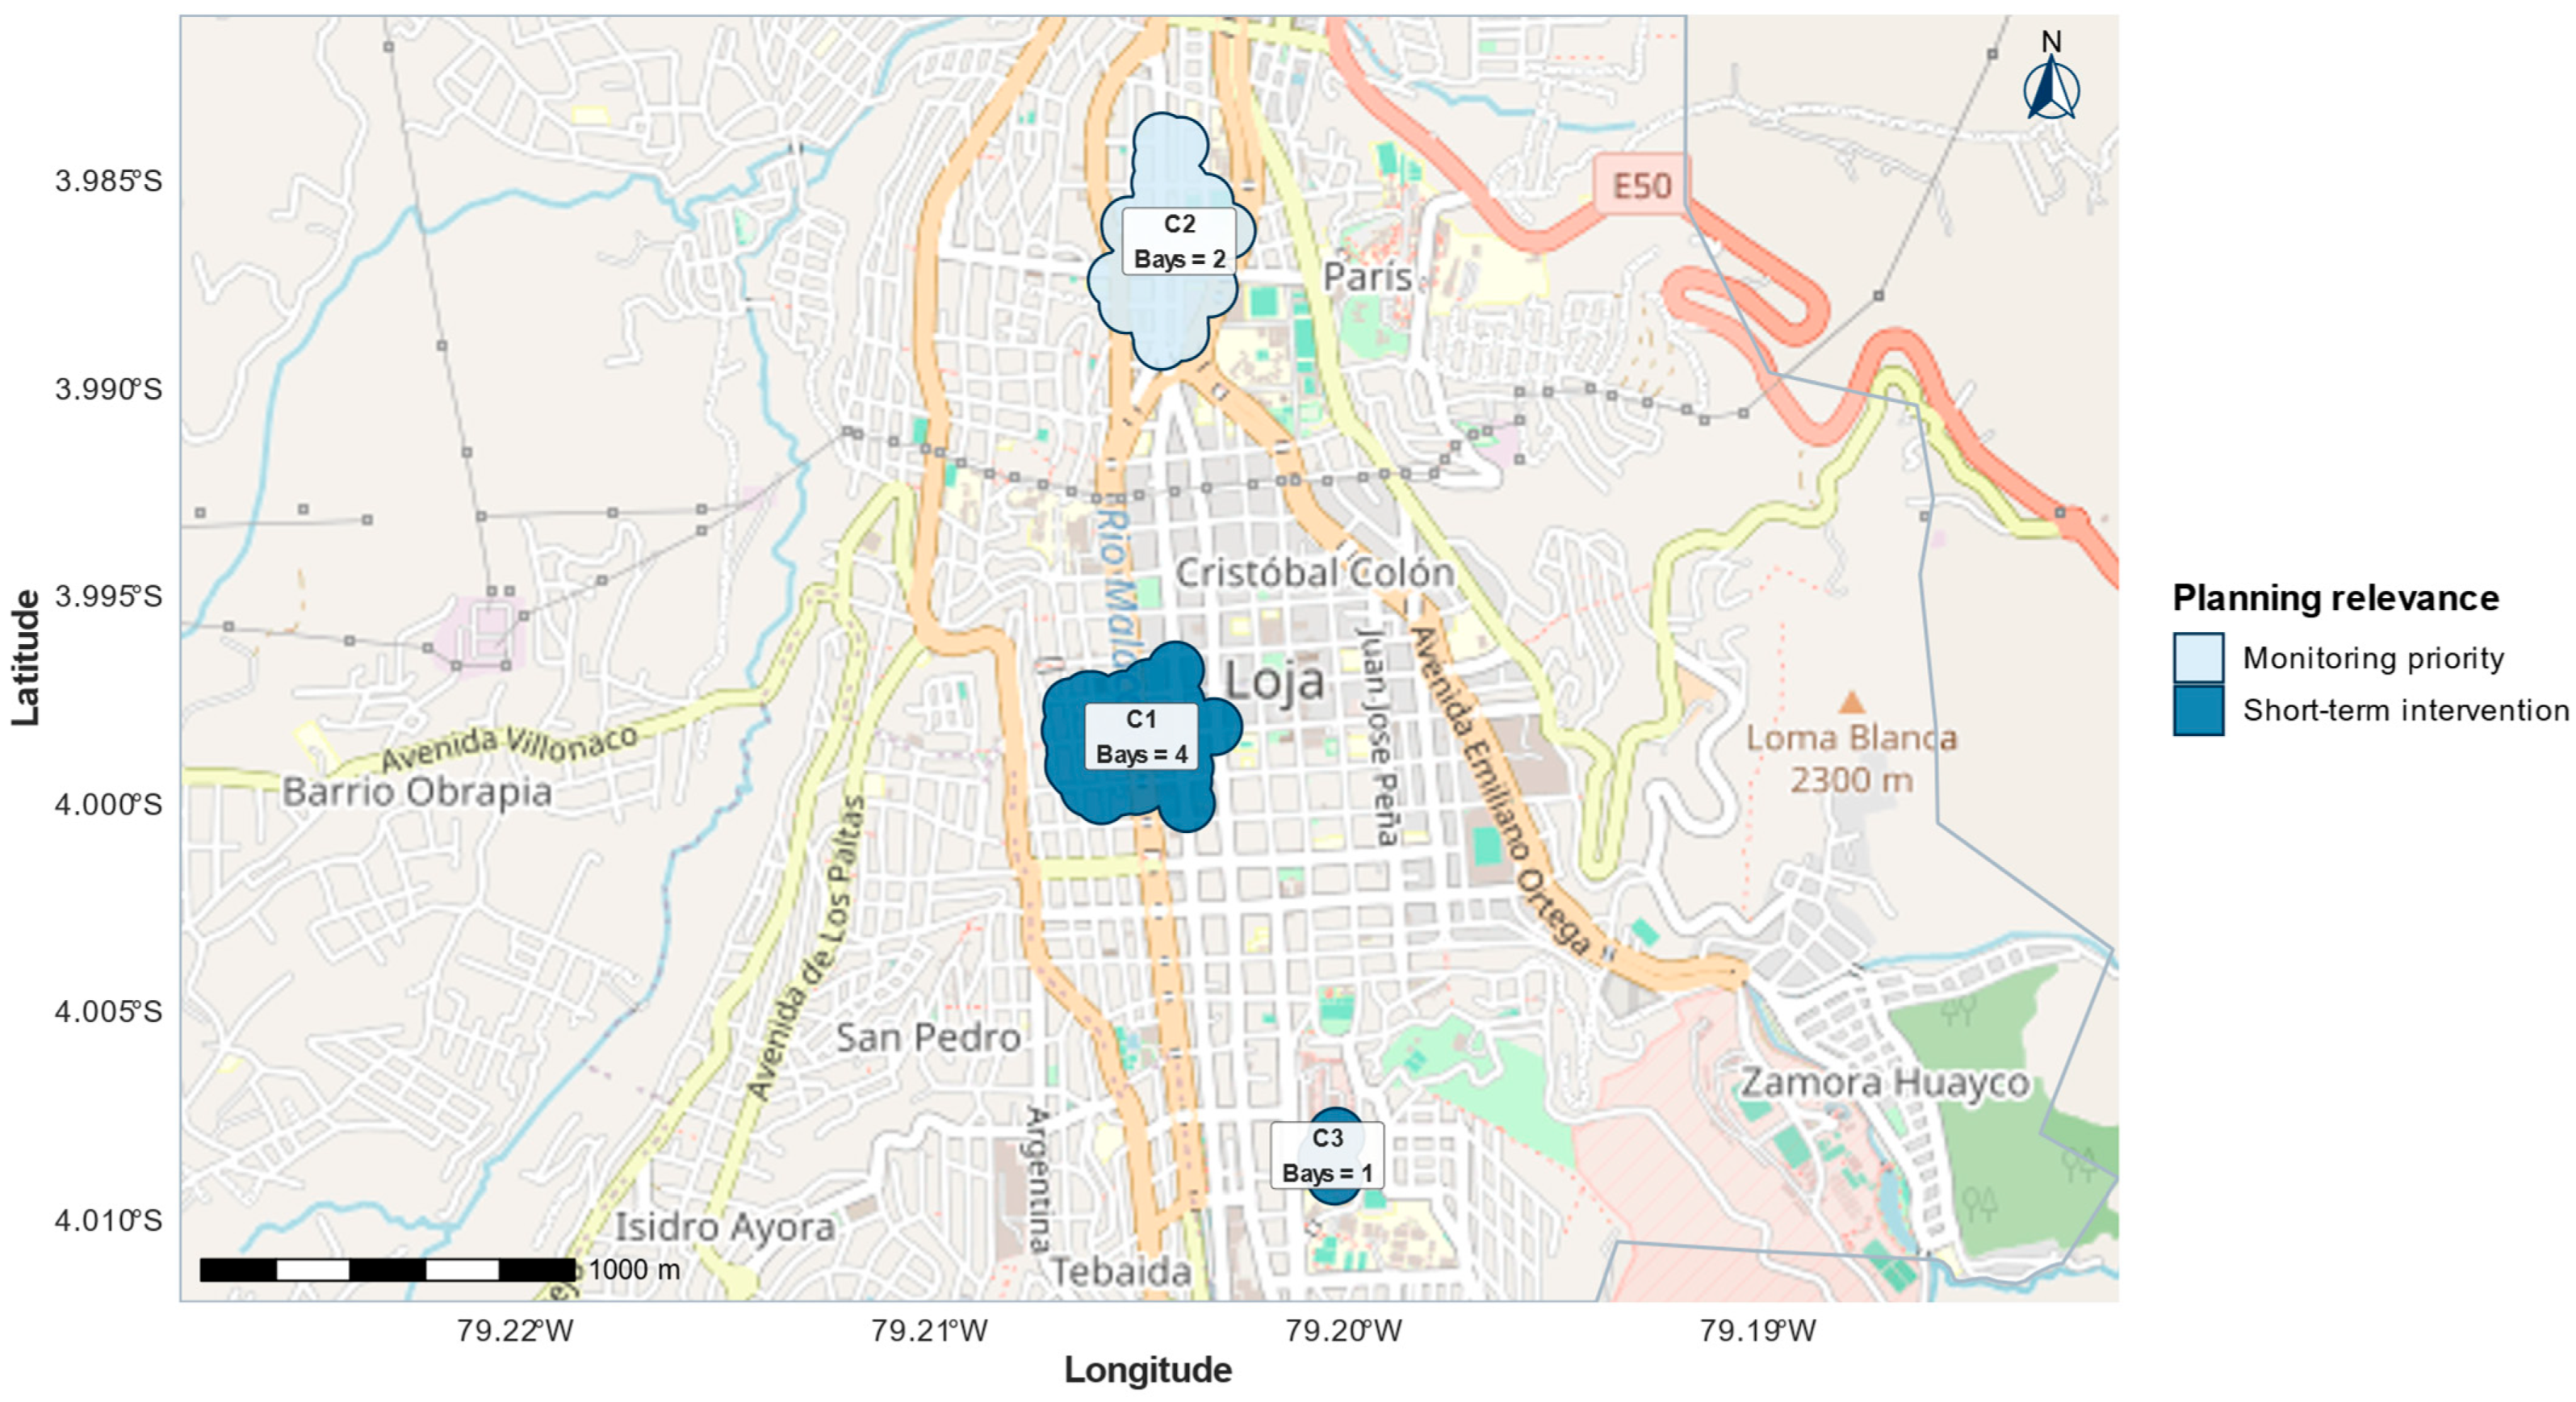
The intervention scenarios were calculated using average daily operations, thereby avoiding infrastructure oversizing based on accumulated demand over the observation period. The prioritization integrated average daily operations, corrected bay requirements, the sustainable transport priority index, the logistics pressure index, conflict rates, informality, critical use of public space, and the main problem identified in each cluster.
Cluster 1 was classified as high priority, with 440 observed operations, an average of 10.48 daily operations, 4 recommended bays, a sustainable transport priority index of 0.523, and a logistics pressure index of 0.703. The associated main problem was pedestrian safety exposure, so the proposed strategy was bay allocation together with operational regulation.
Cluster 3 was also classified as high priority, with 30 observed operations, an average of 3.75 daily operations, 1 recommended bay, a priority index of 0.515, and a logistics pressure index of 0.270. The main problem identified was informal curbside operation; therefore, the proposed strategy was bay allocation and operational regulation.
Cluster 2 was classified as low priority, with 138 observed operations, an average of 8.12 daily operations, 2 recommended bays, a priority index of 0.223, and a logistics pressure index of 0.442. Its main problem was related to vehicular traffic interference, so the strategy was oriented toward low-intensity monitoring and periodic review.
Table 18 summarizes the corrected intervention scenarios by spatial cluster, linking priority level, recommended bays, dominant operational problem, and proposed curbside management strategy. Unlike
Table 17, which reports weekday bay capacity estimates,
Table 18 focuses on cluster-based intervention planning.
The proposed strategies should be interpreted as planning guidelines derived from the observed spatial-operational patterns. In practical terms, implementation may include defining delivery time windows according to the observed temporal concentration of operations, establishing maximum dwell times to improve bay turnover, installing vertical and horizontal signage, coordinating loading/unloading spaces with paid parking management, and applying periodic monitoring to prevent unauthorized occupation. These measures should be validated through local regulation and pilot implementation before permanent deployment.
The spatial representation of the corrected intervention scenarios is presented in
Figure 16, showing the planning relevance of each cluster together with the corrected number of recommended bays.
4. Discussion
4.1. General Interpretation of the Findings
The results show that urban freight distribution in the medium-sized study area presents a highly concentrated operational pattern, with strong dependence on light freight vehicles and direct interaction among supply operations, curbside use, and road space occupation. This configuration confirms that, even in medium-sized cities, UFD is not a marginal activity, but rather a structural component of everyday urban functioning. The final sample of 642 valid operations made it possible to identify that loading and unloading activities are concentrated in specific types of establishments, mainly minimarkets, warehouses, and retail stores, which reveals a direct relationship between the proximity-based commercial structure and logistics pressure on urban space. This pattern is consistent with studies indicating that freight operations in central areas tend to intensify around retail businesses, high-turnover establishments, and zones with limited availability of parking or dedicated loading and unloading spaces [
33,
34]. However, because the sampling strategy was non-probabilistic and based on direct field observations, these findings should be interpreted as evidence of the observed spatial-operational patterns rather than as a statistical representation of all freight movements in Loja. In this sense, the predominance of light trucks and the concentration of operations around everyday commercial establishments suggest that the main logistics pressure in Loja is not generated by large freight vehicles, but by frequent short-distance supply operations that repeatedly occupy curbside and roadway space. This finding is relevant because it shows that medium-sized cities may experience significant UFD pressure even without the large-scale freight flows typically associated with metropolitan areas.
A central finding is that most operations do not take place in areas formally designed for loading and unloading, but rather in mixed-use spaces, mainly paid parking zones and roadways. This suggests that the current system operates through the everyday adaptation of public space, where logistics operators use the available infrastructure even when it was not necessarily designed for logistics purposes. The high share of semi-formal and informal operations reinforces this interpretation, as it shows that the specific supply of loading and unloading zones is limited in relation to the observed demand. Previous studies have shown that the insufficiency or poor location of loading spaces can induce behaviors such as double parking, irregular parking, lane occupation, and conflicts with other users [
35,
36]. In this sense, the results from the study area do not represent an isolated case, but rather a local expression of a widely documented problem in urban curbside management. The fact that paid parking zones and roadways absorbed most observed operations indicates that freight demand is being managed indirectly through spaces intended for other urban functions. Therefore, the problem is not only the limited number of formal loading bays, but also the absence of a specific curbside allocation strategy for freight activity.
The duration of operations also has relevant implications for planning. Although some activities present moderate occupation times, the existence of operations with high durations, expressed in the upper percentiles, indicates that the simple allocation of spaces does not by itself guarantee efficient operation. This result suggests that the problem does not depend only on the number of bays, but also on dwell time, turnover, enforcement, and proximity between the unloading point and the establishment served. The literature on loading zones has shown that the efficiency of these spaces depends on their location, capacity, level of occupancy, permitted duration, and compliance with use regulations [
31,
37]. Therefore, bay planning for the study area should consider not only how many spaces are required, but also under what operational rules and management criteria they will be used. This interpretation also supports the need to treat bay estimation as a preliminary planning approximation, rather than as a final engineering design of curbside infrastructure.
4.2. Implications of Operational Conflicts, Informality, and Public-Space Use for Curbside Management
The proportion of operations with some type of conflict or disruption is one of the most relevant results of the study, because it shows that UFD generates visible impacts on vehicular circulation, pedestrian movement, and the everyday functioning of public space. The presence of vehicular and pedestrian conflicts in similar proportions suggests that the problem is not limited to motorized traffic, but also involves safety, accessibility, and pedestrian continuity conditions. This finding is particularly important in consolidated urban areas, where road sections are often limited and where a loading or unloading operation can simultaneously interfere with traffic lanes, sidewalks, crossings, or access to establishments. Studies on urban freight transport have indicated that competition for road space can generate negative effects on congestion, road safety, and the quality of the urban environment [
38,
39]. Thus, the high conflict rate should be interpreted as evidence of a curbside management problem rather than only as an operational inefficiency. In practical terms, loading and unloading activities are competing with parking, pedestrian circulation, and vehicular movement for the same limited urban space.
The operational informality identified in the study area can be explained by a combination of technical and contextual factors. From a technical perspective, the low proportion of formal loading and unloading zones forces operators to use alternative spaces, such as roadways, sidewalks, taxi zones, or bus stops. From a contextual perspective, the concentration of commercial establishments in the urban center increases supply demand in areas where the space available for parking and maneuvering is limited. This combination of high demand, low availability of specific infrastructure, and absence of differentiated operational regulation creates favorable conditions for the informal occupation of public space. Similar results have been reported in studies on Latin American cities and emerging markets, where loading and unloading operations tend to be resolved through informal practices when curbside planning does not match the real commercial dynamics [
12,
33].
Critical use of public space should be interpreted as an indicator of urban pressure rather than as an isolated violation. In many cases, occupation of the roadway or sidewalk may respond to the lack of nearby functional alternatives, the need to reduce walking time with goods, or the absence of available bays. This situation is consistent with studies showing that the scarcity of loading spaces can produce undesirable operational behaviors, such as illegal parking, circulation in search of space, or stops in unauthorized locations [
36,
40]. However, it should also be considered that the creation of bays without control mechanisms may not solve the problem if these spaces are occupied by unauthorized vehicles or if maximum dwell times are not respected [
41]. Therefore, the results support the need for integrated management that combines infrastructure, regulation, control, and monitoring. In practical terms, this implies that any bay allocation policy should be accompanied by clear time limits, signage, coordination with paid parking areas, enforcement procedures, and periodic monitoring of use. This is particularly relevant because roadway operations mainly affect vehicular circulation, whereas operations in paid parking areas reveal competition between commercial supply and regulated parking. Differentiating these two situations is essential for designing targeted interventions instead of applying a single uniform policy to all curbside conflicts.
4.3. Operational Sustainability Risk and Spatial Prioritization
The operational sustainability risk index made it possible to synthesize dimensions that are often analyzed separately: duration, conflict, informality, critical use of public space, operation during peak periods, and motorization. Its main usefulness does not lie in directly measuring environmental sustainability, but in representing a condition of operational pressure that can guide the identification of critical areas. This distinction is important because it avoids interpreting the index as a measurement of emissions or environmental footprint and instead positions it as an operational indicator of urban exposure. Recent literature recognizes that sustainability indicators in urban freight transport must integrate multiple dimensions and respond to the real availability of field data [
17,
38]. From this perspective, the OSRI constitutes a practical approximation for cities where detailed information on energy consumption, emissions, or vehicle fleets is not always available. Accordingly, the term “operational sustainability risk/pressure” is more accurate than a direct sustainability indicator, since the index does not quantify CO
2 emissions, energy consumption, or environmental exposure. The OSRI therefore contributes to the interpretation of the results by transforming dispersed operational evidence into a comparable prioritization criterion. This is useful for planning because it makes it possible to distinguish areas where logistics activity is not only frequent, but also associated with conflict, informality, and pressure on public space.
The spatial analysis using DBSCAN made it possible to identify that UFD is not homogeneously distributed across the urban area, but is instead concentrated in a few clusters with differentiated operational profiles. Cluster 1 concentrated the largest number of operations and showed high logistics pressure, while Cluster 3, although smaller in volume, presented more critical conditions in terms of informality and public space use. This difference is methodologically relevant because it demonstrates that intervention priority should not depend only on the total number of operations. An area with lower demand may require priority intervention if it combines informality, conflict, critical use of public space, or high operational risk. This result is consistent with recent approaches that propose using spatial data and clustering methods to identify logistics demand zones, stopping points, or conflict areas in urban freight operations [
42,
43]. The sensitivity analysis of the DBSCAN parameters further supports this interpretation, since the 75 m radius provided an intermediate spatial scale between excessive fragmentation at smaller radii and excessive aggregation at larger radii. Nevertheless, the selected radius should be understood as a planning scale adapted to this case study, not as a universal parameter for all UFD applications.
The comparison between the logistics pressure index and the sustainable transport priority index provides a more refined interpretation of the problem. While the former mainly reflects operational intensity and pressure conditions, the latter incorporates sustainability, conflict, and informality dimensions that may modify the intervention hierarchy. Therefore, the fact that two clusters were classified as high priority for different reasons is consistent with the multidimensional nature of UFD. In practical terms, this means that urban management should not apply a homogeneous solution across all clusters, but should instead differentiate strategies according to the dominant problem. The literature on curbside management and urban logistics has shown that the most effective interventions usually combine space allocation, dwell-time limits, enforcement, operational data, and adaptation to local demand [
44]. However, because the LPI and STPI are composite indices based on study-defined weights, their results should be interpreted as relative prioritization outputs. Future applications should test the robustness of these rankings through alternative weighting schemes, expert validation, multicriteria methods, or global sensitivity analysis. This distinction between logistics pressure and sustainable transport priority strengthens the scientific interpretation of the results: Cluster 1 represents a demand-intensive area, whereas Cluster 3 represents a lower-volume but more operationally critical area. Consequently, the framework helps avoid the limitation of prioritizing interventions only according to the number of operations.
4.4. Bay Estimation and Intervention Scenarios
The capacity model constitutes one of the most important technical contributions of the study, because bay requirements were estimated based on average daily operations per cluster, rather than on the accumulated total over the observation period. This methodological decision makes it possible to obtain results that are more compatible with a typical operating day and prevents the proposed infrastructure from responding to aggregated demand that does not necessarily occur on a single day. In applied urban planning studies, this criterion is especially relevant, since the sizing of loading and unloading spaces must represent real operating conditions and not cumulative scenarios that could generate unrealistic or difficult-to-implement recommendations. The literature on the provision of loading spaces indicates that sizing must consider the relationship between demand, occupation time, and available capacity, as well as the physical and regulatory constraints of the urban environment [
31,
35]. In this sense, the model applied in Loja provides an intermediate solution between the empirical description of observed demand and the functional planning of urban logistics infrastructure. Nevertheless, the model should be interpreted as a simplified planning tool. It does not explicitly simulate queuing, real-time peak accumulation, vehicle-size heterogeneity, exact curb supply, walking distance between the vehicle and the establishment, or enforcement behavior. The use of average daily operations is particularly important because it prevents the bay estimation from being inflated by the total number of records accumulated over the extended observation period. As a result, the model provides a more operationally interpretable basis for preliminary planning.
The estimated requirements show that the need for bays is not uniform across clusters or weekdays. Cluster 1 requires greater capacity due to its higher average daily demand and longer operation times, while Clusters 2 and 3 require fewer bays, although they present differentiated operational problems. This combination of demand, duration, and priority helps avoid two frequent errors: assigning infrastructure only where there are more operations or ignoring areas with lower demand but higher informality or conflict. Recent studies on loading zones in emerging markets suggest that their impact depends on correct location, user behavior, and the degree of control over the assigned space [
12]. Therefore, bay planning in the study area should be understood as a curbside management policy and not merely as a specific physical intervention. The assumed 240 min operating window and the productivity factors used in the model should therefore be considered planning assumptions that standardize comparison across clusters, rather than fixed regulatory prescriptions. Their final adjustment would require local validation, pilot testing, and coordination with municipal parking and freight regulations.
The intervention scenarios derived from the analysis make it possible to translate the results into concrete urban decisions. In Cluster 1, priority is associated with high demand, logistics pressure, and pedestrian exposure; therefore, bay allocation should be accompanied by operational regulation and protection of pedestrian flows. In Cluster 3, priority is explained more by informality and critical use of public space than by the volume of operations, suggesting the need to formalize loading points, control the curbside, and guide operators toward regulated spaces. Cluster 2, although it presents relevant daily demand, was classified as low priority, supporting a strategy of monitoring and periodic review. This differentiated approach is consistent with current urban freight management recommendations, which emphasize the need to adapt measures to local conditions and avoid applying uniform policies to different operational realities [
21,
44]. To make these scenarios operational, future implementation should define delivery time windows, maximum dwell times, signage requirements, enforcement mechanisms, coordination with paid parking management, and monitoring indicators for bay occupancy, turnover, and unauthorized use. Thus, the scenarios should be read as differentiated planning responses: Cluster 1 requires capacity and pedestrian-safety measures, Cluster 3 requires formalization and enforcement of curbside use, and Cluster 2 requires monitoring rather than immediate infrastructure expansion.
4.5. Implications for Medium-Sized Latin American Cities
The findings have relevant implications for medium-sized Latin American cities, where transport planning often focuses on passenger mobility and leaves urban logistics in the background. In these contexts, UFD may operate under informal schemes due to the lack of demand inventories, the absence of specialized infrastructure, and limited coordination among authorities, carriers, and commercial establishments. The evidence obtained in Loja shows that a medium-sized city can present problems similar to those of large metropolitan areas, although at a more manageable spatial scale and with opportunities for more targeted intervention. Regional reports have indicated that Latin America and the Caribbean face logistics challenges associated with infrastructure, institutional capacity, digitalization, and coordination, which limit the efficiency and sustainability of urban supply chains [
22]. Therefore, case studies such as Loja can provide useful evidence for designing UFD policies adapted to intermediate cities. However, transferability to other cities should be considered conditional on local validation because freight demand, curbside regulation, land use, enforcement capacity, and commercial structure may vary substantially across urban contexts.
From a technical perspective, the study shows that robust diagnoses can be built from relatively accessible field data. The use of georeferenced surveys, statistical analysis, spatial clusters, and composite indicators makes it possible to transform operational observations into planning criteria. This approach can be replicated in cities with limited resources, provided that systematic surveys and a clear delimitation of the urban area are available. In addition, the integration of maps, indicators, and scenarios facilitates the communication of results to non-specialized decision-makers. In this sense, the study contributes not only to academic knowledge on UFD but also to the development of practical tools for urban management. The main contribution of the framework lies in its integration of field observation, spatial clustering, operational indicators, bay estimation, and intervention scenarios, rather than in any single analytical component considered in isolation.
4.6. Study Limitations
The study presents some limitations that should be considered when interpreting the results. First, the sample corresponds to observed and georeferenced operations within the urban area of Loja, so it does not necessarily represent the entirety of regional, interurban, or long-distance logistics flows associated with the city’s supply system. In addition, the non-probabilistic sampling design limits the possibility of generalizing the results to the full universe of freight operations in Loja. Although the fieldwork intentionally covered weekdays, weekends, normal non-holiday periods, and morning, midday, afternoon, and evening time windows, the sample remains an observational record of captured operations rather than a probabilistic demand survey. Second, the survey was based on direct observation of loading and unloading operations, which makes it possible to characterize real conditions, but does not incorporate detailed information on complete routes, logistics costs, cargo volumes, supplier frequencies, or internal company decisions. Third, the sustainability indicators used are operational proxies and not direct measurements of emissions, energy consumption, noise, or environmental exposure. Therefore, the results should be interpreted as a spatial-operational approximation to logistics pressure and not as a comprehensive environmental assessment.
Another limitation is related to the construction of composite indicators and the assignment of weights. Although the weights were defined based on technical criteria and the operational relevance of the variables, there is always a methodological decision component that may influence the final priority classification. Future analyses could incorporate participatory processes, multicriteria techniques with experts, or more extensive sensitivity analyses to evaluate the stability of the indices. In particular, global sensitivity analysis would allow the influence of alternative weights and model assumptions on priority rankings to be evaluated more rigorously, including both direct effects and interaction effects among variables. Likewise, bay estimation was based on a daily operating window of 240 min and productivity factors defined by scenario, which provides a useful approximation for planning, but could be adjusted if more detailed regulatory information were available regarding permitted schedules, effective turnover, and enforcement levels. Finally, the identification of clusters using DBSCAN depends on the selected radius and minimum number of points, although the study incorporated spatial sensitivity analysis to reduce the arbitrariness of this decision.
A further limitation concerns the logistic model for high operational sustainability risk/pressure. Because some predictors are conceptually related to variables included in the construction of the OSRI, this model should not be interpreted as an independent validation of the index. Instead, it should be understood as an exploratory consistency analysis of the operational conditions associated with high-risk classification. This clarification avoids circular interpretation and reinforces the exploratory nature of the composite index approach.
Finally, the long data collection period may involve changes in traffic conditions, land use, delivery behavior, parking regulation, or urban works. Although the study focused on normal operating conditions and did not intentionally include exceptional events, these possible temporal changes were not modeled as longitudinal effects. Future studies should incorporate temporal controls or stratified sampling designs to assess whether UFD patterns remain stable across years, seasons, or regulatory contexts.
4.7. Future Research Lines
Future research could expand the analysis by incorporating direct environmental variables, such as local emissions, fuel consumption, noise levels, or pedestrian exposure at critical points. It would also be relevant to collect information on complete delivery routes, supply frequency by establishment, type of operator, cargo volume, and walking times from the vehicle to the delivery point. This information would make it possible to integrate logistics efficiency models with urban and environmental impact models. In addition, the use of sensors, cameras, GPS, mobile applications, or bay reservation systems could improve the measurement of occupancy, turnover, and compliance in loading zones. These lines of research would make it possible to move from an observational diagnosis toward dynamic curbside management models.
Another future line of research consists of experimentally evaluating the impact of implementing loading and unloading bays in the prioritized clusters. To this end, before-and-after designs, time-window regulation pilots, signage systems, dwell-time control, or digital reservation platforms could be applied. It would also be relevant to compare the Loja case with other medium-sized cities in Ecuador or Latin America in order to identify common patterns and contextual differences in UFD operations. Finally, the methodological framework could be integrated with participatory processes involving carriers, merchants, municipal authorities, and public space users. In this way, future research could strengthen the transfer of results toward urban policies that are sustainable, operationally feasible, and socially accepted.
Future work should also prioritize robustness testing of the methodological framework. This includes applying global sensitivity analysis to OSRI, LPI, and STPI weights; evaluating alternative DBSCAN parameters and clustering techniques; comparing different bay-capacity assumptions; and validating the proposed intervention scenarios through pilot implementation. These additional analyses would strengthen the evidence base for transferring the framework to other medium-sized cities and for supporting operational decisions in real curbside management contexts.
5. Conclusions
The objective of this study was to develop and apply a spatial-operational framework to characterize urban freight distribution operations in a medium-sized Latin American city, identify patterns of conflict and informality, estimate loading and unloading bay requirements, and prioritize intervention zones for sustainable UFD management in Loja, Ecuador. The results show that loading and unloading operations present a high degree of spatial and operational concentration, with a predominance of light freight vehicles, frequent supply operations to minimarkets, warehouses, and retail stores, and significant use of spaces not specifically designed for urban logistics, such as paid parking areas and roadways. Likewise, a relevant proportion of operations involving vehicular or pedestrian conflicts was identified, confirming that UFD is not only a commercial supply activity but also a factor of pressure on curbside space, traffic circulation, and urban public space. However, these findings should be interpreted within the scope of the observational and non-probabilistic sampling design, which provides evidence on the recorded operations but does not represent a probabilistic estimate of all freight movements in the city.
The spatial analysis made it possible to identify differentiated clusters of logistics activity, with distinct profiles of pressure, informality, conflict, and intervention priority. The corrected bay estimation, based on average daily operations rather than accumulated demand, made it possible to obtain a more operationally consistent approximation of bay requirements for preliminary urban planning, highlighting the need to prioritize interventions in areas with higher logistics pressure or more critical use of public space. The results also show that intervention priority should not depend only on the volume of operations, since areas with lower demand may still require action when informality, conflict, or critical public-space occupation is high. Overall, the study provides a replicable and planning-oriented methodological framework for medium-sized cities that integrates direct observation, georeferenced data, statistical analysis, spatial clusters, composite indicators, and intervention scenarios. These results offer a technical basis for guiding more sustainable, targeted, and context-sensitive loading and unloading management policies, adjusted to real urban operating conditions. Nevertheless, the OSRI, LPI, and STPI should be understood as operational prioritization tools rather than definitive sustainability measurements, and the proposed bay requirements should be validated through local regulation, pilot implementation, enforcement assessment, and future sensitivity analyses before permanent deployment.