Article

Efficiency of Leeward-Side Sand-Control Measures for High Embankments in Desert Regions

School of Civil Engineering, Lanzhou Jiaotong University, Lanzhou 730070, China
*
Author to whom correspondence should be addressed.
Sustainability 2026, 18(12), 6018; https://doi.org/10.3390/su18126018
Submission received: 28 April 2026 / Revised: 8 June 2026 / Accepted: 8 June 2026 / Published: 11 June 2026

Abstract

Wind-blown sand threatens railway safety in arid regions. Existing measures mainly protect the windward side and cannot fully prevent particles from crossing the embankment. These particles can be re-entrained by leeward flows and redeposited on the track. This study combines wind tunnel experiments, large eddy simulation, and field observations to examine leeward-side protection for a high railway embankment. Three configurations are tested: no protection, baffles on the leeward slope, and a checkerboard barrier at the slope toe. The results show clear differences in flow structure and sand transport. Without protection, flow reattaches within 2–3 H (H is the height of the embankment) and near-surface velocity reaches 10–11 m/s. With baffles, reattachment shifts to 3–4 H and velocity decreases to 7–9 m/s. With a checkerboard barrier, reattachment is delayed to 4–5 H and velocity reduces to 4–6 m/s, forming a stable low-velocity zone. Surface shear stress decreases from 0.4–0.5 Pa to 0–0.2 Pa, and particle concentration near the shoulder drops by about one order of magnitude. Particle transport is weakened and deposition concentrates at the slope toe. Subgrade sand accumulation decreases from 350–480 g/min to 170–250 g/min. Field results confirm these trends. The checkerboard barrier effectively limits sand movement and improves deposition stability. The proposed leeward-side protection measures can effectively reduce sand accumulation on railway infrastructure, thereby improving the long-term operational safety, resilience, and sustainability of railways in desert environments under increasing wind–sand hazards.

1. Introduction

Wind-blown sand is one of the most typical natural hazards in arid and semi-arid regions [1,2,3,4]. It affects land surfaces and engineering structures through transport, erosion, and deposition. Under strong winds, sand particles move by saltation, creep, and suspension [5,6,7]. This process leads to land degradation and ecological damage, and poses a serious threat to the safety of transportation infrastructure [8,9,10]. In desert and Gobi regions, sand activity is frequent and intense. The hazard is persistent, widespread, and difficult to control, and has become a key factor restricting the safe operation of regional transport systems [11,12,13,14].
Railways are critical transportation infrastructure and, in desert areas, are continuously exposed to wind-blown sand. The impacts include track burial, ballast contamination, structural erosion, and operational safety risks. Among these, sand accumulation is the most critical issue. Large quantities of transported particles deposit on the track and subgrade surface, increasing maintenance costs and potentially causing track irregularities or even service interruption [15,16,17]. With the rapid expansion of railways in sand-prone regions, the impact of wind-blown sand on safety and efficiency has become increasingly significant. There is a clear need for systematic studies and improved protection strategies. From a sustainability perspective, improving sand-control strategies is essential for reducing maintenance demand, enhancing infrastructure resilience, and ensuring the long-term safe operation of railways in arid regions.
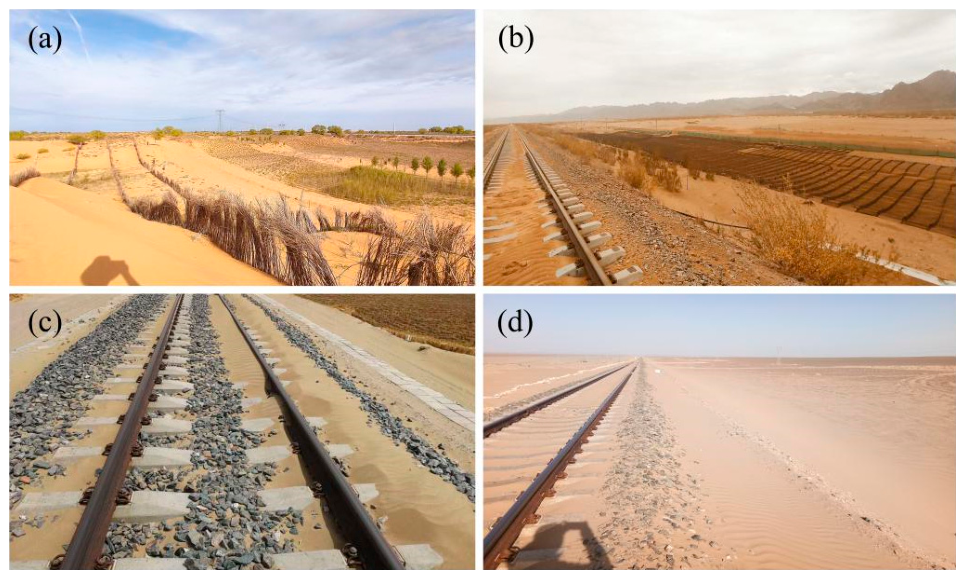
To mitigate sand hazards, mechanical sand-control systems are widely used in practice, including vertical sand fences, checkerboard barriers, and combined structures [18,19,20]. These measures reduce the incoming wind speed and decrease near-surface sand transport, thereby limiting the number of particles entering the railway area [21,22,23]. However, most existing designs focus on the windward side and aim to intercept incoming particles at the front (Figure 1a,b). In actual conditions, wind variability, particle size distribution, and sand supply make complete interception difficult to achieve. Some particles can still pass over the subgrade crest and reach the leeward side. These particles do not simply deposit; rather, they are affected by flow separation, recirculation, and reattachment. Under local turbulent structures, they may be re-entrained and transported back onto the subgrade surface. Field observations have reported this phenomenon in several desert railway sections. Even with multi-level windward protection, significant sand accumulation still occurs on the leeward side and on the track (Figure 1c,d). This indicates that windward protection alone is insufficient, and that the leeward flow structure and its influence on particle motion must also be considered.
Previous studies have mainly focused on wind–sand flow structures, particle transport mechanisms, and the optimization of sand-control measures [24,25,26]. Wind tunnel experiments and numerical simulations have been carried out to examine the effects of single and multiple sand fences on flow and transport processes, and several optimized configurations have been proposed. While these studies have improved the understanding of windward protection, comparatively less attention has been paid to the leeward side after particles pass over obstacles. This gap is more pronounced for high embankments, where the leeward flow is complex, and the processes governing particle re-transport and re-deposition remain unclear. Systematic investigations remain limited.
To address this issue, the present study focuses on high railway embankments in sandy regions. Wind tunnel experiments and numerical simulations are combined to analyze the effects of different leeward-side protection measures on flow structures and particle transport. Three configurations are considered: a single embankment with no protection, an embankment with baffles on the leeward slope, and an embankment with a checkerboard barrier at the slope toe. The evolution of the leeward flow and its influence on particle re-transport and deposition are examined, and the performance of each configuration is evaluated under different wind velocities. In addition, field experiments are conducted on a typical desert railway section to assess the engineering performance of these measures. The findings provide a basis for improving sand-control design for railway systems in arid regions.

2. Materials and Methods

2.1. Wind Tunnel Experiment

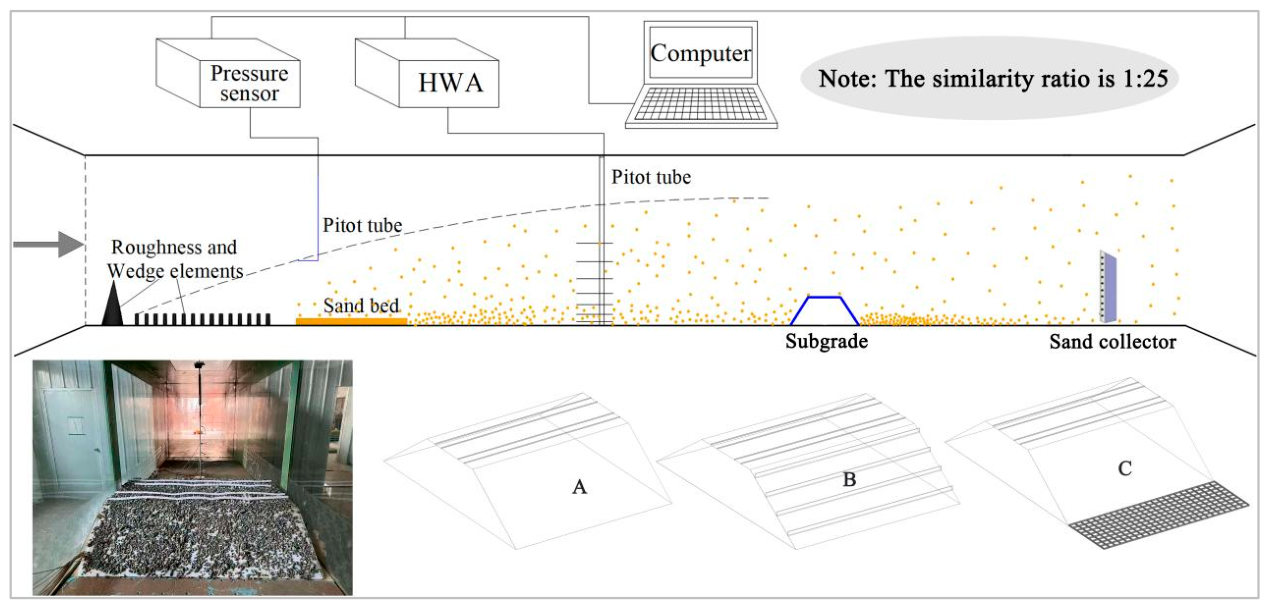
Wind tunnel experiments were conducted in a multifunctional environmental wind tunnel. The experimental setup is shown in Figure 2. To obtain a stable and representative near-surface flow, a wedge and an array of roughness elements were installed at the entrance of the test section. Their height, spacing, and arrangement were adjusted to promote the development of the incoming flow before it reached the test area. A fully developed turbulent boundary layer with a logarithmic velocity profile was achieved. After calibration, the boundary layer thickness was maintained at approximately 0.3–0.4 m, satisfying the similarity requirement that the model height be smaller than the boundary layer thickness. The incoming wind velocity and vertical profiles were measured using Pitot tubes. A reference point was established upstream to monitor flow stability. Multiple measurement points were arranged along the vertical direction in the test section. Wind velocities at different heights were recorded continuously, with each sampling period exceeding 3 min to ensure reliable statistics.
A uniform sand bed was prepared at the upstream section of the test section to serve as the sand supply area. Natural aeolian sand was sieved and evenly distributed with a constant thickness. The surface was leveled and compacted prior to each test to ensure consistent initial conditions. The model area was located downstream of the sand bed. Three configurations were tested: a single embankment with no protection (A), an embankment with multiple baffles on the leeward slope (B), and an embankment with a checkerboard barrier at the slope toe (C). The baffles were uniformly arranged along the slope, while the checkerboard barrier was installed in a regular grid pattern at the slope toe. All models were designed based on geometric similarity, with a scale ratio of 1:25, to ensure the comparability of the flow and particle transport processes.
Wind velocity in the wind tunnel was measured using seven Pitot tubes mounted on a vertical frame at heights of 2.0, 4.0, 7.0, 10.0, 15.0, 20.0, 30.0, and 45.0 cm. The sand collection system was installed downstream of the test section to capture transported particles and calculate sand flux. In addition, sand samples were collected and weighed from different regions of the embankment, including the crest, slope, and slope toe, to determine the spatial distribution of deposition. Prior to the formal experiments, baseline tests were conducted under empty-field conditions to obtain reference wind profiles and sand transport characteristics. Comparative experiments were then performed for the different configurations. The incoming wind velocities were set to 12 m/s and 16 m/s. The experimental sand consisted of natural aeolian sand with a particle size range of 40–500 μm, an average particle size of approximately 200 μm, and a particle density of 2650 kg/m3. The median particle size (d50) was approximately 0.20 mm, the characteristic coarse particle size (d84) was approximately 0.32 mm, and the uniformity coefficient was about 2.1. The sand particle size followed a normal distribution. According to the empty-field wind tunnel tests, the threshold wind velocity of the sand particles was approximately 5–6 m/s, corresponding to a threshold friction velocity of about 0.22–0.25 m/s. To assess experimental repeatability, each test condition was independently repeated three times under identical operating conditions. The reported sand accumulation values represent the mean results, and the corresponding standard deviations were used to quantify the experimental uncertainty.
To evaluate the similarity between the wind tunnel model and the prototype, the Reynolds number was calculated using the embankment height as the characteristic length and an air kinematic viscosity of 1.5 × 10⁻⁵ m2/s. For the wind tunnel model (H = 0.3 m), the Reynolds numbers were approximately 2.4 × 10⁵ and 3.2 × 10⁵ under inflow velocities of 12 m/s and 16 m/s, respectively. For the prototype embankment (H = 7.5 m), the corresponding Reynolds numbers were approximately 6.0 × 10⁶ and 8.0 × 10⁶. Although exact Reynolds number similarity cannot be achieved in wind–sand physical modeling, both the model and prototype fall within the fully turbulent regime (Re > 105). Previous studies have shown that, under such conditions, the main flow structures and dimensionless reattachment characteristics become relatively insensitive to the Reynolds number [27]. Therefore, the wind tunnel model can reasonably reproduce the dominant flow features relevant to the present study.
It should be noted that the wind tunnel experiments cannot fully satisfy all similarity requirements for wind–sand two-phase flow, especially particle-scale similarity. Therefore, the experimental results should not be directly scaled to prototype conditions, but should be used mainly to compare relative trends in flow modification and sand accumulation among different configurations.

2.2. Numerical Simulation

Large eddy simulation (LES) was used to resolve the flow field, allowing for an accurate representation of turbulent structures. Based on the computed flow, particles were released at a specified distance from the inlet, and a Lagrangian particle tracking method was applied to simulate particle trajectories under the three configurations. The governing equations for the fluid phase are given as follows.
Continuity   equation :   u i x i = 0
Momentum   equation :   u i t + u j u i x j = F i 1 ρ p x i + ν 2 u i x j x j ,
where ui denotes the velocity component in direction i; p is the pressure; ρ and v are the fluid density and kinematic viscosity, respectively; and Fi represents the additional body force, expressed as follows:
F i   = 1 ν cell n = 1 n c e l l 1 2 C dp A p | u     u p | u i u pi
where u and up are the air and particle velocities, respectively; Ap is the particle cross-sectional area; Cdp is the particle drag coefficient; ncell is the number of particles in each cell; and vcell is the cell volume.
The LES method decomposes flow variables into resolved large-scale components and subgrid-scale (SGS) components through spatial filtering. The governing equations of LES are given as follows:
t ( ρ u ~ i )   +   x j ( ρ u ~ i u ~ j )   =   p x i + x j ( μ u ~ i x j ) τ ij x j
ρ t + x i ( ρ u ~ i ) = 0
where τij is defined as
τ ij = ρ u i u j ¯ ρ u ~ i u ~ j
where τ i j represents the SGS stress, describing the effect of unresolved small-scale vortices on the resolved large-scale motion in the filtered momentum equations. Because it arises from filtering, it is unknown and must be modeled to close the governing equations. This closure is achieved by expressing the SGS stress in terms of resolved flow variables. Such approaches are referred to as SGS models. In this study, the WALE model is adopted due to its high accuracy and relatively low computational cost. The eddy viscosity is defined as
μ t = ρ L s 2 ( S ij d S ij d ) 3 / 2 ( S - ij S - ij ) 5 / 2 + ( S ij d S ij d ) 5 / 4
L s = min ( κ d , C w V 1 / 3 )
S ij d = 1 2 ( g - ij 2 + g - ji 2 ) 1 3 δ ij g - kk 2 ,   g - ij = u - i x j
where κ = 0.41 is the von Karman constant, and Cw = 0.325.
In wind–sand two-phase flow, particle motion is mainly governed by gravity and aerodynamic drag, which dominate particle dynamics. The net force acting on a sand particle can be expressed as follows:
m p d u p d t = F D + F g
F D = 1 8 C D π D 2 ρ u u p ( u i u p i )
F g = 1 6 π ( ρ p ρ air ) D 3 g
where up is the particle velocity; D is the particle diameter; and ρp is the particle density.
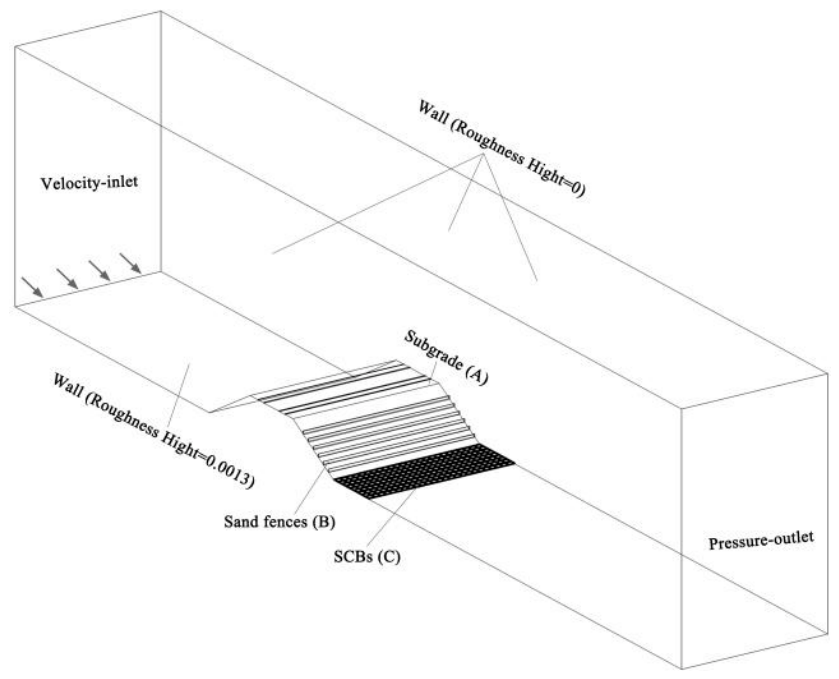
The computational domain was set to 170 m × 25 m × 40 m. The domain and model configuration are shown in Figure 3. A velocity inlet boundary condition was applied at the inlet, and a pressure outlet condition was used at the outlet. All other boundaries were treated as no-slip walls. For the discrete phase model (DPM), the inlet boundary was defined as escape to avoid particle rebound and interference near the inlet. Due to the geometric complexity introduced by the embankment and sand-control structures, a hexahedral mesh was adopted for the entire domain. To improve the accuracy of near-surface flow and particle deposition around the checkerboard structures, refined boundary layer meshes were applied near the wall regions. A total of 15 inflation layers with a growth rate of 1.2 were used, resulting in a final mesh of approximately 25 million cells. Considering the large computational domain and the geometric complexity of the protection structures, a balance between computational accuracy and computational cost was adopted in the mesh design. The area-weighted average y+ value in the near-wall region was approximately 18.4, and more than 90% of the wall surfaces exhibited y+ values between 5 and 30. These values satisfy the near-wall resolution requirements of the WALE subgrid-scale model and provide reliable predictions of near-surface flow structures, wall shear stress, and particle transport processes.
The inflow wind velocities were set to 12 m/s and 16 m/s at a reference height of 10 m. A logarithmic velocity profile was applied at the inlet to represent the near-surface atmospheric boundary layer. The surface roughness length was set to z0 = 0.0013 m. As shown in Formula (13):
v ( h ) = v k ln h z 0
where v is the friction wind speed; k is the von Karman coefficient, which is 0.4; z0 is the length of the rough section; h is the height; v(h) is the wind speed at height h.
The particle phase was modeled using a DPM. Particle sizes ranged from 40 to 500 μm, with a mean diameter of 200 μm. The particle size distribution follows a normal distribution with 20 size groups. Particles were released from the inlet of the computational domain using a uniform area injection method. The inlet and outlet boundary conditions for particles were set as “escape”, while the remaining boundaries were treated as “reflect”. The particle density was set to 2650 kg/m3, and the air density and dynamic viscosity were taken as ρ = 1.225 kg/m3 and 1.789 × 10⁻⁵ Pa·s, respectively.
The transient LES used a fixed time step of 1 × 10⁻⁴ s, with the CFL number kept below 1 in most regions. Before particle release, the flow was simulated for about 10 flow-through times. The first five were used for flow development, and the remaining period was used for statistical averaging. The DPM was solved with one-way coupling, and particle-wall interactions were treated using rebound and trapping conditions. Sufficient particle trajectories were released, and comparisons under different release numbers and time intervals showed stable deposition locations and relative intensities, indicating statistical convergence.
During the simulation, flow parameters fluctuated regularly around stable mean values after the initial development stage, indicating that statistical stationarity was achieved. The residual convergence criterion was set to 10−6, and the reported mean flow fields were obtained by time-averaging over the statistically stable period.
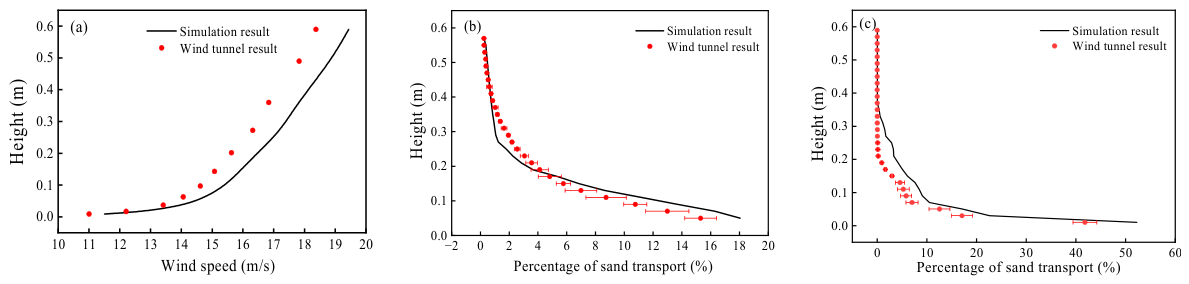
Figure 4 compares the numerical simulation results with the wind tunnel measurements. The computational domain in the numerical simulation was consistent with the wind tunnel experiment, the boundary conditions are shown in Figure 3, and the inflow wind velocity was 12 m/s. Figure 4a shows that wind velocity increases with height. The simulated profile follows the same trend as the experimental data. Good agreement is observed in the middle and upper layers, while slight deviations appear near the surface. Figure 4b shows that sand flux decreases rapidly with height and is mainly concentrated in the near-surface region. The simulation reproduced this trend well and is generally consistent with the measurements. In general, the numerical results capture the wind velocity profile and sand transport characteristics with good accuracy, confirming the reliability of the model. However, direct validation of the leeward wake velocity profiles was limited because the Pitot tubes used in the wind tunnel could not reliably measure reverse flow in the recirculation region. Figure 4c compares the vertical distribution of sand transport at a distance of 5 H on the leeward side of the embankment. The numerical results show good agreement with the wind tunnel measurements, indicating that sand transport is mainly concentrated within the near-surface layer and decreases rapidly with height. This pattern reflects the redistribution of sand particles after passing over the embankment under the combined effects of recirculation and wake flow on the leeward side. The numerical simulation successfully reproduces the vertical variation in sand transport in the leeward region, providing validation for the predicted particle transport characteristics within the wake zone.
It should be noted that, although the particle transport profile on the leeward side was compared with wind tunnel measurements, direct quantitative validation of the wake-flow structure, including velocity distributions within the recirculation region, was not possible due to experimental limitations. Therefore, the flow characteristics in the wake region are primarily based on numerical simulations and should be interpreted accordingly.

3. Results

In this study, the flow structure, reattachment length, vorticity distribution, surface shear stress, and particle transport characteristics were mainly analyzed based on full-scale numerical simulations. The wind tunnel experiments were used to validate the overall wind velocity profiles and sand accumulation trends, rather than to directly extrapolate quantitative reattachment lengths to prototype conditions.

3.1. Analysis of Numerical Simulation Results

3.1.1. Flow-Field Variations Under the Three Structures

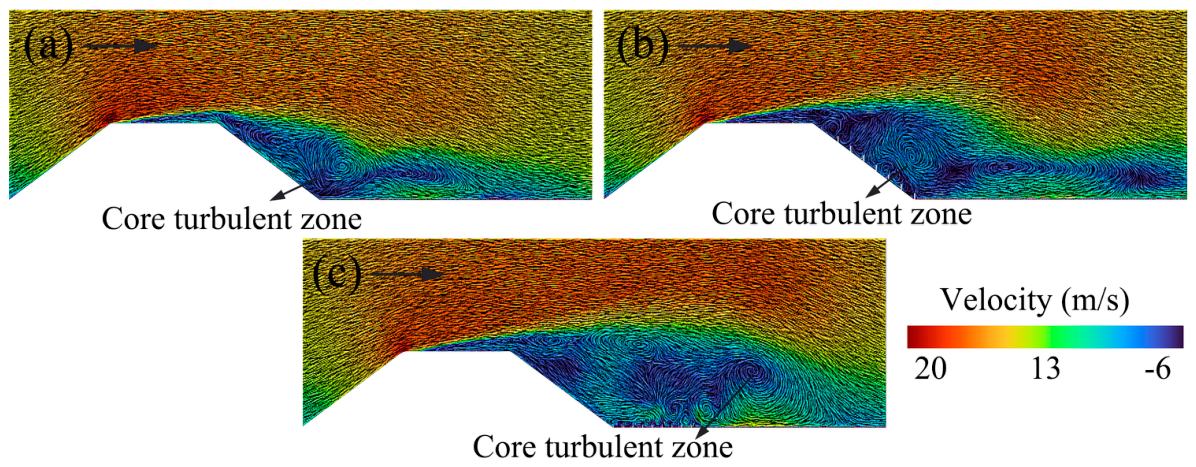
Figure 5 presents the effects of different leeward-side structures on the flow field around the embankment at an incoming wind velocity of 12 m/s. It reflects differences in flow separation and recovery after the flow passes over the crest. Figure 5a shows that, without any protection, the flow separates sharply at the crest and forms a concentrated turbulent core region on the leeward side. The reattachment length is approximately 2–3 H. The near-surface velocity rapidly recovers to about 10–11 m/s, indicating strong momentum recovery. Figure 5b shows that, with multiple baffles installed on the leeward slope, the turbulent core region expands and extends downstream to about 3–4 H. The near-surface velocity decreases to 7–9 m/s, although local velocity recovery still occurs. Figure 5c shows that, with a checkerboard barrier installed at the slope toe, the turbulent core region shifts upward, and the reattachment point is delayed to about 4–5 H. A continuous low-velocity zone forms near the ground, with velocities reduced to 4–6 m/s. The recovery of near-surface flow is clearly suppressed.
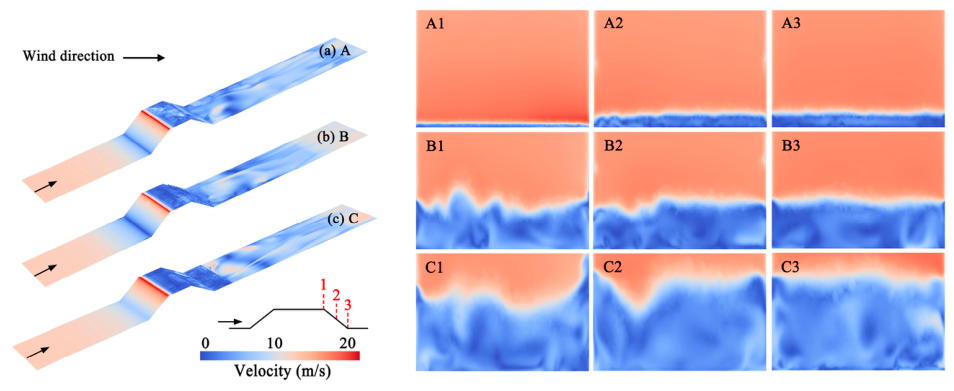
Figure 6 presents the surface flow patterns and the y-z plane distributions at different locations under an incoming wind velocity of 12 m/s, illustrating the spatial evolution of near-surface flow structures. Figure 6a shows the case without any protection. The A1–A3 sections indicate a thin, low-velocity layer near the surface with a relatively smooth interface, suggesting rapid flow recovery after passing over the embankment. Turbulent structures are mainly confined to localized regions, and near-surface disturbances are weak. Figure 6b shows the case with multiple baffles. The B1–B3 sections exhibit a thicker low-velocity region, and the interface becomes more irregular. This indicates that the baffles divide the flow and enhance turbulence, which develops downstream while maintaining overall continuity. Figure 6c shows the case with a checkerboard barrier at the slope toe. The C1–C3 sections reveal a significantly elevated and expanded low-velocity zone. The low-velocity region increases markedly, and local flow structures become more disordered with larger scales, indicating strong suppression of near-surface flow. From locations 1 to 3, the low-velocity zone continues to develop and remains thick downstream. The checkerboard barrier produces the widest and most persistent low-velocity region, leading to enhanced particle deposition.
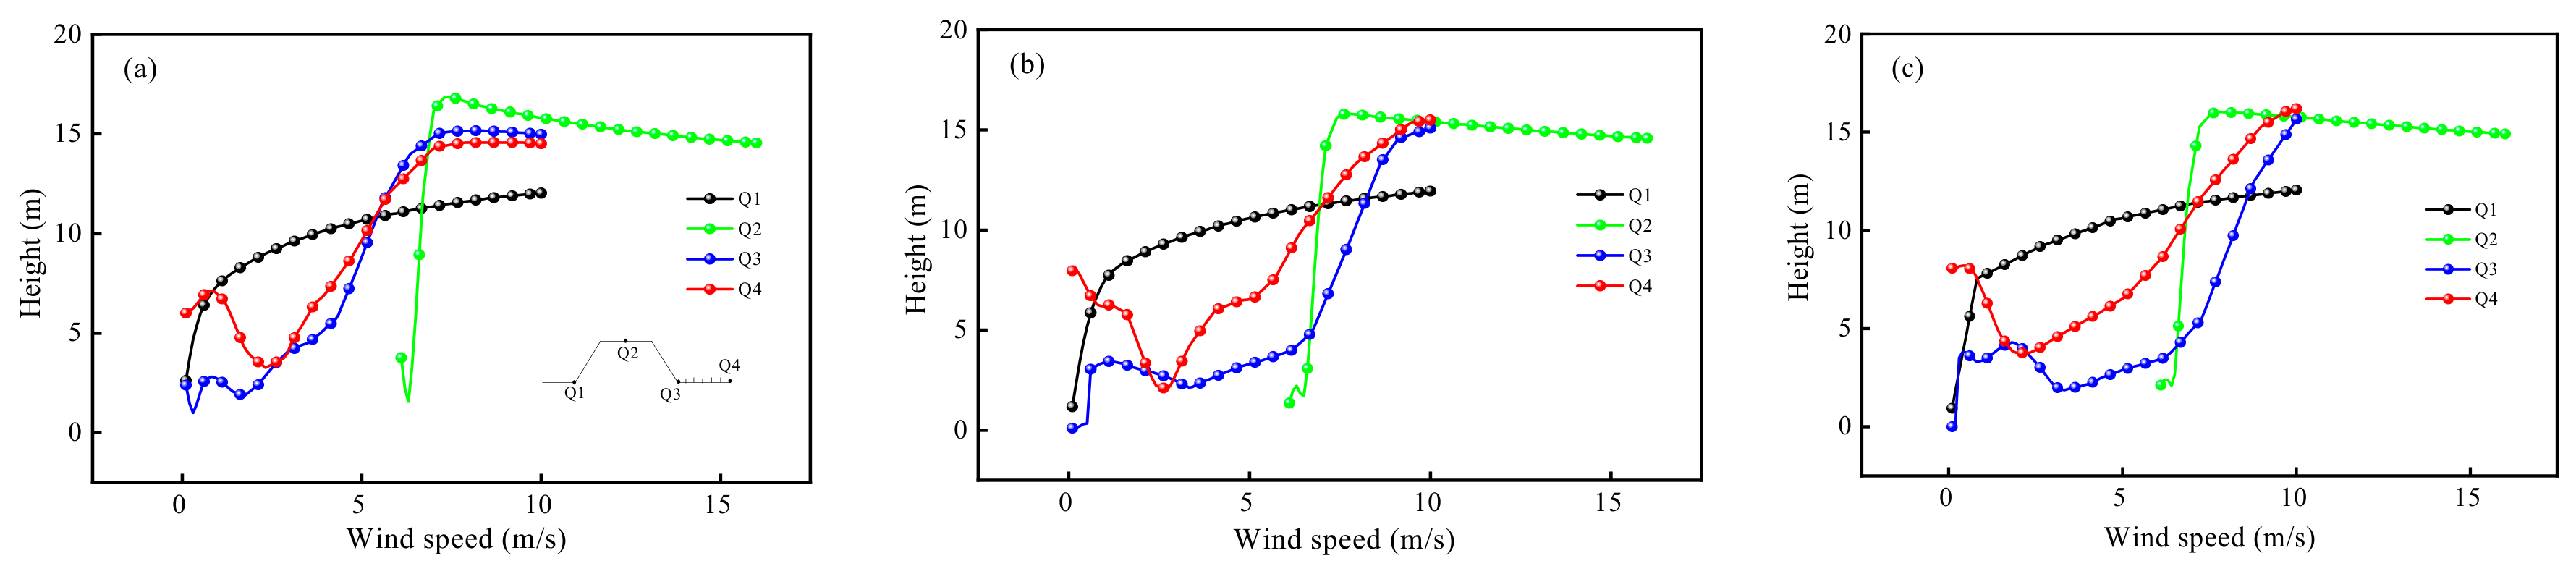
Figure 7 presents the vertical profiles of wind velocity at different locations (Q1–Q4) under the three configurations, highlighting the differences in velocity recovery from the near surface to higher elevations. Figure 7a shows that, without any protection, the wind velocity increases rapidly with height at all locations. At Q3 and Q4, the velocity reaches 14–15 m/s at a height of approximately 6–8 m, which is close to the incoming flow. This indicates fast recovery on the leeward side. A low-velocity zone exists near the surface at Q1 and Q3, but its thickness is limited, with the transition completed within approximately 2–4 m. Figure 7b shows that, with multiple baffles, the recovery process is delayed. At Q3 and Q4, the velocity approaches the incoming flow at a height of approximately 8–10 m. The near-surface low-velocity zone increases to approximately 4–6 m. The profiles also exhibit notable fluctuations, indicating more complex flow structures. Figure 7c shows that, with a checkerboard barrier at the slope toe, the near-surface velocity is significantly reduced. At Q3, the velocity remains below 6 m/s within 0–5 m. The thickness of the low-velocity zone reaches 6–8 m, and the height at which Q4 recovers to the incoming velocity increases to above 10 m.
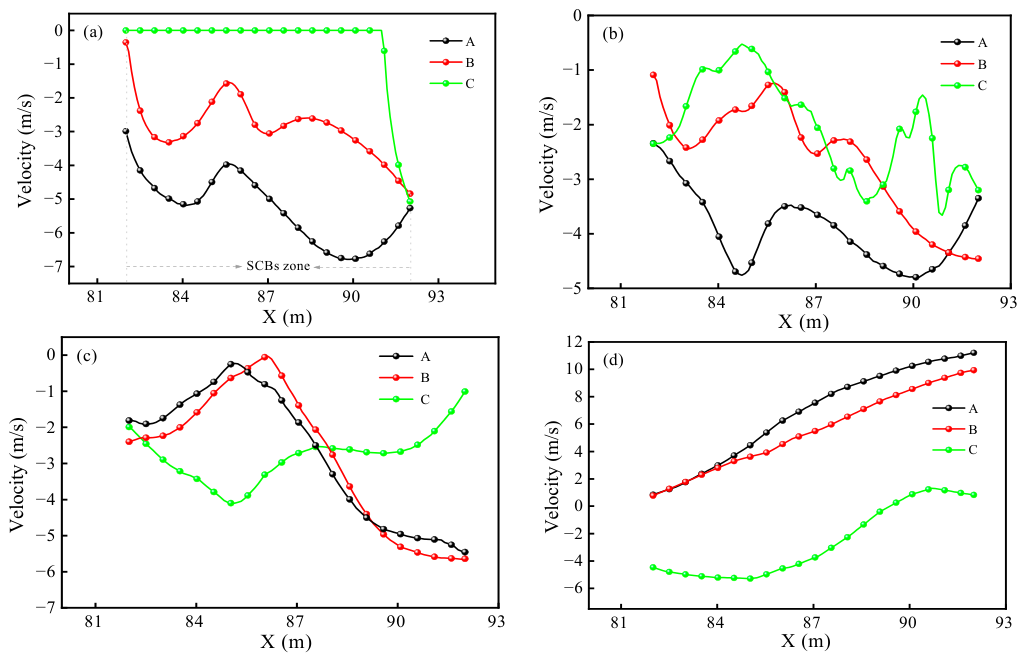
Figure 8 shows the streamwise variation in wind velocity at different heights (0.01 m, 0.5 m, 1 m, and 5 m) on the leeward side under the three configurations, reflecting the recovery process from the near surface to the upper flow. Figure 8a shows that at 0.01 m, the velocity is low and continues to decrease downstream without protection, reaching a minimum of approximately −6.5 m/s. With baffles, the velocity is slightly increased but remains in the range of −2 to −4 m/s. With a checkerboard barrier, the velocity approaches 0 m/s, and local regions become nearly stagnant. Figure 8b shows that at 0.5 m, the differences among configurations are reduced, although stronger fluctuations appear in the checkerboard case, where the velocity remains lower than in the other cases. Figure 8c shows that at 1 m, the velocity gradually recovers and differences further decrease, although the checkerboard case still maintains lower values. Figure 8d shows that at 5 m, the velocity under the no-protection and baffle configurations recovers to approximately 8–11 m/s, while it remains much lower under the checkerboard barrier, at approximately 0–2 m/s.
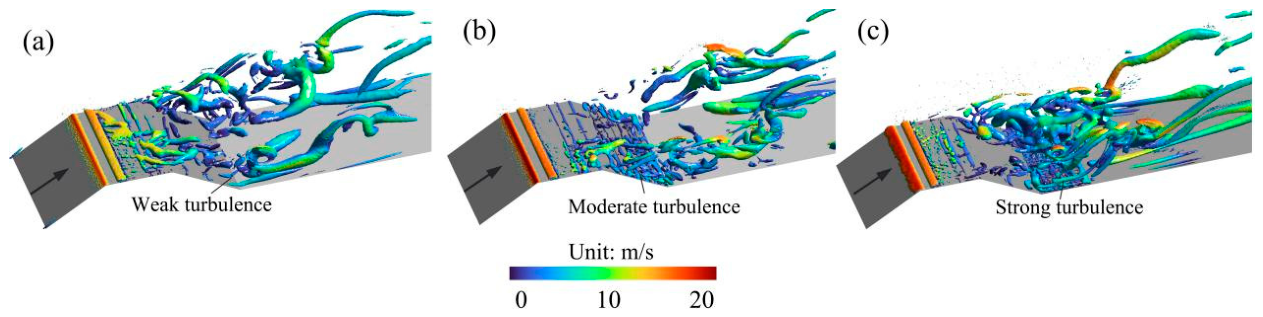
Figure 9 exhibits the vorticity distributions under three configurations at an incoming wind velocity of 12 m/s, reflecting the intensity of three-dimensional flow disturbances and the spatial organization on the leeward side. Figure 9a shows that, without protection, the vortices are relatively large and sparsely distributed, mainly located near the separated shear layer, while few vortices appear near the surface. The overall flow corresponds to a weak turbulence state. Figure 9b shows that, with multiple baffles, the number of vortices increases, with multiple scales observed and local vortex superposition occurring. The vorticity intensity increases and the affected region expands, indicating a moderate turbulence state. Figure 9c shows that, with a checkerboard barrier at the slope toe, a dense and continuous vortex region forms on the leeward side. Small-scale vortices increase significantly and interact with each other. The vorticity distribution becomes more uniform, and the disturbed region extends from the slope to downstream areas, corresponding to a strong turbulence state. This indicates that the checkerboard barrier enhances flow disturbance and modifies the spatial organization of vortical structures. Although the checkerboard barrier generates relatively strong local turbulence, this turbulence mainly consists of small-scale vortical structures, which enhance local energy dissipation and weaken near-surface momentum recovery, thereby suppressing particle re-entrainment.
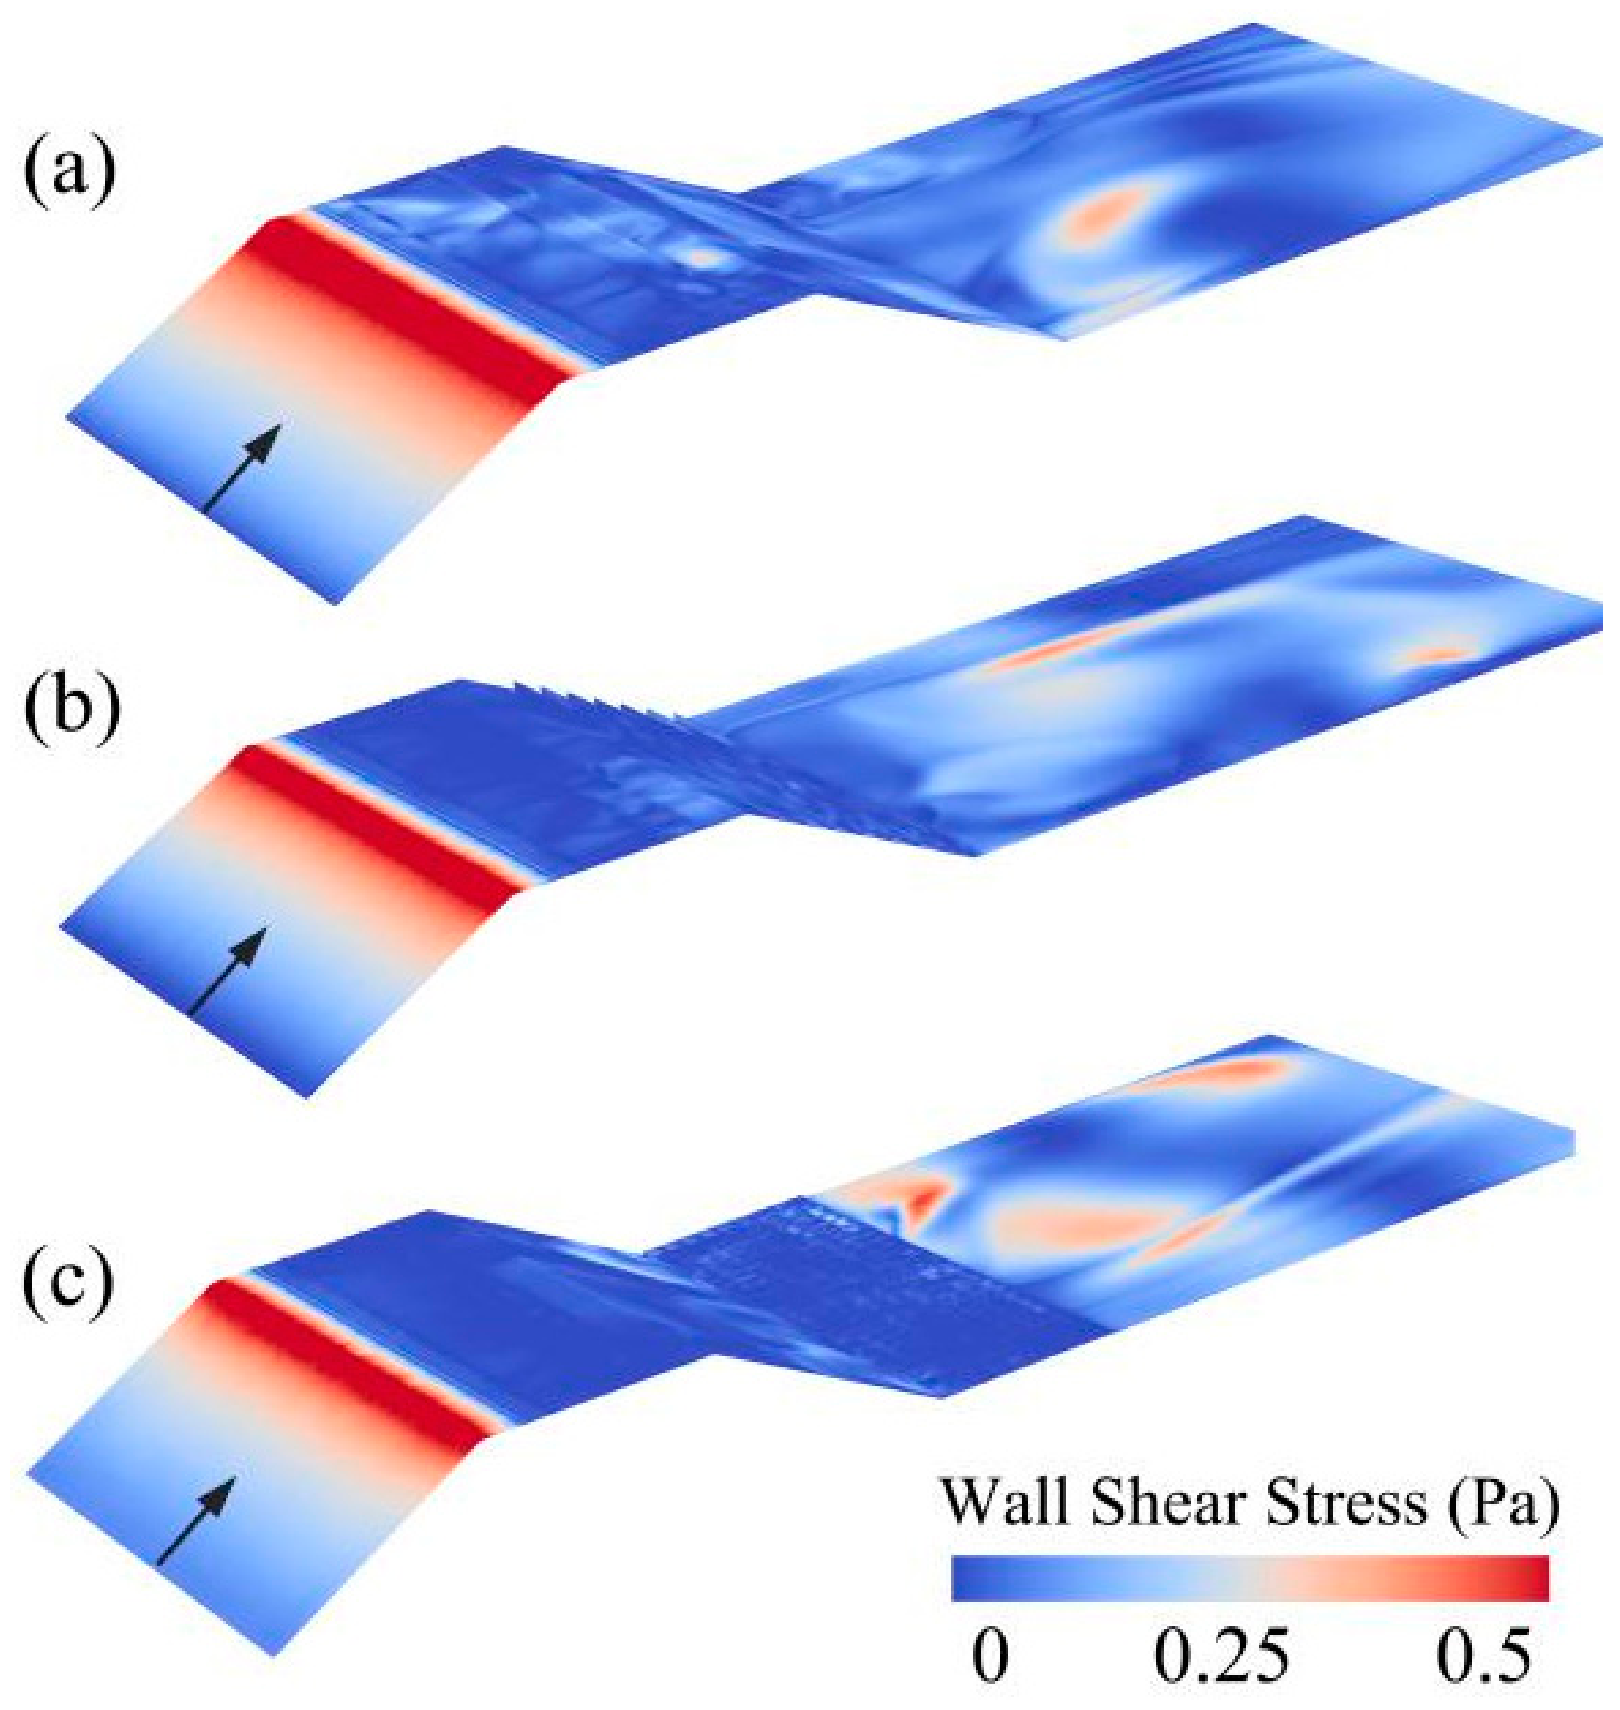
Figure 10 presents the distribution of surface shear stress under the three configurations, reflecting spatial variations in near-surface momentum transfer. For the modeled sand with 200 μm and ρs = 2650 kg/m3, the critical shear stress estimated from the Shields criterion is approximately 0.10–0.16 Pa. Figure 10a shows that, without protection, a continuous high-shear region forms along the leeward slope and slope toe. The local peak reaches approximately 0.4–0.5 Pa, and high values extend downstream. This indicates rapid flow recovery after passing over the crest and strong interaction with the surface. Figure 10b shows that, with multiple baffles, the high-shear region becomes fragmented. The overall level decreases to approximately 0.2–0.35 Pa, although local enhancements still appear between baffles. Figure 10c shows that, with a checkerboard barrier at the slope toe, the surface shear stress is significantly reduced. Most areas remain within 0–0.2 Pa, and high-value regions become sparse and discontinuous. This reduction in near-surface momentum favors particle deposition and stable accumulation.

3.1.2. Sand Deposition Variations Under the Three Structures

Figure 11 reveals the surface particle distributions under the three configurations at an incoming wind velocity of 12 m/s, reflecting the final outcomes of particle transport and deposition under different flow conditions. Figure 11a shows that, without protection, particles on the leeward side are dominated by recirculating motion. They repeatedly move along the slope and slope toe and are lifted back to the subgrade surface under turbulent fluctuations. Figure 11b shows that, with multiple baffles, particles are partially blocked on the slope and exhibit local accumulation. Concentration increases in certain areas, but re-transport still occurs, and the deposition pattern remains discontinuous. Figure 11c shows that, with a checkerboard barrier at the slope toe, particles rapidly settle near the surface and concentrate in the toe region. A continuous high-concentration deposition zone forms, with a stable distribution and increased thickness. Overall, these results are consistent with the flow structures, velocity fields, and shear stress patterns described previously. The checkerboard barrier strongly restricts near-surface flow, suppresses particle re-entrainment, and promotes sustained deposition, leading to the best sand-control performance [16,19].
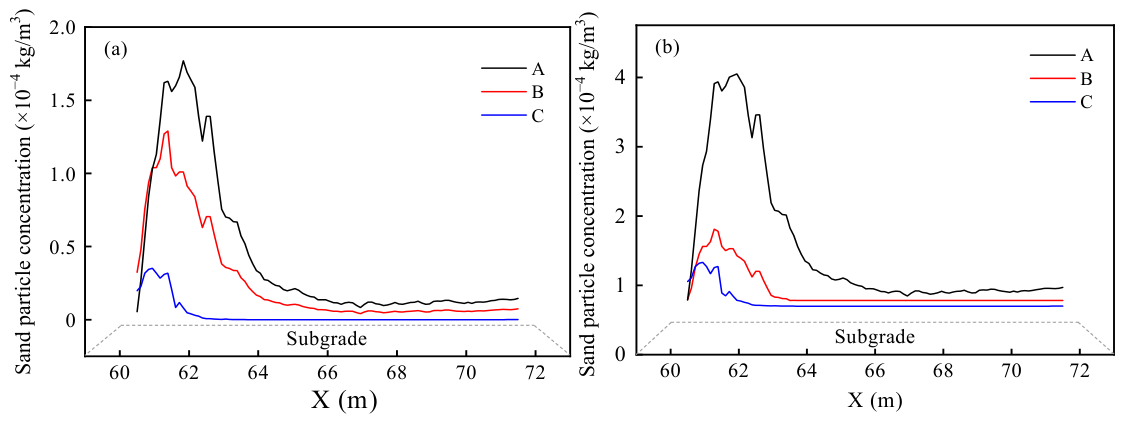
Figure 12 presents the streamwise distributions of particle concentration on the subgrade under two incoming wind velocities, 12 m/s and 16 m/s, illustrating the influence of wind velocity on particle transport and deposition. Figure 12a shows that at 12 m/s, all configurations exhibit a concentration peak near the shoulder (approximately 61–63 m). The highest peak occurs without protection, reaching approximately 1.6 × 10⁻⁴ kg/m3, followed by the baffle case, while the checkerboard barrier has the lowest value, approximately 3 × 10⁻⁴ kg/m3. Downstream, the concentration decreases rapidly, with the fastest decay observed for the checkerboard barrier. Figure 12b shows that at 16 m/s, the overall concentration increases significantly, while the peak location remains similar. However, the peak values under the no-protection and baffle configurations increase sharply, with the baffle case reaching approximately 4 × 10⁻⁴ kg/m3. In contrast, the checkerboard barrier still maintains a relatively low level, approximately 1 × 10⁻⁴ kg/m3. At higher wind velocity, the curves for the configurations with no protection and with baffles maintain higher background concentrations downstream, indicating enhanced particle transport capacity. In contrast, the concentration under the checkerboard barrier rapidly decreases to a stable low level. Overall, increasing wind velocity strengthens particle transport, while the checkerboard barrier effectively reduces peak concentration and limits downstream transport.

3.2. Analysis of Wind Tunnel Results

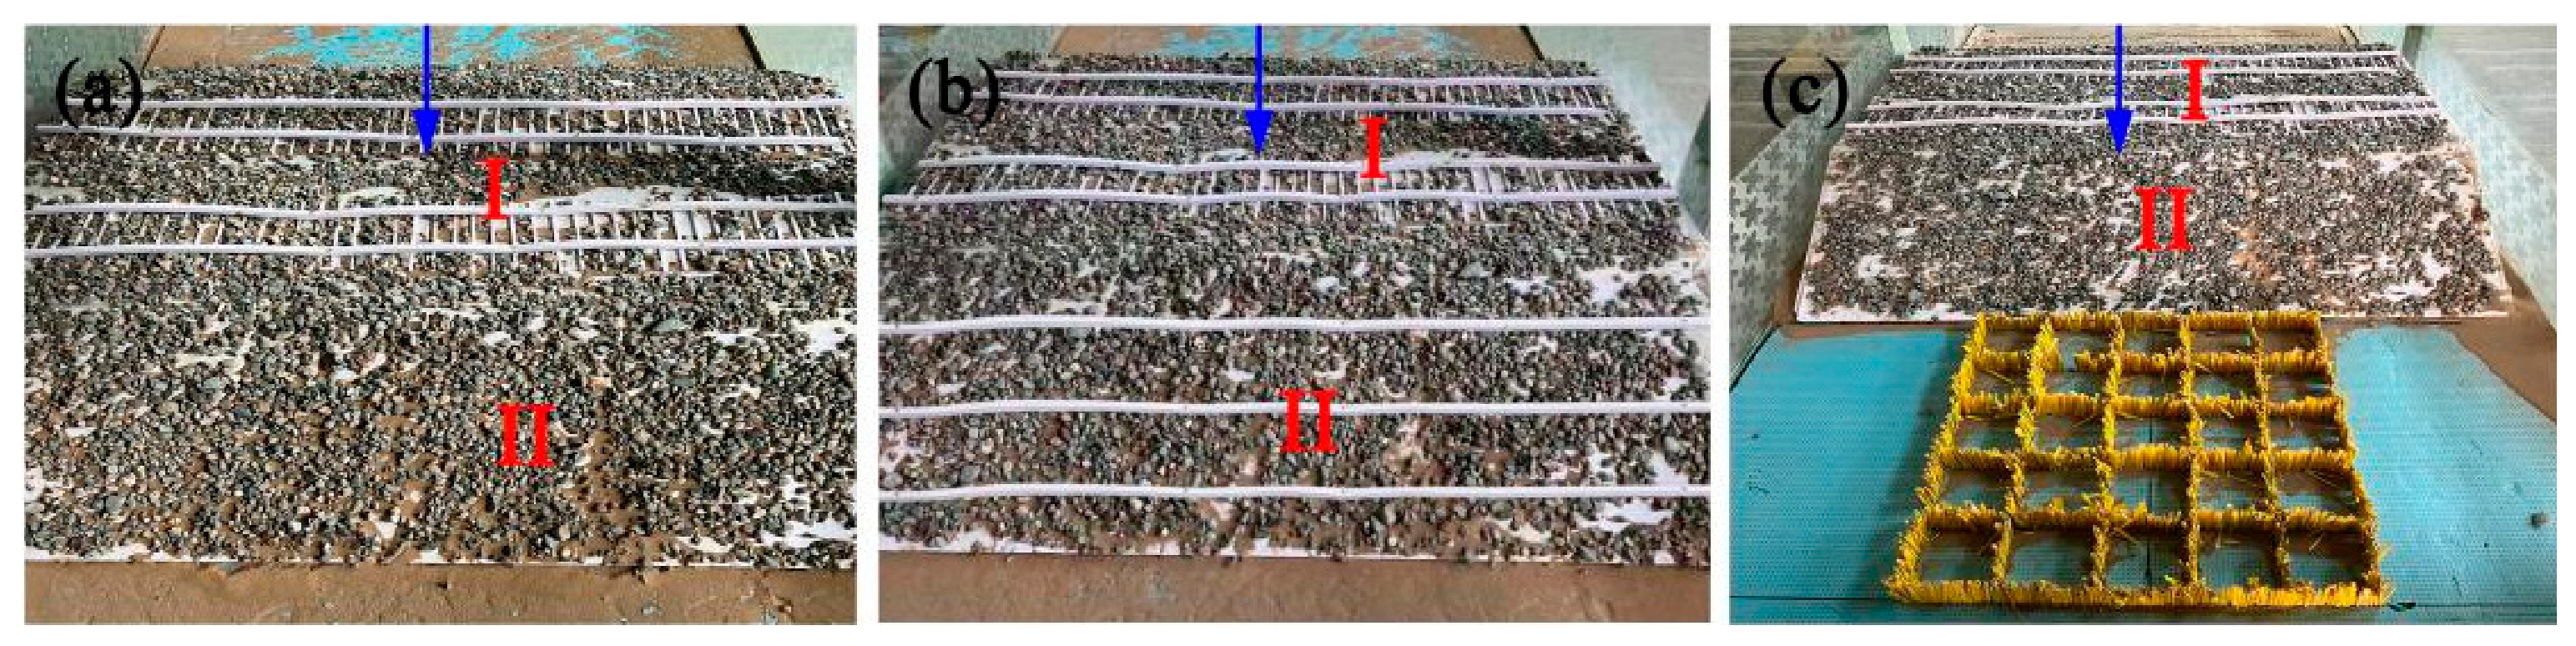
Figure 13 exhibits the sand accumulation patterns under the three configurations in the wind tunnel experiments. Figure 13a shows that, without protection, particles are widely distributed on the leeward side. Thick deposits form at the slope toe, and significant accumulation also appears on the subgrade surface. Figure 13b shows that, with baffles, sand is distributed in strip-like patterns between the barriers. Local retention occurs, but the distribution remains uneven, and sand accumulation on the subgrade is reduced. Figure 13c shows that, with a checkerboard barrier, particles are mainly concentrated within the checkerboard region at the slope toe. Sand accumulation on the subgrade is significantly reduced, indicating the stronger interception and stabilization of particles by the checkerboard barrier.
The sand accumulation measured in the wind tunnel was normalized using the accumulation under the unprotected condition (Structure A) as the reference value. The dimensionless sand accumulation was defined as:
Q = Q i Q A
where Qi is the sand accumulation for each protection structure and QA is that under the unprotected condition. This treatment reduces the influence of scale effects and incomplete similarity in wind–sand two-phase flow experiments.
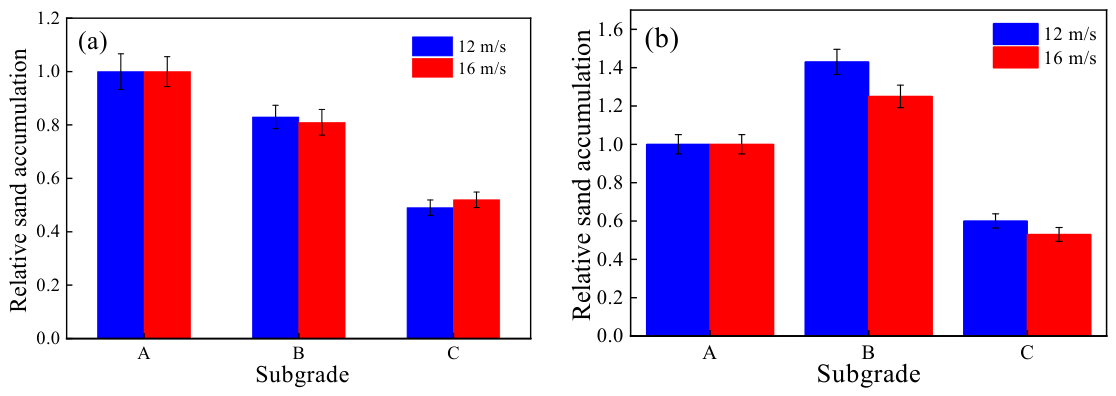
Figure 14 compares the normalized sand accumulation on the subgrade surface (Region I) and the leeward slope (Region II) under the three configurations at wind velocities of 12 m/s and 16 m/s. The accumulation under the unprotected condition (Structure A) was used as the reference value. Figure 14a shows that in Region I, the checkerboard barrier produces the lowest relative accumulation, with normalized values of approximately 0.49 and 0.52 under 12 m/s and 16 m/s, respectively, indicating a significant reduction in particles passing over the embankment crest. The baffle structure shows intermediate values of approximately 0.81–0.83. Figure 14b shows that in Region II, the baffle configuration produces the highest normalized accumulation, reaching approximately 1.25–1.43, indicating enhanced particle deposition on the leeward slope. In contrast, the checkerboard barrier maintains relatively low values of approximately 0.53–0.60. Overall, the checkerboard barrier consistently exhibits the lowest relative accumulation in both regions, demonstrating its effectiveness in suppressing particle transport and reducing leeward-side sand deposition. Each experimental condition was independently repeated three times. The normalized standard deviations are approximately 4.7–6.7%, indicating good repeatability. Since the differences among configurations are substantially larger than the associated uncertainties, the observed deposition trends and the superior performance of the checkerboard barrier are considered reliable.

4. Discussion

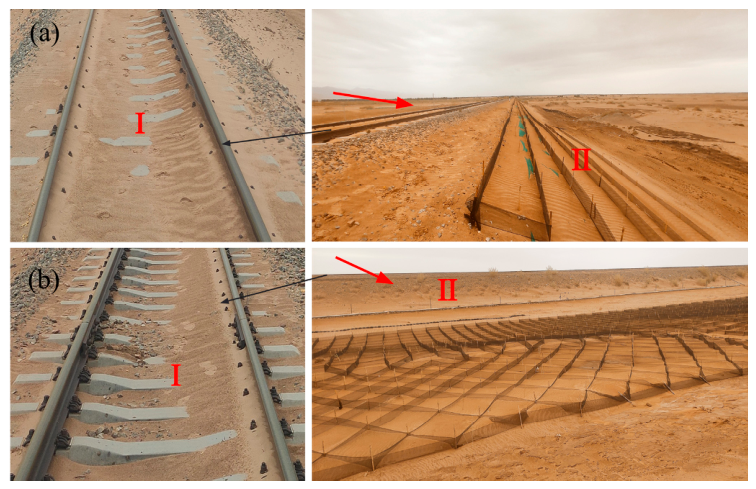
Based on the results of the wind tunnel experiments and numerical simulations, field comparative tests were conducted on a typical desert railway section to evaluate the performance of different leeward-side protection structures. Figure 15 presents the sand accumulation patterns under field conditions. Figure 15a represents the case with multiple baffles installed on the leeward side. Significant sand accumulation is observed on both the track (I) and the leeward slope (II). Particles are continuously distributed between sleepers and on the ballast surface. In some areas, the accumulation thickness is substantial and extends along the railway line, indicating that particles retain strong transport capacity after passing over the embankment and are redistributed on the leeward side. Figure 15b represents the case with a checkerboard barrier installed at the slope toe. Sand is mainly concentrated in the toe region, forming a relatively stable deposition zone. Sand accumulation on the track is greatly reduced, and the spatial distribution becomes more confined. The comparison shows that the checkerboard barrier provides stronger interception and stabilization of near-surface particles and effectively limits their movement toward the track [19]. The field observations are consistent with the wind tunnel and numerical results, supporting the reliability and engineering applicability of the findings.
The engineering applicability of different protection structures is closely associated with local wind–sand conditions and embankment geometry. For high railway embankments in regions characterized by strong winds and abundant sand supply, particles passing over the embankment crest can be re-entrained by the leeward recirculation flow and transported back toward the track area, resulting in persistent sand accumulation [14,17,19]. The field observations presented in Figure 15 further confirm this process. The reattachment lengths obtained in this study are generally consistent with the flow separation characteristics reported for bluff-body and backward-facing step flows, where the reattachment position is strongly influenced by near-surface turbulence intensity and momentum recovery. Although the baffle structure can partially reduce near-surface wind velocity, local vortex structures and high-shear regions remain between the baffles, leading to unstable deposition patterns under strong wind conditions [19].
In contrast, the checkerboard barrier generates dense small-scale vortical structures near the surface, which enhance local turbulent dissipation and reduce the coherence of the recirculation flow. As a result, although the turbulence intensity increases locally, the near-surface mean velocity and shear stress decrease significantly, thereby weakening particle re-entrainment and promoting stable deposition at the slope toe. Similar flow regulation and sediment trapping effects have also been reported in previous studies on straw checkerboard barriers [19,21]. Therefore, the checkerboard barrier is more suitable for railway sections exposed to sustained wind–sand activity. However, the conclusions of this study are mainly applicable to high embankments in relatively flat desert environments, and the protective performance of the proposed structures may vary under complex terrain or multidirectional wind conditions. In addition, although the vertical sand transport profile at 5 H on the leeward side was validated against wind tunnel measurements, direct quantitative validation of the wake-flow velocity field remains limited because reverse flow in the recirculation region could not be reliably measured. Therefore, the wake-flow structures and reattachment characteristics discussed in this study are mainly derived from numerical simulations.
Under future climate change, more frequent extreme wind events may further increase railway sand hazards, making leeward-side protection important for improving infrastructure resilience in desert regions.

5. Conclusions

This study combined wind tunnel experiments, numerical simulations, and field observations to investigate the effects of different leeward-side protection structures on airflow behavior and sand accumulation. The main conclusions are as follows.
(1)
Leeward-side sand accumulation on high embankments is mainly controlled by flow reattachment and near-surface momentum recovery. Without protection, large-scale recirculation causes reattachment within 2–3 H and near-surface velocities of 10–11 m/s. Baffles delay reattachment to 3–4 H but still generate local high-shear regions. In contrast, the checkerboard barrier delays reattachment to 4–5 H and reduces near-surface velocity to 4–6 m/s, weakening momentum recovery on the leeward side.
(2)
The checkerboard barrier improves protection by restructuring the near-surface flow field. Dense small-scale vortices enhance turbulent dissipation and disrupt coherent recirculation. Although local turbulence intensity increases, surface shear stress decreases from 0.4–0.5 Pa to 0–0.2 Pa, close to or below the threshold for particle initiation (0.10–0.16 Pa), thereby suppressing particle re-entrainment and promoting stable deposition near the slope toe.
(3)
Particle deposition gradually changes from wide and unstable accumulation on the leeward side and subgrade to localized stable deposition near the slope toe. With the checkerboard barrier, subgrade sand accumulation decreases from about 350–480 g/min to 170–250 g/min. Field observations generally agree with the wind tunnel and numerical results, confirming the engineering applicability of the checkerboard barrier for high railway embankments in desert regions.
The conclusions are mainly applicable to high embankments in relatively flat desert environments with prevailing winds nearly perpendicular to the railway. However, the wake-flow structures and reattachment characteristics are mainly derived from numerical simulations because direct quantitative validation of the wake-flow velocity field remains limited. They support the sustainable design and maintenance of railway sand-control systems by improving infrastructure resilience and operational safety. Future work should address wind-direction effects, barrier spacing optimization, advanced wake-flow measurements, and long-term field monitoring under complex terrain and extreme sandstorm conditions.

Author Contributions

G.X.: Writing—original draft (equal); Writing—review and editing (equal). Y.D. and Z.Y.: Data curation (equal) and Formal analysis (equal). J.X.: Investigation. W.W.: Investigation (equal). All authors have read and agreed to the published version of the manuscript.

Funding

This work is supported by the National Natural Science Foundation of china (Grant Nos. 12302511, 12562037 and 52562051), the Foundation of TianYou Cultivation of Talents Support Program of Lanzhou Jiaotong University, Key Project of the Joint Fund for Railway Basic Research of the National Natural Science Foundation of China (U2568210), Key Research Project of China State Railway Group Co., Ltd. (N2023X050), and Central Government-Guided Local Science and Technology Development Fund Project (24ZYQA044).

Institutional Review Board Statement

Not applicable.

Informed Consent Statement

Not applicable.

Data Availability Statement

The data that support the findings of this study are available from the corresponding author upon reasonable request.

Acknowledgments

No generative artificial intelligence tools were used in the preparation of this manuscript.

Conflicts of Interest

This study received funding from China State Railway Group Co., Ltd. The funder had no role in the design of the study; in the collection, analysis, or interpretation of data; in the writing of the manuscript; or in the decision to publish the results. The authors declare no conflicts of interest relevant to this study.

References

  1. Bagnold, R.A. The Physics of Blown Sand and Desert Dunes; Methuen: London, UK, 1941; pp. 1–30. [Google Scholar]
  2. Lorenzo, R.; Luca, B. Windblown sand mitigation along railway megaprojects: A comparative study. Struct. Eng. Int. 2020, 30, 355–364. [Google Scholar] [CrossRef] [Scilit]
  3. Kok, J.F.; Parteli, E.J.R.; Michaels, T.I.; Karam, D.B. The physics of wind-blown sand and dust. Rep. Prog. Phys. 2012, 75, 106901. [Google Scholar] [CrossRef] [Scilit] [PubMed]
  4. Wang, T.; Qu, J.J.; Niu, Q.H. Comparative study of the shelter efficacy of straw checkerboard barriers and rocky checkerboard barriers in a wind tunnel. Aeolian Res. 2020, 43, 100574. [Google Scholar] [CrossRef] [Scilit]
  5. Cheng, J.J.; Jiang, F.Q.; Xue, C.X.; Xin, G.W.; Li, K.C.; Yang, Y.H. Characteristics of the disastrous wind-sand environment along railways in the Gobi area of Xinjiang, China. Atmos. Environ. 2015, 102, 344–354. [Google Scholar] [CrossRef] [Scilit]
  6. Zhang, K.; Qu, J.; Yu, Y.; Han, Q.; Wang, T.; An, Z.; Hu, F. Research progress on wind-sand prevention along China railway. Adv. Earth Sci. 2019, 34, 573–583. [Google Scholar]
  7. Huang, N.; Xia, X.; Tong, D. Numerical simulation of wind sand movement in straw checkerboard barriers. Eur. Phys. J. E 2013, 36, 99. [Google Scholar] [CrossRef] [Scilit]
  8. Cheng, J.J.; Lei, J.Q.; Li, S.Y.; Wang, H.F. Disturbance of the inclined inserting-type sand fence to wind-sand flow fields and its sand control characteristics. Aeolian Res. 2016, 21, 139–150. [Google Scholar] [CrossRef] [Scilit]
  9. An, Y.; Cheng, J.; Ding, L.; Chen, B.; Gao, L.; Lei, J.; Zhen, Z. Evolution law of wind-sand flow field of multi-row reed sand barriers and optimal spacing. Nat. Hazards 2024, 120, 197–218. [Google Scholar] [CrossRef] [Scilit]
  10. He, W.; Huang, N.; Xu, B.; Wang, W. Numerical simulation of wind-sand movement in the reversed flow region of a sand dune with a bridge built downstream. Eur. Phys. J. E 2018, 41, 53. [Google Scholar] [CrossRef] [Scilit] [PubMed]
  11. Xin, G.; Huang, N.; Zhang, J.; Dun, H. Investigations into the design of sand control fence for Gobi buildings. Aeolian Res. 2021, 49, 100662. [Google Scholar] [CrossRef] [Scilit]
  12. Li, X.R.; Kong, D.S.; Tan, H.J.; Wang, X.P. Changes in soil and vegetation following stabilisation of dunes in the southeastern fringe of the Tengger Desert, China. Plant Soil 2007, 300, 221–231. [Google Scholar] [CrossRef] [Scilit]
  13. Dong, Z.B.; Wang, X.M.; Liu, L.Y. Wind erosion in arid and semiarid China: An overview. J. Arid Environ. 2004, 58, 559–574. [Google Scholar]
  14. Lü, P.; Dong, Z.; Ma, X. Aeolian sand transport above three desert surfaces in northern China with different characteristics (shifting sand, straw checkerboard, and gravel): Field observations. Environ. Earth Sci. 2016, 75, 577. [Google Scholar] [CrossRef] [Scilit]
  15. Cheng, J.J.; Xue, C.X. The sand-damage-prevention engineering system for the railway in the desert region of the Qinghai-Tibet Plateau. J. Wind Eng. Ind. Aerodyn. 2014, 125, 30–37. [Google Scholar] [CrossRef] [Scilit]
  16. Zhang, K.; Tian, J.J.; Qu, J.J.; Zhao, H.L.; Li, S. Sheltering effect of punched steel plate sand fences for controlling blown sand hazards along the Golmud-Korla Railway: Field observation and numerical simulation. J. Arid Land 2022, 14, 604–619. [Google Scholar] [CrossRef] [Scilit]
  17. Dong, H.; Cheng, J.; Ma, B.; Li, Y.; Chen, Y. Characteristics of wind-sand transportation along railways in the eastern fringe of the Taklimakan Desert and sand control system. Transp. Saf. Environ. 2024, 6, tdad042. [Google Scholar] [CrossRef] [Scilit]
  18. Xin, G.; Yang, Z.; Qi, Y.; Zhang, X.; Han, G. Prevent sand accumulation under the windbreak wall along railways in strong wind areas. Phys. Fluids 2025, 37, 023303. [Google Scholar] [CrossRef] [Scilit]
  19. Xu, B.; Zhang, J.; Huang, N.; Gong, K.; Liu, Y. Characteristics of turbulent aeolian sand movement over straw checkerboard barriers and formation mechanisms of internal erosion. J. Geophys. Res. Atmos. 2018, 123, 6907–6919. [Google Scholar] [CrossRef] [Scilit]
  20. Bo, T.L.; Ma, P.; Zheng, X.J. Numerical study on the effect of semi-buried straw checkerboard sand barriers belt on the wind speed. Aeolian Res. 2015, 16, 101–107. [Google Scholar] [CrossRef] [Scilit]
  21. Wang, T.; Qu, J.; Niu, Q.; An, Z.; Gao, Y.; Wang, H.; Niu, B. Aerodynamic properties and shelter effects of a concrete plate-insert sand fence along the Lanzhou-Xinjiang high-speed railway in Gobi regions under strong winds. Front. Environ. Sci. 2022, 10, 842025. [Google Scholar] [CrossRef] [Scilit]
  22. Chen, B.; Cheng, J.; Xin, L.; Wang, R. Effectiveness of hole plate-type sand barriers in reducing aeolian sediment flux: Evaluation of effect of hole size. Aeolian Res. 2019, 38, 1–12. [Google Scholar] [CrossRef] [Scilit]
  23. Lee, S.J.; Park, K.C.; Park, C.W. Wind tunnel observations about the shelter effect of porous fences on sand particle movements. Atmos. Environ. 2002, 36, 1453–1463. [Google Scholar] [CrossRef] [Scilit]
  24. Khier, W.; Breuer, M.; Durst, F. Flow structure around trains under side wind conditions: A numerical study. Comput. Fluids 2000, 29, 179–195. [Google Scholar] [CrossRef] [Scilit]
  25. Pickard, J. Post and rail fences: Derivation, development, and demise of rural technology in colonial Australia. Agric. Hist. 2005, 79, 27–49. [Google Scholar] [CrossRef] [Scilit]
  26. Cleugh, H.A.; Hughes, D.E. Impact of shelter on crop microclimates: A synthesis of results from wind tunnel and field experiments. Aust. J. Exp. Agric. 2002, 42, 679–701. [Google Scholar] [CrossRef] [Scilit]
  27. McQueen, T.; Burton, D.; Sheridan, J.; Thompson, M.C. Active control of flow over a backward-facing step at high Reynolds numbers. Int. J. Heat Fluid Flow 2022, 93, 108891. [Google Scholar] [CrossRef] [Scilit]
Figure 1. Windward sand-control measures and subgrade sand accumulation along desert railways: (a) windward-side protection system; (b) sand accumulation on the subgrade under the windward-side protection system; (c,d) sand accumulation on the subgrade.
Sustainability 18 06018 g001
Figure 2. The wind tunnel experimental setup. The subgrade height was 0.3 m (within the boundary layer), with a side slope ratio of 1:1.5 and an embankment crest width of 0.52 m. The baffles had a height of 0.02 m and a spacing of 0.1 m. The checkerboard barrier consisted of 25 straw checkerboard cells with dimensions of 0.1 m × 0.1 m, and its porosity was 30%.
Sustainability 18 06018 g002
Figure 3. The computational domain for the numerical simulation.
Sustainability 18 06018 g003
Figure 4. The validation of the numerical simulation results. (a) Inlet wind velocity; (b) relative sand transport rate at the inlet; (c) relative sand transport rate at a distance of 5 H on the leeward side of the embankment.
Sustainability 18 06018 g004
Figure 5. The flow field distribution in the x-z plane under the three configurations: (a) no protection; (b) baffles on the leeward slope; (c) checkerboard barrier at the slope toe.
Sustainability 18 06018 g005
Figure 6. The surface flow field and y-z plane flow distributions at different locations under the three configurations: (a) no protection; (b) baffles on the leeward slope; (c) checkerboard barrier at the slope toe.
Sustainability 18 06018 g006
Figure 7. The vertical profiles of wind velocity at different locations under the three configurations: (a) no protection; (b) multiple baffles on the leeward slope; (c) checkerboard barrier at the slope toe.
Sustainability 18 06018 g007
Figure 8. The streamwise velocity variations at different heights on the leeward side under the three configurations: (a) 0.01 m; (b) 0.5 m; (c) 1 m; (d) 5 m.
Sustainability 18 06018 g008
Figure 9. The vorticity structures under the three configurations: (a) no protection; (b) baffles on the leeward slope; (c) checkerboard barrier at the slope toe.
Sustainability 18 06018 g009
Figure 10. The surface shear stress under the three configurations: (a) no protection; (b) baffles on the leeward slope; (c) checkerboard barrier at the slope toe.
Sustainability 18 06018 g010
Figure 11. The surface particle distributions under the three configurations: (a) no protection; (b) baffles on the leeward slope; (c) checkerboard barrier at the slope toe.
Sustainability 18 06018 g011
Figure 12. The particle concentration on the subgrade under different wind velocities: (a) 12 m/s; (b) 16 m/s.
Sustainability 18 06018 g012
Figure 13. The results of the wind tunnel experiments for different configurations: (a) no protection; (b) baffles on the leeward slope; (c) checkerboard barrier at the slope toe. (12 m/s).
Sustainability 18 06018 g013
Figure 14. The relative sand accumulation on the (a) subgrade surface and (b) leeward slope under different wind velocities. Values represent the normalized mean ± standard deviation (n = 3).
Sustainability 18 06018 g014
Figure 15. The field observation results. The actual wind condition data have been added to the caption of Figure 15. In this region, the average wind velocity is approximately 12 m/s, while the maximum wind velocity can reach 20 m/s. The prevailing wind direction is nearly perpendicular to the railway embankment. The particle size of sand accumulated on the leeward side was dominated by fine particles, with a characteristic size of approximately 100 μm. The dominant wind direction is indicated by the red arrow in the figure. (a) A vertical plate is added on the leeward side of the subgrade; (b) Checkerboard sand barriers are added on the leeward side of the subgrade.
Sustainability 18 06018 g015
Disclaimer/Publisher’s Note: The statements, opinions and data contained in all publications are solely those of the individual author(s) and contributor(s) and not of MDPI and/or the editor(s). MDPI and/or the editor(s) disclaim responsibility for any injury to people or property resulting from any ideas, methods, instructions or products referred to in the content.