Article

Spatio-Temporal Evolution and Scenario Simulation of Ecosystem Service Value in Ecologically Fragile Hilly Region: A Case Study of Longji Mountain Area in Guangxi, China

1
School of Geography and Ocean Science, Nanjing University, Nanjing 210023, China
2
The Key Laboratory of Coastal Zone Exploitation and Protection, Ministry of Natural Resources, Nanjing 210023, China
3
College of Environment and Resources, Guangxi Normal University, Guilin 541004, China
4
School of Environment Engineering, Nanjing Institute of Technology, Nanjing 211167, China
5
Nanjing Institute of Technology Research Center, Key Laboratory of Carbon Neutrality and Territory Optimization, Ministry of Natural Resources, Nanjing 211167, China
6
International Joint Laboratory of Green & Low Carbon Development, Nanjing 211167, China
*
Author to whom correspondence should be addressed.
These authors contributed equally to this work.
Sustainability 2026, 18(12), 5926; https://doi.org/10.3390/su18125926
Submission received: 26 April 2026 / Revised: 3 June 2026 / Accepted: 6 June 2026 / Published: 10 June 2026
(This article belongs to the Section Sustainable Urban and Rural Development)

Abstract

Ecologically fragile hilly areas are key regions for safeguarding national ecological security and advancing ecological civilization construction. Accurate assessment of ecosystem service value (ESV) and future scenario simulations in these regions is crucial for improving regional land use and attaining sustainable development. Based on high-resolution remote sensing data of the Longji Mountain area in Guangxi, China, from 2013 to 2023, this study systematically assesses the spatiotemporal evolution characteristics of ESV using the equivalent factor method with localized corrections. This study adopts spatial autocorrelation analysis, geographic modeling, and scenario simulation. It predicts the spatial patterns of ESV for 2028 and 2033 under three scenarios: ecological protection, natural development, and tourism development. The results reveal that: (1) from 2013 to 2023, the total ESV in the Longji Mountain area showed an overall fluctuating trend. It increased first, then declined and recovered slightly, with an average annual growth rate of −0.15%. Spatially, the ESV presented a heterogeneous pattern, characterized by “high-value agglomeration in forest land, medium-value transition in terraced fields, and low-value interpolation in constructed areas”, with distinct clustering features; (2) regional ecological functions are mainly dominated by regulating and supporting services. Climate regulation contributes the highest value. Water supply is the only service with negative value, indicating a persistent water ecological deficit that remains unaddressed; (3) scenario simulations reveal that the total ESV is highest and spatial connectivity is strongest under the ecological protection scenario. Furthermore, a consistent trend is observed across all three scenarios: high-value ESV areas tend to become dominant, while spatial connectivity shows progressive enhancement. The human–land system coupling framework for the ecologically fragile hilly region suggests that ecologically oriented decision-making is the core pathway to sustainably improve ecosystem services and realize regional sustainable development. This study offers scientific support for regional ecological conservation and sustainable advancement.

1. Introduction

The assessment of ecosystem service value (ESV) aims to convert the multidimensional welfare that people gain from ecosystem structures, processes, and functions (including provisioning services, regulating services, and cultural services) into comparable values [1]. In essence, it quantifies the human well-being derived from ecosystems [2]. Quantitative ESV evaluation serves as a key link between ecological conservation and socioeconomic decision-making. It has become an essential quantitative tool and a core part of land space optimization. A reliable ESV assessment provides critical scientific support for ecological compensation, land space optimization, and sustainable development strategies. Its accuracy directly determines the effectiveness and scientific validity of human decision-making.
Over the past two decades, research on ESV has achieved great progress in both theoretical and empirical fields and attracted widespread attention from the academic community. The research spatial scales have become increasingly diverse, covering global [3,4] and national [5] macro-level perspectives, as well as smaller-scale research objects including river basins [6,7], urban agglomerations [8,9], and typical ecosystems [10,11]. In terms of research methods, a standardized value evaluation system has been established [4], functional classification has become progressively refined [12], and there are continuous innovations in econometric and technical approaches [13]. These improvements have further promoted the in-depth development of ESV quantitative accounting [4]. However, a review of existing studies reveals several notable research shortcomings. First, regarding study scale, although large-scale analyses have laid a solid foundation for understanding macro-level patterns, systematic investigations on characteristic areas with unique ecological functions and intense human–land conflicts are still insufficient. Typical areas include ecologically fragile regions and key development zones. The insufficiency is mainly caused by data acquisition difficulties. Accordingly, the internal complex spatial heterogeneity of such areas is often overlooked in macro-level assessments. Second, in terms of evaluation methods, this equivalent factor approach is commonly adopted due to its operational simplicity [1,5,14]. In 1997, Costanza et al. first measured global ecosystem service values and developed the equivalent factor table [1]. This method has established an important foundation for subsequent research. Although the Costanza equivalent factor method has been widely applied globally, subsequent empirical studies in North America, Europe, and Southeast Asia have revealed obvious regional dependencies in its value coefficients. In North America, empirical research has found multiple limitations of this method. For instance, a study on urbanized areas of Texas confirmed that the method underestimates the actual ecological value loss by approximately two to three times. The core reason is that it cannot reflect the patch fragmentation characteristics of regional landscapes. To address this issue, the introduction of landscape pattern indices has been suggested to calibrate the value coefficients [15]. A comparative analysis conducted in the Midwestern United States further indicates that the correlation between the equivalent factor method and the InVEST model in assessing border areas with high landscape heterogeneity is only about 0.6, and the spatial aggregation bias can reach 200%. This finding led to the proposal of the “proximity principle of value transfer” [16]. European scholars have also pointed out noticeable flaws in the equivalent framework. A meta-analysis of 150 relevant studies in Spain revealed that Costanza’s original coefficients are mainly derived from temperate and tropical regions. These coefficients significantly underestimated the value of Mediterranean ecosystem services. In response, a national-level database was established, along with a localized calibration framework [17]. Research on mangroves in Thailand, Vietnam, and Indonesia within Southeast Asia shows that the equivalent factor method independently calculates various ecosystem services. This calculation mode ignores the strong synergistic effects between coastal protection and fishery support functions. Consequently, a shift toward a joint assessment model of ecosystem service clusters has been recommended [18]. Furthermore, a study in the Mekong Delta of Vietnam found that value coefficients vary greatly across distinct tidal zones, with a maximum difference of more than fourfold. This finding led to the proposal of a localized improvement scheme termed the “microtopography zoning equivalent table” [19]. In summary, the above empirical findings demonstrate that the equivalent factor method, in the absence of localized correction, is inadequate for the precise assessment of ESV in distinctive regions. Therefore, learning from localized correction strategies adopted in empirical studies under data-limited conditions represents a critical issue worthy of further investigation. Chinese scholars, including Xie Gaodi, further advanced the equivalent table for unit-area service values of terrestrial ecosystems in China [5,14], thereby promoting the regional application of this method. However, this approach typically assumes a unit-area constant service value, so it cannot accurately reflect the fine-scale land use characteristics and spatial heterogeneity. In contrast, models with stronger process-based explanatory capacity, such as the InVEST model, can better represent the spatial dominance characteristics of ecosystem services [20,21]; nevertheless, the application largely depends on high-precision data support. At present, there remains considerable scope for research in the characterization of land use and cover dynamics using high-resolution, long time-series data. Additionally, most current value assessment research focuses on static cross-sectional analyses. They pay insufficient attention to dynamic simulations of service value formation mechanisms, spatial flow processes, and supply–demand matching relationships. This substantially limits the capacity of assessment results to support specific decisions, such as those related to land space optimization. Therefore, conducting dynamic assessments of regional ecosystem services based on high-precision spatiotemporal data, revealing their detailed spatiotemporal evolution patterns, and deepening the understanding of the coupling relationship between ecosystem functions and human welfare are of great theoretical significance and practical relevance to the execution of regional sustainable development strategies.
At present, ESV research has made extensive progress at large and medium scales. However, in-depth investigations on small-scale, highly heterogeneous regions, such as rural villages, remain insufficient. Future research should focus more on integrating high-precision data with localized parameters effectively to enhance the accuracy and regional applicability of evaluation results. First, the application of high-resolution remote sensing datasets, including UAV aerial imagery, LiDAR, and Sentinel-2, can greatly improve the spatial characterization capability of ESV assessments in complex terrains. It helps identify microscale land use dynamics and ecosystem service response characteristics [22,23]. Second, field surveys and dynamic monitoring help localize and refine key parameters such as equivalence factors. This improves the scientific reliability and regional adaptability of relevant models in small-scale regions [24,25]. On this basis, further coupling socioeconomic factors with multi-model simulations can systematically reveal the interactive feedback mechanisms between ecosystem services and human activities [26,27]. It can provide more targeted scientific support for small-scale ecological management and precise regulation. Therefore, in ecologically fragile areas, improving established assessment methods such as the equivalent factor approach through adaptive refinement and integrating high-precision land use data to systematically capture both the static patterns and dynamic evolution of ESV has become a critical direction for regional ecosystem service research [28,29]. Focusing on the scale of rural villages with typical topographic features, this study integrates high-resolution remote sensing datasets and localized parameters to finely characterize the spatiotemporal evolution patterns of ESV in hilly areas. This approach effectively addresses the limitations of traditional large-scale studies in capturing fragmented terrain features. It also reveals the profound influence of micro-topographic differences on the ESV spatial differentiation. Furthermore, it provides targeted scientific support for precision ecological governance, land use optimization, and sustainable advancement in ecologically fragile hilly regions.
This study takes the Longji Mountain area in Guangxi, a typical ecologically fragile hilly region in southern China, as the research case to address the three core scientific questions: (1) What are the spatiotemporal evolution characteristics of the ESV in the study area from 2013 to 2023, and how do its spatial agglomeration and cold-hot spot patterns change during this period? (2) What are the spatial distribution patterns and evolutionary trajectories of the values associated with different individual ecosystem service functions? (3) Under the three scenarios of natural development, ecological protection, and tourism development, how will the total ESV and its spatial structure in the study area change in the future? The findings of this research can provide a reusable methodological reference and a representative case study for the refined assessment of ESV in ecologically fragile hilly regions.
The structure of this paper is organized as follows. Section 2 provides a detailed overview of the study area, multi-source data, and processing methods, including ESV spatial quantification approaches, spatial autocorrelation analysis, and the construction of future scenario simulations. Section 3 systematically presents the spatiotemporal evolution characteristics of ESV in the Longji Mountain area from 2013 to 2023, the differentiation patterns of individual service functions, and the ESV simulation results under three scenarios in 2028 and 2033. Section 4 discusses the coupling framework of the human–land system in the ecologically fragile hilly region, the applicability of the equivalent factors revision method, and the limitations of this research. Section 5 summarizes the core research conclusions and outlines directions for future research improvement.

2. Materials and Methods

2.1. Study Area

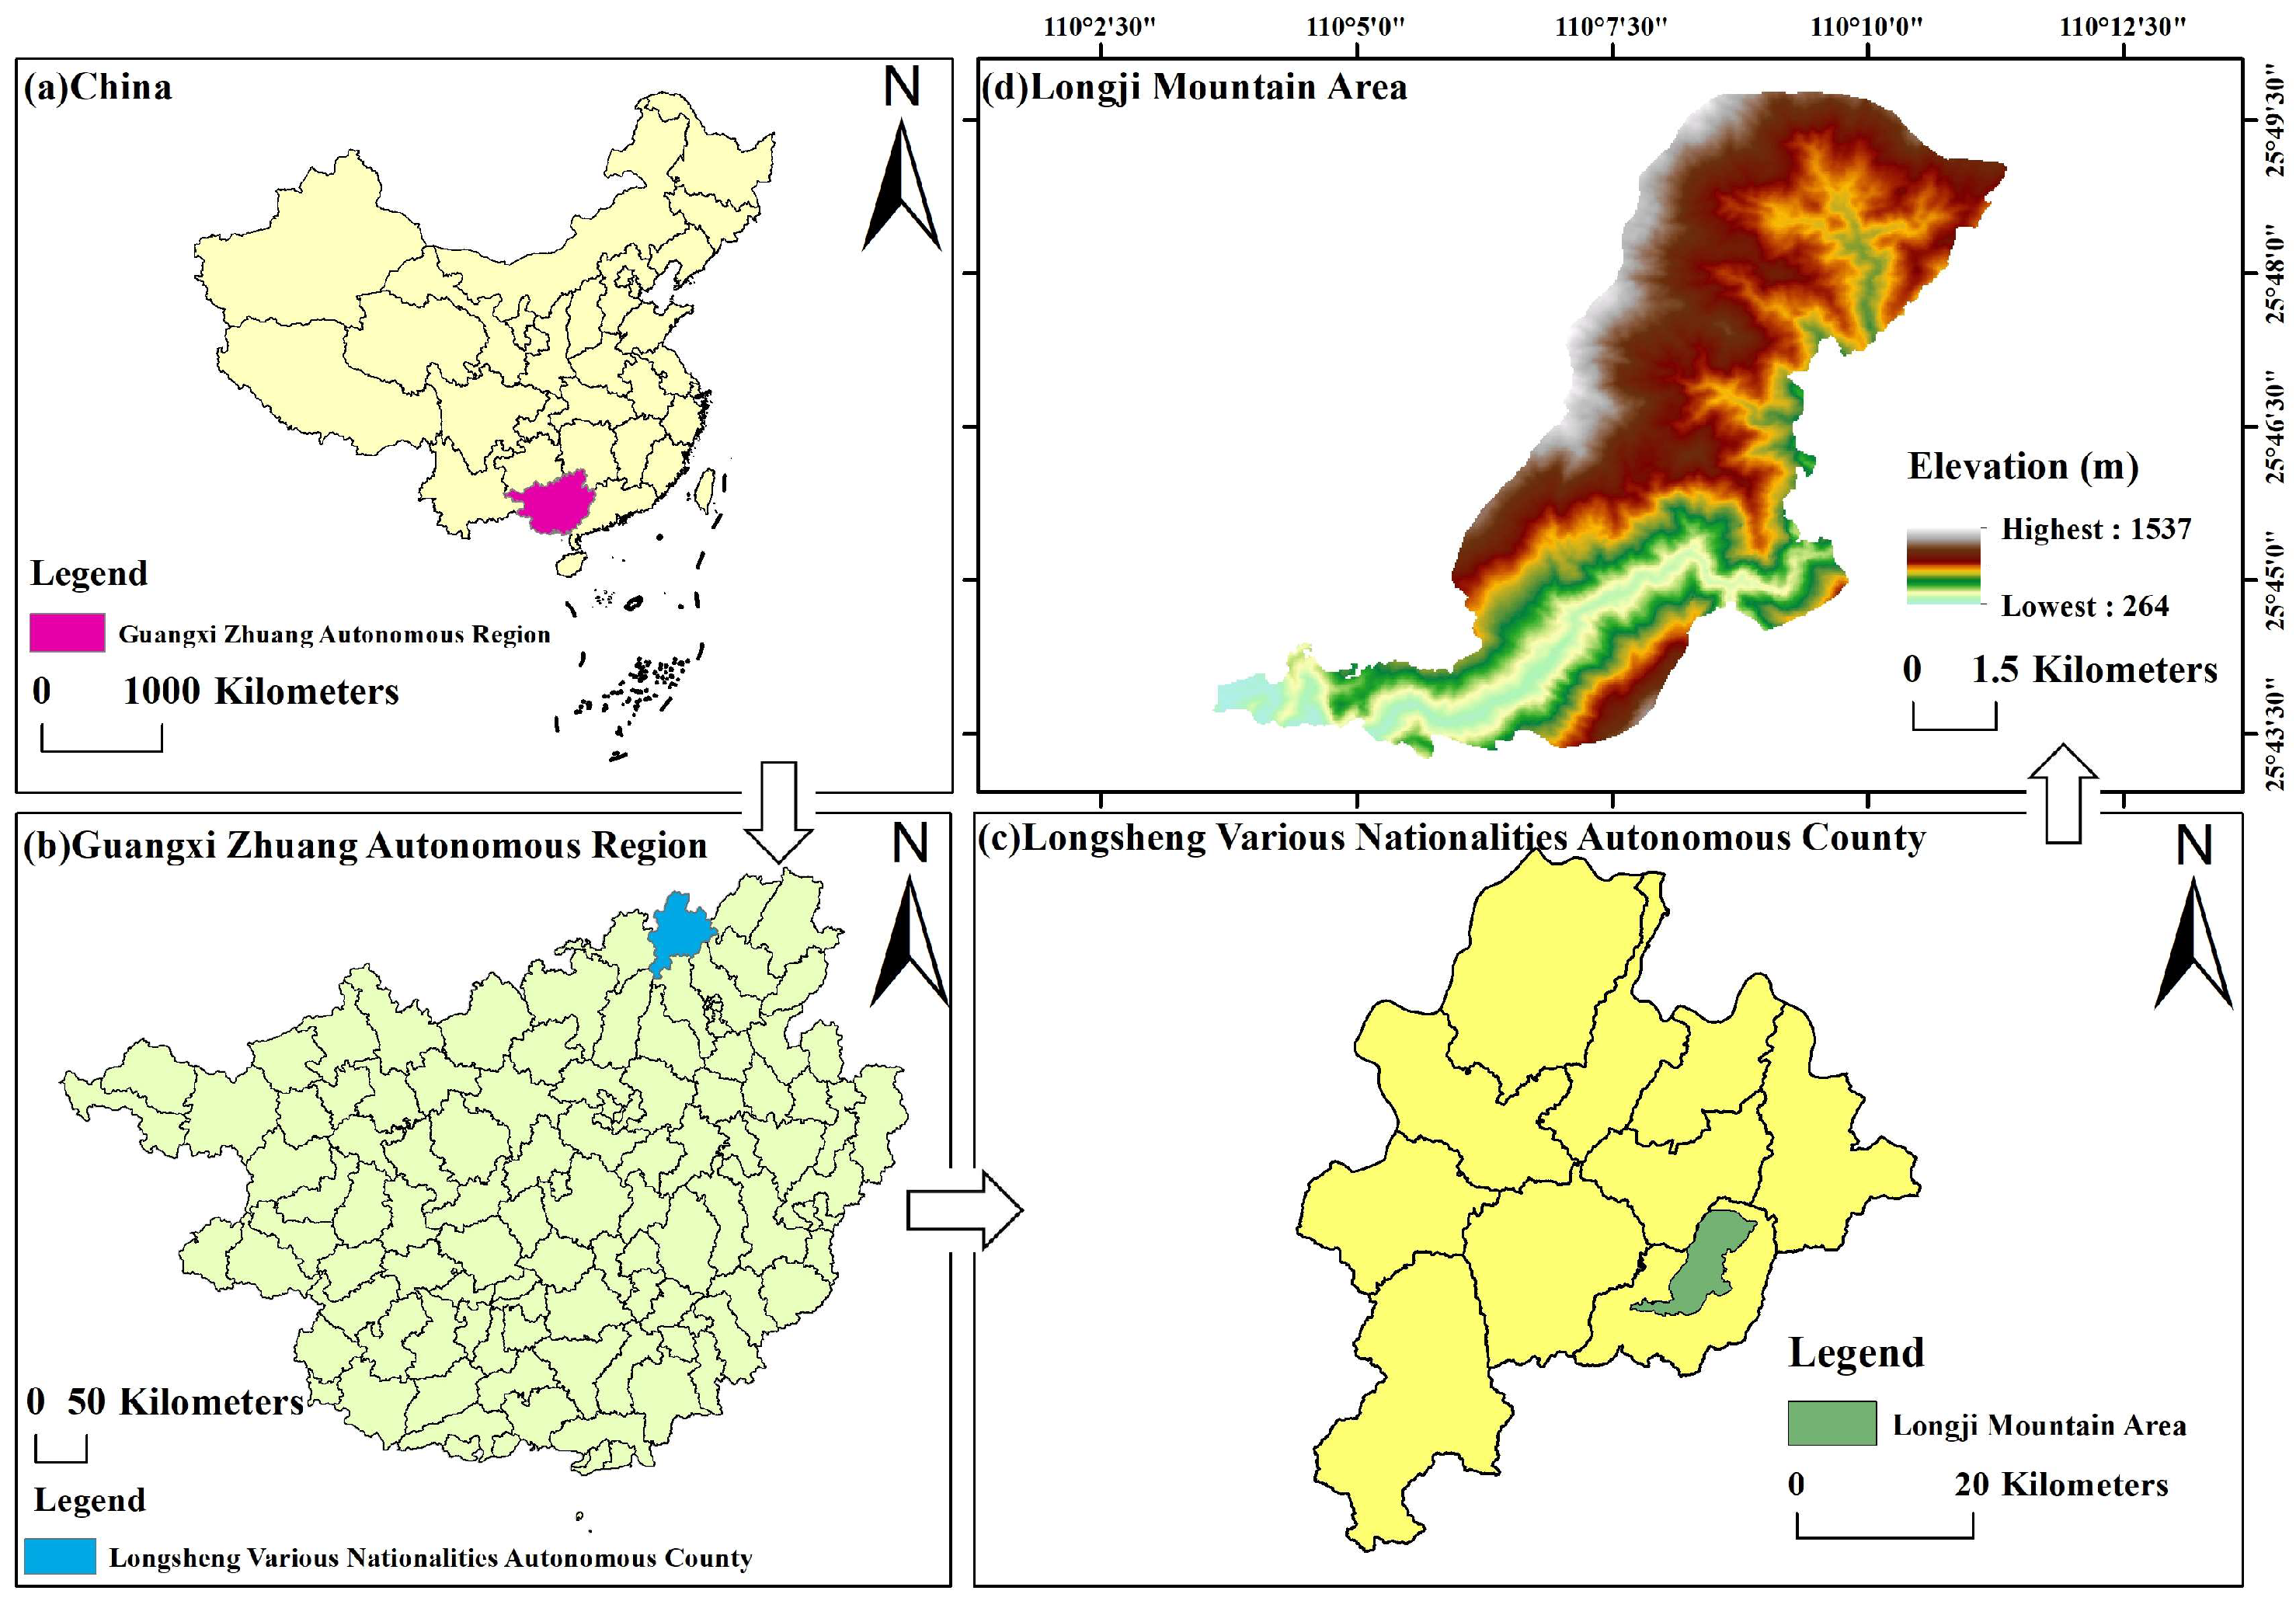
The Longji Mountain area is located in the northeastern part of the Guangxi Zhuang Autonomous Region, China (110°3′34″–110°11′21″ E, 25°43′16″–25°49′45″ N), as shown in Figure 1. Spanning a total area of approximately 5800 hectares, it is a high-altitude mountainous region in northern Guangxi. It belongs to the mid-subtropical monsoon climate belt, marked by a mild, humid climate and persistent cloud cover all year round. The Longji Terraced Fields National Wetland Park is situated within this mountainous area. The Longji terraced fields were first constructed in the mid-14th century [30]. They exhibit a distinct vertical drop and clear terrace levels, with elevations ranging from 300 to 1100 m.
When selecting the ecosystem service types for assessment, this study fully considered the unique environmental context of the study area, an ecologically fragile hilly region. Following the international classification framework established by the Millennium Ecosystem Assessment (MA) [2], four service types—provisioning, regulating, supporting, and cultural—were selected as the core assessment categories. This selection was based on the following three factors. First, the selection reflects the ecological sensitivity of fragile hilly areas. The Longji Mountain area is a moderately ecologically fragile zone. Its ecological vulnerability stems from combined topographic limitations and human activities in the hilly and mountainous terrain of northern Guangxi. The area has elevations ranging from 300 to 1100 m and a relative elevation difference of 800 m. It presents a complex three-dimensional topographic structure and a highly fragmented spatial pattern [31]. On these steep slopes, the destruction of native vegetation can easily lead to soil erosion. This makes local ecosystem services highly vulnerable to land use change and other disturbances. Accordingly, this study emphasizes the assessment of regulatory services (e.g., hydrological regulation and climate regulation) and supporting services (e.g., soil conservation and nutrient cycling). These two service types are directly associated with the stability and adaptability of the hilly ecosystem and act as key indicators of regional ecological vulnerability. Second, the selection matches the multifunctional characteristics of the mountainous area and the national wetland park. The cultivated land in the Longji Mountain area consists of terraces. These terraces not only provide the material foundation for rice production but also form an artificial wetland system to maintain regional ecological balance. The assessment of provisioning services can accurately evaluate the output value of agricultural products such as rice and tea. It also reflects the function of agricultural production in maintaining local residents’ livelihoods. Meanwhile, terrace systems are unique artificial wetlands. The terrace system’s hydrological regulation functions, including water storage, water conservation, and runoff regulation, are systematically captured through the assessment of regulating services. Thus, the ecosystem service assessment clarifies the synergistic relationship between agricultural production and ecological regulation in artificial wetlands. Third, the selection highlights the cultural service values and community attributes of hilly regions [32]. The Longji Mountain area not only supports important natural ecological functions but also embodies profound cultural significance. It is a settlement for the Zhuang and Yao ethnic minorities, who have resided in these mountains for centuries. Long-term rice cultivation and terraced landscapes have become deeply intertwined and formed a unique ethnic cultural heritage. The evaluation of cultural services can quantify the intangible values associated with leisure tourism, aesthetic appreciation, and cultural inheritance. It also emphasizes the social and cultural attributes of the Longji Mountain area. A comprehensive assessment of the four service types allows for a systematic exploration of the interactive mechanisms between ecosystems and human welfare. It provides a scientific basis for balancing ecological conservation and community development. In summary, the study chose the four service categories of provisioning, regulating, supporting, and cultural to construct a systematic assessment framework. This framework fully covers the core ecological functions of ecologically fragile hilly areas and offers a scientific reference for ecological management and sustainable development in similar regions.

2.2. Data Sources

The high-resolution remote sensing datasets of China used in this study were acquired from the Resource and Environmental Science Data Center, Institute of Geographical Sciences and Natural Resources Research, Chinese Academy of Sciences (https://www.resdc.cn/). The satellite data include panchromatic images with a spatial resolution of 2 m and multispectral imagery with a spatial resolution of 8 m (band range: 0.45–0.90 μm) from the GF-1 satellite, as well as panchromatic images with a spatial resolution of 1 m and multispectral images with a spatial resolution of 4 m (band range: 0.45–0.90 μm) from the GF-2 satellite. High-resolution remote sensing data support more accurate identification of terrace microtopography. To reduce the impact of natural factors such as cloud cover on the accuracy of feature classification, all selected images have nearly 0% cloud cover. Most images were acquired in spring and winter. The images are generally clear, have high feature distinguishability, and contain abundant information. Further details are provided in Supplementary Table S1. The data cover the period from 2013 to 2023. There are 11 remote sensing images per year, which fully cover the entire study period.
Basic geographic data mainly include the following categories. First, terrain data. The ASTER GDEM V3 digital elevation model (DEM) with a spatial resolution of 30 m was used. The datasets were obtained from the Resource and Environmental Science Data Center, Institute of Geographical Sciences and Natural Resources Research, Chinese Academy of Sciences (https://www.resdc.cn/). Second, auxiliary verification and base map data. Google satellite imagery from the EarthOL platform (https://www.earthol.com/) was used as the base map. Additionally, GPS boundary trajectories and UAV aerial data from field investigations were used to help verify boundaries and validate ground feature information in the Longji Mountain area of the study site.
Socioeconomic data were primarily obtained from official national and local statistics and reports. Specifically, these sources include the Announcement on Grain Production Over the Years issued by the National Bureau of Statistics of China [33]; the Weekly Report on Grain and Oil Market Monitoring published by the Grain and Material Reserve Bureau of Guangxi Zhuang Autonomous Region [34]; as well as the National Economic and Social Development Statistical Report [35] and the Annual Report on Government Information Disclosure released by the People’s Government of Longsheng Ethnic Autonomous County, Guilin, Guangxi [36].

2.3. Processing Methods

2.3.1. Spatial Quantification of ESV

This study adopts the equivalent table of China’s terrestrial ESV base values proposed by Xie Gaodi et al. [5,14]. This table is established on the foundational work of Costanza et al. [1,37]. Since the table is primarily applicable on the national scale, the equivalence factor method was used to adjust the equivalence coefficients according to the actual biomass conditions of the Longji Mountain area. This operation improves assessment accuracy. Based on the adjusted equivalent table, the ecosystem service values corresponding to different land use categories were quantitatively assessed.
Excluding other inputs such as labor and material resources, the equivalent value of standard per-hectare ecosystem services is defined as the ESV of local food crops. This value is one-seventh of the market value of the per-unit food crops’ yield in the study area. The specific calculation formula is shown below:
V C = 1 7 i = 1 n m i p i q i M
The VC represents the ESV per hectare of farmland ecosystem (CNY/ha). In the equation, i denotes the number of food crop types; n represents the total number of crop types; mi refers to the planting area of the i-th food crop (ha); Pi is the constant price of the i-th crop in the research area (CNY/kg), calculated based on the average price in 2013 as the base year; qi is its yield per unit area in the study area (kg/ha); and M is the total cultivated area of all food crops in the study area (ha).
p i = p t C P I t C P I 2013
To eliminate the impact of inflation on cross-year comparisons [38], this study uses 2013 as the base year and adopts the Consumer Price Index (CPI) of the Guangxi Zhuang Autonomous Region to convert the purchase price Pt in each study year into the constant price Pi (in 2013 terms). This value is then substituted into Formula (1) for calculation [39].
The baseline ESV equivalent table put forward by Xie Gaodi et al. was formulated based on the national scale of China. In practical applications, it is necessary to derive a correction coefficient, denoted as α, computed as the ratio of the average grain crop yield per unit area in the research area to the national average of China. This coefficient is then used to adjust the equivalent factors for the study area. The correction factor is calculated as follows:
α = Y 0 Y
The Y0 is the grain crop yield per unit area in the research area, and Y is the grain crop yield per unit area in China. VCk refers to the adjusted equivalent factor of ESV per unit area in the research area, which is computed as follows:
V C k = α × V C
China has implemented unified regulation and control over grain production, resulting in generally stable grain production over the years. Consequently, the impact of natural conditions or market price fluctuations on yield per unit area is relatively limited. Considering data availability and operability, this study used the total grain crop yield and cultivated area in Longsheng Autonomous County of Guangxi Zhuang Autonomous Region during the study period to calculate the local grain crop yield per unit area. This helps reduce the impact of natural factors and price changes on yield and price.
Based on the ESV equivalent factor per unit area in the Longji Mountain area, the total ESV and the values of individual ecosystem services in the research area were computed. The specific computational formula is as follows:
E S V = i = 1 m ( A i × V C i )
The ESV represents the total ESV in the research area (CNY); Ai represents the area of land use category i (ha); and VCi is the ESV equivalent coefficient per unit area of land use type i.
E S V j = i = 1 m ( A i × V C i j )
The individual ESV, denoted as ESVj, denotes the total value (CNY) of the j-th ecosystem service function, which can be further classified into primary service types and secondary function types. For example, the primary service type of provisioning services includes secondary function types, including food production, raw material production, and water supply. Ai represents the area of land use type i (ha), and VCij denotes the ESV equivalent value of the j-th service function for land use type i.
The ESV in the Longji Mountain area was measured using the equivalent factor method. Food crops were selected as the benchmark. The food production function is the most fundamental, universal, and readily accessible ecosystem service. It helps build a stable and intuitive value reference system. The research area lies in a subtropical climate zone with double-cropping. Rice, including early and late crops, is the major food crop in this region. National policies directly influence the grain purchase prices, while the nominal value is still indirectly affected by macroeconomic inflation. To ensure the accuracy of cross-year comparisons, this study adopts the CPI to uniformly convert all prices to constant 2013 prices. This approach eliminates the effects of changes in monetary purchasing power.
This study used 11 sets of remote sensing images from the GF-1 and GF-2 satellites over the period from 2013 to 2023 to obtain the spatial distribution and area data of various land use categories in the study area. Given the varying spatial resolutions of the original data, radiometric calibration and rational polynomial coefficient (RPC) orthorectification were first performed separately on multispectral and panchromatic bands. A 30 m spatial resolution digital elevation model (DEM) was adopted for topographic correction. Subsequently, the NNDiffuse pan-sharpening algorithm was applied to fuse the multispectral and panchromatic bands, unifying the spatial resolution of 1 m for all images. Taking the 1 m pan-sharpened 2017 GF-2 image as the reference, geometric fine registration and resampling were carried out on images of other years to achieve a uniform pixel spacing of 1 m. Through image mosaicking and subsetting by region of interest (ROI), all 11 image sets were rendered largely consistent in spatial coverage and spectral appearance. On this basis, combined with field survey data and high-precision visual interpretation control points, an object-based image analysis (OBIA) approach employing a supervised maximum likelihood classifier was used to delineate six land use categories: terraced fields, forest land, transportation land, construction land, water bodies, and unused land. Accuracy assessment using a confusion matrix indicated that the overall classification accuracy of each year was higher than 89.98%. The average overall accuracy of all periods reached 94.64%, with an average Kappa coefficient of 82.11%. These results meet the spatial data requirements for ESV assessment.
This study takes the Longji Mountain area as the research object and adopts the national equivalent factor table of China proposed by Xie Gaodi et al. [14] with necessary revisions. The classification processing of land use types in the ESV assessment is specified as follows. First, since there is no universally recognized measurement standard that has been established for the ESV of construction land and transportation land, these two land types are excluded from the calculation scope, and their values are set to zero. Based on the premise that spatial and temporal dimensions are consistent, this processing method conforms to the robustness principle, namely, that “unmodeled factors do not affect the model test”, in the covariance criterion proposed by Song and Levine [40]. However, its effectiveness depends on the condition that unmodeled factors (i.e., the construction land and transportation land) exert no systematic or structural interference with the evaluation of core ecosystem service value. Second, the four main land types in this study correspond to the primary classifications in the ESV equivalent factor table developed by Xie Gaodi et al.; specifically, farmland corresponds to cropland, forest corresponds to forest, water bodies correspond to water areas, and unused land corresponds to desert. Regarding the refinement of secondary classifications, the Longji Mountain area falls within a subtropical climate zone with double-cropping rice cultivation. The local food crops primarily consist of early rice and late rice, and the cultivated land is predominantly paddy fields in the form of terraces. Therefore, the cultivated land in this study was uniformly classified as “paddy ecosystem” for value assessment. Additionally, the research dataset did not include grassland and wetland land types. For this reason, the unused land in the study was treated with reference to “bare land”.
This study adopted the basic equivalent table of terrestrial ecosystem service values in China developed by Xie Gaodi et al. [5,14]. The equivalent factors were regionally revised based on the actual biomass conditions and land use characteristics of the Longji Mountain area. Using this revised equivalent table, the functional framework for ecosystem service assessment in the research area was established. This framework categorizes ecosystem services into four primary categories: provisioning services, regulating services, supporting services, and cultural services [2]. These primary categories are further classified into 11 secondary functional categories, including food production, raw material production, water supply, gas regulation, climate regulation, environmental purification, hydrological regulation, soil conservation, nutrient cycle, biodiversity maintenance, and aesthetic value. Based on this framework, the above-mentioned calculation formula was applied to construct an ESV assessment model per hectare for the time series from 2013 to 2023 in the Longji Mountain area. The annual model data for the 11 study years are presented in Supplementary Table S2. Using land use data from 11 periods between 2013 and 2023 in the Longji Mountain area, the 11-period ESV dataset was developed. To verify the robustness of the revised value equivalent factors, the sensitivity index (CS) was employed. Specifically, the ESV equivalent of each land use category was adjusted upward and downward by 50%, and the corresponding response of the total ESV to these coefficient changes was observed. The results indicated that, over the study period, the average annual CS values for forest land, terraced fields, water bodies, and unused land were 0.9232, 0.0555, 0.0214, and 0.0001, respectively. All CS values of different land use types were below 1. The total ESV in the Longji Mountain area is considered inelastic to changes in the value coefficients of individual land use types. Consequently, the assessment results based on the revised equivalent factors are robust and reliable.
To reveal the spatial distribution pattern of ESV, a grid-based ESV assessment method was adopted. The improved per unit area equivalent factor method, combined with locally adjusted coefficients, was used to calculate the ESV of different land use types within each grid. The ESV of each grid unit was then aggregated [41,42]. A 1-ha fishnet was established to divide the study area into uniformly sized grid units, and the total ESV of each grid was calculated. Furthermore, to characterize the spatial heterogeneity of ESV in the research area, the Jenks natural breaks classification approach was adopted. Based on the statistical features of the dataset, ESV for each period was ultimately classified into five levels: low-value area, relatively low-value area, medium-value area, relatively high-value area, and high-value area. This classification enables intuitive identification and comparison of value differences across different regions.

2.3.2. Spatial Autocorrelation Analysis of ESV

To explore the spatial clustering patterns of ESV in the research area, this study conducted global and local spatial autocorrelation tests with ArcGIS software (V. 10.3). The analysis was based on grid data of ecosystem service values for the Longji Mountain area of Guangxi from 2013 to 2023. On the global scale, the global Moran’s I index was used to assess the overall degree of spatial correlation [43]. Specifically, a Moran’s I value greater than 0 with a z-score exceeding 1.65 indicates notable spatial clustering of values. A Moran’s I value less than 0 with a z-score below –1.65 indicates obvious spatial dispersion. When the absolute Z value is less than 1.65, the ESV suggests a random spatial distribution. On the local scale, the Getis–Ord General G statistic was applied to detect high-value clustering zones (hot spots) and low-value clustering zones (cold spots) [44]. The statistical significance of the findings was classified according to three confidence levels of 99%, 95%, and 90%. This method effectively reveals the local heterogeneity of ESV.

2.3.3. Future Simulation of ESV

This study used the simulation data of land use types in the Longji Mountain area of Guangxi, China, for the years 2028 and 2033. A 1-hectare fishing net grid was established to divide the study area into uniformly scaled units. The ESV of each grid was then computed. This study adopted the ESV equivalent factors suitable for the research area and used spatial pattern data of land use under three scenarios. The three scenarios include natural development, ecological protection, and tourism development. On this basis, the spatial distribution maps of ESV under different future scenarios were simulated. The three scenarios are defined as follows. The natural development scenario continues the historical trajectory of land use change and simulates the natural succession path in the absence of distinct human intervention. The ecological protection scenario prioritizes ecological restoration and natural conservation, with the primary goal of securing the ecological security framework. The tourism development scenario is oriented toward economic growth and the development of tourism infrastructure. It encourages promoting the conversion of land around villages and along major traffic routes to tourism facilities, commercial use, and sightseeing agriculture to meet the demands of tourism-driven economic development. These three distinct scenarios were designed to evaluate the potential effects of different policy directions on the ESV in the research area. Regarding the setting of land use conversion probabilities and rules under different scenarios, the natural development scenario is based directly on historical data of 2013–2018 and 2018–2023. The Markov chain module is employed to quantitatively obtain the benchmark transition probability matrix for the natural development scenario. Altitude is selected as the driving factor for logistic regression to generate the land use suitability atlas. Both the ecological protection scenario and the tourism development scenario take the transition probabilities from the natural development scenario as the basic reference. In combination with the development planning and protection regulations of the study area, the Multi-Criteria Evaluation (MCE) model is used to establish control constraints. Targeted quantitative adjustments are then made to the conversion inflow and outflow relationships of major land types, including terraced fields, forest land, water bodies, transportation land, and construction land. These adjustments clarify the increase or decrease range of conversion probabilities and the associated constraint rules for each land type. The specific conversion probabilities and adjustment rules are presented in Supplementary Table S3.
To clearly illustrate the spatial differentiation characteristics across different years and scenarios, this study adopted the natural breaks classification approach (Jenks), which relies on the statistical characteristics of the dataset, to classify ESV into five levels: low-value zone, relatively low-value zone, medium-value zone, relatively high-value zone, and high-value zone. This classification effectively highlights the differences in ecological functions among regions.
To predict future changes in ecosystem service value, this study employed a quadratic polynomial model for trend fitting and temporal extrapolation. Conventional models, including exponential, linear, logarithmic, and the grey prediction model GM(1,1), were discarded due to poor fitting performance. By introducing a squared term, the quadratic polynomial model effectively captured the nonlinear trend characterized by an initial decrease followed by a subsequent rebound and presented strong fitting capability. Model validation results show that the quadratic coefficient of the ESV equivalent factor is positive for all land types. The model achieves an R2 of 0.7325 and a root mean square error (RMSE) of 0.5607. These two indicators were at relatively low levels, indicating acceptable fitting performance. Based on this model, the study predicted the ESV equivalent factors for 2028 and 2033. Subsequently, the per unit area ESV and the total value of the entire study area were estimated, and spatial distribution simulation results of the two target years were generated.

3. Results

3.1. The Spatiotemporal Dynamics of ESV

3.1.1. The Spatiotemporal Dynamics of ESV in Mountainous Areas

Based on grain crop yield, sown area, and purchase price data, the average grain crop yield per unit area in the Longji Mountain area from 2013 to 2023 was 5701.93 kg/ha. For the same period, the national average grain yield per unit area in China was 5611.79 kg/ha. The average annual grain crop purchase price in Longsheng Autonomous County, Guilin, Guangxi, was 2.67 CNY/kg. The equivalent factor data for ecosystem service values for the Longji Mountain area are listed in Table 1. From 2013 to 2023, the average farmland ESV in Longsheng Autonomous County was 1972.36 CNY/ha, and the average equivalent factor value for ecosystem services was 2017.01 CNY/ha. The correction factor fluctuated between 0.95 and 1.13 during this period, with an annual average value of 1.02.
Here is the revised version with improved academic rigor, grammatical accuracy, sentence structure, logical coherence, and formal tone, while preserving the original meaning. The equivalent factor values for ESV in Longsheng Autonomous County, Guangxi Zhuang Autonomous Region, are presented in Table 2. From 2013 to 2023, the average equivalent factors for different land use types were as follows: terraced fields, 0.78 CNY/m2; forest land, 4.66 CNY/m2; water bodies, 25.34 CNY/m2; and unused land, 0.04 CNY/m2. Consistent with the preceding discussion, construction land and transportation land were excluded from the value calculation.
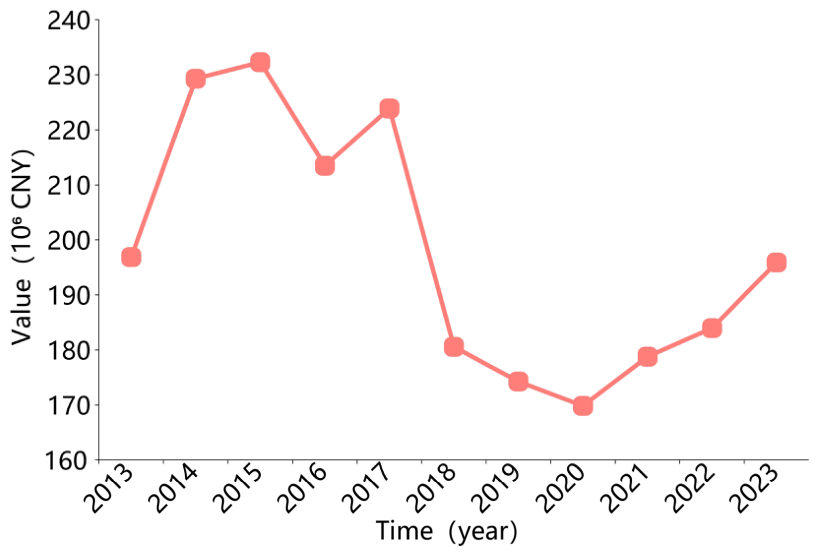
The overall temporal evolution of ESV in the mountainous area is shown in Figure 2. From 2013 to 2023, the total ESV of the Longji Mountain area followed a trajectory characterized by an initial increase, followed by a decline, and then a slow recovery in the later period, with an average annual growth rate of −0.15%. Specifically, the total ESV increased from 196.88 million CNY in 2013 to a peak of 232.27 million CNY in 2015. After that, it fluctuated and declined, reaching a low of 169.83 million CNY in 2020. Subsequently, it gradually rebounded to 195.88 million CNY by 2023. Over the eleven-year period, the average annual ESV was 198.32 million CNY. Overall, the ESV showed a fluctuating trend of “initial increase, subsequent decline, and later recovery”, suggesting that the ecosystem in the study area showed signs of recovery during the latter stage of the study period.
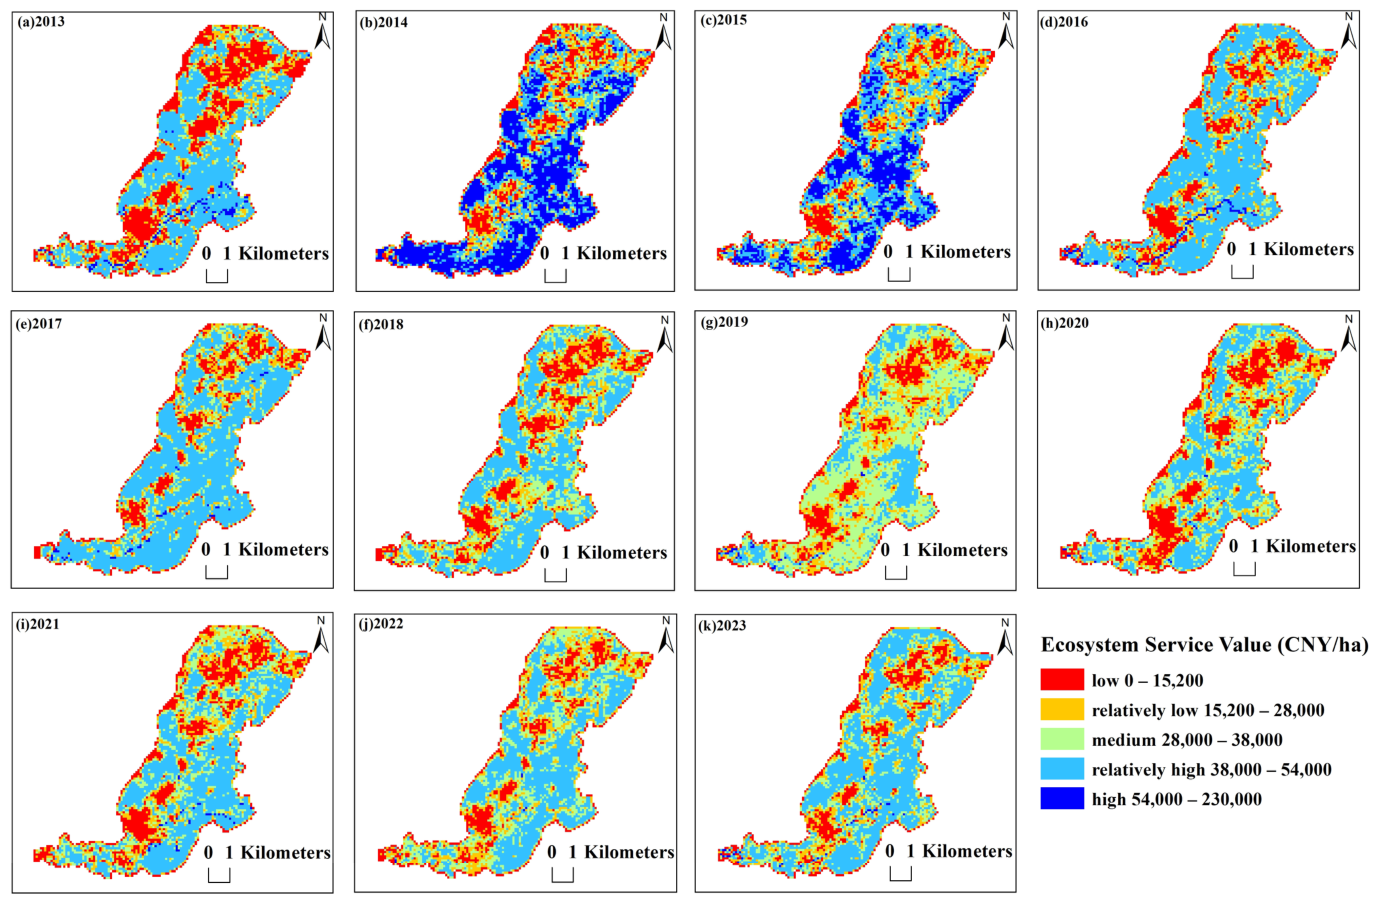
In terms of spatial distribution, the ESV in the Longji Mountain area from 2013 to 2023 exhibited a stable structure that was closely coupled with the land use pattern (Figure 3). The overall landscape presented a typical fragmented pattern described as a “large matrix with small patches”. High-value and medium-high-value areas, which were concentrated in contiguous forest land and water bodies, consistently dominated the region, providing a stable ecological foundation for the entire area. Medium-value areas generally coincided with terrace distributions, while low-value areas appeared as small patches concentrated in the northeastern region, the central-southern part, and the southernmost area, clustered around human settlements and major transportation routes. Over the past decade, the overall spatial structure did not undergo noticeable reorganization; however, the transition zone between medium- and low-value areas exhibited active fluctuations, acting as the primary interface where ecological restoration and development disturbance intersected. Spatial autocorrelation analysis further verified the clustering characteristics of ESV distribution (Table 3). The global Moran’s I index had an average annual value of 0.63 (0.57–0.70), with a mean Z-score of 69.00 (62.78–76.49) and p < 0.01, indicating obvious positive spatial autocorrelation of ESV at the global scale. High/Low Clustering (Getis–Ord General G) analysis showed that the observed values for each year (7–8 × 10⁻⁶) were greatly higher than the expected values (6 × 10⁻⁶), with p < 0.01, confirming the existence of significant and persistent high-value agglomeration hotspots in the study area. Overall, the region exhibited a heterogeneous spatial morphology characterized by a “forest land matrix—terrace transition—built-up core” structure. Specifically, medium-high-value forest land formed the ESV matrix, distributed extensively and continuously; terraces corresponded to the medium-value areas, forming a transition zone; and low-value built-up land areas were embedded in a core-like pattern surrounded by terraces.
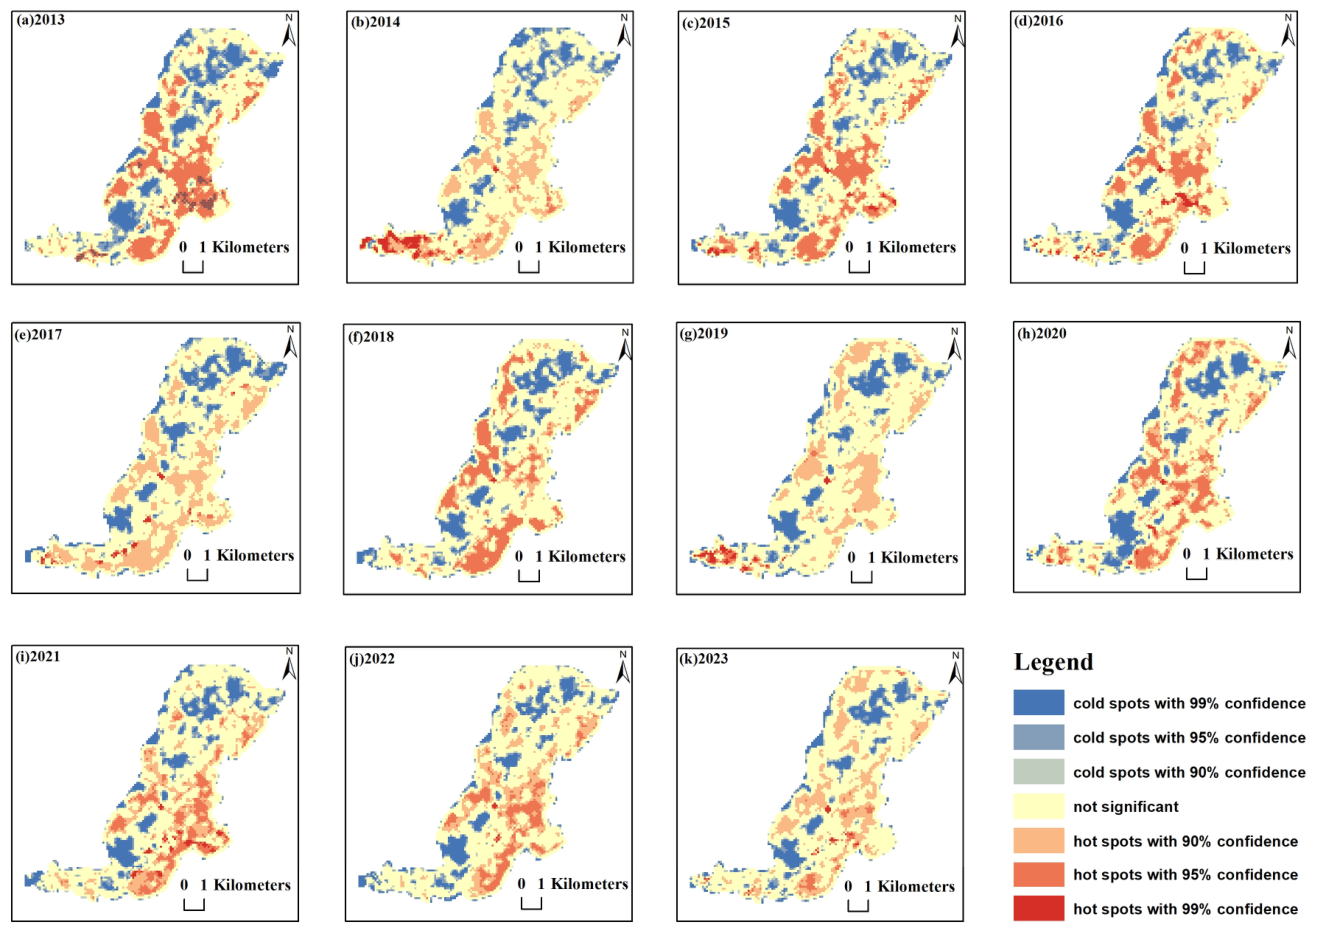
The identification of hotspots and cold spots is based on the Getis–Ord General G local spatial autocorrelation analysis, which further reveals the binary pattern of high- and low-value agglomeration (Figure 4). Hotspot areas are stably concentrated in forest land distribution zones at confidence levels ranging from 95% to 99%, covering contiguous natural secondary forests and water-conservation mountainous areas. Over the past decade, these areas have consistently exhibited a distinct “high-high” spatial correlation. At the same confidence levels, cold spot areas are distributed in human settlements and along transportation corridors, presenting a spatial pattern of “planar spread” and “linear extension”. This pattern reflects the long-term crowding-out effect of urbanization on ecosystem service functions. All terrace areas are located within the “non-significant zone”, indicating that their ESV spatial distribution is relatively uniform with weak neighborhood correlation. This finding is highly consistent with the role of terraces as a contiguous agricultural landscape matrix with small internal value differences.
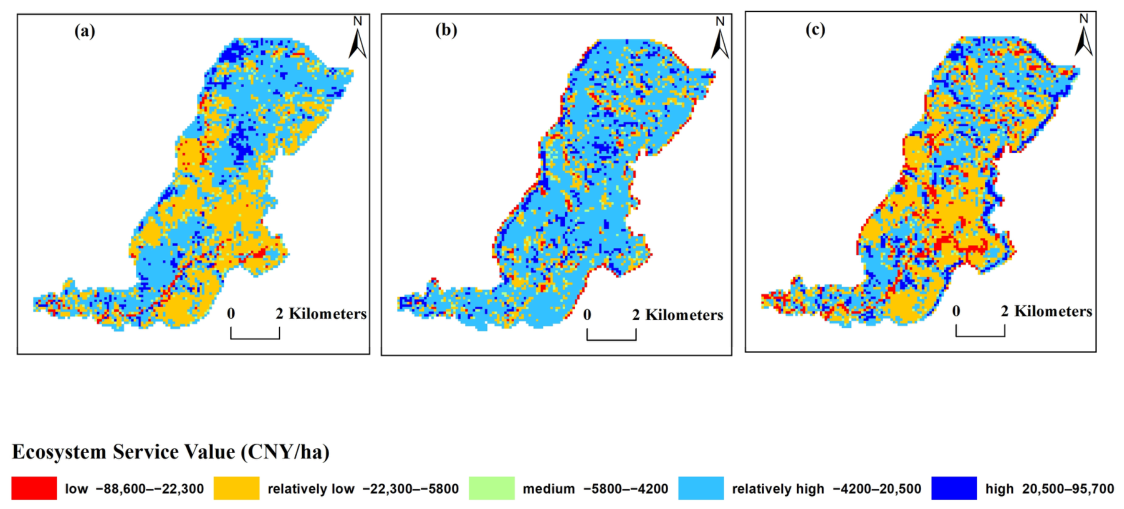
In terms of the dynamic evolution of profit and loss, the Longji Mountain area showed a spatial pattern from 2013 to 2023 characterized as “overall gain dominance, localized negative fragmentation, and concentrated strip-type degradation” (Figure 5). From a decadal perspective (Figure 5a), the net decrease in ESV was 0.9916 million CNY, with negative contributions from cultivated land (−5.6829 million CNY), water bodies (−5.0146 million CNY), and unused land (−0.0192 million CNY). In contrast, forest land achieved a positive growth of +9.7251 million CNY, representing the primary source of ESV gain during this decade. In terms of spatial distribution, the gain areas were primarily concentrated in the central, northern, and southwestern mountainous regions. These areas presented a composite pattern of clustered corridors and patches, with value increases mostly ranging from 20,500 to 95,700 CNY/ha. The periphery areas formed medium-profit-and-loss areas (−5800 to 4200 CNY/ha) and low-profit-and-loss areas (−22,300 to −5800 CNY/ha), constituting a continuous transition zone that extended widely to the western and southern hilly regions. In contrast, high-loss areas were scattered in patchy form along the edge ecotone in the central and eastern regions, as well as in a strip-like pattern extending from the southwest to the northeast across the study area, with ESV loss amplitudes concentrated between −88,600 and −22,300 CNY/ha. To reveal the phased evolutionary characteristics, the ten-year study period was divided into two stages with an early stage (2013–2018) and a late stage (2018–2023), with 2018 as the dividing point. The evolution process showed that during the early stage (Figure 5c), continuous positive gain predominated, with loss changes occurring only sporadically. In the late stage (Figure 5b), the extent and continuity of positive gain decreased greatly, whereas loss changes expanded from edge point-like distributions to central continuous and strip-like distributions, accompanied by a notable increase in medium-intensity transition changes. Consequently, the overall decadal pattern shifted from “overall gain dominance” to “intertwined positive and negative changes with prominent localized degradation”.

3.1.2. Temporal and Spatial Evolution of Individual Ecosystem Service Values

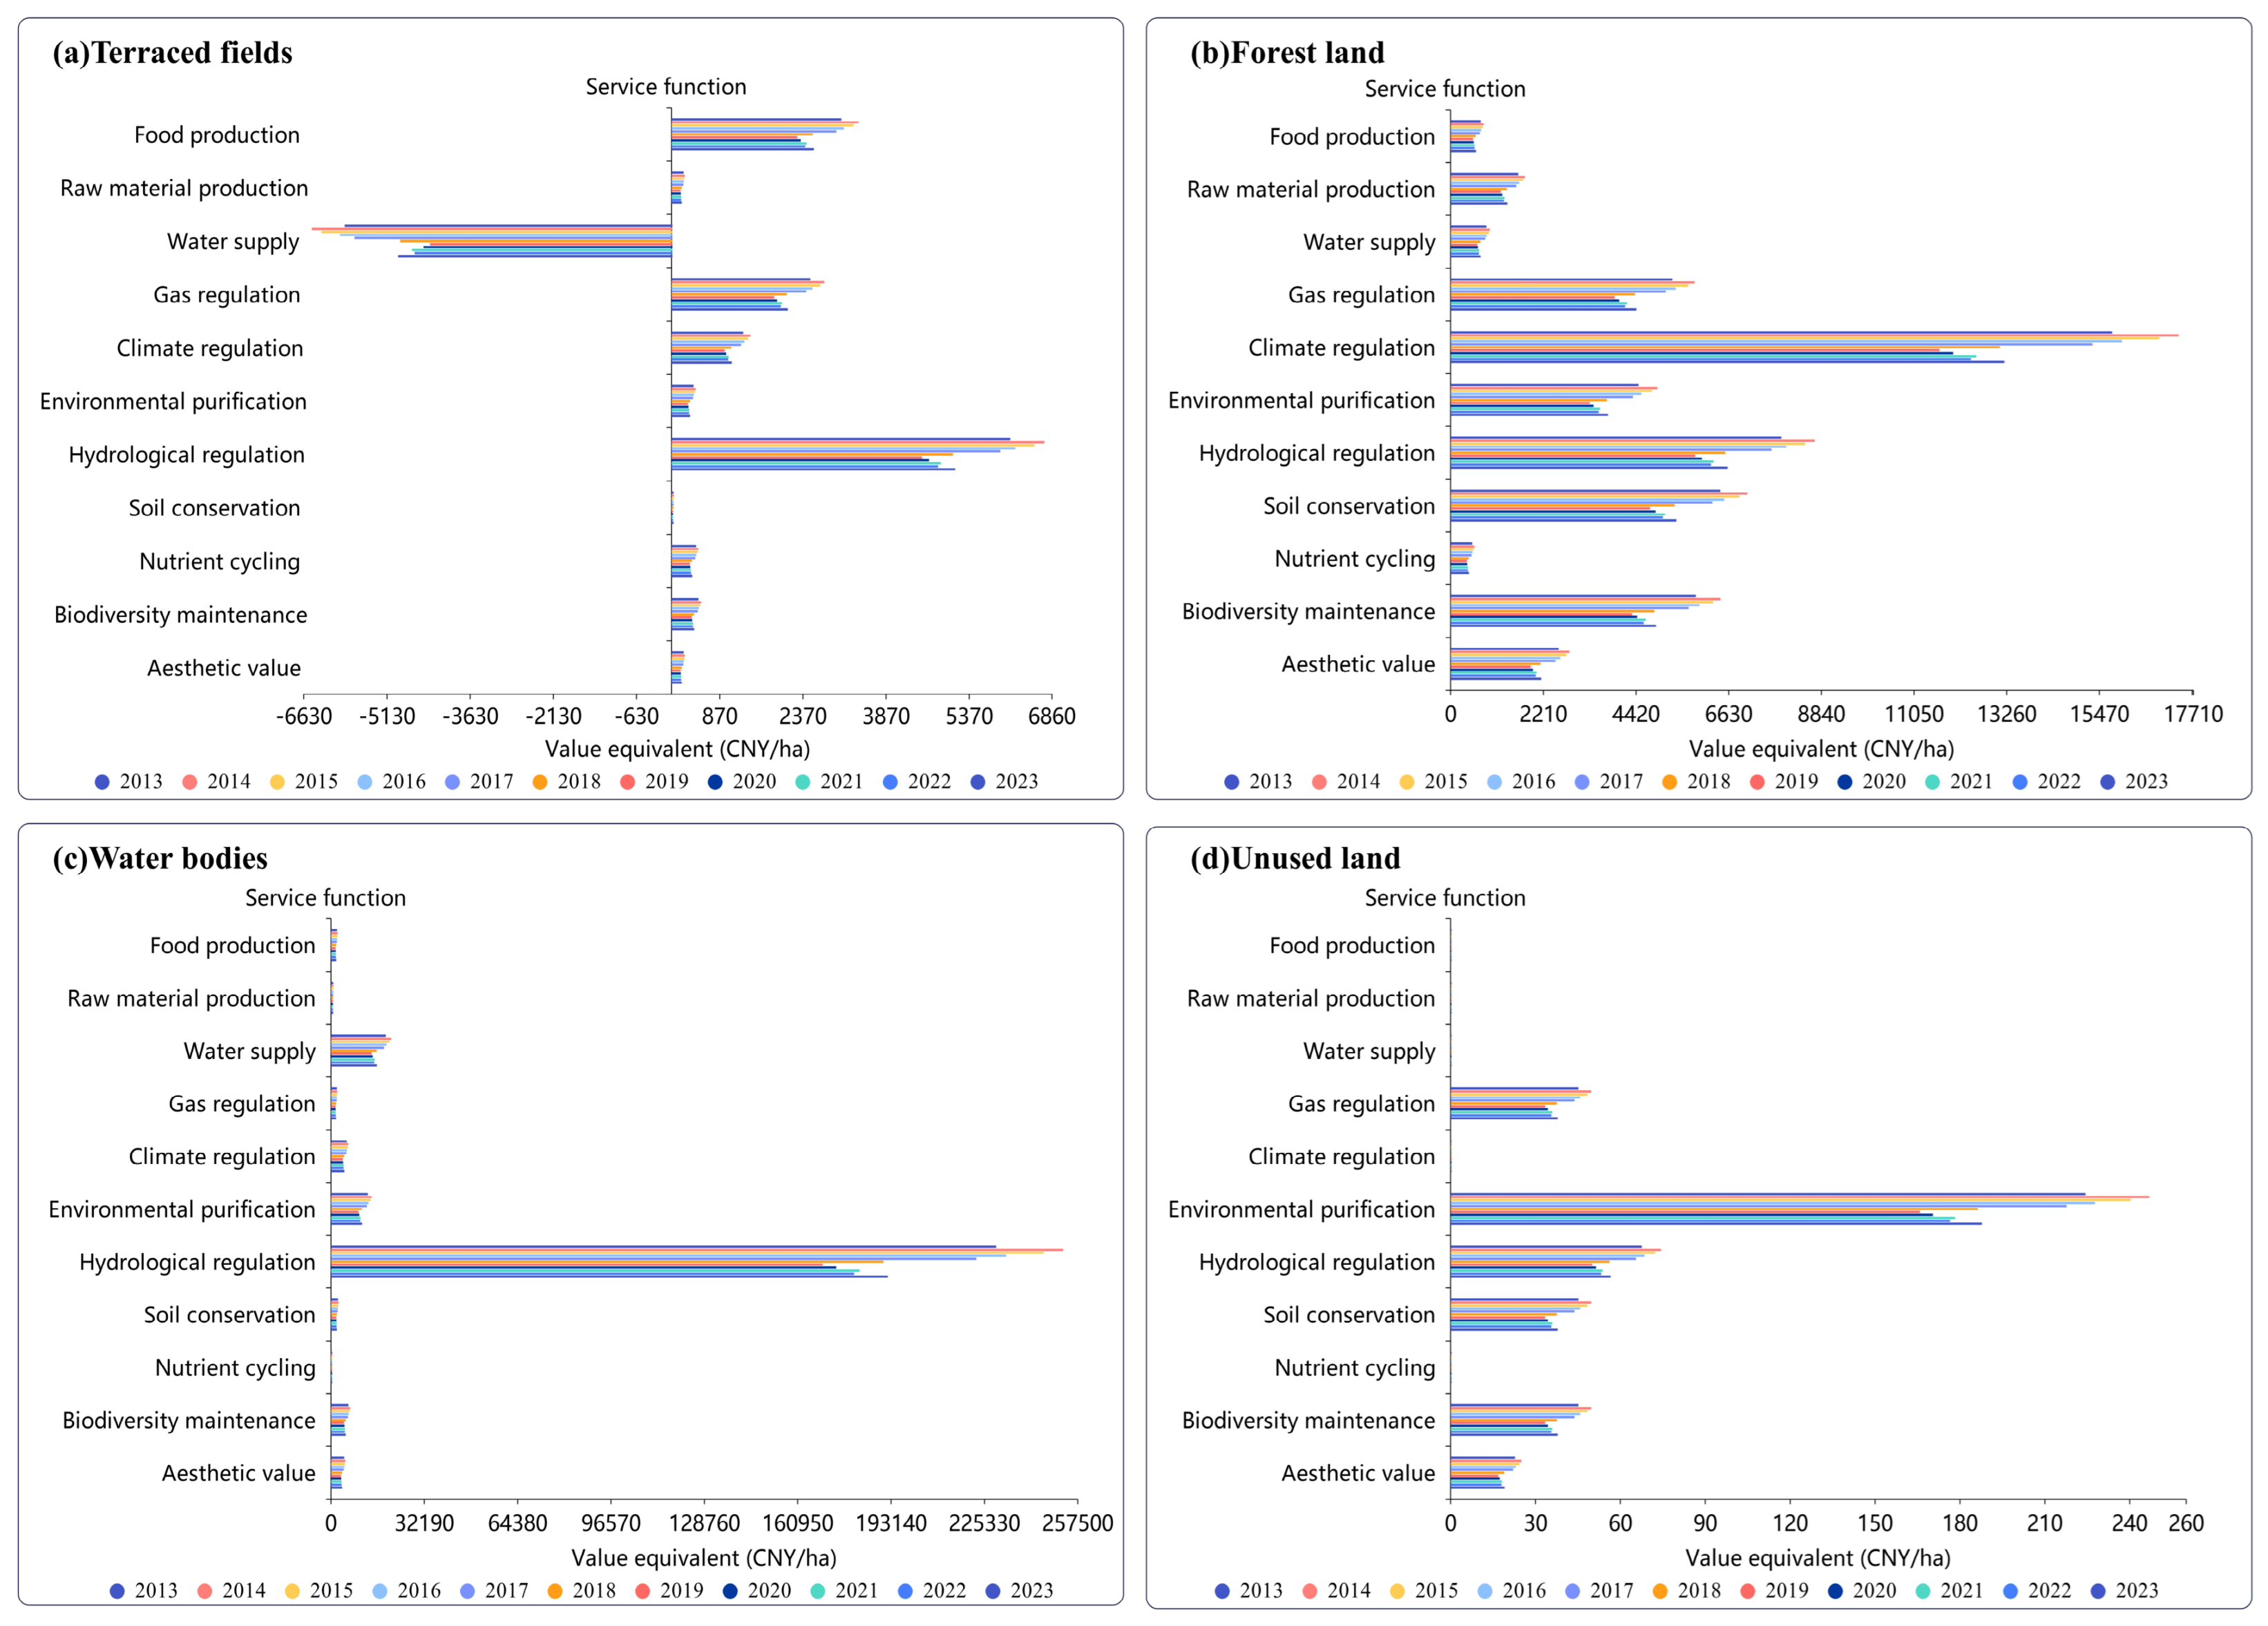
Based on the site-specific conditions of the Longji Mountain area, the equivalent factors were locally adjusted. Accordingly, an ecosystem service assessment functional system suitable for the study area was constructed (Figure 6).
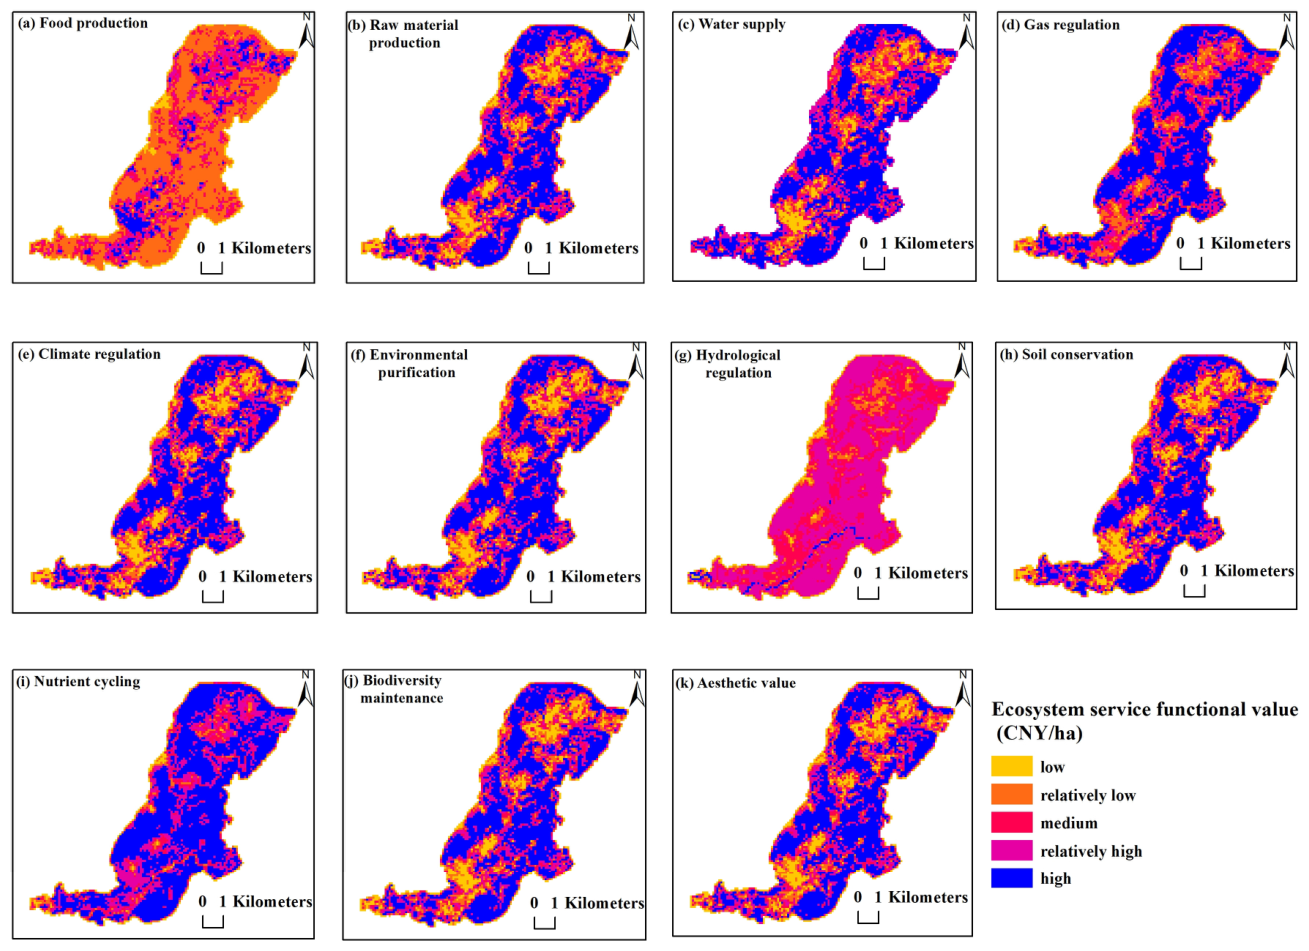
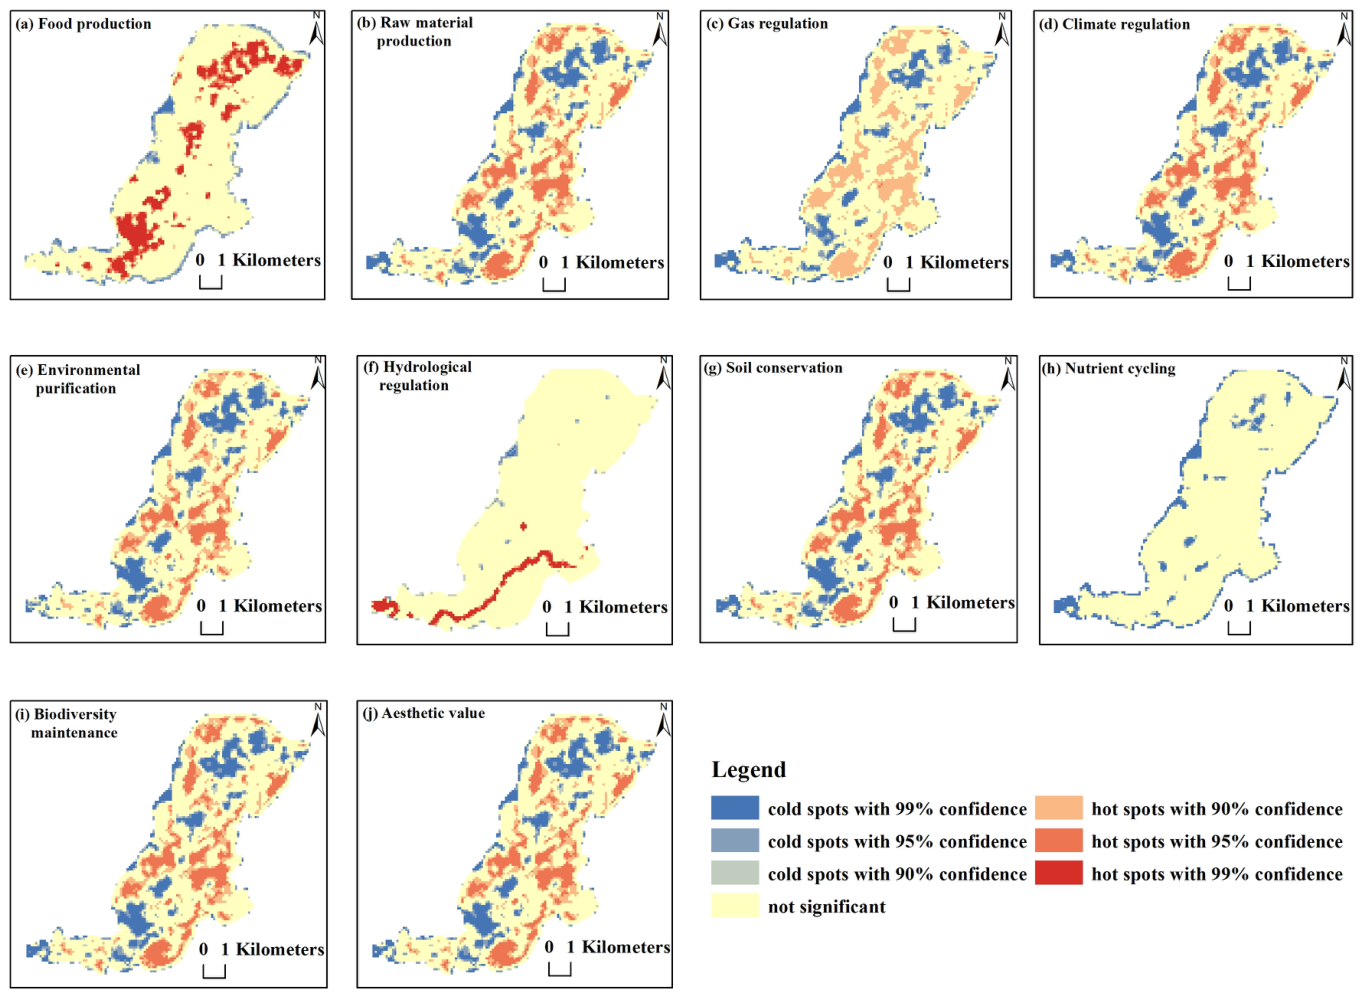
The spatial distribution of individual ecosystem service function values in the Longji Mountain area in 2023 exhibited distinct characteristics that are highly coupled with natural geographical patterns, land use types, and human activity intensities (Figure 7). From a spatial perspective, the high-value areas of different service functions did not completely overlap. Instead, they presented complex spatial relationships with both synergistic and trade-off features. Among all service functions, nine types have highly concentrated high-value zones. These services include raw material production, water supply, gas regulation, climate regulation, environmental purification, soil conservation, nutrient cycling, biodiversity maintenance, and aesthetic value. They were generally distributed in areas with well-preserved natural ecosystems, such as contiguous forests and water bodies, exhibiting distinct spatial agglomeration. This finding indicates that forest and water ecosystems provide overlapping multifunctional effects on regulating, supporting, and cultural services. In contrast, the low-value areas of the aforementioned service functions stably overlapped with human settlements, major traffic routes, and agricultural-intensive areas. This phenomenon reflects the systematic crowding-out effect of human activities on ecosystem service functions. The statistical significance of this spatial differentiation was further confirmed by the hotspot-coldspot pattern and the spatial autocorrelation index (Figure 8). Based on the local spatial autocorrelation analysis of Getis–Ord General G, the hotspot areas (high-value clusters) of six service functions were firmly distributed in continuous forest areas with a high confidence level ranging from 95% to 99%. The six service functions include raw material production, climate regulation, environmental purification, soil conservation, biodiversity maintenance, and aesthetic value. Correspondingly, the coldspot areas (low-value clusters) highly overlap with human settlements, major traffic routes, and unused land, forming a binary dominant spatial pattern of “forest heat versus built-up cold”. The high-value areas for hydrological regulation were distributed along linear river zones and scattered reservoir sites. The high-value areas of food production were clustered in terraced artificial ecosystem areas. The spatial distribution of these two service functions formed mutually exclusive patterns with respect to the other service functions. Further analysis showed that the spatial agglomeration of the hydrological regulation service function exhibited independent differentiation characteristics. Its distinct hotspot areas did not follow forest distribution but were instead concentrated in rivers and reservoirs. This result reflects the irreplaceability of water ecosystems in providing this service.
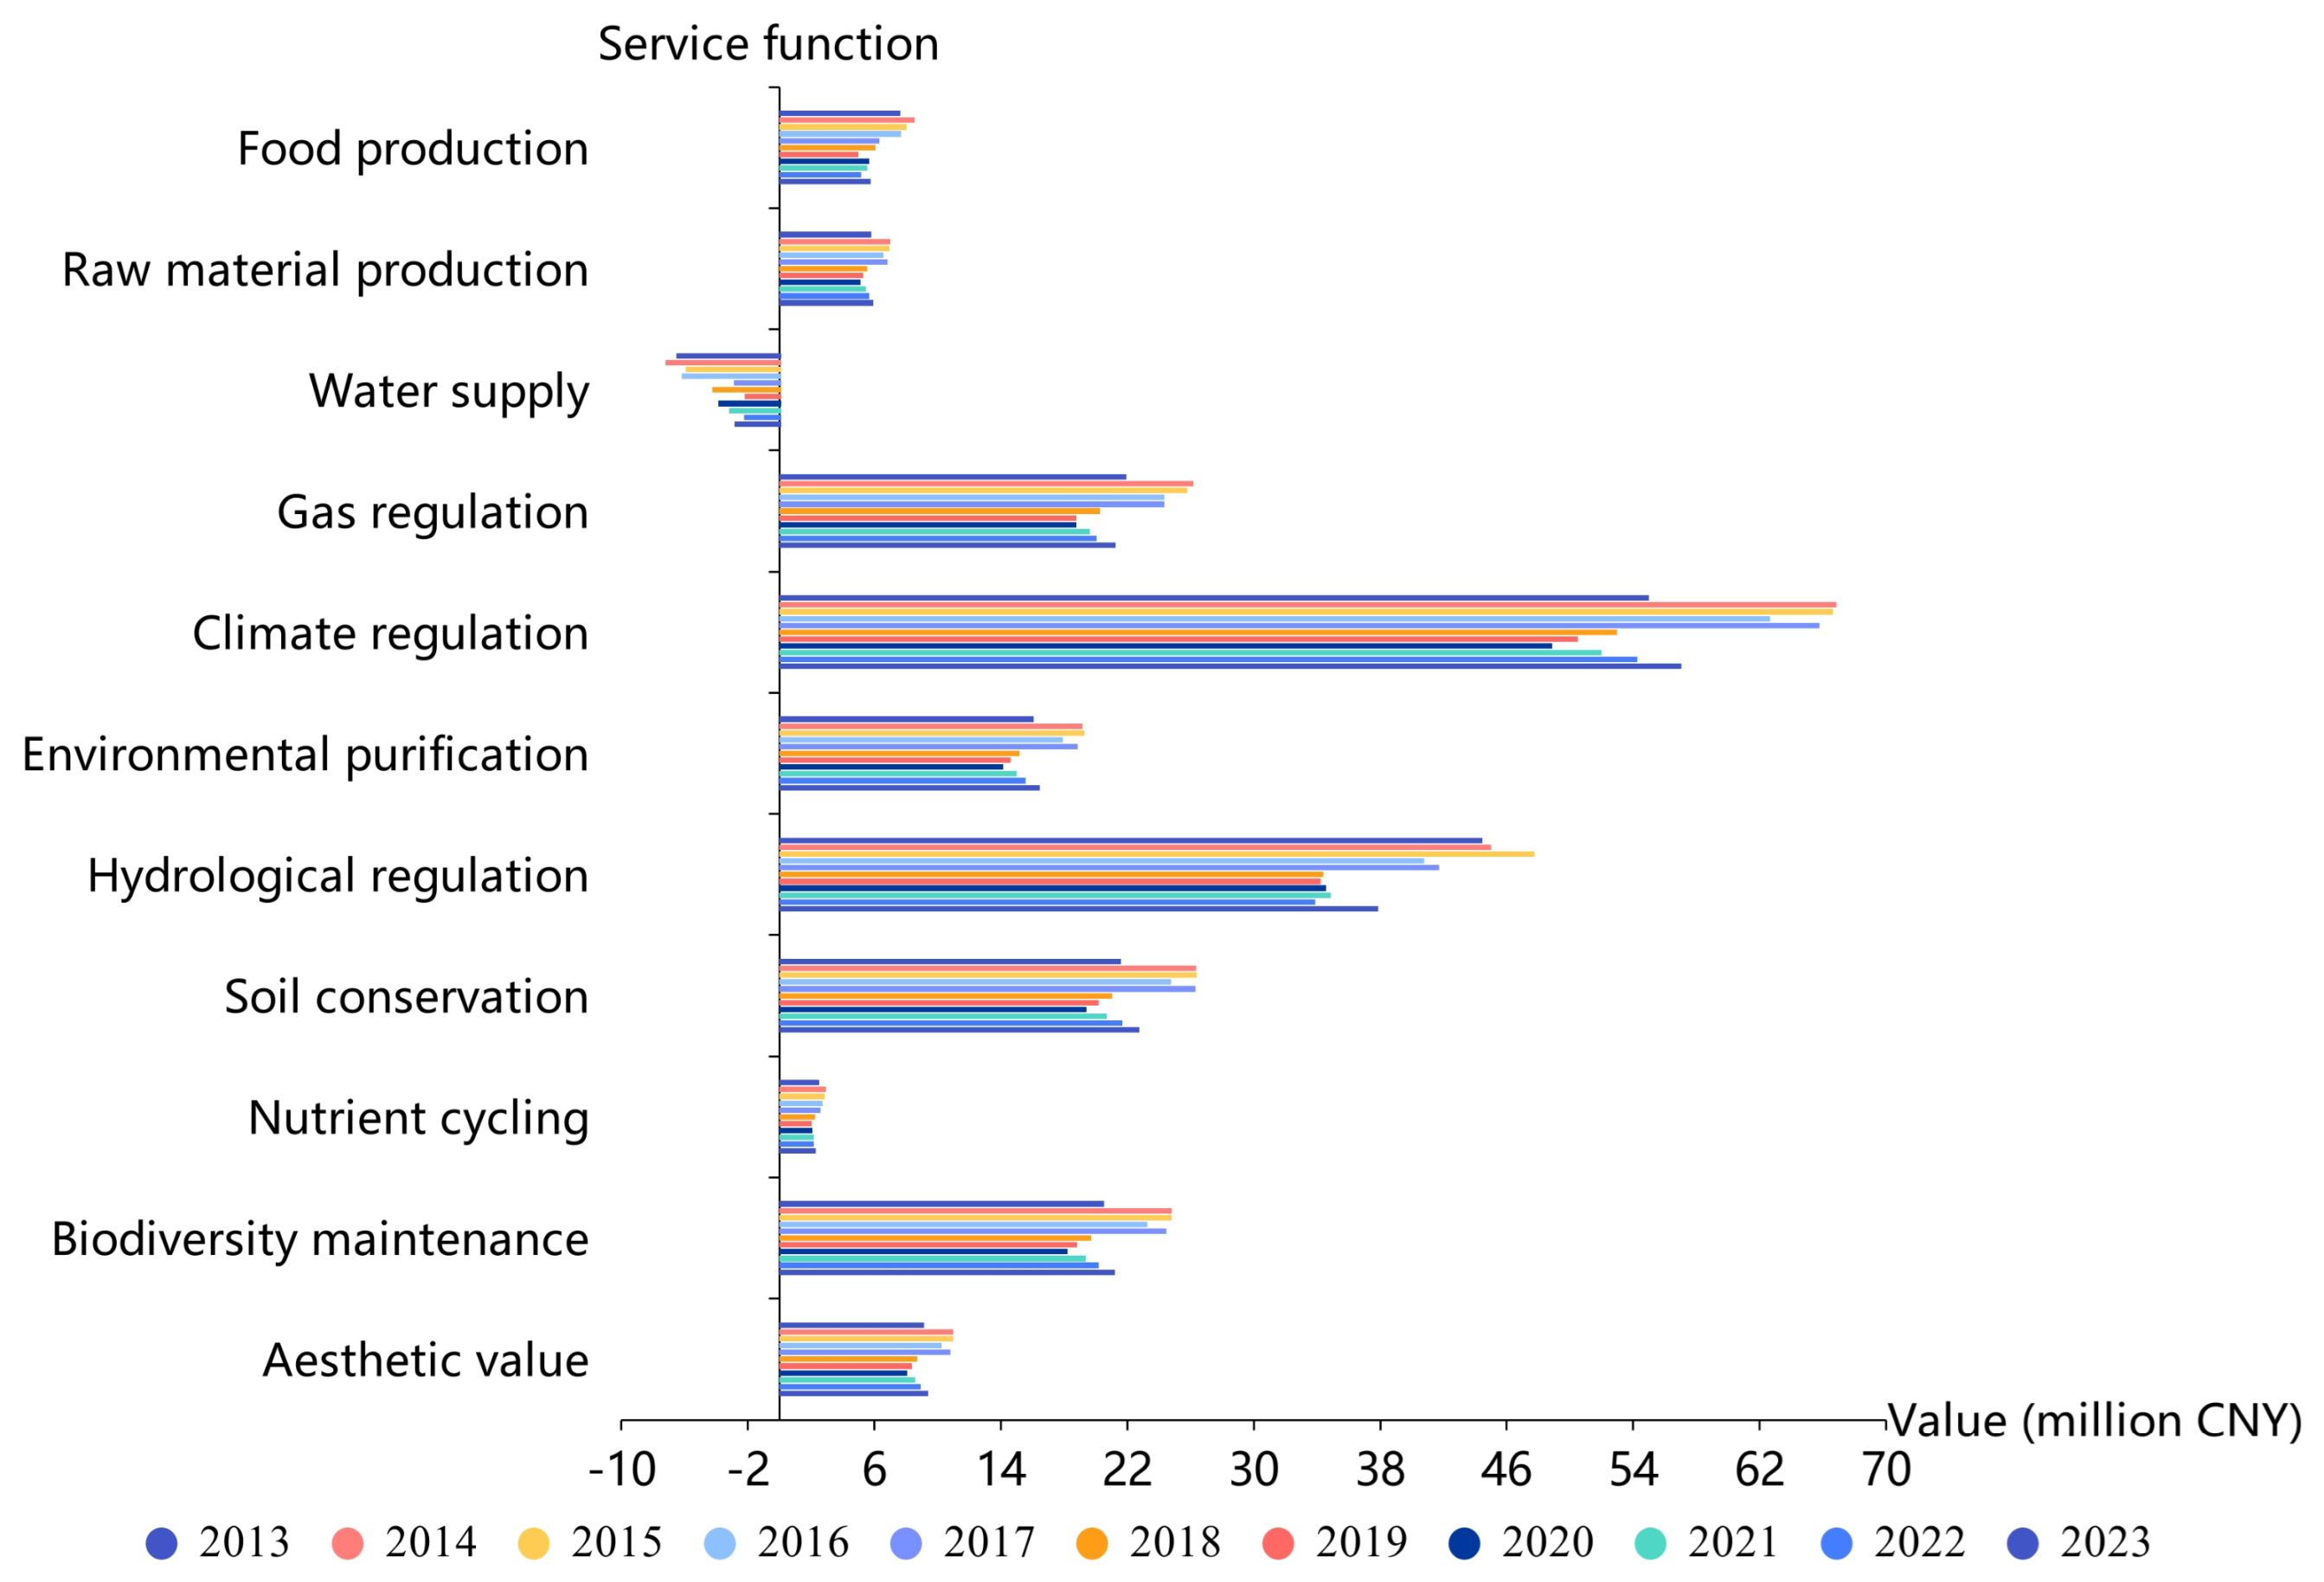
There are considerable differences in the value composition of the various ecosystem service functions. Climate regulation is the single function with the highest value in the study area, amounting to 56.90 million CNY. Other service functions are ranked in descending order of value as follows: hydrological regulation, soil conservation, gas regulation, biodiversity maintenance, environmental purification, aesthetic value, raw material production, food production, and nutrient cycling (2.18 million CNY). Water supply is the only service with a negative value of −2.85 million CNY, indicating a deficit in water-related ecological functions. This deficit is closely associated with the imbalance between regional water resource supply and demand, seasonal drying-up of certain river sections, and reduced water inflow from upstream areas.
The spatial autocorrelation index further quantifies the agglomeration intensity of the study area (Table 4). The global Moran’s I indices for the eleven service functions are all positive, with an average value of 0.60. This shows that all services have distinct positive spatial autocorrelation at the global scale. Among these, Moran’s I index for water resource supply is the highest (0.70), reflecting the strongest agglomeration effect. In contrast, the index for hydrological regulation is the lowest (0.32), indicating relatively weak spatial autocorrelation. This result is consistent with the linear and intermittent distribution of water bodies. High/Low Clustering (Getis–Ord General G) analysis further reveals that, except for water supply, the observed General G values of the other ten service functions are greatly higher than the expected values (p < 0.01), confirming the presence of noticeable high-value agglomeration hotspots. The water resource supply function did not pass the significance test. This may be attributable to its zonal or punctate distribution along rivers and reservoirs, or to insufficient local contrast, rather than to any diminution of the service function itself. The mean Z-score for the eleven service functions is 65.10, which is substantially above the critical value of 1.65. All p-values are below 0.01, providing further statistical confirmation of the obvious agglomerative spatial distribution of service values.
Between 2013 and 2023, the values of the eleven ecosystem service functions in the Longji Mountain area exhibited an obvious trend of differentiation and evolution. Specifically, regulating and supporting services showed an overall increase, while provisioning services and some regulating services experienced decreased or fluctuated adjustments (Figure 9, Table 5). This evolutionary trend has three key features: “core regulating services”, “distinct functional differentiation”, and “a transition from provisioning to regulating services”.
From the perspective of the average annual structure over the past decade, regulating services have occupied an absolutely dominant position in the total annual average value. Specifically, the total value of regulating services was 134.53 million CNY, accounting for 67.91% of the overall total. Among them, climate regulation (57.37 million CNY) and hydrological regulation (38.91 million CNY) alone contributed 48.61% of the total value, thereby supporting the core framework of regional ecological functions. Supporting services totaled 46.27 million CNY. Regulating and supporting services combined accounted for 91.27% of the total value, dominating the overall pattern of ecosystem functions in the study area. Cultural services (aesthetic value) reached 9.34 million CNY. Provisioning services totaled only 7.94 million CNY, among which water resource supply registered a negative value of −4.31 million CNY, accounting for only 4% of the total value.
From the perspective of individual function changes, the study area exhibits a characteristic of “distinct functional differentiation”. Although water supply is the only function with a long-term negative value, it has shown the largest increase over the past decade (+3.67 million CNY). Its negative value shrunk from −6.51 million CNY in 2013 to −2.85 million CNY in 2023, indicating the most obvious improvement. Climate regulation ranks second in growth contribution, and it is the main force of the improved ecosystem service functions, including soil conservation, biodiversity maintenance, and environmental purification. Raw material production (+0.16 million CNY) and aesthetic value (+0.27 million CNY) have shown slight growth, respectively. In comparison, food production, gas regulation, hydrological regulation, and nutrient cycling have declined to varying degrees. Both climate regulation and hydrological regulation have exhibited a V-shaped reversal trajectory characterized by a “deep decline followed by a rebound” over the past decade, reflecting the effectiveness of ecological function restoration. Provisioning services have performed relatively weakly. Food production shows a net decrease of 1.89 million CNY over the decade, indicating that the ecological efficiency of terraced artificial agricultural land has not improved. Changes in nutrient cycling maintenance (−0.19 million CNY) and aesthetic landscape (+0.27 million CNY) show moderate changes with opposite changing trends.
Using 2018 as a time node, the study period was divided into two phases, and the value changes of the various service functions clearly reveal the characteristics of each phase. The early phase (2013–2018) represented a period of comprehensive functional contraction. Except for an improvement in the water supply function, all other service functions declined. In contrast, the later phase (2018–2023) marked a period of comprehensive growth in regulating and supporting services. Specifically, seven types of regulating and supporting services, including climate regulation, hydrological regulation, soil conservation, environmental purification, biodiversity maintenance, gas regulation, and nutrient cycling, increased substantially compared with the early stage. The change reflects the obvious improvement of regional ecosystem service functions. During this later phase, the focus of service value shifted from “resource supply” to “functional regulation”. The spatial pattern of ecosystem services tended toward stabilization, and the overall trend developed positively.

3.2. Scenario Simulation of Future Ecosystem Service Values

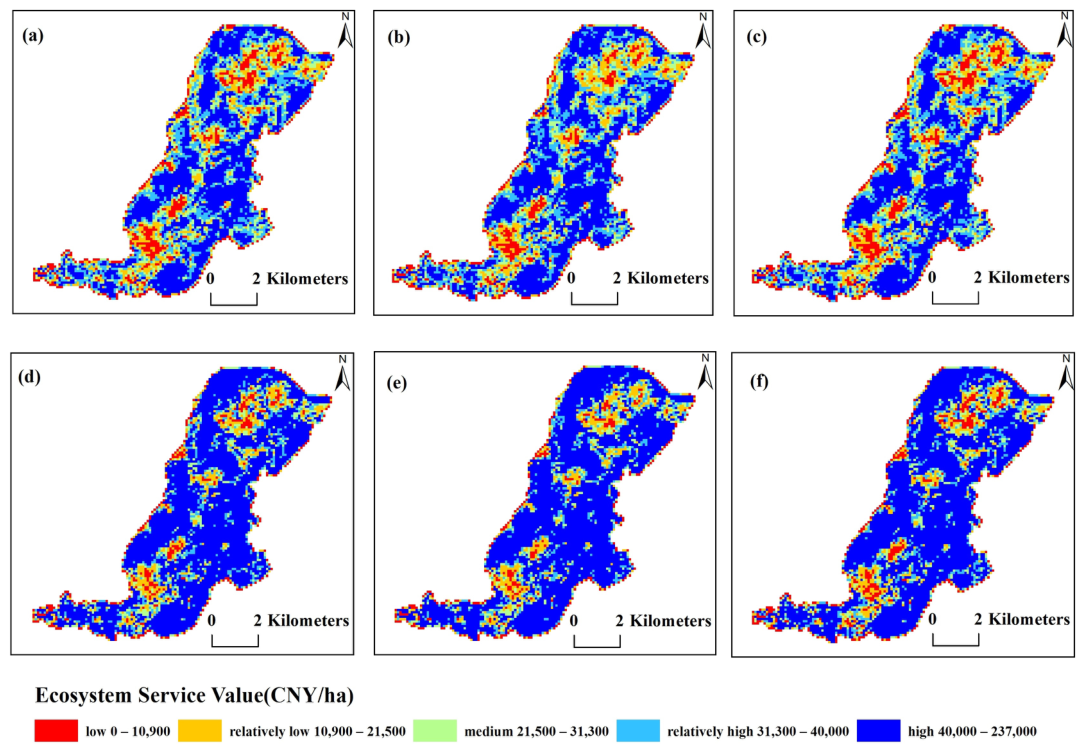
To explore the future evolutionary patterns of ESV in the research area, this study simulated the spatial distribution of ESV per-hectare in 2028 and 2033 under three scenarios: ecological protection, natural development, and tourism development (Figure 10). The results of the three scenario simulations intuitively reflect the spatial evolution trends of ESV in the study area under different development paths. Under the ecological protection scenario, high-value zones (e.g., concentrated forest land and wetland areas) are maintained or even expanded, spatial connectivity is enhanced, and the ecosystem structure becomes more stable. Under the natural development scenario, high-value zones are partially eroded, while medium- and low-value zones expand. Under the tourism development scenario, the expansion of construction land is evident, and ecosystem service functions face greater pressure. Figure 10 visually illustrates the spatial differentiation characteristics of ecosystem service values under the three development paths.
The simulation results for the spatial distribution of ESV per-hectare under the three scenarios in 2028 are shown in Figure 10a–c. Under the natural development scenario (Figure 10a), low-value patches are large in number, exhibit strong connectivity, and cover large areas, with a wide transition band in the median-value zones. These low-value patches are interspersed with high-value forest areas around major transportation routes and human settlements. This landscape reflects the gradual encroachment of human development activities on forest land and the high spatial heterogeneity of the overall landscape. Under the ecological protection scenario (Figure 10b), high-value areas are the most intact and continuously distributed across a large territory. Patch connectivity is greatly enhanced, forming coherent ecological corridors. Compared with the natural development scenario, some median-value areas are transformed into high-value areas, indicating that ecological restoration measures have achieved initial success. Both the extent and number of low-value patches decrease, and the expansion of low-value areas has been effectively restrained. The transition zone of median-value areas shrinks accordingly. Under the tourism development scenario (Figure 10c), the degree of landscape fragmentation is the highest among the three scenarios, with strong edge effects and wide-spreading human disturbance. This demonstrates that tourism development pressure directly leads to the degradation and fragmentation of forest ecological space.
According to the total value of ecosystem services (Table 6), the average annual ESV in the study area from 2013 to 2023 was 198.10 million CNY. The total ESV under the three scenarios in 2028 is listed as follows: 194.77 million CNY for the natural development scenario, 200.43 million CNY for the ecological protection scenario, and 194.19 million CNY for the tourism development scenario. Among the three scenarios, the ecological protection scenario has the highest ESV. Its maximum spatial value (0.19 million CNY/ha) and average value (3.23 × 10⁴ CNY/ha) are both higher than those of the other two scenarios. Based on the total ESV, the maximum spatial value and the average spatial distribution values, the three scenarios rank as follows: ecological protection scenario > natural development scenario > tourism development scenario. The total ESV of the tourism development scenario was 0.58 million CNY lower than that of the natural development scenario, accounting for 0.30% of the total value of the tourism development scenario. Across different land use types, the value of forest land was notably higher than that of other land use categories. The contributions of terraces, water bodies, and unused land are relatively limited to the total ESV.
The simulated spatial distribution of ESV in 2033 under the three scenarios is shown in Figure 10d–f. Comparing the simulation results in 2028 and 2033, the total ESV shows a continuous growth trend under all three scenarios. Specifically, the average total ESV of the three scenarios in 2033 was 255.27 million CNY. The value is higher than the average value in 2028 (196.46 million CNY) and also exceeds the average annual value in 2013–2023 (198.10 million CNY). Under the natural development scenario (Figure 10d), the high-value forest land areas became more continuous and less fragmented, with a distinct reduction in fragmentation, forming more complete large patches. The stability and connectivity of high-value habitats were further improved. Additionally, the number of low-value patches decreased greatly. Their spatial extent shrank noticeably. And their distribution became more dispersed. Under the ecological protection scenario (Figure 10e), the cumulative benefits of ecological protection continue to emerge. Not only are high-value areas effectively maintained, but they have also expanded further, accompanied by a great enhancement in ecological connectivity between patches. Some areas with medium value in 2028 have been transitioned to high-value areas. The change proves the long-term effectiveness of ecological restoration. The overall landscape thus presents a healthy ecosystem pattern characterized by a stable structure and enhanced functionality. Under the tourism development scenario (Figure 10f), the total ESV in the study area still increases steadily. However, the total value under the tourism development scenario is 0.93 million CNY lower than that under the natural development scenario in the same year, representing a slight drop of only 0.37% relative to the total value under the tourism development scenario. Across all three scenarios, the maximum spatial values show an upward trend from 2028 to 2033. This indicates that the service value density of core high-value patches keeps increasing. Meanwhile, value differences within the region may have narrowed due to the general improvement of medium-value areas, reflecting a trend of simultaneous increases in both total value and peak spatial ESV. Overall, from 2028 to 2033, the landscape under the three scenarios has changed from a pattern characterized by “interspersed high and low values with moderate fragmentation” to a new pattern dominated by “high-value areas with enhanced connectivity”.

4. Discussion

4.1. A Coupling Framework for the Human–Land System in Ecologically Fragile Hilly Regions

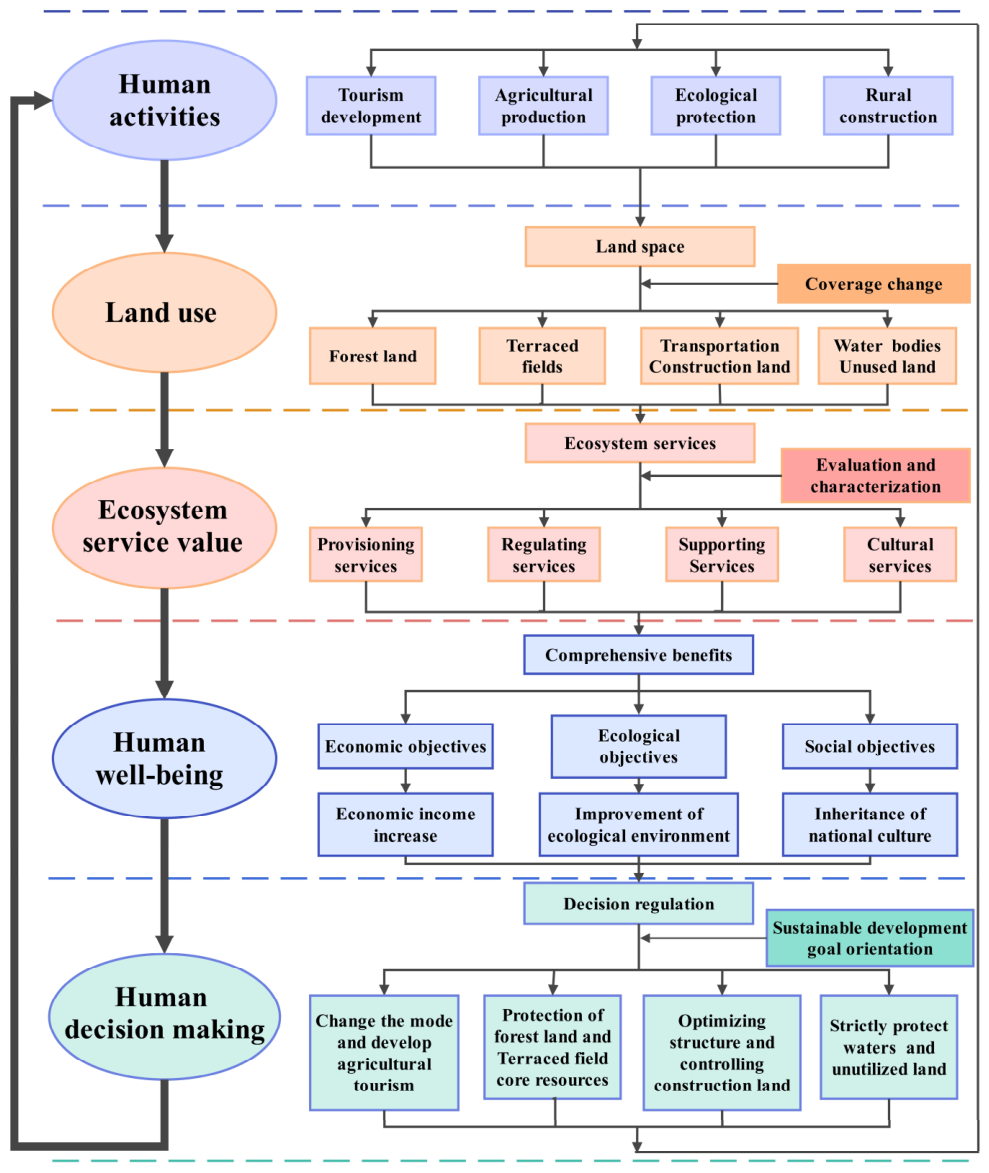
In recent years, academic research on the coupling of human–land systems and the governance of ecologically fragile areas has continued to deepen. In terms of theoretical construction, existing studies have defined human and natural systems as complex adaptive systems and have developed the theoretical framework of “landscape pattern–ecosystem services–sustainable development”, which provides important theoretical support for the study of human–land relationships [45]. In the field of vulnerability research, the “vulnerability interaction framework” proposed by scholars systematically delineates the transmission pathways of vulnerability between human society and natural systems. It offers a clear analytical perspective for the formulation of regulatory strategies and risk avoidance in ecologically fragile areas [46]. In terms of research methods, the system dynamics modeling framework integrates human subsystems (economy, population, food, energy, and water resources) and natural subsystems (climate, land, carbon cycle, and water supply) into a unified analytical framework. It provides reliable technical support for multi-scenario simulation and path comparison in ecologically fragile regions [47]. In terms of regional empirical research, an analytical framework for sustainable agricultural development has been established for karst fragile areas in China. This framework systematically integrates multidimensional indicators, including land suitability evaluation, resource and environmental carrying capacity, and ecological vulnerability classification. It has accumulated valuable experience for the coordination of human–land relationships in similar ecologically fragile hilly areas [48]. In terms of spatial governance, the dynamic balance framework of “human–earth–ecology” emphasizes the need to holistically consider ecosystem functions, geological environmental foundations, and human activity demands in territorial spatial planning. It provides systematic guidance for ecological restoration zoning and spatial regulation in ecologically fragile areas [49]. Based on the above theoretical frameworks and methodological foundations, this study focuses on the micro-level practical research of typical ecologically fragile hilly areas. Taking the spatiotemporal change patterns of ESV and future scenario simulation results in the Longji Mountain area from 2013 to 2023 as the basis, this study constructs a targeted human–land system coupling framework for ecologically fragile hilly areas (Figure 11). This framework represents a microscopic, localized, and operable extension of existing theories. Its core logical chain is “human activities—land use—ecosystem services—human well-being—decision-making regulation”. In this logical chain, the interaction between human development activities (e.g., terrace development, ecological protection, and tourism development) and natural environmental processes directly changes the spatial pattern and intensity of land use. These changes lead to the spatial reorganization of land use types, which in turn affects the spatial distribution of ecosystem service values. In this framework, land use change acts as the core coupling node within this framework, determining the type and quantity of ecosystem service supply. In turn, ESV acts as a key indicator to measure the human–land coupling state, and its value level directly reflects the ecosystem health status. It should be noted that while ecosystems are dynamic and possess a certain degree of resilience, different human development paths can lead to distinct differences in ecosystem outcomes. Specifically, the ecological protection scenario is the optimal path to realize coordinated and sustainable development of the human–land system in this ecologically fragile area. By contrast, the tourism development scenario requires scientific and standardized management to prevent irreversible damage to ecosystem services. Furthermore, the ultimate transformation of ESV into tangible economic, ecological, and cultural benefits for local residents is the internal driving force for achieving regional sustainable development. Concurrently, decision-making regulation, which involves formulating and adjusting policies and plans based on changes in ESV and human well-being needs, exerts a reverse regulatory effect on human activities and land use, thereby forming a closed feedback loop. In summary, this framework aims to explain the coupling relationship between “human development activities, land use change, and ecosystem service response” in ecologically fragile hilly region, to reveal the interaction mechanisms and evolution pathways of the human–land system, and to provide theoretical support for achieving regional sustainable development.
Different decision-making paths lead to markedly different evolutionary trajectories of human–land systems, and decision-making regulation serves as a key lever for achieving continuous improvement of ecosystem services. This study proposes a coupling framework of the human–land system in the ecologically fragile hilly region, which emphasizes a decision-making and regulatory mechanism oriented toward sustainable development goals. Optimization decisions should focus on the following aspects. First, the development model should be transformed to promote agricultural tourism. This approach can drive the growth of the agricultural tourism industry and increase economic income. By inheriting the thousand-year rice culture, land degradation can be reduced through controlled planting. Future tourism development plans should be formulated to restrict the construction of buildings and transportation facilities so as to promote ecotourism development. It is also essential to reduce the adverse effects of tourism development on the ecosystem and to ensure the steady growth of the total ESV [50]. Second, core resources, including forest land and terraced fields, should be protected. Ecological protection measures should be carried out to maintain state-owned ecological public welfare forests, prevent the reduction of forest land area, enhance forest coverage, and plant native tree species such as Pinus massoniana and Phyllostachys pubescens to stabilize soil and conserve water. Meanwhile, the protection and restoration of terrace resources should be reinforced to prevent the loss of terraced fields, and the integration of terrace farming culture with tourism should be promoted [51]. Third, the land use structure should be improved by controlling construction land expansion. The expansion of construction land for purposes such as homestays and roads must be strictly controlled. Three-dimensional and intensive land use practices, such as multi-story parking lots and high-rise homestays, should be adopted. In addition, the protection of traditional villages and the inheritance of national cultural heritage must be reinforced [52]. Fourth, water bodies and unused land should be under strict protection. Water resources must be fully safeguarded and water pollution prevented and controlled. Furthermore, investigation and evaluation of unused land should be strengthened, and its development and utilization scientifically planned. The negative impacts of driving factors such as homestay catering on water bodies and unused land should be controlled [53].
In summary, the conceptual framework of human–land system coupling in ecologically fragile hilly regions clearly explains the internal logic and feasible pathways of human–land coordination and sustainable development in the ecologically fragile mountainous region of Longji, Guangxi. This study provides a framework that offers a theoretical basis for understanding and simulating human–land interactions in ecologically fragile areas. It can also guide regional spatial planning, the development of ecological compensation policies, and the evaluation of sustainable development. Furthermore, it offers a theoretical and practical basis for research on and sustainable management of human–land systems in similar ecologically fragile mountainous regions worldwide, such as the East African Plateau and the Andes Mountains. It thus carries broader significance for studies of ecologically fragile areas.

4.2. Revision of Equivalent Factors for ESV

Based on the evaluation framework proposed by Costanza et al. [1,37], Xie Gaodi and other scholars [5,14] developed a value accounting method grounded in the net profit of grain production within farmland ecosystems. When this framework is applied to local-scale research, the regional correction of the equivalent factor essentially tests and calibrates the relative level of regional ecosystem service capacity through a measurable proxy variable of the “grain yield ratio”. Xu et al. [29] adopted the equivalent factor method to calculate the monetary value of standard equivalent factors based on grain prices in the base year. This method supports dynamic temporal comparison for the ESV assessment of the Yangtze River Delta urban agglomeration. Jia et al. [27] applied the same method to calculate the monetary value of standard equivalent factors based on unit grain yield and its corresponding market price. Their study enables static spatial comparison for ESV evaluation of agricultural ecosystems in arid and semi-arid regions of North-west China. Both studies defined the equivalent factor of different service types as multiples of the unit grain value. Collectively, their methodological approach explicitly takes grain price as the core value benchmark, thereby supporting the “grain crop–equivalent factor” accounting pathway. It should be noted that this correction process implicitly assumes a linear relationship between the intensity of ecosystem services and the level of unit grain yield. This assumption may introduce potential uncertainties in several respects. For example, the regional average of unit grain yield fails to capture the actual spatial heterogeneity of ecosystem services, which could lead to obvious deviations in areas including steep slope farmland and sparse woodland [54]. Moreover, the changes in regulating and cultural services may not necessarily be linearly or synchronously correlated with unit grain yield [55]. Furthermore, the linear assumption struggles to account for the nonlinear responses of ecosystem services under extreme disturbances [56]. In light of the above uncertainties, although this assumption demonstrates satisfactory applicability at the current scale, future research should conduct cross-validation of the linear hypothesis as corrected by the equivalent factor method. Specifically, the verification approaches may include three aspects. The first is to incorporate spatial distribution data of net primary productivity (NPP) derived from high-resolution remote sensing inversions or analyze measured biomass data from sample plots. The second is to select different representative service types to compare their deviations from the equivalent factor-corrected values across various land use types. The third is to select long-term NPP time series data to compare with the interannual variation of grain yield over the same period, followed by an analysis of their response curves during extreme climate years, such as droughts or floods. Such efforts would further clarify the applicable scope and potential uncertainties of this method in mountainous and complex ecosystems.
This study established three future scenarios—natural development, ecological protection, and tourism development—to simulate the potential evolution paths of ESV in the Longji Mountain area under different policy guidelines. From a spatial perspective, although the tourism development scenario leads to local degradation and spatial fragmentation of high-quality ecological patches, the simulated total ESV remains higher than the historical annual average from 2013 to 2023. This finding suggests that, within the current scope of the study area, moderate tourism development, while causing spatial restructuring of the ecosystem and localized functional degradation, has not resulted in a systemic collapse of the total regional ESV. This result confirms that the terrace-forest composite landscape system in the Longji Mountain area has strong buffering capacity and resilience to certain intensities of human development activities. It should be noted that the equivalent factors employed in the above three scenario simulations are primarily derived from historical value coefficients through temporal extrapolation. These factors do not dynamically incorporate external driving factors—such as technological advancements, climate change, and sudden policy interventions—that could potentially affect the value coefficients themselves. For example, agricultural technological innovations may enhance the service output efficiency per unit area of cultivated land [57]; climate change may alter the structural integrity and functional performance of ecosystems [58]; and new ecological compensation policies may change the economic value of grain yield per unit equivalent factor [59]. The omission of these factors implies that the current estimation of total ESV still carries a certain degree of uncertainty. This uncertainty may particularly affect the predictive accuracy of long-term scenario simulations. Future research should adopt actual land use observation data from 2028 and 2033 to conduct posterior verification and deviation analysis of the current simulation results. As noted by Furniss et al. [60], although cross-scenario comparisons can reveal relative rankings and policy priorities under different development paths, they cannot replace direct comparison with empirical data. The lack of a “reality check” makes it difficult to independently determine the reliability of the absolute predictive values of the simulation results. Therefore, posterior verification based on future measured data is a necessary step for evaluating the predictive accuracy of the model. On this basis, the dynamic adjustment mechanism of the equivalence factor can enhance the accuracy and practical value of future scenario simulations.

5. Conclusions

This study takes the Longji Mountain area in Guangxi, China, as a typical case. It systematically analyzes the temporal and spatial evolution of ESV from 2013 to 2023 and simulates the spatial pattern of ESV under three scenarios—ecological protection, natural development, and tourism development—in 2028 and 2033. The study further constructs a conceptual framework for human–land system coupling in ecologically fragile hilly areas. The main conclusions are as follows:
(1)
The total ESV showed a fluctuating trend of “initial increase, followed by decrease, and then recovery in the later period”. Over the past eleven years, the average annual ESV was 198.32 million CNY, with an average annual growth rate of −0.15%. Spatially, a heterogeneous pattern emerged, characterized by “high-value agglomeration of forest land, mid-value transition of terraced fields, and low-value insertion of construction land”.
(2)
The differentiation of individual service functions was distinct, with regulating and supporting services as the dominant types. Regulating and supporting services accounted for over 91.27% of the total ESV, while provisioning services showed a shrinking trend. Water supply services remained negative for a long period but improved greatly, indicating that the regional water ecological deficit has been alleviated but not fundamentally reversed.
(3)
The ESV evolution analysis and the scenario simulations confirmed the key regulatory role of human decision-making in shaping ecosystem services. The ESV gain and loss changes over the past decade revealed a spatial pattern characterized by “dominant gains, fragmented losses, and strip-shaped degradation”. Scenario simulations further indicated that the total ESV and spatial structure were optimal under the ecological protection scenario, while the tourism development scenario performed the worst. The total ESV showed an increasing trend under all three scenarios, with a tendency for spatial differences to narrow.
(4)
A coupling framework for the human–land system in the ecologically fragile hilly region was constructed, which centered on the core elements of “human activities—land use—ecosystem services—human well-being—decision-making regulation”. This framework provides a theoretical basis for understanding human–land interactions in ecologically fragile regions.
This study has several limitations. The correction process of equivalence factors involves a simplified assumption that ecosystem service functions are linearly related to unit grain yield. Future research can introduce biophysical indicators such as net primary productivity (NPP) for cross-validation. In addition, the simulation of future scenarios is based on quadratic polynomial model extrapolation, so the prediction accuracy needs to be further verified with actual land use data of subsequent years. To address these limitations, future research should concentrate on improving the above methodological aspects to develop a more robust and comprehensive ESV accounting system. It can also further test the applicability and validity of this assessment framework in other ecologically fragile mountainous areas so as to provide a scientific basis for balancing urbanization with ecological protection.

Supplementary Materials

The following supporting information can be downloaded at: https://www.mdpi.com/article/10.3390/su18125926/s1, Supplementary Table S1. Source and acquisition time of remote sensing image. Supplementary Table S2. Value equivalent of individual ecosystem services of different land use types in 2013–2023 (CNY/ha). Supplementary Table S3. Summary of land use conversion probabilities and adjustment rules under different scenarios. Supplementary Table S4. Categorical data corresponding to Figure 7.

Author Contributions

Conceptualization, Y.J. and S.H.; methodology Y.J. and S.H.; software, Y.J.; validation, Y.J.; formal analysis, Y.J.; investigation, Y.J.; resources, Y.J., S.H.; data curation, Y.J., S.H. and L.P.; writing—original draft preparation, Y.J., S.H. and J.Z.; writing—review and editing, Y.J., S.H., J.Z., L.P. and L.Q.; visualization, Y.J. and L.Q.; supervision, S.H. and L.P.; project administration, S.H., L.Q. and L.P.; funding acquisition, L.P. All authors have read and agreed to the published version of the manuscript.

Funding

This research was financially supported by the National Natural Science Foundation of China (42476239), the Jiangsu Province Carbon Peak Carbon Neutral Technology Innovation Project (BK20231515), and the Youth Program of Jiangsu Natural Science Foundation (BK20251062).

Institutional Review Board Statement

Not applicable.

Informed Consent Statement

Not applicable.

Data Availability Statement

The original contributions presented in this study are included in the article/supplementary material. Further inquiries can be directed to the corresponding author.

Conflicts of Interest

The authors declare no conflicts of interest.

Abbreviations

The following abbreviations are used in this manuscript:
ESVEcosystem Services Values

References

  1. Costanza, R.; d’Arge, R.; de Groot, R.; Farber, S.; Grasso, M.; Hannon, B.; Limburg, K.; Naeem, S.; Oneill, R.V.; Paruelo, J.; et al. The value of the world’s ecosystem services and natural capital. Nature 1997, 387, 253–260. [Google Scholar] [CrossRef] [Scilit]
  2. Assessment, M.E. A Framework for Assessment; Island Press: Washington, DC, USA, 2005. [Google Scholar]
  3. Brander, L.M.; de Groot, R.; Schägner, J.P.; Guisado-Goñi, V.; van ’t Hoff, V.; Solomonides, S.; McVittie, A.; Eppink, F.; Sposato, M.; Do, L.; et al. Economic values for ecosystem services: A global synthesis and way forward. Ecosyst. Serv. 2024, 66, 101654. [Google Scholar] [CrossRef] [Scilit]
  4. de Groot, R.; Brander, L.; van der Ploeg, S.; Costanza, R.; Bernard, F.; Braat, L.; Christie, M.; Crossman, N.; Ghermandi, A.; Hein, L.; et al. Global estimates of the value of ecosystems and their services in monetary units. Ecosyst. Serv. 2012, 1, 50–61. [Google Scholar] [CrossRef] [Scilit]
  5. Xie, G.D.; Zhang, C.X.; Zhang, L.M.; Chen, W.H.; Li, S.M. Improvement of the evaluation method for ecosystem service value based on per unit area value equivalent factor. J. Nat. Resour. 2015, 30, 1243–1254. [Google Scholar]
  6. Mir, K.; Brouwer, R. Testing the effect of ecosystem service and land classification on global values of forested watershed ecosystem services. For. Policy Econ. 2025, 181, 103342. [Google Scholar] [CrossRef] [Scilit]
  7. Akbar, A.; Abulizi, A.; Abliz, A.; Abliz, A.; Jiang, J.; Yu, T.; Ou, B. Land use and land cover change effects on the value of ecosystem services in the Konqi River Basin, China, under ecological water conveyance conditions. Forests 2023, 14, 1028. [Google Scholar] [CrossRef] [Scilit]
  8. Ge, Q.; Lu, Y.; An, G.; Tian, Z.; Fu, M.; Tan, X.; Liu, X.; Sun, Z. Coupling relationship between city development and ecosystem service in the Shandong Peninsula urban agglomeration. Land 2025, 14, 1119. [Google Scholar] [CrossRef] [Scilit]
  9. Ren, X.; Yang, Y.; Wang, Z. A long-term and comprehensive assessment of the ecological costs arising from urban agglomeration expansion in the middle reaches of the Yellow River Basin. Land 2023, 12, 1736. [Google Scholar] [CrossRef] [Scilit]
  10. Li, J.N.; Yao, L.; Liu, L.Z.; Lian, J.; Li, X.M.; Gan, D.X. Evaluating the social value of ecosystem services for the green heart area of the Changsha-Zhuzhou-Xiangtan urban agglomeration using the SolVES model. J. Ecol. Rural Environ. 2025, 41, 987–1001. [Google Scholar]
  11. Zella, A.Y.; Kitali, L.J. Forecasting the economic value of ecosystem services in coastal areas of the Indian Ocean: A case study of the Kinondoni District, Tanzania. Adv. Res. 2024, 25, 236–250. [Google Scholar] [CrossRef] [Scilit]
  12. Haines-Young, R.; Potschin, M. The links between biodiversity, ecosystem service and human well-being. In Ecosystem Ecology: A New Synthesis; Cambridge University Press: Cambridge, UK, 2010. [Google Scholar]
  13. Bishop, J.; Brink, P.T.; Gundimeda, H.; Kumar, P.; Nesshver, C.; Schröter-Schlaack, C.; Simmons, B.; Sukhdev, P.; Wittmer, H. The Economics of Ecosystems and Biodiversity: Mainstreaming the Economics of Nature—A Synthesis of the Approach, Conclusions and Recommendations of TEEB; UNEP: Nairobi, Kenya, 2010. [Google Scholar]
  14. Xie, G.D.; Zhang, C.X.; Zhang, C.S.; Xiao, Y.; Lu, C.X. The value of ecosystem services in China. Resour. Sci. 2015, 37, 1740–1746. [Google Scholar]
  15. Kreuter, U.P.; Harris, H.G.; Matlock, M.D.; Lacey, R.E. Change in ecosystem service values in the San Antonio area, Texas. Ecol. Econ. 2001, 39, 333–346. [Google Scholar] [CrossRef] [Scilit]
  16. Troy, A.; Wilson, M.A. Mapping ecosystem services: Practical challenges and opportunities in linking GIS and value transfer. Ecol. Econ. 2006, 60, 435–449. [Google Scholar] [CrossRef] [Scilit]
  17. Quintas-Soriano, C.; Martín-López, B.; Santos-Martín, F.; Loureiro, M.; Montes, C.; Benayas, J.; García-Llorente, M. Ecosystem services values in Spain: A meta-analysis. Environ. Sci. Policy 2016, 55, 186–195. [Google Scholar] [CrossRef] [Scilit]
  18. Barbier, E.B.; Hacker, S.D.; Kennedy, C.; Koch, E.W.; Stier, A.C.; Silliman, B.R. The value of estuarine and coastal ecosystem services. Ecol. Monogr. 2011, 81, 169–193. [Google Scholar] [CrossRef] [Scilit]
  19. Vo, Q.T.; Künzer, C.; Vo, Q.M.; Moder, F.; Oppelt, N. Review of valuation methods for mangrove ecosystem services. Ecol. Indic. 2012, 23, 431–446. [Google Scholar] [CrossRef] [Scilit]
  20. Wei, F.; Xiang, M.; Deng, L.; Wang, Y.; Li, W.; Yang, S.; Wu, Z. Spatiotemporal distribution characteristics and their driving forces of ecological service value in transitional geospace: A case study in the upper reaches of the Minjiang River, China. Sustainability 2023, 15, 14559. [Google Scholar] [CrossRef] [Scilit]
  21. Zhuoyao, W.; Yufei, R.; Qunou, J.; Ziyun, Z.; Chen, X. Comprehensive evaluation of ecosystem service functions in Yunnan Province of southwestern China based on InVEST model. J. Beijing For. Univ. 2024, 46, 103–112. [Google Scholar]
  22. Sannigrahi, S.; Zhang, Q.; Joshi, P.; Sutton, P.C.; Keesstra, S.; Roy, P.; Pilla, F.; Basu, B.; Wang, Y.; Jha, S. Examining effects of climate change and land use dynamic on biophysical and economic values of ecosystem services of a natural reserve region. J. Clean. Prod. 2020, 257, 120424. [Google Scholar] [CrossRef] [Scilit]
  23. Ayşe, K.; Neslihan, D.; Mustafa, Ö.; Oğuz, G.; Faris, K. Integration of drones in landscape research: Technological approaches and applications. Drones 2025, 9, 603. [Google Scholar] [CrossRef] [Scilit]
  24. Li, H.; Chen, E.; Lin, S.; Cheng, L.; Zhang, G. Regional calibration of ecosystem service valuation under climate and tourism influences: A case study in subtropical Longyan, China. Sci. Rep. 2025, 15, 30535. [Google Scholar] [CrossRef] [Scilit] [PubMed]
  25. Li, J.; Qiu, J.; Amani-Beni, M.; Wang, Y.; Yang, M.; Chen, J. A modified equivalent factor method evaluation model based on land use changes in Tianfu New Area. Land 2023, 12, 1335. [Google Scholar] [CrossRef] [Scilit]
  26. Ji, Q.; Feng, X.; Sun, S.; Zhang, J.; Li, S.; Fu, B. Cross-scale coupling of ecosystem service flows and socio-ecological interactions in the Yellow River Basin. J. Environ. Manag. 2024, 367, 122071. [Google Scholar] [CrossRef] [Scilit]
  27. Jia, Y.; Liu, Y.; Zhang, S. Evaluation of agricultural ecosystem service value in arid and semiarid regions of northwest China based on the equivalent factor method. Environ. Process. 2021, 8, 713–727. [Google Scholar] [CrossRef] [Scilit]
  28. Felici, G.; Corsi, G.; Fabbri, S.; Niero, M.; Lavagnolo, M.C. Assessing the value of ecosystem services in decentralized sanitation systems: A case study in a vulnerable mountain area. Sustainability 2025, 17, 8186. [Google Scholar] [CrossRef] [Scilit]
  29. Xu, J.; Li, L.; Lin, W.; Xu, D.; Yu, Q.; Xiong, Y.; Shi, Y. Valuation of ecosystem services value based on dynamic equivalent factor in the Yangtze River Delta urban agglomeration. J. Nat. Conserv. 2026, 89, 127158. [Google Scholar] [CrossRef] [Scilit]
  30. Jiang, Y.; Li, S.; Chen, W.; Cai, D.; Liu, Y. The evolution of crop cultivation and paleoenvironment in the Longji terraces, southern China: Organic geochemical evidence from paleosols. J. Environ. Manag. 2017, 202, 524–531. [Google Scholar] [CrossRef] [Scilit]
  31. Cao, H.; Wu, Z.; Zheng, W. Impact of touristification and landscape pattern on habitat quality in the Longji rice terrace ecosystem, southern China, based on geographically weighted regression models. Ecol. Indic. 2024, 166, 112259. [Google Scholar] [CrossRef] [Scilit]
  32. Jiang, Y.; Li, S.; Cai, D.; Chen, W.; Liu, Y.; Yu, Z. The genesis and paleoenvironmental records of Longji agricultural terraces, southern China: A pilot study of human–environment interaction. Quat. Int. 2014, 321, 12–21. [Google Scholar] [CrossRef] [Scilit]
  33. National Bureau of Statistics of China. Announcement on Grain Production Data for 2014–2024. Available online: http://www.stats.gov.cn/english/ (accessed on 19 March 2026).
  34. Department of Grain and Material Reserves of Guangxi Zhuang Autonomous Region. Guangxi Market Grain and Oil Price Weekly Report. Available online: http://lshwzcbj.gxzf.gov.cn/zfxxgkzl/fdzdgknr/sjfb/lyhq/ (accessed on 19 March 2026).
  35. People’s Government of Longsheng Various Nationalities Autonomous County. Statistical Bulletin on National Economic and Social Development of Longsheng Various Nationalities Autonomous County. Available online: http://www.glls.gov.cn/ (accessed on 19 March 2026).
  36. People’s Government of Longsheng Various Nationalities Autonomous County. Government Information Disclosure Work Annual Report of Longsheng Various Nationalities Autonomous County. Available online: http://www.glls.gov.cn/ (accessed on 19 March 2026).
  37. Costanza, R.; de Groot, R.; Sutton, P.; van der Ploeg, S.; Anderson, S.J.; Kubiszewski, I.; Farber, S.; Turner, R.K. Changes in the global value of ecosystem services. Glob. Environ. Chang. 2014, 26, 152–158. [Google Scholar] [CrossRef] [Scilit]
  38. Xie, G.; Zhang, C.; Zhen, L.; Zhang, L. Dynamic changes in the value of China’s ecosystem services. Ecosyst. Serv. 2017, 26, 146–154. [Google Scholar] [CrossRef] [Scilit]
  39. National Bureau of Statistics of China. National Data: Provincial Annual Data. Available online: https://data.stats.gov.cn/dg/website/page.html#/pc/national/fsYearData (accessed on 13 May 2026).
  40. Song, C.; Levine, J.M. Rigorous validation of ecological models against empirical time series. Nat. Ecol. Evol. 2025, 9, 2265–2278. [Google Scholar] [CrossRef] [Scilit]
  41. Shi, F.; Zhou, B.; Zhou, H.; Zhang, H.; Li, H.; Li, R.; Guo, Z.; Gao, X. Spatial autocorrelation analysis of land use and ecosystem service value in the Huangshui River Basin at the grid scale. Plants 2022, 11, 2294. [Google Scholar] [CrossRef] [Scilit]
  42. Hu, M.M.; Li, Z.T.; Wang, Y.F.; Jiao, M.Y.; Li, M.; Xia, B.C. Spatio-temporal changes in ecosystem service value in response to land-use/cover changes in the Pearl River Delta. Resour. Conserv. Recycl. 2019, 149, 106–114. [Google Scholar] [CrossRef] [Scilit]
  43. Moran, P.A.P. Notes on continuous stochastic phenomena. Biometrika 1950, 37, 17–23. [Google Scholar] [CrossRef] [Scilit]
  44. Getis, A.; Ord, J.K. The analysis of spatial association by use of distance statistics. Geogr. Anal. 1992, 24, 189–206. [Google Scholar] [CrossRef] [Scilit]
  45. Fu, B. Coupling human and natural systems for sustainable development. Natl. Sci. Rev. 2023, 10, nwad086. [Google Scholar] [CrossRef] [Scilit]
  46. Guzman, C.B. Networked shorelines: A review of vulnerability interactions between human adaptation to sea level rise and wetland migration. Glob. Environ. Change 2025, 92, 102985. [Google Scholar] [CrossRef] [Scilit]
  47. Sang, S.; Li, Y.; Zong, S.; Yu, L.; Wang, S.; Liu, Y.; Wu, X.; Song, S.; Wang, X.; Fu, B. The modeling framework of the coupled human and natural systems in the Yellow River Basin. Geogr. Sustain. 2025, 6, 100294. [Google Scholar] [CrossRef] [Scilit]
  48. Zhao, X.; Xu, Y.; Wang, Q.; Pu, J.; Shi, X.; Huang, P.; Gu, Z. Sustainable agricultural development models of the ecologically vulnerable karst areas in southeast Yunnan from the perspective of human–earth areal system. Land 2022, 11, 1075. [Google Scholar] [CrossRef] [Scilit]
  49. Ran, Y.; Zhao, X.; Ye, X.; Wang, X.; Pu, J.; Huang, P.; Zhou, Y.; Tao, J.; Wu, B.; Dong, W. A framework for territorial spatial ecological restoration zoning integrating “carbon neutrality” and “human-geology-ecology”: Theory and application. Sustain. Cities Soc. 2024, 115, 105824. [Google Scholar] [CrossRef] [Scilit]
  50. Zhao, S.; Yu, Z.; Liu, W. The co-evolution and driving mechanism analysis of ecosystem services value and tourism economic resilience from 286 cities in China. Sci. Rep. 2025, 15, 16311. [Google Scholar] [CrossRef] [Scilit] [PubMed]
  51. Feng, T.; Hu, P.; Zhu, H. Ecosystem services and sustainable restoration interlinking soil, geological, and vegetation interactions for sustainable development. Front. Earth Sci. 2025, 13, 1743208. [Google Scholar] [CrossRef] [Scilit]
  52. Martinelli, E.; Gonçalves, E.C.C.; Castanho, R.A.M.D.; Pivac, T. Cultural Heritage-Based Sustainable Tourism Approaches; Springer Nature: Cham, Switzerland, 2025. [Google Scholar]
  53. Pawęska, K.; Dąbek, P.B. Water and wastewater management in mountain tourist shelters of Karkonosze National Park. J. Ecol. Eng. 2026, 27, 63–72. [Google Scholar] [CrossRef] [Scilit]
  54. Brunner, S.H.; Huber, R.; Grêt-Regamey, A. Mapping uncertainties in the future provision of ecosystem services in a mountain region in Switzerland. Reg. Environ. Change 2017, 17, 2309–2321. [Google Scholar] [CrossRef] [Scilit]
  55. Lang, Y.; Song, W. Quantifying and mapping the responses of selected ecosystem services to projected land use changes. Ecol. Indic. 2019, 102, 186–198. [Google Scholar] [CrossRef] [Scilit]
  56. Zhang, L.; Zhang, X.; Gao, S.; Gu, X. Revealing nonlinear relationships and thresholds of human activities and climate change on ecosystem services in Anhui Province based on the XGBoost–SHAP model. Sustainability 2025, 17, 8728. [Google Scholar] [CrossRef] [Scilit]
  57. Sanou, J.; Tengberg, A.; Bazié, H.R.; Mingasson, D.; Ostwald, M. Assessing trade-offs between agricultural productivity and ecosystem functions: A review of science-based tools? Land 2023, 12, 1329. [Google Scholar] [CrossRef] [Scilit]
  58. Qin, B.; Zhao, J.; Chen, G.; Wang, R.; Lin, Y. An integrated framework for assessing dynamics of ecological spatial network resilience under climate change scenarios: A case study of the Yunnan central urban agglomeration. Land 2025, 14, 1988. [Google Scholar] [CrossRef] [Scilit]
  59. Zhang, Q.; Hong, J.; Wu, F.; Yang, Y.; Dong, C. Gains or losses? A quantitative estimation of environmental and economic effects of an ecological compensation policy. Ecol. Appl. 2021, 31, e02341. [Google Scholar] [CrossRef] [Scilit]
  60. Furniss, T.J.; Hessburg, P.F.; Povak, N.A.; Salter, R.B.; Wigmosta, M.S. Predicting future patterns, processes, and their interactions: Benchmark calibration and validation procedures for forest landscape models. Ecol. Model. 2022, 473, 110099. [Google Scholar] [CrossRef] [Scilit]
Figure 1. Location map of Longji Mountain area. (a) Location of Guangxi Zhuang Autonomous Region in China; (b) Location of Longsheng Various Nationalities Autonomous County in Guangxi Zhuang Autonomous Region; (c) Location of Longji Mountain Area in Longsheng Various Nationalities Autonomous County; (d) Elevation distribution of Longji Mountain Area.
Sustainability 18 05926 g001
Figure 2. Interannual variation in total ESV from 2013 to 2023.
Sustainability 18 05926 g002
Figure 3. Spatial distribution map of ESV from 2013 to 2023. (a) 2013; (b) 2014; (c) 2015; (d) 2016; (e) 2017; (f) 2018; (g) 2019; (h) 2020; (i) 2021; (j) 2022; (k) 2023.
Sustainability 18 05926 g003
Figure 4. Spatial distribution of cold and hot spots of ESV per hectare from 2013 to 2023. (a) 2013; (b) 2014; (c) 2015; (d) 2016; (e) 2017; (f) 2018; (g) 2019; (h) 2020; (i) 2021; (j) 2022; (k) 2023.
Sustainability 18 05926 g004
Figure 5. Spatial distribution maps of ESV change over three periods. (a) Net Change in ESV (2013–2023). (b) Net Change in ESV (2018–2023). (c) Net Change in ESV (2013–2018).
Sustainability 18 05926 g005
Figure 6. Value equivalent of individual ecosystem services of different land use types from 2013 to 2023. (a) Terraced fields; (b) Forest land; (c) Water bodies; (d) Unused land.
Sustainability 18 05926 g006
Figure 7. Spatial distribution of ecosystem service functional value in 2023. (a) Food production; (b) Raw material production; (c) Water supply; (d) Gas regulation; (e) Climate regulation; (f) Environmental purification; (g) Hydrological regulation; (h) Soil conservation; (i) Nutrient cycling; (j) Biodiversity maintenance; (k) Aesthetic value. The detailed categorical data for each subfigure (ak) are available in Supplementary Table S4.
Sustainability 18 05926 g007
Figure 8. Spatial distribution of cold and hot spots of ecosystem service functional value in 2023. (a) Food production; (b) Raw material production; (c) Gas regulation; (d) Climate regulation; (e) Environmental purification; (f) Hydrological regulation; (g) Soil conservation; (h) Nutrient cycling; (i) Biodiversity maintenance; (j) Aesthetic value.
Sustainability 18 05926 g008
Figure 9. The value of individual ecosystem service function from 2013 to 2023.
Sustainability 18 05926 g009
Figure 10. Simulation of spatial distribution of ESV per hectare under three different scenarios in 2028 and 2033. (a) Natural development scenario in 2028. (b) Ecological protection scenario in 2028. (c) Tourism development scenario in 2028. (d) Natural development scenario in 2033. (e) Ecological protection scenario in 2033. (f) Tourism development scenario in 2033.
Sustainability 18 05926 g010
Figure 11. Framework diagram of human–land system coupling theory in ecologically fragile hilly region.
Sustainability 18 05926 g011
Table 1. Revised ESV per unit area and equivalent factors of Longji Mountain area in Guangxi.
Time
(Year)
Grain Yield per Unit Area in Longsheng Autonomous County (kg/ha)Grain Yield per Unit Area in China(kg/ha)Purchase Price of Grain Crops (Current Price, CNY/kg)Constant Price of Grain Crops (Base Year 2013, CNY/kg)Service Value of Farmland Ecosystem (CNY/ha)Correction
Factor
Equivalent Factor of ESV in Longsheng Autonomous County (CNY/ha)
20135739.1353772.562.562098.881.072240.32
20146073.8553852.572.522186.581.132466.29
20155907.4454832.742.642227.951.082400.46
20165939.4854522.592.462087.301.092273.89
20175896.0855062.582.412029.941.072173.67
20185522.6456212.632.401893.480.981860.34
20195415.4157202.562.261748.400.951655.30
20205520.7957342.612.241766.650.961700.96
20215535.8558052.782.361866.370.951779.84
20225505.5658022.832.361856.160.951761.42
20235665.0358452.862.391934.200.971874.65
Table 2. Equivalent factors of ESV of land types in Longsheng Autonomous County (CNY/m2).
Time (Year)Terraced FieldsForest LandWater BodiesUnused Land
20130.875.1728.140.04
20140.965.6930.980.05
20150.935.5430.150.05
20160.885.2528.560.05
20170.855.0227.300.04
20180.724.3023.370.04
20190.643.8220.790.03
20200.663.9321.370.03
20210.694.1122.360.04
20220.694.0722.130.04
20230.734.3323.550.04
Mean value0.784.6625.340.04
Table 3. Spatial agglomeration index and spatial autocorrelation index of ESV (2013–2023).
Time
(Year)
Moran’s IZGeneral G
Observations • 10−6
General G
Expectations • 10−6
20130.7076.4986
20140.6368.7086
20150.6368.8776
20160.5964.8786
20170.6469.9776
20180.6571.1176
20190.6065.8276
20200.6671.6376
20210.6571.2276
20220.6267.4976
20230.5762.7876
Mean value0.6369.007.36
Table 4. Spatial autocorrelation index and spatial agglomeration index of ESV in 2023.
Service FunctionMoran’s IZGeneral G
Observations • 10−6
General G
Expectations • 10−6
Food production0.6773.0686
Raw material production0.6469.4276
Water supply0.7076.52––*––*
Gas regulation0.5662.1276
Climate regulation0.6470.2476
Environmental purification 0.6368.4776
Hydrological regulation0.3235.0886
Soil conservation0.6571.4976
Nutrient cycling0.4650.0076
Biodiversity maintenance0.6470.0186
Aesthetic value0.6469.6676
Mean value0.6065.1076
––*: Represents that negative values cannot be processed.
Table 5. Change statistics of single ESV (million CNY).
Service FunctionChanges from 2013 to 2018Changes from 2018 to 2023Changes from 2013 to 2023Average from 2013 to 2023
Food production−1.57−0.32−1.896.36
Raw material production−0.240.400.165.89
Water supply2.241.423.67−4.31
Gas regulation−1.671.00−0.6621.81
Climate regulation−2.014.052.0457.37
Environmental purification−0.901.260.3616.44
Hydrological regulation−10.043.46−6.5838.91
Soil conservation−0.581.731.1522.71
Nutrient cycling−0.250.06−0.192.29
Biodiversity maintenance−0.851.540.6821.28
Aesthetic value−0.420.690.279.35
Table 6. Data statistics of ESV under three different scenarios in 2028 and 2033.
Time
(Year)
Scene ModeMaximum Value of Spatial Distribution (Million CNY/ha)Average Value of Spatial Distribution (1 × 10⁴ CNY/ha)Total Value of Spatial Distribution (Million CNY)Total Value of Terraced Fields (Million CNY)Total Value of Forest Land (Million CNY)Total Value of Water Bodies (Million CNY)Total Value of Unused Land (Million CNY)
2028Natural development scenario0.183.19194.779.61179.805.340.03
Ecological protection scenario0.193.23200.4310.05184.715.650.02
Tourism development scenario0.173.13194.199.38179.195.590.03
2033Natural development scenario0.234.15253.6810.91236.895.860.02
Ecological protection scenario0.244.17259.3911.25241.826.300.02
Tourism development scenario0.204.07252.7510.58236.096.050.02
Disclaimer/Publisher’s Note: The statements, opinions and data contained in all publications are solely those of the individual author(s) and contributor(s) and not of MDPI and/or the editor(s). MDPI and/or the editor(s) disclaim responsibility for any injury to people or property resulting from any ideas, methods, instructions or products referred to in the content.