Article

From Rescue to Prevention: A Comprehensive Analysis Framework for Urban Fire Risks Based on the PSR Model and Environmental Criminology Theory


1
School of Geomatics and Urban Spatial Information, Beijing University of Civil Engineering and Architecture, Beijing 100044, China
2
Institute of Remote Sensing and Geographical Information Systems, Peking University, Beijing 100871, China
3
Beijing Key Laboratory of Spatio-Temporal Perception and Urban Resilience, Beijing 100871, China
4
CAUPD Beijing Planning & Design Consultants Ltd., Beijing 100044, China
*
Author to whom correspondence should be addressed.
Sustainability 2026, 18(12), 5795; https://doi.org/10.3390/su18125795
Submission received: 25 March 2026 / Revised: 21 May 2026 / Accepted: 25 May 2026 / Published: 6 June 2026
(This article belongs to the Special Issue Sustainable Urban Risk Management and Resilience Strategy)

Abstract

Urban fire prevention is shifting from reactive response to proactive risk governance, yet current approaches often overlook risk-type heterogeneity, spatial dependencies, and underlying behavioral mechanisms, especially equitable risk distribution among vulnerable groups. To address this, this study integrates the Pressure–State–Response (PSR) model with environmental criminology theories (Routine Activity Theory (RAT) and Crime Pattern Theory (CPT)) to couple macro social causal chains with micro behavioral–spatial mechanisms. Using data from the digital urban management system of Shenzhen’s Guangming District in 2019, four fire risk event types are examined: electric bike charging violations (EB), unauthorized power wiring (PW), water heater misuse (WH), and aging gas pipelines (GP). Spatial error models explain 82–89% of the variance across fire risk event types, and spatial 5-fold cross-validation shows minimal performance decline (ΔR2 = 0.03–0.08), confirming robust prediction without overfitting. Key findings include: (1) elderly proportion is significantly positively associated with WH and PW (coefficients = 2.64 and 3.06, p < 0.01); (2) restaurant density has a consistently positive association with all four risk types (coefficients = 0.24–0.60, p < 0.01); (3) functional diversity and connectivity exhibit dual patterns, showing negative associations with more visible, easily detectable violations (PW, GP) but positive relationships with relatively concealed behaviors (EB); (4) reported safety deficiencies display strong positive associations with all fire risk event types and can therefore serve as an effective early-warning indicator for broader fire risk. These results support risk-specific, equity-oriented prevention strategies that prioritize vulnerable groups and high-risk environments. The validated PSR–RAT/CPT framework provides a novel theoretical basis for targeted fire risk governance and advances safe, resilient, inclusive cities aligned with Sustainable Development Goal 11.

1. Introduction

Urban fire incidence continues to rise with rapid urbanization, particularly in densely populated megacities [1,2], which poses a severe threat to public safety, causing significant casualties and economic losses. In 2024, residential fires in China resulted in approximately 11,600 fatalities and direct economic losses of 7.74 billion yuan [3]. Given their severe impact, the United Nations has incorporated disaster reduction into its Sustainable Development Goals, emphasizing the critical importance of fire prevention [4]. Against this backdrop, many countries are gradually shifting their focus from “ex-post rescue” to “ex-ante prevention” to build more resilient urban safety systems [5,6]. How to effectively enhance the capacity for fire prevention, especially in dense and rapidly changing urban environments, has therefore become a key challenge for both academic research and practice.
The mainstream paradigm in fire prevention has long relied on physical and engineering approaches, such as improving the fire resistance of building materials [7,8] and optimizing the layout of firefighting facilities [9]. These methods mainly focus on the “object” dimension and often treat people as passive recipients of protection. Statistics on residential fires across China in the past decade show that incidents caused by electrical and equipment failures account for 32.3% of all cases, primarily manifested as circuit overloads, non-compliant wiring, and equipment deterioration [3]. These risks are closely related to everyday behaviors and management practices. Recent studies further confirm that physical and engineering solutions alone cannot mitigate behaviorally driven fire risks without complementary social and institutional interventions [10], highlighting the necessity of analyzing fire risks from social and managerial perspectives.
Within this emerging paradigm, people-centric research paths have developed along two main directions: social vulnerability assessment and safety education or management intervention. Social vulnerability studies based on the perspective of social equity mainly aim to identify which social groups (e.g., the elderly, low-income households, migrant populations) are more vulnerable to fire risks due to their socio-economic characteristics [11,12]. Safety education and management research seeks to change people’s cognition and behavior through public safety education, regulations, and community campaigns, representing a predominantly “top-down” intervention mode [13,14,15]. However, most studies still treat fire risk as a homogeneous phenomenon [16,17], obscuring the distinct formation mechanisms behind different types of fire risk events (e.g., electric bike charging violations, unauthorized power wiring, water heater misuse, and aging gas pipelines, etc.). Although the social vulnerability perspective can identify high-risk groups/areas, it struggles to explain why markedly different dominant risks exist within the same vulnerable population or neighborhood. Similarly, safety education often lacks precise intervention logic tailored to specific risk types for specific groups/areas.
At the same time, an increasing number of studies have shifted their focus from isolated fire incidents to the spatial clustering of fire risk events [18,19,20]. Spatial statistical and spatial econometric techniques have been used to reveal how demographic and physical environment factors are associated with fire occurrence [21]. Data-driven and machine learning approaches have also been rapidly introduced into urban fire risk research [22]. By integrating multi-source data such as remote sensing, points of interest, building information, and historical fire records, methods like random forests, gradient boosting, and deep learning models have achieved high predictive accuracy in mapping and forecasting urban fire risk [23,24]. These spatial and data-driven approaches greatly enhance the ability to predict where and when fires are more likely to occur [25].
However, important gaps remain. Many existing studies have overlooked the different types of urban fires, which masks the heterogeneity of formation mechanisms across different risk types [26]. Moreover, machine learning models often function as black boxes: they can predict risk hotspots but offer limited insight into why certain populations and places face higher risk, and how social factors, built environments, and regulatory responses interact to produce these patterns [27]. Equity-oriented questions—such as whether vulnerable groups are disproportionately exposed to particular risk types and how to design targeted, just interventions—are rarely addressed explicitly in such frameworks [28].
In contrast to purely data-driven machine learning models that focus on prediction, the Pressure–State–Response (PSR) model [29] is widely applied in environmental risk assessment [30,31,32,33] and emphasizes interpretability and mechanism-based explanation, especially in the context of sustainable urban safety governance. However, while the PSR model provides a useful macro-level structure for organizing indicators related to people, built environments, and interventions or education, it is difficult to reveal the underlying micro-level individual behaviors and spatial mechanisms. To address these limitations, this study integrates the Routine Activity Theory (RAT) [34] and Crime Pattern Theory (CPT) [35] from environmental criminology into the PSR model. It uses the PSR model to outline the macro-level “pressure–state–response” pathway, while embedding constructs of RAT and CPT into its corresponding dimensions, which provides a micro-level foundation for understanding the behavioral logic and spatial interaction mechanisms behind various fire risk event types. Note that this PSR–RAT/CPT-based framework is designed to complement these spatial and data-driven approaches rather than compete with them. Specifically, it provides an explicit theoretical linkage between macro and micro-level explanations, distinguishes various types of fire risk events, and yields interpretable coefficients that support equity-oriented and mechanism-based policy insights, addressing a critical gap in current fire risk literature.
Based on the above analysis, this study selects Guangming District of Shenzhen as the case study area. Adopting the integrated PSR-RAT/CPT framework, spatial econometric methods are employed to empirically investigate the heterogeneous impacts of multiple socio-environmental factors on different types of fire risk events. The findings aim to support targeted fire prevention by informing equity-oriented strategies that prioritize vulnerable groups and high-risk environments. Finally, this work seeks to advance equitable disaster risk reduction and facilitate a paradigm shift in fire governance from passive response to proactive, prevention-oriented management, thereby contributing to the achievement of Sustainable Development Goal 11.
The paper is structured as follows: Section 2 presents the integrated PSR-RAT/CPT theoretical framework and its operationalization. Section 3 describes the study area, data and methodology. Section 4 reports the empirical results and model diagnostics. Section 5 provides a detailed interpretation of the findings from the PSR dimensions and discusses their implications for equity-oriented risk governance. Finally, Section 6 summarizes the main conclusions and outlines directions for future research.

2. Urban Fire Risk Event Analysis Framework Integrating PSR with Environmental Criminology

This study proposes a novel analytical framework for fire risk analysis, which integrates the PSR model with environmental criminology theories, RAT and CPT. In the integrated framework, “Pressure” corresponds to “Motivated Offenders”, “State” corresponds to “Suitable Targets & Awareness Spaces”, and “Response” corresponds to “Capable Guardians”, which clarifies the conceptual linkage between the macro-level PSR dimensions and the micro-level criminological constructs.

2.1. Theoretical Integration

The PSR model decomposes fire risk into three interrelated dimensions: Pressure, State and Response, which together form a logical chain of risk formation. RAT posits that fire risk events occur when a motivated offender, a suitable target, and the absence of a capable guardian converge in time and space, while CPT emphasizes how the built environment shapes the spatial distribution of human activities and the formation of risk patterns. By embedding RAT/CPT into each PSR dimension, we concretize the abstract PSR constructs:
  • Pressure Dimension: Motivated Offender
The pressure dimension captures the demographic characteristics that increase the likelihood of risk-prone behaviors. Examples include the proportion of elderly residents (who may use outdated electrical appliances), the proportion of youth (who may exhibit high curiosity and low risk awareness), total population size, and gender composition. These attributes proxy for the “motivated offender” component in RAT, reflecting individuals whose behaviors or awareness levels make them more likely to create fire hazards.
  • State Dimension: Suitable Target & Awareness Space
The state dimension reflects the physical and functional characteristics of the built environment that facilitate fire risks. Drawing on the “3D” framework of density, diversity, and design [36], we operationalize this dimension through variables such as residential density, mixed-use development density, restaurant density, road network density, etc. RAT/CPT conceptualizes these as “suitable targets” within “awareness spaces”—locations particularly vulnerable to fire risks due to their spatial characteristics.
  • Response Dimension: Capable Guardian
The response dimension encompasses formal and informal mechanisms that mitigate fire risks. Formal guardians include fire-station proximity, while informal guardians are captured by community self-monitoring capacity, measured by the frequency of reported safety deficiencies. In PSR terms, these are the interventions aimed at reducing pressures and improving states, which correspond to the “capable guardians” in RAT/CPT that can prevent or reduce risk events.

2.2. Operationalization of Constructs

To make the framework empirically testable, we translate each conceptual element into specific measurable indicators. Table 1 summarizes the definitions of variables and their linkage to the corresponding PSR dimension and RAT/CPT construct. Notably, while each variable is assigned to a primary PSR dimension for analytical clarity, we acknowledge that certain indicators may conceptually span multiple dimensions in complex urban systems. Potential secondary associations with other dimensions are addressed in the subsequent discussions.

2.3. Interaction and Feedback Mechanisms

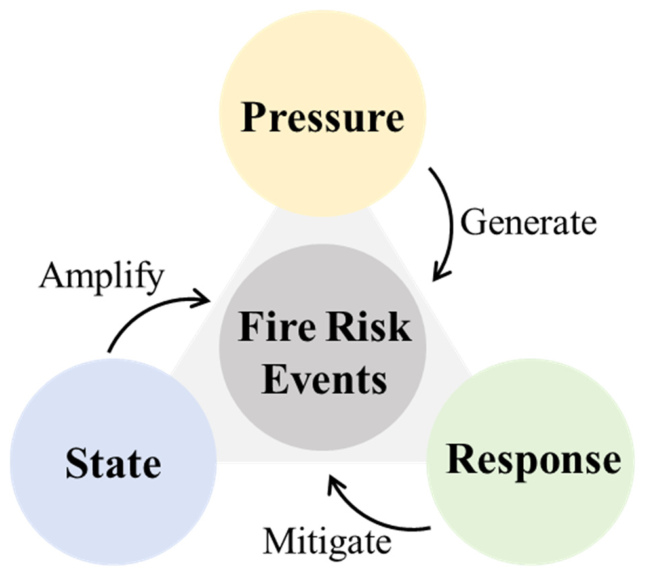
The integrated framework demonstrates the coupling effect between macro-level social system causal chains and micro-level individual behavioral–spatial mechanisms. It reveals the dynamic feedback process among the three dimensions (Figure 1). Population (Pressure) generates risk behaviors that emerge from specific socioeconomic conditions and individual decision-making processes. These behaviors manifest in particular environmental contexts (State) characterized by specific spatial configurations and built environment features. Meanwhile, institutional and community (Response) work to mitigate these risks through formal regulations and informal social control mechanisms. This loop explains why certain areas develop into fire-risk hotspots and provides a theoretical basis for targeted interventions that address the specific risk factors present in different spatial contexts.

3. Data and Methodology

This section demonstrates how to transform the theoretical framework into verifiable empirical research, taking the Guangming District of Shenzhen as an example. The experiments were carried out using ArcMap 10.8 and GeoDa 1.22.0.21.

3.1. Study Area

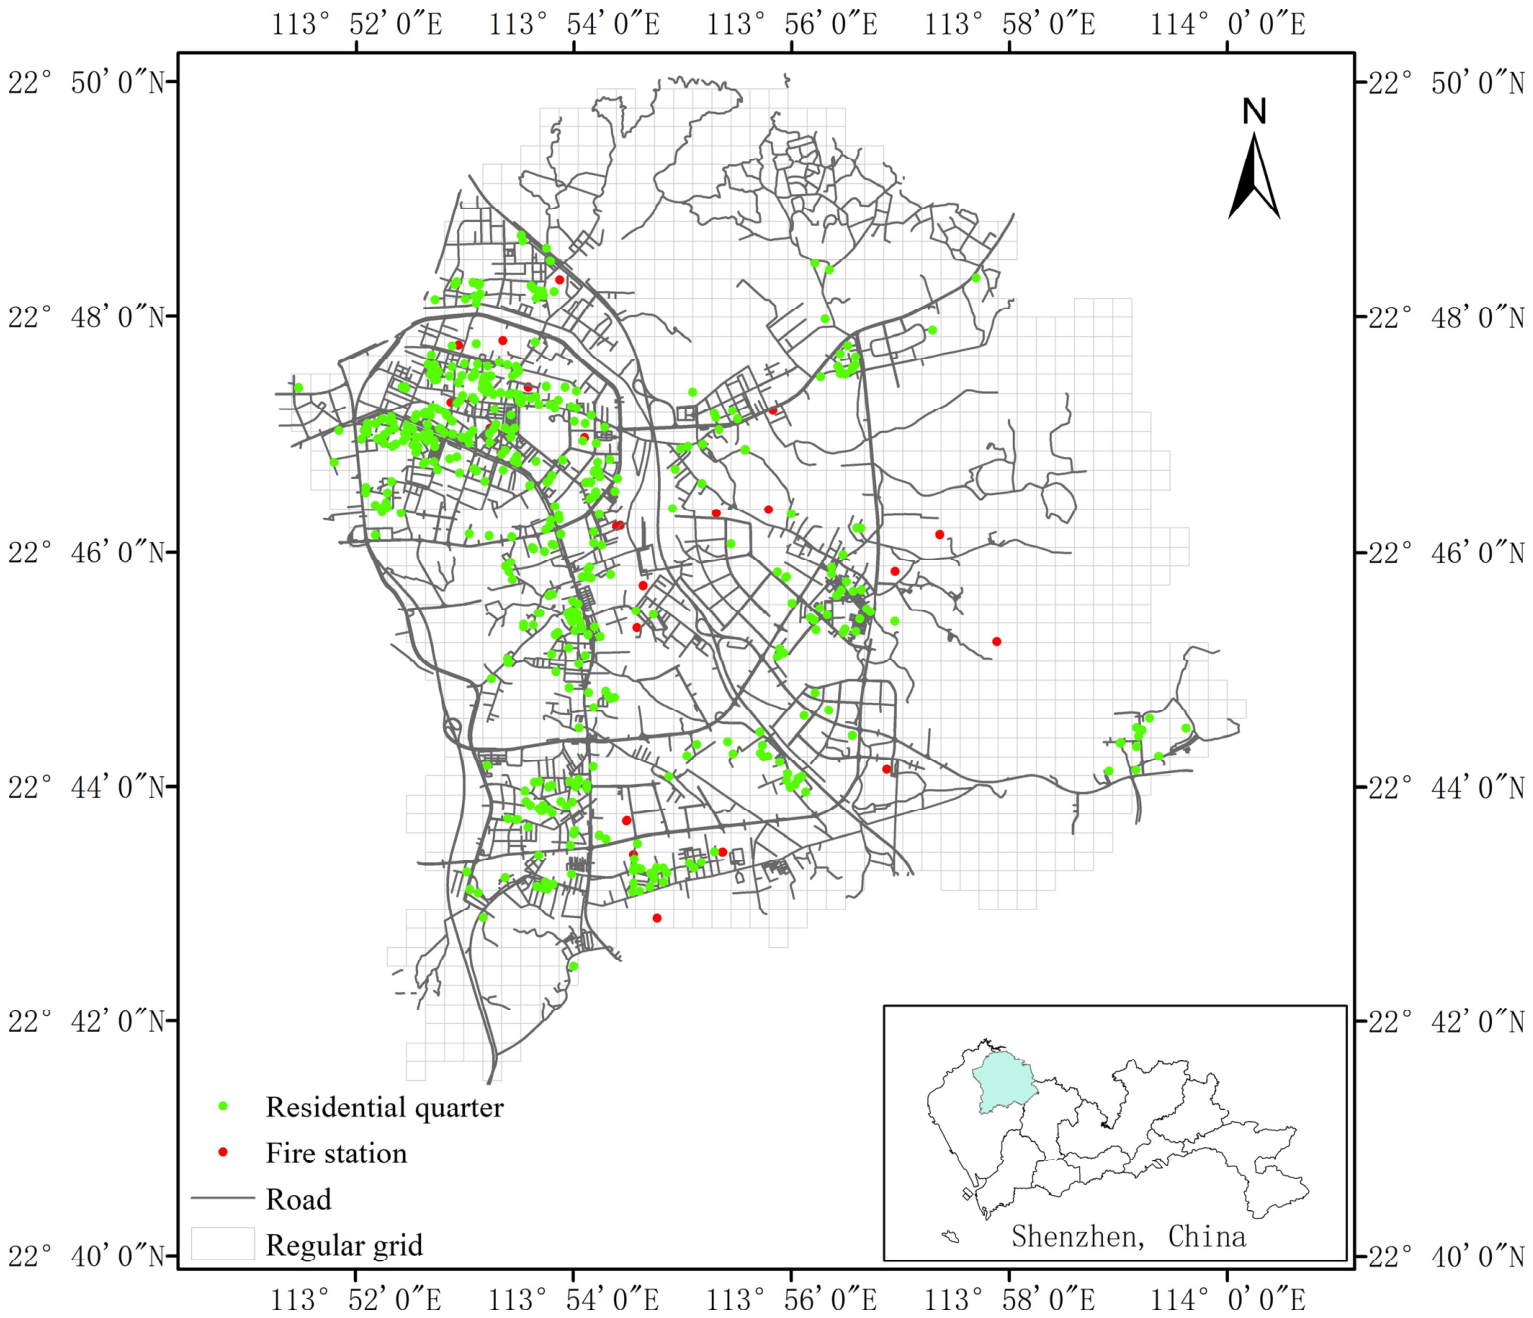
This study focuses on Guangming District, see Figure 2, a medium-sized area in northwestern Shenzhen, China, covering 156.1 km2 with 31 communities and a resident population of approximately 1.095 million. The district has attracted a large migrant workforce, forming a typical dense urban environment with available fine-grained data, making it suitable for spatial analysis of urban risks.
From 2023 to 2024, a total of 1044 fires were recorded in Guangming, causing multiple fatalities [1,2]. Electrical defects, careless fire use, and conveyance-related incidents accounted for more than 85% of fire causes. Among typical risk factors, unsafe charging of electric bikes—often occurring in residential common areas rather than designated charging points—has been frequently reported. Such hidden dangers often precede actual fires, indicating a clear linkage between pre-existing risks and ignition events. Therefore, analyzing the correlation between these frequent latent risks and underlying social factors can support targeted fire prevention. Enhancing patrols and public education in areas with similar socio-spatial characteristics will help reduce urban fire occurrences.

3.2. Data and Preprocessing

Fire risk event data was treated as the dependent variable, while PSR-based social factors served as independent variables, with preprocessing applied specifically to the characteristics of each.

3.2.1. Fire Risk Event Data

In recent years, based on digital urbanization, China has established daily fire risk inspection mechanisms to effectively identify and control major fire risks. The fire risk event data in this study was obtained from the Digitized Urban Management System (DUMS) of the study area between June and November 2019. Trained safety officers conduct daily checks and report identified safety risks to the unified management center using portable digital terminals. The reports include event type, location, and photos, which are described using different digital codes. The events encompass risks related to urban safety, environmental disorder, emergencies, and other events caused by both human and natural factors. For complex safety issues, the unified management center will dispatch them to specialized personnel from different departments, such as firefighters and police. After the reported events are handled, a safety officer will conduct a follow-up check and report back to the system. To achieve fine management, the DUMS divides the jurisdiction into more than 1500 irregular polygons. Each area has one or more safety officers responsible for daily safety checks.
This study analysis comprises records of four categories of representative risk events collected by DUMS between June and November 2019. The four categories of representative fire risk events are mainly related to electric bike charging violations (EB), unauthorized power wiring (PW), water heater misuse (WH), and aging gas pipelines (GP). Their corresponding event descriptions are detailed in Table 2. To ensure privacy and comply with data protection regulations, all records have been anonymized and spatially processed by relevant government departments. The spatial format adopts a 300 × 300 m grid system, enabling fine-scale spatial analysis while protecting sensitive location details.

3.2.2. Influencing Social Factors

The independent variables listed in Table 1 were derived from open datasets. Specifically: (1) The study utilized anonymized mobile signaling data from China Unicom, which was resampled to a standardized grid to generate population profiles for fire risk assessment. (2) Point of Interest (POI) data was employed to construct variables related to disaster-prone environments. The POI data of 2018 was sourced from Auto Navi Map (www.amap.com), a popular electronic navigation platform in China. (3) For Response-related data, the locations of fire stations were obtained from publicly available government records, while the DUMS also compiled reports from the public regarding missing fire safety facilities. All variables are calculated at the 300 m × 300 m grid level to be consistent with the statistics of fire events, forming a comprehensive foundation for analyzing the relationship between social factors and urban fire risk. Further, to ensure comparability across variables with different scales and types, we applied a three-type normalization procedure:
First, percentage-based indicators, such as the proportion of elders. These factors would be normalized to the interval from 0 to 1 by dividing each observation by its theoretical maximum, thereby preserving proportional relationships while eliminating unit-based scale effects.
Second, Boolean indicators, reflecting binary attributes such as whether the grid has a fire station or not. These factors would be converted into dichotomous variables, coded as 1 for “true” (present) and 0 for “false” (absent), enabling their direct integration into statistical and spatial models without introducing magnitude bias.
Third, non-negative numerical indicators, such as the count of residential buildings. To reduce the impact of outliers and eliminate the influence of scale, apply the logarithmic transformation to these factors and normalize all values. As to the logarithmic transformation, there is one detail adjustment, which is adding one to all non-negative parameters, to circumvent the occurrence of undefined logarithmic results. After that, a normalization step would be applied across logarithmic transformation values to prevent extreme imbalances in parameter weights caused by measurement units. In order to maintain the non-negativity of the data for preserving the interpretability of variable contributions, choose min–max normalization, scaling these variables to a fixed range from 0 to 1. This approach preserves the original directional relationships between variables, avoids altering the sign of their influence, and allows for more intuitive interpretation of their relative magnitudes in the modeling process.
In summary this preprocessing procedure ensures consistent scaling across variable types, mitigates the influence of outliers, and thereby enhances the stability and interpretability of the subsequent spatial regression analysis.

3.3. Exploration of Spatial Patterns and Selection of Analysis Models

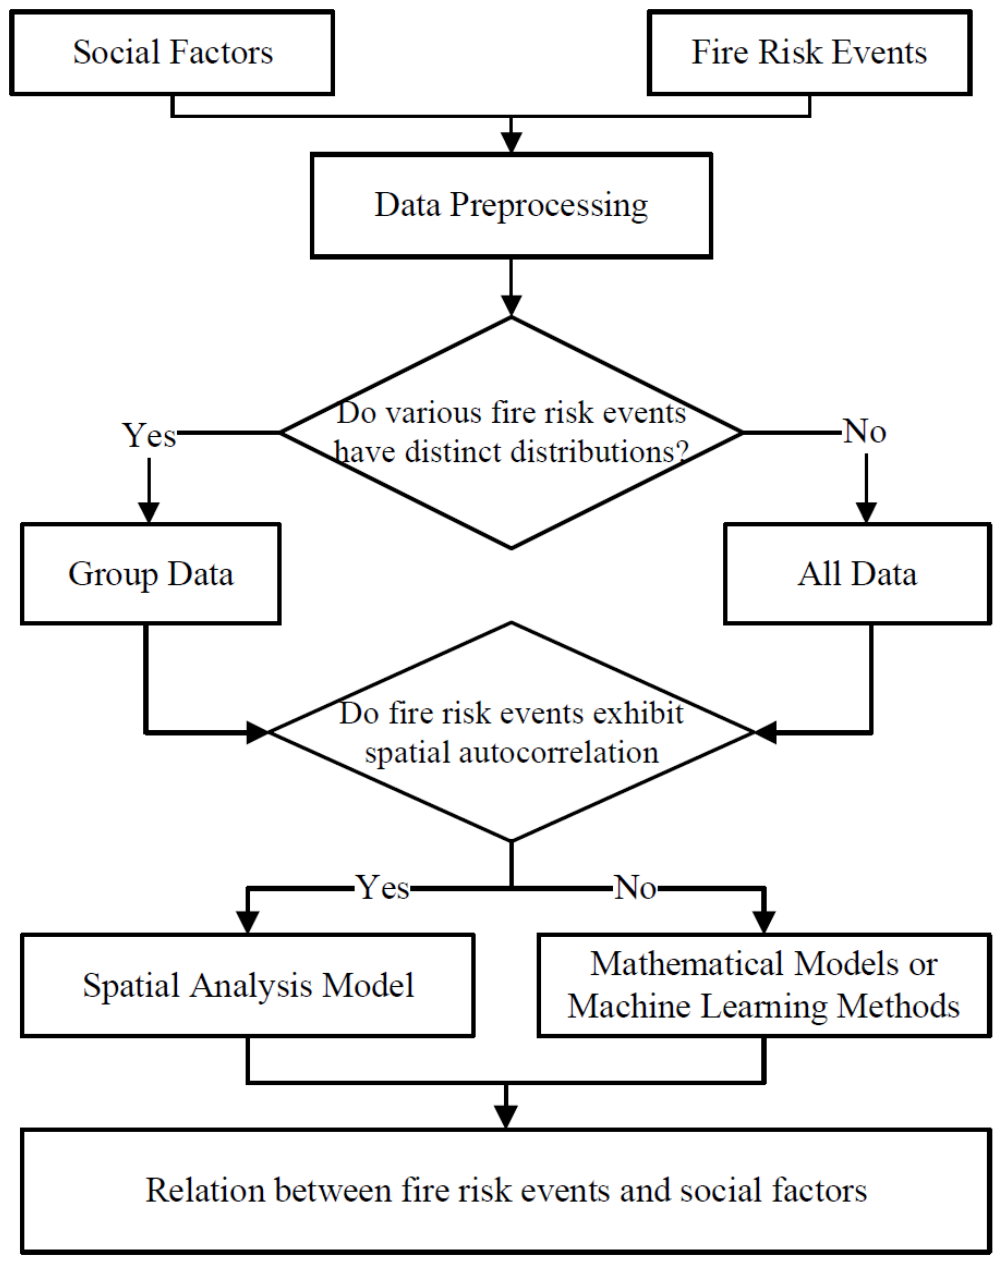
Fire risk exhibits spatial heterogeneity, type heterogeneity, and spatial correlation. Considering these characteristics, this study designs an analytical procedure (see Figure 3) as follows.
First, a spatial distribution analysis of fire risk events is conducted to verify whether different types of fire risk events show significantly distinct spatial distribution patterns. If spatial patterns differ, it suggests that influencing factors or their weights may vary across risk categories, making it more appropriate to construct separate models for each type. Otherwise, building a model using the full dataset may be preferable. In this study, the Standard Deviational Ellipse (SDE) method is adopted to determine whether spatial distribution differences exist [37]. This method reveals the dispersion of events along different axes, while the mean center reflects the average location of the incident distribution.
Second, spatial autocorrelation is measured by Moran’s I to determine the need for a spatial model [38]. If significant spatial autocorrelation is detected (p < 0.05), a spatial model is adopted. Subsequently, the Lagrange Multiplier (LM) test and its robust forms are applied to select the appropriate spatial model—either spatial lag or spatial error—based on the significance of the test statistics (see Appendix A Table A1) [39]. Otherwise, conventional mathematical or machine learning methods may be used when the spatial autocorrelation is not significant.
Finally, based on the selected model—taking the Spatial Error Model [39] as an example—the influence mechanisms between fire risk and various social factors under the PSR framework are analyzed. The formula is given below:
Risk Eventi = β0 + αX + βY + γZ + µi
µi = λWµi + ϵi
Here, X is a vector of proxies for pressure variables. Y is a vector of proxies for state variables. Z is the vector of proxies for response variables. ϵi represents a random error that conforms to the normal distribution. W is the spatial weight matrix, which is represented by the first-order Queen Contiguity rule in this study. It encodes the spatial adjacency relationships between grid cells and enables the model to capture residual spatial autocorrelation through the spatial error term. µi represents the spatial error term. λ are coefficients on spatial error terms.

4. Result

4.1. Spatial Distribution of Fire Risk Events

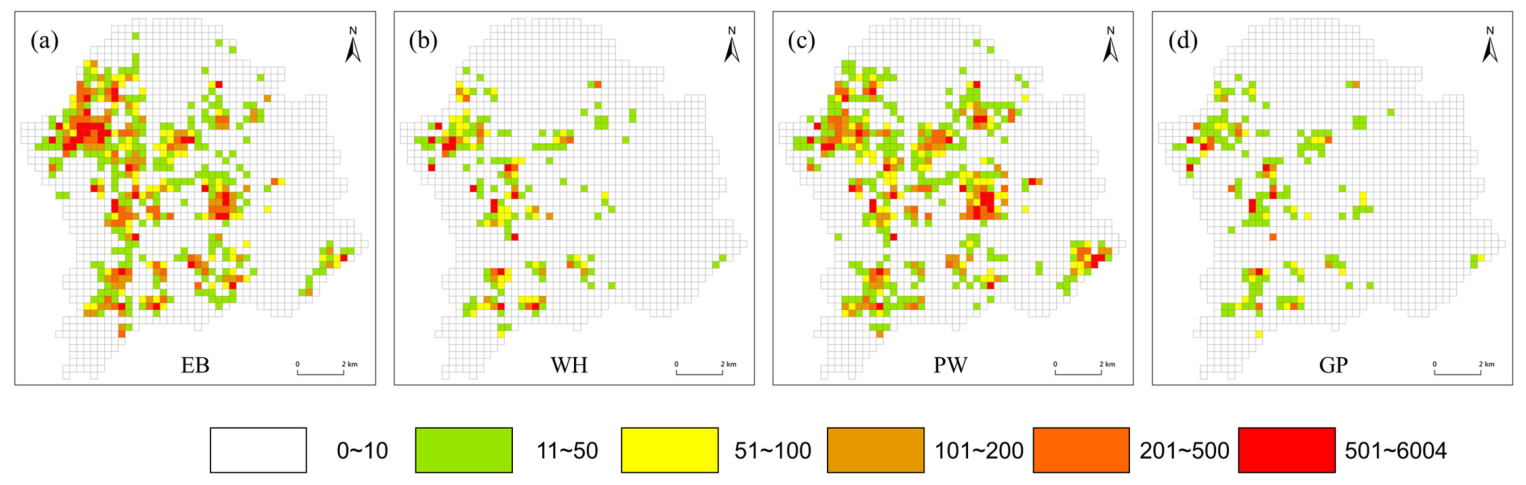
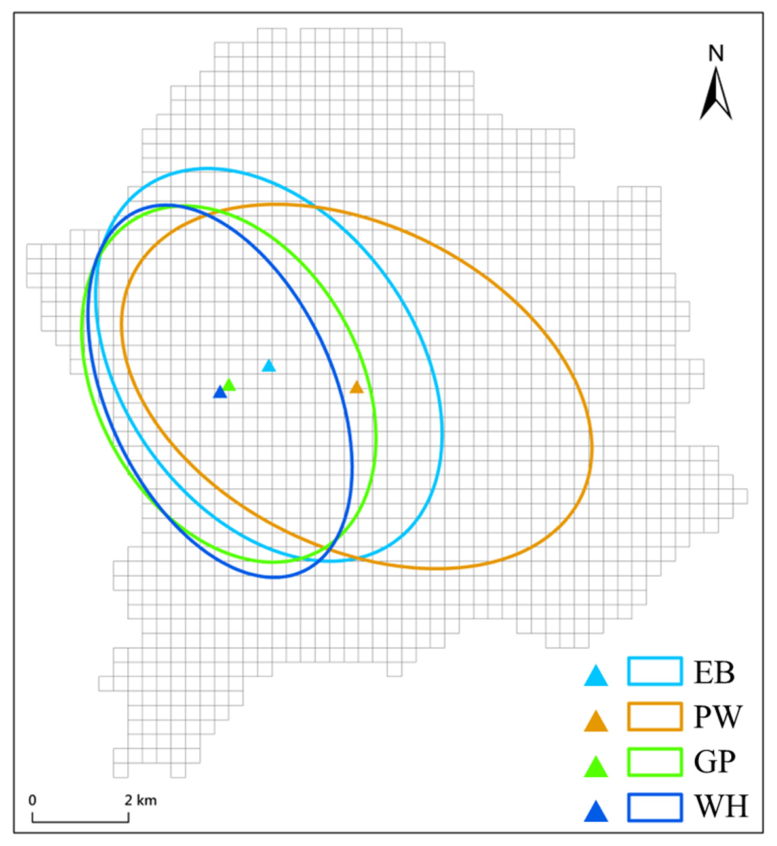
According to the spatial distribution of four types of fire risk events (Figure 4), all four fire risk types show pronounced spatial clustering with clear hotspots in the central area of Guangming District. However, their hotspot patterns are not identical: EB and PW display broader, corridor-like concentrations along major residential and mixed-use belts, whereas GP and WH are more tightly clustered around older residential neighborhoods and local commercial streets. The heterogeneous spatial patterns observed across the four fire risk event types are consistent with findings from related urban studies [40,41]. Figure 5 further visualizes the distribution patterns using mean centers and standard deviation ellipses. The limited overlap among the four ellipses also quantitatively confirms that the spatial footprints of different fire risk event types do not fully coincide, supporting modeling them separately and suggesting underlying differences in the “state” environments associated with each fire risk event type.

4.2. Model Specification Based on LM Diagnostics

The spatial autocorrelation analysis indicated statistically significant positive spatial autocorrelation for all four fire risk types (Moran’s I > 0.20, p < 0.001). The LM test results show that both the Lagrange Multiplier (error) and its robust form are highly significant (LM-error = 311.61, p < 0.001; Robust LM-error = 199.90, p < 0.001), while the robust Lagrange Multiplier (lag) is marginally significant (Robust LM-lag = 3.49, p = 0.06). According to the selection criteria of the LM test [39] (see Appendix A Table A1), when the robust LM-error is significant, the spatial error model (SEM) is selected as the optimal spatial model.

4.3. Multicollinearity Diagnostics

To assess potential multicollinearity among the explanatory variables, we computed the Pearson correlation matrix, the Variance Inflation Factor (VIF) [42] for each of the 12 covariates, and the multicollinearity condition number [42] for all four fire risk event models.
With the exception of the moderate correlation between RD and NE (0.70) and the relatively high correlation between PE and PT (0.80), all other correlations are notably low, with absolute values not exceeding 0.62 and a mean of 0.21 (see Appendix A Table A2). This average level is well below the conventional threshold of |r| ≥ 0.80 for serious multicollinearity. The VIF values of all the variables except TP are below the commonly used cut-off value of 5 [42,43]. Although TP (8.93) marginally surpasses the strict threshold of 5, it is still within the acceptable limit of 10 [43], suggesting no explanatory variable suffers from severe multicollinearity (see Appendix A Table A3). In addition, the condition numbers for the four models fall between 5.31 and 7.71, which are far below the critical threshold of 30 [42], further confirming that the model matrices are reasonably well-conditioned (see Appendix A Table A4). Taken together, these diagnostics suggest that multicollinearity does not materially bias the SEM coefficient estimates.

4.4. Evaluation of Model Performance and Cross-Validation

The Spatial Error Model was applied to examine the influence of various social factors on the four types of fire risk events. The R2 values of these models range from 0.82 to 0.89, which indicates that the independent variables, combined with spatial effects, collectively explain over 80% of the variance in fire risk events. Although these values are not exceptional in absolute terms, they are considered robust for high-resolution urban grid analysis [16,25,44].
To evaluate the predictive performance and potential overfitting of the SEMs, a spatial 5-fold cross-validation was implemented. The data were partitioned into five spatially contiguous folds to reduce spatial leakage between training and testing sets. For each fold, the SEM was estimated on four folds and evaluated on the held-out fold. The results show that the mean out-of-sample R2 for each model is only slightly lower than the corresponding in-sample pseudo R2, with the difference ranging from 0.03 to 0.08 (Table 3). It indicates that the models have robust predictive capabilities and there is no significant overfitting problem.

4.5. Regression Results of Spatial Error Models

For all spatial error models, we report coefficient estimates, standard errors (SE) and 95% confidence intervals (CI = estimate ± 1.96 × SE) (Table 4). Noted, only the statistically significant variables (p < 0.05) were involved in the final model construction, while the remaining variables are left blank in Table 4.

4.6. Residual Diagnostics and Heteroskedasticity

We employed likelihood ratio (LR) tests to confirm significant spatial error dependence [39] for all four fire risk event models (LR = 114.76–234.45, p < 0.001), justifying the use of the Spatial Error Model. The LR test is widely adopted to verify the necessity of incorporating spatial error components, as it effectively detects residual spatial autocorrelation that would otherwise be ignored by conventional non-spatial models. However, Breusch–Pagan tests [45] further indicated significant heteroskedasticity in the residuals (p < 0.001), which may lead to inefficient coefficient estimates and biased standard errors, thereby undermining the reliability of statistical inference. To address this issue, we re-estimated the models with PySAL’s GM_Error_Het estimator [46], which provides heteroskedasticity-robust standard errors while keeping the SEM specification and spatial weights unchanged. The robust results show that the coefficients and significance of the key variables remain stable, and the spatial error parameter λ is still highly significant (p < 0.001), indicating that the coefficient estimates remain statistically reliable despite residual heteroskedasticity. Combined with spatial 5-fold cross-validation (ΔR2 ≤ 0.08), these diagnostics confirm that the models are robust and not merely overfitting to local noise.

5. Discussion

The results indicate that no single factor can explain all types of fire risk event distribution, underscoring the necessity of a comprehensive and type-specific analytical framework. Further, the influencing factors were categorized according to the PSR framework for analysis, see Table 5. However, their coefficients varied noticeably across the different risk event types, underscoring the need for targeted risk-specific interventions. As summarized in Table 5, we use “+”/“−” to denote positive/negative correlations, with the number of symbols reflecting effect strength (e.g., + for 0–2, ++ for 2–5, +++ for coefficients > 5). All reported correlations are statistically significant at p < 0.05.
The following section summarizes the key influencing social factors and their mechanisms for each fire risk events type, which lays the foundation for formulating targeted prevention strategies based on risk event types, population groups and geographical environments.

5.1. Pressure: Demographic Risk Factors

The findings provide empirical evidence for distributive inequity in fire risk exposure. The proportion of elderly residents shows a significantly positive correlation with violations related to water heater usage and non-standard electrical wiring practices. This may coincide with the elderly population’s longstanding unsafe habits, who may tend to use older, less safe water heaters, or their limited mobility may lead to inadequate installation of safety components such as standardized exhaust pipes.
Notably, while the elderly act as primary motivated offenders in this context, they also represent a highly vulnerable group in fire incidents due to reduced physical mobility and slower response capabilities, highlighting the need for equitable intervention strategies. Therefore, communities with higher proportions of older adults should be prioritized for targeted safety education and enhanced regulatory oversight.
Regarding other demographic variables, the total resident population exhibited a negative correlation in multiple models, suggesting that fire risks are concentrated within specific subpopulations rather than the general population size. Other variables, such as the proportion of females and the proportion of teenagers, were not statistically significant in the models, indicating no direct association with these high-risk behaviors.
These findings underscore the importance of developing differentiated intervention strategies based on demographic profiles. Rather than implementing broad-based campaigns, resources should be directed toward specific groups—particularly the elderly—to address risk patterns associated with daily behavioral patterns.

5.2. State: Risk Embodied in the Built Environment

The built environment serves as a critical spatial medium through which social pressures translate into tangible fire risks. From the environmental criminology perspective, these areas function as “nodes” in residents’ daily activity patterns, naturally becoming “suitable targets” for risk concentration due to the convergence of various activities and populations.
Variables measuring regional development intensity—including the density of residential areas, mixed-use buildings, and restaurants—generally demonstrated positive correlations with fire risk events. Particularly noteworthy is the consistent significant positive influence of restaurant density across all four types of high-risk behaviors. This may be related to the inherent fire risks associated with food service operations, which typically involve open flames, high electrical loads, and gas appliances.
Mixed-use buildings present a particularly complex risk profile. The combination of residential and commercial functions within single structures is often associated with functional confusion and ambiguous management responsibilities. For example, the presence of restaurants is correlated with management challenges in surrounding residential areas and shows linkage with risk spillover patterns and higher observed risk levels. The associations of land use mix and road network density varied significantly across different risk types, revealing the nuanced role of spatial configuration. Areas with higher functional diversity and connectivity tend to have higher development levels, accompanied by stricter regulatory oversight. These areas exhibit significant negative correlations with more visible, easily detectable violations such as unauthorized power wiring and aging gas pipelines. These areas also exhibited positive relationships with behaviors such as improper electric-bike charging, which may coincide with denser populations and frequent activities. This complex relationship highlights how identical environmental characteristics can simultaneously show both negative and positive associations with different risk types. The monitoring effect of high development levels appears more effective for conspicuous violations, while the increased activity opportunities in these areas may promote more concealed risk behaviors.
These findings strongly support Crime Pattern Theory’s emphasis on how urban environments are related to human activity distribution and consequent risk patterns. The built environment not only provides the physical setting for risk behaviors but actively structures their occurrence through its configuration of spaces, flows, and activity nodes, which may exacerbate existing social inequalities. Therefore, equity-oriented environmental intervention measures need to be taken for specific risk events associated with the state.

5.3. Response: Regulatory Measures and Warning Signals

The response dimension reveals how institutional and community-level interventions are associated with fire risk event patterns. The presence of fire stations was negatively associated with fire risk events, indicating a potential negative linkage between formal emergency response facilities and the occurrence of fire risks. This finding aligns with the “Capable Guardian” construct in RAT, where visible authority or infrastructure can suppress risk-taking behaviors.
More remarkably, the variable representing reported deficiencies—such as missing fire equipment and blocked exits—exhibited a strongly significant positive correlation (p < 0.001) with notably large coefficient values for all four types of fire risk events. This pattern indicates that concentrated reported deficiencies correspond to elevated observed fire risk levels. Two possible interpretations are noted. First, intensified regulation inevitably leads to higher detection rates. Therefore, reported deficiencies may serve as an indicator of regulatory intensity rather than purely reflecting the objective risk level, which can be termed the “regulatory spillover effect.” Second, a risk-regulation-discovery cycle may exist, where initial risks trigger regulatory attention, which in turn uncovers additional hidden risks, thereby forming a self-reinforcing feedback loop.
Notably, NE reflects both actual fire risk levels and local regulatory intensity simultaneously and may introduce possible endogeneity and bias in the estimation. However, since this study emphasizes explanatory and predictive performance for risk governance practice rather than strict causal identification, NE still provides a valid and practically useful signal for fire risk early warning and governance prioritization. At the practical level, when deficiency reports increase and cluster spatially, authorities may initiate comprehensive inspections across all risk types, enabling early intervention before fire incidents occur. This evidence-based approach supports a paradigm shift from reactive response to predictive, proactive governance, where warning signals guide resource allocation and intervention priorities. Future research may adopt instrumental variables or exogenous regulatory indicators to further address endogeneity concerns.

5.4. Implications and Recommendations

The integrated PSR-Environmental Criminology framework reveals close interactions among pressure, state, and response dimensions in relation to fire risk events. Targeted interventions can therefore be designed along these three dimensions: safety education for high-risk groups at the pressure dimension, built environment optimization at the state dimension, and strengthened supervision and early warning at the response dimension.
Specifically, tailored intervention approaches are suggested for different fire risk event types. Electric bike charging violations represent a combined “state-response” association pattern, which is linked to both the built environment and regulatory behaviors. It is necessary to strengthen patrols and reporting at the response dimension while simultaneously providing adequate charging facilities to improve the state dimension, forming a governance strategy that combines preventive measures with practical solutions. Water heater misuse is a typical “pressure-state” associated risk, requiring equity-oriented safety education for vulnerable groups, supplemented by in-home inspections and environmental modifications where necessary. Unauthorized power wiring and aging gas pipelines are “state-associated” risk events, which are strongly linked to the physical environment. Thus, it necessitates physical environment improvements and infrastructure upgrades in the high-risk areas.
Another key insight is the multidimensional nature of the influencing factors. Although all variables are assigned to a primary PSR dimension, they are potentially associated with other dimensions. For instance, RD is categorized under the built environment (State), yet it also generates specific pressures (Pressure) related to population gathering. Similarly, MDL reflects spatial configuration (State) but also alters the opportunity structure for both risky behaviors and regulatory oversight (Response). These findings suggest that urban fire risk is not merely a sum of independent factors, but also emerges from the interaction and coupling of pressures, states, and responses.
Moreover, the strong spatial clustering of risk events supports that a regional-based governance model should be adopted, instead of treating individual buildings in isolation. The PSR framework proposed in this study provides a theoretical basis for identifying high-risk regions, which can support urban management systems and fire departments in optimizing the allocation of resources.

5.5. Limitations

This study still has several limitations that need to be addressed in future research. Restricted by data availability and official authorization, we are currently unable to obtain comparable data for longer periods or other regions. Thus, the empirical analysis is limited to Guangming District, Shenzhen, in 2019. This inevitably constrains the temporal and spatial generalizability of the findings. Multi-region, long-term validation will be pursued in future work through cooperation with more local governments and fire authorities, so as to test the universality and robustness of the proposed PSR–RAT/CPT framework across diverse urban contexts and longer temporal dynamics.
It is also important to emphasize that the empirical results presented in this study reflect statistical associations rather than strict causal relationships. While the integrated PSR-RAT/CPT framework offers a theoretically grounded structure for interpreting these associations, the cross-sectional nature of the data limits our ability to infer causality. More rigorous causal inference will require panel data or quasi-experimental designs in subsequent research.
It is worth noting that in a separate study in the same district [47], we have already systematically examined the spatiotemporal distribution patterns and lag relationships of multiple fire risk event types. Based on that, this study focuses on how different fire risk event types are associated with social factors within a given period, providing a complementary “mechanism-oriented” perspective. Future research will integrate these two perspectives by extending the proposed framework to multi-period datasets and adopting panel spatial econometric or dynamic spatiotemporal models, thereby jointly capturing temporal dynamics, spatial dependence, and potential causal pathways.

6. Conclusions

This study successfully couples macro-level social system causal chains (PSR) with micro-level individual behavioral–spatial mechanisms (RAT/CPT), proposing a targeted prevention and control strategy based on the linkage of “Pressure–State–Response” mechanisms, with explanations grounded in environmental criminology theory. Nevertheless, readers should interpret the findings as contextual associations derived from a specific spatio-temporal setting, rather than universal causal laws. It treats fire risk events as dynamic correlational patterns among human activities, environmental conditions and institutional regulations to analyze how social factors are associated with different types of urban fire risk events. The effectiveness of this framework is validated through a case study of Guangming District, Shenzhen.
In the practical case study of Guangming District, it was found that fire risk events exhibit strong interactive effects, spatial clustering, and type-specific dependencies. This necessitates the development of comprehensive prevention strategies tailored to “specific risk types, population groups, and geographical areas”, which aligns with the call for more inclusive risk management strategies that prioritize vulnerable groups and promote distributive justice in disaster risk reduction. Specifically, interventions at the pressure dimension should prioritize high-risk groups, such as implementing safety education programs targeting elderly residents; interventions at the state dimension require optimizing environmental design, including installing safe charging facilities in residential areas; interventions at the response dimension can leverage community reporting systems as early-warning indicators to enable proactive governance.
This framework provides a novel perspective for understanding urban fire risks, promoting a significant shift in urban fire governance from “ex-post rescue” to “ex-ante prevention”. By integrating fire risk considerations into everyday urban planning and community governance, it advances intelligent fire risk management in smart cities and directly contributes to the achievement of Sustainable Development Goal 11 for inclusive, safe, resilient and sustainable cities and communities.

Author Contributions

Conceptualization, Y.F. and C.C.; methodology, Y.F., C.C.; software, C.C., Z.L. and Z.S.; validation, Z.L. and Z.S.; formal analysis, Y.F. and C.C.; investigation, Y.F. and C.C.; resources, L.W. and Y.T.; data curation, C.L.; writing—original draft preparation, Y.F. and C.C.; writing—review and editing, Y.F., C.C. and Y.T.; visualization, Z.L. and Z.S.; supervision, L.W. and Y.T.; project administration, L.W. and Y.T.; funding acquisition, Y.F. All authors have read and agreed to the published version of the manuscript.

Funding

The research was funded by the Beijing Natural Science Foundation, grant number 8254052, and the Young Elite Scientists Sponsorship Program of the Beijing High Innovation Plan, grant number 20250689.

Institutional Review Board Statement

Not applicable.

Informed Consent Statement

Not applicable.

Data Availability Statement

Restrictions apply to the availability of these data. Data were obtained from the Digitized Urban Management System of Shenzhen and are available from the author Lun Wu with the permission of the Digitized Urban Management System of Shenzhen.

Conflicts of Interest

Author Cong Liao was employed by the company CAUPD Beijing Planning & Design Consultants Ltd. The remaining authors declare that the research was conducted in the absence of any commercial or financial relationships that could be construed as a potential conflict of interest.

Abbreviations

The following abbreviations are used in this manuscript:
PSRPressure–State–Response Model
RATRoutine Activity Theory
CPTCrime Pattern Theory
DUMSDigitized Urban Management System
EBElectric bike charging
PWPower wiring
WHWater heater
GPGas pipelines
POIPoint of Interest
TPTotal population of residents
PEProportion of elderly over 60 years old
PTProportion of teenagers under the age of 18
PFProportion of female
CDDensity of communities
RQDDensity of residential quarters
MBDDensity of mixed-use buildings for trading and residence
RDDensity of restaurants
MDLThe level of mixed-use development on land parcels
RRRatio of road length to total area
IFSIs there a fire station around
NENumber of fire risk events in public area

Appendix A

Table A1. Spatial model selection and significance of LM test [39].
Test ResultModel Selection
Only LM-lag significantSAR
Only LM-error significantSEM
Both LM tests significantRefer to robust tests
— Robust LM-lag significantSAR
— Robust LM-error significantSEM
— Both Robust LM tests significantSDM
Table A2. Correlation coefficients between independent variables.
TPPFPEPTCDRQDMBDRDMDLRRIFSNE
TP1.0000
PF0.1551 1.0000
PE0.3423 0.1068 1.0000
PT0.4350 0.1274 0.8042 1.0000
CD0.3828 0.1906 −0.0892 −0.0046 1.0000
RQD0.3368 0.1487 −0.1951 −0.1582 0.3364 1.0000
MBD0.3270 0.1991 −0.1137 −0.0673 0.5378 0.3302 1.0000
RD0.4616 0.2041 −0.1308 −0.0636 0.6186 0.4151 0.5948 1.0000
MDL0.4103 0.1068 −0.2218 −0.1821 0.3774 0.4813 0.3491 0.5035 1.0000
RR0.3947 0.1063 −0.1846 −0.1204 0.3855 0.4939 0.3881 0.5305 0.5892 1.0000
IFS0.0670 0.0427 −0.0147 0.0124 0.0580 0.0968 0.0682 0.0605 0.0629 0.0469 1.0000
NE0.4930 0.1876 −0.1820 −0.0920 0.6198 0.4850 0.5230 0.7042 0.5920 0.5737 0.0547 1.0000
Table A3. VIFs of independent variables.
VariableVIF
TP8.9338
PE4.4346
PT5.0572
PF4.2062
CD2.1948
RQD3.8775
MBD1.9474
RD3.2283
MDL4.0413
RR4.7377
IFS1.0280
NE4.5318
Table A4. Condition numbers of the four SEM models.
ModelEBWHPWGP
Multicollinearity Condition Number5.31397.71017.63405.4090

References

  1. The People’s Government of Guangming District, Shenzhen. Analysis of the Situation of Work Safety and Disaster Prevention and Mitigation in Guangming District in 2023. 2024. Available online: https://www.szgm.gov.cn/gkmlpt/content/11/11128/post_11128412.html#1181 (accessed on 21 April 2026).
  2. The People’s Government of Guangming District, Shenzhen. Analysis of the Situation of Work Safety and Disaster Prevention and Mitigation in Guangming District in 2024. 2025. Available online: https://www.szgm.gov.cn/gkmlpt/content/11/11987/post_11987395.html#1181 (accessed on 21 April 2026).
  3. National Fire and Rescue Administration. The Fire Department Has Summarized Five Characteristics of Fires Across the Country in 2024, with 908,000 Reports Received Throughout the Year. 2025. Available online: https://www.119.gov.cn/qmxfxw/mtbd/wzbd/2025/48022.shtml (accessed on 21 April 2026).
  4. United Nations General Assembly. Report of the Second Committee: Sustainable Development: Disaster Risk Reduction(A/73/538/Add.3). Retrieved from United Nations Digital Library. 2018. Available online: https://digitallibrary.un.org/record/1662282 (accessed on 15 March 2026).
  5. Integr. Risk Management Plan. Available online: https://www.merseyfire.gov.uk/about/our-plans-and-performance/integrated-risk-management-plan-irmp/ (accessed on 25 November 2025).
  6. Fire and Rescue Bureau of the Ministry of Emergency Management. Available online: https://www.119.gov.cn/qmxfxw/xfywm/2025/48602.shtml (accessed on 25 November 2025).
  7. Bhadauria, P.K.S.; Ranit, A.B.; Chaudhary, P.S.; Dongre, K.A.; Harle, S.M.; Bhagat, A.P. Innovative approaches to fire-resistant building materials: A review. Life Cycle Reliab. Saf. Eng. 2025. [Google Scholar] [CrossRef] [Scilit]
  8. Gravit, M.V.; Kotlyarskaya, I.L.; Zybina, O.A.; Korolchenko, D.A.; Nuguzhinov, Z.S. Fire Resistance of Building Structures and Fire Protection Materials: Bibliometric Analysis. Fire 2025, 8, 10. [Google Scholar] [CrossRef] [Scilit]
  9. Chen, Y.; Wu, G.; Chen, Y.; Xia, Z. Spatial Location Optimization of Fire Stations with Traffic Status and Urban Functional Areas. Appl. Spat. Anal. Policy 2023, 16, 771–788. [Google Scholar] [CrossRef] [Scilit]
  10. Dabous, S.A.; Shikhli, A.; Shareef, S.; Mushtaha, E.; Obaideen, K.; Alsyouf, I. Fire prevention and mitigation technologies in high-rise buildings: A bibliometric analysis from 2010 to 2023. Ain Shams Eng. J. 2024, 15, 103010. [Google Scholar] [CrossRef] [Scilit]
  11. Davies, I.P.; Haugo, R.D.; Robertson, J.C.; Levin, P.S. The unequal vulnerability of communities of color to wildfire. PLoS ONE 2018, 13, E0205825. [Google Scholar] [CrossRef] [Scilit] [PubMed]
  12. Lambrou, N.; Kolden, C.; Loukaitou-Sideris, A.; Anjum, E.; Acey, C. Social drivers of vulnerability to wildfire disasters: A review of the literature. Landsc. Urban Plan. 2023, 237, 104797. [Google Scholar] [CrossRef] [Scilit]
  13. Edgeley, C.M.; Evans, A.M.; Devenport, S.E.; Kohler, G.; Zamudio, Z.M.; DeGrandpre, W.D. Preventing Human-Caused Wildfire Ignitions on Public Lands: A Review of Best Practices. For. Sci. 2025, 71, 493–521. [Google Scholar] [CrossRef] [Scilit]
  14. Hesseln, H. Wildland fire prevention: A review. Curr. For. Rep. 2018, 4, 178–190. [Google Scholar] [CrossRef] [Scilit]
  15. National Wildfire Coordinating Group. National Wildfire Prevention Strategy; USDA Forest Service Fire and Aviation Management, Washington Office: Washington, DC, USA, 2021; 20p.
  16. Hao, Y.; Li, M.; Wang, J. A High-Resolution Spatial Distribution-Based Integration Machine Learning Algorithm for Urban Fire Risk Assessment: A Case Study in Chengdu, China. ISPRS Int. J. Geo-Inf. 2023, 12, 404. [Google Scholar] [CrossRef] [Scilit]
  17. Zhang, Y. Analysis on comprehensive risk assessment for urban fire: The case of Haikou city. Procedia Eng. 2013, 52, 618–623. [Google Scholar] [CrossRef] [Scilit]
  18. Corcoran, J.; Higgs, G.; Brunsdon, C.; Ware, A.; Norman, P. The use of spatial analytical techniques to explore patterns of fire incidence: A South Wales case study. Comput. Environ. Urban Syst. 2007, 31, 623–647. [Google Scholar] [CrossRef] [Scilit]
  19. Ceyhan, E.; Ertuğay, K.; Düzgün, S. Exploratory and inferential methods for spatio-temporal analysis of residential fire clustering in urban areas. Fire Saf. J. 2013, 58, 226–239. [Google Scholar] [CrossRef] [Scilit]
  20. Zhang, X.X.; Yao, J.; Sila-Nowicka, C. Exploring spatiotemporal dynamics of urban fires: A case of Nanjing, China. ISPRS Int. J. Geo-Inf. 2018, 7, 7. [Google Scholar] [CrossRef] [Scilit]
  21. Liu, N.; Zhu, W.; Zhong, S.; Cheng, H. Spatial-temporal characteristics and influencing factors of wildfire occurrence and correlation with WUI presence in Beijing-Tianjin-Hebei region, China. Geomat. Nat. Hazards Risk 2023, 14, 2281246. [Google Scholar] [CrossRef] [Scilit]
  22. Yıldız, M.A. Machine Learning for Fire Safety in the Built Environment: A Bibliometric Insight into Research Trends and Key Methods. Buildings 2025, 15, 2465. [Google Scholar] [CrossRef] [Scilit]
  23. Xiang, H.; Wu, L.; Guo, Z.; Ren, S. Urban Fire Spatial–Temporal Prediction Based on Multi-Source Data Fusion. Fire 2025, 8, 177. [Google Scholar] [CrossRef] [Scilit]
  24. Wei, G.; Han, G.S.; Lang, X. Fire risk assessment using machine learning techniques: A case study of Jinan City, China. Sci. Rep. 2026, 16, 6410. [Google Scholar] [CrossRef] [Scilit]
  25. Lee, S.L.; Hsu, M.H.; Wang, Y.F.; Wang, M.Y. Machine learning-based forecasting of urban fire impact in city environments. Sci. Prog. 2025, 108, 368504251406566. [Google Scholar] [CrossRef] [Scilit]
  26. Thakare, K.V.; Tajne, K.M. A Comprehensive Review of Geographic Information Systems (GIS)-Based Methodologies for Urban Fire Risk Assessment. Cureus J. Eng. 2025, 2, es44388-024-02916-y. [Google Scholar] [CrossRef] [Scilit]
  27. Ejaz, N.; Choudhury, S. A comprehensive survey of the machine learning pipeline for wildfire risk prediction and assessment. Ecol. Inform. 2025, 90, 103325. [Google Scholar] [CrossRef] [Scilit]
  28. Kumar, R.; Kaur, A.; Kumar Dangi, H.; Kumari, P.; Kumar, N. Artificial Intelligence in Fire Safety: A Critical Perspective on Policy, Stakeholders and Emerging Technologies in India. FIIB Bus. Rev. 2026, 15, 11–19. [Google Scholar] [CrossRef] [Scilit]
  29. Rapport, D.J.; Friend, A.M. Towards a Comprehensive Framework for Environmental Statistics: A Stress-Response Approach; Minister of Supply and Services Canada: Ottawa, ON, Canada, 1979. [Google Scholar]
  30. Fu, X.; Liu, Y.; Xie, Z.; Jiang, F.; Xu, J.; Yang, Z.; Deng, Z.; Wang, Q.; Liao, M.; Wu, X.; et al. A coupled PSR-based framework for holistic modeling and flood resilience assessment: A case study of the 2022 flood events in five southern provinces of China. J. Hydrol. 2024, 636, 131255. [Google Scholar] [CrossRef] [Scilit]
  31. Jiao, L.; Wang, L.; Lu, H.; Fan, Y.; Zhang, Y.; Wu, Y. An assessment model for urban resilience based on the pressure-state-response framework and BP-GA neural network. Urban Clim. 2023, 49, 101543. [Google Scholar] [CrossRef] [Scilit]
  32. Wang, G.P.; Min, Q.W.; Ding, L.B.; He, S.Y.; Li, H.Y.; Jiao, W.J. Comprehensive disaster risk assessment index system for national parks based on the PSR model. Acta Ecol. Sin. 2019, 39, 8232–8244. [Google Scholar] [CrossRef] [Scilit]
  33. Xu, M.; Huang, X.; Li, J.; Qi, S.; Zhang, Y.; Zhang, X. Assessing the ecological risk and its driving forces on Islands using the Pressure-State-Response model. Sci. Rep. 2025, 15, 23162. [Google Scholar] [CrossRef] [Scilit]
  34. Cohen, L.E.; Felson, M. Social change and crime rate trends: A routine activity approach (1979). In Classics in Environmental Criminology; Andresen, M.A., Brantingham, P.J., Kinney, J.B., Eds.; Routledge: New York, NY, USA, 2010; pp. 203–232. [Google Scholar]
  35. Brantingham, P.; Brantingham, P.L.; Wortley, R.; Mazerolle, L. Environmental Criminology and Crime Analysis, 1st ed.; Willan: London, UK, 2008; pp. 100–116. [Google Scholar]
  36. Ewing, R.; Cervero, R. Travel and the built environment: A meta-analysis. J. Am. Plan. Assoc. 2010, 76, 265–294. [Google Scholar] [CrossRef] [Scilit]
  37. Yuill, R.S. The standard deviational ellipse; an updated tool for spatial description. Geogr. Ann. Ser. B. Hum. Geogr. 1971, 53, 28–39. [Google Scholar] [CrossRef]
  38. Moran, P.A.P. Notes on continuous stochastic phenomena. Biometrika 1950, 37, 17–23. [Google Scholar] [CrossRef] [Scilit]
  39. Anselin, L. Lagrange multiplier test diagnostics for spatial dependence and spatial heterogeneity. Geogr. Anal. 1988, 20, 1–17. [Google Scholar] [CrossRef] [Scilit]
  40. Feng, Y.; Du, S.; Myint, S.W. Do Urban Functional Zones Affect Land Surface Temperature Differently? Remote Sens. 2019, 11, 1802. [Google Scholar] [CrossRef] [Scilit]
  41. Huang, A.-C.; Huang, C.-F.; Shu, C.-M. A Case Study for an Assessment of Fire Station Selection in the Central Urban Area. Safety 2023, 9, 84. [Google Scholar] [CrossRef] [Scilit]
  42. Belsley, D.A.; Edwin, K.; Roy, E.W. Regression Diagnostics: Identifying Influential Data and Sources of Collinearity; John Wiley & Sons: New York, NY, USA, 1980. [Google Scholar]
  43. Hair, J.F.; Anderson, R.E.; Tatham, R.L.; Black, W.C. Multivariate Data Analysis, 3rd ed.; Macmillan: New York, NY, USA, 1995. [Google Scholar]
  44. Das, M.; Das, A.; Mandal, A. Exploring the factors affecting urban ecological risk: A case from an Indian mega metropolitan region. Geosci. Front. 2023, 14, 101488. [Google Scholar] [CrossRef] [Scilit]
  45. Breusch, T.S.; Pagan, A.R. A simple test for heteroscedasticity and random coefficient variation. Econometrica 1979, 47, 1287–1294. [Google Scholar] [CrossRef] [Scilit]
  46. Arraiz, I.; Drukker, D.M.; Kelejian, H.; Prucha, I.R. A spatial Cliff-Ord-type model with heteroskedastic innovations: Small and large sample results. J. Reg. Sci. 2010, 50, 592–614. [Google Scholar] [CrossRef] [Scilit]
  47. Cheng, C.Y.; Wu, L.; Tian, Y.; Liao, C.; Zhang, J.X.; Cao, X.C.; Deng, Y.L.D.; Ma, R.P. Spatiotemporal Patterns Mining for Urban Fire Hazards: A Case Study in Guangming District, Shenzhen. Acta Sci. Nat. Univ. Pekin. 2025, 61, 99–110. [Google Scholar]
Figure 1. The interaction among fire risk events and PSR dimensions.
Sustainability 18 05795 g001
Figure 2. The overview of the study area.
Sustainability 18 05795 g002
Figure 3. Analytical procedure.
Sustainability 18 05795 g003
Figure 4. Grid spatial distributions of four typical types of fire risk events: (a) EB, (b) WH, (c) PW, and (d) GP. Each grid cell represents a 300 m × 300 m unit, and the legend indicates the number of recorded events, increasing from cool (low) to warm (high) colors.
Sustainability 18 05795 g004
Figure 5. Distribution patterns of different fire risk events revealed by Mean Centers and SDE. The solid points mark the mean centers of each fire risk event type, while the ellipses depict the one-standard-deviation dispersion and directional trend.
Sustainability 18 05795 g005
Table 1. Operationalization of PSR dimensions and RAT/CPT constructs.
PSR
Dimension
RAT/CPT
Constructs
VariablesDefinitions
PressureMotivated OffenderTPTotal population of residents
PEProportion of elderly over 60 years old
PTProportion of teenagers under the age of 18
PFProportion of female
StateSuitable Target & Awareness SpaceCDDensity of communities
RQDDensity of residential quarters
MBDDensity of mixed-use buildings for trading and residence
RDDensity of restaurants
MDLThe level of mixed-use development on land parcels
RRRatio of road length to total area
ResponseCapable GuardianIFSIs there a fire station around
NENumber of fire risk events in public areas
Table 2. Fire risk events.
CategoriesDefinitionsCount
EBStoring electric bikes or charging them (including charging after removing the battery and placing it indoors) in public corridors, stairwells, anterooms, or inside rooms of residential buildings.94,871
PWHaphazardly connecting or carelessly pulling power cords. Using power wires without insulating sleeves.74,685
GPThe gas pipes are aging. Or the gas valves are loose. Or the connections between pipes and valves are not secured with clamps.15,398
WHUsing direct-vent water heaters. Using forced-vent water heaters without installing exhaust pipes or with exhaust pipes not extending outdoors. Using electric water heaters without leakage protection devices.24,437
Table 3. Model Performance and cross-validation.
ModelIn-Sample Pseudo-R2Mean Out-of-Sample R2 of Cross-ValidationΔR2
EB0.89140.85030.0411
WH0.82080.76620.0546
PW0.81720.78380.0334
GP0.82990.75460.0753
Table 4. Significant Coefficient Estimates of Spatial Error Models.
Variables(Coefficient, SE, 95% CI)
EBWHPWGP
TP −0.34,0.14,
[−0.62,−0.07]
−0.32,0.15,
[−0.62,−0.01]
PE 2.64,0.90,
[0.87,4.41]
3.06,0.99,
[1.12,5.00]
PT
PF
CD 0.39,0.14,
[0.11,0.68]
0.64,0.13,
[0.37,0.90]
RQD0.28,0.09,
[0.10,0.46]
0.16,0.08,
[0.00,0.32]
MBD 0.34,0.14,
[0.07,0.62]
0.28,0.13,
[0.02,0.53]
RD0.24,0.11,
[0.02,0.47]
0.45,0.11,
[0.24,0.66]
0.38,0.10,
[0.18,0.59]
0.60,0.10,
[0.40,0.79]
MDL0.15,0.05,
[0.04,0.25]
−0.11,0.05,
[−0.20,−0.02]
−0.11,0.05,
[−0.20,−0.01]
−0.22,0.04,
[−0.31,−0.14]
RR0.30,0.09,
[0.13,0.48]
−0.27,0.07,
[−0.41,−0.13]
IFS −0.28,0.12,
[−0.52,−0.04]
−0.30,0.13,
[−0.55,−0.06]
NE7.13,0.12,
[6.89,7.38]
5.00,0.11,
[4.78,5.22]
5.32,0.11,
[5.09,5.54]
4.67,0.11,
[4.46,4.88]
Table 5. Effects of Social Factors on Fire Risk Events within the PSR Framework.
PSR
Dimension
RAT/CPT Theoretical CorrespondenceIndependent VariablesImpact onCore Mechanism Interpretation
EBWHPWGP
PressureMotivated OffenderTP Highly
population-
specific.
PE ++++
PT
PF
StateSuitable Target & Awareness SpaceCD + +Environment-driven risks.
RQD+ +
MBD + +
RD++++
MDL+
RR+
ResponseCapable GuardianIFS Regulatory complexity.
NE++++++++++++
Note: “+” and “−” indicate statistically significant positive and negative correlations, respectively (p < 0.05). The number of symbols indicates the strength of the correlation based on the coefficient value (+ for 0–2, ++ for 2–5, +++ for >5). Blank cells indicate no statistically significant relationship. Variables in bold have significant effects or broad effects on three or all four risk types.
Disclaimer/Publisher’s Note: The statements, opinions and data contained in all publications are solely those of the individual author(s) and contributor(s) and not of MDPI and/or the editor(s). MDPI and/or the editor(s) disclaim responsibility for any injury to people or property resulting from any ideas, methods, instructions or products referred to in the content.