1. Introduction
The global manufacturing industry (MFI) is undergoing a profound transformation based on sustainable transition. Traditional extensive growth models relying heavily on resource consumption and cheap labor are encountering significant bottlenecks in efficiency and quality. These models increasingly conflict with global goals for carbon neutrality and circular resource use [
1].
In many regions, manufacturing still faces low efficiency, high pollution emissions, and insufficient quality control. Structural upgrading is urgently required to surmount these developmental constraints. As the world’s largest manufacturing nation, China shoulders a significant responsibility for reducing emissions. Against this national backdrop, the Beijing–Tianjin–Hebei (BTH) region functions as a crucial economic powerhouse and manufacturing center in northern China [
2]. It is also a designated demonstration area for high-quality development propelled by the digital economy.
Under the integrated development strategy of the BTH region, local manufacturing is confronted with dual pressures: attaining peak carbon emissions while simultaneously upgrading its industrial structure. Therefore, studying the spatial evolution and regional synergy of the BTH manufacturing sector is of critical importance. Specifically, exploring how digital elements can resolve the dilemma of high energy consumption and low efficiency is crucial not only for achieving regional sustainable development but also for providing valuable insights for other industrial regions facing similar challenges [
3].
The New Economic Growth Theory (Endogenous Growth Theory) posits that economic growth depends not only on traditional production factors but also on technological progress [
4]. Technological advancement serves as the core mechanism for upgrading regional manufacturing industrial structures and the primary driver of sustainable manufacturing development [
5]. In the digital economy era, digital elements are increasingly integrated into social production and operations, enhancing economic efficiency and driving industrial transformation. As the central engine of digital economic development, digital elements represent new production factors emerging from the empowerment of traditional factors through digital technology innovation [
6]. Unlike traditional factors, digital elements provide a novel approach to overcoming resource constraints in manufacturing upgrading by continuously optimizing resource allocation efficiency through data iteration [
7,
8].
The sustainable upgrading of regional manufacturing is essentially an organic process characterized by multi-stakeholder participation, multi-level coordination, and dynamic evolution driven by technological changes. Its progression is profoundly influenced by both internal and external innovation drivers. The innovation ecology theory posits that this industrial organizational form is similar to natural ecosystems. It follows a dynamic collaborative mechanism similar to that of ecological communities, ultimately forming a continuously evolving industrial innovation network. The low-cost diffusion and rapid dissemination of digital technology innovations across regional spaces are the primary driving forces behind the ongoing evolution and upgrading of regional manufacturing industrial structures [
9].
However, against the backdrop of intensifying global resource constraints and carbon-neutrality goals, pursuing only the upgrading of the manufacturing industrial structure without a green orientation makes it difficult to achieve long-term sustainable development [
10]. The theory of green development originates from China’s ecological civilization construction practices and targets sustainable development [
11]. Existing research primarily focuses on industrial advancement and rationalization [
4,
12,
13,
14]. This study, grounded in the theory of green development, introduces the concept of “industrial greening” and establishes a three-dimensional integrated evaluation framework for the green upgrading of the manufacturing industrial structure to address the practical demands of sustainable development [
15].
In this study, an innovation ecosystem perspective is adopted to unpack the mechanisms linking digital elements to manufacturing green upgrading. Beyond confirming local drivers, our spatial analysis reveals that digital element inputs generate significant cross-border externalities—specifically, a trade-off between local advancement and regional spatial siphoning. This holistic examination, which accounts for both intra-regional dynamics and inter-regional competition, allows for a more comprehensive evaluation of sustainable development. Ultimately, this study provides policymakers with actionable empirical evidence to bridge the gap between regional industrial development strategies and the Global Sustainable Development Goals (SDGs).
Specifically, the contributions and innovations of this study are as follows: (1) Based on the Innovation Ecosystem Theory, this study reconstructs the synergy mechanism among the subject, elements, and environment that drives the green transformation of manufacturing through digital elements. (2) This study establishes a three-dimensional evaluation framework that emphasizes sophistication, rationality, and environmental sustainability, thus enriching the theoretical framework for the upgrading of the manufacturing industrial structure. (3) The spatial Durbin model is used to systematically clarify the spatial effects of digital elements on the green transformation of manufacturing in the Beijing–Tianjin–Hebei region.
The main components of this study are as follows:
Section 2, based on theoretical analysis, examines the mechanism by which digital inputs influence the green transformation of manufacturing and reconstructs its evolutionary path from an ecological perspective.
Section 3 breaks down the three mechanisms through which digital elements impact this transformation and proposes research hypotheses.
Section 4 outlines the research design, including spatial correlation tests, the spatial Durbin model, and the mediation effect model, along with the development of an indicator system and data description.
Section 5 presents an empirical analysis, interpreting the regression results within the BTH context, and
Section 6 discusses the study’s findings. Finally,
Section 7 summarizes the conclusions, offers policy recommendations, and identifies research limitations and future directions.
2. Theoretical Framework of the Impact of Digital Elements on the Green Upgrading of Regional MFI
2.1. Ecological Reconstruction
A natural ecosystem is a unified system formed through the continuous circulation of matter and exchange of energy between a biotic community and its inorganic environment. The ecological chain is the internal mechanism of community development and succession. The material and energy can form a powerful driving mechanism in the community and promote its succession as the “top community”, which has the highest utilization efficiency of environmental resources.
An industrial innovation ecosystem has similar properties to a natural ecosystem. As Moore (1993) pointed out, enterprises should not be regarded as members of a single industry [
16] but as part of a cross-industry ecosystem, creating value through co-evolution with other members of the system. From the perspective of the complete role division of the ecological community, the population of social and economic organizations participating in the input of industrial digital elements can be divided into three population categories: R&D, industrialization, and consumer. This division is consistent with Adner’s (2017) logic on ecosystem structure; that is, a system is structured by a group of multilateral actors to achieve a specific core value proposition—the green upgrading of MFI [
17]. In such a framework, all kinds of innovation elements are first gathered in the R&D population to form technological achievements, and then products are produced through the industrialization population. Finally, they are used and fed back to the consumer population [
18]. Within a supportive inorganic environment, including policy and investment and financing, the complete system, comprising digital element input, research and development, value transformation, and factor reduction, leads the whole industrial community to be the “top community”.
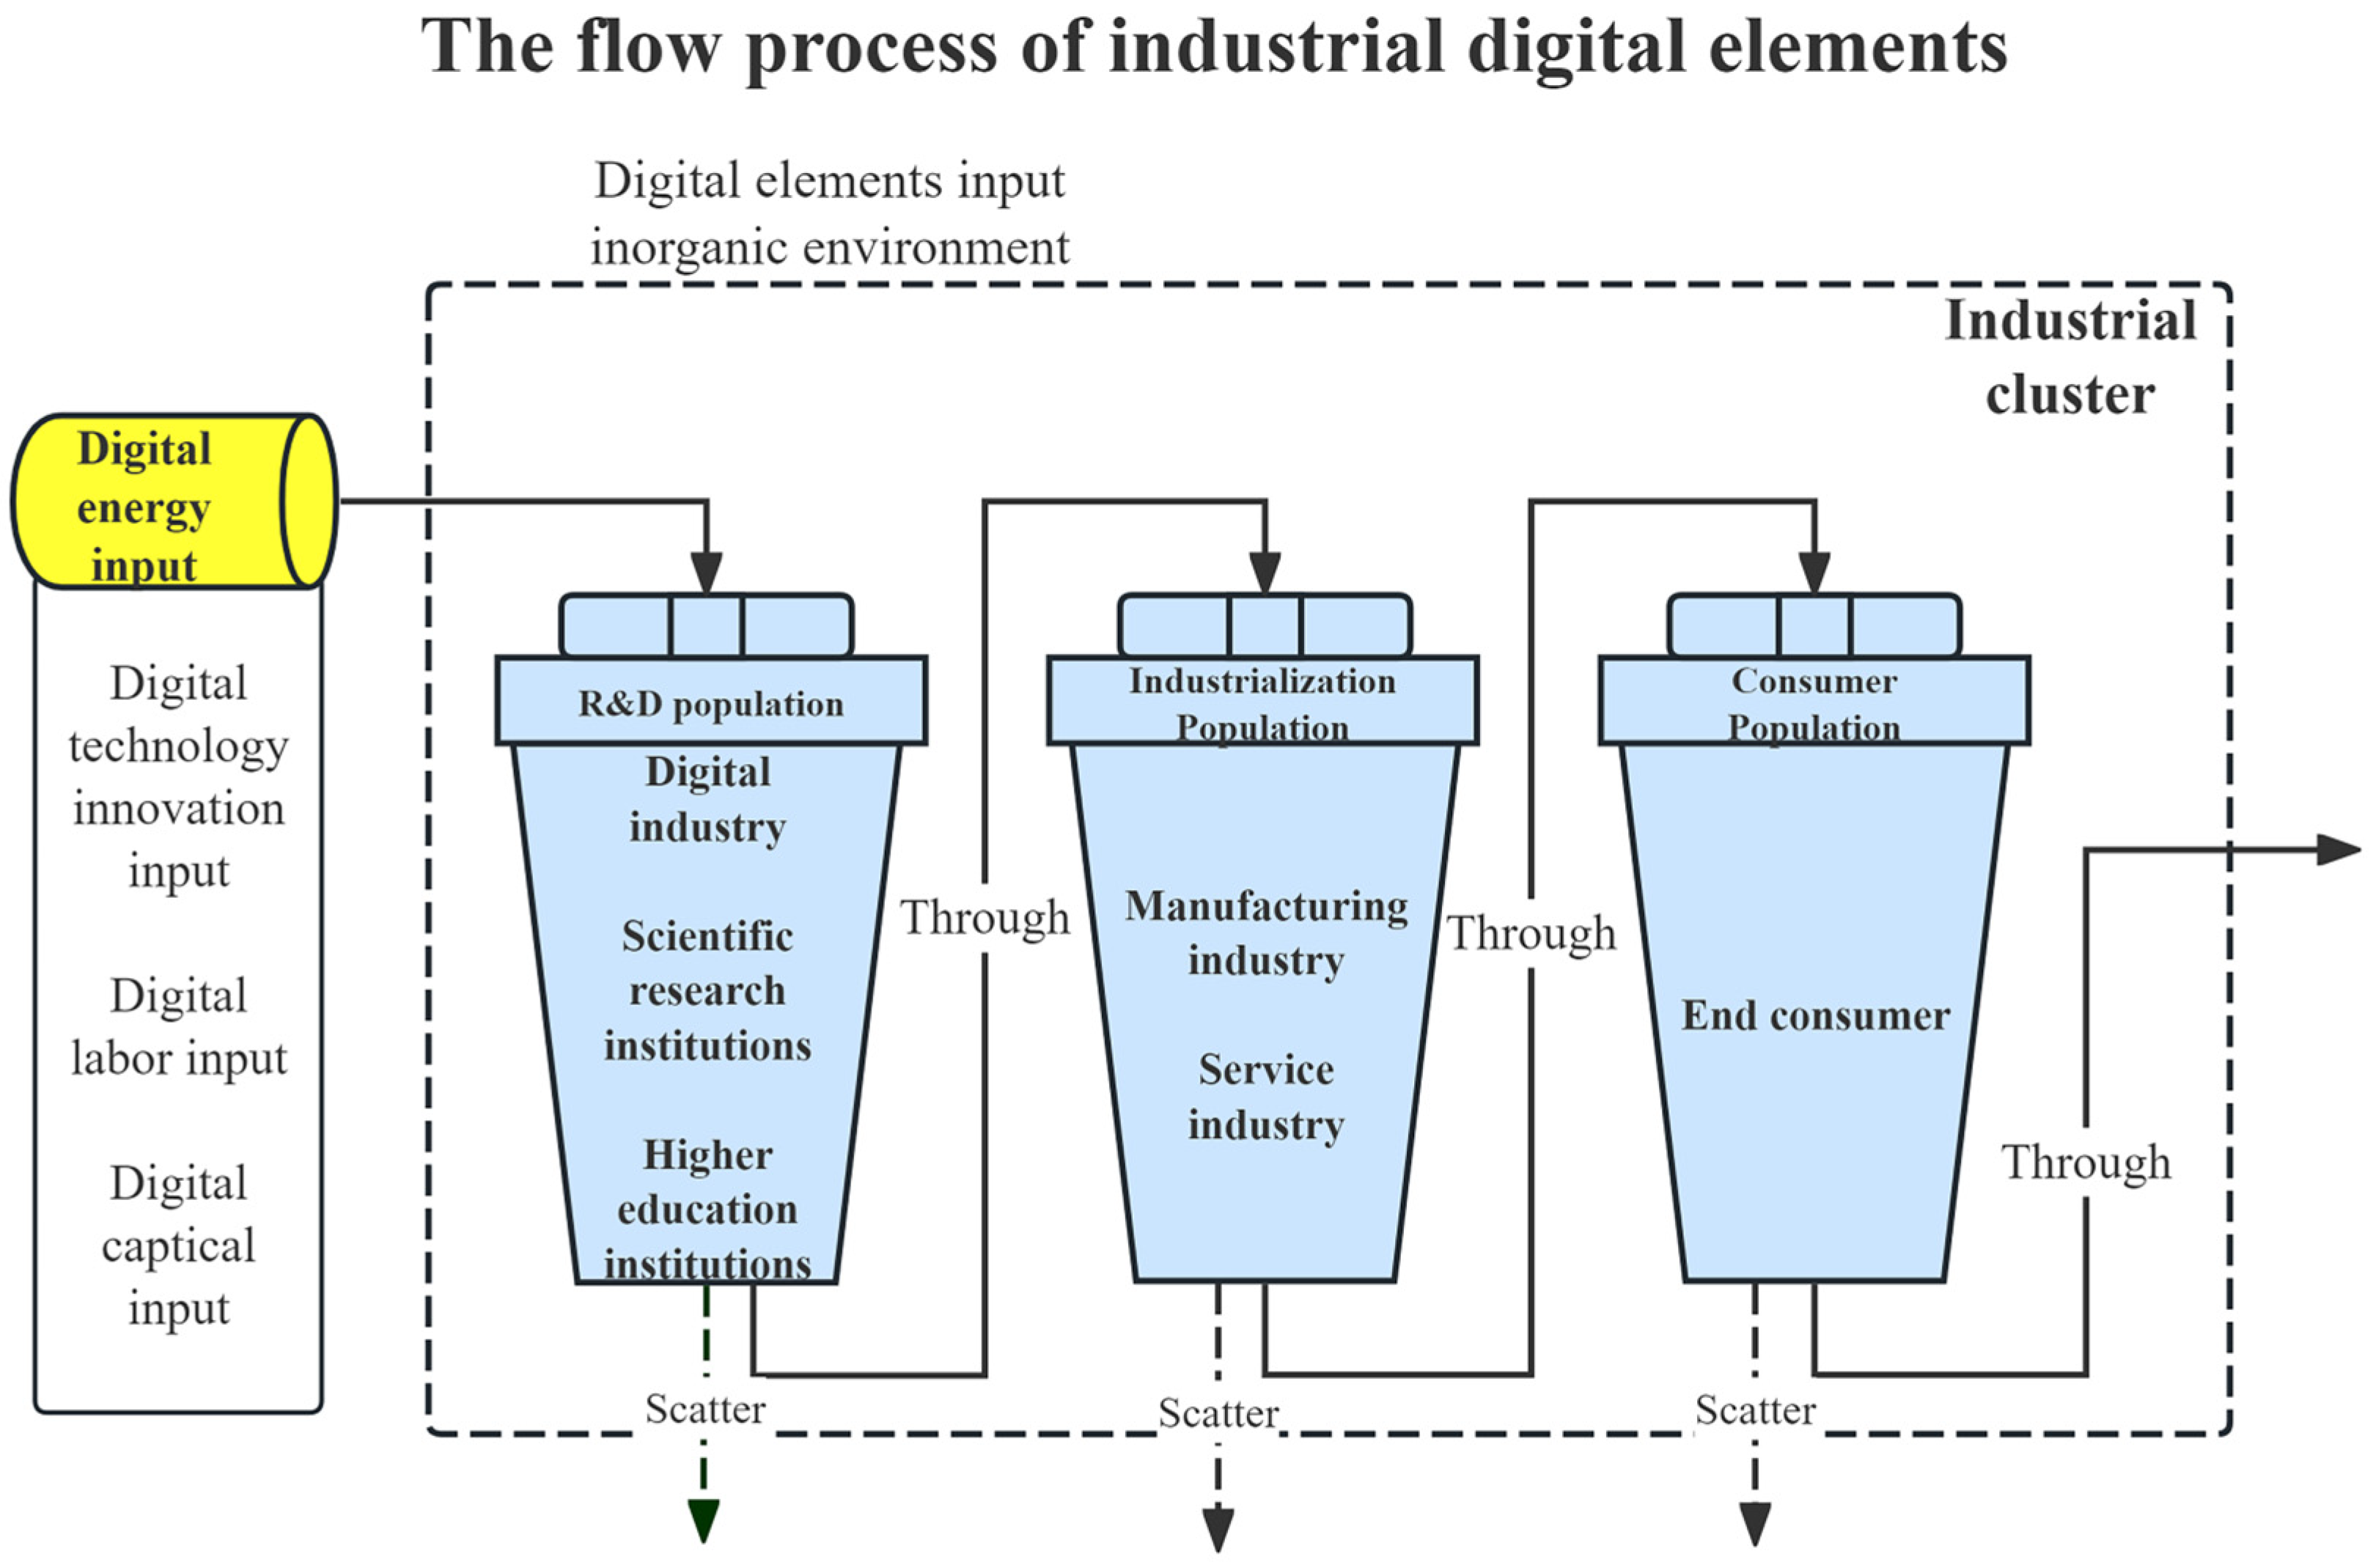
From the perspective of ecology, the input process of industrial digital elements can be seen as the process of digital technology innovation energy flow. The input of industrial digital elements is defined as a dynamic flow of digital technological innovation energy, strictly organized around the four stages of energy input, transmission, transformation, and dissipation. The specific process is shown in
Figure 1.
The first stage is energy input, in which digital technology innovation, labor force, capital, and other factors enter the system as primary production factors. They are first absorbed and transformed into digital technology achievements by the R&D population, specifically through the digital industry, research institutions, and universities, and the original kinetic energy is reserved for subsequent industrial transformation.
The second stage is energy transmission, during which the initial digital energy is absorbed and integrated by the R&D population—comprising universities, research institutions, and digital industries; crystallized into core digital technological achievements; and further transmitted and diffused to the industrial production population. Therefore, it is transferred to the industrialized population through technology flow, realizing digital technology and traditional production factors’ integration and transforming data value into actual commercial and environmental value.
The third stage is energy transformation, in which manufacturing enterprises use digital technologies to reshape traditional production models, transforming data value into both economic and environmental value. Through process optimization, energy consumption management, and low-carbon production retrofitting, the green upgrading of the MFI is realized. At this time, the MFI is transforming its production processes through intelligent automation, reducing losses and completing the transition from high-emission to green manufacturing.
The fourth stage is energy dissipation and circular feedback, in which final products and services deliver value to the consumer population, reasonable energy losses occur during production, and consumption-side data information flows back to the R&D end, forming a continuously iterative closed-loop succession. Finally, the energy flows to the consumer population and is transformed into final products and services, and part of the energy is naturally lost during system operation.
In summary, the energy of digital technology innovation in the population flows in a cycle of “input–transfer–transformation–dissipation”, which promotes the internal structure of the industry to be optimal.
2.2. Succession Path of Green Industrial Upgrading of MFI
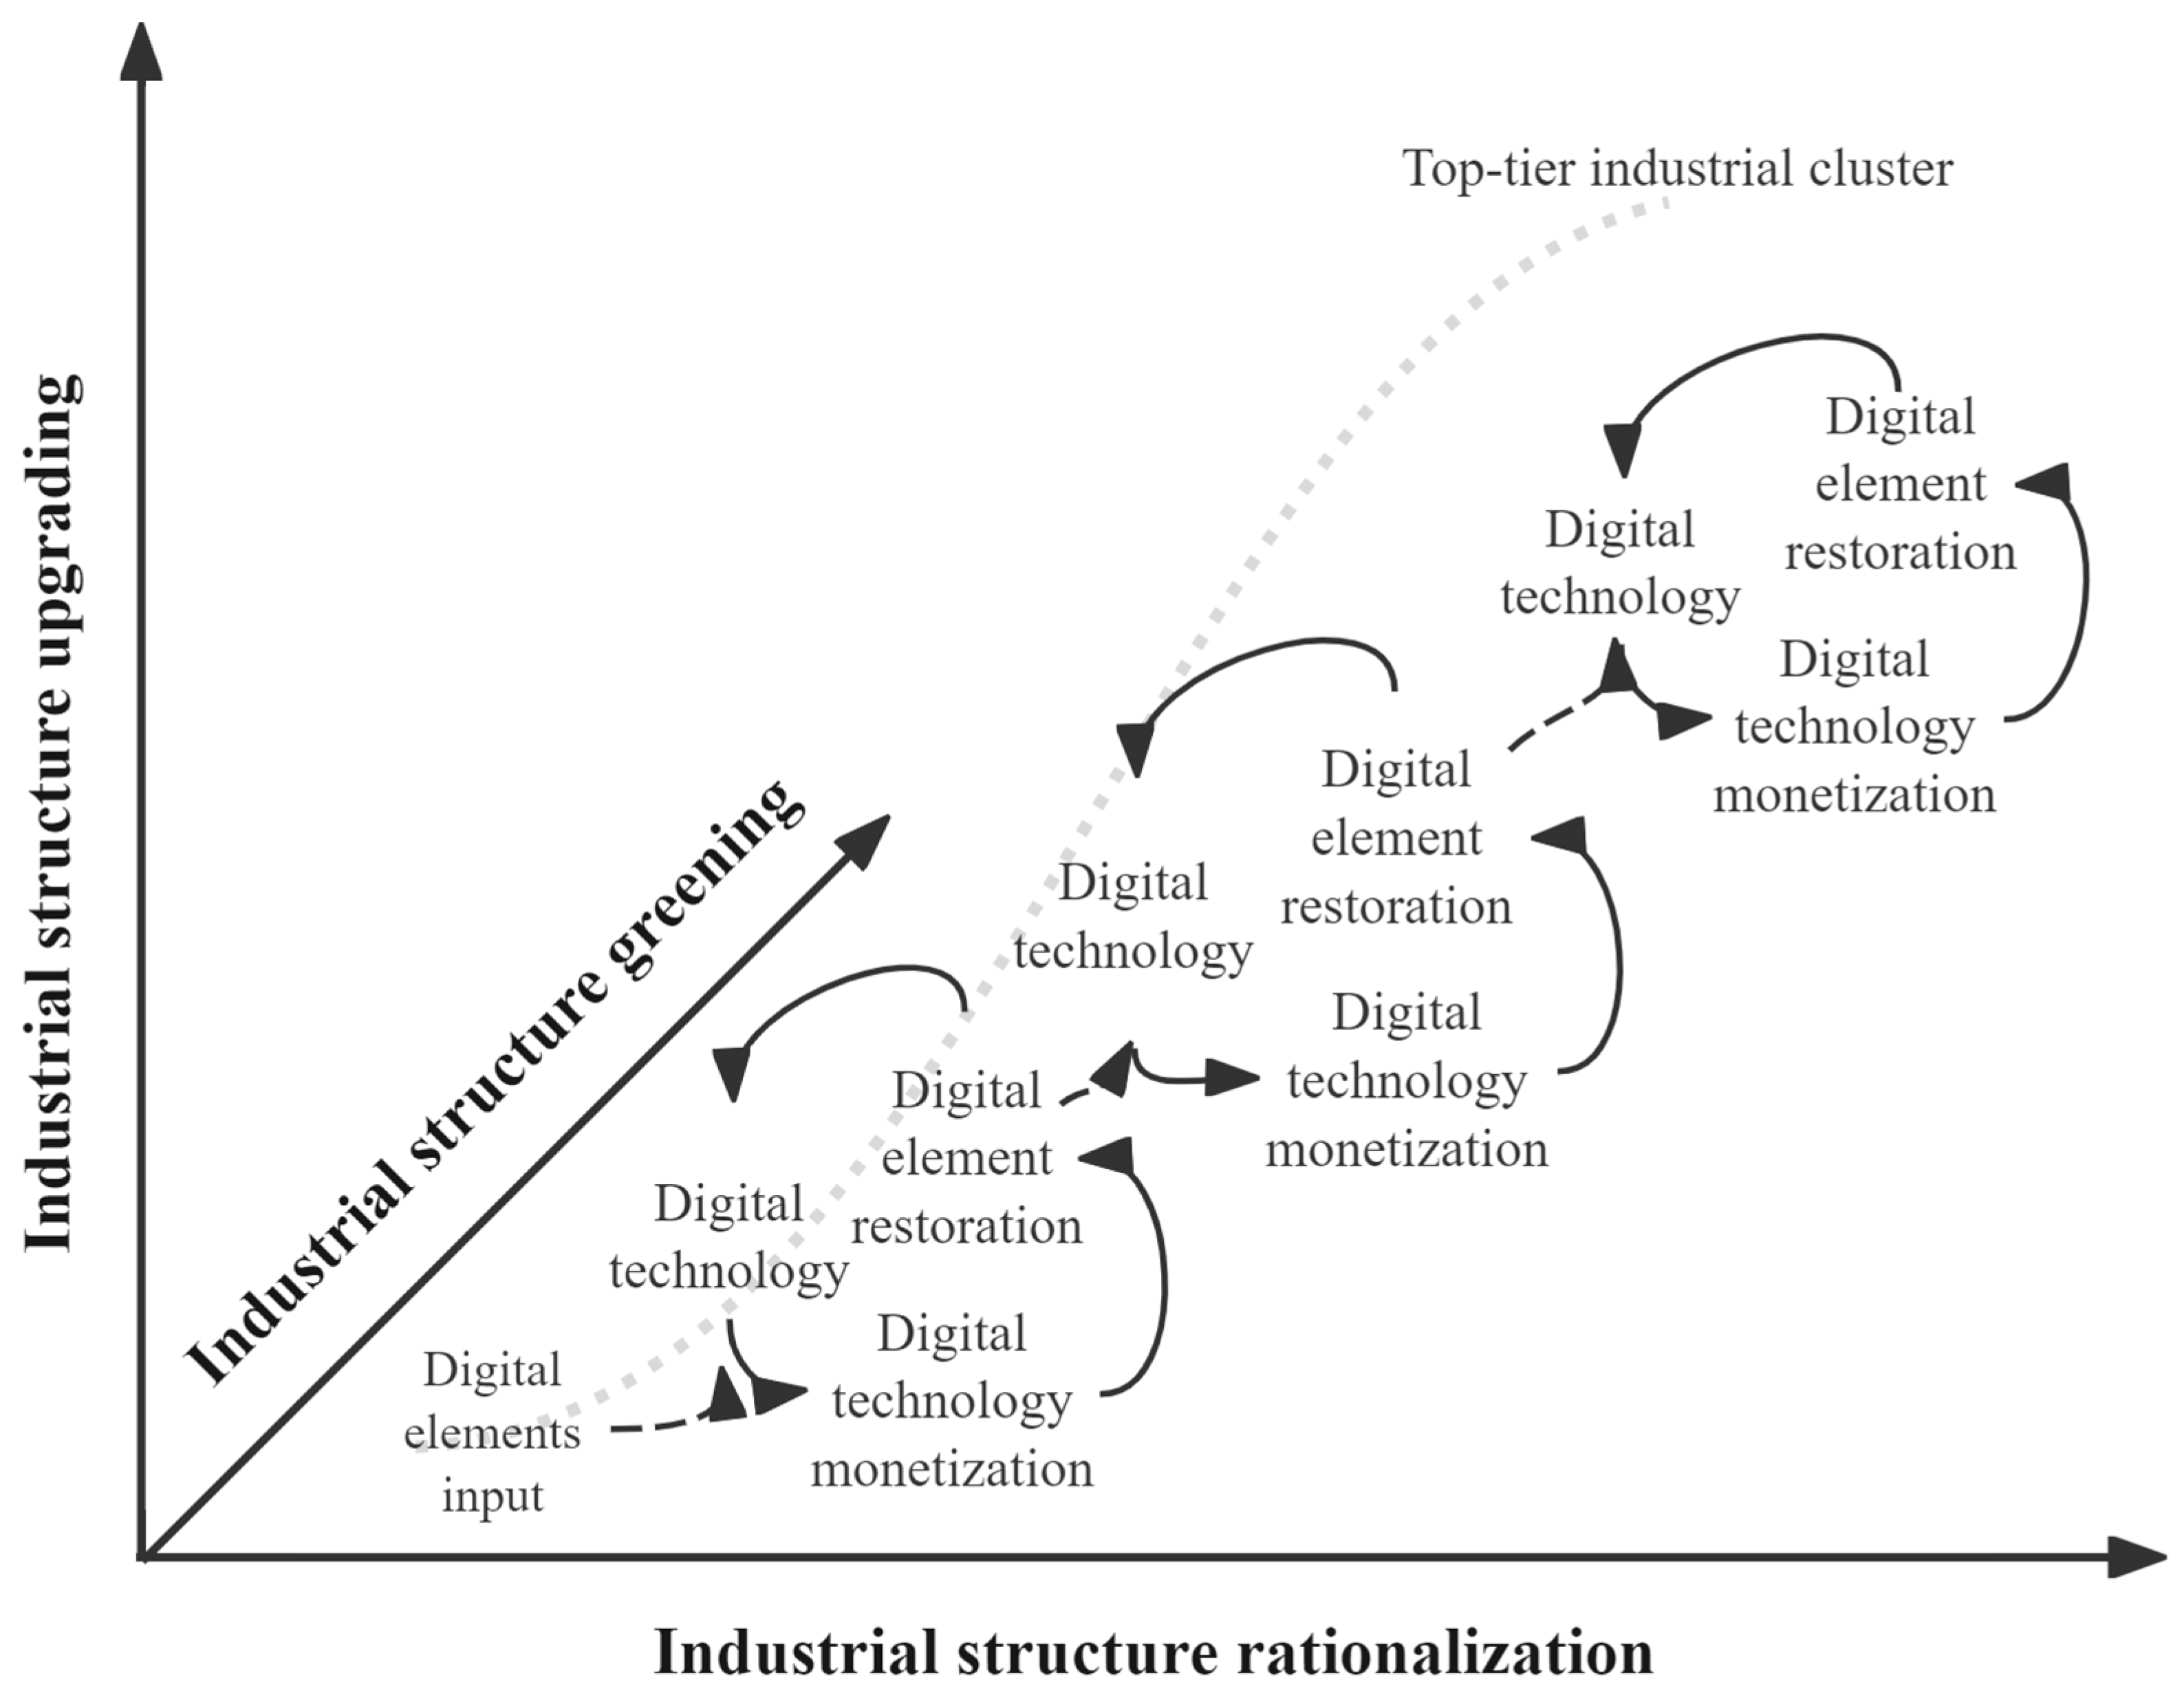
Driven by the above-mentioned energy cycle and material exchange, the internal mechanism of community succession determines the succession path of the green upgrading of MFI. From the perspective of the industrial innovation ecosystem, the regional MFI, government, and research and intermediary institutions constitute the ecological community in the system, while the policy, system, and culture constitute the inorganic environment. As the most powerful driving energy in the system, digital technology innovation promotes the continuous exchange and circulation between the MFI and other related innovation subjects in the region and external environment, making the elements within the community compete and co-exist. The succession process is shown in
Figure 2.
This succession is embodied in three dimensions. First, digital elements empower traditional production factors such as technology, labor, and capital, which not only change the production organization mode of MFI [
19] but also link the upstream and downstream of infrastructure and value chain more efficiently and gently and across more space than traditional factors, promoting the rationalization of regional MFI. Secondly, the input of digital elements gradually expands the limits of MFI [
20] and accelerates the integration and development of more advanced industrial forms, such as the manufacturing and service industry. This promotes the transformation of industry from labor-intensive to technology- and service-intensive, thereby promoting the optimization of MFI [
21]. Finally, the new generation of digital production factors produced during the manufacturing process, including big data, AI, and other technical means, optimize the energy production efficiency of manufacturing and reduce energy waste and carbon emissions. These factors enable energy-intensive industries to save energy and reduce carbon emissions, promoting the upgrade of high-emission, low-value-added industries to low-carbon-emission, green, and high-tech industries, thus obtaining a greener MFI [
22].
This succession path of using digital elements to realize the green upgrading of MFI is reflected in the coordinated development of the BTH region in China [
23], where different administrative regions have incorporated different digital elements to further facilitate manufacturing based on their own resource endowments. As a main source of digital innovation, Beijing features high-level digital technology enterprises, research institutions, and universities. This ecosystem provides a continuous stream of innovation energy to MFIs across the BTH region, driving their digital and intelligent transformation. Tianjin offers a good environment for international exchange, cooperation, and financing. This allows the city to function as a pivotal hub for testing and commercializing digital innovation. At the same time, Hebei provides substantial green energy support and storage space for the region, offering a solid foundation for computational power [
24]. In summary, the flow, innovation, and collaborative development of digital elements in the BTH region have jointly promoted the upgrading of the MFI across the region toward the attainment of higher added value, green energy saving, and low carbon emissions. Thus, the resilience of the ecosystem in the BTH region is improved, realizing a mutually beneficial scenario that combines economic growth and environmental protection [
25].
3. Influencing Mechanisms of Regional MFI Green Upgrading
3.1. Driving Mechanism of Digital Production Factors
The use of digital production factors has proven to be valuable through their promotion of the ecological reconstruction of regional MFIs. Due to their non-competitive nature and increasing returns to scale, these data factors provide a solid foundation for digitalization, networking, and intelligence [
26]. Thus, they play a crucial role as “convergence catalysts” [
27]. The accumulation and monetization of data encompass the entire value chain and lifecycle of industrial digitalization. This process drives the cross-border integration of traditional and digital formats, giving rise to a series of emerging formats and stimulating fresh market demand for manufacturing [
28,
29]. The data-driven development model has continuously transformed data value into business value [
30] and promoted the deep integration of the service industry and MFI based on digital technology transformation. Through such cross-border integration and the development of new models, the original innovation power of enterprises is further activated. The increased use of digital elements has been observed to enhance the digital technology innovation ability of enterprises and then become the core driving factor for the optimization and upgrading of regional MFI. Therefore, this paper presents the following hypothesis:
H1. Digital elements promote the green upgrading of regional MFI by improving the digital innovation capability of enterprises.
3.2. Consumer-Side Demand Traction Mechanism
Against the backdrop of the digital economy, digital element inputs not only change the supply side but also stimulate the long-tail demand of consumers. Consumer demand, perceptions, and values are increasingly shifting toward personalization and environmental sustainability. Consumers need the MFI to create new digital products, consumption patterns, and digital consumption scenes. This robust demand leads the MFI to innovate products and services, driving the digital upgrading of internal processes [
31]. It effectively aligns the supply and demand chain and deepens the integration of the manufacturing and service industries around consumer needs. These new demands attract social investment and financing into the MFI, guiding the extension of its value chain. Consequently, this dynamic drives business model innovation through value co-creation [
32] and drives the MFI toward high-end, sustainable, intelligent, and service-oriented development. Based on this, the following hypothesis is presented:
H2. Digital elements will promote the green upgrading of regional MFI by stimulating consumers’ digital demand.
3.3. Driving Mechanism of Production Mode
Digital technology has many advantages, such as spatiotemporal flexibility and strong connectivity, enabling MFIs to transition away from traditional methods. The application of AI technology, large-scale data, cloud computing, and other digital technologies in MFIs promotes its sustainable development by improving production efficiency, reducing costs, and enhancing product quality [
33], thereby optimizing supply chain management and innovating business models. Through machine learning, deep learning, and other methods, AI technology enables self-learning and the optimization of production processes, thus realizing intelligent and automated production lines. Cloud computing technology provides powerful computing and data storage capabilities for MFIs. Enterprises can realize the rapid deployment and elastic expansion of resources through cloud computing platforms, as well as boost the adaptability and reaction time of the production process. The combination of AI technology and Internet of Things technology enables real-time monitoring and data analysis at every stage of the production process, achieving strict quality control and optimization. Supply chain data analysis tools help enterprises achieve transparency and coordination in the supply chain. Specifically, they can more accurately forecast market demand and inventory status, adjust production plans and logistics arrangements in a timely manner, and improve the response speed and flexibility of the supply chain. Digital infrastructure improves data mobility and cross-industry data integration, enabling the creation of digital-sharing platforms. The dissolution of traditional industry boundaries promotes the transformation from production to platform-based, ecological ecosystems, reshapes the organizational structure of MFIs, and effectively corrects resource misallocation in traditional manufacturing. It can be seen that the transformation from production is finally realized through the fundamental improvement of resource allocation efficiency [
34], bringing new energy to the development of MFIs [
35]. Therefore, this paper proposes the following hypothesis:
H3. Digital elements improve the allocation capacity of resources to promote the green upgrading of regional manufacturing.
4. Research Design
4.1. Model Construction
4.1.1. Spatial Autocorrelation Analysis Method
In this study, exploratory spatial data were used to analyze whether a spatial correlation exists between data input and green upgrading of regional manufacturing among prefecture-level cities in the BTH region. Specifically, global spatial autocorrelation analysis was conducted on quantitative indicators, measured using the global Moran index (Moran’s I, MI). The calculation formula of the MI is shown below:
The number of regional units is represented by , is the observed value of the ith region, and is the observed mean. In this paper, the adjacency matrix is used as the spatial weight matrix to calculate Moran’s index, which reflects the geographical proximity relationship among the cities in the BTH region.
4.1.2. Construction of Spatial Durbin Model
Based on theoretical analysis, the deep integration of the digital and real economies, driven by the national strategy for the coordinated development of the BTH Region, establishes a spatial correlation for the green upgrading of MFIs. This transformation is driven by not only local data asset inputs but also positive digital spillover effects from neighboring regions. Compared to the space panels lag model (SLM) or space error model (SEM), the SDM considers the spatial correlation and dependencies at the same time. Considering this, we formulate the spatial Durbin model (SDM) as follows:
Here, the dependent variable represents the level of manufacturing green upgrading in region during period ; the independent variable , the level of digital element input in region during period ; , a series of control variables; , the standardized spatial economic distance matrix; , a random disturbance term; , the individual fixed effect; , the time fixed effect; , the coefficient of the spatial lag term of the dependent variable; , the coefficient of the core explanatory variable; , the coefficient of the spatial lag term of the core explanatory variable; , the coefficient of the control variable; and , the coefficient of the spatial lag term of the control variable.
4.1.3. Mediating Effect Model
Data input reshapes the ecological environment of the MFI itself, including the supply and demand sides. Data are continuously used to optimize the industrial structure of the MFI by enhancing the innovation ability of firms, improving the allocation of resources and stimulating the digital demand of consumers. To test this mechanism, we refer to the mediating effect test proposed by Baron and Kenny (1986) [
36], Wen Zhonglin (2004) [
37], Jiang Ting (2022) [
38], and Xie Huiqiang (2025) [
39] and constructed a mediating effect model, which has the following formula:
In the formula, is the mediating variable, including enterprise digital innovation capability (EDI), consumer digital demand (CDD), and enterprise resource allocation capability (ERU); represents the intercept, and and are the parameters to be estimated.
4.2. Variable Selection
4.2.1. Explanatory Variables
The level of digital element input (Dei) is the core explanatory variable in the regional MFI. In this study, digital element inputs are categorized into three subsystems: digital technology innovation inputs (Dtis), digital labor inputs (Dlis), and digital capital inputs (Dcis) [
40,
41,
42,
43,
44,
45]. The entropy method was used to calculate the comprehensive evaluation indicator of data input in the MFI of 13 cities in the BTH region from 2003 to 2023, as shown in
Table 1.
Digital technology innovation input (Dti) represents the endogenous research and development capability brought about by the new combination of production factors, fusing enabling technologies with exponentially growing data assets. Solow (1957) [
46] believed that, in addition to labor and capital, technological innovation is the main factor of economic development, and Romer (1986) [
47] believed that technological innovation, as an endogenous variable, was determined by capital and human resources involved in the scientific research process. Technological innovation drives the optimization and upgrading of the industrial structure through knowledge and technology spillover effects. Therefore, the number of patent applications by industrial enterprises and that of Internet users were selected as indicators in this study. The entropy method was used to assign weights to the indicators, and a comprehensive score that represents the investment level of industrial digital innovation technology was obtained.
Digital labor input (Dli) and exponential elements enable the new combination of traditional labor production factors to provide intellectual support to upgrade the manufacturing structure and supply capacity for digital innovation research. Information and communication technology (ICT) provides intellectual support for digital processing systems, which is the basis of digitalization. Romer’s (1986) [
47] endogenous growth model considers the labor input of scientists and technicians as an endogenous variable. Therefore, considering the availability of data at the city level, the approach of Chai Hongwang and Zuo Pengfei was followed in this study, selecting the full-time equivalent of R&D personnel, information transmission, number of people in scientific research and technical services, and number of employed people in software and information technology services as indicators. The entropy method was used to assign weights to the indicators, yielding a comprehensive score that represents the level of industrial digital labor input.
Digital capital input (Dci) is an exponential element that facilitates the novel combination of traditional capital production factors [
48,
49]. Capital input encompasses software business, software products, information technology services, operational services, integrated circuit design, embedded system software, etc. Therefore, considering the availability of data at the city level, it can be represented by R&D internal expenditure, scientific and technological expenditure, and telecommunications business revenue. The entropy method was used to assign weights to these factors, and a comprehensive score was obtained to represent the level of industrial digital capital investment.
4.2.2. Explained Variable
The explained variable is the green upgrading level of the regional MFI (Rmul). In this study, three aspects were chosen to describe industrial upgrading: industrial optimization, rationalization, and greening. Referring to the practice of Hu Yan (2021) [
50], industrial upgrading is measured using the ratio of tertiary industry value-added to secondary industry value-added, GDP. Industrial rationalization reflects the degree of coordination and effective utilization of various production factors among industries. Referring to the practice of Tang (2018) [
51], Theil’s index was selected to measure the relative balance of the input–output structure of each industry, which reflects the degree of coordination and effective utilization of resources among industries. When the industrial structure is balanced, the productivity level of all industrial sectors is the same, that is, TL = 0. Q
k/L
k = Q/L. Therefore, the closer the TL value is to 0, the closer the industrial structure is to the equilibrium state, and the more reasonable the industrial structure. The calculation formula of Theil’s index is as follows:
Here, T refers to Theil’s index, which represents the rationalization of the industrial structure; , the output value of the KTH industry; Q, the gross regional product; , the number of employees in industry k; and L, the total number of employees in the region. k = 3 represents the number of industries. Theil’s index TL is a reverse indicator: the closer its value is to 0, the closer the current industrial structure is to the equilibrium state, that is, the more reasonable it is. Otherwise, the more the current industrial structure deviates from the equilibrium state, the more unreasonable it is.
Greening of the industrial structure reflects the dynamic balance between industrial development and the natural environment, as well as a reduction in pollution emissions while simultaneously improving its developmental efficiency. Energy-intensive and highly polluting industries will be upgraded to become green, low-energy, and technology-intensive. In this study, the green upgrading of industries was measured using indicators like the unit GDP energy consumption [
52], the comprehensive utilization rate of general industrial solid waste, and industrial sulfur dioxide emissions [
53,
54]. The indicator system was constructed as shown in
Table 2.
The data processing method for each green industrial structure upgrading index is the same as for the explanatory variables. The data were standardized and dimensionless. The entropy weight method was used to determine the weight of each index, yielding the comprehensive evaluation index of the green upgrading of the industrial structure in Beijing, Tianjin, and 11 prefecture-level cities in Hebei Province from 2003 to 2023.
4.2.3. Control Variables
In this study, the economic development level (ED), openness level (Open), government intervention degree (Gov), and human capital level (HC) were selected as control variables. Among them, the economic development level is measured by the per capita regional GDP, and the openness level by the proportion of actual foreign investment utilization to regional GDP. Attracting foreign investment may not only bring funds but also introduce advanced green production processes through technology spillover effects, thereby influencing green upgrading in the MFI. Government intervention degree is measured by the proportion of the expenditure of the local government general budget to the regional GDP, as proposed by Zhang (2024) [
55]. This indicator reflects the intensity of government intervention in the regional economy and the financial support provided, and it captures the guiding role of fiscal policies on the direction of manufacturing transformation. Human capital level is measured by the proportion of regular undergraduate and junior college students to the total population at the end of the year, as proposed by Zhang Hanyu (2025) [
56]. Human capital is the core element of the innovation ecosystem. The concentration of talents from universities can provide key knowledge reserves and technological research and development support for the green upgrading of MFIs.
4.2.4. Mechanism Variables
The mechanism variables in this study encompass enterprises’ digital innovation capability, consumers’ digital demand, and enterprises’ resource allocation capability. Referring to the findings of Li et al. (2023) [
57], the enterprises’ capacity for digital innovation is measured using the natural logarithm of the ratio of internal R&D expenditure to the number of patent applications. From the demand side, the construction and popularization of modern digital infrastructure serve as the core engine that drives the emergence of digital consumption demands. Therefore, this study drew on the research of Yang Zhongxin et al. (2025) [
58] and used the internet penetration rate to represent consumers’ digital demands and examine its mediating role in compelling manufacturing to adopt green production methods. The enhancement of enterprise resource allocation capabilities is key to unleashing the dividends driven by digital elements and empowering the green upgrading of manufacturing industries. Therefore, this study referred to the research of Bai Junhong et al. (2018) [
59] and calculated and standardized the degree of market distortion of factors to take the reciprocal to measure the enterprise’s resource allocation capabilities.
4.3. Data Sources and Descriptive Statistics
The years 2003–2023 were selected as the research interval. The coordinated development of the BTH region was set as the research background, and Beijing, Tianjin, and 11 cities in Hebei (13 cities in total) were selected as research objects. Due to the delay in the publication of municipal statistical yearbooks and environmental bulletins, the latest municipal panel data were only traced back to 2023, so this study does not cover the period after 2023. The research data mainly originated from official and authoritative channels such as the China City Statistical Yearbook, the BTH Statistical Yearbook, and municipal environmental statistical bulletins. To address missing values among individual indicators and ensure integrity and balance, the mean imputation method was used to supplement the panel data. The descriptive statistics of the variables are shown in
Table 3.
5. Empirical Analysis and Test
5.1. Spatial Correlation Test
In this study, the global Moran index was calculated based on the spatial adjacency matrix, and a spatial correlation test was carried out on the digital element input and the level of manufacturing green upgrading of each sample unit during the period from 2003 to 2023. The calculation results are shown in
Table 4.
The results show that from 2003 to 2023, the global Moran index of the manufacturing green upgrading level was greater than 0 for the vast majority of years and passed the significance level test of 10% or above, indicating that the green upgrading of manufacturing in different regions was not randomly and independently distributed spatially, but showed a clear spatial positive correlation. At the same time, the global Moran index of digital element input was always positive during the period from 2003 to 2023, and it always passed the significance level tests of 5% or 1%, suggesting that there was also a strong and stable spatial positive correlation of digital element input within the BTH region.
In conclusion, the digital element input in the BTH region and the green upgrading level of manufacturing both have a significant positive spatial correlation, meeting the prerequisite conditions for spatial econometric analysis and providing an empirical basis for the future identification of its spatial effects using spatial econometric models.
5.2. Regression Results of Spatial Durbin Model
Given the panel structure of our dataset (N = 13 cross-sectional units, T = 21 time periods), we estimated the spatial Durbin model (SDM) using Lee and Yu’s (2010) [
60] transformation approach to eliminate individual heterogeneity. This approach avoids the performance limitations of traditional fixed-effect transformations for small-N, large-T panels, while preserving long-run temporal variation to identify both direct and spatial spillover effects. Based on the fitting equation of the green upgrading level of MFIs in the BTH region from 2003 to 2023, using the spatial economic distance matrix W1, the results of fitting the spatial Durbin model were obtained using Stata 19 software (StataCorp LLC, College Station, TX, USA) and are presented in
Table 5.
The empirical results indicate that the spatial autoregressive coefficient rho is 0.080, which is statistically significant at the 10% level. This demonstrates a positive spatial correlation in the green upgrading of manufacturing across the Beijing–Tianjin–Hebei region, meaning that the green upgrading levels of neighboring areas exert a certain influence on their own regions. This further validates the appropriateness of employing a spatial econometric model for empirical analysis.
The coefficient for digital element input (Dei) is 0.489, which is significant at the 1% level. This indicates that an increase in digital element input in the region positively promotes the green upgrading of local manufacturing.
In terms of effect decomposition, the direct effect is 0.490 and is significant at the 1% level, demonstrating that local digital element input significantly drives the green transformation of the MFI. However, the indirect effect is −0.074, significant at the 5% level, reflecting a negative spatial influence. This suggests that during the current development phase of the Beijing–Tianjin–Hebei region, the aggregation and input of digital elements exhibit a siphon effect [
61], where digital resources and related green manufacturing elements from surrounding areas tend to concentrate in central cities with stronger digital advantages, thereby inhibiting the green upgrading efforts of neighboring cities.
The total effect of digital element input is 0.416, significant at the 1% level, which confirms its overall positive impact on the green upgrading of manufacturing. Additionally, the coefficient of the spatial lag term WDei is −0.110, which is significant at the 1% level, indicating that an increase in digital element input from adjacent regions suppresses the green upgrading of local manufacturing. This further validates the presence of spatial competition characteristics in digital resource allocation within the Beijing–Tianjin–Hebei region, thereby weakening the green upgrading capacity of surrounding areas.
In terms of controlling variables, the impact of various factors on the green transformation of manufacturing shows distinct characteristics. The direct effect of the economic development level (ED) is 0.078, significant at the 1% level, indicating that the enhanced local economic strength provides essential financial and market support for the green upgrading of manufacturing. However, its indirect effect is significant (−0.123), resulting in a total effect of −0.045. This suggests that regional economic hubs exert strong resource attraction effects on surrounding areas, widening the disparities in green transformation capabilities across regions.
The direct and total effects of the openness level (Open) are −0.088 and −0.073, respectively, both significant at the 1% level, while their indirect effects remain insignificant. This may reflect that from 2003 to 2023, some export-oriented manufacturing industries in the Beijing–Tianjin–Hebei region remained predominantly resource-intensive and processing-oriented. Foreign investment inflows and import–export expansion failed to fully translate into green technology spillovers. Instead, these factors likely fostered high-energy-consuming and high-emission industrial clusters, thereby hindering the green transformation of manufacturing.
The direct effect of the government intervention level (Gov) is significant at 0.412 (1%), demonstrating that local fiscal and policy support significantly promotes the green transformation of the MFI. However, its indirect effect is also significant (−0.681), yielding a total effect of −0.269. This implies homogeneous competition among local governments in securing green industry resources, stringent policy boundaries, and the need for improved cross-regional policy coordination.
In contrast, the direct effect of human capital (HC) is not significant, whereas its indirect effect is significantly positive at the 5% level, and the total effect is also significantly positive at the 10% level. This indicates that high-end talent and knowledge factors exhibit strong mobility and diffusion within the Beijing–Tianjin–Hebei region. They can indirectly drive green technological advancement in manufacturing across neighboring cities through knowledge flows, thereby serving as a potential driving force for regionally coordinated green transformation.
5.3. Robustness Test
(1) Replacing the spatial weight matrix: To verify the reliability of the conclusions, a robustness test was conducted by adjusting the spatial weight matrix.
Table 6 presents the results of the spatial economic distance matrix (W1), inverse distance matrix (W2), and economic geography weight matrix (W3) separately. The empirical results indicate that under different spatial weight matrix settings, the coefficient direction of the core explanatory variable Dei is consistent with the benchmark regression results of the spatial Durbin model, and all pass the significance test, thereby confirming that the research conclusion has strong robustness.
(2) Excluding specific years: The COVID-19 pandemic in 2021 was a sudden external shock that caused significant fluctuations in China’s manufacturing production activities, logistics supply chain, and market demand [
62]. To eliminate the interference of such extreme abnormal years on the empirical results, this study excluded them and re-calculated the regression to verify the universality of the basic conclusion. The regression results are shown in
Table 7. After excluding the data of 2021, the regression coefficient of the core explanatory variable, digital element input, remained positive and was significant at the 1% level, and rho was also significantly positive at the 5% level. This indicates that the core regression results are consistent with the estimation direction and significance of the previous basic spatial Durbin model and that the basic empirical conclusion has good robustness.
(3) Winsorization: To enhance the robustness of the regression analysis and mitigate the influence of outliers, this study applied 1% and 5% winsorization treatments to all continuous variables. The results are reported in
Table 7. Even under different levels of winsorization, the regression coefficients of the digital element input remain positive and statistically significant at the 1% level, showing little difference from the benchmark regression results, which further supports the conclusions above.
5.4. Endogeneity Test
To address potential endogenous issues such as bidirectional causality and variable omission between digital elements (Dei) and the green upgrading level of manufacturing (Rmul), the first-order lagged terms of the explanatory variables and the dependent variable were constructed as instrumental variables [
39,
63]. Tests were conducted using the IV-2SLS and System GMM methods, and the results are shown in
Table 8. In the IV-2SLS estimation, the Kleibergen-Paap rkLM statistic is 25.228, which significantly rejects the null hypothesis of unidentifiable instrumental variables at the 1% level, indicating a strong correlation between the instrumental and endogenous variables, whereas the Kleibergen-Paap rk Wald F statistic is 70.016, which is greater than the critical value of Stock-Yogo, eliminating the problem of weak instrumental variables and confirming the validity of the instrumental variables. In the System GMM estimation, the AR(1) test value is 0.040, which is less than 0.05, rejecting the null hypothesis that there is no first-order autocorrelation in the residuals, which is in line with the expected results; the AR(2) test result is 0.538, which is greater than 0.10, accepting the null hypothesis that there is no second-order autocorrelation in the difference residuals and indicating a reasonable model setting; and Hansen test’s
p value is 0.316, which is greater than 0.10, accepting the null hypothesis of exogeneity of the instrumental variables and confirming the validity of the results. After controlling for other variables and eliminating potential endogenous biases, the estimated coefficient of the core explanatory variable is 1.478, and it is significantly positive at the 1% level. This indicates that after controlling for endogeneity interference, the core conclusion of this paper—that digital elements drive the green upgrading of manufacturing—remains robust.
5.5. The Mediation Mechanism of Inspection
Based on the confirmation that digital elements have a significant promotional effect on the green upgrading of manufacturing in the BTH region, this study, following the two-step method of intermediary effect proposed by Jiang (2022) [
38], further explored the internal influencing mechanism of digital elements driving green upgrading.
Table 9 presents the specific results of the mechanism tests.
The regression results from the mechanism test regarding the technological innovation pathway show that the coefficient for digital element input (Dei) on corporate digital innovation capability (M1) is 0.804, which is statistically significant at the 1% level. This confirms that digital element input significantly enhances firms’ innovation momentum. Having established this logical premise, and following the research logic of Aghion et al. (1990) [
64] on “technological innovation and green growth”, the improvement in digital innovation capability facilitates the streamlining of production processes through induced technological change. In the BTH region, digital element input has notably boosted firms’ R&D efficiency in green and low-carbon technologies. Such digital innovation not only reduces the marginal cost of green technological breakthroughs but also drives a fundamental shift in manufacturing from end-of-pipe treatment to source-based carbon reduction by substituting traditional energy-intensive processes. This, in turn, propels the green upgrading of the MFI, thereby confirming Hypothesis H1.
The regression results for the demand-pull pathway show that the coefficient of digital elements on consumer digital demand (M2) is 1.428, which is significant at the 1% level. This indicates that digital elements effectively stimulate green preferences on the consumption side by reducing information asymmetry between supply and demand. Following the value co-creation theory proposed by Prahalad and Ramaswamy (2004) [
65], once digital platforms activate the vast green long-tail demand among consumers in the BTH region, these demand signals feed back to the production stage. This powerful market-pull mechanism forces manufacturing firms to accelerate green product iteration and service-oriented transformation to maintain market share. Through this outside-in reverse pressure logic, digital elements successfully transform consumption-side digital dividends into endogenous drivers for the green upgrading of manufacturing, achieving collaborative greening across the up- and downstream segments of the industrial chain. Thus, Hypothesis H2 is validated.
The regression results for the efficiency optimization pathway show that the coefficient of digital elements on corporate resource allocation capability (M3) is 0.888, which is significant at the 1% level. This confirms the driving force of digital elements in transforming production methods. Drawing on the research conclusions of Brynjolfsson and McElheran (2016) [
33] regarding data-driven decision making (DDDM), the application of digital technologies enables firms to achieve the real-time monitoring and precise scheduling of entire production factors. For the BTH (BTH) region, the interconnected digital infrastructure has effectively corrected historical issues of resource misallocation and improved the turnover efficiency of energy and raw materials. This enhancement in resource allocation capability directly reduces resource consumption intensity per unit of output value. By improving factor utilization rates and supply chain coordination, digital elements optimize the resource organization model of the MFI at the macro level, providing a solid efficiency guarantee for its continuous upgrading. Thus, Hypothesis H3 is confirmed.
After completing the mechanism test of the aforementioned two-step mediation effect and preliminarily determining the influence relationships among the variables, in order to further confirm the validity of each mediation path, this study employed the Sobel test as a specialized statistical test for the indirect effect. The results are presented in
Table 10.
The Sobel test results reveal that the indirect effect of the enterprise digital innovation capability (M1) was 0.040, which is significant at the 5% level, indicating that the enterprise digital innovation capability played a positive mediating role in the process of digital element input promoting green upgrading. The direct effect was 0.647, and the total effect was 0.687. Overall, the digital element input had a strong promoting effect on green upgrading. For the consumer digital demand (M2), the indirect effect was −0.088, which was significant at the 10% level, suggesting that this path exhibited a certain inhibitory effect between digital element input and green upgrading. The direct effect was 0.775, and the total effect was 0.687. This shows that digital element input could effectively promote the green upgrading of the MFI as a whole, which implies that fluctuations in consumer digital demand may, to some extent, buffer or dilute the direct benefits brought by digitalization [
66]. However, after overcoming this effect, the overall promoting trend remains stable. Regarding enterprise resource allocation capability (M3), the estimated indirect effect was 0.172, which was significant at the 1% level, indicating that enterprise resource allocation capability is an important positive mediating channel for digital elements to promote green upgrading. At this time, the direct effect was 0.515, and the total effect was 0.687. This further verified the mechanism that digital element input promotes local manufacturing green upgrading through optimizing enterprise resource allocation capability. In conclusion, the three-tier mechanism paths of enterprise digital innovation capability, consumer digital demand, and enterprise resource allocation capability all passed the statistical test, and the effectiveness of the mechanisms was robust.
In conclusion, according to the empirical results and mechanism analysis, the summary hypothesis test results are shown in
Table 11.
6. Discussion
Based on the Innovation Ecosystem Theory, the process of industrial digitalization is essentially the flow of digital technological innovation energy among the R&D, industrialization, and consumer populations. The global Moran I tests in this study reveal a significant positive spatial correlation between digital elements and green upgrading in the Beijing–Tianjin–Hebei (BTH) region. It shows a distinct phased leap around 2014 following the rollout of national strategies.
Empirical results from the spatial Durbin model (SDM) further indicate that, as the main hub of R&D, Beijing’s digital element inputs exert a significant promotional effect locally. However, in the short term, its indirect effect is significantly negative, exhibiting a spatial siphon effect on neighboring areas. This objectively reflects the intense factor competition and niche aggregation during the early stages of ecosystem evolution.
Nevertheless, the significantly positive spatial autoregressive coefficient suggests that through “coopetition and symbiosis,” various agents within the system will eventually evolve toward a “climax community” characterized by the highest efficiency in environmental and resource utilization. This transition from short-term factor competition to long-term synergistic development confirms that the low diffusion cost and high propagation speed of digital elements can effectively break geographical and administrative boundaries, driving the internal structure of regional industries toward optimization.
New Growth Theory posits that digital elements are characterized by non-rivalry and unlimited supply. In the empirical regression of this study, the total effect coefficient of the core explanatory variable—digital elements—was significantly positive at the 1% level and passed rigorous endogeneity tests, including the IV-2SLS and System GMM. This robustly demonstrates that the reuse of data factors not only avoids diminishing marginal utility but actively optimizes resource allocation through continuous iteration, thereby correcting the resource misallocation inherent in traditional manufacturing. Such distinctive properties enable the MFI to break through the resource constraints of traditional extensive growth models. Consequently, this drives the evolution of high-energy-consuming, high-emission industries toward low-carbon, technology-intensive sectors, facilitating a transformation from labor-intensive models to advanced, rationalized, and green structures dominated by technology and services.
Further mechanism tests reveal that corporate digital innovation capability, consumer digital demand, and resource allocation capability serve as critical transmission pathways through which digital elements drive the green upgrading of manufacturing. Notably, the mediation effects of both corporate digital innovation capability and resource allocation capability are significantly positive. This indicates that digital elements effectively promote the green upgrading of manufacturing by strengthening green technology R&D, optimizing supply chain coordination, and enhancing production efficiency. This aligns with the “innovation energy cycle” logic in Innovation Ecosystem Theory, wherein digital technology innovations are ultimately transformed into gains in green production efficiency through industrial diffusion.
Concurrently, the consumer digital demand pathway shows a certain “masking effect” based on the Sobel test. This indicates that although digital demand from the consumption side may exert cost pressures on corporate green supply chains in the initial stage, this demand-pull mechanism will, in the long term, force firms to pursue green product innovation and transformations in production methods. These findings illustrate that green upgrading in the context of the digital economy no longer depends solely on supply-side technological retrofitting. Instead, it has gradually developed a new paradigm characterized by bidirectional supply–demand interaction and the co-evolution of up- and downstream industrial chains.
7. Conclusions
Drawing on panel data from 13 prefecture-level cities in the Beijing–Tianjin–Hebei (BTH) region of China from 2003 to 2023, this study confirms that digital elements serve as core drivers of green upgrading in the BTH manufacturing sector. Empirical results indicate that while digital element inputs significantly propel the advancement, rationalization, and green transformation of local manufacturing, they also exhibit certain spatial siphon characteristics at the regional level due to phased spatial competition. In the long run, the cross-temporal, cross-spatial, and strongly connective nature of digital elements is key to achieving integrated and sustainable regional development.
Based on these findings, this study proposes the following policy recommendations:
(1) Enhance Digital Infrastructure Interconnectivity: The BTH region should strengthen the interconnectivity of digital infrastructure. While leveraging Beijing’s role as an innovation leader, further investment should be directed toward the infrastructure of computational power and green energy support in Hebei Province. Establishing a region-wide digital sharing platform is crucial to mitigating resource misallocation.
(2) Implement Differentiated Gradient Development Strategies: A differentiated gradient development strategy should be adopted. Specifically, Beijing should focus on the front-end R&D of digital technologies, Tianjin should specialize in achievement commercialization and financial support, and Hebei should undertake green production processes. This functional division of labor and niche synergy can mitigate the negative short-term effects of the siphon phenomenon and enhance the overall resilience of the BTH regional innovation ecosystem.
(3) Foster Talent and Provide Financial Support: Given that human capital exerts a positive spatial synergy effect, the BTH region should refine its talent cultivation system to facilitate the flow of high-end talent from regional universities and research institutes to the front lines of digital R&D in manufacturing. Concurrently, fiscal support for the digital–intelligent transformation of manufacturing and the R&D of green, low-carbon technologies should be increased. This will provide robust financial and intellectual safeguards for the sustainable transformation of the regional MFI.
That said, this study has several limitations. First, the study sample covers only 13 cities in the BTH region. Future research could expand to other regions for comparative studies, refine the research framework, further validate the universal impact of digital element inputs on green transformation in manufacturing, and enrich academic findings in this field. Second, constrained by the inherent publication lag in municipal statistical yearbooks and environmental bulletins, the empirical data utilized in this study only covered up to 2023. Subsequent research could employ industry surveys or real-time big data monitoring to validate the timeliness of the findings. Finally, the current measurement of digital elements in this study was primarily based on macro-level urban data. Future research should endeavor to acquire micro-level enterprise data to conduct more granular analyses of the underlying micro-mechanisms.