Article

Spatio-Temporal Evolution and Correlation Analysis of Water Yield and Carbon Storage in the Qinghai Lake Basin


1
College of Geographical Sciences, Qinghai Normal University, Xining 810008, China
2
Key Laboratory of Natural Geography and Environmental Processes of Qinghai Province, Xining 810008, China
3
National Positioning Observation and Research Station of Qinghai Lake Wetland Ecosystem in Qinghai, National Forestry and Grassland Administration, Haibei 812300, China
4
College of Ecological Environmental and Resources, Qinghai Minzu University, Xining 810007, China
5
School of Natural Resources, Faculty of Geographical Sciences, Beijing Normal University, Beijing 100875, China
*
Author to whom correspondence should be addressed.
Sustainability 2026, 18(11), 5569; https://doi.org/10.3390/su18115569
Submission received: 27 April 2026 / Revised: 24 May 2026 / Accepted: 28 May 2026 / Published: 1 June 2026

Abstract

The Qinghai Lake Basin represents a critical ecological security barrier in the northeastern Qinghai–Tibet Plateau. Water yield and carbon storage within this basin are closely linked to regional ecological security and sustainable development. To investigate their spatiotemporal patterns, influencing factors, and spatial interrelationships from 1995 to 2020, this study integrated the InVEST model, the Optimal Parameter Geodetector model, and spatial autocorrelation analysis. The results indicate that water yield exhibited a fluctuating yet generally increasing trend over the study period, rising from 1.42 × 10⁹ m3 to 1.97 × 10⁹ m3. High water yield values were predominantly concentrated in high-altitude headwater areas, whereas low values mainly occurred in the lake area and its surroundings. Elevation, annual mean temperature, and precipitation were identified as the primary drivers of water yield. Carbon storage increased from 1.76 × 10⁸ t in 1995 to 2.14 × 10⁸ t in 2020. High carbon storage values were mainly concentrated in grassland and forested areas, while low values were largely distributed in built-up land, unused land, and the lake area. Elevation, NDVI, and water yield emerged as the main influencing factors of carbon storage. A significant positive spatial correlation was observed between water yield and carbon storage. Persistent patterns of high-carbon-storage–high-water-yield clusters and low-carbon-storage–low-water-yield clusters demonstrate a clear spatial synergy. These findings provide scientific support for ecological conservation, water resource management, and carbon sink enhancement in the Qinghai Lake Basin and are of practical significance for sustaining regional ecosystem services and safeguarding sustainability.

1. Introduction

Global warming, together with the growing imbalance between water supply and demand, has become a prominent challenge to global sustainable development. Water resources not only play an essential role in biogeochemical cycles but also underpin natural processes and socioeconomic systems, serving as a cornerstone of human sustainability [1]. Meanwhile, as the world’s largest carbon emitter, China’s commitment to achieving carbon peaking and carbon neutrality represents a major strategic decision aimed at proactively addressing climate change and alleviating critical resource and environmental constraints [2]. These changes drive shifts in land use/land cover and vegetation productivity, thereby affecting watershed ecosystem services related to water yield and carbon storage. Water yield and carbon storage are integral components of ecosystem services, and a trade-off and synergy relationship exists between them. Therefore, exploring the correlation between these two services holds significant scientific value and practical relevance for formulating nature-based strategies in ecological conservation and water resource management [3].
To date, numerous studies have investigated water yield and carbon storage services within the ecosystem services framework. Owing to its modular architecture, clear spatial explicitness, moderate data requirements, and capability for multi-service trade-off assessment, the InVEST model has been widely adopted by researchers for evaluating water yield and carbon storage. For instance, Du et al. [4], Gao et al. [5], and Shi et al. [6] applied the InVEST model to assess water yield in the Datong River Basin, Kuye River Basin, and Erhai Lake Basin, respectively. Similarly, Hu et al. [7], Lü et al. [8], and Meng et al. [9] used the InVEST model to predict carbon storage in the Yangtze River Economic Belt, the Qinghai–Tibet Plateau, and the Aksu region, yielding satisfactory simulation results. Meanwhile, a growing number of researchers have focused on trade-offs and synergies among ecosystem services. Xu et al. [10] analyzed the Xiaolangdi Reservoir area of the Yellow River and found a significant negative correlation between water yield and carbon storage, indicating a strong trade-off relationship. Dong et al. [11] reported that water yield and carbon storage exhibited varying degrees of synergy across spatial scales in the Ningxia region. Zhang et al. [12] similarly revealed a trade-off between water yield and carbon storage at the watershed scale in the Beiluo River Basin from 1970 to 2020. However, previous studies have largely concentrated on quantitative assessments of either water yield or carbon storage individually, or on macro-level analyses of overall trade-offs/synergies among ecosystem services. However, systematic investigations specifically targeting the intrinsic spatial relationship between water yield and carbon storage remain scarce.
The Qinghai Lake Basin is home to the largest inland saltwater lake in China and serves as a crucial water conservation area and ecological security barrier in the northeastern Qinghai–Tibet Plateau. The water yield capacity of the basin directly affects regional ecological security and environmental quality. Meanwhile, its carbon storage capacity holds significant scientific assessment value under the national “dual-carbon” strategy. Previous studies have preliminarily revealed the spatiotemporal variation characteristics of water yield and carbon storage in the Qinghai Lake Basin [13,14]. However, certain limitations remain. Existing research has mostly assessed water yield and carbon storage as independent ecosystem service functions, lacking a perspective that treats them as a coupled system for spatial correlation analysis. This makes it difficult to reveal the synergies or trade-offs between the water and carbon processes in the basin, which, to some extent, limits the understanding of the integrated regulation mechanisms of watershed ecosystem services. In terms of driving factor detection, current studies mainly rely on traditional geographical detector models [15]. These methods are highly dependent on subjective experience when selecting key parameters, such as discretization methods for continuous variables and the number of strata. Different parameter settings often lead to varying results, thereby reducing the objectivity and reliability of the detection outcomes. To address these research gaps and methodological limitations, this study introduces the Optimal Parameters-based Geographical Detector (OPGD). By systematically searching for the optimal combination of parameters—including discretization methods and the number of classes for continuous variables—the accuracy and objectivity of factor detection are significantly improved. From the perspective of water–carbon coupling, this approach reveals the driving mechanisms behind the spatial differentiation of water yield and carbon storage services in the Qinghai Lake Basin. This improvement not only fills the gap in existing research regarding coupled system analysis but also provides a more scientific basis for decision-making aimed at regional ecological protection and the coordinated achievement of the dual-carbon goals.
To address this research gap, the present study applied the InVEST model to characterize the spatiotemporal patterns of water yield and carbon storage in the Qinghai Lake Basin. The OPGD model was adopted to identify the key factors influencing water yield and carbon storage. Furthermore, a spatial autocorrelation model was employed to reveal the spatial relationship between these two ecosystem services. The findings provide a scientific basis for understanding the interaction mechanisms among ecosystem services in high-altitude cold regions and supporting adaptive management strategies and sustainability.

2. Overview of the Study Area and Data Sources

2.1. Overview of the Study Area

The Qinghai Lake Basin is situated in the northeastern part of the Qinghai–Tibet Plateau at the convergence of three major climatic zones: the East Asian monsoon region, the arid zone of northwestern China, and the cold highland region of the Qinghai–Tibet Plateau. This basin plays a pivotal role in climate change research in western China [16]. It covers an area of approximately 29,661 km2, with elevations ranging from 3007 m to 5285 m (Figure 1), exhibiting a general topography that is higher in the northwest and lower in the southeast. The local climate is characterized by cool, humid summers and cold, dry winters [17]. Several rivers traverse the basin, including the Buha River, Shaliu River, and Heima River [18]. Driven by the combined influence of topography and climate, vegetation types exhibit distinct horizontal and vertical distribution patterns, primarily comprising four major categories: temperate grassland, alpine grassland, alpine meadow, and alpine desert [19]. Soils in the basin are mainly represented by chernozems, alpine meadow soils, and aeolian soils.
The main land use types in the Qinghai Lake Basin include cropland, forest land, grassland, water bodies, built-up land, and unused land (Figure 1). Among these, grassland accounts for the largest proportion of the total area and serves as the primary ecosystem type in the basin. The Qinghai Lake Basin provides multiple ecological functions, including water conservation, soil retention, windbreak and sand fixation, and biodiversity conservation. These functions are of great significance for ensuring the ecological security of the Qinghai–Tibet Plateau [20]. At the same time, the basin maintains the ecological security of the northeastern Qinghai–Tibet Plateau and acts as a natural barrier preventing the eastward spread of desertification [21]. However, due to the impacts of climate change and human activities, the Qinghai Lake Basin faces a series of ecological and environmental issues, such as grassland degradation, land desertification, and the deterioration of habitat conditions for wildlife and birds [22]. In some areas, the water conservation capacity has declined, and the stability and service functions of the ecosystem have been threatened to a certain extent. Therefore, selecting the Qinghai Lake Basin as the study area helps to reveal the spatial coupling relationship between water yield and carbon storage in a typical plateau ecosystem, providing scientific support for the construction of ecological security barriers in western China and the coordinated regulation of water and carbon at the regional level.

2.2. Data Sources and Preprocessing

As listed in Table 1, all datasets were uniformly projected to the WGS_1984_UTM_Zone_47N coordinate system. Elevation, slope, and aspect were derived from the DEM using ArcGIS 10.8.

3. Research Methods

3.1. Estimation of Water Production

As a comprehensive ecosystem assessment tool, the InVEST model includes an annual Water Yield module, which can be employed to quantify water yield services at the watershed scale. Specifically, this module operates on the principle of water balance, where water yield (Y) is calculated as the difference between annual precipitation (P) and annual actual evapotranspiration (AET) [23,24]. The calculation formula is as follows:
Y ( xi ) = 1 AET ( xi ) P ( x ) × P ( x )
In this equation, Y(xi) represents the annual water yield (mm) for land use type i in grid cell x; AET(xi) represents the annual actual evapotranspiration (mm) for land use type i in grid cell x; and P(x) represents the annual precipitation (mm) in grid cell x.
The Z parameter (seasonal factor) is a key input parameter for the InVEST model. In this study, the Z value was set to 2.9, which was calibrated and validated for the Qinghai Lake Basin by Han [25]. The goodness of fit (R2) between the simulated and measured values ranged from 0.79 to 0.85. To test the applicability of this parameter in the present study, the water yield coefficient published in the Qinghai Province Water Resources Bulletin (2020) was compared with the water yield coefficient calculated by the model. The resulting relative error was 13.56%, indicating that Z = 2.9 is applicable to the Qinghai Lake Basin.

3.2. Estimation of Carbon Storage

The InVEST model is designed for the comprehensive assessment and trade-off analysis of multiple ecosystem services. Within this framework, the Carbon Storage and Sequestration module focuses on quantifying carbon storage and its sequestration capacity in a given area [8,26]. This module comprises four main carbon pools: above-ground biomass carbon (C_above), below-ground biomass carbon (C_below), soil carbon (C_soil), and organic carbon in the litter layer (C_dead) [27]. The carbon density data used in this study were mainly derived from a literature review specific to the Qinghai Lake Basin [28] (Table 2). The calculation formula is as follows:
C = C above + C below + C soil + C dead
C t = i = 1 n S i × C i
In this equation, C denotes the total carbon storage per unit area for a given land use type; Ct represents the total ecosystem carbon storage in a specific region; and Si is the area of land use type i.
Table 2. Carbon density data (t·ha−2).
Land Use TypeC_aboveC_belowC_soilC_dead
Cultivated Land6.191.1147.810
Forest Land14.9520.49116.730
Grassland0.472.9389.050
Water Body0039.380
Built-up Land0024.150
Unused Land02.113.440

3.3. Factor Analysis

The OPGD model is an enhanced version of the conventional Geographical Detector (GD) model. Building upon the same fundamental principles as the GD model, OPGD improves it by optimizing data spatial discretization methods and mitigating the modifiable areal unit problem (MAUP) in spatial heterogeneity analysis. This model determines the optimal parameter combination for each variable by systematically searching through various discretization methods (i.e., equidistant, natural breaks, quantile, geometric interval, and standard deviation) alongside different numbers of breaks (from 3 to 7), with the objective of maximizing the q-value, which represents the explanatory power of a variable [29,30]. The formula for calculating the q-value is as follows:
q = 1 h = 1 L ( N h σ h 2 ) N σ 2
In the above equation, q indicates the explanatory power of the driving factors; L denotes the number of stratified regions; Nh and σh are the sample size and variance of stratum h, respectively; and N and σ2 represent the total sample size and the overall variance, respectively.
The q-statistic quantifies the explanatory power of each influencing factor on the spatial differentiation of the dependent variable, with values ranging between 0 and 1. A higher q-value indicates a stronger capacity of the factor to explain the spatial heterogeneity of the dependent variable. The interaction detector works as follows: (i) the q-value of each individual factor is calculated; (ii) two factors are overlaid to generate a new layer, and its q-value is computed. This allows for evaluating factor interactions and revealing their combined effect on the spatial differentiation of the dependent variable [31].
This study used the OPGD model implemented in R to explore the effects of multiple factors on carbon storage and water yield. The model requires that all input layers have the same raster size and spatial registration. Using ArcGIS 10.8, the resolution of each influencing factor was resampled to 1000 m. This resolution matches the coarsest meteorological input data, fully preserves the original resolution of climatic and underlying surface factors, and effectively smooths local noise that may be amplified by an excessively high resolution. As a result, the identification of influencing factors becomes more reliable, and the computational efficiency of the OPGD model in the Qinghai Lake Basin is improved. Using ArcGIS 10.8, the study area was divided into 3000 m × 3000 m grids; after removing outliers, a total of 3119 grid cells remained. Carbon storage and water yield served as dependent variables, while climatic, topographic, and land cover factors constituted the independent variables (Table 3). It should be noted that the spatial correlation between water yield and carbon storage at the watershed scale has been confirmed by multiple studies [32,33]. Therefore, using these two services as mutually influencing factors for factor detection can support subsequent spatial correlation analysis. Carbon storage itself is calculated from land use data and carbon density data, and there is a deterministic functional relationship between them. Consequently, this study does not select land use data as an influencing factor.

3.4. Spatial Autocorrelation Analysis

Spatial autocorrelation is a method used to investigate whether variables exhibit correlated patterns within a given study area [34]. In this study, spatial autocorrelation analysis was conducted using GeoDa 1.22, ArcGIS 10.8, and R software (version 4.4.2). A combined approach using bivariate global Moran’s I and LISA (Local Indicators of Spatial Association) cluster maps was used to analyze the spatial variation patterns and clustering characteristics of carbon storage and water yield [35]. The bivariate global Moran’s I measures the overall correlation between the value of one variable in a given spatial unit and the value of another variable in neighboring units [36]. The calculation formula is as follows:
I = n k = 1 n l = 1 n w kl ( x k x ¯ ) ( y l y ¯ ) k = 1 n l = 1 n w kl k = 1 n ( x k x ¯ ) 2 l = 1 n ( y l y ¯ ) 2
In this equation, I represents the bivariate global Moran’s I index, with a range of [−1, 1]. The absolute value of I directly reflects the strength of the spatial association between the two variables. I = 0 indicates that there is no significant spatial association between the two variables; I > 0 indicates a significant positive spatial association; and I < 0 indicates a significant negative spatial association. n represents the total number of spatial units within the study area; wkl is a spatial weight matrix whose components can be used to define the adjacency properties of different spatial units; when spatial unit k is adjacent to unit l, wkl is set to 1, and when there is no adjacency, it is set to 0. xk and yl represent the observed values of variable x in unit k and variable y in unit l, respectively; x ¯ and y ¯   are the overall mean values of the two sets of study variables, respectively.

4. Analysis of Results

4.1. Characteristics of Changes in Water Yield

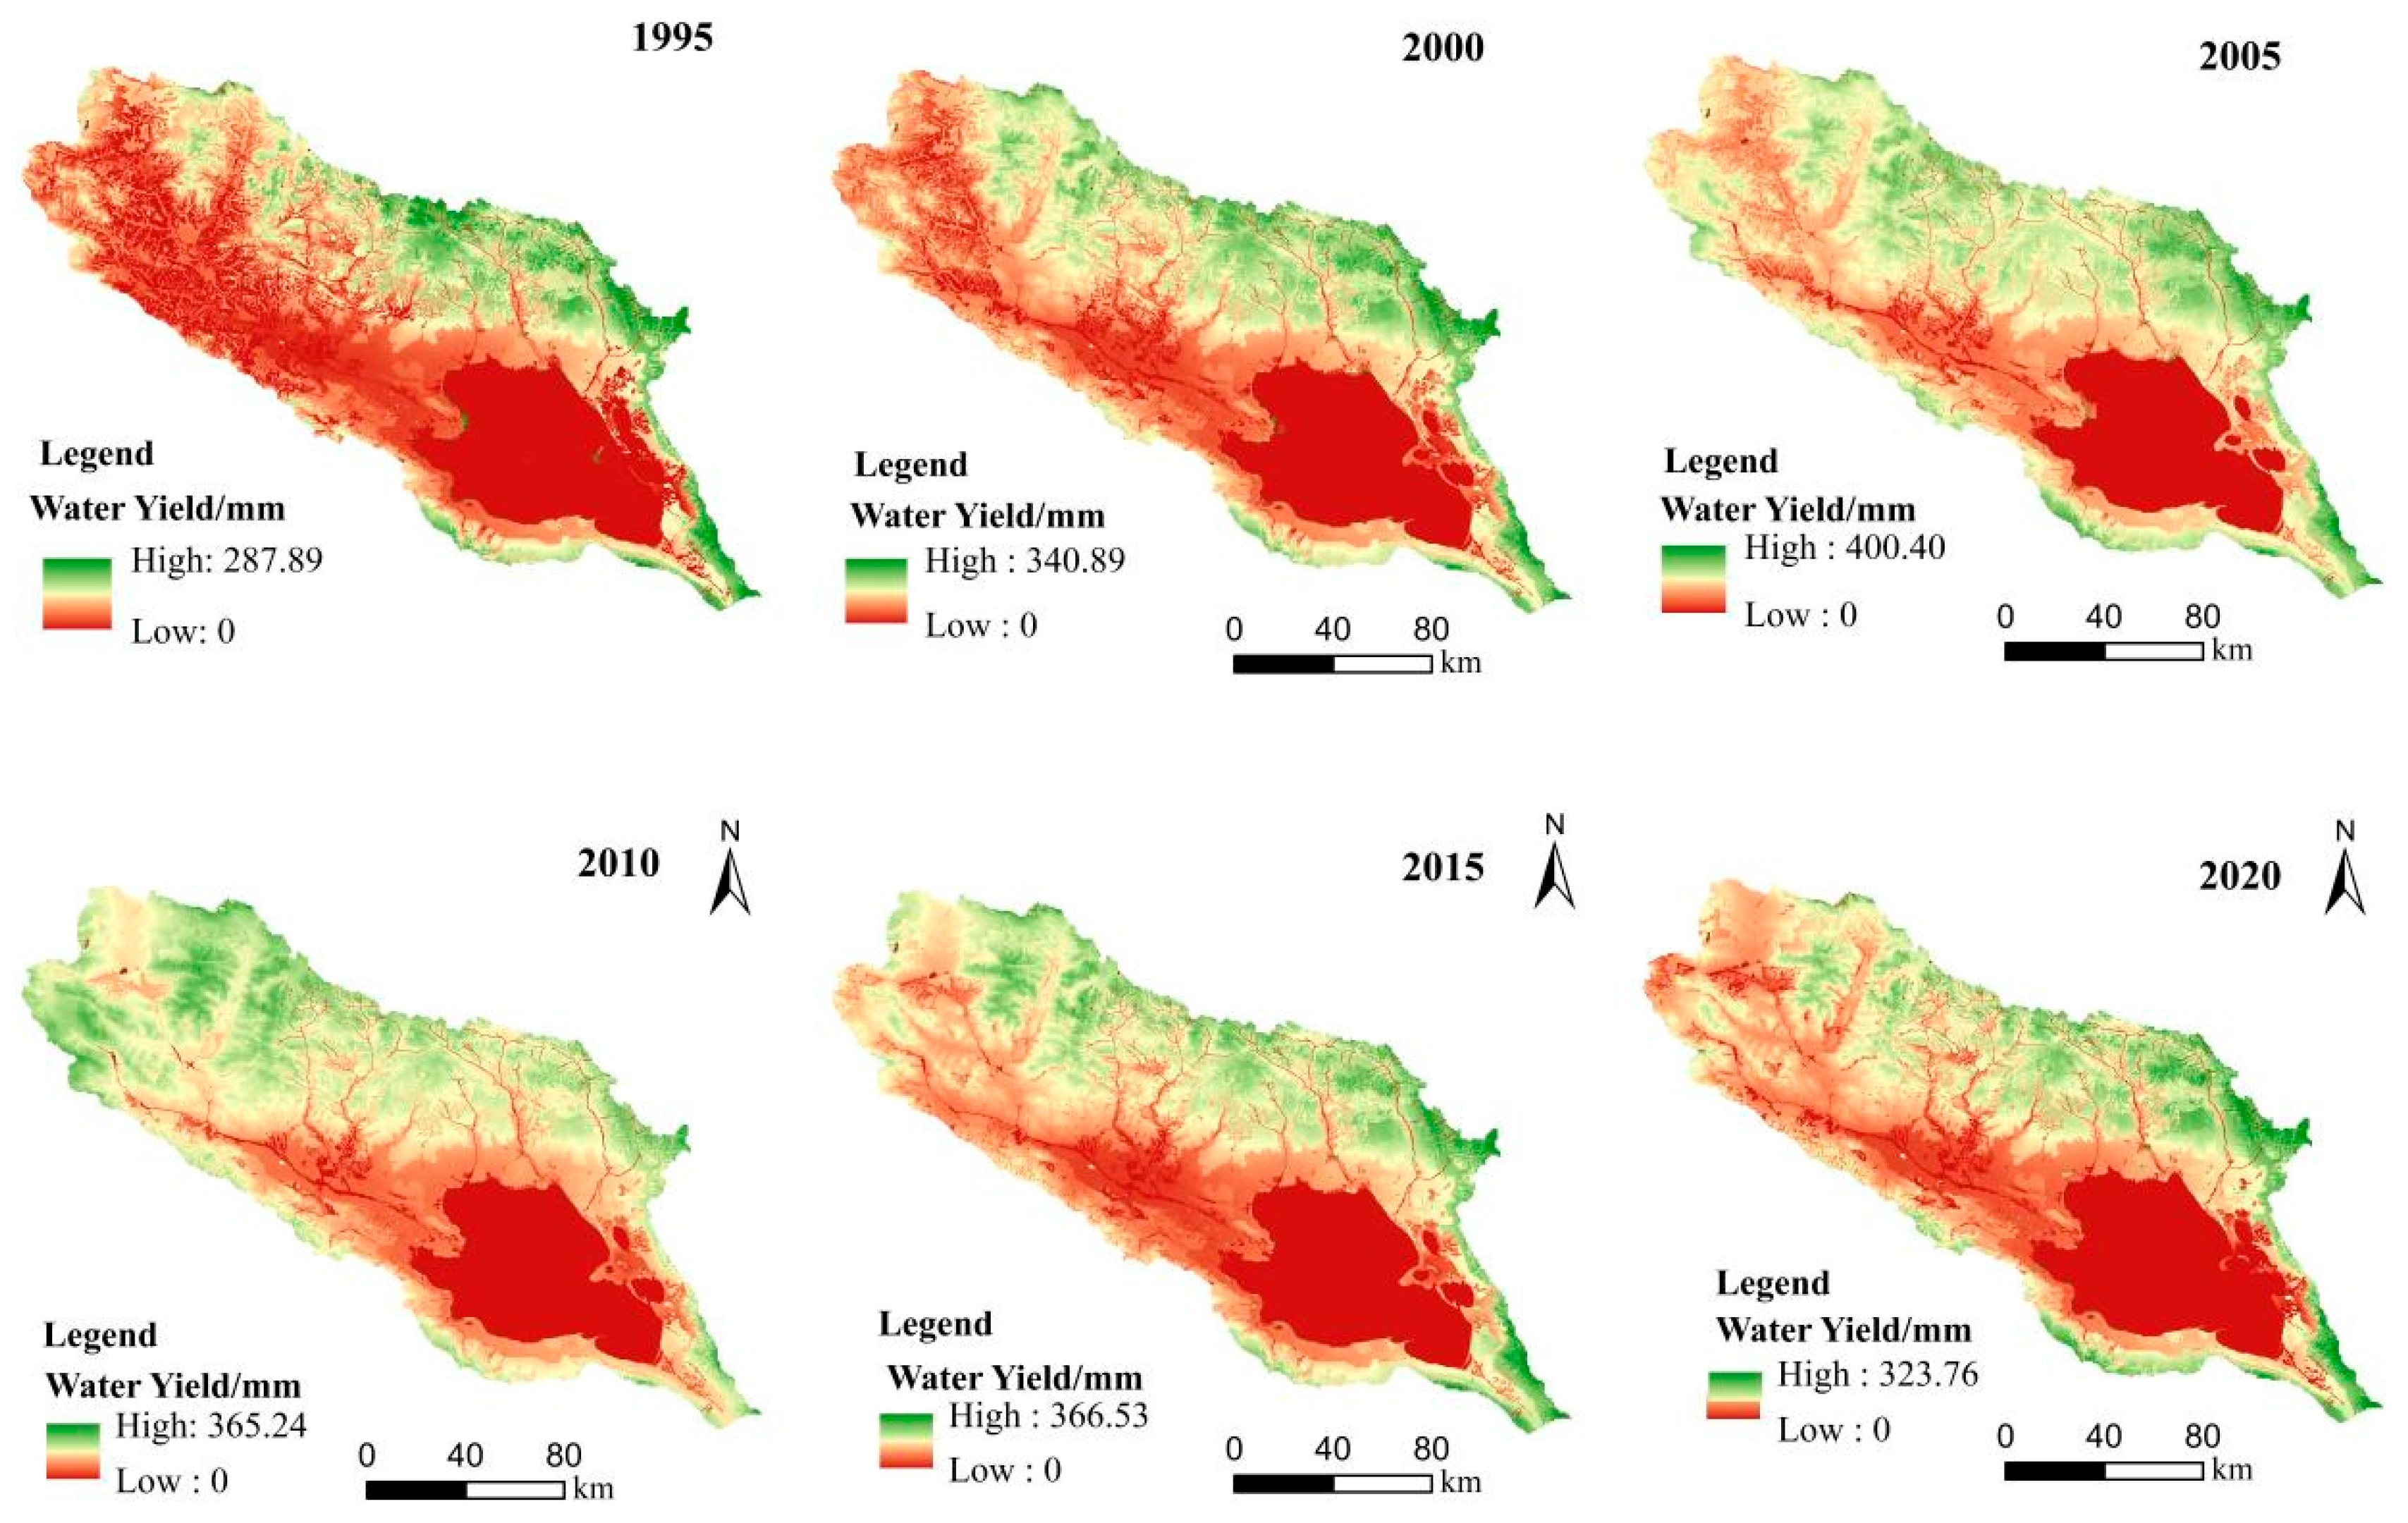
From 1995 to 2020, water yield in the Qinghai Lake Basin exhibited a fluctuating upward trend, with the highest value occurring in 2010 (3.98 × 10⁹ m3) and the lowest in 1995 (1.42 × 10⁹ m3). Over the same period, total water yield increased by 0.55 × 10⁹ m3, a trend consistent with that of precipitation over the same period.
The spatial distribution of water yield in the Qinghai Lake Basin shows significant spatial heterogeneity (Figure 2). High-yield areas occur mainly in the high-altitude headwater regions of the northern and northwestern basin, where high annual precipitation and low potential evapotranspiration prevail. Low-yield areas lie primarily in the lake area and along the surrounding rivers. Relatively high potential evapotranspiration in these zones leads to lower water yield compared to other parts of the basin. From 1995 to 2020, the most pronounced changes in water yield appeared mainly in the northwestern region.

4.2. Characteristics of Changes in Carbon Storage

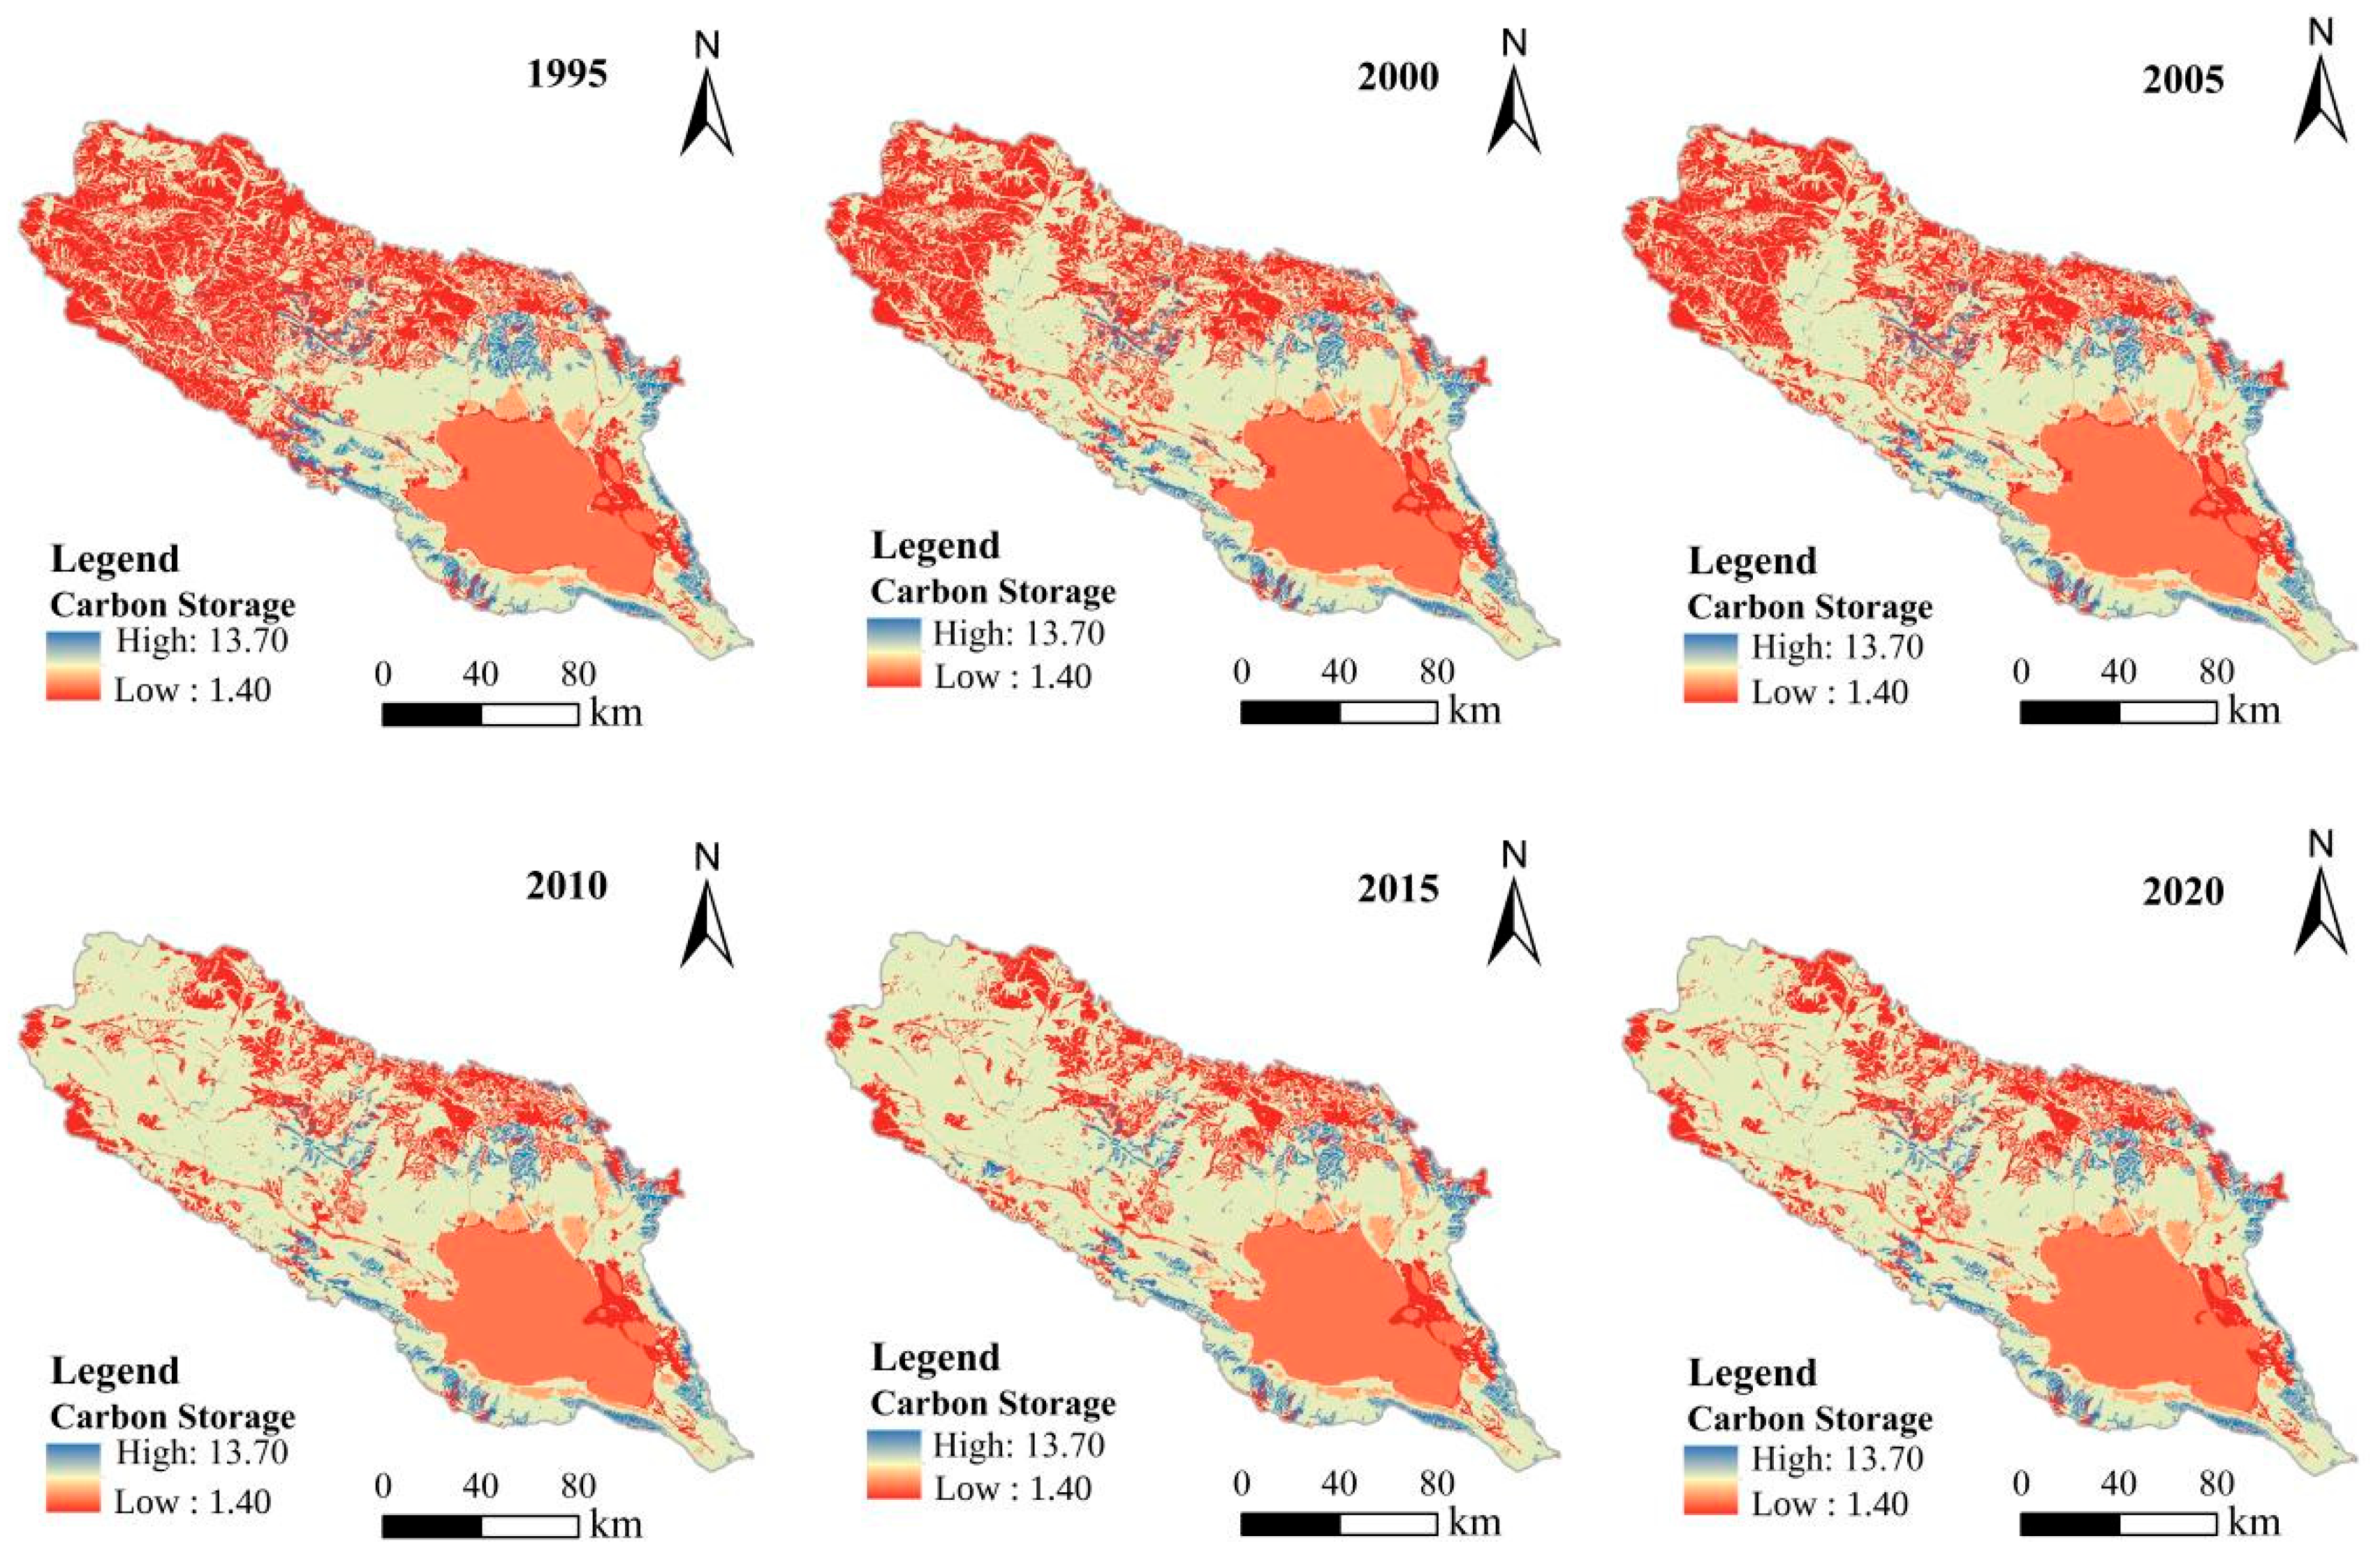
During 1995–2020, total carbon storage in the Qinghai Lake Basin exhibited a fluctuating upward trend. Carbon storage values in 1995, 2000, 2005, 2010, 2015, and 2020 reached 1.76 × 10⁸ t, 1.90 × 10⁸ t, 1.90 × 10⁸ t, 2.14 × 10⁸ t, 2.15 × 10⁸ t, and 2.14 × 10⁸ t, respectively. Over this 25-year period, total carbon storage increased by 0.38 × 10⁸ t, indicating a strong carbon sink function of the basin’s ecosystem over the long term.
Carbon storage in the Qinghai Lake Basin exhibits significant spatial heterogeneity (Figure 3). High-carbon-storage areas occur mainly in the grassland and forested areas of the basin, whereas low-carbon-storage areas lie primarily in built-up land, unused land, and the lake area. From 1995 to 2020, the most pronounced changes in carbon storage took place in the northern and northwestern parts of the basin, where carbon storage showed a clear upward trend.

4.3. Analysis of Factors Affecting Water Yield and Carbon Storage

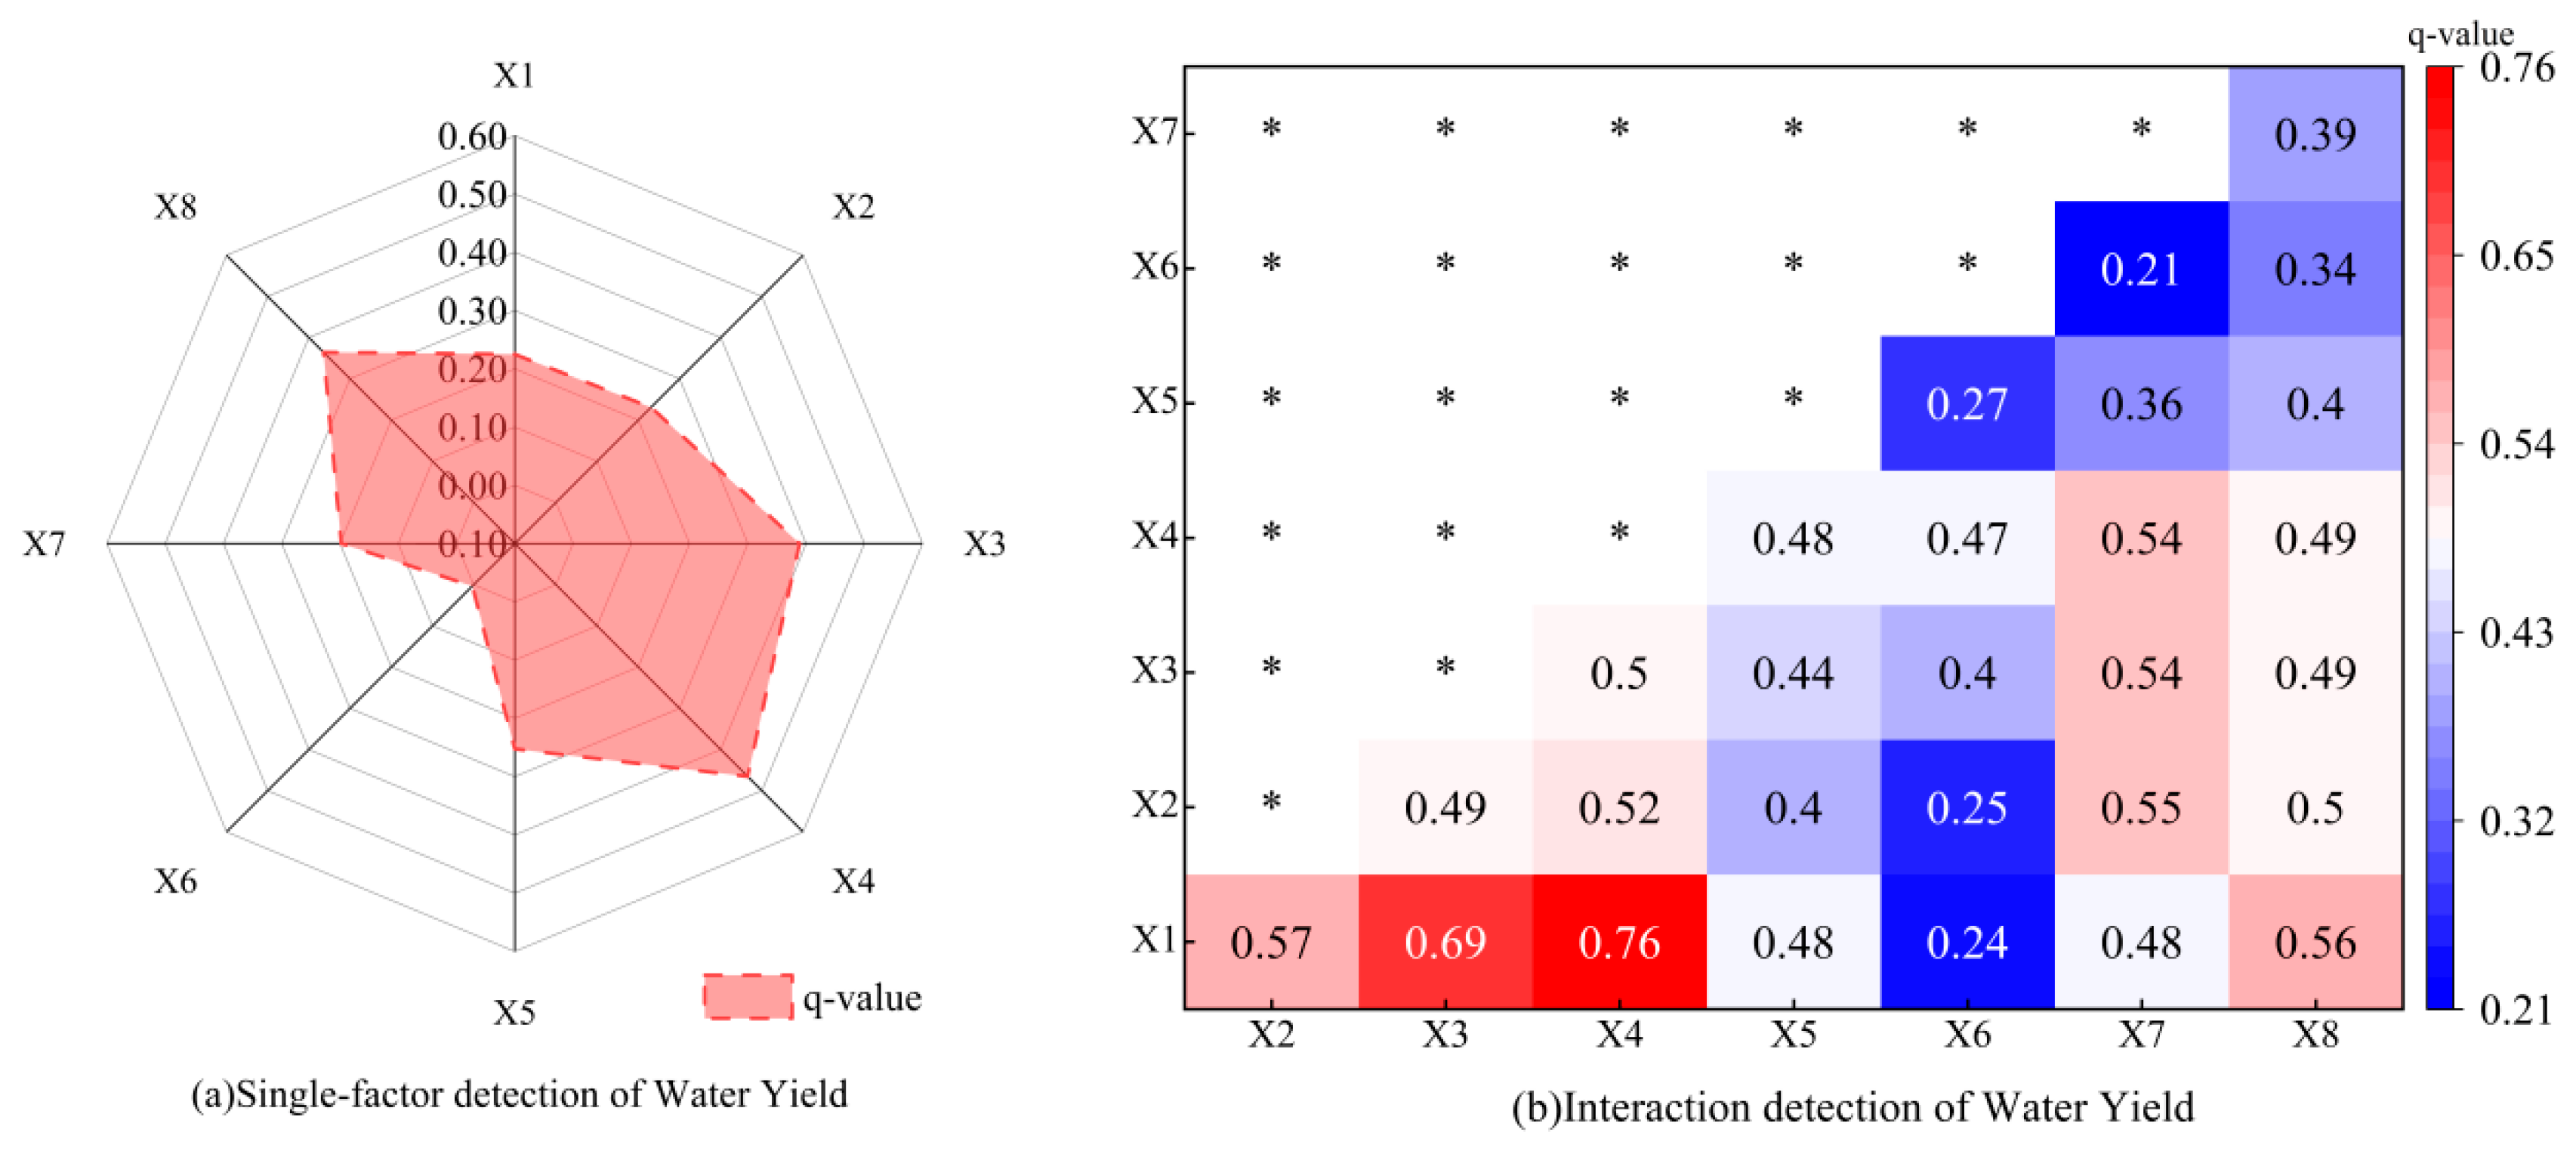
The results of the single-factor and multi-factor interaction analyses for water yield in the Qinghai Lake Basin (Figure 4 and Table 4) are as follows: Among individual factors, elevation and annual mean temperature exhibit the highest explanatory power, with corresponding q-values of 0.47 and 0.39, respectively. All other factors show q-values not exceeding 0.30. The multi-factor interaction analysis indicates that the interaction between elevation and precipitation yields the strongest explanatory power, with a q-value as high as 0.76, followed by the interactions of temperature with precipitation and potential evapotranspiration with precipitation. Interactions involving factors such as slope and aspect show relatively weak explanatory power. Notably, every interaction result in the study area displays a higher q-value than any single-factor result. Overall, factors in the Qinghai Lake Basin influence water yield primarily through interactions, whereas the independent effect of any single factor is relatively minor.
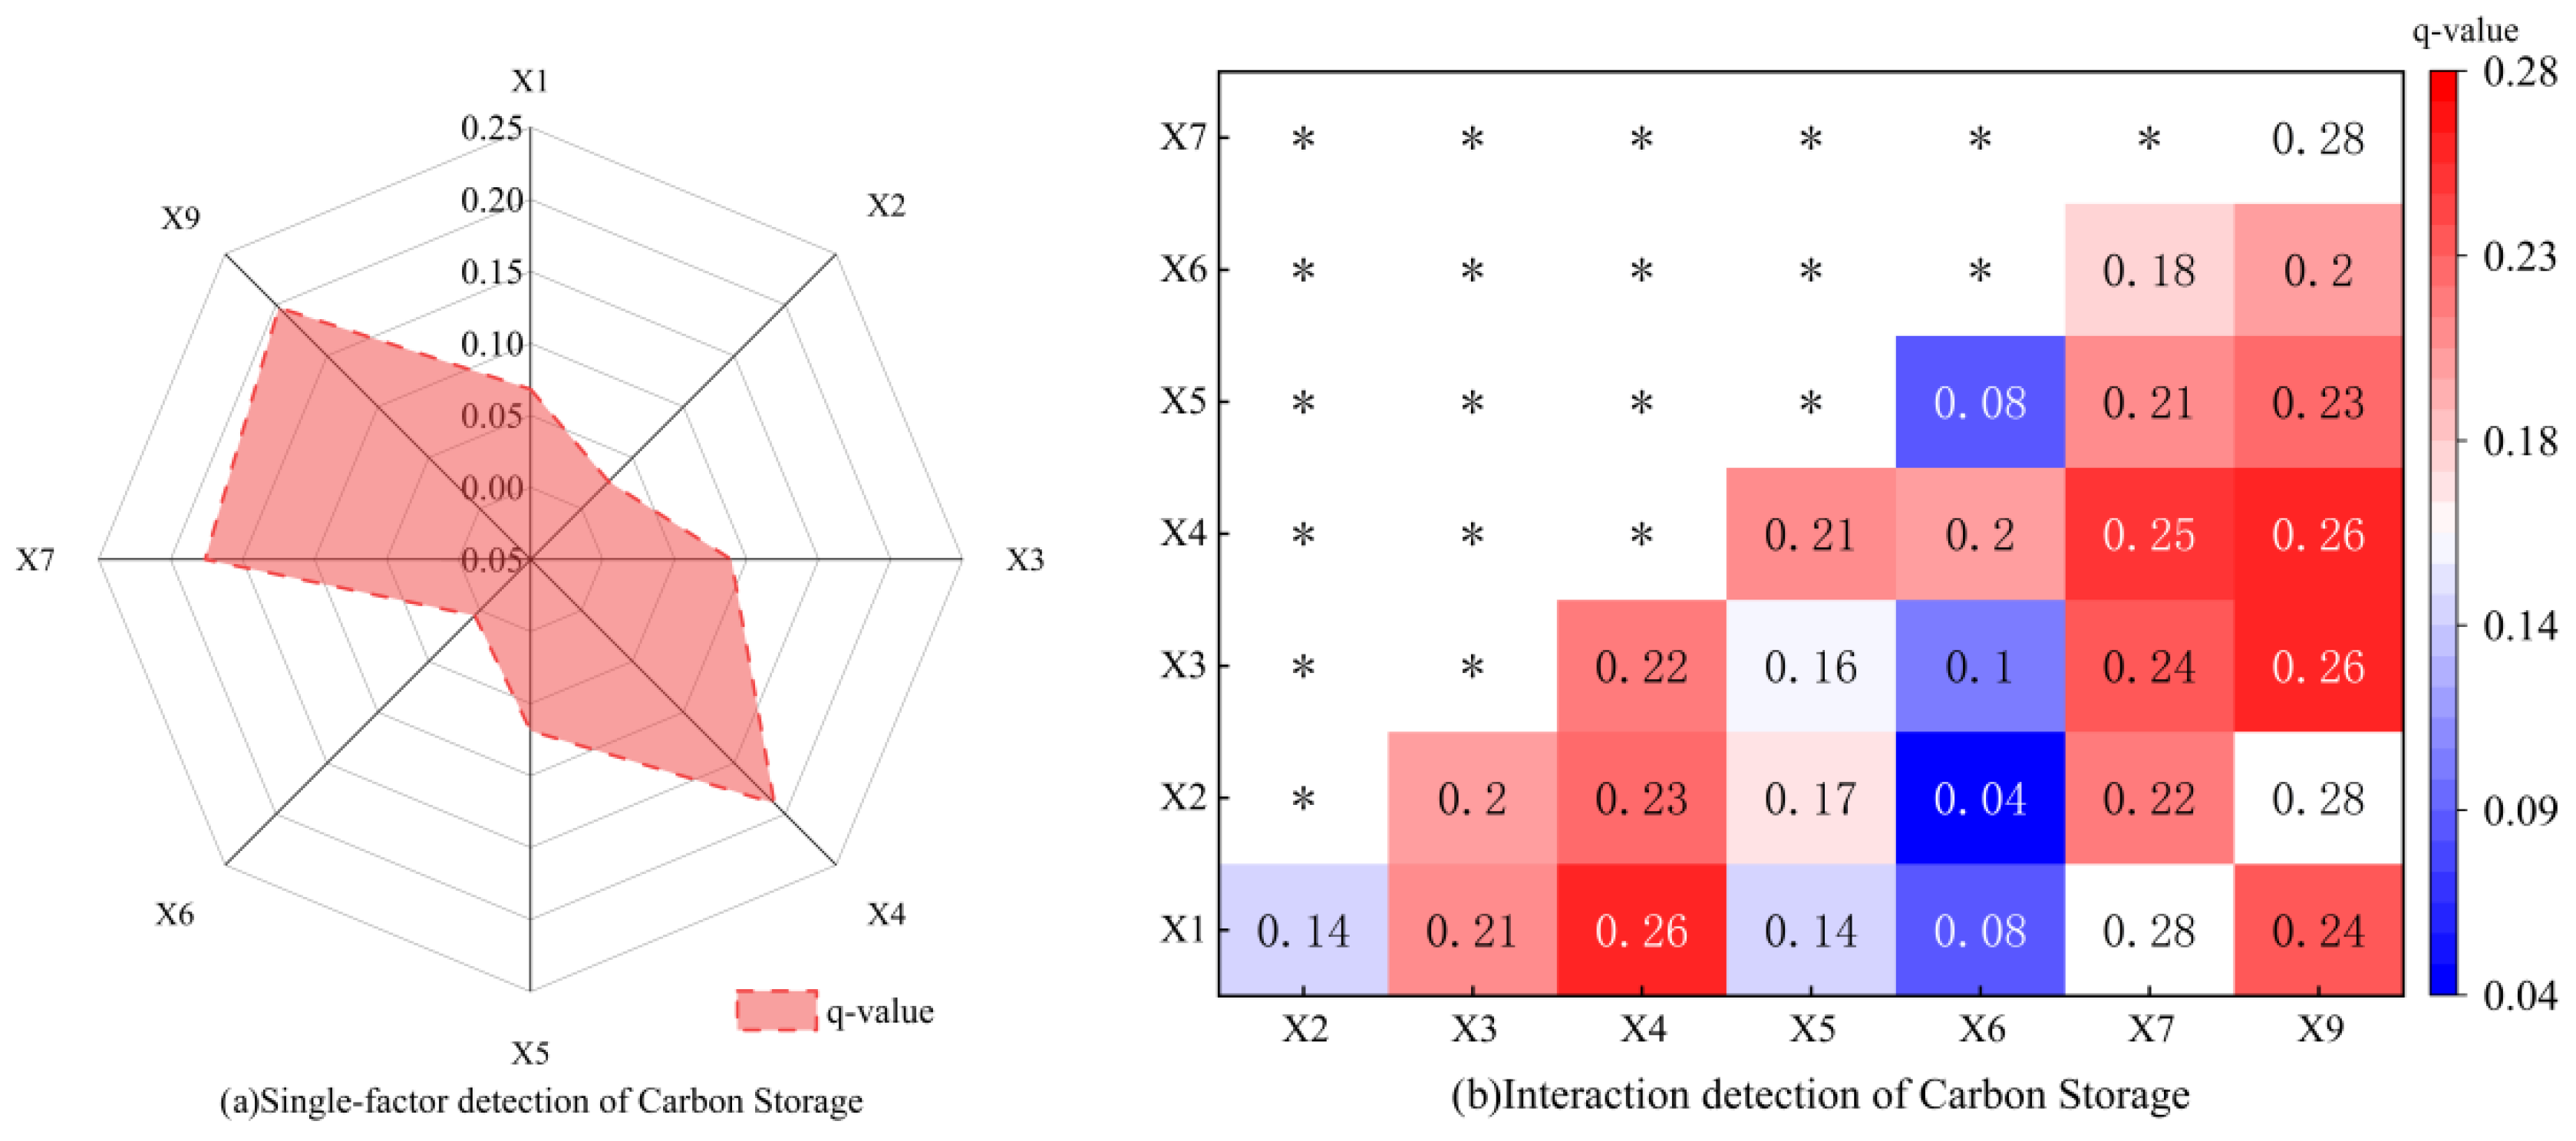
The results of the factor analysis for carbon storage in the Qinghai Lake Basin are shown in Figure 5 and Table 5. In the single-factor analysis, water yield exhibits the strongest explanatory power for carbon storage, with a q-value of 0.20, followed by elevation (q = 0.19) and NDVI (q = 0.18). The remaining factors show relatively weak explanatory power for carbon storage. In the interaction analysis, interactions involving water yield, NDVI, and elevation with other factors all demonstrate strong explanatory power for carbon storage. Among these, the interaction between water yield and potential evapotranspiration yields the highest explanatory power, with a q-value of 0.28, whereas interactions involving slope and aspect show comparatively weaker explanatory power.

4.4. Spatial Autocorrelation Analysis of Water Yield and Carbon Storage

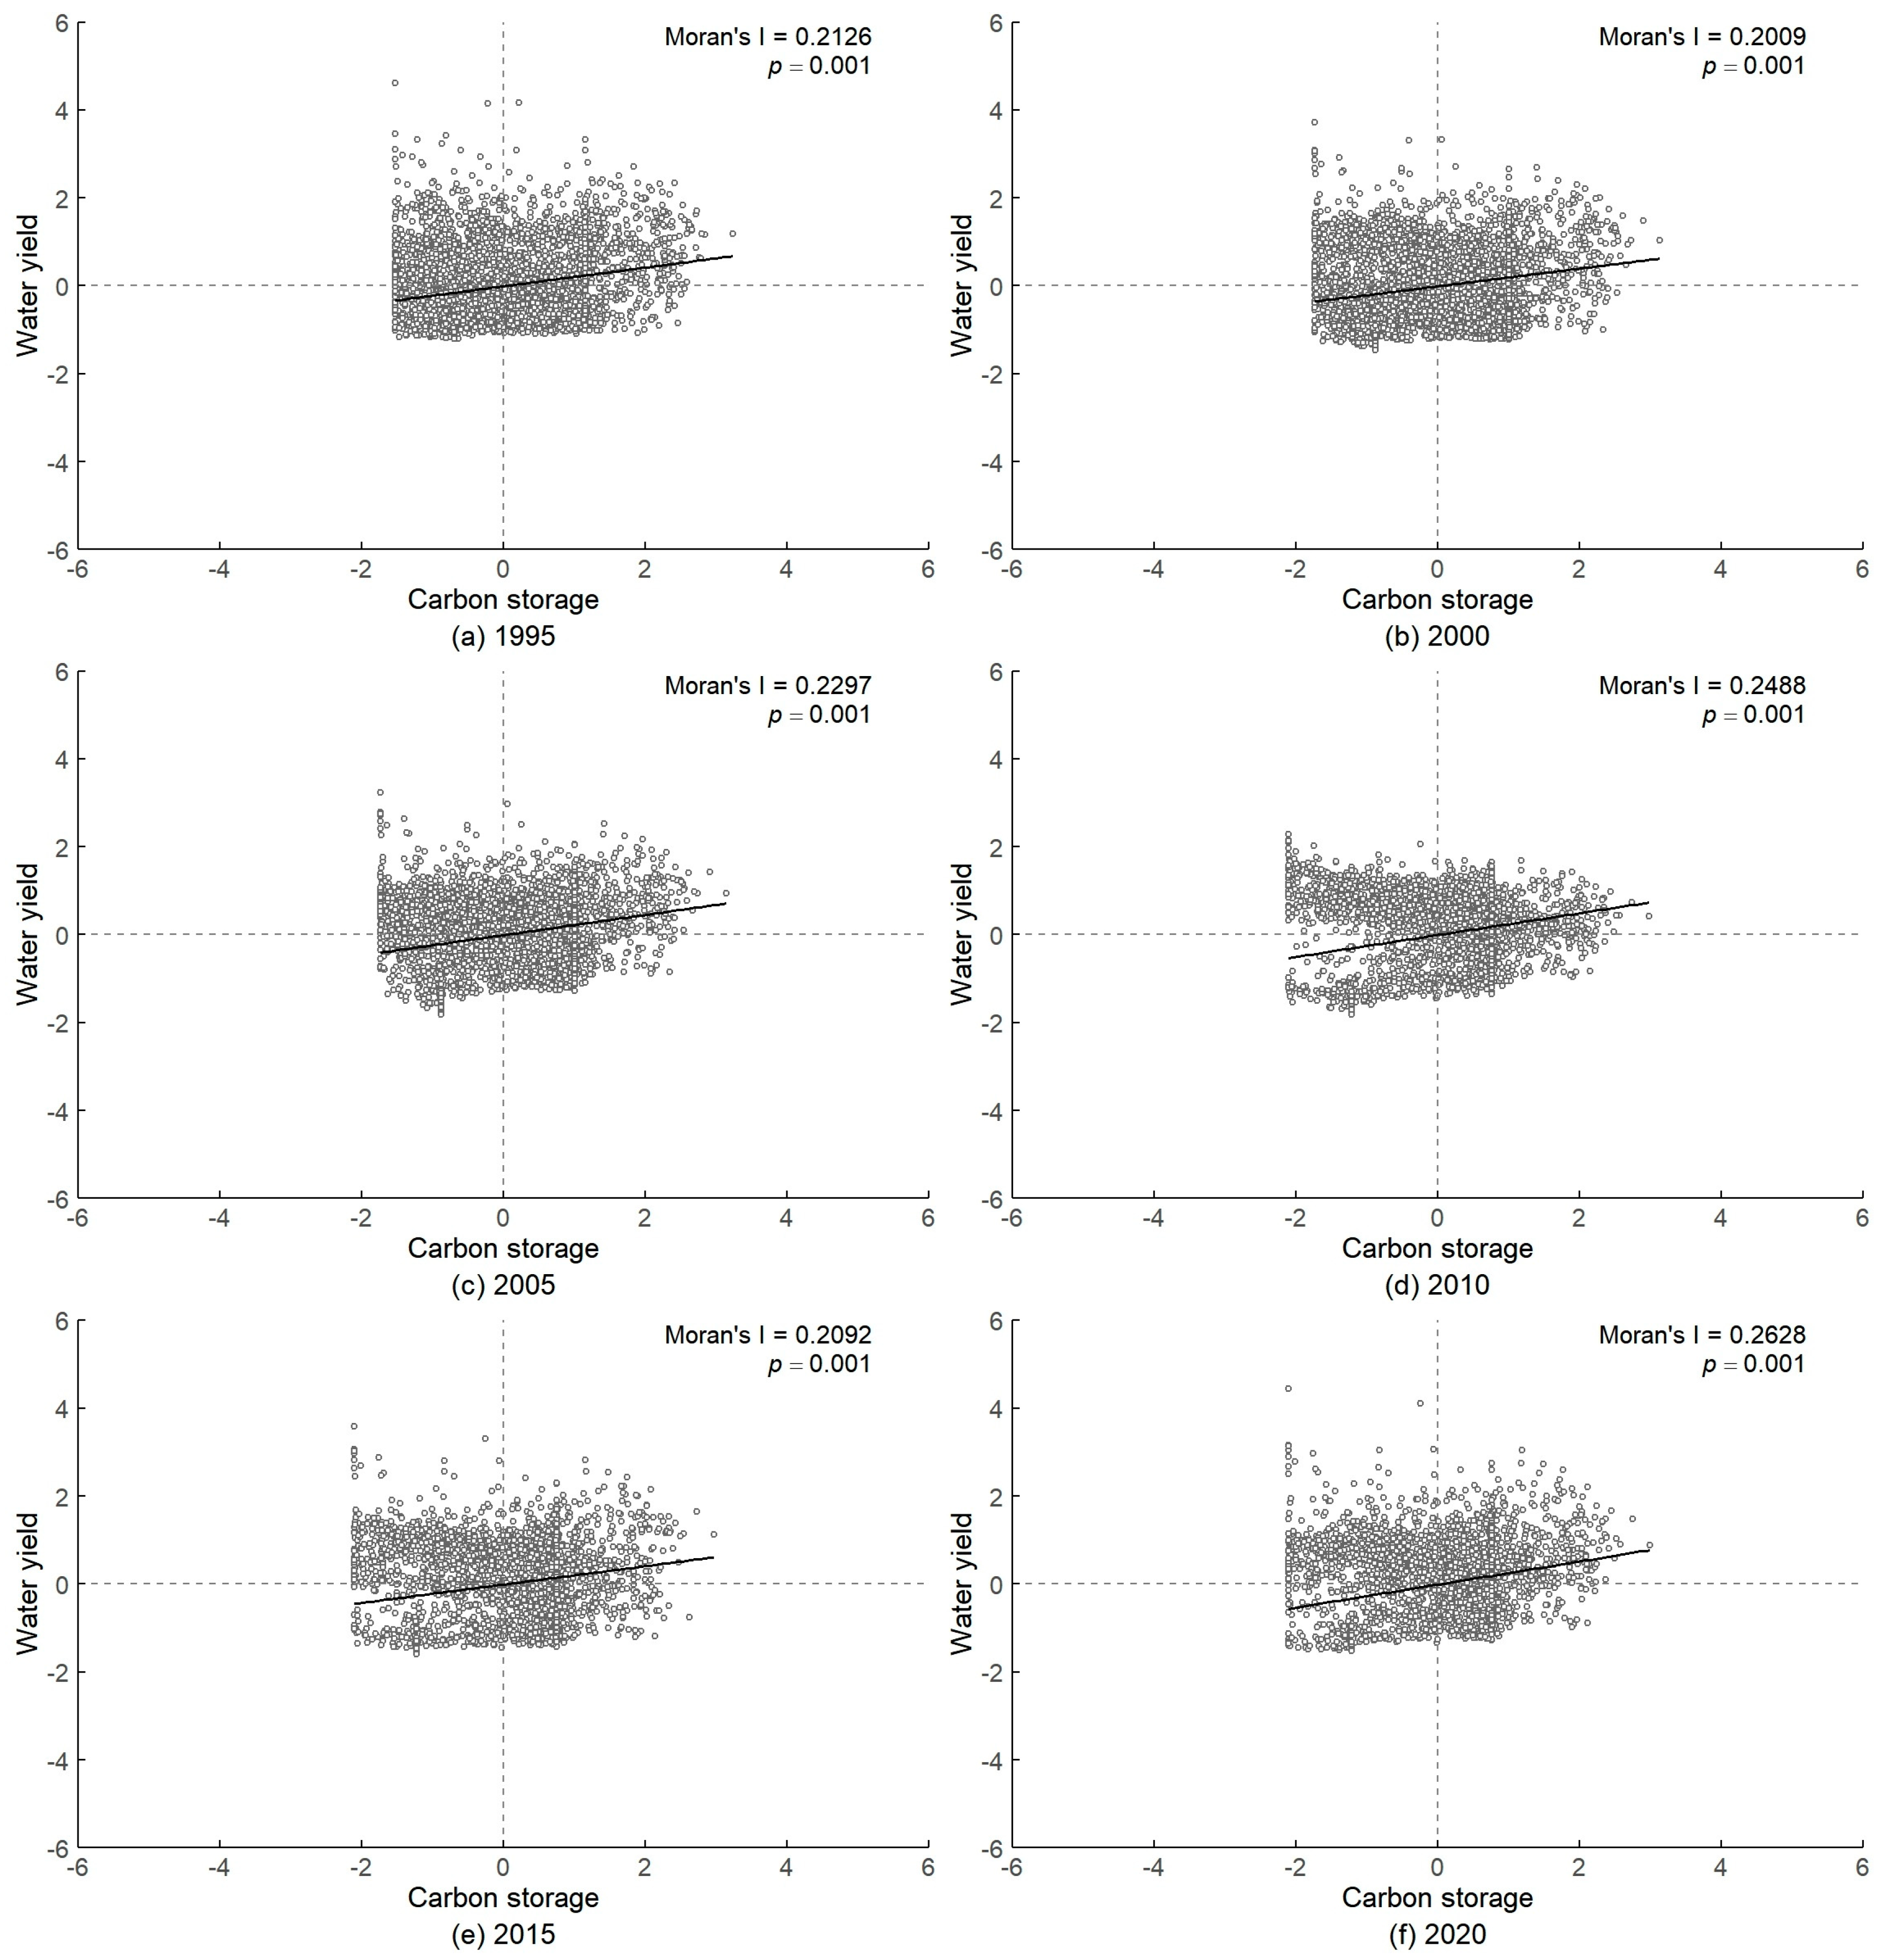
The global Moran’s I index for the bivariate analysis of water yield and carbon storage in the Qinghai Lake Basin from 1995 to 2020 remained consistently above zero, with all annual p-values reaching extreme significance (p = 0.001). This result indicates a persistent, significant positive spatial correlation between the two variables throughout the study period (Figure 6). Specifically, the first and third quadrants contained the highest number of data points, whereas the second and fourth quadrants held fewer points. The data points generally aligned with the fitted line in a positive direction, suggesting a synergistic spatial distribution relationship between water yield and carbon storage. Regarding temporal trends, the global Moran’s I index for the two variables displayed an overall fluctuating upward trend: it rose gradually from 0.2126 in 1995 and 0.2009 in 2000 to 0.2297 in 2005 and 0.2488 in 2010, then decreased slightly to 0.2092 in 2015 before increasing further to 0.2628 in 2020—the highest value over the study period. Overall, the spatial clustering effect between water yield and carbon storage exhibited a strengthening trend during the study period, and the degree of spatial synergy between the two continued to increase over time.
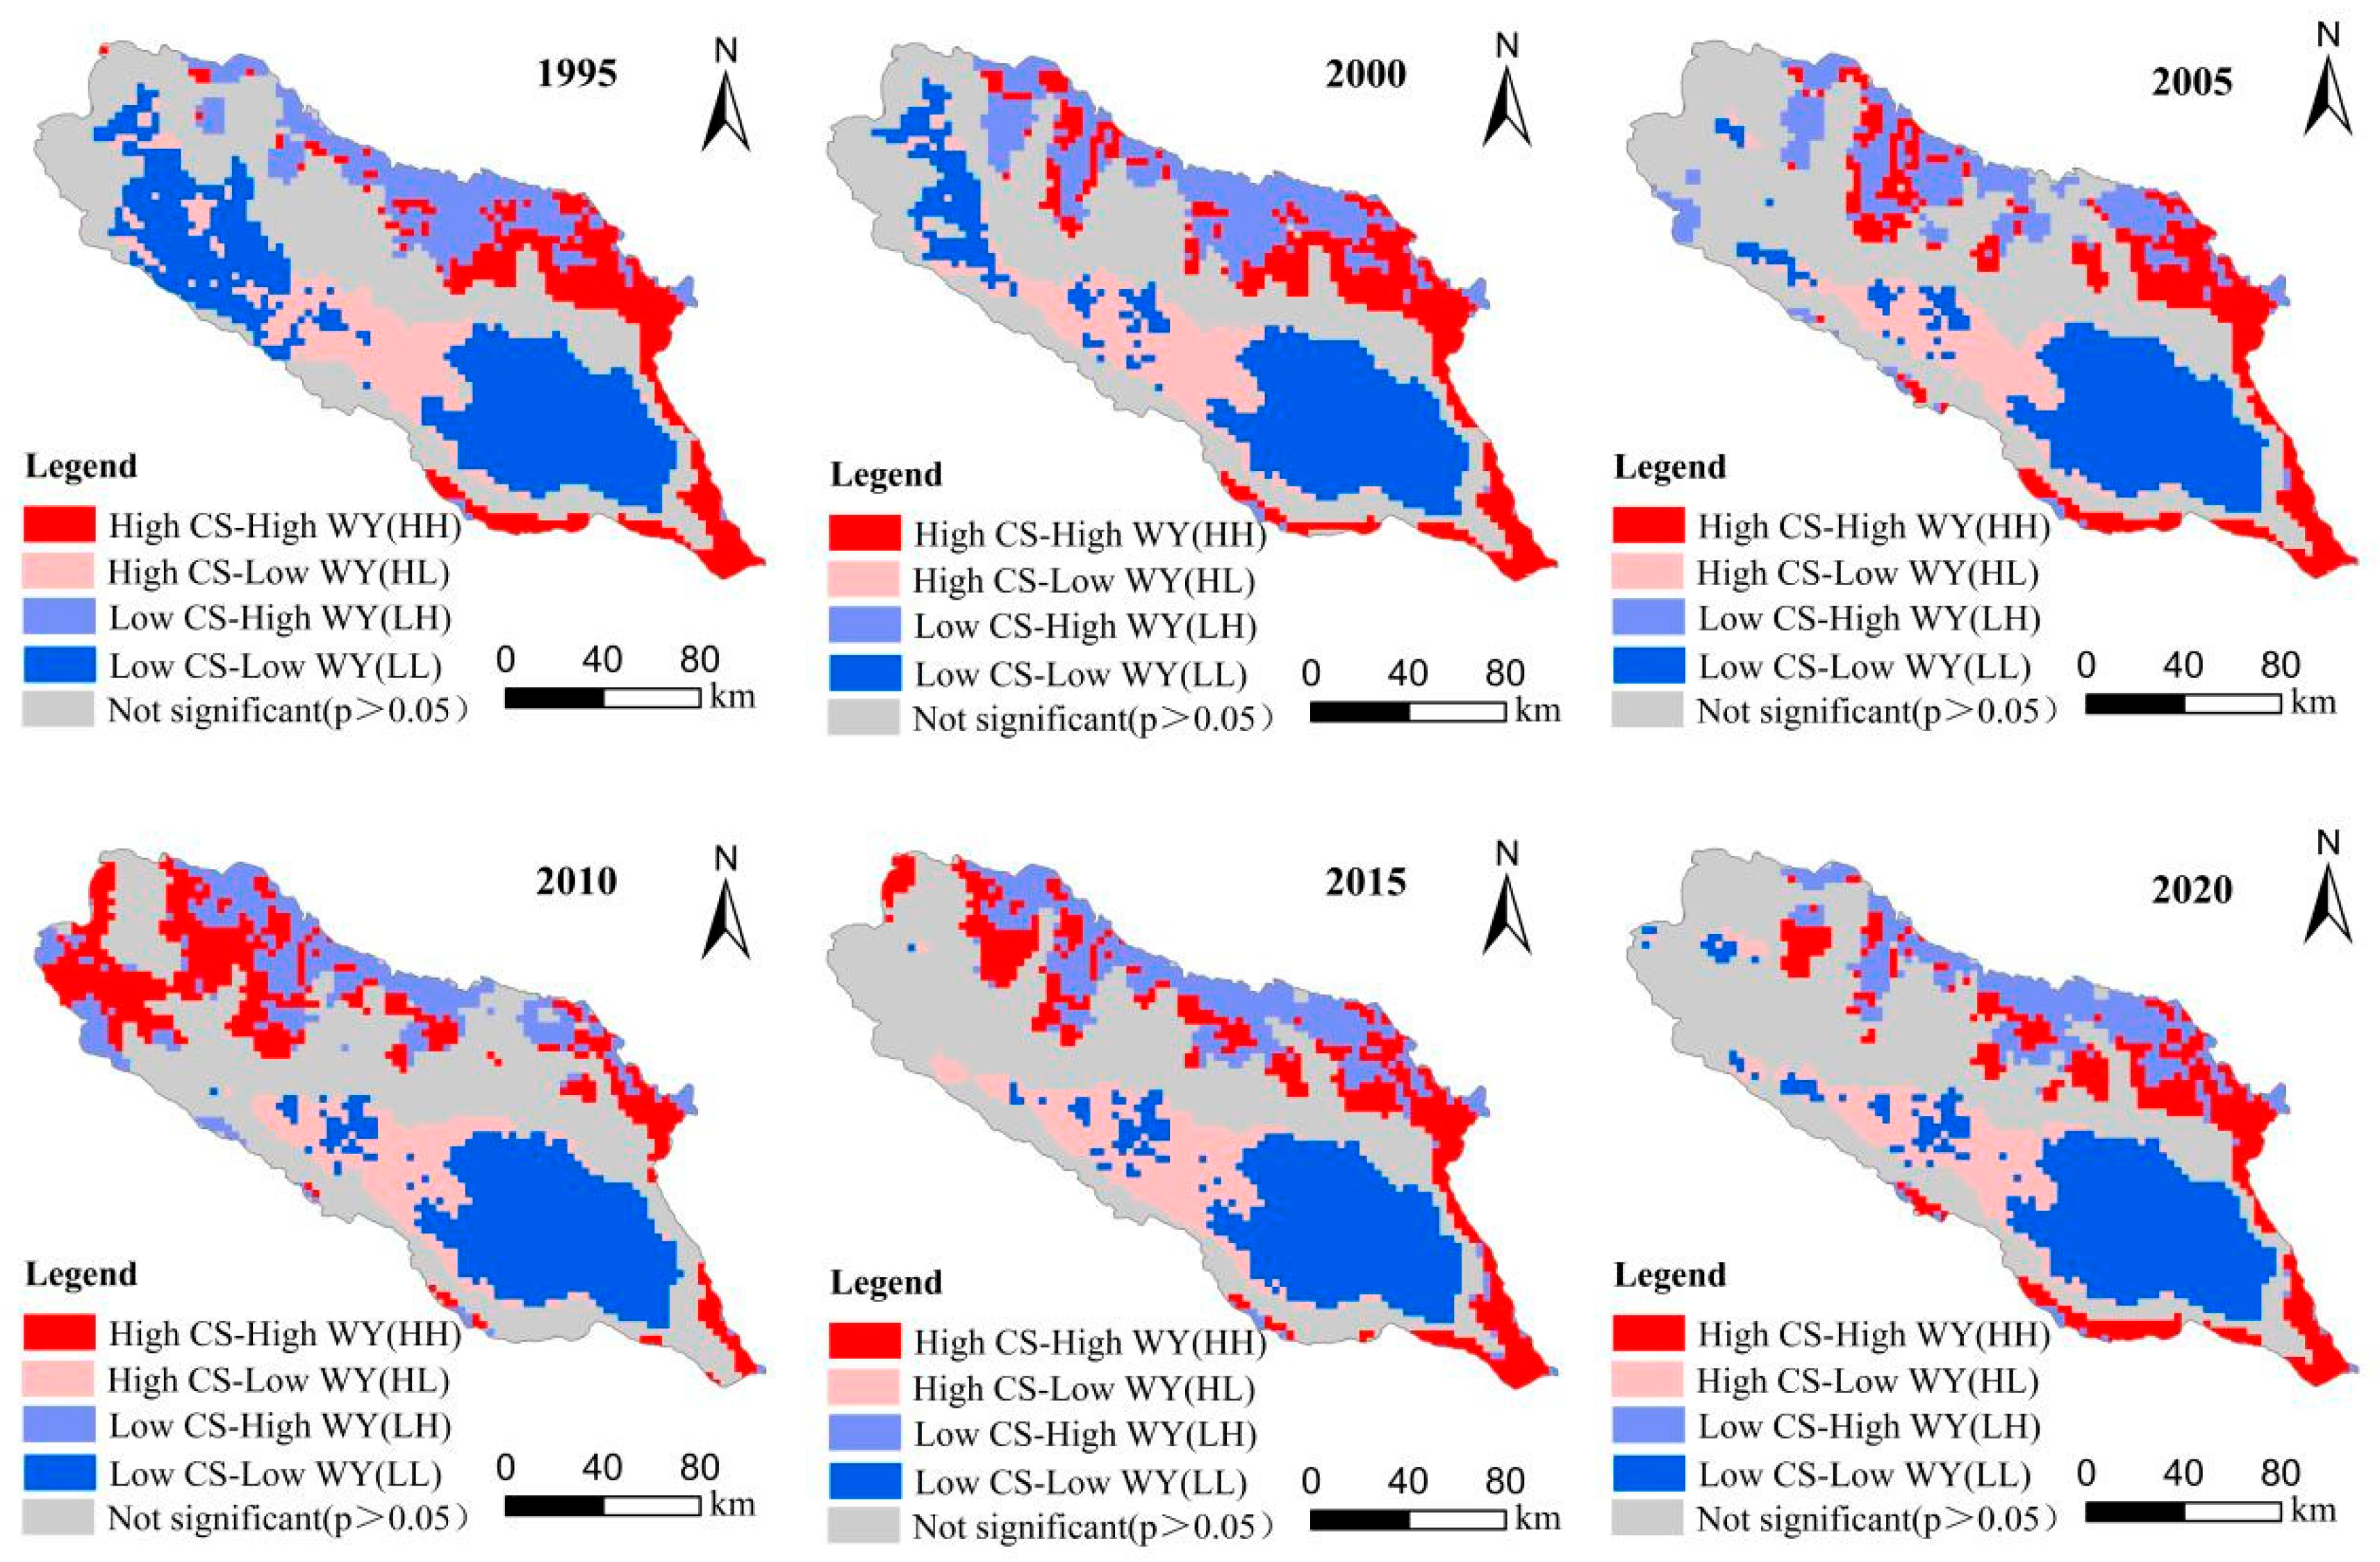
Figure 7 illustrates the spatial relationship between water yield and carbon storage in the Qinghai Lake Basin. The local spatial autocorrelation between the two variables exhibits a predominantly non-significant pattern across the basin. Among the significant clusters, high–high clusters (high carbon storage with high water yield) and low–low clusters (low carbon storage with low water yield) appear relatively widespread, concentrating mainly in the northern part of the basin and the lake area. Negative correlation clusters, including high–low (high carbon storage with low water yield) and low–high (low carbon storage with high water yield), occupy relatively small portions of the basin. These findings confirm a distinct spatial co-aggregation pattern between water yield and carbon storage in the Qinghai Lake Basin.

5. Discussion and Conclusions

5.1. Discussion

Water yield in the Qinghai Lake Basin displayed a fluctuating upward trend from 1995 to 2020. Spatially, high-yield areas occurred mainly in the high-altitude headwater regions of the northern and northwestern basin, whereas low-yield areas lay surrounding the lake and along riverbanks. This trend agrees with findings from Mei et al. [37] and Wu et al. [13]. The present results show a water yield peak in 2010. Studies at the Tibetan Plateau scale by Liu et al. [14] and Dai et al. [38] indicate that precipitation and evapotranspiration together constitute the primary mechanism driving water yield spatial differentiation. Factor analysis in this study reveals elevation and annual mean temperature as the dominant single factors, with the elevation–precipitation interaction yielding the strongest explanatory power. In contrast to the plateau interior, where land use and NDVI dominate, the Qinghai Lake Basin features a large elevation gradient and notable topographic variations in hydrological and thermal conditions. Thus, elevation becomes the core factor controlling water yield spatial distribution, reflecting the basin’s unique hydrological structure and the moderating role of topography.
Regarding carbon storage, total carbon storage in the Qinghai Lake Basin exhibited a fluctuating upward trend from 1995 to 2020. Spatially, high-storage areas occurred in grasslands and forested regions, whereas low-storage areas lay in built-up land, unused land, and the lake area. Studies by Mei et al. [37] and Liu et al. [15] also identified a fluctuating upward trend in carbon storage and a spatial pattern with higher values in the east and lower values in the west. Differences in carbon storage estimates across studies may be attributed to varying degrees of localization in carbon density parameters. Single-factor analysis reveals water yield, elevation, and NDVI as the dominant factors influencing carbon storage, which generally agrees with the conclusion that NDVI serves as the core driving factor at the Qinghai–Tibet Plateau scale. However, the explanatory power of NDVI remains relatively low, suggesting that, as a closed basin in the northeastern plateau, carbon sink processes in the Qinghai Lake Basin depend strongly on hydrological conditions and topographic features. Carbon storage has shown a tendency to stabilize since 2010, with reduced growth rates. This finding differs somewhat from existing studies reporting a continuous increase in net ecosystem productivity (NEP). Such a discrepancy may reflect a lag effect of carbon storage—as a cumulative stock—in response to flux changes and also implies that the region’s carbon sink function may gradually enter a relatively stable plateau phase. Since the beginning of this century, a series of ecological projects have been implemented in the Qinghai Lake Basin, including the Grain for Green program, natural forest protection, ecological protection of the Three-River-Source region [39,40], and comprehensive management of the Qinghai Lake Basin [41]. Since 2011, policies on grassland grazing prohibition and the balance between grassland and livestock have been fully enforced [42]. These policies have reduced human disturbance and facilitated vegetation restoration, significantly enhancing the regional carbon sink capacity, which is consistent with the observed continuous increase in carbon storage.
Spatial autocorrelation analysis reveals a significant positive spatial correlation between water yield and carbon storage, with both variables displaying distinct patterns of synergistic clustering. The study by Wu et al. [13] also identified a synergistic relationship between carbon storage and water conservation capacity; differences in clustering center locations may relate to variations in study periods and changes in land use patterns. Unlike the Beiluo River Basin [12] and the Han River Basin [32,43]—where trade-off relationships dominated—and the Yellow River Basin, which exhibited a transition from trade-off to synergy [44,45], the Qinghai Lake Basin demonstrates a stable synergistic relationship between water yield and carbon storage. This finding reflects distinct regional characteristics. High vegetation cover areas typically possess both strong water conservation capacity and high ecosystem carbon density, which may explain this synergy. Furthermore, against the backdrop of a warming and moistening climate, increased precipitation can promote vegetation growth and carbon sequestration processes, thereby creating a bidirectional positive feedback loop.
The limitations of this study include insufficient parameter localization in the InVEST model, inadequate consideration of policy interventions and socioeconomic factors, and a lack of future scenario simulations. Future research will require parameter determination based on field sampling, incorporation of land-use scenario simulation models and climate change scenarios, and examination of the effects of the continued rise in Qinghai Lake water level on carbon cycling in the riparian zone.

5.2. Conclusions

(1)
From 1995 to 2020, water yield in the Qinghai Lake Basin displayed an overall fluctuating upward trend, rising from 1.42 × 10⁹ m3 to 1.97 × 10⁹ m3—a cumulative increase of 0.55 × 10⁹ m3. Spatially, high water yield areas occurred in the high-altitude headwater regions of the northern and northwestern basin, whereas low water yield areas lay in the lake area and along the riverbanks. Factor analysis results reveal elevation (q = 0.47) and annual mean temperature (q = 0.39) as the dominant single factors affecting basin water yield. The interaction between elevation and precipitation yielded the highest explanatory power for water yield (q = 0.76). Notably, every interaction factor exhibited higher explanatory power than any single factor, highlighting the composite effects of multiple factors. The river source zones with high water yield should be designated as core protection areas for water conservation, where grassland restoration and wetland protection should be strengthened. Ecological restoration of buffer zones should be emphasized around the lake and along rivers. In high-altitude areas, water resources should be scientifically allocated in the context of climate warming, and factors such as topography and precipitation should be integrated into multi-sector collaborative management.
(2)
From 1995 to 2020, carbon storage in the Qinghai Lake Basin increased from 1.76 × 10⁸ t to 2.14 × 10⁸ t, a cumulative increase of 0.38 × 10⁸ t, exhibiting a fluctuating upward trend. Spatially, high carbon storage areas occurred mainly in grassland and forest regions, whereas low carbon storage areas lay in built-up land, unused land, and the lake area. Water yield (q = 0.20), elevation (q = 0.19), and NDVI (q = 0.18) constituted the dominant single factors influencing carbon storage. Interaction analysis results revealed the water yield–potential evapotranspiration interaction as the strongest explanatory factor (q = 0.28). It is recommended that priority be given to the improvement and afforestation of grassland and forest land to enhance carbon sinks, as well as to vegetation restoration on built-up land and unused land. In low-altitude areas, carbon sinks can be strengthened by increasing NDVI, and attention should be paid to the interactive effects between water yield and potential evapotranspiration. A basin-scale ecological–hydrological–carbon cycle regulation strategy should be formulated.
(3)
From 1995 to 2020, a significant positive spatial correlation existed between water yield and carbon storage in the Qinghai Lake Basin. The global Moran’s I index fluctuated from 0.2126 to 0.2628, indicating a strengthening trend in the spatial clustering effect between the two variables. Local spatial correlation analysis revealed that regions exhibiting positive high–high (high carbon storage with high water yield) and low–low (low carbon storage with low water yield) correlations occurred widely, mainly in the northern basin and the lake area. Negative correlation regions covered a smaller area, further confirming that water yield and carbon storage within the basin display a spatial co-clustering pattern. This synergistic agglomeration characteristic indicates the feasibility of implementing a collaborative management project for water conservation and carbon enhancement in the high-altitude areas of the northern and northwestern basin, strengthening the restoration of degraded meadows around the lake, and establishing a water–carbon collaborative monitoring network. By regularly assessing spatiotemporal changes using remote sensing and ground station data, a scientific basis can be provided for ecological compensation in the basin, thereby achieving coordinated development between sustainable water resource utilization and carbon sink capacity enhancement.

Author Contributions

Conceptualization, M.C. and K.C.; Methodology, C.C.; Validation, S.Z.; Investigation, Y.M. and H.Z.; Data curation, Y.H. and Z.L.; Writing—original draft, M.C.; Writing—review and editing, M.C. and K.C. All authors have read and agreed to the published version of the manuscript.

Funding

This study was supported by the National Natural Science Foundation of China (Grant No. 42461018) and the Central Government Guidance Fund for Local Science and Technology Development of Qinghai Province (Grant No. 2025-ZY-043).

Institutional Review Board Statement

Not applicable.

Informed Consent Statement

Not applicable.

Data Availability Statement

The original contributions presented in this study are included in the article. Further inquiries can be directed to the corresponding author.

Conflicts of Interest

The authors declare no conflicts of interest.

Abbreviations

The following abbreviations are used in this manuscript:
OPGDoptimal parameter geographical detector
DEMdigital elevation model
NDVINormalized Difference Vegetation Index
Pprecipitation
AETannual actual evapotranspiration
C_aboveabove-ground biomass carbon
C_belowbelow-ground biomass carbon
C_soilsoil carbon
GDOrganization for Economic Co-operation and Development
CSUnited Nations Educational, Scientific, and Cultural Organization
WYstandard deviation

References

  1. Wang, X.; Zhang, S.; Gao, C.; Tang, X. Coupling coordination and driving mechanisms of water resources carrying capacity under the dynamic interaction of the water-social-economic-ecological environment system. Sci. Total Environ. 2024, 920, 171011. [Google Scholar] [CrossRef] [PubMed]
  2. Zhang, T.J.; Shao, Q.Q.; Deng, L.; He, T.; Ge, J.S.; Yang, F. Contribution of water supply service in the Yellow River Basin of Qinghai Province to water-energy-carbon reduction in the Yellow River. J. Nat. Resour. 2026, 41, 516–531. [Google Scholar]
  3. Liu, M.; Dong, X.; Zhang, Y.; Wang, X.; Wei, H.; Zhang, P.; Zhang, Y. Spatiotemporal changes in future water yield and the driving factors under the carbon neutrality target in Qinghai. Ecol. Indic. 2024, 158, 111310. [Google Scholar] [CrossRef]
  4. Du, J.J.; Wei, P.J.; Zhang, H.Y.; Chen, S.Y. Spatiotemporal changes of water yield and water conservation capacity in the Datong River Basin. Pratac. Sci. 2026, 1–22. Available online: https://link.cnki.net/urlid/62.1069.S.20251124.1622.002 (accessed on 15 March 2026).
  5. Gao, H.S.; Qin, F.C.; Wu, Y.H.; Dong, X.Y.; Zhou, Y.Q. Spatial-temporal evolution and prediction of water conservation capacity in the Kuye River Basin based on InVEST and CA-Markov models. J. Soil Water Conserv. 2026, 1–12. [Google Scholar] [CrossRef]
  6. Shi, X.L.; Zhang, G.J. Impacts of climate, land use, and ecological management on water ecosystem services in the Haihe River Basin. Bull. Soil Water Conserv. 2026, 46, 353–365. [Google Scholar] [CrossRef]
  7. Hu, Q.Y.; Zhou, Q.Y.; Niu, L. Spatiotemporal variations, regional differences and dynamic evolution of carbon storage at the county scale in the Yangtze River Economic Belt. Environ. Sci. 2026, 1–19. [Google Scholar] [CrossRef]
  8. Lü, X.W.; Wang, C.J.; Chang, L.Y.; Xiang, L.Y.; Liu, Y. Multi-scenario prediction and driving factor analysis of carbon storage on the Qinghai-Tibet Plateau based on PLUS-InVEST-GTWR models. Environ. Sci. 2026, 1–22. [Google Scholar] [CrossRef]
  9. Meng, S.S.; Ding, J.L.; Wang, J.J.; Zhao, S.; Hu, J.H. Spatiotemporal evolution and driving mechanism of carbon storage in the Aksu Oasis based on Mop-PLUS-InVEST-Geodetector model. Environ. Sci. 2026, 1–25. [Google Scholar] [CrossRef]
  10. Xu, B.L.; Zhang, F.S.; Fan, X.Q. Spatial-temporal dynamics and trade-offs of ecosystem services in the Xiaolangdi Reservoir area of the Yellow River. For. Invent. Plan. 2025, 50, 110–116. [Google Scholar] [CrossRef]
  11. Dong, P.B.; Ren, Z.P.; Li, P.; Wang, K.B.; He, G.K.; Wang, P. Trade-off and synergy relationships of ecosystem services in Ningxia under land use change. Arid Zone Res. 2024, 41, 1032–1044. [Google Scholar] [CrossRef]
  12. Zhang, Y.J.; Zhang, X.P.; Sun, W.N.; Geng, W.L.; An, Z.F.; Chen, Q.W. Spatiotemporal evolution characteristics and trade-off/synergy relationships of water yield, soil retention and carbon sequestration ecosystem services in the Beiluo River Basin from 1970 to 2020. J. Soil Water Conserv. 2025, 39, 365–377. [Google Scholar] [CrossRef]
  13. Wu, X.; Zhang, L.; Gao, L.; Li, Y.; Liu, X. Change and tradeoff/synergy analysis of watershed ecosystem services: A case study of Qinghai Lake Basin. Sustainability 2023, 15, 11711. [Google Scholar] [CrossRef]
  14. Liu, M.J.; Zhong, J.T.; Wang, B.; Mi, W.B. Spatiotemporal variation and driving factors of water yield function in the Qinghai Lake Basin based on the InVEST model. Sci. Geogr. Sin. 2023, 43, 411–422. [Google Scholar] [CrossRef]
  15. Liu, Y.; Tian, L.H.; Shi, D.R. Spatiotemporal variation characteristics and driving factors of carbon storage in the Qinghai Lake Basin. Qinghai J. Agric. For. Sci. Technol. 2025, 3, 1–7+19. [Google Scholar] [CrossRef]
  16. Wu, H.W.; Li, X.Y.; Zhao, G.Q.; Li, G.Y.; Li, Z.; Li, L. Variation characteristics of δ18O and δD in precipitation and river water in the Qinghai Lake Basin. J. Nat. Resour. 2014, 29, 1552–1564. [Google Scholar] [CrossRef]
  17. Li, Y.; Chen, Z.; Chen, K.L.; Xia, X.S. Ecological effects of land use transformation in the Qinghai Lake Basin from 1990 to 2021. Sci. Soil Water Conserv. 2025, 23, 136–148. [Google Scholar] [CrossRef]
  18. Wang, M.Y.; Wu, C.Y.; Chen, K.L. Spatiotemporal variation of vegetation greenness and its influencing factors in the Qinghai Lake Basin. J. Desert Res. 2025, 45, 289–300. [Google Scholar]
  19. Ding, C.S.; Cao, S.K.; Zhang, F.L.; Wang, J.; Hou, Y.F.; Lei, Y.Z.; Pei, R.Y. Spatial pattern and simulation of soil moisture in the Qinghai Lake Basin. Acta Agrestia Sin. 2026, 34, 984–997. [Google Scholar]
  20. Cao, S.K.; Cao, G.C.; Han, G.Z.; Han, G.Z.; Wu, F.T.; Lan, Y. Comparison of evapotranspiration between two alpine type wetland ecosystems in Qinghai Lake basin of Qinghai-Tibet Plateau. Ecohydrol. Hydrobiol. 2020, 20, 215–229. [Google Scholar] [CrossRef]
  21. Wang, L.; Mao, X.F.; Song, X.H.; Tang, E.J.; Wang, W.Y.; Yu, H.Y.; Deng, Y.F.; Zhang, Z.P.; Zhang, Z.J.; Zhou, H.K. How rising water levels altered ecosystem provisioning services of the area around Qinghai Lake from 2000 to 2020: An InVEST-RF-GTWR combined method. Land 2022, 11, 1570. [Google Scholar] [CrossRef]
  22. Zhang, C.M.; Ma, M.X.; Zhang, S.L.; Bao, X.M.; Li, D.B. Research on major ecological issues and protection/restoration measures of Qinghai Lake under global warming and humidification. Qinghai Natl. Land Strategy 2025, 2, 57–61. [Google Scholar] [CrossRef]
  23. Wu, A.Q.; Shi, M.C.; Zhang, Y.W.; Wang, J.Y.; Liu, J.Y.; Chen, K. Ecosystem services and driving factors in the Pearl River Basin based on PLUS-InVEST-GeoDetector models. Environ. Sci. 2026, 1–31. [Google Scholar] [CrossRef]
  24. Du, H.Y.; Bai, S.; Sun, T.; Hao, R.N.; Yu, J.F. Ecological security pattern construction and ecological network resilience assessment in the Qilian Mountains. Chin. J. Appl. Ecol. 2026, 1–15. [Google Scholar] [CrossRef]
  25. Han, Y.L. Study on the Impacts of Climate and Landscape Pattern Changes on Ecosystem Services in the Qinghai Lake Basin. Ph.D. Thesis, Qinghai Normal University, Xining, China, 2021. [Google Scholar] [CrossRef]
  26. Zhang, X.M.; Zhang, W.; Yue, Y.M.; Li, J.F.; Yuan, C.; Xiao, J.Y.; Xie, J.; Pang, X.F.; Xie, B.G. Impacts of multidimensional poverty and ecosystem health factors on ecosystem services in karst regions. Acta Ecol. Sin. 2026, 1–18. [Google Scholar] [CrossRef]
  27. Wang, Y.M.; Zhang, Z.X.; Chen, X. Spatiotemporal variation and driving factors of carbon storage in the Poyang Lake Eco-economic Zone based on PLUS-InVEST-GeoDetector models. Environ. Sci. 2026, 1–24. [Google Scholar] [CrossRef]
  28. Ma, Y.J.; Zhong, J.T.; Mi, W.B.; Shi, J.L.; Jiang, X. Carbon storage assessment and vulnerability analysis based on multi-scenario simulation of land use in the Qinghai Lake Basin. Arid Land Resour. Environ. 2023, 37, 46–55. [Google Scholar] [CrossRef]
  29. Wang, J.F.; Liu, Y.T.; Liu, Y.Q. Influence of built environment on urban vitality and its spatial heterogeneity based on OPGD and MGWR: A case study of Guangzhou city. Geogr. Res. 2025, 44, 3304–3321. [Google Scholar] [CrossRef]
  30. Li, Y.H.; He, Z.H.; Yao, S.; Jiang, H.H.; Song, J.F. Spatiotemporal evolution and driving forces of ecosystem service supply-demand in Zhejiang Province at the county scale based on the InVEST-OPGD-RF framework. Environ. Sci. 2026, 1–15. [Google Scholar] [CrossRef]
  31. Jiang, W.W.; Tang, M.B.; Xiao, H.L. Spatial-temporal patterns, ecological thresholds and driving mechanisms of vegetation restoration in the drawdown zone of Guanyinyan Reservoir on the Jinsha River. Environ. Sci. 2026, 1–15. [Google Scholar] [CrossRef]
  32. Ren, W.J.; Si, Z.J.; Lv, K.; Zhao, Z.; Li, Z. Trade-offs, synergies and driving force analysis of ecosystem services in the Hanjiang River Basin based on the XGBoost-SHAP model. China Rural. Water Hydropower 2026, 97–105. Available online: https://irrigate.whu.edu.cn/CN/10.12396/znsd.2500375 (accessed on 20 May 2026).
  33. Li, T.; Zhi, R.C.; Zhang, C. Spatiotemporal Evolution Characteristics and Trade-off Synergy Relationships of Ecosystem Services in the Yanhe River Basin. J. Soil Water Conserv. 2026, 40, 120–131+143. [Google Scholar] [CrossRef]
  34. Wang, K.Y.; Wei, X.J.; Jia, M.L.; Pan, W.Y. Ecological efficiency of cultivated land use and its influencing factors in the Yangtze River Economic Belt based on ecosystem service value. Environ. Sci. 2026, 1–21. [Google Scholar] [CrossRef]
  35. Yang, Z.K.; Zuo, Q.T.; Bayin, J.; Qin, X.; Ji, Y.H. Spatiotemporal evolution and correlation analysis of water yield and carbon storage in the Qinhe River Basin based on InVEST model. Yellow River 2025, 47, 1–9. [Google Scholar] [CrossRef]
  36. Getis, A. Spatial autocorrelation. In Handbook of Applied Spatial Analysis: Software Tools, Methods and Applications; Fischer, M.M., Getis, A., Eds.; Springer: Berlin/Heidelberg, Germany, 2009; pp. 255–278. [Google Scholar] [CrossRef]
  37. Mei, Z.Y.; Zhang, Y.R.; Huang, X.Y.; Liu, Z.C. Ecological risk assessment based on ecosystem services and analysis of influencing factors of spatial heterogeneity in the Qinghai Lake Basin. Acta Ecol. Sin. 2024, 44, 4973–4986. [Google Scholar] [CrossRef]
  38. Dai, E.F.; Lu, R.R. Spatial and temporal distribution pattern and influencing factors of water yield service in the Qinghai-Tibet Plateau from 2000 to 2020. J. Northwest Norm. Univ. (Nat. Sci. Ed.) 2024, 60, 1–11. [Google Scholar] [CrossRef]
  39. Shao, Q.Q.; Fan, J.W.; Liu, J.Y.; Huang, L.; Cao, W.; Liu, L.L. Ecological effectiveness assessment of the first phase of the Three-River-Source Ecological Protection and Construction Project based on targets and policy recommendations. Bull. Chin. Acad. Sci. 2017, 32, 35–44. [Google Scholar] [CrossRef]
  40. Shao, Q.Q.; Liu, J.Y.; Huang, L.; Fan, J.W.; Xu, X.L.; Wang, J.B. Comprehensive ecological effectiveness assessment of ecological protection and construction projects in the Three-River-Source Nature Reserve from 2005 to 2009. Geogr. Res. 2013, 32, 1645–1656. [Google Scholar]
  41. Xu, Y.X. The ecological environmental protection and comprehensive management project of the Qinghai Lake Basin was officially launched. Qinghai Pratacult. 2008, 50. Available online: https://kns.cnki.net/kcms2/article/abstract?v=VfSiRbMmQk0ieBk8p9nzpwH-PzpYpofNj-6tSsztqMa842uGwY2hU3Js-37AFrHF9v9vlwLTaTiKwreZggxaPyCQ3C7cvcWAOCPgqdRSbJEJE06J_IOUartRtWL7wNo-gs1LvPM2LrA=&uniplatform=NZKPT&language=CHS (accessed on 20 May 2026).
  42. Hu, Y.Y.; He, X.G.; Li, G.X.; Yan, X.Z.; Wei, J.T.; Liu, H.; Cheng, W.; Hou, X.W. Quantitative separation of spatiotemporal patterns and driving factors of NEP in the terrestrial ecosystem of the Qinghai Lake Basin. J. Soil Water Conserv. 2025, 39, 254–266. [Google Scholar] [CrossRef]
  43. Zhang, B.; Zheng, L.; Wang, Y.; Li, N.; Li, J.; Yang, H.; Bi, Y. Multiscale ecosystem service synergies/trade-offs and their driving mechanisms in the Han River Basin, China: Implications for watershed management. Environ. Sci. Pollut. Res. 2023, 30, 43440–43454. [Google Scholar] [CrossRef]
  44. Cui, W.D.; Wang, H.X.; Sui, G.H.; Feng, R.; Yang, Y.X.; Yu, L.Z. Spatiotemporal changes and trade-off/synergy relationships of ecosystem services in the Yellow River source region. Chin. J. Eco-Agric. 2025, 33, 1012–1023. [Google Scholar] [CrossRef]
  45. Wang, Y.Q.; Sun, X.Y. Trade-off/synergy relationships and spatiotemporal heterogeneity of ecosystem services in the Yellow River Basin. Environ. Sci. 2025, 46, 972–989. [Google Scholar] [CrossRef]
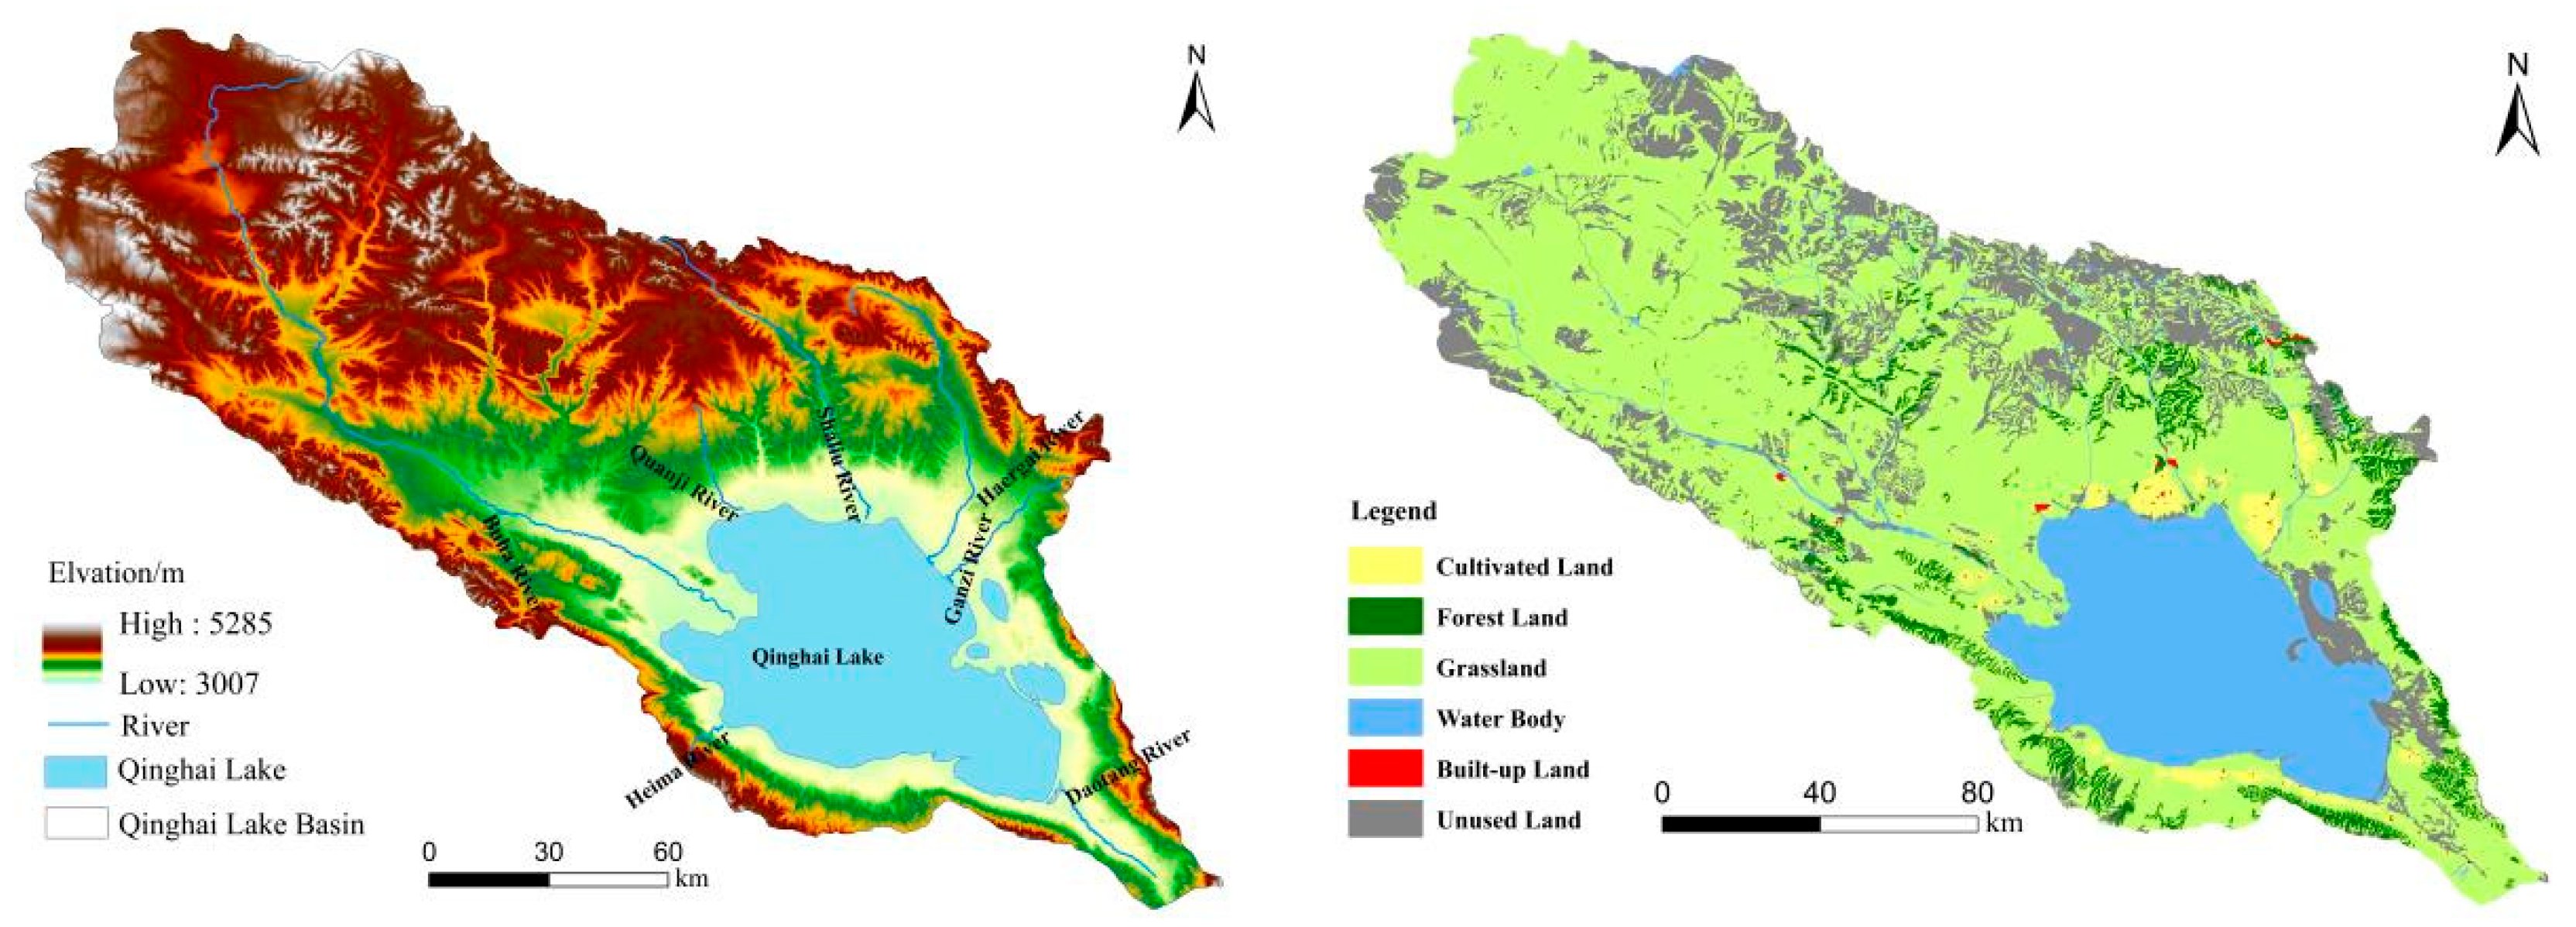
Figure 1. Study area topography and land use conditions in 2020.
Sustainability 18 05569 g001
Figure 2. Temporal–spatial characteristics of water yield in Qinghai Lake Basin (1995–2020).
Sustainability 18 05569 g002
Figure 3. Temporal–spatial characteristics of carbon storage in Qinghai Lake Basin (1995–2020).
Sustainability 18 05569 g003
Figure 4. Results of single-factor detection and interactive detection of water yield (X1: precipitation; X2: potential evapotranspiration; X3: temperature; X4: elevation; X5: slope; X6: aspect; X7: NDVI; X8: carbon storage; “*” symbol that the interaction factor detection results are statistically significant, enabling rapid identification of the reliable influence of key driving factors.).
Sustainability 18 05569 g004
Figure 5. Results of single-factor detection and interactive detection of carbon storage (X1: precipitation; X2: potential evapotranspiration; X3: temperature; X4: elevation; X5: slope; X6: aspect; X7: NDVI; X9: water yield; “*” symbol that the interaction factor detection results are statistically significant, enabling rapid identification of the reliable influence of key driving factors.).
Sustainability 18 05569 g005
Figure 6. Global Moran’s I index scatter plot.
Sustainability 18 05569 g006
Figure 7. Partial LISA cluster (CS: carbon storage; WY: water yield).
Sustainability 18 05569 g007
Table 1. Date Sources.
Data TypeData SourceSpatial Resolution
Land use dataThe Data Platform for Resources and Environmental Sciences, Chinese Academy of Sciences
(http://www.resdc.cn/) (accessed on 12 April 2025)
30 m
Annual precipitation dataNational Tibetan Plateau Data Center
(http://data.tpdc.ac.cn/) (accessed: 15 October 2025)
1000 m
Annual potential evapotranspiration data1000 m
Annual mean temperature data1000 m
Qinghai Lake Basin vector data/
Plant available water content dataEarth Resources Data Cloud
(http://www.gis5g.com/) (accessed on 11 March 2026)
1000 m
Maximum root burial depth data1000 m
Normalized Difference Vegetation Index (NDVI)NASA MOD13A3
(https://lpdaac.usgs.gov/) (accessed: 12 March 2026)
1000 m
Digital Elevation Model (DEM)Geospatial Data Cloud
(http://www.gscloud.cn/) (accessed on 7 November 2025)
30 m
SlopeDerived from DEM30 m
AspectDerived from DEM30 m
Carbon density dataLiterature collection/
Table 3. Input of driving factors for the OPGD.
Driving Factor CategoryIndependent Variable (X1–X9)
ClimatePrecipitation (X1)Potential evapotranspiration (X2)Temperature (X3)
TopographyElevation (X4)Slope (X5)Aspect (X6)
Underlying surfaceNDVI (X7)
OthersCarbon Storage (X8)Water Yield (X9)
Table 4. Optimal spatial discretization methods and numbers of intervals for each influencing factor of water yield (X1: precipitation; X2: potential evapotranspiration; X3: temperature; X4: elevation; X5: slope; X6: aspect; X7: NDVI; X8: carbon storage).
Influencing FactorOptimal Spatial Discretization MethodsNumber of Intervals
X1Equal7
X2Natural7
X3Standard Deviation6
X4Quantile6
X5Quantile7
X6Natural7
X7Geometric7
X8Geometric4
Table 5. Optimal spatial discretization methods and numbers of intervals for each influencing factor of carbon storage (X1: precipitation; X2: potential evapotranspiration; X3: temperature; X4: elevation; X5: slope; X6: aspect; X7: NDVI; X9: water yield).
Influencing FactorOptimal Spatial Discretization MethodsNumber of Intervals
X1Natural7
X2Geometric7
X3Geometric7
X4Quantile5
X5Geometric7
X6Standard Deviation5
X7Standard Deviation6
X9Natural7
Disclaimer/Publisher’s Note: The statements, opinions and data contained in all publications are solely those of the individual author(s) and contributor(s) and not of MDPI and/or the editor(s). MDPI and/or the editor(s) disclaim responsibility for any injury to people or property resulting from any ideas, methods, instructions or products referred to in the content.