2. Materials and Methods
2.1. Study Area
The study was carried out in a natural
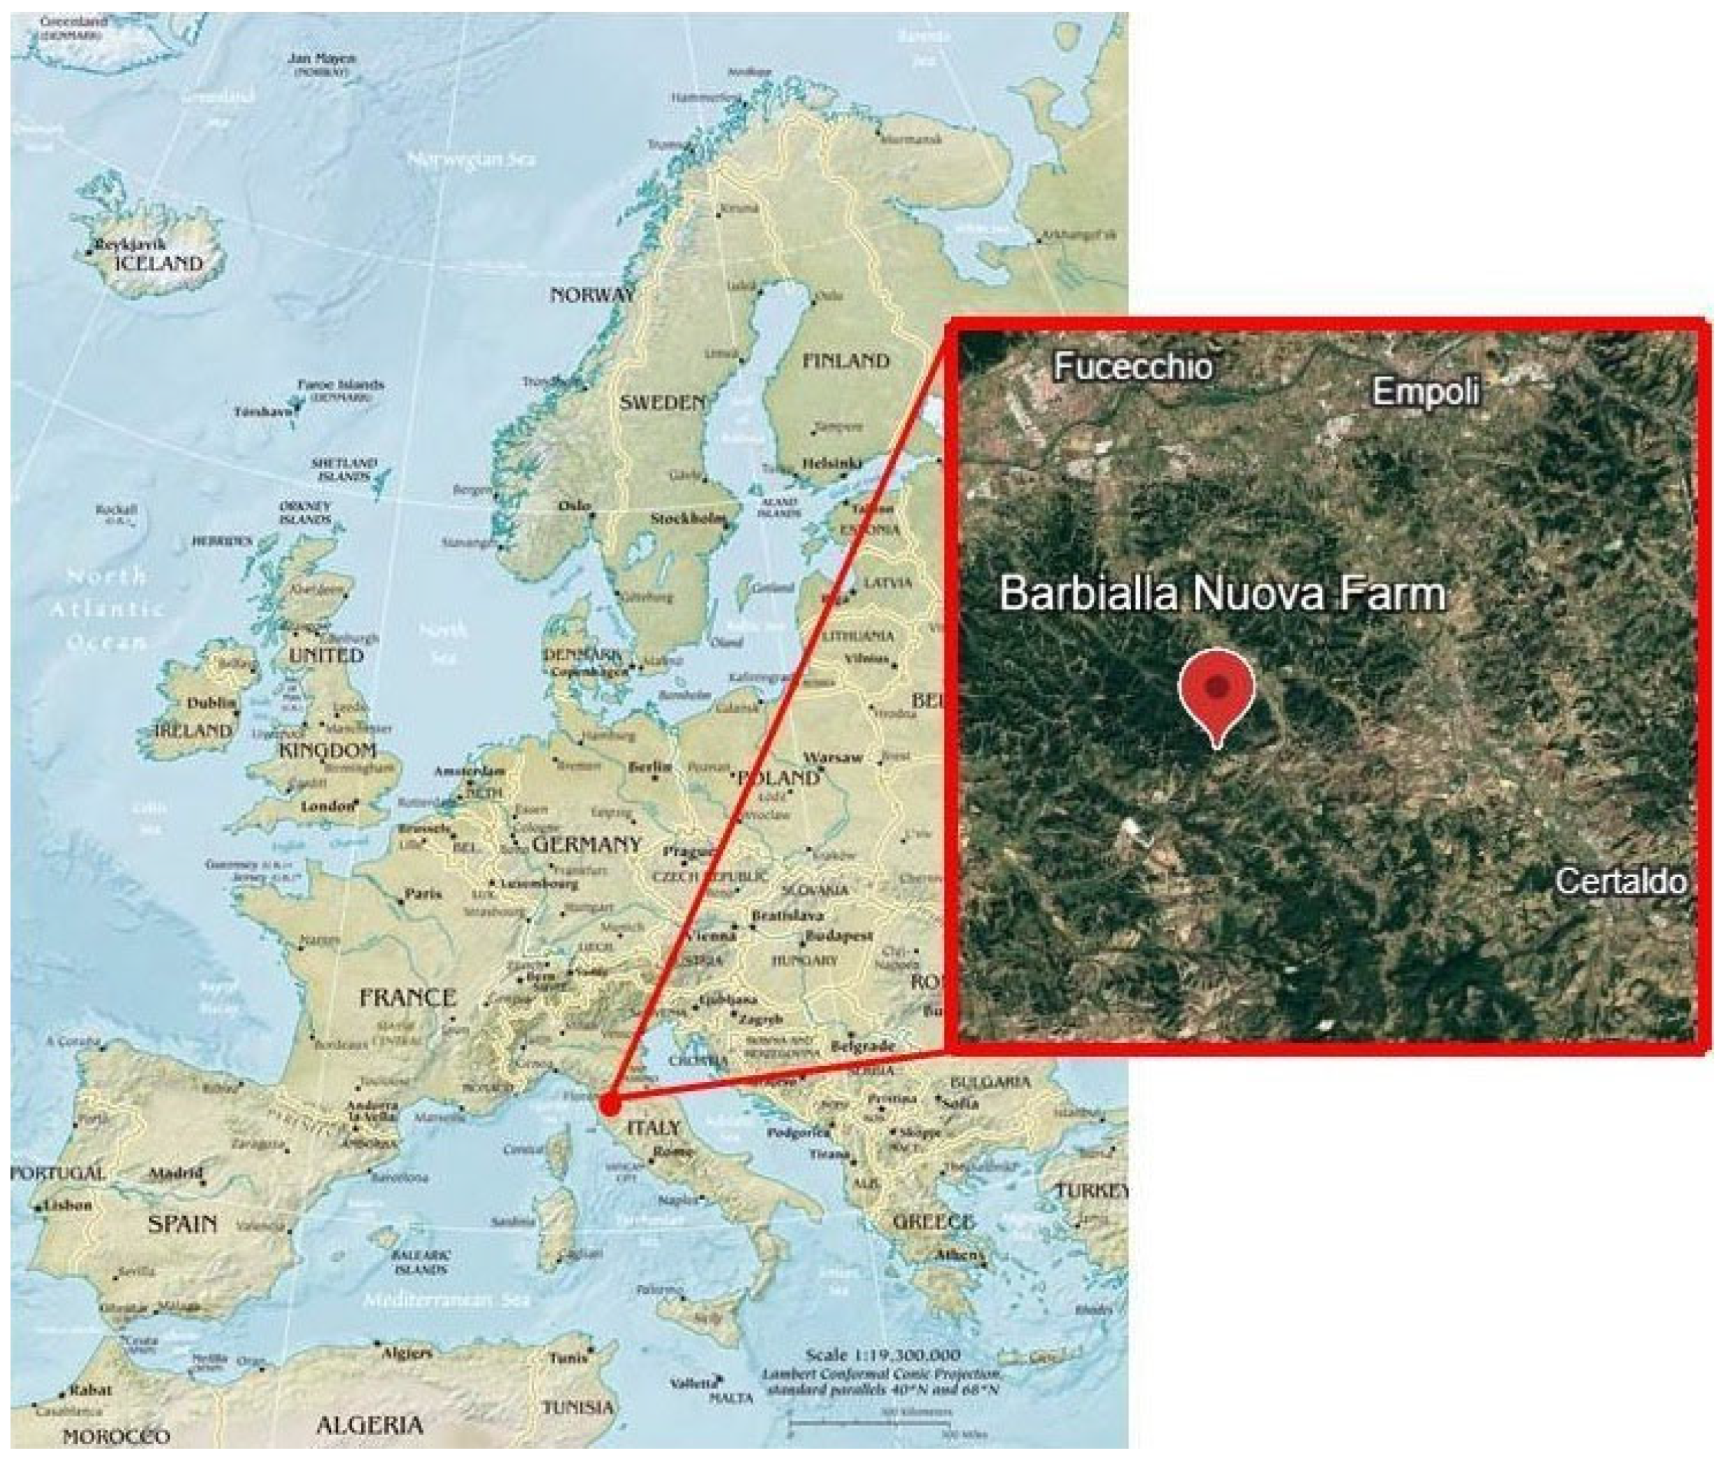
T. magnatum truffle ground located at Barbialla Nuova Farm, Montaione (Florence, central Italy; 43°35′30″ N, 10°50′55″ E), within the high-quality White Truffle production district of the San Miniato hills (
Figure 1). The experimental area extends over approximately 1.5 ha and was selected based on its favourable geopedological characteristics and long-standing truffle productivity, as documented during the interregional MAGNATUM project [
32].
The site is characterized by a heterogeneous topography at an average elevation of about 150 m a.s.l., with a northeast-facing slope of moderate gradient. From a geological perspective, the area is underlain by Pliocene marine sediments, consisting mainly of sandy deposits interspersed with thin clay layers. The upper part of the slope includes sub-flat terraced areas, reflecting historical agricultural land use.
Vegetation is dominated by hop hornbeam (Ostrya carpinifolia Scop.), white poplar (Populus alba L.), and field maple (Acer campestre L.), with tree canopy cover ranging from 40% to 85%. The shrub layer covers approximately 30% of the area and is mainly composed of Cornus mas L., C. sanguinea L., Crataegus monogyna Jacq., Fraxinus ornus L., Ostrya carpinifolia, Pyracantha coccinea M. Roem., and Rubus canescens DC. Hedera helix L. and Lonicera caprifolium L. occur in both shrub and herbaceous layers, with H. helix locally forming dense ground cover. The herbaceous layer is species-rich and includes Anagallis arvensis L., Brachypodium sylvaticum (Huds.) P.Beauv., Ranunculus lanuginosus L., Rubia peregrina L., Sanicula europaea L., Tamus communis (L.) Caddick & Wilkin, Torilis arvensis (Huds.) Link, and violets (Viola alba Besser and V. reichenbachiana Jord. ex Boreau).
Soil analyses (
Table 1) of topsoil (0–20 cm) revealed alkaline conditions, with pH values ranging from 8.1 to 8.2 and total CaCO
3 contents between 4.5% and 6.1%, which are consistent with the ecological requirements of
T. magnatum. These values derive from topsoil sampling performed within two representative areas of the truffière previously identified during the MAGNATUM project, corresponding to the plots where the irrigation experiment was conducted, and are reported as mean values of the analysed samples.
A comprehensive pedological characterization of the study area, including soil classification and full profile description, is reported in [
32], based on a representative soil profile sampled within the same truffle ground under the MAGNATUM project.
2.2. Field Experimental Design and Climate Stress Assessment
A Before–After–Control–Impact (BACI) framework [
33] was adopted to assess the effects of irrigation, applied as a mitigation strategy against climate-related stressors—particularly increased temperature and summer drought—on
Tuber magnatum within the studied truffière. The BACI approach allows temporal changes observed in impacted plots to be compared with those occurring in control plots, by testing the interaction between time (before vs. after) and treatment (control vs. irrigated) [
33].
In this study, the “before” period corresponds to pre-irrigation sampling campaigns carried out in February and May 2013, while the “after” period includes post-irrigation sampling conducted in August and December 2013. This temporal framework was applied exclusively to soil T. magnatum DNA amount, for which repeated measurements were available across all plots. Conversely, for truffle production, no pre-treatment data were available at the plot scale; consequently, the production-related analysis was kept strictly independent of the BACI framework and treated solely as a post-treatment spatial comparison among the experimental groups.
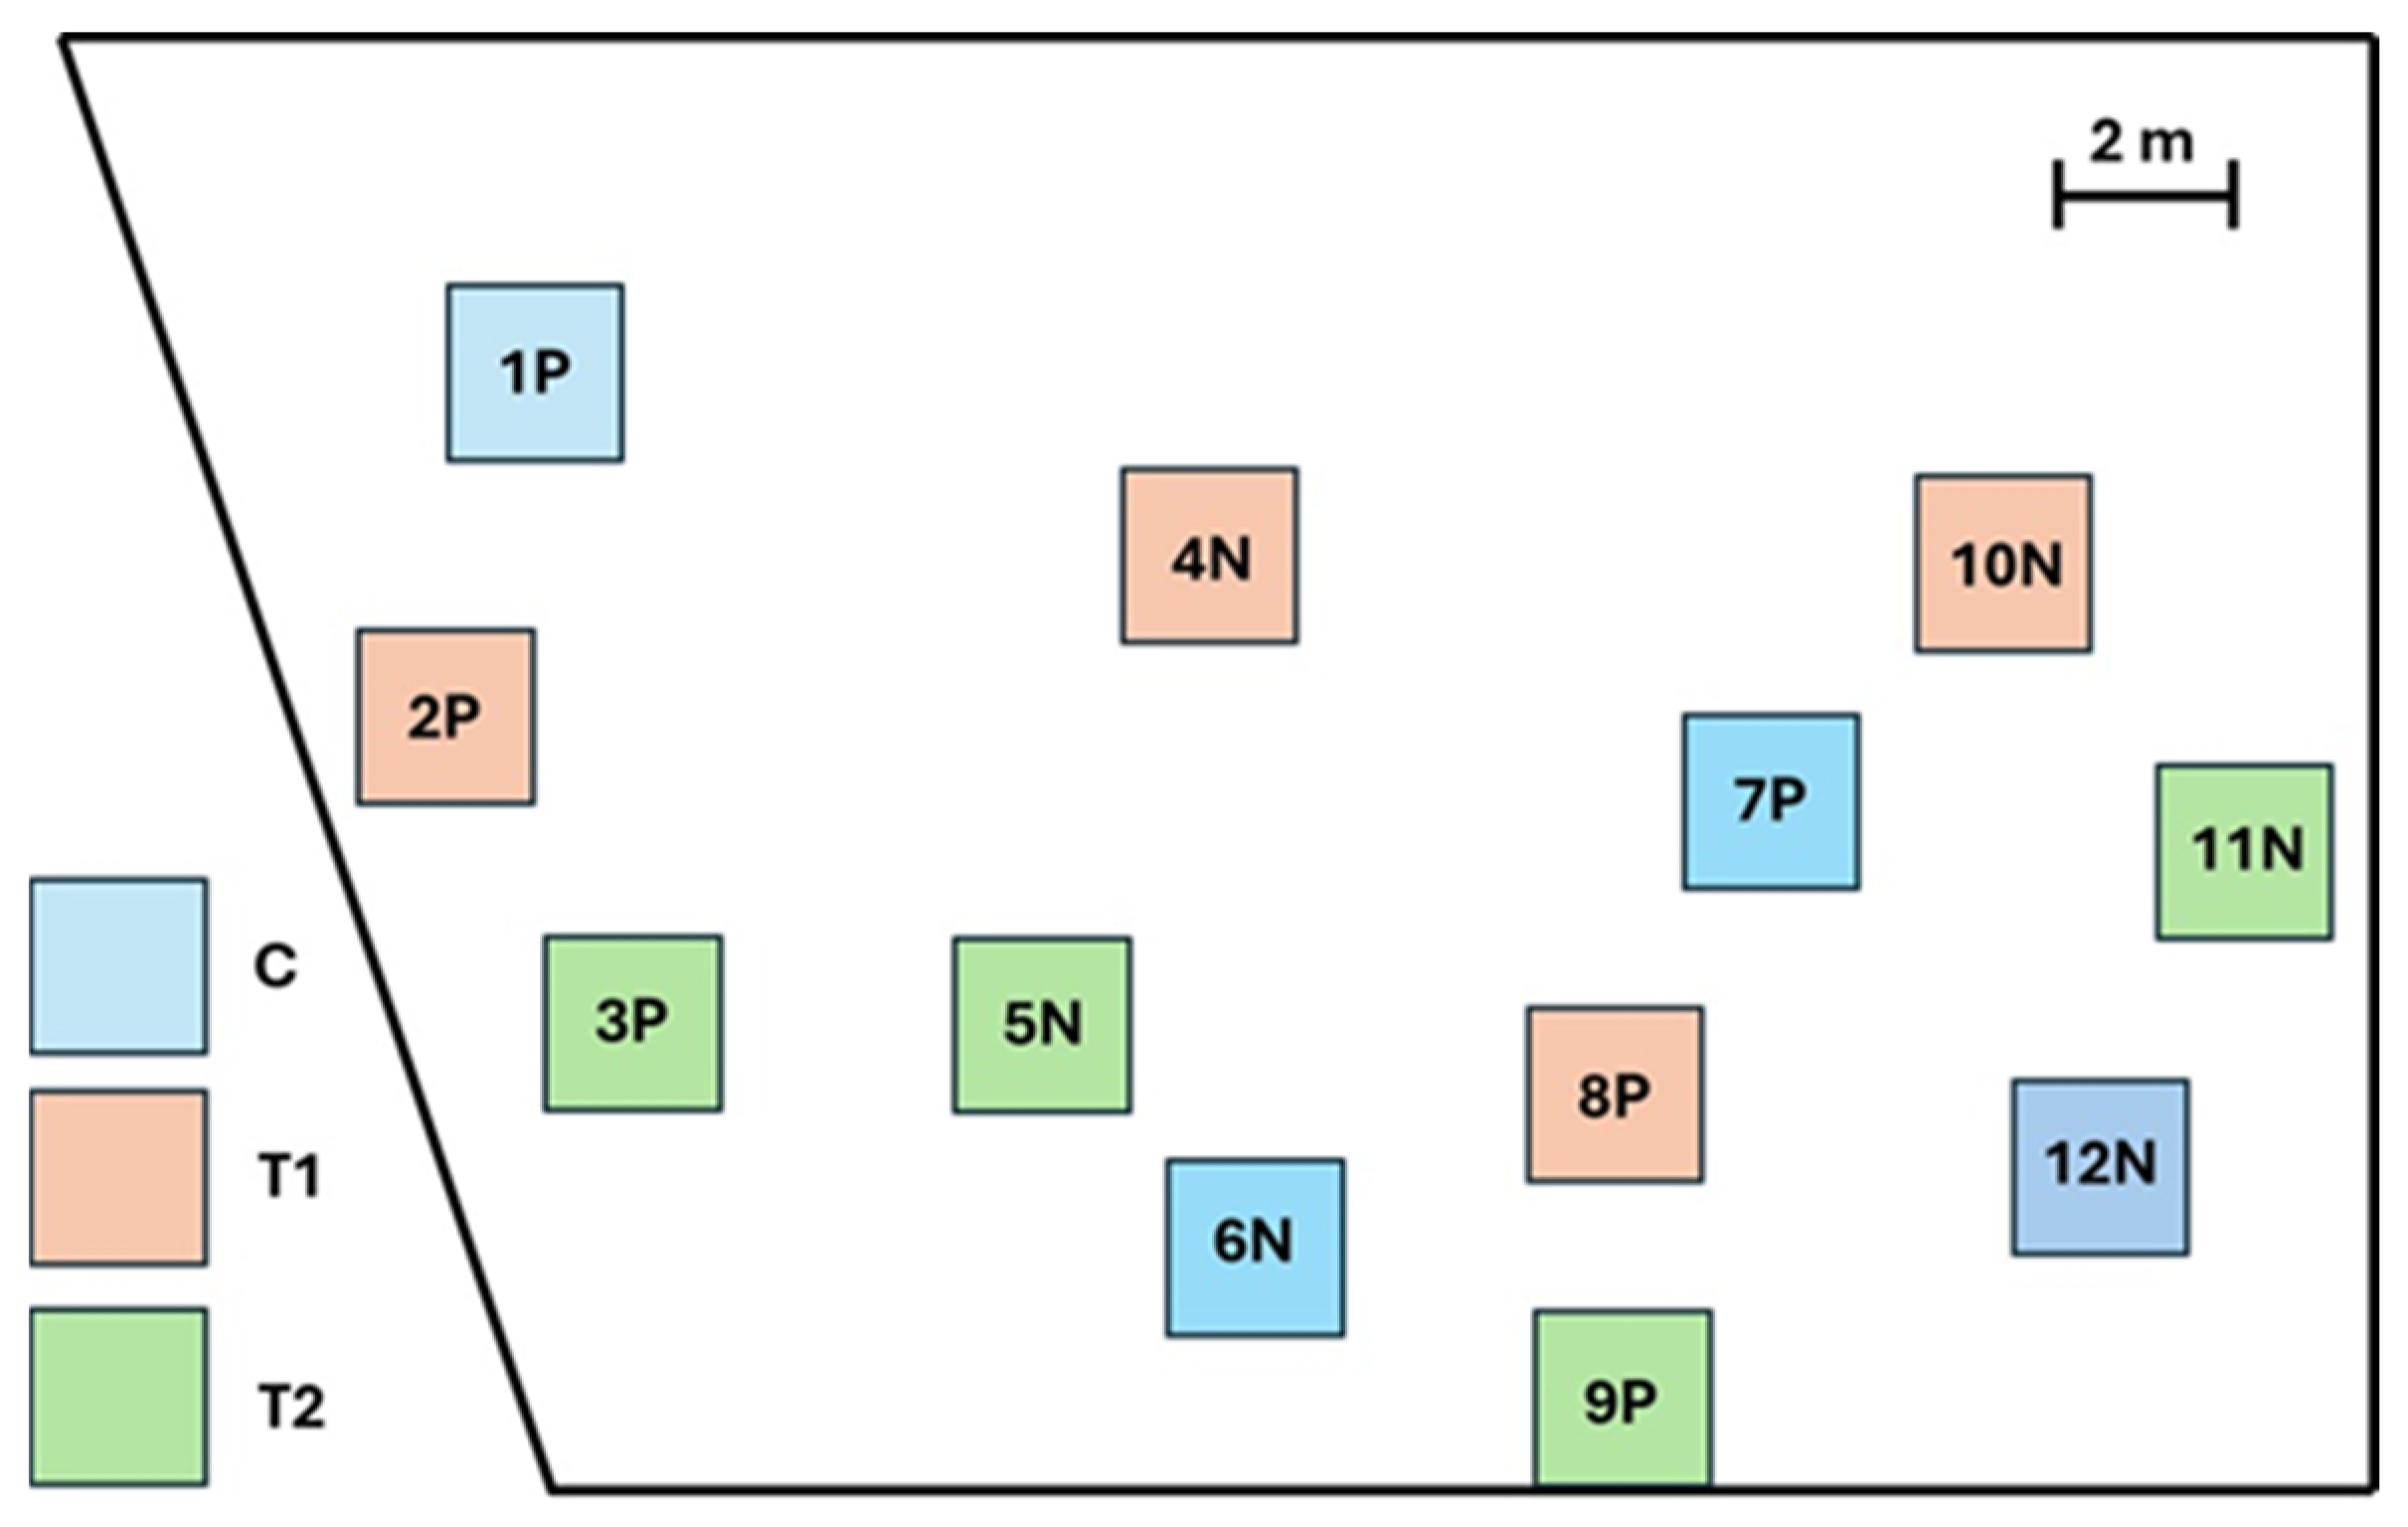
To implement the experimental design, twelve plots (approximately 4 m
2 each) were established in areas homogeneous in terms of vegetation structure and soil characteristics (
Figure 2). The plots were randomly assigned to three treatments: four plots subjected to a higher irrigation level (T1), four plots receiving a lower irrigation level (T2), and four untreated plots serving as controls (C). Irrigation was applied during July and August 2013, corresponding to the period of maximum water deficit in Mediterranean environments.
Irrigation scheduling and water volumes were defined based on rainfall patterns observed during the most productive years between 2008 and 2011. Irrigation was applied using manual sprinkler systems, with each event lasting approximately 8 min and delivering a water depth of about 15 mm. Applications were carried out at approximately 1 m above ground level, generally during morning hours under calm weather conditions to minimize spray drift toward adjacent plots.
In the T1 treatment, four irrigation events were applied (3 July, 26 July, 5 August, and 16 August 2013), whereas in T2 only two events were performed (26 July and 16 August 2013). Control plots received no irrigation. To prevent disturbances from wild fauna and ensure experimental integrity, the study area was enclosed with an electric fence.
Soil moisture and temperature were monitored using probes installed at 20 cm depth within representative plots (7PC, 8PT1, and 9PT2). Measurements were recorded hourly using ECH2O sensors connected to an EN50 data logger (Decagon Devices, Pullman, WA, USA), enabling continuous monitoring and real-time data transmission.
2.3. Soil–Plant–Atmosphere Water Balance Modelling for Irrigation Management
To support the development of a process-based model describing the main physical and hydrological interactions within the soil–vegetation–atmosphere continuum, meteorological and pedological data were integrated to quantify water fluxes and irrigation requirements of the studied
T. magnatum truffière. Thermopluviometric data were collected from the Peccioli meteorological station (140 m a.s.l., 10 km from the study site) for the period 2001–2012 (
www.sir.toscana.it, accessed on 3 April 2014), selected among available stations due to its altimetric and geomorphological similarity to the study area. While air temperature data were obtained from the Peccioli station, precipitation records were complemented with data from the Fornacino station (San Miniato, PI, 12 km from the study site) to improve the representation of summer rainfall events and soil moisture dynamics observed during the MAGNATUM project.
A daily soil–vegetation–atmosphere water balance model was implemented following the FAO 56 conceptual framework [
34,
35], in continuity with previous modelling activities conducted at the study site [
36]. In the earlier application, the model was parameterized using data from a representative soil profile and was applied to simulate soil water dynamics at the scale of the entire forest stand, with the primary objective of evaluating model performance. In the present study, the same conceptual framework is retained but parameterized using site-specific topsoil and vegetation data from the truffle-producing area, allowing a targeted simulation of soil water dynamics and the estimation of irrigation requirements under experimental conditions.
The model represents water fluxes within a single soil–plant–atmosphere continuum and computes the root zone water balance assuming an effective soil depth of 70 cm, corresponding to the active soil layer relevant for truffle mycelium and host plant interactions. The daily water balance is expressed as:
where V is the soil water content of the root zone; P is precipitation; IF is canopy interception; I is irrigation input; RO is surface runoff; ETcₐ is actual evapotranspiration; and DP is deep percolation. All terms are expressed as equivalent water depths, and the subscript t refers to the daily time step.
Canopy interception was estimated using the formulations proposed by Von Hoyningen Hüne (1983) and Braden (1985) [
37,
38]. Leaf area index (LAI) and canopy cover fraction were derived using an extinction coefficient of k = 0.9, consistent with dense deciduous forest canopies. Reference evapotranspiration (ET
0) was computed using the Hargreaves equation, owing to the limited availability of complete meteorological variables (solar radiation and wind speed). Actual evapotranspiration was subsequently estimated as a function of ET
0, soil water availability, and vegetation characteristics.
Soil physical and hydraulic parameters were derived from site-specific soil sampling conducted within the MAGNATUM project [
32]. Volumetric soil water content at field capacity (θFC) and wilting point (θWP) were estimated using pedotransfer functions following [
33], based on measured soil texture, organic carbon content, and bulk density. Total Available Water (TAW), defined as the maximum amount of water extractable by vegetation from the root zone, was calculated as:
where Zr is the effective rooting depth. The effective root zone depth (Zr = 70 cm) represents the soil layer explored by arboreal roots, as derived from pedological descriptions. Consistent with the FAO-56 approach, soil moisture is treated as a profile-averaged quantity. Measurements at 20 cm depth were used as a proxy for temporal soil moisture dynamics, acknowledging that they represent near-surface conditions rather than the full vertical distribution. Field capacity and wilting point correspond to matric potentials of −100 cm and −15,000 cm, respectively, reflecting soil water retention characteristics relevant to plant uptake.
2.4. Assessment of Truffle Production and T. magnatum DNA Amount in the Soil
Truffle production was monitored weekly from September to December 2013, for a total of 16 surveys, using trained truffle dogs. All harvested ascocarps were individually labelled, weighed, and assigned to their respective experimental plots.
The assessment of soil
T. magnatum DNA amount, used as a proxy for mycelial biomass, was based on 144 soil samples (12 plots × 4 sampling times × 3 biological replicates), collected both before irrigation (February and May 2013;
n = 72) and after irrigation (August and December 2013;
n = 72). Within each plot, five equidistant soil cores (30 cm in depth, 16 mm in diameter) were taken along two diagonal transects. To minimize edge effects, a peripheral buffer zone was excluded from sampling (
Figure 3).
For each plot and sampling interval, the five cores were pooled into a single composite sample. During this process, visible roots, stones, and litter were carefully removed under a stereomicroscope. The resulting 48 composite samples were stored at 4 °C and processed within 24 h of collection. To prepare for molecular analysis, samples were frozen at −80 °C and subsequently lyophilized for 72 h using a VaCo 5 freeze dryer (Zirbus Technology, Bad Grund, Germany). Post-lyophilization, the soil was ground and homogenized in a mortar, passed through a 1 mm sieve, and stored at room temperature. Three biological replicates (1 g lyophilized soil each) were prepared for each composite sample. DNA extraction and qPCR quantification of
T. magnatum DNA amount were performed following the protocol described by [
39]. Briefly, total genomic DNA was extracted using a CTAB-based method and purified with a Nucleospin Plant II kit (Macherey-Nagel, Düren, Germany). Quantitative real-time PCR (qPCR) was performed using the primer pair TmgITS1for–TmgITS1rev and the TaqMan probe TmgITS1prob. Thermal cycling conditions consisted of an initial denaturation at 95 °C for 10 min, followed by 45 cycles at 95 °C for 15 s, 60 °C for 30 s, and 72 °C for 30 s. Fluorescence thresholds were automatically determined using the adaptive baseline algorithm of MXPro software (version 4.10; Agilent Technologies, Santa Clara, CA, United States), and cycle threshold (Ct) values were converted to
T. magnatum DNA quantities using the standard curve method. For each qPCR run, a standard curve was generated from tenfold serial dilutions of
T. magnatum genomic DNA, ranging from 10
7 to 10
2 fg per reaction. DNA of
T. magnatum was extracted from 20 mg of immature lyophilized ascocarp using the DNeasy Plant Mini Kit (Qiagen, Hilden, Germany) following the manufacturer’s instructions for fungal material.
2.5. Statistical Analysis
T. magnatum DNA abundance data were analysed using a Linear Mixed Model (LMM) to account for the hierarchical structure of the experimental design and potential random effects. This analysis was performed in R software (version 4.5.1; R Core Team, Vienna, Austria) using the lme4 package (version 2.0.1; Bates et al.) for model fitting. The lmerTest package (version 3.2.1; Kuznetsova et al.) was applied to compute p-values based on Satterthwaite’s approximation, and the emmeans package (version 2.0.3; Lenth) was used for estimated marginal means and post hoc pairwise comparisons.
Subsequently, temporal changes in soil T. magnatum DNA abundance between control and irrigated plots were analysed using the BACI framework, testing the significance of the time × treatment interaction. In contrast, given the absence of baseline pre-treatment data at the plot scale, differences in truffle production (number of ascocarps and total fresh weight) were evaluated independently using a standard one-way analysis of variance (ANOVA) to compare the post-treatment outcomes across the experimental groups. When significant effects were detected, Tukey’s HSD post hoc test was used for pairwise comparisons.
Data normality was assessed using the Shapiro–Wilk test, while homogeneity of variances was verified with Levene’s test [
40]. Statistical analyses were performed using XLSTAT software version 7.5.2 (Addinsoft, Paris, France).
3. Results
3.1. Interannual Variability of Climate and Truffle Production
To quantify irrigation requirements for the experimental area, thermopluviometric data from 2001–2012 were compared with
T. magnatum production records provided by the truffière owners at Barbialla Nuova farm. This comparison revealed marked interannual variability in truffle fruiting, closely associated with variations in temperature and soil moisture conditions (
Supplementary Materials Table S1).
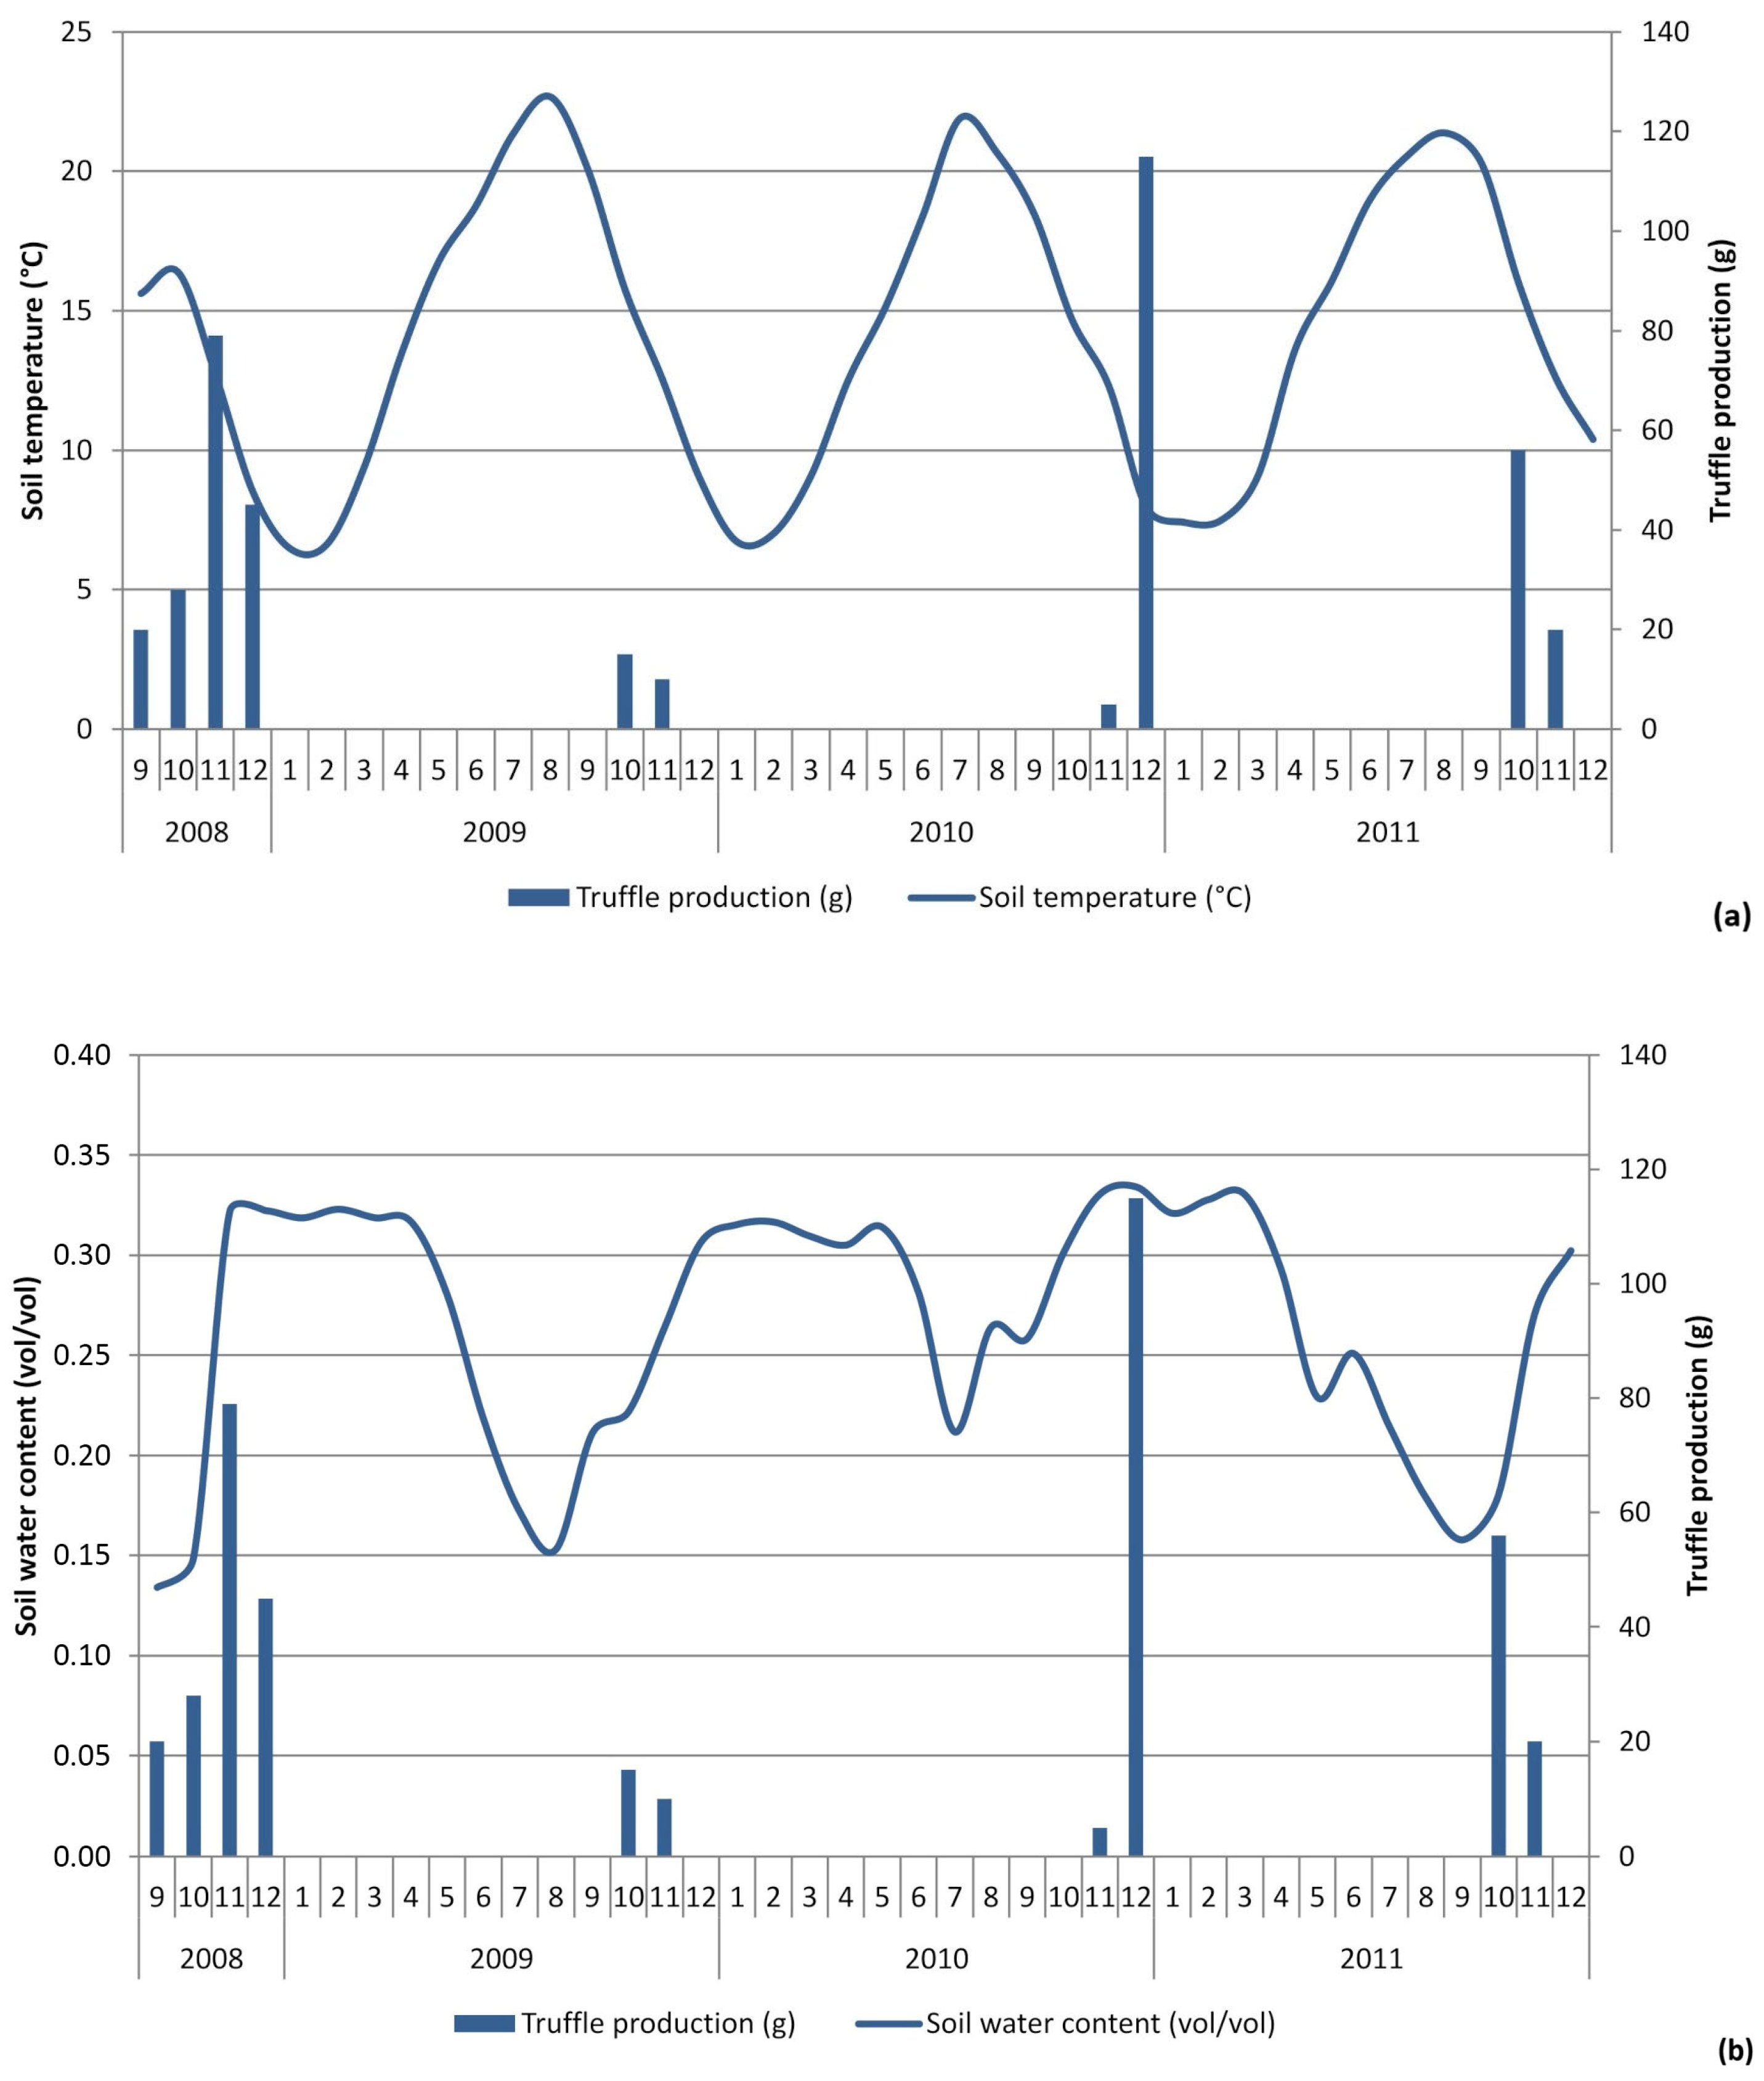
According to farm-scale records, yields were excellent in 2003 and very good in 2007 and 2010, whereas markedly low production occurred in 2004, 2008, and 2011. Sensor-based measurements collected during 2008–2011 indicate that fruiting takes place in autumn, coinciding with periods of soil water recharge, with average soil moisture around 25% and temperatures near 13 °C (
Figure 4). In contrast, years characterized by prolonged summer drought showed persistently low soil moisture over several consecutive months, leading to substantial reductions in truffle production.
3.2. Identification of Reference Soil Moisture Conditions
Among the monitored years, 2010 exhibited comparatively wetter conditions and higher yields. Due to the combination of favorable soil moisture patterns, high truffle production at the farm scale, and the availability of continuous soil moisture observations, this year was selected as the reference for defining target soil moisture conditions. The temporal soil moisture pattern observed in 2010 was therefore used as a reference target in subsequent irrigation simulations.
The reference year was not intended to represent an absolute optimal state, but rather a realistic soil moisture regime empirically associated with favourable production under natural conditions. Given the intrinsic complexity of truffle ecosystems and the limited availability of long-term quantitative yield data, this target-based approach provides a practical framework for irrigation management aimed at reducing severe water stress.
3.3. Model Performance and Validation
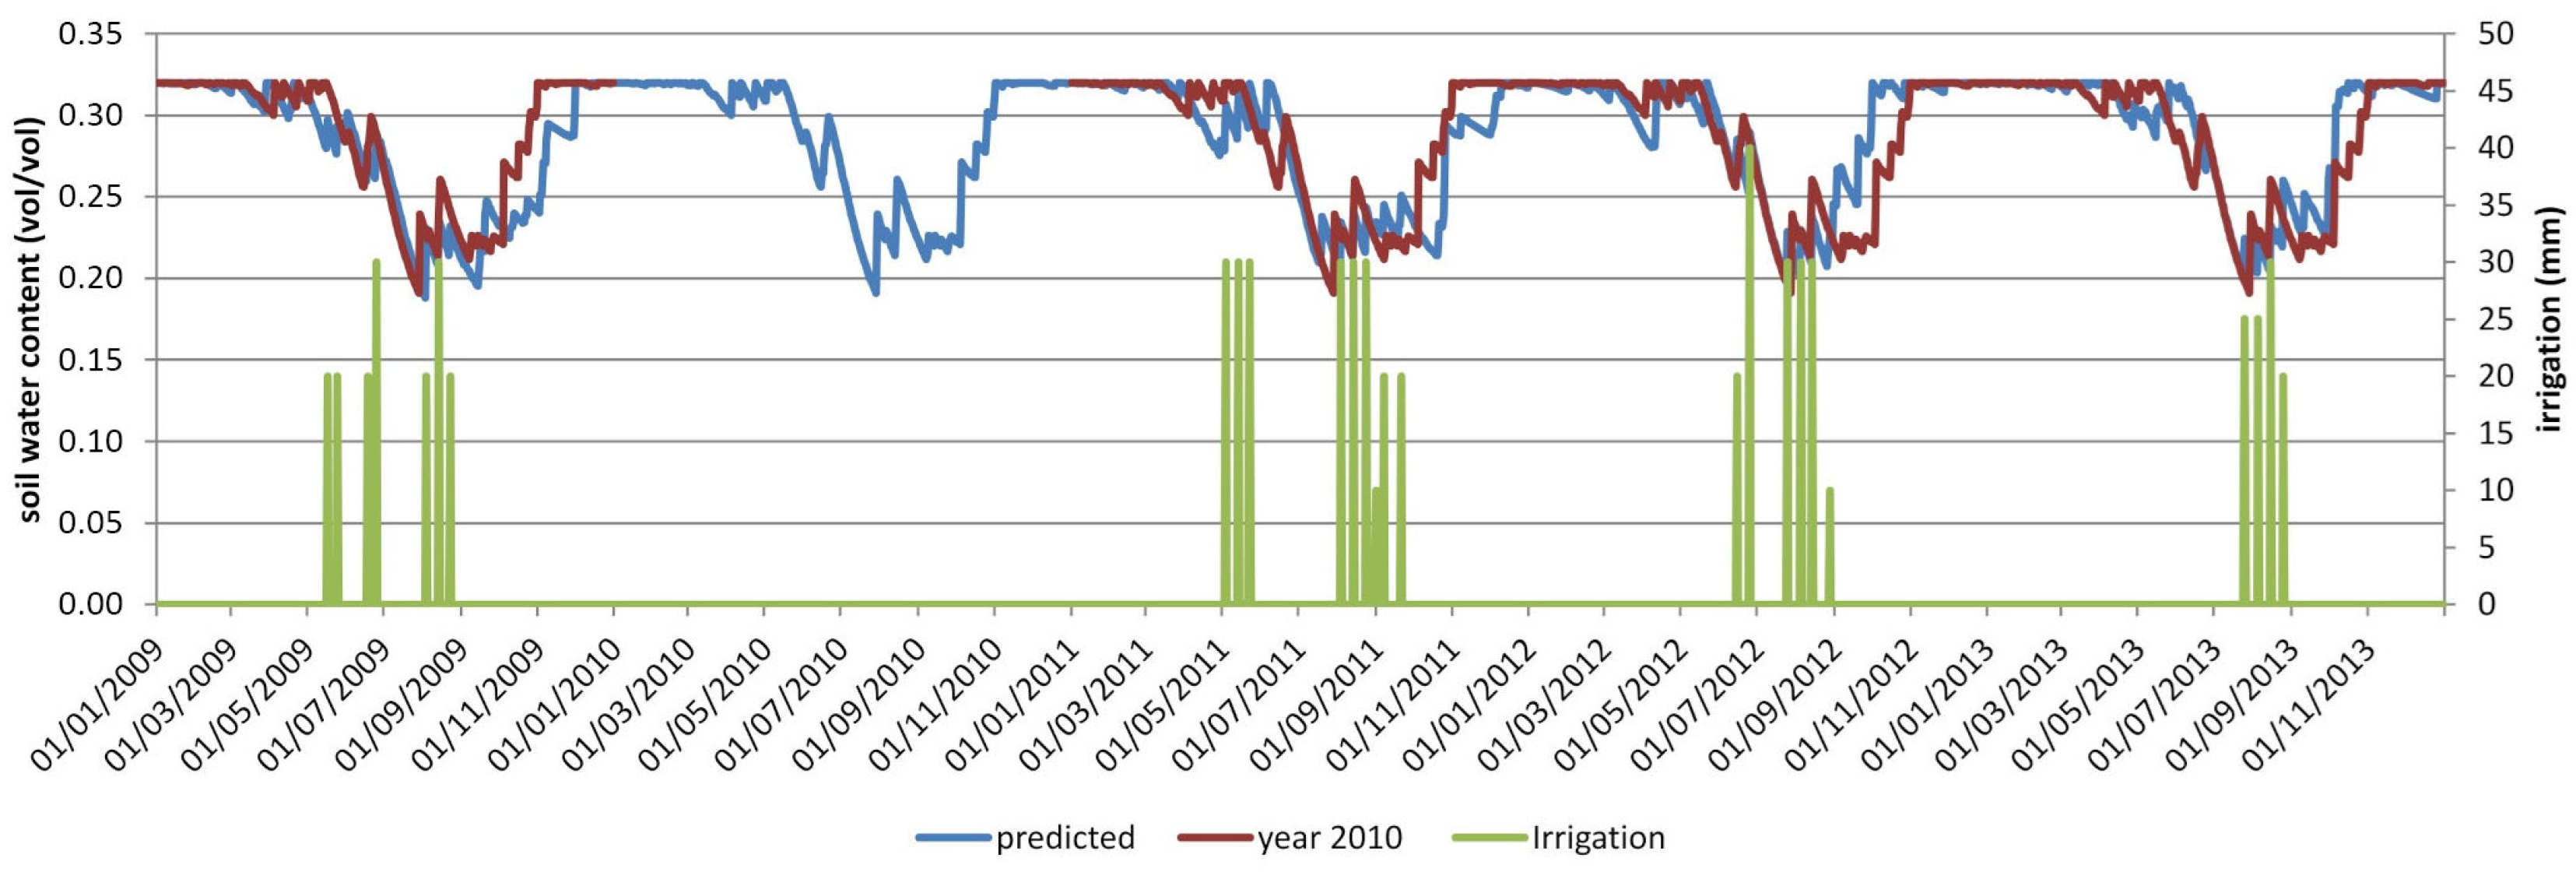
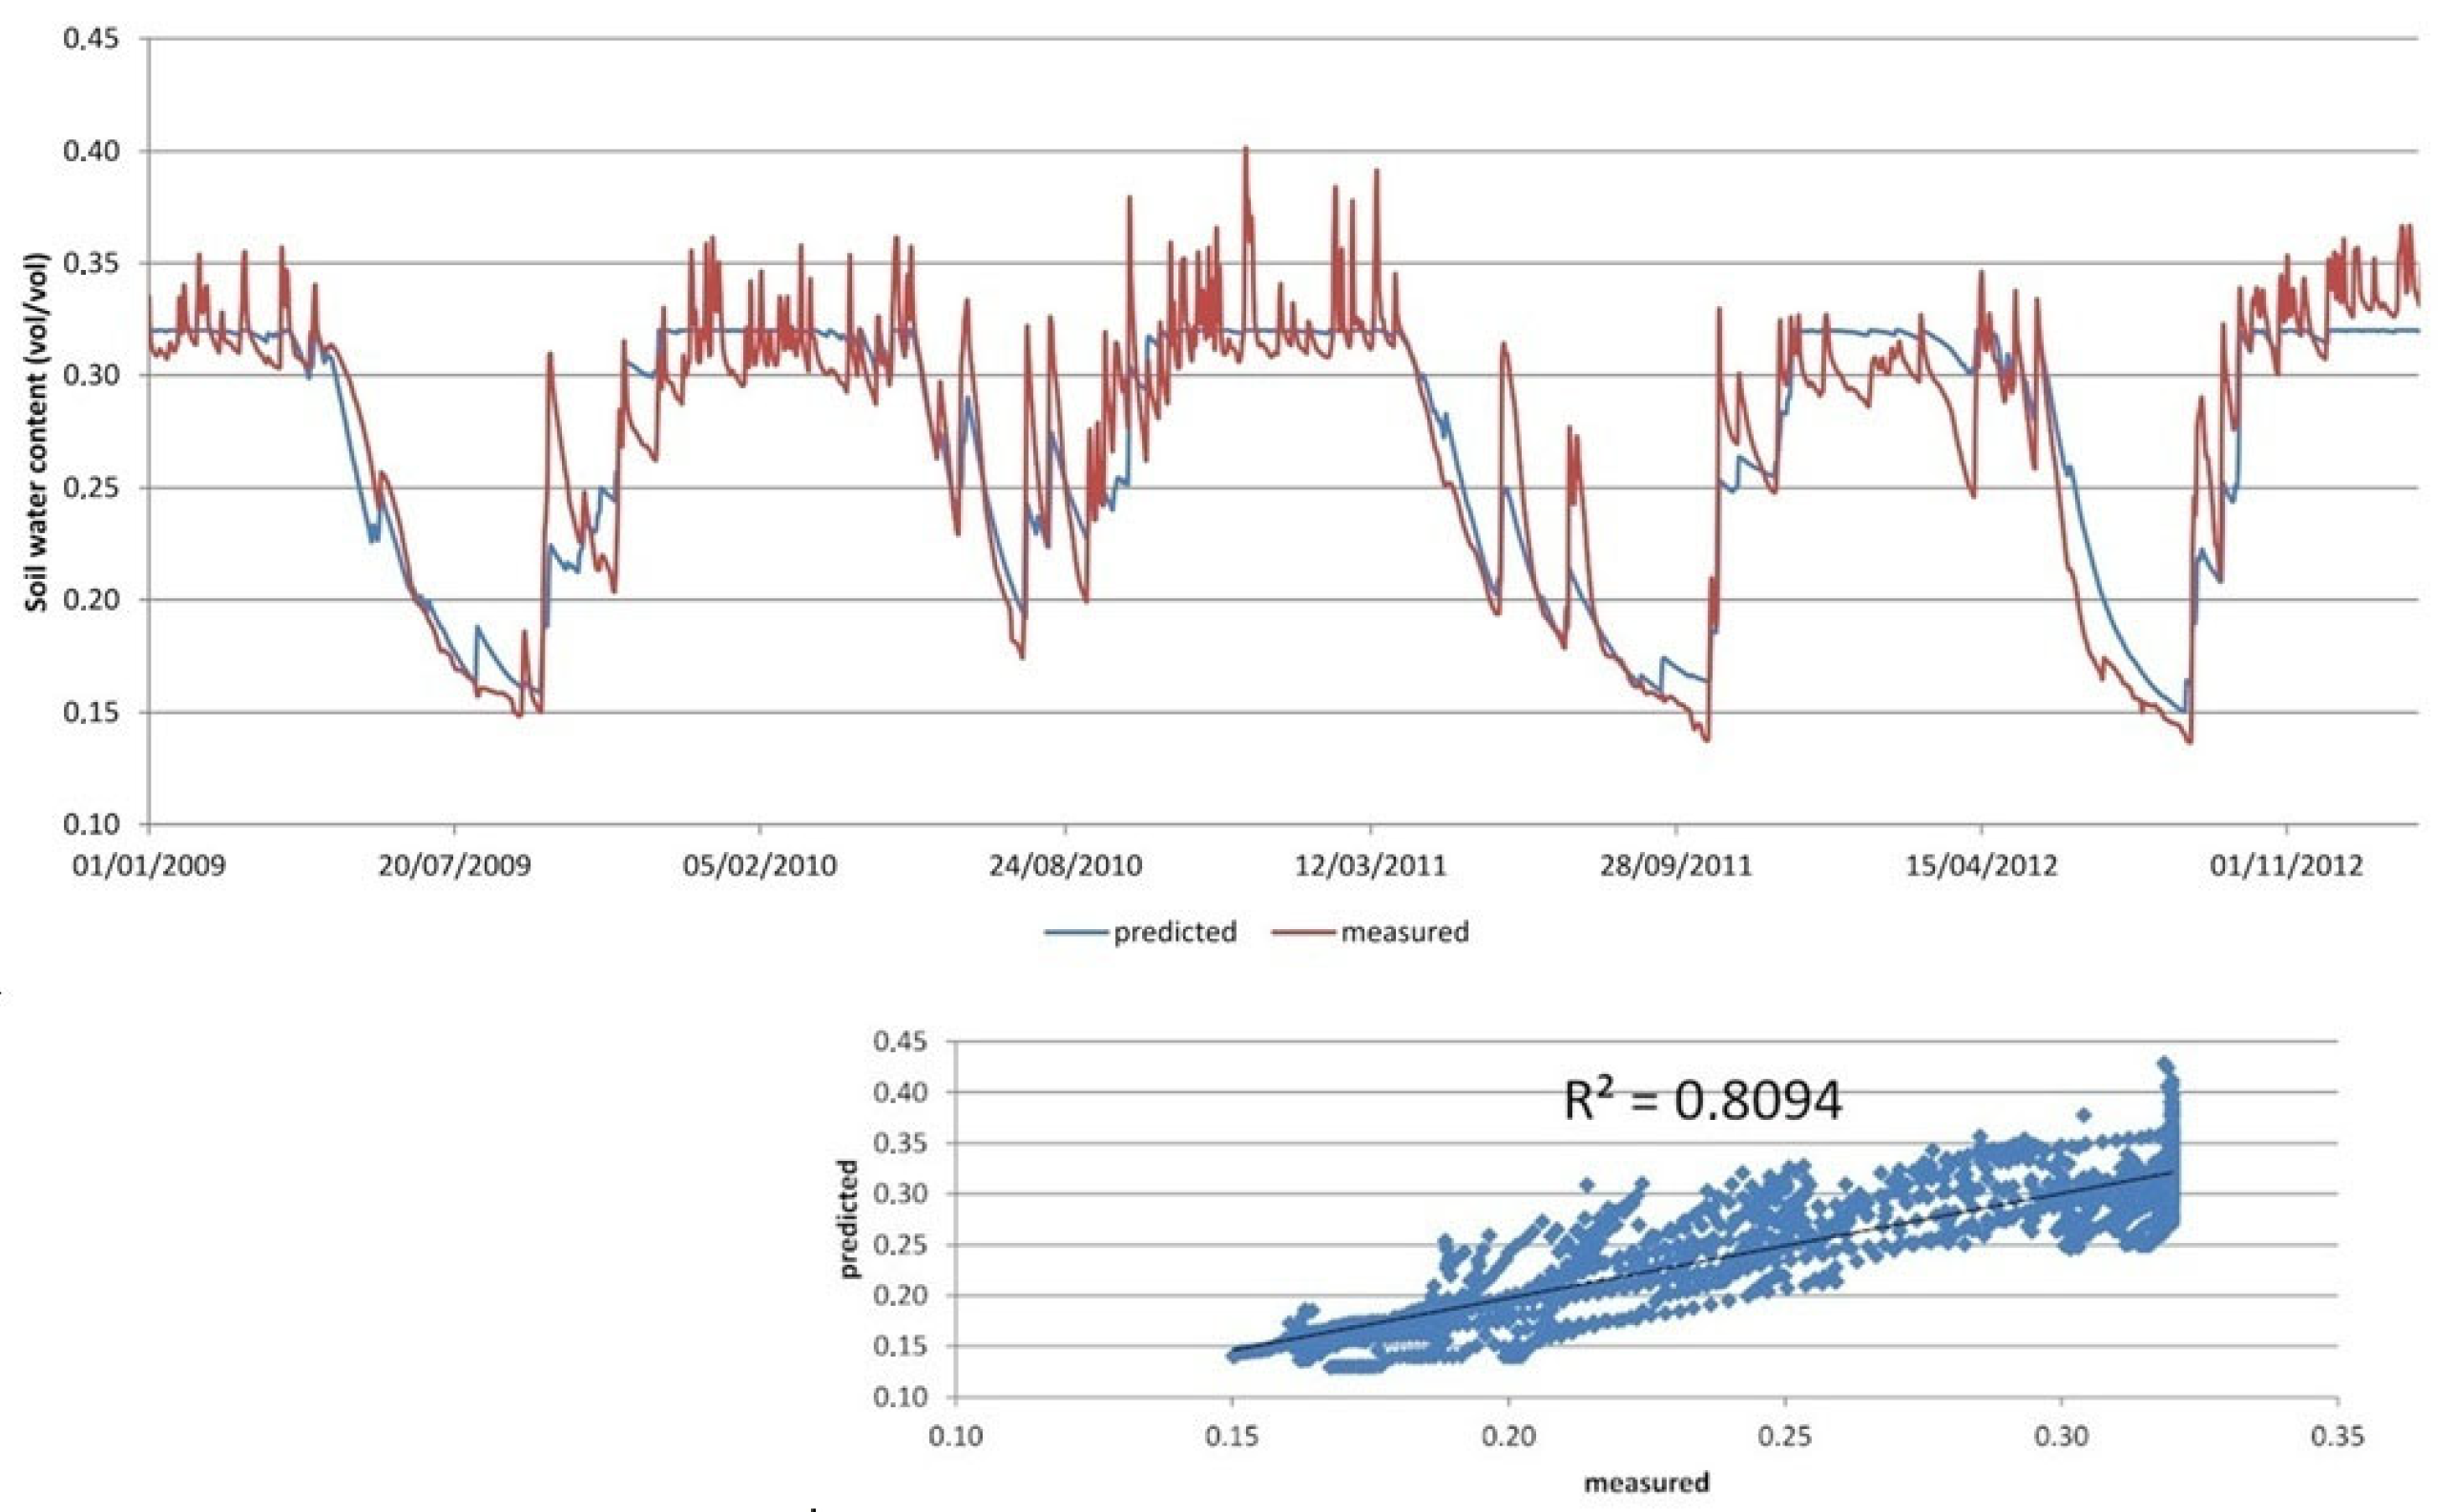
Model simulations for the 2009–2012 period reproduced the main seasonal dynamics of the soil–plant–atmosphere system (
Figure 5), including autumnal soil rewetting, progressive depletion during spring and summer, and responses to episodic rainfall events.
Model performance was further evaluated using standard error metrics. Across the 2009–2013 period, the model showed a mean absolute error (MAE) of 0.021 m3 m−3 and a root mean square error (RMSE) of 0.028 m3 m−3, with a negligible mean error (ME = 0.00018 m3 m−3), indicating the absence of systematic bias. The coefficient of determination (R2) was 0.81 (N = 1826), confirming a good agreement between simulated and measured soil moisture values.
The agreement between observed and simulated soil moisture was generally satisfactory, although a lower fit was observed for 2013. In that year, soil probes were relocated to different plots within the truffière to monitor the experimental areas, likely introducing variability due to differences in canopy cover and local soil properties that may have produced unreliable values in the first months of observation. This is supported by the consistently lower winter soil moisture observed in these plots compared to previous years.
3.4. Simulated Irrigation Requirements
A daily soil water balance model, calibrated using soil moisture observations, was applied to the 2009–2012 period to simulate soil moisture dynamics under observed climatic conditions. Irrigation requirements were then estimated by introducing water inputs whenever simulated soil moisture fell below the corresponding values of the 2010 reference trajectory, with the objective of minimizing deviations between the two profiles over time.
Irrigation was simulated as discrete events of fixed depth (25–30 mm), and their timing and frequency were determined iteratively by the model on a daily time step. The resulting irrigation requirements were subsequently aggregated into 10-day periods for interpretation (
Figure 6) and into monthly and annual totals (
Table 2).
Table 2 summarizes these cumulative irrigation volumes, showing that irrigation was required as early as late spring in 2009 and 2011, while August consistently represented the period of highest water demand.
For this specific soil type and the use of sprinkler irrigation, interventions of 25–30 mm were considered in the simulation.
The simulations indicate that soil moisture deficits may occur as early as May–June in dry years, requiring one or two irrigation events of 20–25 mm. During July and August, prolonged drought periods exceeding 30–40 days can critically affect truffle survival; under such conditions, three irrigation events of approximately 30 mm, spaced at 10-day intervals, are required, particularly in August. Irrigation in September is generally unnecessary, although it may be beneficial under exceptionally hot and dry conditions.
3.5. Field Irrigation Experiment
In 2013, irrigation was managed in real time based on monitored soil moisture conditions. Irrigation was applied whenever the mean soil moisture of the current 10-day period fell below the corresponding value of the 2010 reference trajectory. However, operational constraints in the forest environment limited both the frequency and the amount of water applied, preventing full adherence to the simulated irrigation schedule. Irrigation events of approximately 15 mm were applied, representing a compromise between simulated optimal volumes and operational constraints. In treatment T1 (higher irrigation level), four irrigation events of 15 mm each were applied, whereas in T2 (lower irrigation level), two events were carried out.
Although irrigation volumes in the field were constrained by practical limitations, the simplified soil water balance model, calibrated using five years of soil moisture observations, proved effective in reproducing soil moisture dynamics within the truffière. The model allows for the identification of seasonal wet and dry periods and provides a quantitative, albeit approximate, estimate of the irrigation requirements needed to mitigate prolonged drought conditions detrimental to T. magnatum production, using a reference year representative of optimal conditions.
However, it should be noted that the field irrigation experiment did not fully implement the irrigation volumes suggested by the model. Due to operational constraints in the forest environment, irrigation events of 15 mm were applied, representing a reduced and pragmatic implementation of the simulated optimal regime (20–25 mm per event). As a consequence, the field trial should be interpreted as an exploratory test of the system’s response to supplemental water inputs, rather than as a full validation of the model-derived optimal irrigation schedule.
The 2013 growing season was characterized by a medium-to-low yield compared to the historical standards of the San Miniato hills, reaching approximately 25% of the local historical maximum. This reduced production was consistent with unfavourable climatic conditions, including prolonged summer drought and elevated soil temperatures, which resulted in persistently low soil moisture levels during the critical months preceding the fruiting season. Such conditions are known to negatively affect both mycelial persistence and sporocarp formation in
T. magnatum. However, as discussed above, truffle production is driven by a complex interaction of climatic, edaphic, and biological factors, and soil water balance alone cannot fully explain interannual variability in yield. The climatic conditions observed in 2013 therefore represent a necessary but not sufficient explanation for the reduced production. Consistent with this negative trend, the sites monitored within the MAGNATUM project between 2008 and 2010 [
39] exhibited a marked reduction in ascocarp production compared to previous years (personal communication).
In 2013, a total of 10 truffles (ranging from 6 to 33 g) were collected within the overall study area. However, only two of these ascocarps were harvested specifically within the 12 experimental plots: one weighing 17 g (plot 2T1) and another weighing 7 g (plot 8T1). Notably, both specimens were recorded in plots subjected to the high irrigation level (T1 treatment). While the presence of production exclusively in irrigated plots is noteworthy, the extremely low number of samples represents a significant limitation. Accordingly, these observations should be interpreted as preliminary and exploratory, rather than as evidence of a statistically robust production response.
3.6. Seasonal Dynamics of T. magnatum DNA Amount
Table 3 summarizes the seasonal dynamics of
T. magnatum DNA abundance across the experimental plots. Spring was identified as the period of maximum mycelial expansion, while summer represented the most critical phase for fungal survival.
To statistically evaluate the effect of irrigation treatments (C, T1, T2) over time, a Linear Mixed Model (LMM) was performed with season as a fixed effect and plot as a random effect. The ANOVA results from the model indicated no significant differences for the “Treatment” effect (
F = 0.85,
p = 0.459) or the “Treatment: Season” interaction (
F = 0.8,
p = 0.577;
Supplementary Materials Table S3). The pairwise post hoc comparisons confirmed the absence of significant differences between treatment groups within each season (
p > 0.05;
Tables S4 and S5). Mean values and standard deviations for each group are detailed in
Table 4, while the complete dataset and statistical outputs are available in the
Supplementary Materials (Tables S2–S5).
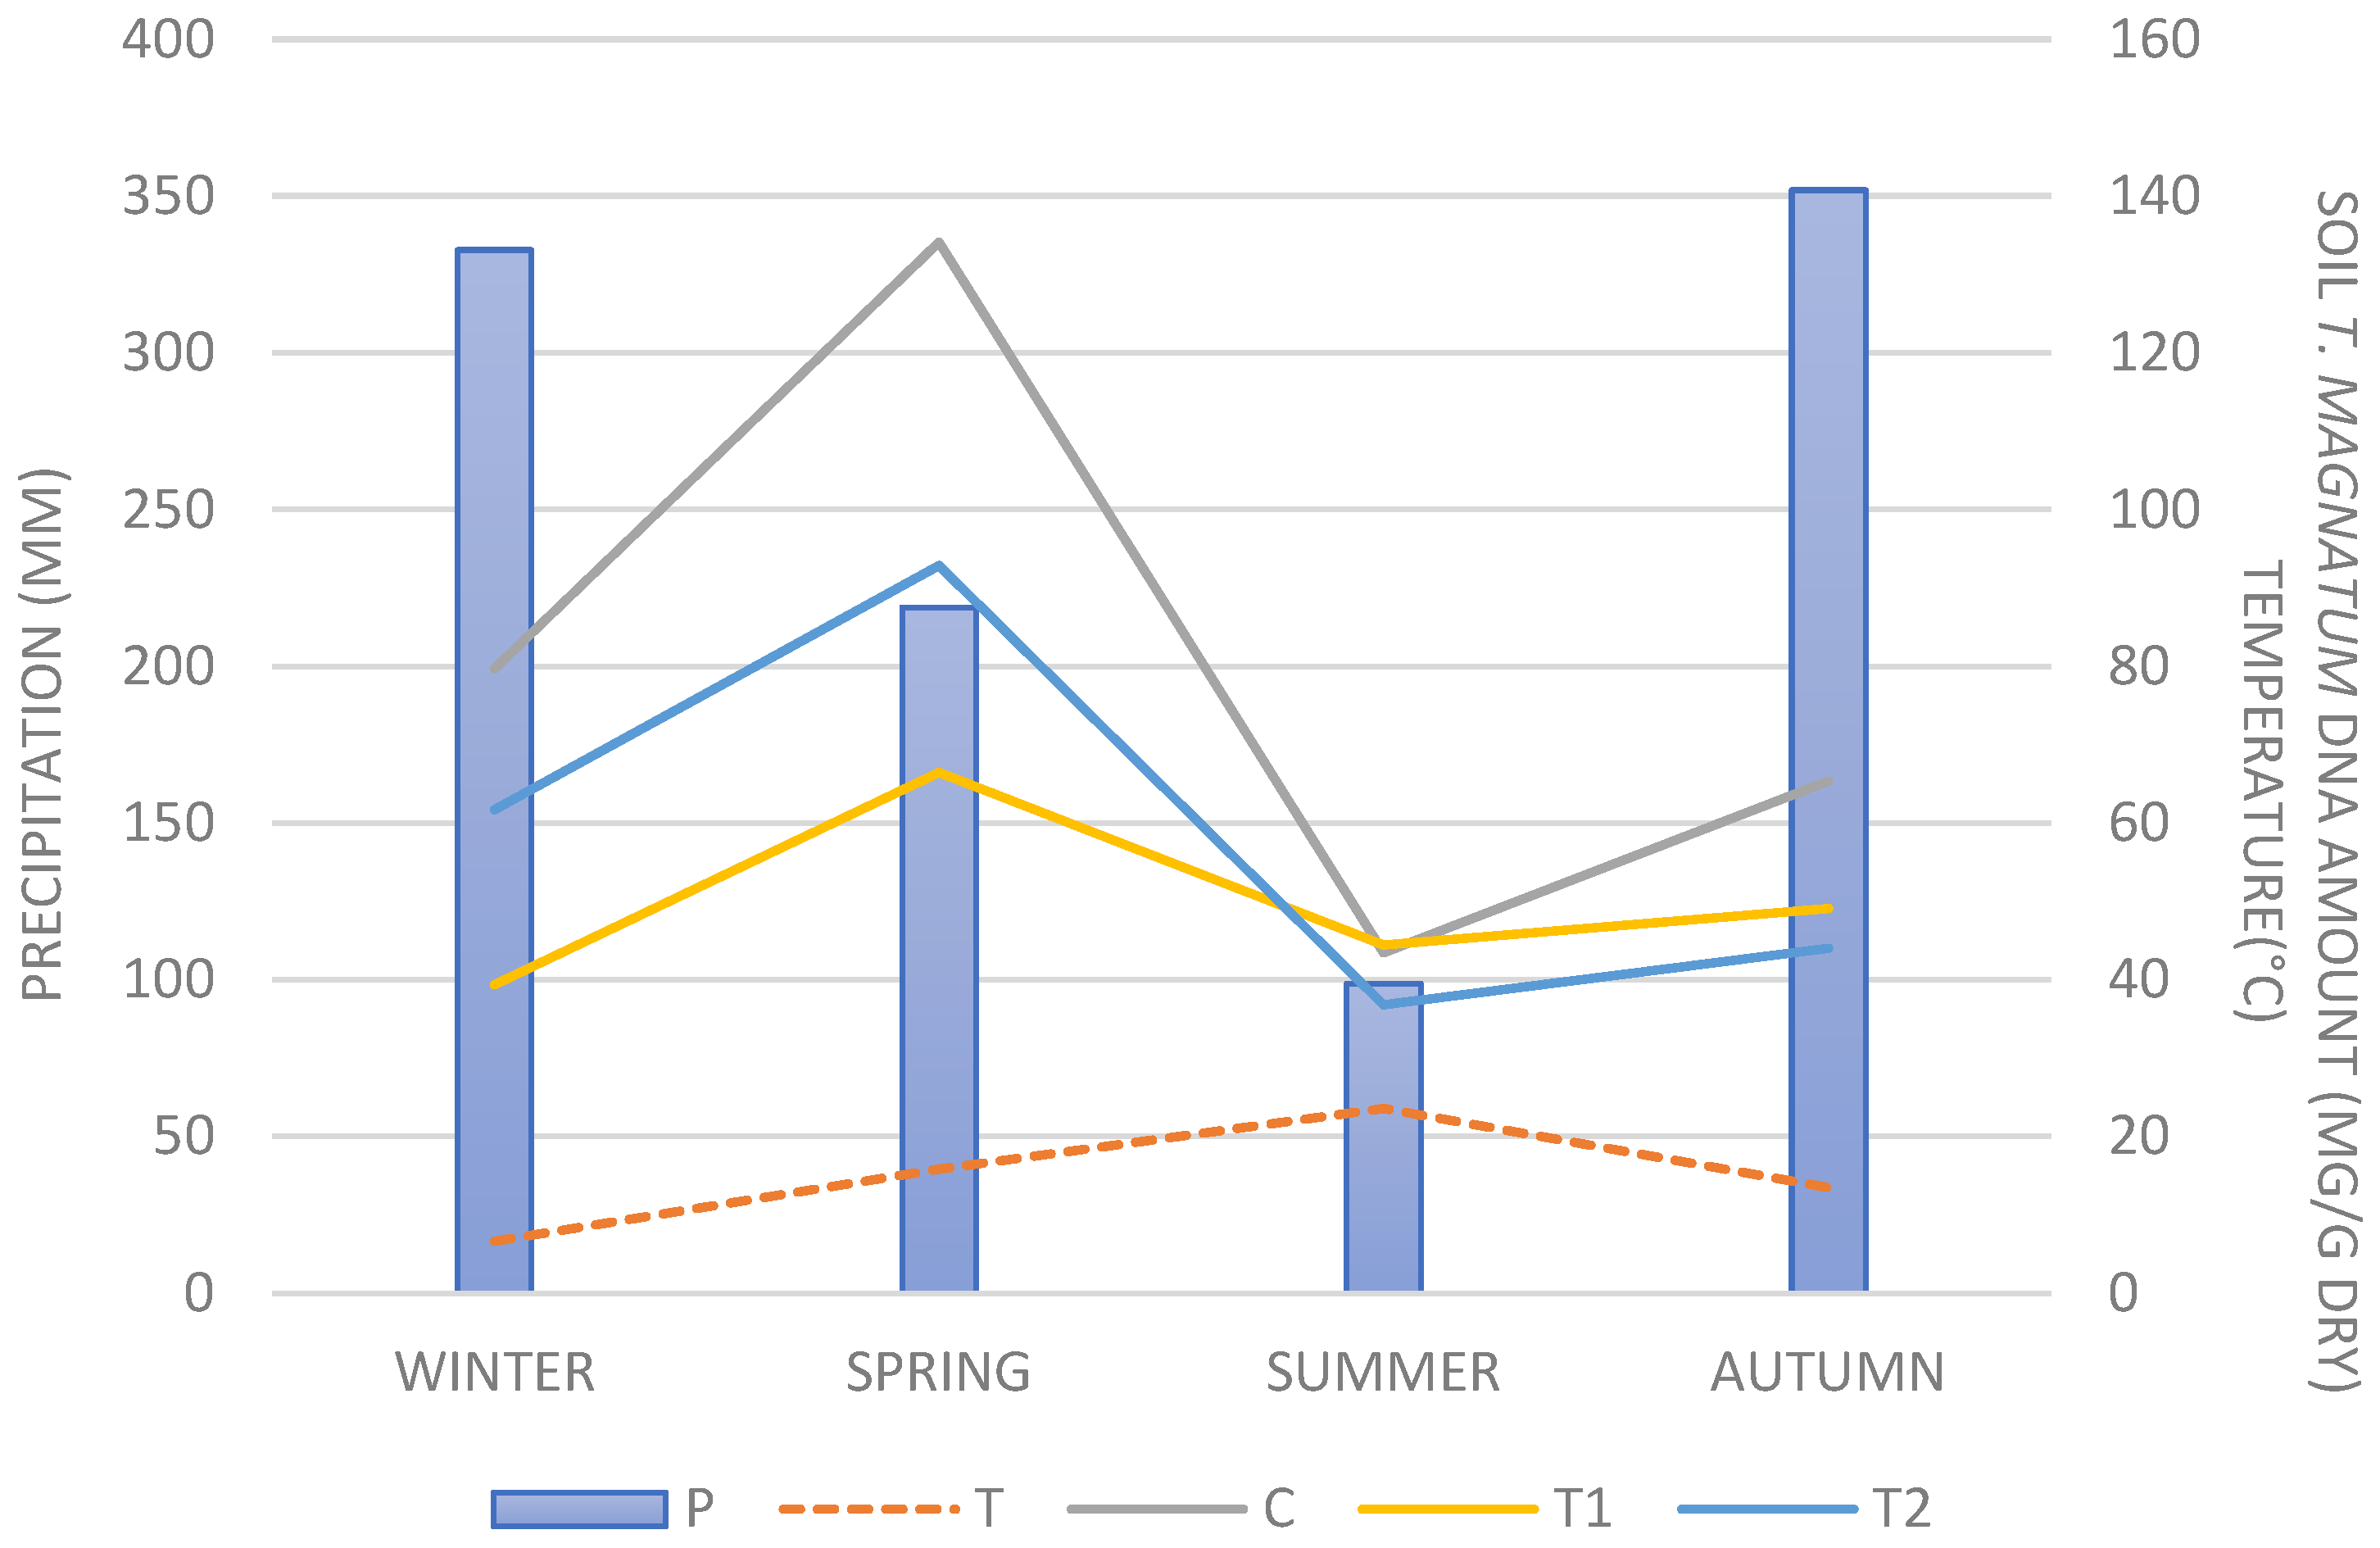
When interpreted in relation to microclimatic parameters (
Figure 7), the seasonal pattern confirms that the increase in spring temperatures acts as a key driver of vegetative mycelial development. Conversely, summer thermal and water stress lead to a decline in fungal biomass across all treatments, indicating that while irrigation may influence local persistence, the broad seasonal trend is primarily governed by regional climatic fluctuations.
3.7. Effects of Irrigation on T. magnatum DNA Dynamics
Comparative analysis among treatments yielded results of particular relevance for sustainable land management. In plots subjected to the higher irrigation level (T1), the summer decline in
T. magnatum DNA amount was significantly less pronounced than in control plots (C) and in those subjected to the lower irrigation level (T2). Moreover, the T1 treatment promoted a more stable maintenance of
T. magnatum DNA amount in the soil, also attenuating the sharp autumn recovery peaks observed in the other treatments. Analysis of variance (ANOVA) confirmed the statistical significance (
p < 0.05) of the observed differences, both with respect to the timing of water inputs (pre- and post-irrigation) and among the different experimental irrigation treatments tested (
Table 5).
4. Discussion
The results of this study confirm the strong dependence of
T. magnatum development and productivity on soil moisture and temperature regimes, suggesting that irrigation could represent an adaptive management option to mitigate the negative impacts of increasing climatic variability on natural and semi-natural truffières. The marked interannual variability observed in truffle yields, as reported by truffière owners and supported by long-term thermopluviometric data, is consistent with previous studies that identify
T. magnatum as one of the truffle species most sensitive to hydrological and thermal constraints [
41].
The analysis of soil temperature and moisture conditions during productive and unproductive years confirms that
T. magnatum fruiting is favored by autumn soil water recharge, with optimal conditions occurring at soil moisture values around 25% and temperatures close to 13 °C. These thresholds are in agreement with earlier findings from Central and Northern Italy, where truffle fructification has been linked to moderate temperatures and sustained soil humidity following summer drought [
42]. Conversely, the prolonged summer droughts observed during the 2008–2011 period resulted in critically low soil moisture levels persisting for several consecutive months, severely limiting both mycelial survival and fruiting body formation. Such climatic patterns are increasingly frequent in Mediterranean regions and are projected to intensify under future climate change scenarios [
4], posing a significant threat to the persistence of high-value ectomycorrhizal fungi such as
T. magnatum [
16,
43].
The selection of 2010 as a reference year, characterized by favorable moisture conditions and higher truffle productivity, provided an ecologically meaningful baseline for defining irrigation thresholds. This approach is consistent with adaptive forest management strategies that use favorable climatic analogues to guide mitigation actions under increasingly variable environmental conditions [
44]. The soil water balance model applied in this study showed an adequate ability to reproduce the main seasonal wetting and drying dynamics, particularly during autumn recharge and summer depletion phases. However, limitations were observed in simulating short-term increases in soil moisture beyond field capacity, a behavior commonly reported in modelling applications in heterogeneous forest soils [
35,
45]. In particular, larger point-scale deviations between measured and simulated soil moisture were mainly associated with rainfall events, during which soil water content recorded by sensors could temporarily exceed field capacity for a few hours. As the model operates at a daily time step and represents drainage once field capacity is exceeded, these short-term peaks cannot be explicitly reproduced. Consequently, the observed discrepancies reflect event-driven deviations rather than systematic seasonal biases in simulated soil moisture dynamics.
A lower agreement was observed in 2013, when soil moisture sensors were relocated within different plots characterized by heterogeneous canopy cover and local pedological conditions. This change likely altered the measured soil moisture regime relative to previous years and highlights the sensitivity of point-scale simulations to sensor placement and site heterogeneity, rather than a deterioration of model structure or performance.
In addition, the use of meteorological data from off-site weather stations likely contributed to discrepancies between simulated and observed soil moisture during localized summer rainfall events. This highlights the importance of high-resolution microclimatic monitoring in forested truffle systems, where canopy structure, soil heterogeneity, and convective precipitation can generate strong spatial variability [
46]. As irrigation requirements were derived from daily soil water balance simulations, this limitation may introduce uncertainty in the timing of individual irrigation events under highly localized rainfall conditions. Future studies should integrate on-site rainfall measurements and soil moisture monitoring with model-based approaches to enable adaptive, real-time irrigation management under highly variable microclimatic conditions.
Despite these limitations, the use of the 2010 moisture regime as a reference provided a practical basis for defining irrigation timing and volumes. While highly localized summer rainfall events may not always be captured by off-site meteorological stations, the modelling framework reliably identifies periods of critical soil moisture depletion. Irrigation recommendations derived from the model are therefore intended to support adaptive management decisions, to be implemented in combination with local observations of rainfall and soil conditions. The simulations indicate that soil moisture deficits can arise as early as late spring, with August consistently representing the most critical period. These findings corroborate previous studies suggesting that summer drought, rather than winter or autumn conditions alone, plays a key role in determining the success of
T. magnatum fructification in the subsequent season [
7,
8].
The assessment of
T. magnatum DNA amount in the soil revealed a clear seasonal pattern, with maximum expansion occurring in spring and a pronounced decline during summer. This dynamic reflects the strong coupling between fungal vegetative growth and favorable thermal and moisture conditions, as observed in other ectomycorrhizal fungi [
47,
48].
The results indicate that the T1 treatment promoted a more stable maintenance of
T. magnatum amount in the soil. Specifically, while absolute DNA concentrations were characterized by high spatial variability (
Table 4), the BACI analysis confirmed that the summer decline in
T. magnatum DNA was significantly less pronounced in T1 plots compared to control and T2 plots. This suggests that the higher irrigation level effectively attenuated the negative impact of summer drought on the mycelial network. Notably, the T1 treatment also reduced the pronounced autumn recovery peaks observed in non-irrigated and less irrigated plots, indicating a more continuous and stable mycelial presence in the soil. Such stability might contribute to the resilience of the fungal network, as repeated cycles of severe summer decline followed by abrupt recovery could weaken the fungal network and its symbiotic efficiency over time [
49,
50].
Although truffle production within the experimental plots in 2013 was very limited, likely due to generally unfavorable climatic conditions, sporocarps were observed exclusively in plots subjected to the higher irrigation level. However, this sample size is too small to support strong claims of yield stabilization. Given the well-known lag between mycelial dynamics and sporocarp formation, longer-term experiments are required to fully capture the productive response to irrigation treatments [
51]. Long-term monitoring is also essential to evaluate the persistence and stability of irrigation effects over time and to assess the robustness of this adaptive strategy under interannual climatic variability.
Future research should also integrate ecological and hydrological approaches with biochemical and metabolomic analyses (e.g., VOCs and sulfur compounds) to better understand the physiological mechanisms underlying T. magnatum responses to environmental stress.
From a sustainable forestry perspective, the results of this study provide valuable insights into adaptive management strategies for truffle-producing forest ecosystems. Carefully calibrated irrigation, applied during critical summer periods, appears capable of mitigating drought stress without inducing excessive soil moisture fluctuations that could negatively affect soil structure, microbial balance, or host tree physiology. However, irrigation in forest environments must be carefully balanced against water availability, ecological integrity, and economic feasibility. The relatively low volumes proposed in this study (20–30 mm per intervention) represent a compromise between ecological effectiveness and sustainability, particularly in regions increasingly exposed to water scarcity. Overall, the integration of soil moisture monitoring and modeling approaches provides a preliminary framework that, if validated by longer-term data, could assist in enhancing the resilience of T. magnatum habitats. Furthermore, if confirmed over longer periods, these strategies could potentially support truffle production and help preserve the broader ecological functions and socio-economic value of traditional truffle landscapes.
Study Limitations
Despite the insights provided by this study, several limitations should be acknowledged. First, the research was conducted at a single study site, which restricts the generalizability of the findings to other truffle-producing ecosystems with different climatic, soil, and ecological characteristics. Second, the field irrigation experiment was limited to a single growing season (2013), preventing the assessment of interannual variability and long-term ecosystem responses to irrigation practices. Third, the number of truffles recorded within the experimental plots in 2013 was very low, which does not allow for a quantitative statistical evaluation of production responses and limits interpretation at the productive level to exploration and qualitative evidence. Fourth, the modelling approach relied on meteorological data from off-site weather stations, which may not fully capture the spatial heterogeneity of precipitation and microclimatic conditions typical of forest environments, introducing uncertainty in soil moisture simulations and derived irrigation timing. Finally, although irrigation clearly influenced mycelial dynamics, the relationship between below-ground mycelial responses and sporocarp production remains difficult to resolve, due to the complex and still incompletely understood ecological controls governing Tuber magnatum fruiting. These limitations highlight the need for multi-site and long-term experimental designs integrating high-resolution microclimatic monitoring and extended production datasets.
5. Conclusions
This study supports the role of soil water availability as a key factor influencing T. magnatum persistence and productivity under Mediterranean conditions. These findings are based on a single-season, small-scale field experiment and should therefore be interpreted with caution. Summer drought and thermal stress were associated with a reduced soil T. magnatum DNA amount, whereas targeted irrigation during critical periods appeared to mitigate these effects. A higher irrigation level maintained a more stable T. magnatum DNA amount presence throughout the year and aligned with positive trends in truffle production components, although a definitive causal link remains unproven under these experimental constraints.
The proposed irrigation strategy represents a potentially feasible adaptive management option for truffle-producing forest ecosystems, balancing ecological effectiveness with water-use efficiency. Although the direct productive responses remain tentative and require longer observation periods due to the lag between mycelial dynamics and sporocarp formation, the stabilization of fungal biomass highlights the potential of irrigation to enhance ecosystem resilience.
Importantly, the use of a locally calibrated soil water balance model proved essential for identifying site-specific moisture dynamics and defining operational irrigation thresholds. This approach provides a transferable framework that may be adapted to other forest systems, supporting the development of context-specific irrigation strategies under increasing climatic variability.
Overall, these findings contribute to the development of sustainable management practices for T. magnatum habitats, promoting the monitoring of truffle production dynamics and the conservation of the ecological and socio-economic value of traditional truffle landscapes. However, further long-term and larger-scale studies are needed to confirm the effectiveness and general applicability of irrigation strategies under different environmental conditions.




 ,
,