1. Introduction
Maritime transport plays a central role in international trade, but it remains a significant source of air pollutants and greenhouse gas (GHG) emissions [
1]. Ships operating on conventional fossil fuels emit sulphur oxides (SO
x), nitrogen oxides (NO
x) and particulate matter (PM), which have well documented impacts on air quality, ecosystems and human health [
2]. At the same time, the maritime sector contributes to global carbon dioxide (CO
2) emissions and is increasingly subject to international climate mitigation efforts [
3]. In response, the International Maritime Organization (IMO) has progressively developed regulatory instruments aimed at reducing both local pollutant emissions and the climate impact of shipping [
4].
Historically, IMO air pollution regulation and GHG mitigation policy have advanced through partly separate regulatory instruments. MARPOL Annex VI established limits for air pollutants, including SO
x and NO
x emissions, while subsequent measures introduced technical and operational energy efficiency requirements, such as the Energy Efficiency Existing Ship Index (EEXI) and the Carbon Intensity Indicator (CII) [
5]. More recently, the IMO 2023 GHG Strategy has strengthened the long-term direction of maritime decarbonization, including the objective of reaching net zero GHG emissions from international shipping by or around 2050 [
6,
7]. Although these instruments pursue complementary environmental objectives, they operate through different compliance logics, time horizons and performance metrics. Consequently, a technology or fuel strategy that performs well under one regulatory objective may not necessarily remain optimal under another [
8].
This interaction is particularly relevant for sulphur compliance strategies [
9]. Exhaust gas cleaning systems, commonly referred to as scrubbers, have been widely adopted to comply with sulphur limits while allowing continued use of heavy fuel oil (HFO) and their effectiveness has been extensively documented [
10,
11]. However, their operation may also increase fuel consumption due to additional auxiliary power demand and changes in exhaust system operation, which can lead to higher CO
2 emissions [
12]. Therefore, scrubbers illustrate a broader regulatory trade-off between local pollutant mitigation and fuel-related carbon performance, since technologies designed to reduce SO
x emissions may also increase energy consumption and associated CO
2 emissions [
11].
The relevance of this trade-off has increased as maritime regulation moves towards GHG intensity-based approaches and possible economic instruments [
13,
14]. The IMO Net-Zero Framework, discussed as part of the development of mid-term GHG reduction measures, has included proposals based on greenhouse gas fuel intensity, expressed in gCO
2eq/MJ, and associated economic mechanisms such as Remedial Units. However, recent developments show that the final architecture, timing and economic design of these measures remain uncertain. At MEPC 84, further discussion took place on the Net-Zero Framework, but discussions revealed continued divergence between positions favoring adoption of the draft framework with limited changes and those supporting alternative approaches based on market readiness [
15]. Discussions are therefore expected to continue through intersessional work before MEPC 85 [
16]. This regulatory uncertainty supports the use of transparent scenario assumptions to evaluate future carbon-related costs, rather than treating them as formal compliance obligations, an approach that is consistent with recent maritime decarbonization studies adopting scenario-based and data-driven analytical frameworks [
17,
18].
The issue is especially important for aging vessels. Ships are long-lived, capital-intensive assets, and compliance investments made late in their operational life may create lock in effects if future regulation or market conditions change. Recent analyses of alternative IMO scenarios highlight that fuel pathway choices can create lock in exposure under stringent or fragmented regulatory outcomes, particularly when investment decisions are difficult or costly to reverse [
19]. For shipowners operating older vessels, the decision is therefore not only whether a given technology achieves immediate pollutant compliance, but also whether it remains economically and operationally robust over the remaining lifetime of the asset [
20].
Despite the extensive literature on sulphur abatement technologies, existing studies have often assessed scrubbers and fuel switching from a pollutant reduction or technical performance perspective [
21,
22,
23,
24]. However, fewer studies have evaluated how sulphur compliance strategies interact with fuel-related GHG intensity, prospective carbon cost exposure and total cost performance for aging vessels operating under uncertain decarbonization pathways and evolving regulatory conditions [
25]. In particular, there is still limited evidence on whether the lower carbon cost exposure associated with fuel switching can compensate for the fuel cost advantage of HFO operation with scrubbers, especially for aging passenger vessels already equipped with exhaust gas cleaning systems.
This study addresses this gap by providing an integrated techno-economic assessment of sulphur compliance strategies under evolving SOx and GHG constraints. Using real operational data from a 1998-built cruise vessel, three operational configurations are evaluated: HFO baseline operation, HFO operation with open-loop scrubbers, and full fuel switching to marine diesel oil (MDO). The analysis combines pollutant emissions, energy consumption, fuel-related GHG intensity, prospective carbon cost exposure, total cost performance, break-even fuel price thresholds and sensitivity analysis. By linking local pollutant reduction, fuel-related carbon exposure and economic decision indicators, the study provides a practical framework to support sustainability-oriented compliance planning for aging vessels under regulatory and market uncertainty. The scope of the assessment is limited to operational atmospheric emissions, fuel-related Tank-to-Wake carbon performance and techno-economic implications, while broader lifecycle and marine environmental impacts, such as Well-to-Wake emissions and scrubber washwater ecotoxicity, remain outside the scope of the present study.
2. Methods
This section presents the methodological framework used to compare alternative sulphur compliance strategies for the case study vessel. The analysis includes pollutant emission calculations, fuel-related GHG intensity assessment, prospective carbon cost exposure, total cost evaluation, break-even fuel price spread analysis and sensitivity analysis. Vessel specific operational data were combined with technical, economic and regulatory parameters to assess the environmental and economic performance of HFO operation with scrubbers and MDO switching.
2.1. Case Study Vessel and Data Source
A cruise ship under commercial operation was selected as a case study to assess the environmental and economic implications of alternative sulphur compliance strategies for aging passenger vessels. The vessel was built in 1998, has an overall length of 272.8 m, and is equipped with a diesel electric propulsion system. Its main technical characteristics are summarized in
Table 1.
The analysis was based on three complementary data sources. First, detailed operational data were obtained from the ship’s electronic logbook for April 2024. This dataset includes information on vessel operating conditions, power demand, fuel consumption, and time spent in each operational mode. The April 2024 dataset was used as the reference operational period for the scenario-based emissions and fuel consumption calculations.
Second, technical and economic data related to the installed scrubber system and onboard energy efficiency measures were obtained from the shipowner and from the underlying case study documentation. These data include capital expenditure, operating expenditure, estimated fuel savings, and retrofit related costs. They were used to support the total cost assessment and the comparison between fuel switching and scrubber-based compliance.
Third, regulatory parameters and emission factors were obtained from IMO guidelines and peer reviewed literature. These include fuel-based emission factors, sulphur conversion assumptions, greenhouse gas intensity factors, and projected economic parameters associated with emerging GHG intensity-based mechanisms.
The scope of the present assessment is limited to operational atmospheric emissions, fuel-related Tank-to-Wake GHG performance and techno-economic implications associated with alternative sulphur compliance strategies. Environmental impacts associated with open-loop scrubber washwater discharge, including potential marine ecotoxicological impacts and local or regional discharge restrictions, were not quantified due to the absence of vessel-specific washwater monitoring data and therefore remain outside the scope of the present study. Similarly, the greenhouse gas assessment was limited to the Tank-to-Wake segment and does not include upstream Well-to-Tank contributions.
The vessel regularly operates on routes between the United States and the eastern Caribbean region. This operational profile is relevant because coastal waters of the United States are included in the North American Emission Control Area, where stricter limits on SOx and NOx emissions apply. As a result, the vessel is subject to different regulatory constraints depending on its operating location, which directly affects fuel selection and emission control strategies.
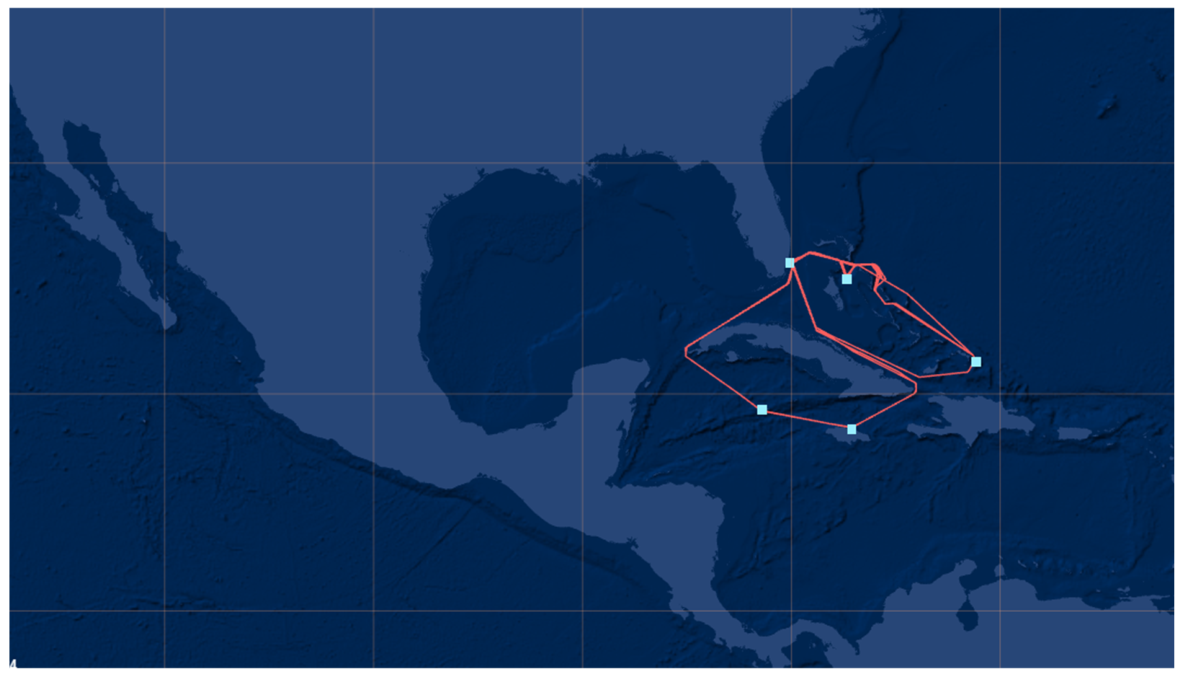
During the reference month, the vessel spent 71% of its time in navigation, 24% docked or at anchor, and 5% performing port maneuvers. This operational distribution was used to allocate fuel consumption and emissions across the main activity phases considered in the analysis. The route followed during the reference period is shown in
Figure 1.
2.2. Operational Scenarios Definition
To evaluate the environmental and economic implications of alternative sulphur compliance strategies, three operational scenarios were defined based on fuel type and exhaust gas treatment configuration. The same operational profile recorded during the reference period was used in all scenarios to ensure comparability.
The first scenario considers operation using heavy fuel oil without exhaust gas cleaning. This scenario does not comply with current sulphur limits in Sulphur Emission Control Areas and is therefore not treated as a feasible compliance option. Instead, it is retained only as a counterfactual baseline to quantify the effects of fuel switching and scrubber operation relative to conventional HFO use.
The second scenario represents operation using HFO in combination with open-loop scrubbers. This configuration reflects the current sulphur compliance strategy of the vessel and allows continued use of HFO while meeting SOx emission limits through exhaust gas cleaning. It is therefore considered the scrubber-based compliance scenario.
The third scenario assumes full fuel switching to marine diesel oil, without the use of scrubbers. In this case, sulphur compliance is achieved through the use of a low-sulphur fuel across all operating conditions, including navigation within emission control areas. This scenario is considered the fuel switching compliance alternative.
Because the vessel is equipped with a diesel electric propulsion system, fuel consumption was estimated from the recorded electrical energy demand and the specific fuel consumption of the diesel generators. For the scrubber-based scenario, measured operational data from the reference period were used. For the HFO baseline and MDO scenarios, fuel consumption was estimated by applying the same operational profile and power demand distribution recorded during the reference period. This approach ensures that differences between scenarios are attributable to fuel type and exhaust gas treatment configuration rather than changes in vessel operation.
The main operational and regulatory characteristics of the evaluated scenarios, together with the corresponding monthly fuel consumption values, are summarized in
Table 2.
These values correspond to the reference operational period and were subsequently used for pollutant emission calculations, greenhouse gas intensity assessment, and economic evaluation. When annual indicators were required, monthly values were annualized as described in
Section 2.3.
2.3. Emissions Calculation
Pollutant emissions were estimated using a fuel consumption-based approach consistent with the EMEP/EEA Air Pollutant Emission Inventory Guidebook [
26] and the Fourth IMO Greenhouse Gas Study [
27]. Given the availability of vessel specific operational data, a Tier 3 approach was adopted [
28]. This method allows emissions to be estimated by combining fuel consumption, fuel type, engine characteristics and operational phase.
For each operational scenario, total emissions were calculated by aggregating the emissions generated during the main activity phases of the vessel, namely navigation, port maneuvering and hotel load during port stay or anchorage. The general formulation used for pollutant emission calculation is expressed as Equation (1):
where
is the total emission of pollutant
over the reference period, expressed in kg.
is the fuel consumption of fuel type
during operational phase
, expressed in tons, and
is the emission factor for pollutant
, fuel type
, and operational phase
, expressed in kg of pollutant per ton of fuel. The pollutants considered in this study are CO
2, NO
x, SO
x and PM. The fuel types considered are heavy fuel oil and marine diesel oil.
Emission factors were applied using two approaches depending on the pollutant. CO
2 and SO
x emissions were calculated using fuel-based emission factors. NO
x and PM emissions were initially defined using energy-based emission factors and then converted into fuel-based emission factors using the baseline specific fuel consumption of the engines, Equation (2):
where
is the fuel-based emission factor,
is the energy-based emission factor, and
is the baseline specific fuel consumption of the engine. This conversion ensures that all pollutant emissions can be consistently calculated from fuel consumption data.
Table 3 summarizes the calculation basis used for each pollutant.
2.3.1. Carbon Dioxide
Carbon dioxide emissions were calculated using fuel-based emission factors derived from IMO MEPC.1/Circ.684 [
29]. The adopted emission factors are presented in
Table 4.
The total CO
2 emissions for each scenario were calculated using Equation (3):
where
is the fuel consumption of fuel m over the reference period and
is the corresponding fuel-based CO
2 emission factor.
Although the carbon factor of MDO is slightly higher than that of HFO, differences in fuel consumption and lower heating value affect the total emissions and greenhouse gas intensity of each scenario [
27].
2.3.2. Nitrogen Oxide Emissions
Nitrogen oxide emissions were estimated using energy-based emission factors dependent on engine speed and regulatory Tier, in accordance with MARPOL Annex VI Regulation 13 [
30]. Since the case study vessel is equipped with medium speed diesel generators, the corresponding emission factors were selected according to engine rotational speed and year of construction. The general formulation applied for NO
x emissions is depicted in Equation (4):
where
is the engine power associated with operational phase
,
is the corresponding load factor,
is the operating time, and
is the energy-based NO
x emission factor expressed in gNO
x/kWh.
When fuel consumption-based aggregation was required, the energy-based NOx factor was converted into a fuel-based equivalent using the baseline specific fuel consumption, as described in Equation (2).
2.3.3. Sulphur Oxide Emissions
Sulphur oxide emissions were calculated from the sulphur content of the fuel using the formulation provided by IMO [
27]. In this study,
represents the sulphur mass fraction of the fuel, expressed as a decimal. Therefore, fuel with 3.5% sulphur content corresponds to
, while fuel with 0.1% sulphur content corresponds to
. The fuel-based SO
x emission factor was calculated using Equation (5):
where the factor 2 accounts for the molecular mass conversion from sulphur to sulphur dioxide, and 0.97753 represents the fraction of fuel sulphur assumed to be converted into SO
x. The remaining fraction is assumed to form sulphate or sulphite aerosols and is considered in the particulate matter calculation.
For the HFO baseline and MDO switching scenarios, SO
x emissions were calculated directly from the sulphur content of the corresponding fuel. For the HFO + scrubber scenario, gross SO
x emissions were first calculated using the HFO sulphur content, and then corrected by applying the scrubber SO
x removal efficiency, Equation (6):
where
is the SO
x removal efficiency of the scrubber system. In the present study, the removal efficiency was derived from the measured reduction between the HFO baseline and the scrubber operating condition over the reference period. This procedure ensures that the SO
x emissions reported for the scrubber scenario reflect the effect of exhaust gas cleaning rather than a change in fuel sulphur content.
2.3.4. Particulate Matter
Particulate matter emissions were estimated using sulphur dependent energy-based emission factors from the IMO Fourth Greenhouse Gas Study. Since particulate emissions are affected by fuel sulphur content, separate formulations were used for heavy fuel oil and distillate fuel operation.
For engines operating on HFO, the energy-based particulate matter emission factor was calculated using Equation (7):
For engines operating on MDO, the corresponding factor was calculated using Equation (8):
where
is expressed in gPM/kWh,
is the specific fuel consumption of engine
, and
is the fuel sulphur mass fraction expressed as a decimal.
For the scrubber scenario, particulate matter emissions were calculated using the HFO-based formulation and then adjusted according to the observed particulate matter reduction associated with scrubber operation. This approach reflects the fact that scrubbers reduce part of the particulate fraction associated with sulphur compounds, although their removal efficiency for particulate matter is considerably lower than for SOx.
Finally, the energy-based particulate matter emission factors were converted into fuel-based factors using the baseline specific fuel consumption, ensuring consistency with the fuel consumption-based emission inventory.
2.3.5. Calculation Workflow
The calculation procedure followed a consistent sequence for all scenarios:
Fuel consumption was estimated for each scenario over the reference operational period.
Fuel consumption was allocated across the main operational phases.
Pollutant specific emission factors were selected or calculated for each fuel type.
Scrubber removal efficiency was applied only to the HFO + scrubber scenario for SOx and particulate matter.
Emissions were aggregated across operational phases to obtain total monthly emissions.
When annual values were required for the economic assessment, monthly emissions and fuel consumption were annualized according to the procedure described in
Section 2.4.
This workflow was applied consistently across all scenarios to ensure that differences in emissions were attributable to fuel type, fuel consumption and exhaust gas treatment configuration rather than to differences in operational profile.
2.4. Energy Consumption, Annualization and Data Scaling
Fuel consumption values obtained for the reference operational month were converted into energy consumption using the lower heating value (LHV) of each fuel. This step was required to compare the greenhouse gas intensity and prospective carbon cost exposure of the evaluated scenarios on a common energy basis. For each scenario, the total energy consumption over the reference period was calculated using Equation (9):
where
is the energy consumption of scenario
, expressed in MJ,
is the fuel consumption of scenario
, expressed in kg and
is the lower heating value of fuel
, expressed in MJ/kg. The lower heating values used in this study were 40.2 MJ/kg for HFO and 42.7 MJ/kg for MDO.
The detailed operational dataset corresponds to one month of vessel operation in April 2024. Therefore, fuel consumption, emissions and energy consumption were first calculated on a monthly basis for the reference period. These monthly values were used for the direct comparison of the three operational scenarios. When annual economic indicators were required, monthly values were annualized using Equation (10):
where
is the annualized value of variable
for scenario
, and
is the corresponding value calculated for the reference month.
This annualization procedure was applied to fuel consumption, pollutant emissions, energy consumption, prospective carbon costs and total cost indicators. The procedure assumes that the reference month reflects a representative operating profile for the vessel. However, cruise vessel operations may vary seasonally depending on itinerary, occupancy, weather conditions and port time, which introduces uncertainty into the annualized results. Consequently, this assumption is treated as a limitation of the study.
To partially address this uncertainty, the influence of key economic and operational assumptions was explored through sensitivity analysis. In addition, the use of a common operational profile across all scenarios ensures that the comparison focuses on the relative effect of fuel type and sulphur compliance strategy, rather than on differences in route, operating time or vessel activity distribution.
Therefore, the annualized emissions, energy consumption and economic results presented in this study should be interpreted as scenario-based comparative estimates derived from the reference operational period rather than as predictive annual operational inventories.
2.5. Fuel-Related Tank-to-Wake Carbon Performance Indicators and Regulatory Context
In addition to pollutant emissions, carbon performance was evaluated from two complementary perspectives. First, the Carbon Intensity Indicator (CII) was used as a contextual indicator of the vessel’s recent operational carbon performance. Second, fuel-related greenhouse gas intensity was used to compare the relative Tank-to-Wake GHG performance of the evaluated sulphur compliance strategies on an energy basis.
The CII analysis was based on annual aggregated operational data provided by the shipowner for the period 2022–2024. These data include annual CO
2 emissions, transport capacity and distance traveled. Unlike the scenario-based calculations, which were performed using the detailed April 2024 operational dataset, the CII values were not used to rank the three operational scenarios. Instead, they were included to characterize the recent operational efficiency trajectory of the vessel and to contextualize the role of previously implemented energy efficiency measures. The attained CII was calculated using Equation (11):
where
is the attained Carbon Intensity Indicator, expressed in gCO
2/ton·nm,
is the annual CO
2 emission, expressed in grams,
is the ship capacity used for the CII calculation, expressed in tons and
is the annual distance traveled, expressed in nautical miles.
Fuel-related greenhouse gas intensity was then used to compare the evaluated sulphur compliance strategies independently of transport work. The metric, which is calculated using Equation (12), expresses the greenhouse gas emissions associated with each unit of fuel energy consumed and provides a common basis for comparing the HFO baseline, HFO with scrubbers, and MDO switching scenarios:
where
is the greenhouse gas fuel intensity of scenario s, expressed in gCO
2eq/MJ,
is the greenhouse gas emissions associated with scenario
and
is the energy consumption calculated according to
Section 2.4.
Given the uncertainty surrounding the final implementation of future GHG fuel intensity regulation, the GFI values were not interpreted as formal compliance results [
15,
16]. Instead, they were used as comparative Tank-to-Wake GHG performance indicators and as inputs for the prospective carbon cost scenario described in
Section 2.6.
Therefore, the fuel-related GHG intensity values presented in this study should be interpreted as comparative Tank-to-Wake indicators intended for scenario-based techno-economic assessment rather than as lifecycle-based greenhouse gas assessments or formal IMO compliance values.
2.6. Prospective Carbon Cost Scenario
Given the uncertainty surrounding the final adoption, implementation timeline and detailed design of future greenhouse gas fuel intensity regulation, this study does not treat the IMO Net-Zero Framework as a fully implemented compliance regime. Instead, a prospective carbon cost scenario was developed to explore how GHG intensity-based economic instruments could affect the relative attractiveness of alternative sulphur compliance strategies.
The carbon cost scenario was based on the general logic of emerging GHG fuel intensity regulation, where economic exposure increases when the fuel-related GHG intensity of a vessel exceeds a defined target. The values of USD 100 and USD 380 per equivalent compliance unit associated with the GHG intensity exceedance were used as reference carbon cost levels because they correspond to the Tier 1 and Tier 2 Remedial Unit prices discussed in the IMO Net-Zero Framework proposals. An intermediate value of USD 250 per ton of CO2eq was also included to represent a medium carbon cost scenario. These values were not treated as forecasts of future market prices, but as scenario assumptions for comparative assessment. The selected time horizon to 2035 was considered appropriate for the evaluated case study because the vessel, built in 1998, represents an aging asset approaching the later stages of its operational lifetime. Consequently, the prospective scenario was designed to explore whether progressively tightening carbon-related constraints could materially influence medium-term fuel selection and compliance strategy decisions for existing vessels already equipped with scrubber systems.
For each scenario and year, the annual GHG intensity target was calculated using Equation (13):
where
is the greenhouse gas fuel intensity target in year
,
is the annual reduction factor, and
is the baseline greenhouse gas fuel intensity. The GHG intensity gap was then calculated using Equation (14):
where
is the intensity gap for scenario
in year
, and
is the fuel-related greenhouse gas intensity calculated in
Section 2.5.
The prospective annual carbon cost was obtained with Equation (15):
where
is the prospective carbon cost for scenario
in year
,
is the annualized energy consumption of scenario
, and
is the assumed carbon cost parameter, expressed in USD per ton CO
2eq associated with the GHG intensity exceedance. The conversion factor
was included to convert greenhouse gas emissions from grams to metric tons.
To assess the sensitivity of the economic results to different levels of carbon-related cost exposure, three carbon cost assumptions were considered, as summarized in
Table 5. The lower and upper values were selected based on the Tier 1 and Tier 2 Remedial Unit prices discussed in the IMO Net-Zero Framework proposals, while the intermediate value was included to represent a medium carbon cost scenario.
This approach allows the economic comparison to remain relevant under regulatory uncertainty. Rather than estimating formal Remedial Unit obligations, the analysis evaluates how different levels of carbon-related cost exposure would affect the relative performance of HFO with scrubbers and MDO switching. The prospective carbon cost assessment is therefore intended to compare the relative sensitivity of the evaluated operational scenarios to tightening GHG intensity constraints under the assumptions considered, rather than to reproduce formal lifecycle-based regulatory compliance outcomes.
The reduction factors used in the prospective scenario are presented in
Table 6.
The reduction factors used in this study are broadly consistent with trajectories discussed in recent IMO decarbonization proposals. They are used as scenario inputs to represent progressively tightening carbon constraints, rather than as fixed regulatory requirements. Since the available emission coefficients and case study calculations are limited to the Tank-to-Wake (TtW) segment, Well-to-Tank contributions were not included. For heavy fuel oil, a TtW value of 79.2 gCO
2eq/MJ was adopted, while the associated Well-to-Tank contribution of 14.1 gCO
2eq/MJ was excluded from the calculation [
32]. Therefore, the prospective carbon cost assessment should be interpreted as a comparative screening exercise, not as a formal lifecycle-based IMO compliance calculation.
2.7. Total Cost Assessment
A total cost assessment was performed to compare the economic performance of the evaluated sulphur compliance strategies under different carbon cost assumptions. The objective was to determine whether the lower carbon cost exposure of MDO switching can compensate for the fuel cost advantage of operating with HFO and scrubbers.
For each scenario, the annual total cost was calculated as the sum of fuel cost, annualized capital expenditure, annual operating expenditure and prospective carbon cost. Equation (16):
where
is the total annual cost of scenario
in year
,
is the annual fuel cost,
is the annualized capital cost,
is the annual operating cost associated with the compliance technology, and
is the prospective carbon cost calculated according to
Section 2.6. The annual fuel cost was calculated by Equation (17):
where
is the annualized fuel consumption of scenario
, expressed in tons per year, and
is the unit price of fuel
, expressed in USD per ton. For the scrubber scenario, the capital expenditure associated with the installation of the exhaust gas cleaning system was annualized over the assumed remaining economic lifetime of the vessel using the capital recovery factor, Equation (18):
where
is the initial investment cost of scenario
,
is the discount rate, and
is the assumed remaining lifetime of the investment in years. The operating expenditure of the scrubber system was included as an annual cost. For the MDO switching scenario, no additional capital expenditure was assumed, since sulphur compliance is achieved through fuel substitution rather than installation of additional exhaust gas treatment equipment.
The HFO without scrubber scenario was retained only as a counterfactual baseline and was not considered a feasible regulatory compliance option. Therefore, the main economic comparison was made between the HFO with scrubbers scenario and the MDO switching scenario.
The cost difference between both compliant options was calculated using Equation (19):
where a positive value of
indicates that the scrubber-based strategy remains economically preferable, while a negative value indicates that MDO switching becomes the lower cost option. The cost components included in each scenario are summarized in
Table 7.
This structure allows the economic comparison to capture both short-term fuel cost differences and long-term exposure to carbon-related costs. It also makes it possible to determine whether the economic advantage of HFO with scrubbers is maintained when carbon cost exposure is included.
2.8. Break-Even Fuel Price Spread
A break-even fuel price spread analysis was performed to identify the conditions under which MDO switching becomes economically competitive with HFO operation using scrubbers. This analysis is particularly relevant because the scrubber strategy benefits from the lower price of HFO, while the MDO strategy benefits from lower fuel consumption and reduced prospective carbon cost exposure.
The break-even MDO price was calculated by equating the annual total cost of the MDO switching scenario with that of the HFO with scrubbers scenario, Equation (20):
Considering that the MDO switching scenario does not require additional scrubber-related capital or operating costs, the break-even MDO price was obtained with Equation (21):
where
is the break-even MDO price in year
,
is the annualized fuel consumption of the HFO with scrubbers scenario,
is the HFO price,
is the annualized scrubber capital cost,
is the annual scrubber operating cost,
is the prospective carbon cost of the scrubber scenario,
is the prospective carbon cost of the MDO switching scenario, and
is the annualized fuel consumption of the MDO scenario.
The corresponding break-even fuel price spread was then calculated by Equation (22):
where
represents the maximum MDO-HFO price spread at which fuel switching remains economically equivalent to the scrubber-based strategy.
If the actual MDO-HFO price spread is lower than , MDO switching becomes economically preferable. Conversely, if the actual spread is higher than , the HFO with scrubbers’ strategy remains the lower cost option.
This analysis allows the economic attractiveness of scrubber-based compliance to be evaluated as a function of fuel market conditions and carbon cost exposure, rather than as a fixed outcome. It also provides a practical decision threshold for shipowners assessing whether continued operation with HFO and scrubbers remains economically preferable under future carbon constrained scenarios.
2.9. Sensitivity Analysis
A sensitivity analysis was performed to evaluate how uncertainty in fuel prices, carbon cost exposure and investment assumptions influences the relative economic performance of the evaluated sulphur compliance strategies. This analysis was designed to determine whether the relative attractiveness of HFO operation with scrubbers and MDO switching changes under different market and regulatory conditions.
The main sensitivity variables considered were the HFO price, the MDO-HFO price spread, the carbon cost parameter, the annualization factor applied to the reference operational month, the scrubber capital expenditure, the scrubber operating expenditure, the discount rate and the assumed remaining lifetime of the vessel. In addition to the economic sensitivity analysis, a parametric check was performed for the SOx and PM removal efficiencies of the scrubber system. This check was included to evaluate how uncertainty in pollutant removal assumptions affects the local emission outcomes of the HFO with scrubbers scenario.
The sensitivity analysis was structured around three groups of parameters. First, fuel price uncertainty was assessed by varying the MDO-HFO price spread around the reference values used in the base case. This allowed the break-even fuel price spread identified in
Section 2.8 to be compared with plausible fuel market conditions. Second, carbon cost uncertainty was assessed using the low, medium and high carbon cost scenarios defined in
Section 2.6. Third, investment uncertainty was assessed by varying the annualized scrubber cost through changes in discount rate, remaining vessel lifetime and scrubber CAPEX.
The influence of the annualization assumption was also tested by applying alternative scaling factors to the reference monthly dataset. This was included because cruise ship operation may vary seasonally depending on itinerary, occupancy, port time and weather conditions. The parameters included in the sensitivity analysis are summarized in
Table 8.
The results of the sensitivity analysis were used to identify the parameters with the greatest influence on the relative economic performance of the compliance strategies and to evaluate how uncertainty in scrubber removal efficiencies affects the SOx and PM emission outcomes of the HFO with scrubbers scenario.
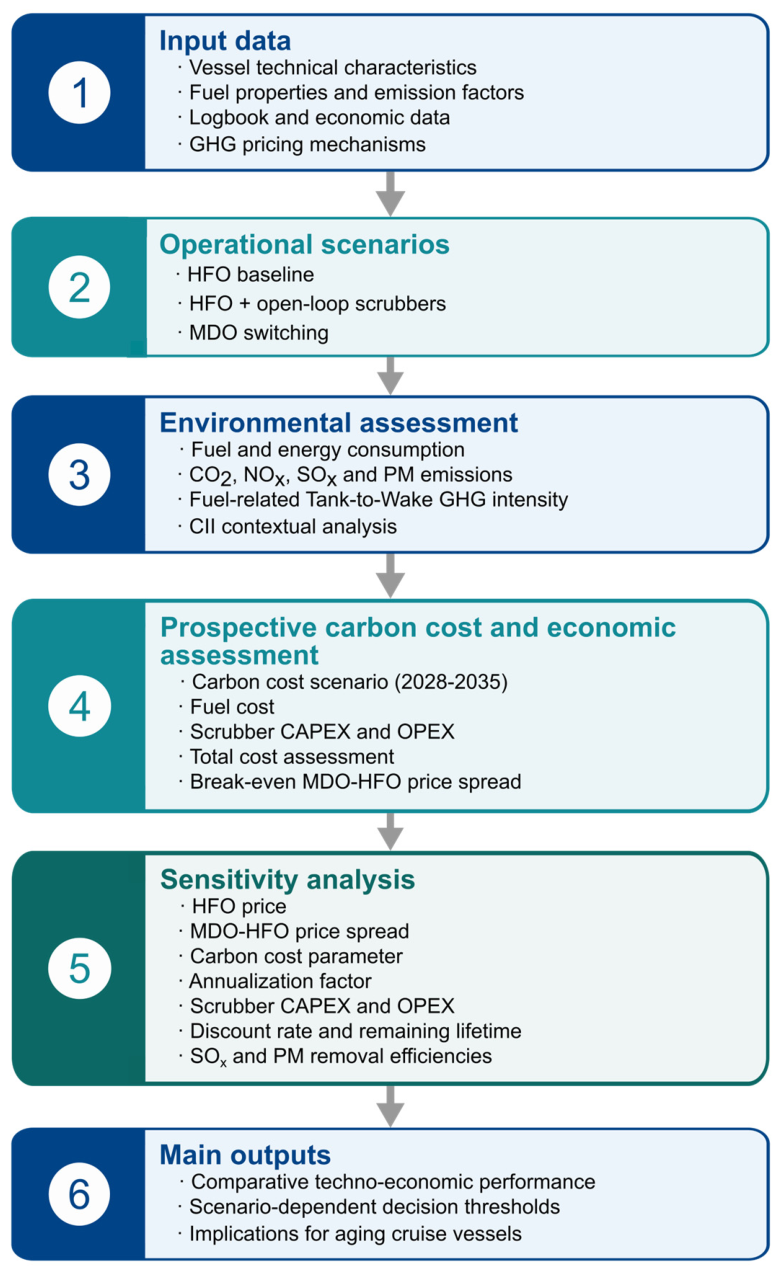
To improve the readability of the methodological framework,
Figure 2 summarizes the assessment sequence from input data collection and operational scenario definition to environmental assessment, prospective carbon cost estimation, total cost analysis, sensitivity analysis and decision support outputs.
3. Results and Discussion
This section presents the results of the case study analysis and discusses the environmental and economic trade-offs associated with alternative sulphur compliance strategies. The analysis focuses on pollutant emissions, fuel-related GHG intensity, prospective carbon cost exposure, total cost performance, and break-even conditions under regulatory and market uncertainty.
3.1. Fuel Consumption, Energy Use and Pollutant Emissions
The fuel consumption results obtained for the reference operational month show clear differences between the evaluated sulphur compliance strategies. Operation with HFO and scrubbers resulted in the highest fuel consumption, with 2802.3 ton/month, compared with 2703.7 ton/month for the HFO baseline and 2505.9 ton/month for the MDO switching scenario. Therefore, scrubber operation increased fuel consumption by approximately 3.6% relative to the HFO baseline. In contrast, MDO switching reduced fuel consumption by approximately 7.3% relative to the HFO baseline. When compared directly with MDO switching, the HFO with scrubbers configuration required approximately 11.8% more fuel during the reference month.
The corresponding monthly energy consumption values are presented in
Table 9. Because HFO and MDO have different lower heating values, variations in fuel mass consumption do not translate directly into equivalent changes in energy demand. In this case, the reduction in energy consumption achieved by MDO switching is more moderate, amounting to approximately 1.6% relative to the HFO baseline. Similarly, the increase associated with scrubber operation corresponds to approximately 3.6% in energy terms. Overall, the MDO switching scenario showed the lowest energy consumption among the evaluated configurations.
Based on the emission calculation procedure described in
Section 2.3, pollutant emissions were calculated for each scenario. The results are shown in
Table 10.
The results show that scrubbers are effective in reducing sulphur oxide emissions. The HFO with scrubbers scenario reduced SOx emissions by approximately 96.9% relative to the HFO baseline. However, this reduction is accompanied by higher fuel consumption, which leads to a 3.6% increase in CO2 emissions and a similar increase in NOx emissions. Particulate matter emissions decreased only moderately, by approximately 6.7%.
By contrast, MDO switching achieved the largest reductions in local pollutant emissions, reducing SOx emissions by more than 99% and particulate matter emissions by approximately 88.8% relative to the HFO baseline. It also reduced CO2 emissions by 4.6%. However, NOx emissions remained practically unchanged. NOx emissions were assumed to remain approximately independent of fuel type because the evaluated scenarios maintained the same engine configuration, operational profile and combustion technology. Under these conditions, the use of MDO instead of HFO is not expected to produce substantial changes in NOx formation compared with the influence of engine load, combustion temperature and engine tuning parameters. Consequently, NOx differences between the evaluated scenarios were considered negligible for the comparative techno-economic assessment and did not materially affect the overall ranking of the compliance strategies.
These results show that both SO
x compliant strategies improve sulphur performance, but they do so through different environmental trade-offs. Scrubber-based compliance strongly reduces SO
x emissions while increasing fuel consumption and associated CO
2 emissions. MDO switching reduces SO
x, PM and CO
2 emissions, but at the expense of higher fuel costs, which are evaluated in
Section 3.4 and
Section 3.5.
3.2. Operational Carbon Performance Context
The annual CII values provided by the shipowner were used to contextualize the recent operational carbon performance of the case study vessel. These values were not used to rank the fuel switching and scrubber scenarios, but to assess the recent efficiency trajectory of the vessel under real operating conditions. The evolution of the vessel’s annual CII values is presented in
Table 11.
The attained CII decreased from 11.4 in 2022 to 10.2 in 2024, indicating an improvement in operational carbon intensity over the analyzed period. This trend is consistent with the implementation of onboard efficiency measures, including reductions in auxiliary power demand and hotel load. However, the values remain within a range that can be interpreted as standard operational performance for vessels of similar characteristics, rather than representing a high efficiency classification.
This result is relevant for the present study because it shows that incremental operational efficiency improvements can reduce carbon intensity, but they do not fundamentally change the fuel-related GHG intensity of fossil fuel-based operation. Therefore, while operational efficiency measures remain important, the comparison between HFO with scrubbers and MDO switching must also account for fuel type, fuel consumption, carbon cost exposure and total economic performance.
3.3. Greenhouse Gas Intensity and Prospective Carbon Cost Exposure
The fuel-related Tank-to-Wake GHG intensity values calculated for the evaluated scenarios are presented in
Table 12. The HFO baseline and HFO with scrubbers scenarios show the same GHG intensity because both configurations use the same fuel. Although scrubber operation increases total fuel consumption and total CO
2 emissions, it does not change the GHG intensity per unit of fuel energy. In contrast, MDO switching results in a lower GHG intensity, with 75.082 gCO
2eq/MJ compared with 77.463 gCO
2eq/MJ for the HFO-based scenarios.
These values are interpreted as comparative Tank-to-Wake GHG performance indicators rather than formal compliance values under future GHG fuel intensity regulation and should not be interpreted as lifecycle-based greenhouse gas assessments.
The prospective carbon cost scenario was then applied to evaluate how different levels of carbon-related cost exposure could affect each strategy.
Table 13 summarizes the results for selected years under the low, medium and high carbon cost assumptions. The full annual series from 2028 to 2035 was used in the total cost assessment.
The prospective carbon cost exposure increases over time as the selected GHG intensity targets become more stringent. In all selected years, the HFO with scrubbers scenario shows higher carbon cost exposure than MDO switching. This occurs because scrubber operation increases total energy consumption without reducing Tank-to-Wake fuel-related GHG intensity. However, these values should not be interpreted as formal regulatory payments or lifecycle-based compliance estimates. They represent scenario-based estimates designed to test whether carbon-related cost exposure can materially affect the economic ranking of sulphur compliance strategies.
The results confirm that MDO switching shows lower prospective carbon cost exposure than HFO with scrubbers because it combines lower energy consumption with lower Tank-to-Wake fuel-related GHG intensity. Nevertheless, whether this advantage is sufficient to offset the higher fuel price of MDO can only be determined through the total cost assessment presented in
Section 3.4.
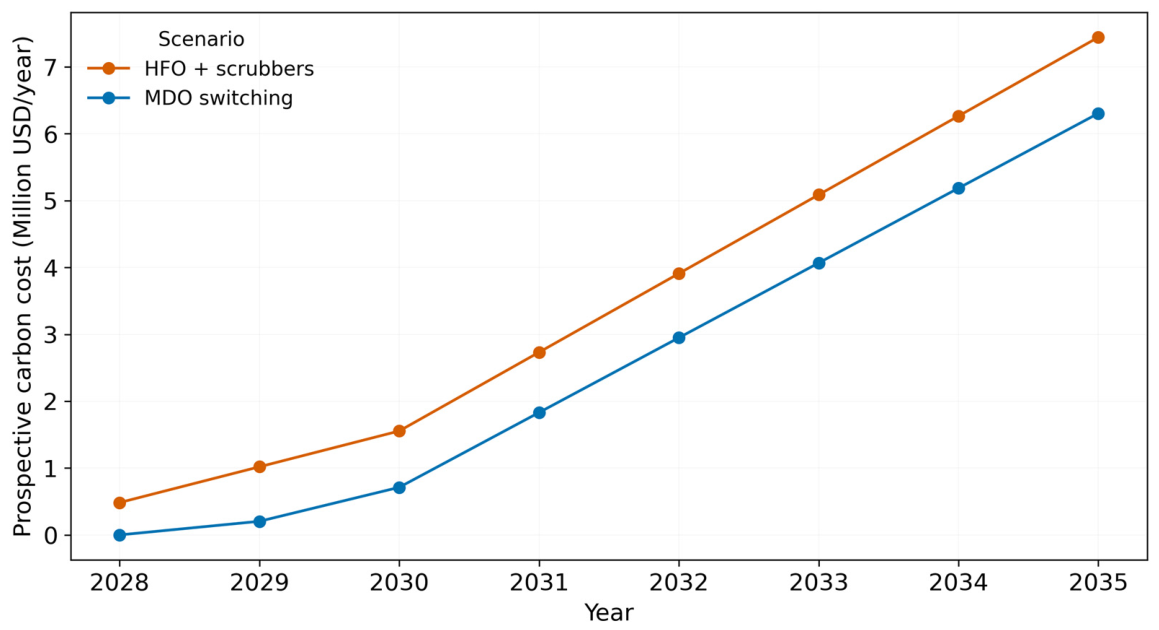
Figure 3 illustrates the evolution of the scenario-based prospective carbon cost exposure for the two compliant strategies under the medium carbon cost assumption.
3.4. Total Cost Comparison of Sulphur Compliance Strategies
The total cost assessment integrates fuel cost, scrubber related capital and operating costs, and prospective carbon cost exposure. This step is essential because the lower carbon cost exposure of MDO switching does not necessarily imply lower total cost. The scrubber-based strategy benefits from the lower price of HFO, whereas MDO switching avoids scrubber related costs and reduces carbon cost exposure.
The base case cost assumptions used in the total cost assessment are summarized in
Table 14. These assumptions define the fuel price spread between MDO and HFO, the annualized cost of the scrubber system, and the operational and financial parameters used in the comparison between both SO
x compliant strategies. The fuel prices, scrubber CAPEX and scrubber OPEX were obtained from the shipowner and the underlying case study documentation. The discount rate and remaining lifetime were treated as economic assumptions for the base case. A 10% discount rate and a 10-year remaining lifetime were adopted to represent a medium-term evaluation horizon for an aging vessel, consistent with previous maritime scrubber economic assessments and case-study-based analyses of scrubber investment decisions [
33,
34]. The annualization factor of 12 months per year was used as the base case scaling assumption, while alternative annualization factors were tested in the sensitivity analysis to account for dry dock, lay-up, itinerary disruption or off-hire periods.
The annual fuel cost is substantially higher for the MDO switching scenario because MDO is more expensive than HFO under the base case assumptions. However, the MDO scenario also benefits from lower fuel consumption and lower prospective carbon cost exposure. Conversely, the HFO with scrubbers scenario incurs additional scrubber CAPEX and OPEX but retains a substantial fuel cost advantage due to the lower HFO price.
Table 15 presents the annual total cost comparison between the two SO
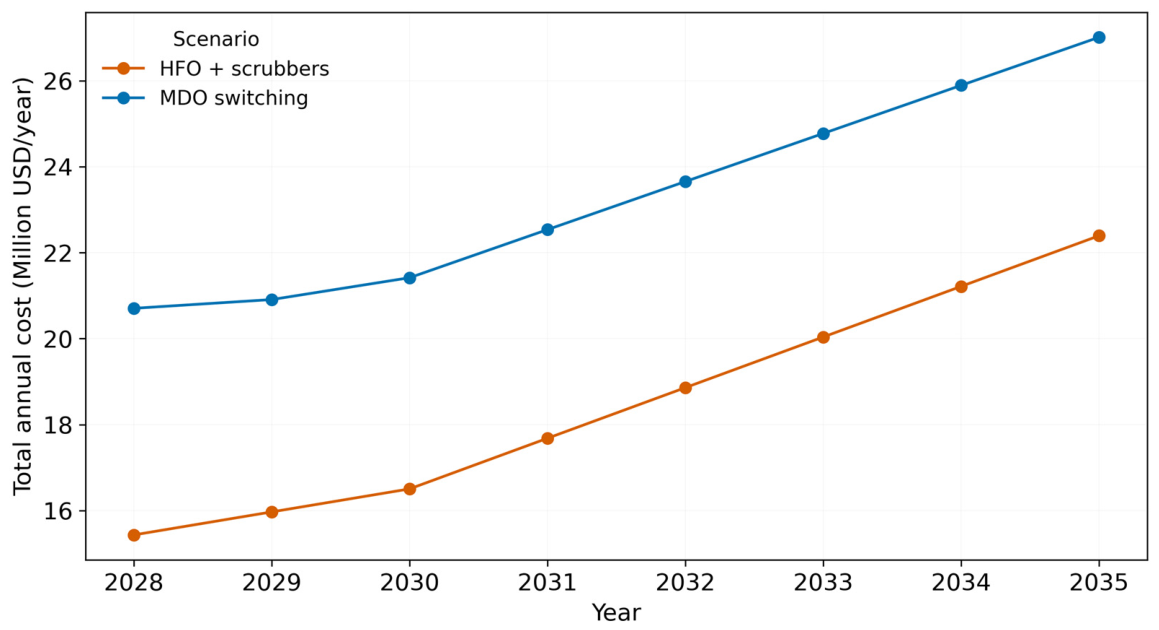
x compliant strategies for selected years and carbon cost assumptions. The results show that HFO with scrubbers remains the lower cost option in all selected cases. In relative terms, the total cost of the scrubber-based strategy is approximately 24.3–26.9% lower than that of MDO switching in 2028, depending on the carbon cost assumption. By 2035, this relative advantage decreases to 13.3–22.8%, reflecting the increasing effect of prospective carbon cost exposure on the scrubber-based configuration. Therefore, although carbon-related costs progressively narrow the economic gap between both strategies, they are not sufficient to reverse the cost ranking under the base case fuel price assumptions.
These results indicate that prospective carbon cost exposure progressively reduces the economic advantage of HFO with scrubbers but does not eliminate it under the base case fuel price assumptions. Therefore, the main economic finding is not that scrubbers are universally advantageous or that MDO switching is economically preferable under all conditions. Rather, the relative techno-economic performance of each strategy depends on the interaction between fuel price spread, carbon cost exposure, scrubber CAPEX and OPEX, and the remaining economic lifetime of the vessel.
Figure 4 illustrates the annual total cost evolution of the two SO
x compliant strategies under the medium carbon cost assumption.
3.5. Break-Even Fuel Price Spread
The break-even analysis identifies the maximum MDO-HFO price spread at which fuel switching remains economically equivalent to HFO operation with scrubbers. This threshold is particularly useful for shipowners because it translates the combined effect of fuel prices, scrubber costs and carbon cost exposure into a practical decision indicator. The break-even values obtained under the different carbon cost scenarios are presented in
Table 16.
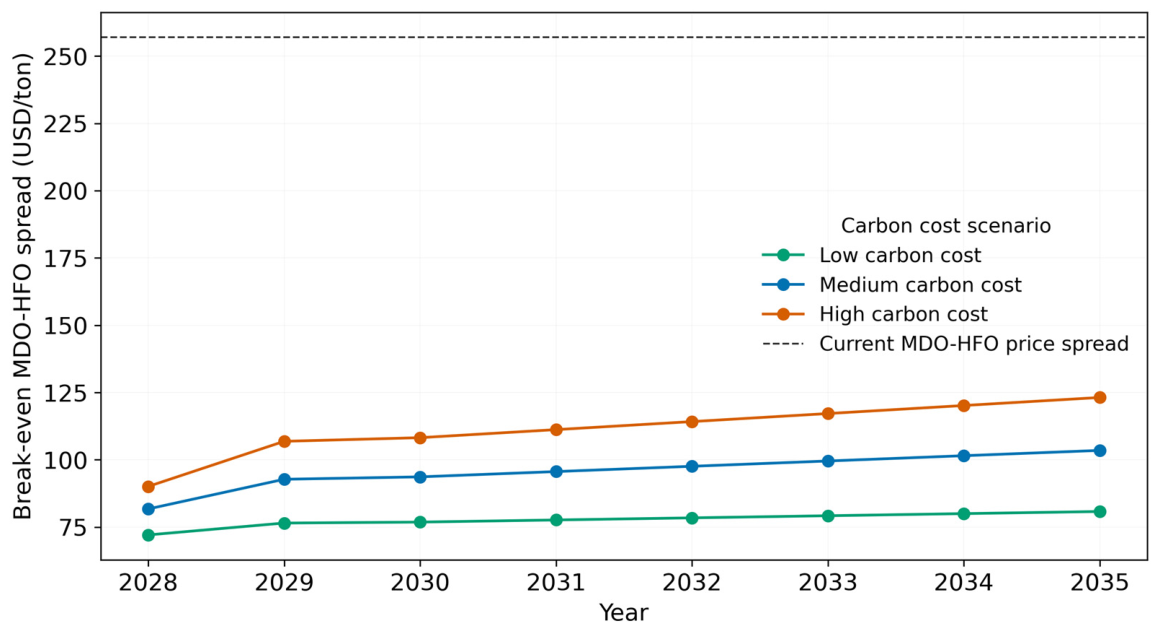
The base case MDO-HFO price spread is 257.0 USD/ton, which is substantially higher than all calculated break-even thresholds. In 2028, the break-even spread ranges from 72.1 USD/ton under the low carbon cost scenario to 90.1 USD/ton under the high carbon cost scenario. By 2035, this range increases to 80.8–123.1 USD/ton.
These results show that higher carbon cost exposure progressively improves the relative attractiveness of MDO switching by allowing it to tolerate a larger price premium over HFO. However, even under the high carbon cost scenario in 2035, the break-even spread remains far below the base case price spread of 257.0 USD/ton. Therefore, MDO switching does not become economically competitive under the fuel price assumptions adopted in the base case.
If the actual MDO-HFO price spread is below the break-even value, MDO switching becomes economically preferable. Conversely, if the actual spread remains above this threshold, HFO with scrubbers remains the lower cost SOx compliance option despite higher carbon cost exposure. In practical terms, MDO would need to become substantially cheaper relative to HFO, or carbon cost exposure would need to increase significantly, before fuel switching becomes the lower cost strategy.
Figure 5 illustrates the evolution of the break-even MDO-HFO price spread under the three carbon cost assumptions.
3.6. Sensitivity Analysis
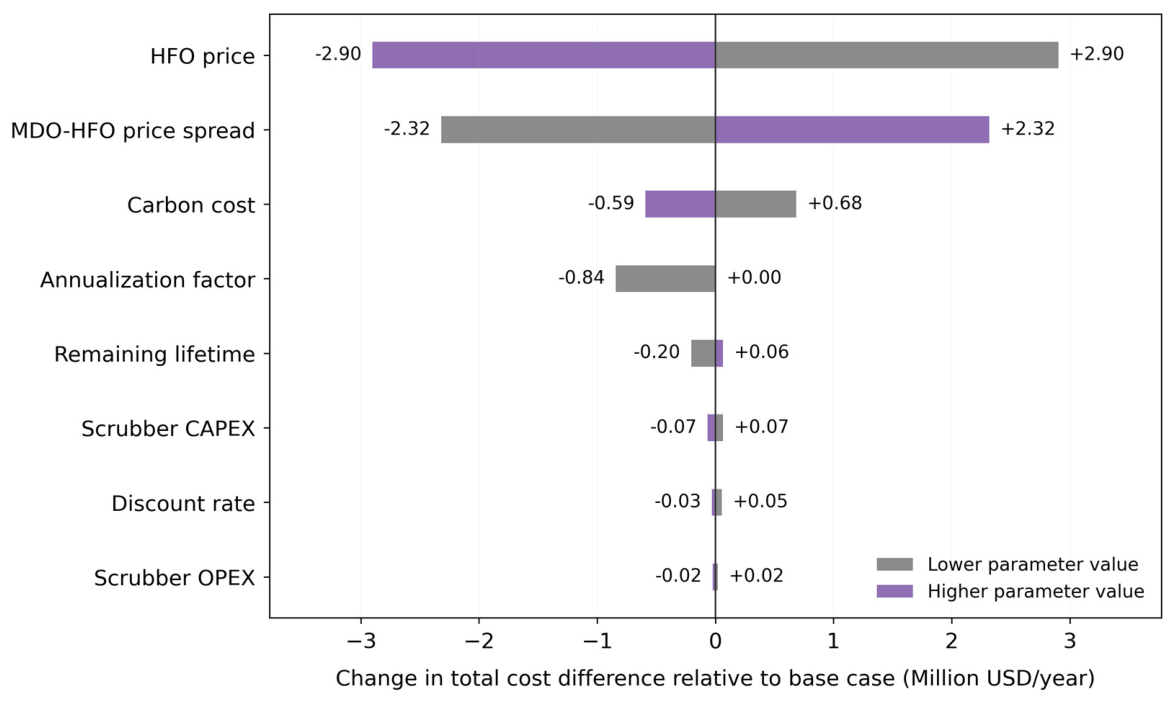
The sensitivity analysis was performed to determine which parameters most strongly influence the economic ranking of HFO with scrubbers and MDO switching. The results are summarized in
Figure 6, where the sensitivity metric is the variation in the total cost difference between MDO switching and HFO with scrubbers in 2035 relative to the base case. Positive values indicate an increase in the cost advantage of HFO with scrubbers, whereas negative values indicate that MDO switching becomes more economically attractive.
The results show that the HFO price is the most influential parameter. This is expected because the scrubber-based strategy relies directly on the continued use of lower cost HFO. A reduction in HFO price increases the economic advantage of the scrubber scenario, while an increase in HFO price reduces this advantage and moves the system closer to fuel switching competitiveness.
The second most influential parameter is the MDO-HFO price spread. A lower spread improves the competitiveness of MDO switching, whereas a higher spread reinforces the economic advantage of HFO with scrubbers. This confirms that the fuel price relationship between HFO and MDO is the main market condition determining whether fuel switching can become economically attractive.
Carbon cost exposure is the third most relevant factor. Higher carbon cost assumptions reduce the advantage of HFO with scrubbers because this scenario has higher energy consumption and higher prospective carbon cost exposure than MDO switching. However, within the range considered, carbon cost variations are not sufficient to reverse the economic ranking.
The annualization factor also has a noticeable effect, reflecting the influence of annual operating activity on fuel consumption, emissions and carbon cost exposure. Lower annual activity reduces the absolute cost difference between the two strategies. By contrast, scrubber CAPEX, scrubber OPEX, discount rate and remaining lifetime have a smaller effect on the total cost difference under the base case assumptions. This indicates that, for the case study vessel, the economic ranking is primarily driven by fuel market conditions and carbon cost exposure rather than by scrubber investment parameters.
In addition to the economic sensitivity analysis, a separate parametric check was performed to evaluate how uncertainty in scrubber removal efficiencies affects SO
x and PM emission outcomes. This analysis was kept separate from the economic tornado plot because SO
x and PM removal efficiencies affect local pollutant emissions, but do not directly modify the total cost difference used as the economic sensitivity metric in
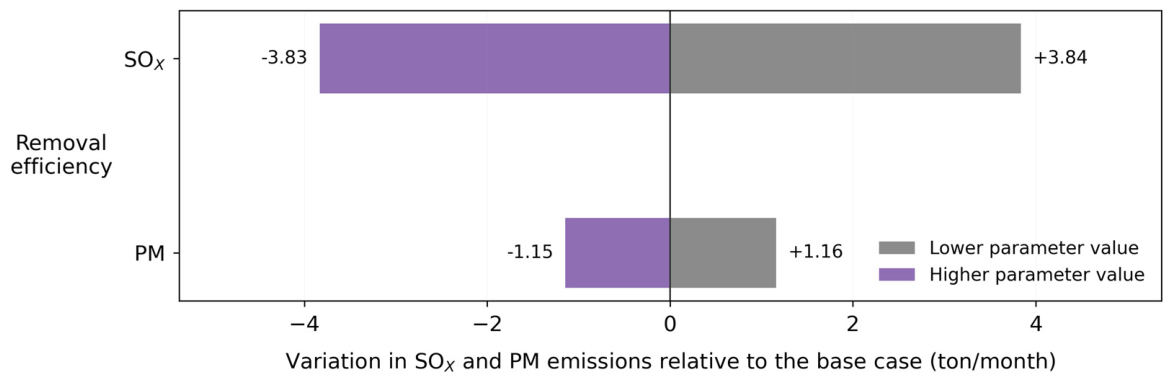
Figure 6. The results are shown in
Figure 7.
Figure 7 shows that the SO
x emissions are more sensitive in absolute terms to changes in removal efficiency than PM, because the gross SO
x emissions before scrubbing are substantially higher. Within the tested range, SO
x emissions vary by approximately ±3.8 tons per month relative to the base case, while PM emissions vary by approximately ±1.2 tons per month. However, the qualitative interpretation remains unchanged: the scrubber configuration continues to provide substantial SO
x reductions, whereas its effect on PM emissions remains comparatively limited. Therefore, uncertainty in scrubber removal efficiency affects the magnitude of the local pollutant outcomes, but it does not alter the relative economic ranking between HFO with scrubbers and MDO switching.
Overall, the sensitivity analysis indicates that HFO with scrubbers remains the lower cost strategy within the uncertainty ranges considered. However, the relative economic advantage decreases when HFO prices increase, when the MDO-HFO price spread decreases, or when carbon cost exposure becomes more stringent.
3.7. Techno-Economic Implications for Aging Cruise Vessels
The results of this study highlight the need for integrated decision support tools for shipowners operating existing vessels. In a technology-neutral regulatory environment, different compliance pathways may coexist, but their environmental and economic consequences depend on multiple interacting variables. Therefore, compliance decisions should account simultaneously for local pollutant emissions, fuel-related GHG intensity, fuel market conditions, retrofit costs and regulatory uncertainty. The discussions at MEPC 84 further support this interpretation, since different regulatory architectures remain under consideration and the balance between technical requirements, GHG pricing and market readiness remains unresolved [
15].
Overall, the case study suggests that transition strategies for aging cruise vessels should be evaluated through conditional techno-economic and regulatory thresholds rather than fixed technology rankings. For the vessel analyzed, the key decision is not simply whether scrubbers reduce SOx or whether MDO reduces prospective carbon cost exposure, but whether future market and regulatory conditions are sufficient to alter the relative competitiveness of the evaluated compliance pathways over the remaining lifetime of the ship.
The present assessment focused on operational atmospheric emissions, fuel-related Tank-to-Wake GHG performance and techno-economic implications under the assumptions considered. Consequently, broader lifecycle and marine environmental impacts, including Well-to-Wake emissions and the potential ecotoxicological effects of open-loop scrubber washwater discharge, were not quantified and may influence the broader environmental and techno-economic assessment of the evaluated strategies under specific regulatory or environmental contexts. In particular, the future adoption of Well-to-Wake based greenhouse gas accounting frameworks could modify the relative carbon performance of HFO and MDO pathways, depending on upstream fuel production and supply chain emissions. Furthermore, the increasing adoption of local or regional restrictions on open-loop scrubber discharge may reduce the operational flexibility of scrubber-based compliance strategies in certain ports or coastal areas. Under these conditions, vessels may require temporary fuel switching, hybrid operation or additional compliance procedures, potentially increasing operational complexity and associated operating costs.
In addition, the pollutant sensitivity analysis showed that the magnitude of the SOx and PM reductions achieved with scrubbers depends on the assumed removal efficiency, particularly for PM emissions, although the overall comparative interpretation remained unchanged within the evaluated range.
Moreover, the present analysis assumes stable scrubber energy penalties and operating performance over the evaluated period and does not explicitly account for long-term variations associated with equipment aging, maintenance scheduling, fouling effects or operational degradation.
The annualization of a one-month operational dataset introduces uncertainty associated with seasonal variability in cruise vessel operation, although the use of real operational data combined with scenario-based sensitivity analysis provides a useful comparative framework for evaluating sulphur compliance strategies under evolving market and regulatory conditions. Consequently, the emissions and economic results should be interpreted as scenario-dependent comparative outcomes under the operational assumptions considered.
Finally, the CII framework for cruise passenger ships also remains under discussion, including proposals for alternative metrics such as Carbon Intensity per Gross Ton-Hour (cgHRS). Therefore, the CII values reported in this study were used only as contextual indicators of recent operational performance and not as a basis for ranking the evaluated sulphur compliance strategies.
4. Conclusions
This study assessed the environmental and techno-economic implications of alternative sulphur compliance strategies for an aging cruise vessel using real operational data. Three configurations were evaluated: a counterfactual HFO baseline, HFO operation with open-loop scrubbers, and full switching to MDO. The analysis integrated pollutant emissions, fuel-related Tank-to-Wake GHG intensity, prospective carbon cost exposure, total cost assessment, break-even fuel price spread and sensitivity analysis.
From an emissions perspective, both SOx compliant strategies substantially improved sulphur performance compared with the HFO baseline, although through different trade-offs. HFO operation with scrubbers significantly reduced SOx emissions by 96.9%, but increased fuel consumption and associated CO2 emissions due to the additional energy demand of the exhaust gas cleaning system. In contrast, MDO switching achieved the largest reductions in SOx emissions by more than 99% and PM emissions by 88.8%, while also reducing CO2 emissions by 4.6%. However, NOx emissions remained practically unchanged.
The additional sensitivity analysis on scrubber removal efficiency indicated that the magnitude of the SOx and PM reductions depends on the assumed removal performance, particularly for PM emissions. Nevertheless, the overall comparative interpretation of the evaluated compliance strategies remained robust within the tested range.
The fuel-related Tank-to-Wake GHG intensity analysis indicated that scrubber operation did not improve carbon intensity per unit of fuel energy because the same fuel type was retained. Consequently, MDO switching showed lower prospective carbon cost exposure under all carbon cost assumptions considered. However, these results should be interpreted as scenario-based comparative estimates rather than formal compliance calculations, since the assessment was limited to the Tank-to-Wake segment.
Under the assumptions considered, the total cost assessment indicated that HFO operation with scrubbers remained the lower cost SOx compliance strategy across all selected years and carbon cost scenarios. Although prospective carbon cost exposure progressively reduced its economic advantage, the difference was not sufficient to offset the fuel price premium associated with MDO switching under the base case fuel market conditions. In 2035, the cost advantage of HFO with scrubbers ranged from USD 5.30 million per year under the low carbon cost scenario to USD 4.03 million per year under the high carbon cost scenario.
The break-even analysis and sensitivity assessment showed that the relative economic performance of the evaluated strategies is strongly conditioned by fuel market dynamics, particularly HFO price and the MDO-HFO price spread, followed by carbon cost exposure. By contrast, scrubber CAPEX, OPEX and discount rate showed a comparatively smaller influence under the assumptions considered. These findings suggest that, for aging vessels already equipped with scrubbers, operational fuel costs and future carbon pricing assumptions may have a greater influence on compliance decisions than retrofit investment parameters alone.
Overall, the study demonstrates that the relative environmental and economic performance of scrubber-based sulphur compliance depends strongly on fuel price spreads, carbon cost exposure and operational assumptions. For the case study vessel, HFO operation with scrubbers remains economically preferable under the fuel market and carbon cost assumptions evaluated, despite its higher fuel consumption and prospective carbon cost exposure. Conversely, MDO switching provides lower local pollutant and fuel-related carbon exposure but remains economically constrained by its fuel price premium.
These findings support the use of integrated decision support approaches for existing and aging vessels operating under increasing regulatory uncertainty. From a sustainability perspective, the study contributes by showing that sulphur compliance decisions should not be based on a single environmental or economic criterion, but on the combined evaluation of local pollutant reduction, fuel-related carbon exposure, operational feasibility and cost robustness. This framework can support more transparent and sustainability-oriented compliance planning for aging vessels during the transition towards stricter maritime environmental regulations. Future work should extend the analysis to additional vessel types, longer operational datasets, alternative fuels, Well-to-Wake emission factors and broader marine environmental impacts associated with open-loop scrubber washwater discharge.