Article

Digital–Intelligent Technology Innovation, Urban Pollution–Carbon Synergy, and Sustainable Urban Transition in China: Mechanisms, Boundary Conditions, and Spatial Spillovers

1
School of Economics, Northwest Minzu University, Lanzhou 730030, China
2
School of Management and Economics, University of Electronic Science and Technology of China, Chengdu 611731, China
*
Authors to whom correspondence should be addressed.
Sustainability 2026, 18(11), 5486; https://doi.org/10.3390/su18115486
Submission received: 7 May 2026 / Revised: 26 May 2026 / Accepted: 27 May 2026 / Published: 30 May 2026

Abstract

This study examines whether digital–intelligent technology innovation supports sustainable urban transition by improving urban pollution–carbon synergy in China. Using panel data for 278 prefecture-level cities from 2012 to 2023, we measure digital–intelligent technology innovation by the per capita intensity of patent applications in key digital–intelligent technology fields and construct an urban pollution–carbon synergy index based on a global non-radial directional distance function combined with data envelopment analysis. The results show that digital–intelligent technology innovation is positively associated with urban pollution–carbon synergy, and this finding remains robust to alternative variable definitions, sample adjustments, alternative frontier settings, and supplementary identification strategies. Further analyses suggest that the relationship is stage-dependent rather than purely linear, with stronger sustainability gains emerging after critical development thresholds are crossed. Channel analyses indicate that green technological innovation, digital inclusive finance, and AI firm agglomeration are important routes through which digital–intelligent innovation is translated into environmental governance capacity. Additional analyses show that the effect is stronger on the carbon mitigation dimension than on the pollution reduction dimension, is more pronounced in cities with higher human capital and more developed financial technology, and exhibits both temporal persistence and spatial spillover effects. In addition, digital–intelligent technology innovation is associated with higher energy efficiency, lower total energy consumption, and lower PM2.5, SO2, total CO2 emissions, and CO2 intensity. Overall, these findings contribute to the sustainability literature by showing that digital–intelligent innovation can facilitate sustainable urban transition when it is effectively transformed through green innovation, financial support, and local application scenarios.

1. Introduction

China’s green and low-carbon transition is not merely a matter of reducing emissions; it also concerns whether cities can sustain economic output while improving the way they transform capital, labor, and energy under environmental constraints. As the principal carriers of industrial production and energy consumption, cities face a dual challenge: they must maintain economic growth while reducing both conventional pollutants and carbon emissions. For many years, the development of some Chinese cities relied heavily on expanded energy inputs and energy-intensive industries. Although this growth model supported output expansion, it also locked cities into high energy consumption and substantial environmental pressure. Therefore, the evaluation of urban transition through only GDP growth, carbon intensity, or a single pollutant indicator provides an incomplete picture. A more appropriate perspective is to ask whether cities can reduce pollution and carbon emissions jointly while maintaining output with given resource inputs. The synergistic efficiency of pollution reduction and carbon mitigation provides such a perspective [1]. This study contributes to the sustainability literature by explaining how digital–intelligent technology innovation can be transformed into urban pollution–carbon governance capacity and, in turn, support sustainable urban transition.
At the same time, digital and intelligent technologies are becoming increasingly embedded in production systems, energy management, and environmental governance. Technologies such as artificial intelligence, high-end chips, quantum information, the Internet of Things, blockchain, the industrial Internet, and other related intelligent digital systems do more than expand digital connectivity. Their common feature is that they improve sensing, data processing, algorithmic decision-making, real-time coordination, and feedback control. In production, these technologies may support real-time monitoring, process optimization, equipment coordination, and more accurate energy allocation. In environmental governance, they may improve pollution source identification, emissions monitoring, early-warning systems, and regulatory responsiveness. In this sense, digital–intelligent technology may affect urban green transition not simply by adding a new technology input, but by changing the informational and coordinative conditions under which energy use and environmental governance operate [2].
However, the environmental value of digital–intelligent technology should not be taken for granted. Innovation reflected in patents does not automatically reduce energy use or emissions. Whether digital–intelligent technology can improve environmental performance depends on whether it can be translated into cleaner production, energy management systems, green innovation, financial support for green upgrading, and concrete application scenarios in industry and governance. A city may accumulate digital–intelligent patents, yet if these technologies remain detached from industrial upgrading, energy-saving equipment, pollution control technologies, or carbon management practices, their environmental value will remain limited. Therefore, the key question is not only whether digital–intelligent technology improves urban environmental performance, but how such innovation is transformed into pollution–carbon governance capacity [3].
Conceptually, this study views digital–intelligent innovation through the joint lens of green growth and absorptive capacity. The green growth perspective implies that sustainable urban transition should be evaluated not by emission reduction alone, but by whether cities can improve economic–environmental performance under the joint constraints of pollution and carbon governance. Absorptive capacity theory further suggests that new technological knowledge does not automatically generate performance gains; its value depends on whether local actors can absorb, adapt, finance, and apply it in concrete production and governance settings. Taken together, these perspectives imply that digital–intelligent innovation is unlikely to have a uniform or automatic environmental effect. Its environmental value must be realized through a conversion process, and that process may depend on local human capital, financial support, and industrial application conditions.
Existing studies have examined how the digital economy, digital finance, artificial intelligence, digital infrastructure, and digital technology innovation affect energy efficiency, environmental pollution, and carbon emissions [4]. While this literature provides important evidence, three gaps remain. First, much of the existing research focuses on a single outcome, such as carbon intensity, pollutant emissions, or energy efficiency [5], and therefore does not fully capture the coordination problem between pollution reduction and carbon mitigation. Yet these two objectives are closely linked through energy use, industrial structure, and production technology, while not always following the same governance logic. Second, many studies rely on broad indicators such as the digital economy, digital infrastructure, or overall digital patents. Although informative, these measures do not clearly isolate the subset of technologies with stronger intelligent characteristics, namely those related to intelligent sensing, algorithmic processing, connected control, and adaptive feedback. Third, the environmental effect of digital technology is often treated as direct and linear, whereas in practice it may be conditional and stage-dependent [6]. In the early stage, digital infrastructure construction and digital industrial expansion may increase electricity demand and resource consumption [7]. The environmental gains of digital–intelligent innovation may emerge only when complementary capabilities, financial support, and application scenarios become sufficiently mature [8].
This study addresses these issues using panel data for 278 prefecture-level cities in China from 2012 to 2023. We measure digital–intelligent technology innovation by the per capita patent intensity of seven key digital–intelligent technology fields: artificial intelligence, high-end chips, quantum information, the Internet of Things, blockchain, the industrial Internet, and the metaverse. This measure differs from broad digital economy indicators or generic digital patent measures in that it focuses on city-level knowledge accumulation in technologies that more directly embody intelligent sensing, algorithmic control, interconnection, and adaptive coordination. We then construct an urban pollution–carbon synergy index using a global non-radial directional distance function combined with data envelopment analysis. In this framework, capital, labor, and energy are treated as inputs; gross regional product is treated as the desirable output; and PM2.5, industrial SO2, and CO2 emissions are treated as undesirable outputs. Compared with single pollution, carbon, or green efficiency indicators, this setting better captures whether cities can jointly improve economic output and reduce both conventional pollutants and carbon emissions within a unified efficiency framework [9].
Our empirical results show that digital–intelligent technology innovation is positively associated with urban pollution–carbon synergy. This relationship remains robust to alternative variable definitions, sample adjustments, alternative frontier settings, and supplementary identification strategies. Additional analyses further suggest that the environmental returns to digital–intelligent innovation may be stage-dependent rather than uniformly linear. In particular, the gains from digital–intelligent innovation are more likely to emerge when cities possess stronger absorptive and supporting conditions. Channel analyses further show that green technological innovation, digital inclusive finance, and AI firm agglomeration are important routes through which digital–intelligent innovation is translated into environmental governance capacity [10]. These findings indicate that digital–intelligent technology should not be understood as a direct emission reduction instrument, but as a technological foundation whose environmental value depends on whether it can be converted into green technology supply, financial support, and concrete application scenarios.
Further analyses reinforce this interpretation. Decomposition results show that digital–intelligent technology innovation improves both pollution reduction synergy and carbon mitigation synergy, with a stronger effect on the carbon mitigation dimension. Consistency checks based on energy use and emission outcomes show that digital–intelligent technology innovation is associated with higher energy efficiency, lower total energy consumption, and lower PM2.5, SO2, total CO2 emissions, and CO2 intensity. Additional tests also show that this relationship persists over time, diffuses across space, and is stronger in cities with higher human capital and more developed financial technology. Taken together, these findings suggest that the environmental effect of digital–intelligent innovation is not only conditional and cumulative, but also spatially connected.
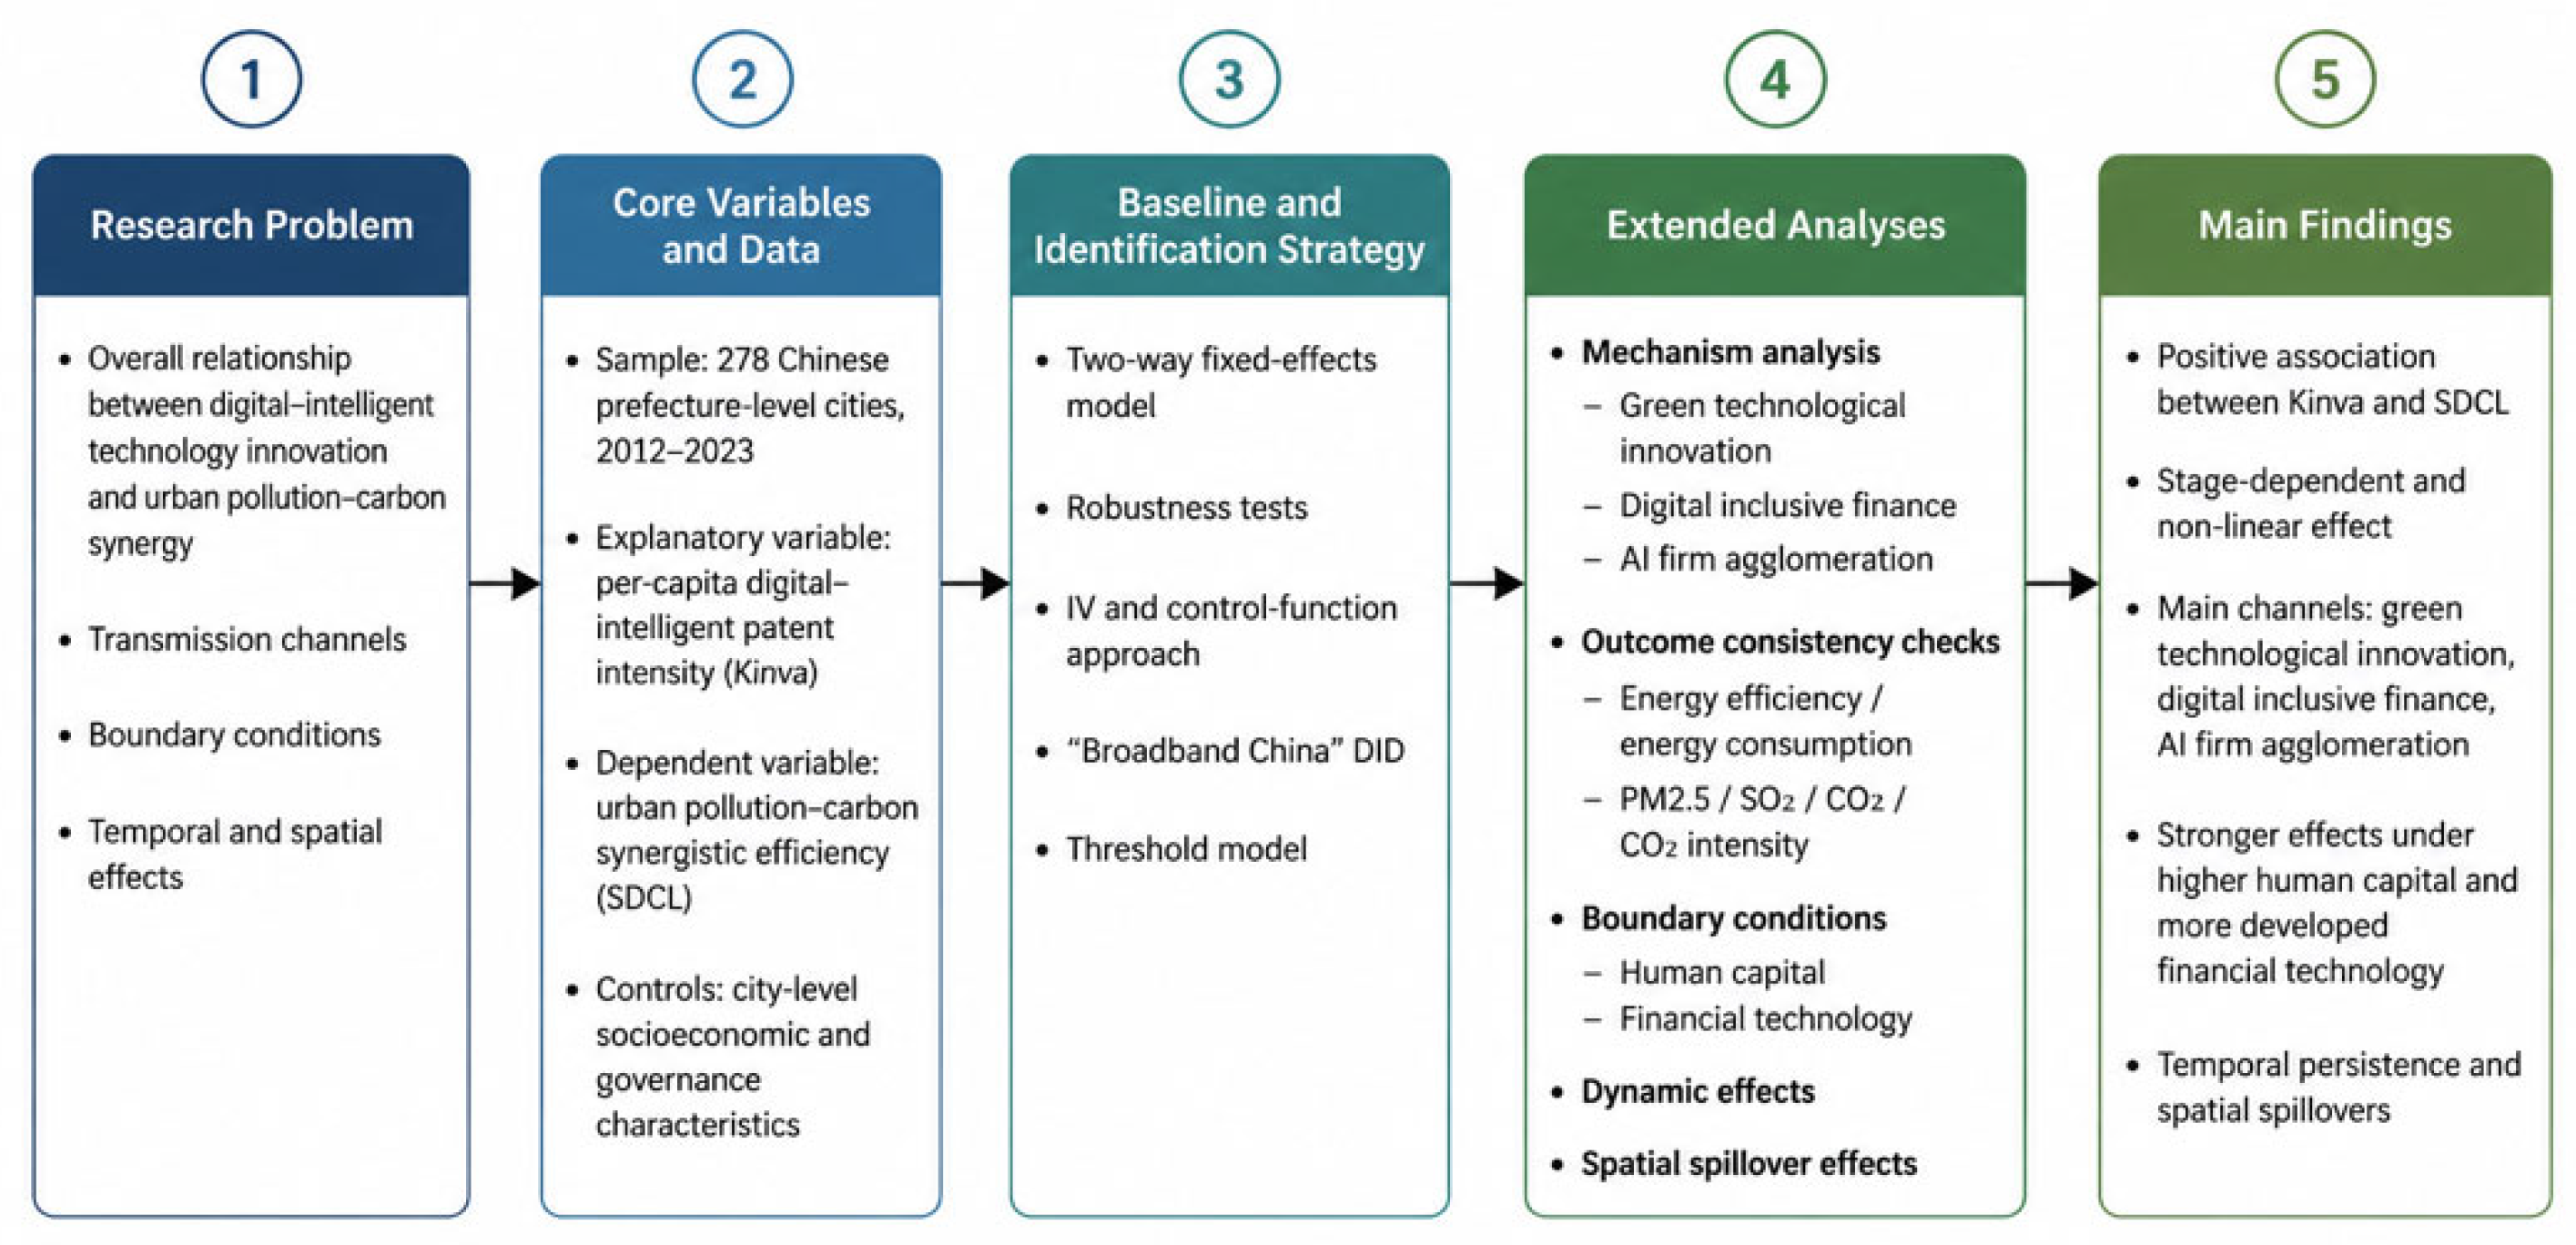
Rather than claiming to introduce an entirely new empirical setting or method, this study seeks to refine how the environmental role of digital–intelligent innovation is conceptualized and measured, and to explain how such innovation is converted into urban pollution–carbon governance capacity. It contributes to the literature in three main respects. First, it refines the measurement of digital technological change by focusing on key digital–intelligent technology innovation rather than broad digital economy indicators or generic digital patent measures. By using the per capita intensity of patents in seven key digital–intelligent technology fields, this study captures the city-level accumulation of technologies characterized by intelligent sensing, algorithmic processing, connected control, and adaptive coordination. Second, this study examines urban green transition through the lens of pollution–carbon synergy rather than single outcomes, such as carbon emissions, air pollution, or green efficiency alone. The DDF-DEA framework used in this study evaluates whether cities can improve economic performance under the joint constraints of pollution reduction and carbon mitigation, thereby offering a more integrated assessment of urban green transition. Third, this study explains how digital–intelligent innovation is transformed into urban pollution–carbon governance capacity. Rather than stopping at whether digital–intelligent innovation matters, this study demonstrates through what channels this transformation occurs, under what local conditions it becomes stronger, and how it unfolds across time and space. In this sense, this study integrates mechanisms, enabling conditions, temporal persistence, and spatial spillovers into a unified analytical framework of technological transformation. To provide an overview of the study design, Figure 1 presents the research framework of this study.

2. Theoretical Analysis and Hypotheses

This study builds on two complementary theoretical perspectives: green growth and absorptive capacity. From the perspective of green growth, the key issue is not only whether cities can reduce emissions, but whether they can improve economic performance while jointly reducing conventional pollutants and carbon emissions under resource and environmental constraints. From the perspective of absorptive capacity, the environmental value of digital–intelligent technology does not arise automatically from innovation itself. Rather, it depends on whether cities and firms can recognize, finance, absorb, and apply such technologies in production and governance processes [11]. Taken together, these perspectives imply that digital–intelligent technology innovation should be understood not as a direct emission reduction instrument, but as a technological foundation whose environmental value depends on transformation channels, enabling conditions, and diffusion processes [10]. Relative to existing studies that mainly focus on broad digital development, digital infrastructure, or single environmental outcomes, this framework highlights the incremental contribution of the present study by explaining how digital–intelligent technology innovation is translated into urban pollution–carbon synergistic efficiency through specific channels, under particular supporting conditions, and with dynamic and spatial extensions.
Digital–intelligent technology may affect urban pollution–carbon synergy by changing the informational conditions of production, energy use, and environmental governance. Urban emissions are determined not only by industrial scale or energy structure, but also by whether firms can observe energy use in real time, whether equipment operation can be adjusted promptly, and whether pollutant and carbon emissions can be identified before they accumulate into greater environmental costs. Under conventional production modes, firms often lack timely information on equipment status, energy consumption, and emissions. As a result, energy inputs may exceed actual production needs, while environmental governance tends to rely more on ex-post treatment than on real-time process control.
Digital–intelligent technologies, including artificial intelligence, the Internet of Things, the industrial Internet, and other data-driven intelligent systems, can partly change this pattern. Through sensing, real-time monitoring, data processing, and algorithmic analysis, these technologies help firms better match energy inputs with production demand, optimize production scheduling, and reduce ineffective energy consumption. On the governance side, they can improve the identification of pollution sources, emissions monitoring, and regulatory response. Therefore, their role is not simply to add another technology input, but to make production and governance more observable, connected, and adjustable. From the perspective of energy economics, digital–intelligent technology does not mainly reduce emissions by suppressing output. The more relevant effect of digital–intelligent technology lies in increasing output per unit of energy input and reducing energy consumption and emissions per unit of output. If digital–intelligent technology improves energy use efficiency on the production side and strengthens emissions monitoring on the governance side, cities may reduce PM2.5, SO2, and CO2 emissions while maintaining economic output. This process can improve the synergistic efficiency of pollution reduction and carbon mitigation [12].
At the same time, this relationship may not be purely linear. In the early stage, digital–intelligent innovation may require infrastructure expansion, equipment upgrading, organizational adaptation, and complementary investment, all of which may increase energy use and adjustment costs. Therefore, the environmental benefits of digital–intelligent innovation may remain weak or even fail to appear immediately. However, as digital–intelligent innovation accumulates and becomes embedded in production, finance, and governance systems, its effects on efficiency improvement and emission reduction are more likely to become evident. This suggests that the environmental effect of digital–intelligent technology innovation may be stage-dependent and may become stronger only after key development thresholds are crossed.
Accordingly, the following hypothesis is proposed:
H1. 
Digital–intelligent technology innovation improves the urban synergistic efficiency of pollution reduction and carbon mitigation, but this effect may exhibit non-linear and stage-dependent characteristics.
Green technological innovation is one channel through which digital–intelligent technology may be converted into pollution–carbon synergy. Pollution reduction and carbon mitigation require more than lower energy use; they also depend on energy-saving technologies, cleaner production technologies, pollution control technologies, and carbon mitigation technologies. Digital–intelligent technology can reduce the costs of information search, technical matching, and R&D coordination. Firms may use data analysis to identify energy-intensive links, algorithms to optimize production processes, and digital platforms to coordinate with research institutions, suppliers, and downstream users. These changes can improve the efficiency of green technology development and diffusion [13].
Green technological innovation then affects energy and emission outcomes more directly. Energy-saving and cleaner production technologies reduce energy consumption per unit of output, while pollution control and carbon mitigation technologies reduce PM2.5, SO2, and CO2 emissions during production [14]. When combined with digital–intelligent technology, green innovation is less likely to remain an isolated technical improvement and more likely to be embedded in energy management, equipment operation, emissions monitoring, and environmental governance. In this sense, digital–intelligent technology contributes to pollution–carbon synergy when it is transformed into a green technology supply.
Accordingly, the following hypothesis is proposed:
H2. 
Digital–intelligent technology innovation is positively associated with urban pollution–carbon synergistic efficiency through the channel of green technological innovation.
Digital inclusive finance provides a second transformation path. Green R&D, energy-saving equipment upgrading, clean energy use, and pollution control projects usually require large initial investment, involve long payback periods, and carry considerable uncertainty. These characteristics make financing constraints a common obstacle, especially for small- and medium-sized firms. Under conventional financial arrangements, financial institutions may lack sufficient information on firms’ green projects, energy consumption conditions, and emission reduction potential. As a result, projects with environmental value may not receive adequate financial support.
Digital–intelligent technology can improve financial allocation by strengthening data collection, risk identification, and online service delivery. Through digital payments, online credit, big-data risk control, and platform-based financial services, digital inclusive finance can lower service costs and expand credit access to firms that are difficult to reach through traditional channels. For urban pollution–carbon synergy, this means that more firms may obtain funding for energy-saving renovation, green technology adoption, and low-carbon investment. Digital inclusive finance may also guide capital away from energy-intensive activities and toward projects with greater energy-saving and emission reduction potential. Therefore, digital–intelligent technology may improve pollution–carbon synergy by easing financial constraints in the green transformation process [15].
Accordingly, the following hypothesis is proposed:
H3. 
Digital–intelligent technology innovation is positively associated with urban pollution–carbon synergistic efficiency through the channel of digital inclusive finance.
AI firm agglomeration reflects whether digital–intelligent technology has sufficient industrial carriers and application scenarios. Digital patents and algorithms do not automatically enter production or governance. Their environmental value depends on whether they can be translated into concrete services, equipment, software, and management systems. Cities with stronger AI firm agglomeration usually have more firms engaged in algorithm development, data processing, intelligent equipment, industrial software, and scenario-based services. These firms can provide solutions for manufacturing enterprises, energy management departments, and environmental governance agencies, making it easier for digital–intelligent technology to enter production scheduling, energy monitoring, pollution identification, and carbon emission management.
In production, AI applications can optimize equipment operation and production scheduling, thereby reducing energy waste. In environmental governance, they can help identify pollution sources, predict emission risks, and improve regulatory response. In carbon management, they can support carbon accounting, energy consumption monitoring, and the design of emission reduction pathways [16]. Therefore, AI firm agglomeration indicates more than a larger number of digital firms; it reflects stronger implementation capacity and richer application scenarios. The higher the level of AI firm agglomeration, the more likely digital–intelligent technology is to be translated into energy efficiency improvement and pollution–carbon reduction.
Accordingly, the following hypothesis is proposed:
H4. 
Digital–intelligent technology innovation is positively associated with urban pollution–carbon synergistic efficiency through the channel of AI firm agglomeration.
Although the above variables describe transformation channels, the strength of this transformation may still depend on local supporting conditions. A city may possess digital–intelligent patents or a growing stock of digital knowledge, but this does not mean that such innovation can immediately generate energy-saving or emission reduction outcomes. According to absorptive capacity theory, the translation of new knowledge into actual performance depends on whether local actors can understand, finance, and implement it in practice. Therefore, in this study, we distinguish between time-varying transformation channels and pre-existing boundary conditions. Green technological innovation, digital inclusive finance, and AI firm agglomeration are treated as channels through which digital–intelligent innovation is translated into environmental governance capacity. By contrast, human capital and financial technology are treated as boundary conditions that shape how effectively such a transformation can occur.
Human capital affects whether firms and governments can understand, absorb, and apply digital–intelligent technology. Cities with higher human capital are better able to embed digital tools into production management, energy scheduling, and pollution control [17]. Financial technology affects whether green projects can obtain timely and efficient financial support. It improves financial service efficiency and helps meet the capital demand of green R&D, equipment upgrading, and low-carbon investment [18]. Where these supporting conditions are weak, digital–intelligent technology may remain a technological stock rather than being converted into actual environmental governance capacity.
Accordingly, the following hypothesis is proposed:
H5. 
The positive relationship between digital–intelligent technology innovation and urban pollution–carbon synergistic efficiency is stronger in cities with higher human capital and more developed financial technology.
Finally, the transformation of digital–intelligent technology into pollution–carbon governance capacity may not remain confined to the local city. Once digital–intelligent technologies are embedded in green innovation, financial allocation, and industrial application scenarios, their effects may diffuse through intercity knowledge spillovers, industrial collaboration, talent mobility, and the sharing of governance practices. In this sense, spatial spillovers should be understood as an extension of the same transformation process rather than as an isolated empirical result. Therefore, the local conversion of digital–intelligent innovation into governance capacity may generate not only within-city environmental gains, but also cross-city diffusion effects.
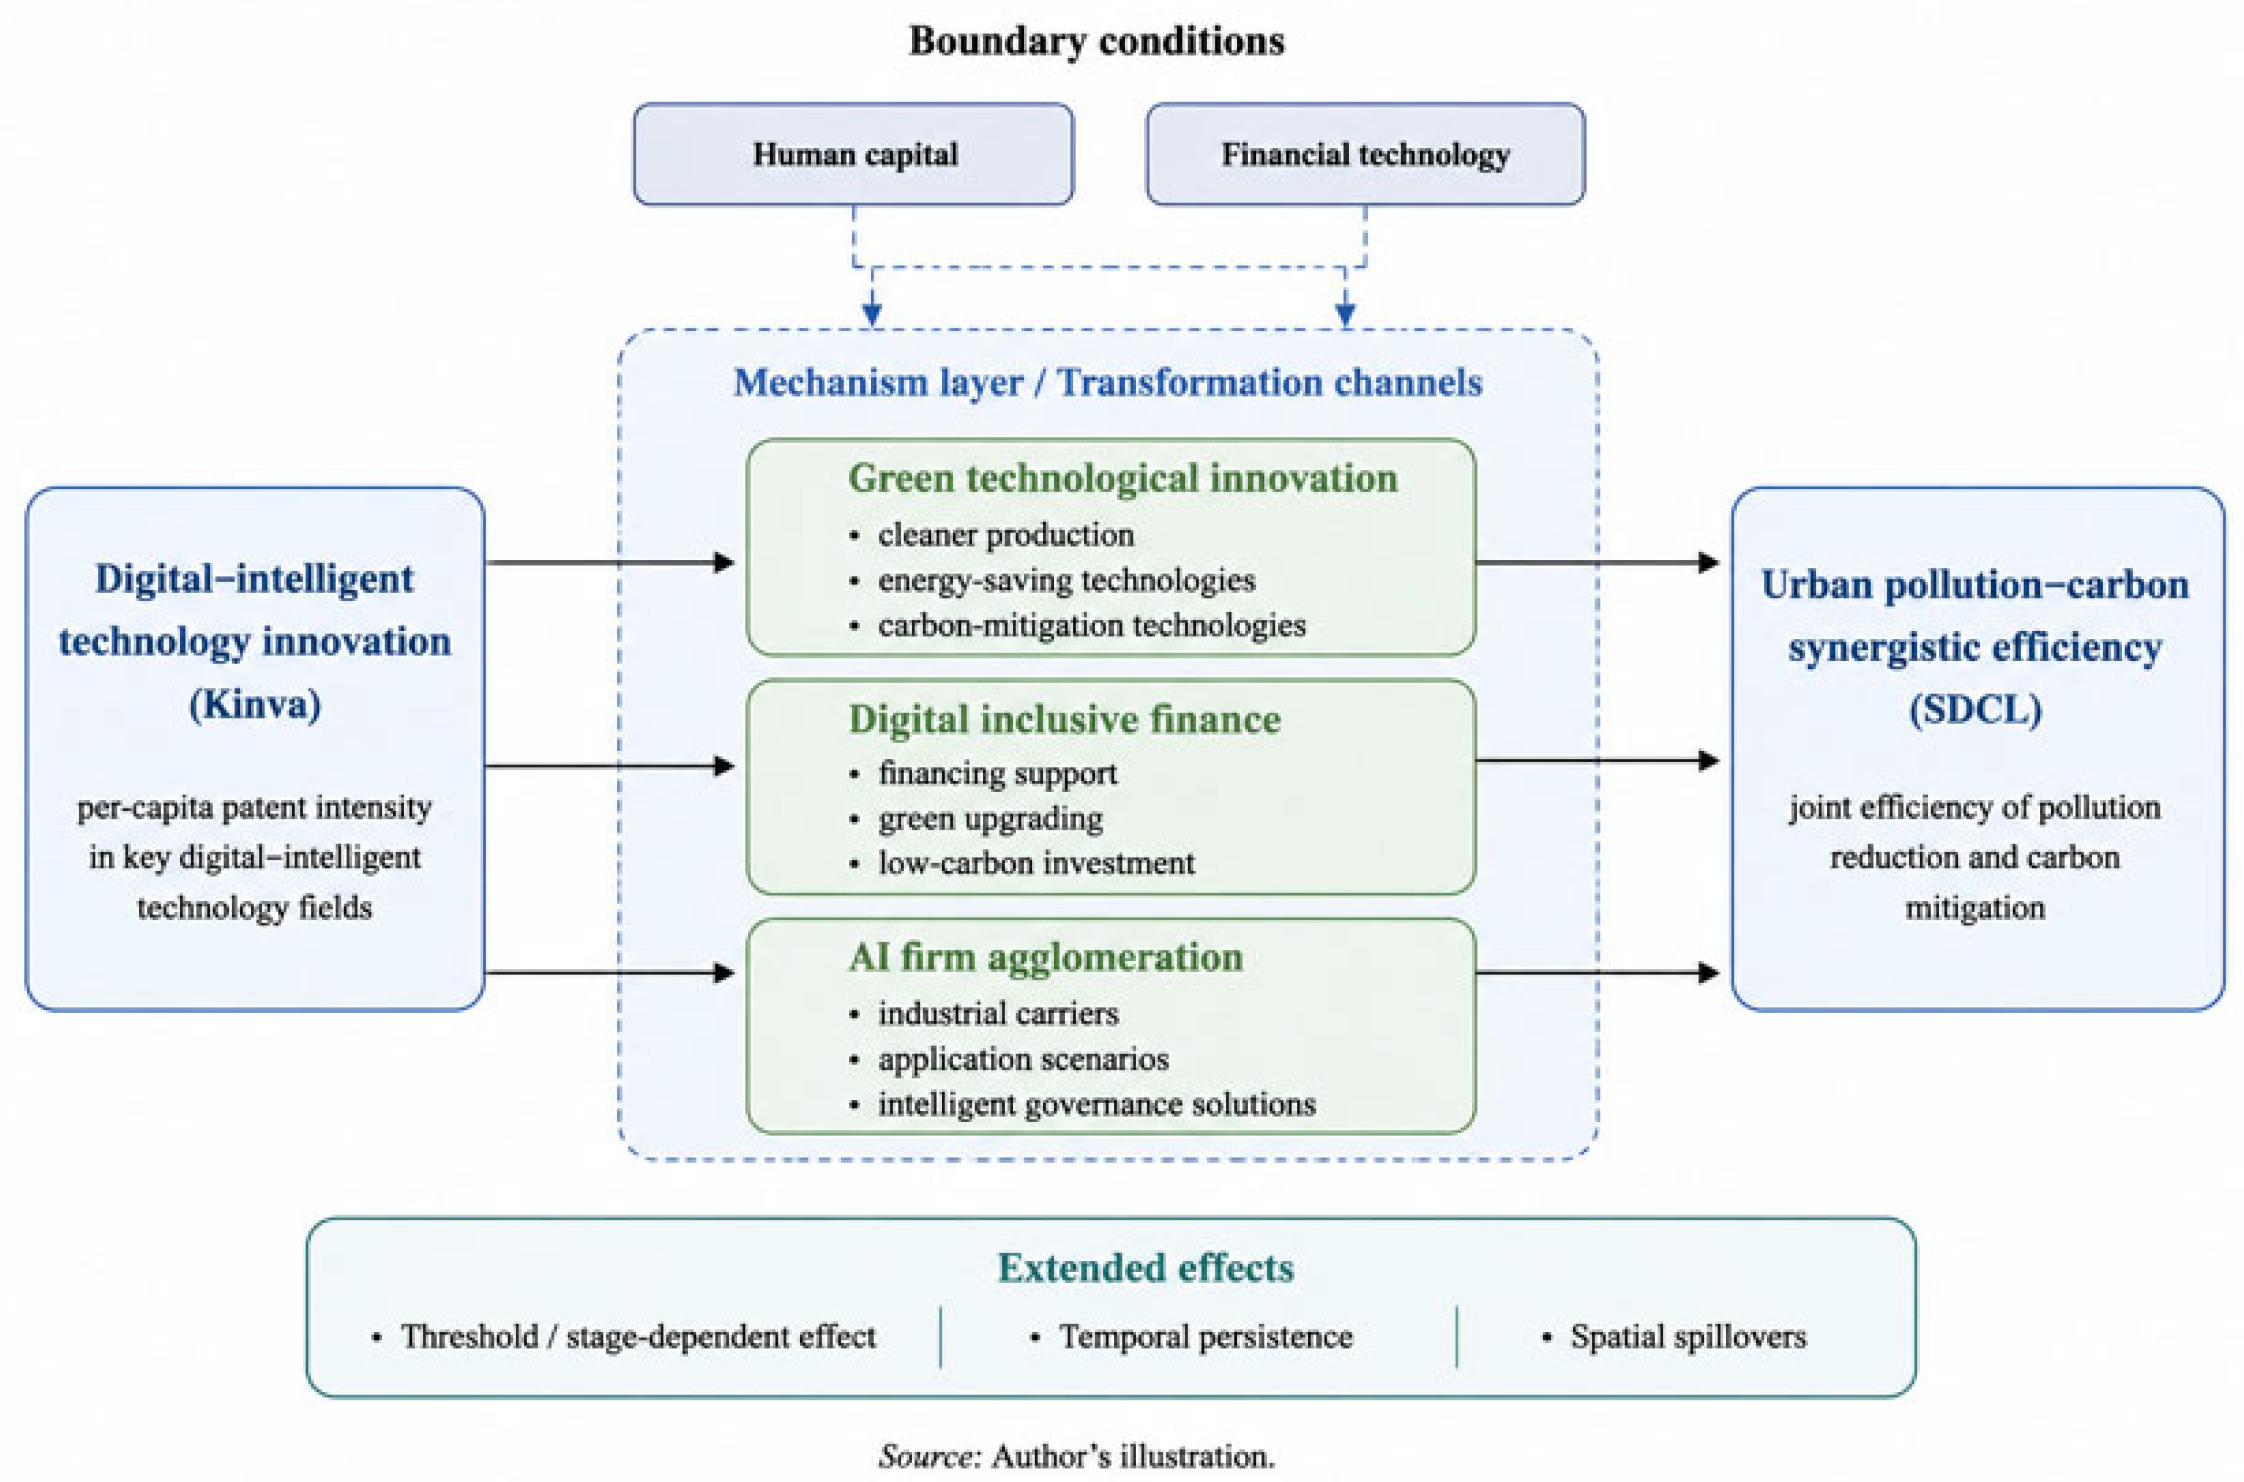
Based on the above theoretical analysis, Figure 2 illustrates the transformation channels, boundary conditions, and extended effects linking digital–intelligent technology innovation to urban pollution–carbon synergistic efficiency.

3. Model and Data

3.1. Econometric Model

To examine the relationship between digital–intelligent technology innovation and the urban synergistic efficiency of pollution reduction and carbon mitigation, this study first estimates a two-way fixed effects model. Cities differ in resource endowments, industrial foundations, governance capacity, and historical development paths, all of which may affect both digital–intelligent technology innovation and pollution–carbon synergy. In addition, macroeconomic fluctuations, changes in energy prices, and adjustments in environmental policies may exert common effects across cities in different years. Therefore, the baseline model controls for both city fixed effects and year fixed effects [19]. The baseline specification is as follows:
S D C L i t = α 0 + α 1 K i n v a i t + α 2 X i t + μ i + λ t + ε i t
where S D C L i t denotes the synergistic efficiency of pollution reduction and carbon mitigation in city i in year t . K i n v a i t denotes digital–intelligent technology innovation, measured by the per capita intensity of patent applications in key digital–intelligent technology fields. X i t is a set of control variables, including financial technology development, openness, digital infrastructure, human capital, urbanization rate, fiscal capacity, and population agglomeration; μ i denotes the city fixed effects, which control for time-invariant city characteristics; λ t denotes the year fixed effects, which control for common annual shocks; and ε i t is the random error term. Standard errors are clustered at the city level.
Although the two-way fixed effects model controls for time-invariant city characteristics and common time shocks, endogeneity concerns may still remain. First, reverse causality may arise because cities with better pollution–carbon synergy may have stronger fiscal capacity and policy incentives to invest in digital–intelligent technologies. Second, unobserved factors, such as local governance capacity, industrial policy orientation, and innovation environment, may simultaneously affect digital–intelligent technology development and pollution–carbon mitigation efficiency [20].
To mitigate these concerns, this study adopts an instrumental variable approach. The instrumental variable is constructed as the interaction between terrain ruggedness and the national growth rate of the telecommunication business. Terrain ruggedness captures the geographical difficulty of constructing and maintaining communication infrastructure [21]. In areas with greater terrain fluctuation, the deployment of fiber-optic networks, base stations, and related digital infrastructure usually faces higher engineering costs and weaker network accessibility. Therefore, this geographical condition may affect the long-term foundation and marginal improvement space of local digital–intelligent technology development. However, terrain ruggedness itself is largely determined by natural conditions and is unlikely to be directly shaped by current urban pollution–carbon performance.
The national growth rate of the telecommunication business provides time-varying variation in the expansion of China’s communication sector [22]. When the national telecommunication sector expands rapidly, cities with greater terrain-related communication constraints may experience larger marginal improvements because nationwide communication expansion helps relax previous infrastructure bottlenecks. By interacting terrain ruggedness with national telecommunication growth, the instrumental variable captures heterogeneous exposure to nationwide communication expansion caused by exogenous geographical constraints.
Therefore, the relevance condition is based on the fact that terrain conditions affect the cost, accessibility, and marginal returns of digital infrastructure construction, while national telecommunication growth determines the timing and intensity of communication sector expansion. Their interaction should be correlated with local digital–intelligent technology development. A positive first-stage coefficient can be interpreted as evidence consistent with a bottleneck relief or catch-up effect in more terrain-constrained cities. The exclusion restriction is not directly testable. Terrain ruggedness is a predetermined natural geographical feature, and national telecommunication growth is a macro-level shock common to all cities. Conditional on city fixed effects, year fixed effects, and city-level control variables, the interaction between terrain conditions and national telecommunication growth is less likely to directly affect the current synergistic efficiency of pollution reduction and carbon mitigation except through digital–intelligent technology development. Nevertheless, since terrain may also affect environmental performance through transportation costs, industrial location, energy use, and urban development patterns, the IV results are interpreted as supplementary evidence rather than definitive proof of causality.
The two-stage regression models are specified as follows:
K i n v a i t = β 0 + β 1 I V i t + β 2 X i t + μ i + λ t + u i t
S D C L i t = γ 0 + γ 1 K ı n v a ^ i t + γ 2 X i t + μ i + λ t + ν i t
where I V i t denotes the instrumental variable, and K ı n v a ^ i t is the fitted value of digital–intelligent technology development obtained from the first-stage regression. If γ 1 is significantly positive, it indicates that digital–intelligent technology continues to improve urban pollution–carbon synergy after potential endogeneity is partially addressed.
To further assess the validity of the instrumental variable, this study reports the first-stage regression results and the weak instrument test. A significant coefficient of the instrumental variable in the first stage would suggest that terrain-related exposure to telecommunication expansion affects local digital–intelligent technology development. The Kleibergen–Paap rk Wald F statistic is also reported to examine whether the instrument suffers from weak instrument problems. In addition, the baseline instrumental variable estimation is supplemented with stricter specifications, including province-by-year fixed effects. These tests help reduce the concern that the instrument affects pollution–carbon synergy through other geography-related development channels rather than through digital–intelligent technology.
Because the environmental effect of digital–intelligent technology innovation may be stage-dependent, this study further estimates a threshold model to test whether the relationship between K i n v a and S D C L changes across development regimes. Following the logic of non-linear transformation, the threshold specification is written as follows:
S D C L i t = κ 0 + κ 1 K i n v a i t I ( K i n v a i t τ 1 ) + κ 2 K i n v a i t I ( τ 1 < K i n v a i t τ 2 ) + κ 3 K i n v a i t I ( K i n v a i t > τ 2 ) + κ 4 X i t + μ i + λ t + ξ i t
where τ 1 and τ 2 denote the estimated threshold values, and I ( ) is an indicator function. If the estimated coefficients differ significantly across regimes, the relationship between digital–intelligent technology innovation and urban pollution–carbon synergy is better characterized as non-linear and stage-dependent rather than purely linear.
Beyond the baseline and endogeneity analyses, this study further examines potential transformation channels, observable energy and emission outcomes, boundary conditions, dynamic effects, and spatial spillovers. In the channel analysis, green technological innovation, digital inclusive finance, and AI firm agglomeration are introduced as channel variables to examine whether digital–intelligent technology innovation is associated with pollution–carbon synergy through green technology supply, financial resource allocation, and application scenario formation [23]. The corresponding specifications are as follows:
M i t = φ 0 + φ 1 K i n v a i t + φ 2 X i t + μ i + λ t + ϵ i t
S D C L i t = ψ 0 + ψ 1 K i n v a i t + ψ 2 M i t + ψ 3 X i t + μ i + λ t + ζ i t
where M i t denotes the mechanism variable, including green technological innovation, digital inclusive finance, and AI firm agglomeration. The first equation tests whether digital–intelligent technology innovation is associated with the channel variable, while the second equation tests whether the channel variable is further associated with urban pollution–carbon synergy. Since these channel variables may also evolve endogenously, the results are interpreted as channel-based evidence rather than definitive causal mediation estimates.
To further determine whether the improvement in synergistic efficiency corresponds to actual changes in energy use and environmental outcomes, this study also uses energy efficiency, total energy consumption, PM2.5, SO2, total CO2 emissions, and CO2 intensity as dependent variables [24]. These variables are not treated as strict mediating variables. Instead, they are examined as real outcome variables to assess whether the effects of digital–intelligent technology are reflected in energy use and pollution–carbon emission outcomes [25].
For the boundary condition analysis, cities are divided into high- and low-level groups according to their initial levels of human capital and financial technology, and subgroup regressions were then conducted. To further test whether the differences between high- and low-level groups are statistically meaningful, the following interaction model was estimated:
S D C L i t = ϕ 0 + ϕ 1 K i n v a i t + ϕ 2 K i n v a i t × H i g h i + ϕ 3 X i t + μ i + λ t + ω i t
where H i g h i is a dummy variable indicating whether a city belongs to the high-level group based on its initial characteristics. This variable corresponds, respectively, to cities with high human capital and high financial technology. Since H i g h i is a relatively time-invariant city-level characteristic, its separate term is absorbed after city fixed effects are controlled for. Therefore, the analysis focuses on the coefficient of the interaction term K i n v a i t × H i g h i . If ϕ 2 is significantly positive, the corresponding condition strengthens the positive effect of digital–intelligent technology on the synergistic efficiency of pollution reduction and carbon mitigation.
Considering that digital–intelligent technology may require time to move from patent application to production and governance applications, this study also constructs a dynamic effect model by including one-period, two-period, and three-period lagged digital–intelligent technology variables [26]:
S D C L i t = δ 0 + δ 1 K i n v a i , t k + δ 2 X i t + μ i + λ t + η i t , k = 1 , 2 , 3
If δ 1 remains significantly positive across different lag periods, it suggests that the effect of digital–intelligent technology on the synergistic efficiency of pollution reduction and carbon mitigation has a persistent transformation pattern, rather than merely reflecting a contemporaneous correlation.
Finally, considering the possible existence of technology diffusion, industrial linkages, and spillovers of environmental governance experience across cities, this study uses a spatial Durbin model to examine the spatial diffusion effect of digital–intelligent technology [27]. The model is specified as follows:
S D C L i t = ρ j = 1 N w i j S D C L j t + θ 1 K i n v a i t + θ 2 j = 1 N w i j K i n v a j t + θ 3 X i t + θ 4 j = 1 N w i j X j t + μ i + λ t + ξ i t
where W = ( w i j ) is the spatial weight matrix. This study uses a spatial adjacency matrix, a geographical distance matrix, and an economic–geographic nested matrix for the spatial analysis. j = 1 N w i j S D C L j t denotes the spatial lag of the synergistic efficiency of pollution reduction and carbon mitigation in surrounding cities, while j = 1 N w i j K i n v a j t denotes the spatial lag of digital–intelligent technology development in surrounding cities. The coefficient ρ captures the spatial dependence of pollution–carbon synergy, and θ 2 reflects the effect of digital–intelligent technology development in surrounding cities on local pollution–carbon synergy. If both the direct and indirect effects are significantly positive, digital–intelligent technology not only improves local synergistic efficiency, but it also promotes green and low-carbon performance in surrounding cities through spatial linkages [28].

3.2. Variable Definitions

3.2.1. Explanatory Variable

The core explanatory variable is digital–intelligent technology innovation, which is denoted as K i n v a . Digital–intelligent technology in this study refers to a group of key technologies that combine digital connectivity with intelligent sensing, data processing, algorithmic decision-making, and adaptive control. It covers seven fields: artificial intelligence, high-end chips, quantum information, the Internet of Things, blockchain, the industrial Internet, and the metaverse. Compared with broad indicators of the digital economy or generic digital patents, this measure focuses more directly on technological knowledge that is relevant to intelligent coordination, real-time monitoring, connected control, and scenario-based application in production and governance [29].
Specifically, based on the Classification System for Key Digital Technology Patents (2023) [30], this study identifies patents in the above seven categories and aggregates them to the prefecture-level city according to the location of the patent applicant. To reduce the mechanical bias associated with city size, the baseline measure of K i n v a is constructed as the per capita intensity of patent applications in key digital–intelligent technology fields. Thus, a higher value of K i n v a indicates a stronger local foundation of digital–intelligent technological innovation relative to city population size. In the robustness analysis, we further replace patent applications with granted patents and alternative transformations of the variable to assess whether the results depend on a specific measurement choice.

3.2.2. Dependent Variable

The dependent variable is the urban synergistic efficiency of pollution reduction and carbon mitigation, denoted as S D C L . Conventional carbon efficiency indicators usually focus on economic output efficiency under carbon emission constraints. However, in China’s urban green transition, pollution reduction and carbon mitigation often occur simultaneously, and both are closely related to energy consumption, industrial activity, and environmental governance. Examining only carbon emissions or a single pollutant cannot fully reflect the comprehensive performance of cities under energy inputs, economic outputs, and environmental constraints. Therefore, this study constructs an indicator of urban synergistic efficiency from the perspective of pollution–carbon synergy [31].
To construct the urban synergistic efficiency indicator, this study applies a global non-radial directional distance function combined with data envelopment analysis (DDF-DEA) to calculate urban efficiency values. This method can simultaneously account for desirable and undesirable outputs and incorporate input and output slacks [32]. Compared with conventional radial DEA models, the non-radial directional distance function is more suitable for measuring energy–environment efficiency because urban green and low-carbon transition does not simply involve proportional reductions in inputs or emissions [33]. Instead, it may involve redundant inputs, insufficient reductions in certain pollutants, or incomplete carbon emission constraints [34]. By introducing a global production frontier, the efficiency values are also made comparable across years [35].
In constructing the input–output framework, the urban production process is divided into three parts: inputs, desirable output, and undesirable outputs. The input variables include capital, labor, and energy. Capital input is measured by urban fixed-asset investment, while labor input is measured by the number of urban employees. Energy input is obtained by converting electricity consumption, natural gas consumption, and liquefied petroleum gas consumption into standard coal equivalents. Following the conversion coefficients reported in the Energy Statistical Yearbook, electricity, natural gas, and liquefied petroleum gas are converted at 0.1229 kgce/kWh, 1.33 kgce/m3, and 1.7143 kgce/kg, respectively, and then summed to obtain the total urban energy input. The desirable output is measured by real gross regional product after price deflation. The undesirable outputs include annual average PM2.5 concentration, industrial SO2 emissions, and CO2 emissions, which capture urban air pollution, industrial pollution, and carbon emission pressure, respectively.
Based on this framework, three types of efficiency values are calculated. The first efficiency value is the comprehensive efficiency that incorporates PM2.5, SO2, and CO2 constraints simultaneously, denoted as S E . This indicator reflects the overall efficiency of a city when both pollution reduction and carbon mitigation constraints are considered. The second efficiency value is pollution reduction efficiency, denoted as P R E , which considers only PM2.5 and SO2 constraints and measures efficiency under pollution control objectives. The third efficiency value is carbon mitigation efficiency, denoted as C R E , which considers only CO2 constraints and measures efficiency under carbon emission constraints.
This study further defines synergy gains as the improvement of comprehensive efficiency relative to single-objective efficiency. The synergy gain in pollution reduction is defined as follows:
d e p i t = S E i t P R E i t P R E i t
d e c o 2 i t = S E i t C R E i t C R E i t
where d e p i t denotes the synergy gain in pollution reduction for the city i in year t , and d e c o 2 i t denotes the synergy gain in carbon mitigation. A higher value of d e p i t indicates a greater efficiency improvement generated by the comprehensive governance framework relative to the single pollution reduction objective. Similarly, a higher value of d e c o 2 i t indicates a greater efficiency improvement generated by the comprehensive governance framework relative to the single carbon mitigation objective. A positive value indicates that the comprehensive pollution–carbon framework generates additional efficiency gains relative to the corresponding single-objective benchmark, whereas a negative value indicates that such additional gains are not observed.
Considering that pollution reduction and carbon mitigation are equally important in urban green and low-carbon transition, this study assigns equal weights to the two dimensions and constructs the synergistic efficiency of pollution reduction and carbon mitigation as follows:
S D C L i t = 1 2 d e p i t + 1 2 d e c o 2 i t
A higher value of S D C L indicates a higher degree of synergistic efficiency between pollution reduction and carbon mitigation, whereas a lower value suggests weaker coordination between pollution governance and carbon governance. The equal-weight specification is adopted as the baseline because there is no strong a priori basis for assigning a systematically larger weight to either pollution reduction or carbon mitigation in the context of sustainable urban transition. To address possible concerns about this weighting choice, the robustness analysis further reconstructs S D C L under alternative weighting schemes.
Since S D C L is constructed from relative efficiency gains rather than directly from DEA efficiency scores, it is not bounded between 0 and 1. A negative value indicates that the comprehensive pollution–carbon framework does not generate additional efficiency gains relative to the corresponding single-objective benchmark in a given city–year. Moreover, because S D C L is constructed using ratios and differences, it may be sensitive to extreme values or unusually small denominator terms in P R E or C R E . To reduce the influence of outliers, this study applies two-sided winsorization to the indicator in the baseline regressions. In addition, the robustness analysis excludes observations with extremely low values of P R E or C R E to further assess whether the main findings are driven by denominator sensitivity.
It should also be noted that S D C L is jointly calculated from urban energy inputs, economic output, pollutant emissions, and carbon emissions. Therefore, this value reflects not only energy input–output efficiency, but also comprehensive performance under pollution and carbon emission constraints. For this reason, the subsequent empirical analysis further examines energy efficiency, energy consumption, PM2.5, SO2, total CO2 emissions, and CO2 intensity to determine whether improvements in S D C L correspond to observable changes in energy use and environmental outcomes. Because energy input is one component in the construction of S D C L , the subsequent tests on energy efficiency and energy consumption are not interpreted as independent causal mechanisms. Rather, they are used as consistency checks to assess whether changes in the composite efficiency indicator correspond to observable changes in the urban energy system. Similarly, PM2.5 concentration, SO2 emissions, total CO2 emissions, and CO2 intensity are examined to assess whether improvements in S D C L are reflected in real pollution and carbon outcomes.

3.2.3. Control Variables

To reduce omitted variable bias, this study controls for a set of city-level characteristics that may affect both digital–intelligent technology development and pollution–carbon synergy.
Financial technology development ( f i n t e c h ) is measured by the financial technology index. It reflects the digitalization of urban financial services and the efficiency of financial resource allocation, which may affect green R&D, energy-saving renovation, and low-carbon investment. Openness ( o p e n ) is measured by the ratio of total import and export trade to gross regional product. Openness may influence energy efficiency and environmental performance through technology introduction, industrial competition, and changes in trade structure. Digital infrastructure ( d i g i n f r a ) is measured by the number of broadband Internet access users per 100 people [36]. It provides the basic network conditions for digital production and governance. Human capital ( h u m c a p ) is measured by the ratio of students enrolled in regular higher education institutions to the permanent resident population. Human capital affects a city’s ability to absorb and apply new technologies. Urbanization ( u r b a n ) is measured by the share of the urban population in the total regional population. Urbanization may generate scale economies and improve public service efficiency, but it may also increase energy demand and environmental pressure. Fiscal capacity ( f i s c a l ) is measured by the ratio of general public budget expenditure to GDP. It affects infrastructure construction, environmental governance investment, and public service provision. Population agglomeration ( p o p a g g ) is measured by the ratio of local permanent population density to the national average population density. Population agglomeration may affect pollution–carbon synergy through scale economies, transport demand, energy consumption, and pollutant concentration [37].

3.3. Data Description

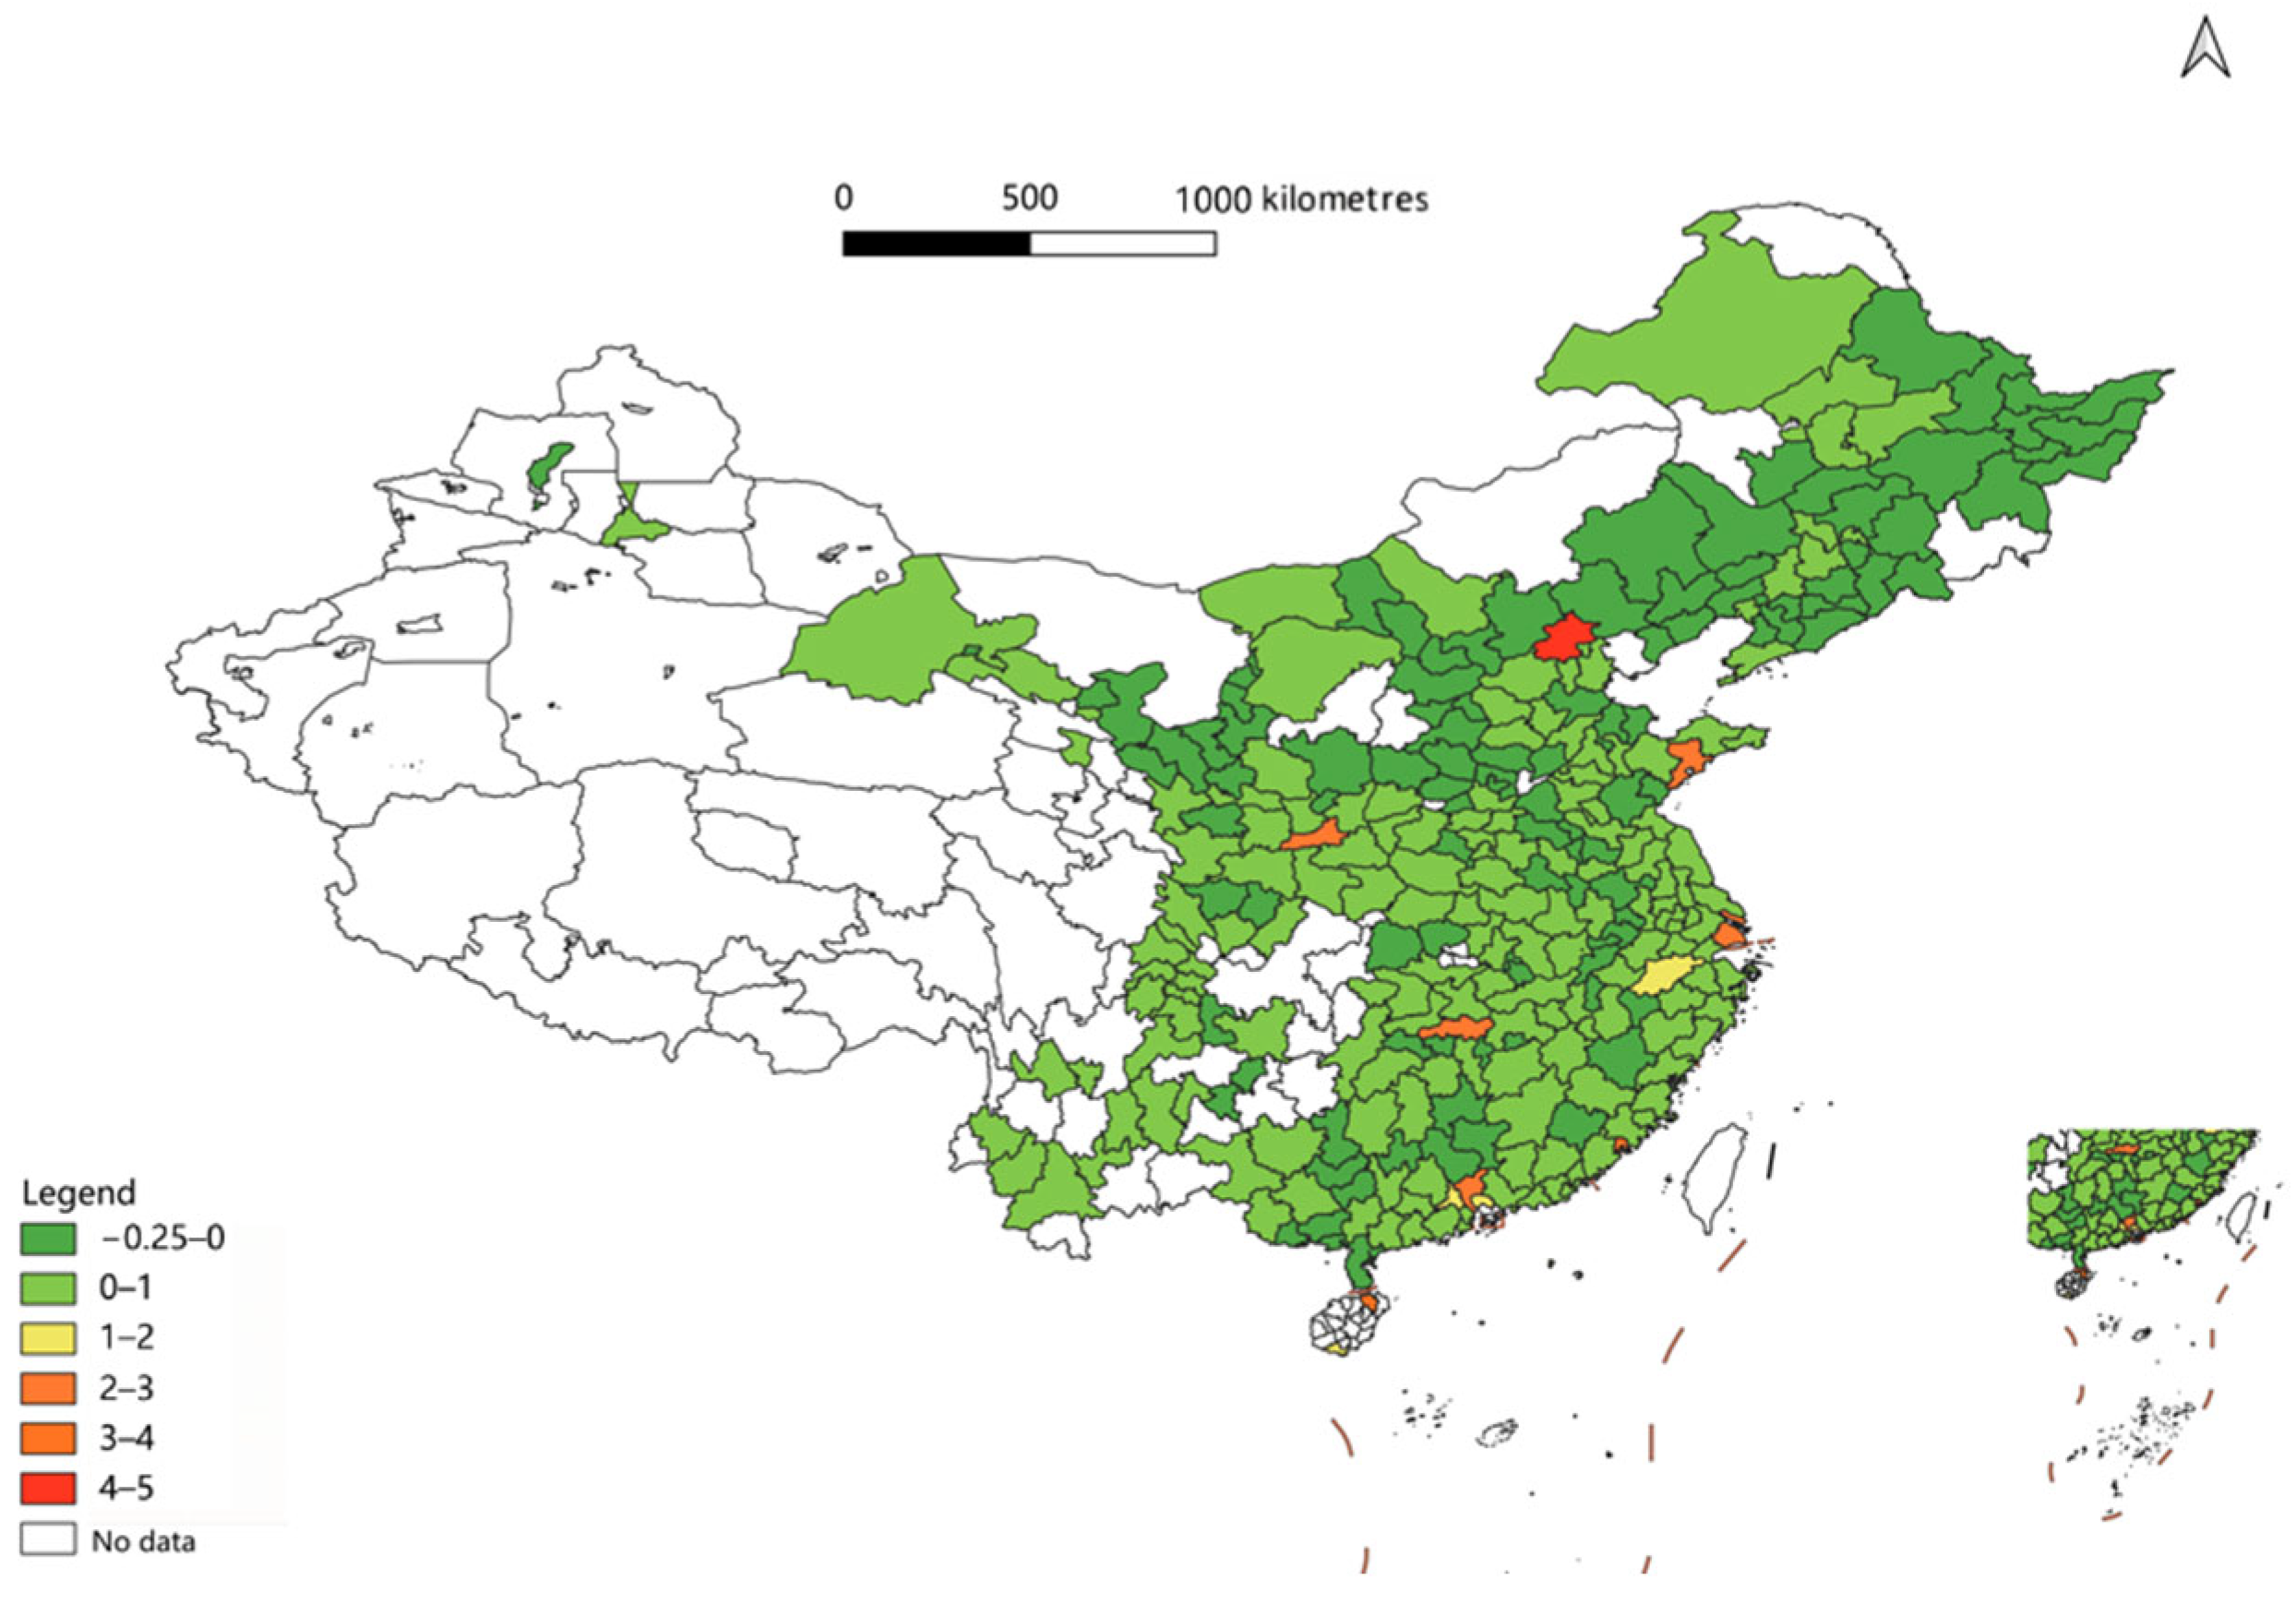
This study uses Chinese prefecture-level cities as the research units and covers the period from 2012 to 2023. After excluding cities with missing key variables, the final sample consists of 278 prefecture-level cities and 3336 city–year observations.
Patent data for key digital–intelligent technologies are obtained from the patent retrieval platform of the China National Intellectual Property Administration. Following the Classification System for Key Digital Technology Patents (2023) [30], patents are identified in seven categories: artificial intelligence, high-end chips, quantum information, the Internet of Things, blockchain, the industrial Internet, and the metaverse. These patents are aggregated to the prefecture-level city according to the location of the patent applicant and are then converted into the per capita intensity of patent applications in key digital–intelligent technology fields, which serves as the baseline explanatory variable. Data on energy consumption, gross regional product, and population are collected mainly from the China City Statistical Yearbook, China Statistical Yearbook, China Urban Construction Statistical Yearbook, and China Regional Statistical Yearbook. PM2.5 concentration and industrial SO2 emissions are obtained from the Chinese Research Data Services Platform. Data for the control variables are mainly drawn from the China City Statistical Yearbook.
In the data processing procedure, gross regional product is deflated to ensure comparability across years. Key continuous variables are winsorized to reduce the influence of extreme values. Energy inputs are converted into standard coal equivalents to ensure comparability across energy types. The resulting dataset covers the main dimensions required for the empirical analysis, including urban digital–intelligent technology innovation, energy input, economic output, pollutant indicators, and carbon emissions. Table 1 reports the descriptive statistics of the main variables.

4. Empirical Results

4.1. Baseline Regression Results

Table 2 reports the baseline estimates for the relationship between digital–intelligent technology innovation and urban pollution–carbon synergistic efficiency ( S D C L ). The core explanatory variable, K i n v a , is measured by per capita digital–intelligent patent intensity, which helps mitigate the mechanical bias associated with city size.
Column (1) presents the bivariate specification and shows that K i n v a is positively and significantly associated with S D C L . Column (2) further controls for a range of city-level characteristics, including financial development, openness, digital infrastructure, human capital, urbanization, fiscal capacity, and population agglomeration. The coefficient on K i n v a remains positive and statistically significant, indicating that the baseline relationship is not solely driven by observable cross-city differences in these factors. Column (3) additionally includes both city fixed effects and year fixed effects, and this is our preferred baseline specification. The estimated coefficient on K i n v a remains positive and significant at the 1% level, which suggests that, within the same city over time, a higher level of per capita digital–intelligent patent intensity is associated with higher pollution–carbon synergistic efficiency after accounting for time-invariant city characteristics and common time shocks.
In terms of economic significance, we evaluate the estimated effect using the interquartile variation in K i n v a . Based on the preferred specification, moving from the 25th to the 75th percentile of per capita digital–intelligent patent intensity is associated with a 0.223-point increase in S D C L , which corresponds to approximately 83.23% of the sample mean of S D C L . This suggests that the estimated relationship is not only statistically significant but also economically meaningful.
Overall, the baseline results indicate a stable positive association between digital–intelligent technology innovation and urban pollution–carbon synergy. At the same time, these estimates should be interpreted as baseline associations rather than definitive causal effects. Therefore, we conducted a series of further analyses, including robustness, endogeneity, and non-linearity tests, presented in the following sections.

4.2. Robustness Tests

Table 3 reports a series of robustness checks. The positive effect of digital–intelligent technology innovation on urban pollution–carbon synergistic efficiency remains qualitatively unchanged in the following conditions: the dependent variable is remeasured under the sequential frontier; municipalities directly under the central government are excluded; the core explanatory variable is transformed as l n ( 1 + K i n v a ) ; alternative weighting schemes are used to reconstruct the S D C L index; the core explanatory variable is replaced by the per capita number of granted patents in key digital technology fields; and observations with extremely low denominator values are excluded from the ratio-based S D C L construction. In all cases, the estimated coefficients remain positive and statistically significant. These results suggest that the baseline conclusion is robust to alternative measurements of the dependent and explanatory variables, sample adjustments, and index construction strategies. Compared with patent applications, granted patents better reflect realized innovative output and therefore provide a stricter alternative measure of digital–intelligent technology innovation. Because patent grants typically involve an approval lag, this specification should be interpreted as a stricter alternative measure of realized innovative output rather than a perfect contemporaneous proxy for current-year innovation input. In addition, excluding observations in the bottom 1% and bottom 5% of pollution reduction efficiency ( P R E ) or carbon mitigation efficiency ( C R E ) helps alleviate concerns that the ratio-based S D C L index may be mechanically driven by very small denominator values. The results remain qualitatively unchanged, suggesting that the main finding is not driven by denominator sensitivity in the construction of S D C L .

4.3. Addressing Endogeneity: IV, Control Function, and Policy Shock Evidence

4.3.1. Instrumental Variable and Control Function Results

Given the potential endogeneity between digital–intelligent technology innovation and urban pollution–carbon synergistic efficiency, we further employ an instrumental variable (IV) approach and a control function (CF) approach as supplementary tests. Endogeneity may arise from reverse causality because cities with stronger pollution–carbon synergy may have greater incentives and capacity to invest in digital and intelligent technologies. Endogeneity may also stem from omitted factors, such as local innovation conditions, industrial policies, governance capacity, and long-term development fundamentals, which may jointly affect K i n v a and S D C L .
The instrumental variable is constructed as the interaction between terrain ruggedness and national telecommunication business growth. The logic is that terrain ruggedness affects the cost and difficulty of local communication infrastructure deployment, while national telecommunication growth captures the time-varying expansion of China’s communication sector. Therefore, their interaction reflects cross-city differences in exposure to nationwide telecommunication expansion arising from geographical constraints. The instrument is expected to be relevant because terrain-related communication frictions shape the local conditions for digital–intelligent technology development. At the same time, because terrain may also influence environmental outcomes through transportation costs, industrial location, urban form, and energy use, the IV estimates are interpreted here as supplementary evidence that helps alleviate endogeneity concerns rather than as definitive causal proof.
The test results are reported in Table 4. In Column (1), the first-stage coefficient on the instrumental variable is positive and highly significant, indicating that the instrument is strongly correlated with K i n v a . The Kleibergen–Paap rk LM statistic is 23.768, rejecting the null of underidentification, and the Kleibergen–Paap rk Wald F statistic is 29.074, suggesting that weak instrument concerns are substantially mitigated. In Column (2), the second-stage coefficient on K i n v a remains positive and significant, indicating that the main result is robust after accounting for potential endogeneity through the IV approach.
As an additional check, Columns (3) and (4) report the control function estimates. The residual from the first-stage regression enters the second-stage regression significantly, which suggests that endogeneity is indeed present. Nevertheless, after controlling for this endogenous component, the coefficient on K i n v a remains positive and statistically significant. This result is consistent with the baseline finding.
Finally, Column (5) introduces province-by-year fixed effects to absorb time-varying province-level shocks, such as provincial industrial policies, environmental regulation intensity, energy structure adjustment, and digital infrastructure planning. Under this stricter specification, the coefficient on K i n v a remains positive and significant, further supporting the stability of the main result.
Overall, the IV and control function estimates provide additional support for the baseline finding that digital–intelligent technology innovation is positively associated with urban pollution–carbon synergistic efficiency. These results should still be interpreted cautiously, but they suggest that the positive relationship is not solely driven by reverse causality or omitted variable bias.

4.3.2. Quasi-Natural Experimental Evidence from the “Broadband China” Policy

To further mitigate endogeneity concerns, we exploit the implementation of the “Broadband China” program as a quasi-natural experiment [38]. The policy improved local digital infrastructure and thus provided an exogenous shock to the development environment for digital and intelligent technologies [39]. If digital–intelligent technology innovation indeed contributes to urban pollution–carbon synergistic efficiency, the policy should not only improve S D C L in treated cities after implementation, but also promote digital–intelligent technology innovation itself.
Table 5 reports the DID results. Column (1) presents a parsimonious specification without additional controls or two-way fixed effects and shows that the coefficient on B r o a d b a n d C h i n a × P o s t is positive and significant. Column (2) further includes control variables, city fixed effects, and year fixed effects. The coefficient remains positive and statistically significant, indicating that treated cities experienced a greater post-policy improvement in urban pollution–carbon synergistic efficiency. Column (3) uses K i n v a as the dependent variable. The coefficient on B r o a d b a n d C h i n a × P o s t is also positive and statistically significant, suggesting that the policy significantly promoted digital–intelligent technology innovation itself.
Taken together, these results indicate that the “Broadband China” policy improved the local digital environment, stimulated digital–intelligent technology innovation, and was associated with higher urban pollution–carbon synergistic efficiency. Therefore, the DID evidence provides complementary identification support for the baseline finding and helps alleviate concerns that the positive relationship between digital–intelligent technology innovation and S D C L is driven solely by reverse causality or omitted variable bias.

4.3.3. Parallel Trend and Placebo Tests

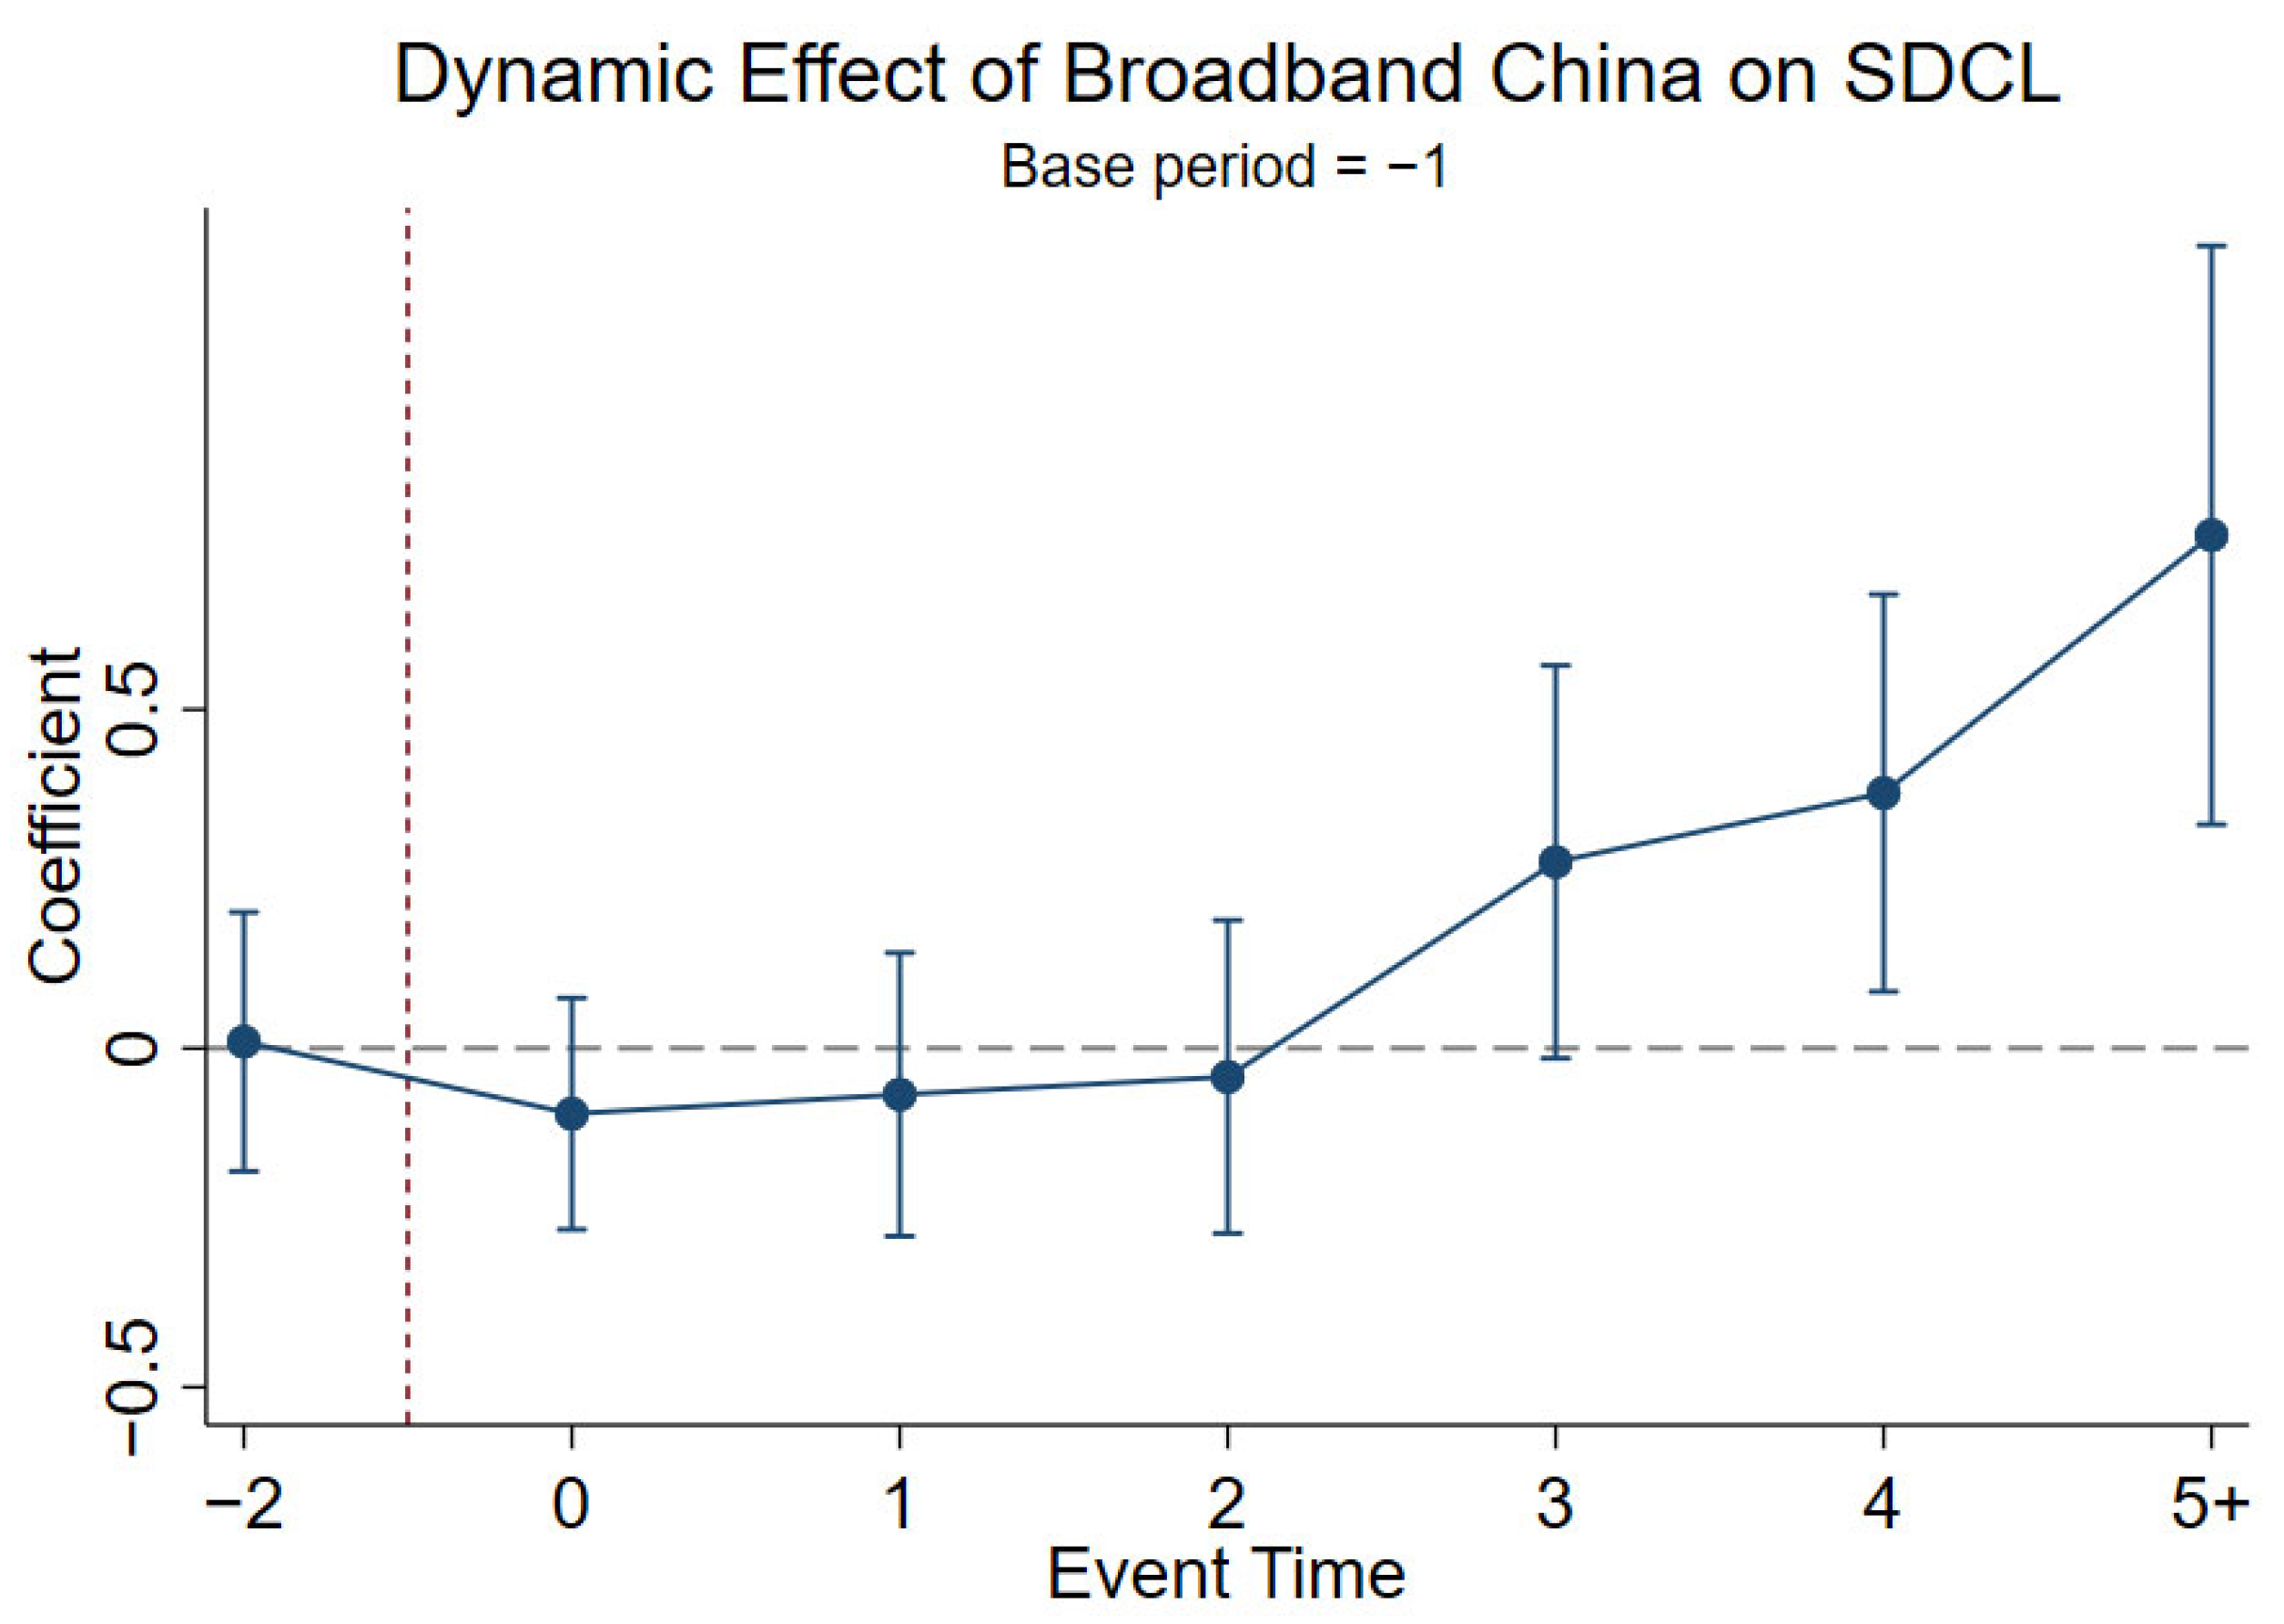
To examine the validity of the DID design, we further conducted parallel trend and placebo tests. As show in Figure 3, the event study results show that the coefficients in the pre-treatment periods are close to zero and statistically insignificant, supporting the parallel trend assumption. In contrast, the post-treatment coefficients become gradually larger, suggesting that the policy effect emerges dynamically over time.
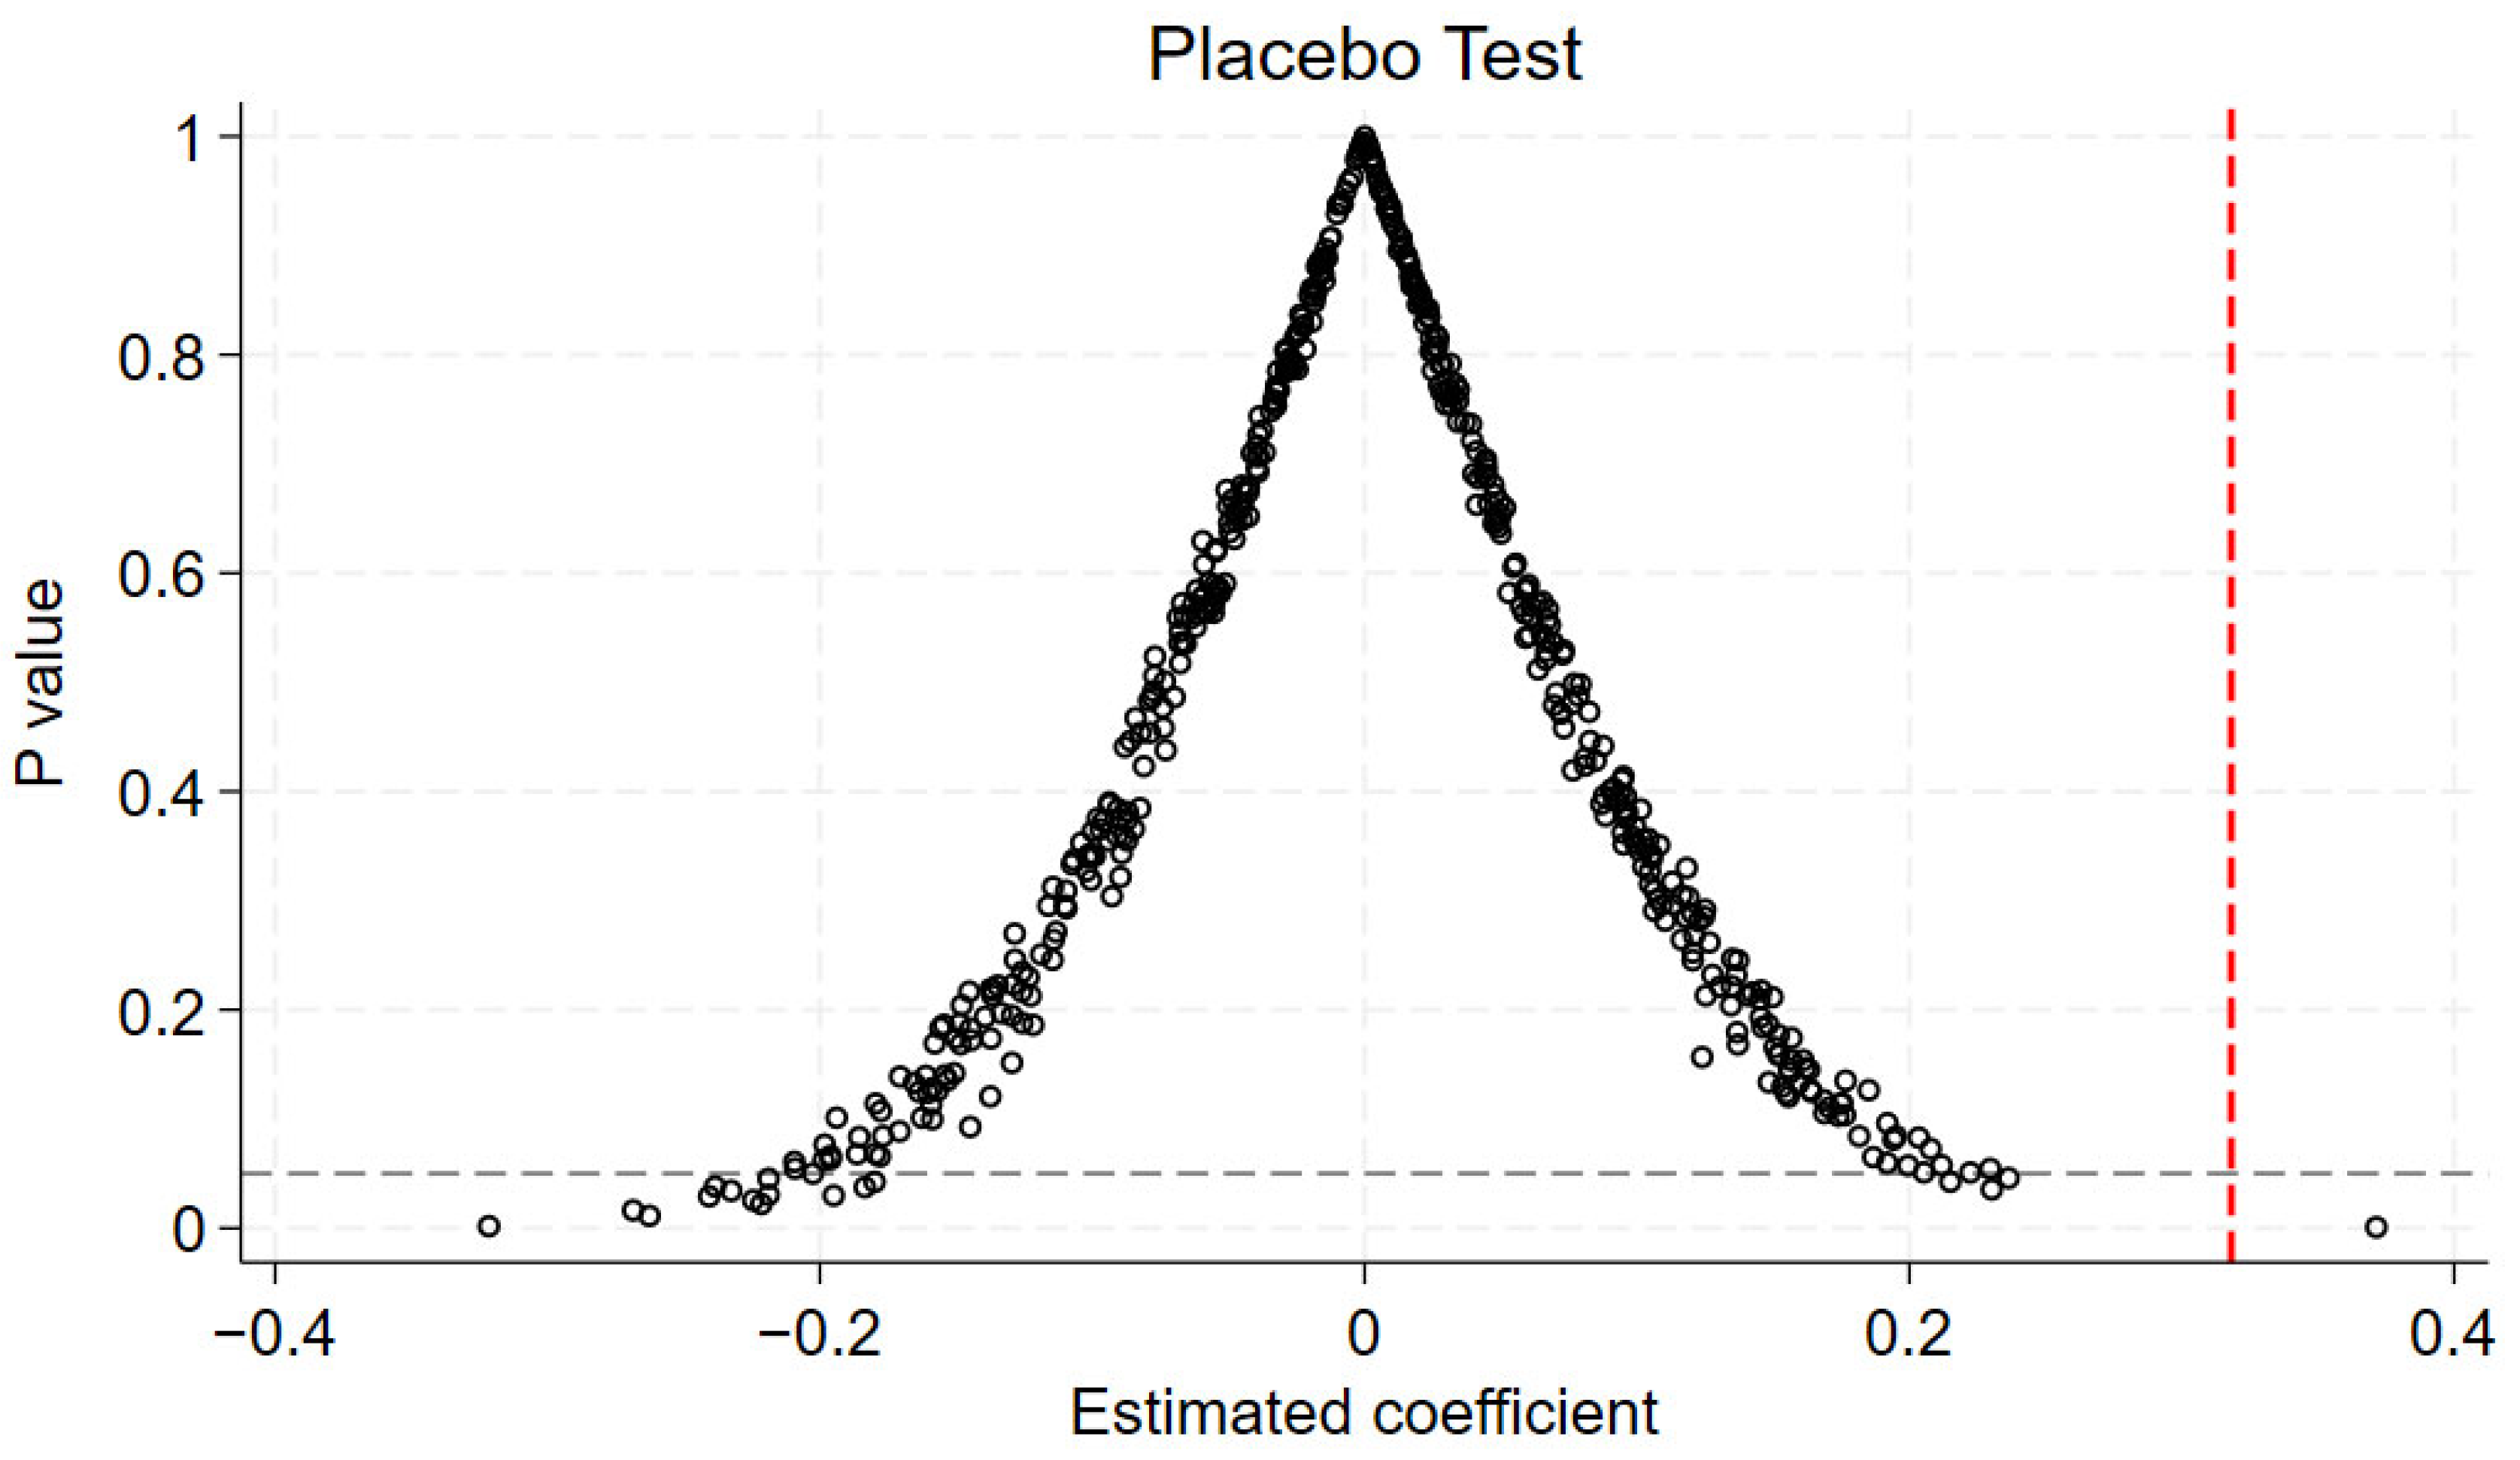
We also performed a placebo test based on random assignment. As show in Figure 4, the distribution of placebo coefficients is centered around zero, while the actual estimated coefficient lies in the right tail of the distribution. This finding suggests that the benchmark DID result is unlikely to be driven by random shocks or spurious correlation. Overall, these tests support the credibility of the policy shock evidence in addressing endogeneity.

4.4. Threshold and Stage-Dependent Effects

Table 6 reports the results of the threshold effect tests of the relationship between digital–intelligent technology innovation and urban pollution–carbon synergy. The results show that both the single-threshold and double-threshold effects are statistically significant. The F-statistic for the single-threshold test is 104.25 with a p-value of 0.000, while the F-statistic for the double-threshold test is 45.95 with a p-value of 0.010. Since the null hypothesis of the no threshold effect is rejected in both cases, and the double-threshold test remains significant, the relationship between K i n v a and S D C L is better characterized by a double-threshold specification rather than by a linear model.
Table 6 shows that both the single-threshold and double-threshold tests are significant, indicating that the relationship between K i n v a and S D C L is non-linear and is better described by a double-threshold model. Table 7 further shows that the effect of K i n v a on S D C L changes substantially across different regimes. When K i n v a is below 1.2565, its coefficient is significantly negative, suggesting that low-level digital–intelligent innovation may not yet be effectively converted into environmental performance gains. When K i n v a lies between 1.2565 and 7.7053, the coefficient becomes positive but insignificant, implying that the environmental effect remains weak during the transitional stage. Once K i n v a exceeds 7.7053, the coefficient turns significantly positive, indicating that digital–intelligent innovation begins to generate substantial gains in pollution–carbon synergy after reaching a sufficiently high level. Overall, the results suggest that the contribution of digital–intelligent innovation to sustainable urban transition is conditional on crossing critical development thresholds.

4.5. Mechanism Analysis

To better understand how digital–intelligent technology innovation is associated with urban pollution–carbon synergistic efficiency, we examine three potential transmission channels: green technological innovation, digital inclusive finance, and AI firm agglomeration. Following the conventional two-step approach, we first test whether K i n v a is significantly associated with each channel variable, and then include the corresponding channel variable in the baseline regression. Since these channel variables may also evolve endogenously, the mechanism analysis is intended to provide channel-based evidence rather than definitive causal mediation evidence. To further alleviate simultaneity concerns, we additionally report specifications using the one-period lag of each channel variable.
Table 8 reports the contemporaneous mechanism results. Columns (1), (3), and (5) show that K i n v a is positively and significantly associated with green technological innovation, digital inclusive finance, and AI firm agglomeration, respectively. This suggests that higher per capita digital–intelligent patent intensity is systematically related to stronger green innovation output, broader digital financial support, and a denser local AI industrial base.
Columns (2), (4), and (6) further include the corresponding channel variables in the S D C L regressions. The estimated coefficients on green technological innovation, digital inclusive finance, and AI firm agglomeration are all positive and statistically significant. At the same time, the coefficient on K i n v a declines relative to the baseline specification after each channel variable is added. This pattern is consistent with the interpretation that digital–intelligent technology innovation is associated with urban pollution–carbon synergy partly through knowledge conversion, financial resource allocation, and AI-related industrial application scenarios. These results should nevertheless be interpreted cautiously as contemporaneous channel evidence rather than strict causal mediation results.
Table 9 presents the corresponding mechanism tests using the one-period lag of each channel variable. This specification helps reduce concerns that the contemporaneous mechanism results are driven mainly by simultaneity or short-run co-movement. The results show that the lagged values of green technological innovation, digital inclusive finance, and AI firm agglomeration remain positively associated with S D C L , indicating that these channels continue to matter after introducing a temporal structure into the analysis.
More specifically, the lagged green innovation variable remains significantly positive, while the coefficient on K i n v a becomes statistically insignificant, suggesting that green technological innovation may represent a relatively strong transformation channel. The lagged digital inclusive finance variable is also significantly positive, while K i n v a remains positive and significant, which is more consistent with a partial transmission channel. Similarly, the lagged AI firm agglomeration variable remains significantly positive, while the coefficient on K i n v a weakens substantially and remains only marginally significant, suggesting that AI firm agglomeration may serve as another relatively strong channel linking digital–intelligent technology innovation to pollution–carbon synergy.
Taken together, the evidence from Table 8 and Table 9 suggests that the positive association between digital–intelligent technology innovation and urban pollution–carbon synergistic efficiency is consistent with three complementary channels: green innovation as a knowledge-conversion channel, digital inclusive finance as a resource-allocation channel, and AI firm agglomeration as an industrial-application channel. Even so, these findings are best understood as supportive channel evidence rather than definitive causal mediation estimates.

5. Energy and Emission Outcomes

The preceding results show that digital–intelligent technology innovation is associated with urban pollution–carbon synergy and appears to be linked with it through green technological innovation, digital inclusive finance, and AI firm agglomeration. Since S D C L is a composite efficiency indicator, it is necessary to examine whether its improvement corresponds to observable changes in energy use and pollution–carbon outcomes. This section first decomposes S D C L into the synergy gain in pollution reduction and the synergy gain in carbon mitigation. It then examines whether digital–intelligent technology innovation improves energy efficiency, restrains total energy consumption, and reduces PM2.5 concentration, SO2 emissions, total CO2 emissions, and CO2 intensity.

5.1. Decomposition of Pollution–Carbon Synergy

Table 10 reports the decomposition results. Column (1) uses S D C L as the dependent variable, while Columns (2) and (3) further decompose the overall synergy effect into the synergy gain in pollution reduction ( d e p ) and the synergy gain in carbon mitigation ( d e c o 2 ), respectively. As defined above, d e p captures the improvement of comprehensive efficiency relative to single-objective pollution reduction efficiency, whereas d e c o 2 captures the improvement of comprehensive efficiency relative to single-objective carbon mitigation efficiency. This decomposition helps clarify whether digital–intelligent technology innovation is associated with only one environmental dimension or with broader coordination between pollution governance and carbon governance.
The results show that K i n v a remains positively and significantly associated with overall pollution–carbon synergistic efficiency in Column (1), which is consistent with the baseline findings. In Column (2), the coefficient on K i n v a is also positive and significant, indicating that higher per capita digital–intelligent patent intensity is associated with a greater synergy gain in pollution reduction. In Column (3), the coefficient on K i n v a is likewise positive and significant, suggesting that digital–intelligent technology innovation is also associated with stronger synergy gains in carbon mitigation.
Comparing Columns (2) and (3), the estimated coefficient is substantially larger for d e c o 2 than for d e p , which suggests that the effect of digital–intelligent technology innovation may be stronger on the carbon mitigation dimension than on the pollution reduction dimension. One possible explanation is that digital and intelligent technologies are more directly linked to energy management, production scheduling, process optimization, and low-carbon technology diffusion, all of which are closely related to carbon emission performance. At the same time, the positive coefficient on d e p indicates that the estimated effect is not limited to carbon mitigation alone, but is also associated with improved coordination in pollution governance.
Overall, the decomposition results suggest that digital–intelligent technology innovation is associated with both dimensions of pollution–carbon synergy, although the relationship appears to be stronger for carbon mitigation synergy than for pollution reduction synergy.

5.2. Energy Efficiency and Energy Consumption

To examine whether the improvement in urban pollution–carbon synergistic efficiency is reflected in observable energy use performance, we further use energy efficiency and total energy consumption as outcome variables. Because energy input is one component in the construction of S D C L , these tests are not interpreted as independent causal mechanisms or fully independent validation tests. Instead, they are used as energy-side consistency checks to assess whether the estimated improvement in the composite efficiency index corresponds to meaningful changes in the urban energy system. The results are reported in Table 11.
Column (1) uses energy efficiency as the dependent variable. The coefficient on K i n v a is positive and significant at the 1% level, indicating that higher per capita digital–intelligent patent intensity is associated with higher urban energy efficiency. This suggests that cities with stronger digital–intelligent technology innovation tend to generate more economic output per unit of energy input. Such a pattern is consistent with the view that digital and intelligent technologies may help improve energy allocation, process coordination, and refine energy management through data integration, intelligent scheduling, and production optimization.
Column (2) uses total energy consumption as the dependent variable. The coefficient on K i n v a is negative and significant at the 1% level, suggesting that stronger digital–intelligent technology innovation is associated with lower total energy consumption. This result is consistent with the interpretation that the observed improvement in pollution–carbon synergy is related not merely to expanded energy inputs, but also to more efficient energy use and better energy management practices.
Overall, the results in Table 11 provide additional energy-side support for the baseline finding. While these estimates should not be viewed as fully independent verification, they are consistent with the argument that digital–intelligent technology innovation is associated with improvements in urban energy use performance, which in turn aligns with higher pollution–carbon synergistic efficiency.

5.3. Pollution and Carbon Emission Outcomes

Building on the energy-side results, this study further examines whether digital–intelligent technology innovation is associated with better pollution and carbon outcomes. The dependent variables include PM2.5 concentration, SO2 emissions, total CO2 emissions, and CO2 intensity. The results are reported in Table 12.
The estimates show that digital–intelligent technology innovation is consistently associated with lower levels of both air pollution and carbon emissions. For local air-quality outcomes, higher digital–intelligent patent intensity is linked to lower PM2.5 concentration and lower SO2 emissions, suggesting that digital and intelligent technologies may strengthen pollution source identification, emissions monitoring, and process-based environmental regulation. In economic terms, this pattern implies that digital–intelligent innovation is not merely correlated with an improvement in the composite S D C L indicator, but is also reflected in cleaner observable environmental conditions at the city level.
A similar pattern is found for carbon outcomes. Cities with stronger digital–intelligent technology innovation tend to exhibit both lower total CO2 emissions and lower CO2 intensity. This indicates that digital–intelligent innovation is associated not only with a reduction in aggregate carbon pressure, but also with lower carbon emissions per unit of economic output. From the perspective of sustainable urban transition, this finding is economically meaningful because it suggests that digital–intelligent innovation is linked to cleaner growth rather than to output expansion accompanied by higher emissions.
Combined with the previous results on energy efficiency and energy consumption, these findings provide further support for the argument that the improvement in S D C L corresponds to observable changes in energy use, pollution control, and carbon emission performance. Overall, digital–intelligent technology innovation appears to contribute to urban pollution–carbon synergy by improving energy use efficiency, restraining energy consumption growth, and reducing both pollution and carbon intensity.
Taken together, Table 10, Table 11 and Table 12 show that the positive effect of digital–intelligent technology innovation on S D C L is supported by both internal decomposition and observable energy and emission outcomes. The decomposition results show that K i n v a increases synergy gains in both pollution reduction and carbon mitigation, with a stronger effect on the carbon mitigation dimension. The energy outcome results show that K i n v a is associated with higher energy efficiency and lower total energy consumption. The pollution and carbon outcome results further show lower PM2.5 concentration, SO2 emissions, total CO2 emissions, and CO2 intensity.
These findings suggest that the improvement in pollution–carbon synergy is not only a change in the composite efficiency indicator; the improvement also corresponds to observable changes in energy use, pollution control, and carbon emission performance. Digital–intelligent technology innovation appears to support urban pollution–carbon synergy by improving energy use efficiency, restraining energy consumption growth, reducing pollution pressure, and lowering carbon emission intensity.

6. Boundary Conditions and Spatial Diffusion

After examining energy and emission outcomes, this section further analyzes the conditions under which the effect of digital–intelligent technology innovation becomes stronger and whether this effect persists over time and diffuses across cities. The analysis first focuses on boundary conditions, including human capital and financial technology, and then examines dynamic effects and spatial diffusion.

6.1. Boundary Condition Analysis

The mechanism and boundary condition analyses address different questions. The mechanism analysis examines whether digital–intelligent technology innovation is associated with changes in potential transmission channels. By contrast, the heterogeneity analysis asks under what initial city conditions is digital–intelligent technology innovation more likely to be translated into urban pollution–carbon synergistic efficiency. To distinguish pre-existing enabling conditions from time-varying channels, the grouping variables are measured using their initial city-level values in 2012 rather than their contemporaneous values during the sample period. This design helps reduce the concern that the heterogeneity analysis mechanically overlaps with the mechanism tests.
Based on this logic, we examine two dimensions of heterogeneity: human capital and financial technology. Human capital reflects the local absorptive capacity needed to understand, adopt, and apply digital–intelligent technologies. Financial technology captures the supporting financial environment for green upgrading and low-carbon investment. Cities are divided into high- and low-level groups according to the median values of these initial conditions in 2012, and the baseline model is then re-estimated within each subgroup. Since human capital and financial technology also appear in the baseline control set, their contemporaneous counterparts are excluded from the corresponding subgroup regressions to avoid mechanical overlap between the grouping criterion and the control specification.
Table 13 reports the heterogeneity results. For the human capital grouping, the coefficient on K i n v a is positive but insignificant in the low human capital group, while it remains positive and highly significant in the high human capital group. This finding suggests that the positive effect of digital–intelligent technology innovation on pollution–carbon synergy is more likely to be realized in cities with stronger human capital foundations. In this sense, human capital mainly serves as an absorptive capacity condition that facilitates the environmental benefits of digital–intelligent technology innovation.
For the financial technology grouping, the coefficient on K i n v a is positive in both the low and high financial technology groups, and the effect is stronger in the high financial technology group. This result indicates that digital–intelligent technology innovation contributes to urban pollution–carbon synergy under different levels of financial technology development, but its role is more pronounced when the supporting financial environment is more developed. Therefore, financial technology appears to function as a reinforcing condition that enhances the effectiveness of digital–intelligent technology innovation.
Overall, the heterogeneity results show that the environmental effect of digital–intelligent technology innovation is not uniform across cities. Instead, it is more likely to be translated into higher pollution–carbon synergistic efficiency in cities with stronger human capital endowments and better financial technology conditions.
To supplement the grouped regression evidence, we further estimate interaction models based on the same initial city conditions. Specifically, we construct High human capital and High financial technology using the 2012 median values of human capital and financial technology, and then interact them with K i n v a . This specification provides an additional check on whether the effect of digital–intelligent technology innovation is stronger in cities with better initial absorptive capacity and financial support conditions. The results are reported in Table 14.

6.2. Dynamic Effects

Digital–intelligent technology innovation may require time to move through diffusion, adoption, organizational learning, and governance embedding before it is reflected in production and environmental outcomes. To capture this temporal pattern, we replace the contemporaneous explanatory variable with its one-period, two-period, and three-period lags.
Table 15 shows that the coefficient on K i n v a is positive and statistically significant, not only in the contemporaneous specification, but also when one-period, two-period, and three-period lagged values are used. This result suggests that the relationship between digital–intelligent technology innovation and urban pollution–carbon synergistic efficiency is not limited to the current period; rather, the estimated effect displays clear temporal persistence.
The lagged estimates further suggest that the effect of digital–intelligent technology innovation is released gradually over time rather than being exhausted immediately. This pattern is consistent with the idea that digital–intelligent technologies need to move from patent generation to practical deployment before they can materially affect urban energy use, production organization, pollution control, and carbon governance. In this sense, the environmental gains associated with digital–intelligent technology innovation appear to reflect a process of diffusion, adaptation, and cumulative application.
As the lag length increases, the number of observations declines because the construction of lagged variables in panel data mechanically reduces the available sample. Nevertheless, the estimated coefficients remain positive and statistically significant across all lag specifications. This stability suggests that the main finding is not a short-lived contemporaneous correlation, but instead reflects a more sustained association over time.
Overall, the dynamic effect results provide further support for the baseline finding. They suggest that digital–intelligent technology innovation has a persistent association with urban pollution–carbon synergy, and that its environmental gains are more likely to emerge gradually as digital and intelligent technologies are transformed from patent-based innovation into actual industrial and governance applications.

6.3. Spatial Diffusion Effects

Before presenting the formal spatial econometric results, Figure 5 illustrates the spatial distribution of the average urban pollution–carbon synergistic efficiency ( S D C L ) across Chinese prefecture-level cities during 2012–2023. The figure shows evident regional heterogeneity, with relatively higher average levels concentrated in parts of eastern and central China, while many western and some inland cities remain at comparatively lower levels. This descriptive pattern provides preliminary visual support for the existence of spatial dependence and motivates the subsequent spatial econometric analysis.
After examining the temporal persistence of digital–intelligent technology innovation, we further tested whether its environmental effect also exhibits spatial diffusion. Digital–intelligent technology innovation is not purely local in nature. Owing to knowledge spillovers, industrial linkages, talent mobility, and policy learning, its influence on energy management, pollution control, and carbon governance may extend beyond the city in which the innovation is generated. To examine this possibility, we estimated a spatial Durbin model ( S D M ) using three row-standardized spatial weight matrices: the spatial adjacency matrix, the geographical distance matrix, and the economic–geographic nested matrix.
Table 16 shows that the spatial autoregressive coefficient is positive and statistically significant under all three spatial weight matrices, indicating that urban pollution–carbon synergistic efficiency displays clear spatial dependence. In other words, the environmental performance of a given city is related not only to its own characteristics, but also to the performance of surrounding or spatially connected cities.
The coefficient on K i n v a remains positive and significant under all three spatial matrices, suggesting that digital–intelligent technology innovation continues to be positively associated with local pollution–carbon synergy even after spatial dependence is taken into account. More importantly, the spatially lagged term of K i n v a is also positive and significant across all three matrices. This finding indicates that digital–intelligent technology innovation in neighboring or otherwise connected cities is associated with higher local pollution–carbon synergistic efficiency, which is consistent with the existence of cross-city spillover effects. Put differently, the environmental gains associated with digital–intelligent technology innovation are not confined to the city where the innovation occurs, but may diffuse across cities through spatial linkages.
The effect decomposition further supports this interpretation. The direct effects are positive and significant under all three matrices, indicating that digital–intelligent technology innovation improves local pollution–carbon synergy within the city itself. At the same time, the indirect effects are also significantly positive, suggesting that the benefits of digital–intelligent technology innovation spill over to other cities. Accordingly, the total effects remain significantly positive across all specifications. Taken together, these results indicate that digital–intelligent technology innovation generates both local improvement effects and spatial spillover effects.
Among the three spatial structures, the spillover effect appears to be particularly strong under the geographical distance matrix. This pattern suggests that distance-based intercity connections may better capture broader channels of intercity interaction, including technology diffusion, industrial collaboration, talent mobility, and policy learning. At the same time, because the scale and economic meaning of different spatial weight matrices are not identical, the magnitude differences across matrices should be interpreted cautiously. What takes precedence is that the positive spillover result remains robust.
Overall, the spatial results suggest that digital–intelligent technology innovation has both local and cross-regional environmental effects. It is associated not only with higher pollution–carbon synergy in the local city, but also with positive spillovers to other cities through spatial linkages. Combined with the dynamic effect results, this finding indicates that the environmental gains associated with digital–intelligent technology innovation are characterized by both temporal persistence and spatial diffusion. While the S D M does not directly identify the precise spillover channel, the pattern of results is consistent with diffusion through intercity knowledge linkages, industrial collaboration, and the sharing of governance experience.

7. Discussion

The results of this study show that digital–intelligent technology innovation is positively associated with urban pollution–carbon synergy. This finding is important because the dependent variable does not capture a single environmental outcome, but rather it measures the joint efficiency of economic output, energy input, pollutant reduction, and carbon mitigation. In this sense, the results suggest that digital–intelligent innovation may help cities improve the coordination between economic activity and environmental governance, rather than merely reducing one specific type of emission.
A central implication of the analysis is that the environmental value of digital–intelligent technology does not arise automatically from innovation itself. In this study, digital–intelligent innovation is measured by the per capita intensity of patent applications in key digital–intelligent technology fields, which captures the relative accumulation of local technological knowledge rather than simple city size. However, even when such innovation is present, its environmental value still depends on whether it can be transformed into practical governance capacity. The channel analysis suggests that green technological innovation, digital inclusive finance, and AI firm agglomeration are important routes through which digital–intelligent innovation can be translated into pollution–carbon synergy. This means that digital–intelligent innovation should not be understood as a direct emission reduction instrument, but as a technological foundation whose environmental benefits depend on its embedding in cleaner production, energy management, pollution monitoring, carbon accounting, and green upgrading.
The results also suggest that this relationship is not purely linear. The threshold analysis indicates that the environmental gains associated with digital–intelligent innovation are stage-dependent. At relatively low levels, digital–intelligent innovation does not immediately generate positive environmental returns and may even be associated with weak or adverse short-run effects. A plausible explanation is that the early stage of digital transformation often requires infrastructure expansion, equipment upgrading, organizational adjustment, and complementary investment, which may increase energy demand and adjustment costs before efficiency gains are realized. However, as digital–intelligent innovation accumulates and becomes more deeply embedded in production, finance, and governance processes, its environmental benefits become more visible. This finding helps explain why the contribution of digital–intelligent innovation to sustainable urban transition should be understood as a gradual transformation process rather than an instantaneous technological effect.
The decomposition results provide further insight into the structure of this transformation. The positive relationship is observed for both pollution reduction synergy and carbon mitigation synergy, but it is stronger for the carbon mitigation dimension. One possible explanation is that digital–intelligent technologies are more directly linked to energy management, production scheduling, process optimization, and low-carbon technology diffusion, all of which are closely related to carbon emission performance. By contrast, pollution reduction—especially for PM2.5 and SO2—may depend more heavily on industrial structure, end-of-pipe treatment facilities, environmental regulation intensity, and atmospheric conditions. Thus, digital–intelligent innovation appears able to support both dimensions of environmental governance, but its effects are more readily reflected in energy- and carbon-related outcomes.
The consistency checks using observable energy and emission indicators further support this interpretation. Digital–intelligent innovation is associated with higher energy efficiency, lower total energy consumption, lower PM2.5 concentration, lower SO2 emissions, lower total CO2 emissions, and lower CO2 intensity. These findings matter because they indicate that the improvement in S D C L is not merely a result of the composite efficiency framework itself, but is also consistent with cleaner observable environmental conditions at the city level. At the same time, these results should be interpreted carefully. Because energy input and emissions are already embedded in the construction of S D C L , these tests are better understood as outcome-based consistency checks rather than as fully independent validation exercises.
Another important implication is that the environmental effect of digital–intelligent technology depends on local supporting conditions. The heterogeneity analysis shows that the positive relationship is stronger in cities with higher human capital and more developed financial technology. This finding is consistent with the logic of absorptive capacity. Human capital affects whether local firms and governments can understand, absorb, and apply digital tools in production, energy scheduling, and environmental governance. Financial technology affects whether green upgrading, equipment renewal, and low-carbon investment can receive timely and efficient financial support. In this sense, human capital and financial technology function not as parallel mechanisms, but as enabling conditions that strengthen the conversion of digital–intelligent innovation into environmental governance capacity.
This distinction also helps clarify the relationship between the channel analysis and the heterogeneity analysis. Green technological innovation, digital inclusive finance, and AI firm agglomeration describe the main transformation routes through which digital–intelligent innovation is associated with better environmental performance. Human capital and financial technology, by contrast, indicate whether cities possess the absorptive and financial conditions needed for these routes to function effectively. Therefore, the mechanism, heterogeneity, and spatial analyses should not be understood as disconnected empirical modules; rather, they describe different layers of the same transformation process: digital–intelligent innovation first needs to be converted through technological, financial, and scenario-based channels; this conversion is stronger where local absorptive capacity and financial support are greater; and once such conversion takes place, its effects may diffuse over time and across cities.
The dynamic and spatial results reinforce this interpretation. The positive lagged effects indicate that the environmental gains associated with digital–intelligent innovation are not purely contemporaneous. Patent-based innovation requires time to move through diffusion, organizational adaptation, industrial deployment, and governance embedding before it becomes visible in energy and emission outcomes. Similarly, the spatial spillover results suggest that the transformation of digital–intelligent innovation into pollution–carbon governance capacity is not confined to the local city. Instead, it may spread through intercity knowledge linkages, industrial collaboration, talent mobility, and policy learning. This is especially relevant in urban agglomerations and regionally connected city networks, where production systems, labor markets, and environmental governance are increasingly interdependent.
The findings also carry a broader implication for the debate on digitalization and sustainability. Digital transformation is often assumed to generate environmental benefits automatically, but the results here suggest a more conditional and nuanced picture. In particular, the threshold evidence implies that digitalization may involve transitional costs and potential rebound pressures in its early stages, including higher electricity demand associated with infrastructure expansion, intelligent equipment, and data-intensive applications. Therefore, the environmental gains of digital–intelligent innovation depend on whether cities can move beyond this early stage and connect digital transformation with green innovation, financial support, and practical application scenarios. In this sense, digitalization and green transformation are complementary, but not automatically aligned.
Several limitations should also be noted. First, although this study uses instrumental variables, control functions, and policy shock evidence to alleviate endogeneity concerns, the empirical results should still be interpreted cautiously because fully exogenous city-level variation in digital–intelligent technology innovation is difficult to obtain. Second, although the baseline explanatory variable is defined as the per capita intensity of patent applications in key digital–intelligent technology fields, patent-based indicators still cannot fully capture patent quality, commercialization, or actual adoption by firms and governments. Third, the pollution–carbon synergy index is constructed from selected inputs and undesirable outputs, and future research could extend the analysis by incorporating sector-level emissions, wastewater, solid waste, or firm-level environmental data. Finally, this study focuses on Chinese prefecture-level cities. Whether similar transformation mechanisms, threshold effects, and spillover patterns exist under other institutional and developmental contexts remains an important question for future comparative research.

8. Conclusions and Policy Implications

8.1. Conclusions

Using panel data for 278 prefecture-level cities in China from 2012 to 2023, this study measured digital–intelligent technology innovation by the per capita intensity of patent applications in key digital–intelligent technology fields and constructed an index of urban pollution–carbon synergy based on a DDF-DEA framework. Moreover, this study examined whether, through which channels, and under what conditions digital–intelligent technology innovation is associated with urban pollution–carbon synergy. The following three main conclusions emerged.
First, digital–intelligent technology innovation is positively associated with urban pollution–carbon synergy, but this relationship is not purely linear. The baseline results show that cities with higher per capita digital–intelligent patent intensity tend to exhibit higher synergistic efficiency in pollution reduction and carbon mitigation. This finding remains robust across alternative variable definitions, sample adjustments, index reconstructions, and supplementary identification strategies, including instrumental variable, control function, and policy shock evidence. At the same time, the threshold analysis indicates that the environmental gains of digital–intelligent innovation are stage-dependent rather than immediate. This suggests that digital–intelligent innovation should be understood as a gradual transformation process whose environmental returns become stronger after critical development thresholds are crossed.
Second, the environmental value of digital–intelligent technology innovation depends on whether it can be translated into practical governance capacity. The channel analysis suggests that green technological innovation, digital inclusive finance, and AI firm agglomeration are important routes through which digital–intelligent innovation is associated with higher pollution–carbon synergy. These channels reflect knowledge conversion, financial support, and industrial application scenarios, respectively. Additional analyses further show that the positive relationship is stronger in cities with higher human capital and more developed financial technology, indicating that absorptive capacity and financial support are important enabling conditions for this transformation process. In other words, digital–intelligent innovation does not automatically generate environmental benefits; its effect depends on whether cities can absorb, finance, and apply it effectively.
Third, the improvement in pollution–carbon synergy is reflected in observable energy and emission outcomes and extends across both time and space. The decomposition results show that digital–intelligent innovation is associated with stronger synergy gains in both pollution reduction and carbon mitigation, with a relatively stronger effect on the carbon mitigation dimension. Consistency checks further show that digital–intelligent innovation is associated with higher energy efficiency, lower total energy consumption, lower PM2.5 concentration, lower SO2 emissions, lower total CO2 emissions, and lower CO2 intensity. The dynamic results indicate that these environmental gains are persistent rather than purely contemporaneous, while the spatial results show that the gains are not confined to the local city but also spill over through intercity linkages. Overall, the findings suggest that the environmental significance of digital–intelligent technology innovation lies not only in local technological accumulation, but also in its gradual conversion into green governance capacity and its diffusion across connected urban systems.

8.2. Policy Implications

The above findings imply that policies should focus not only on expanding digital technologies, but also on improving the conditions under which digital–intelligent innovation can be transformed into pollution–carbon governance capacity.
First, digital–intelligent technology policy should be linked more directly to energy management and environmental governance rather than being confined to the digital sector itself. Local governments should encourage the use of digital and intelligent tools in energy consumption monitoring, equipment optimization, production scheduling, emissions tracking, and pollution source identification, especially in energy-intensive industries and major emitting sectors. The key policy objective is not simply to increase the number of digital projects, but also to improve the application of digital–intelligent technologies in concrete low-carbon and pollution control scenarios.
Second, policymakers should pay attention to the stage-dependent nature of digital–intelligent innovation. Since the environmental benefits of digitalization may not appear immediately, policy evaluation should avoid expecting short-run environmental gains from digital expansion alone. In the early stage, investments in digital infrastructure, intelligent equipment, and data-intensive applications may even raise electricity demand and adjustment costs. Therefore, policy design should combine digital investment with complementary measures that help cities move more quickly from the initial expansion stage to the stage in which efficiency and emission reduction gains can be realized.
Third, strengthening the transformation channels is essential. Since green technological innovation, digital inclusive finance, and AI firm agglomeration appear to be important routes linking digital–intelligent innovation to pollution–carbon synergy, local policy should support the integration of digital tools with green R&D, cleaner production technologies, and low-carbon industrial applications. Financial institutions can improve support for green upgrading through digital risk control tools, project databases, and online financing services, while local governments can promote AI-related industrial services that are closely connected to smart manufacturing, energy management, carbon accounting, and environmental monitoring.
Fourth, a differentiated policy should be adopted according to local conditions. Because the environmental returns to digital–intelligent innovation are stronger in cities with higher human capital and more developed financial technology, cities with weaker foundations should not rely solely on expanding digital patents or digital infrastructure. Instead, they should first address constraints in talent cultivation, technology absorption, and financial support for green upgrading. By contrast, cities with stronger human capital and financial technology foundations are better positioned to deepen the integration of digital–intelligent technologies with smart energy systems, intelligent manufacturing, and low-carbon governance.
Fifth, regional coordination should be strengthened to take advantage of spatial spillovers. Since the environmental gains of digital–intelligent innovation can diffuse across cities, local governments should move beyond isolated city-based digital strategies and promote intercity cooperation in technology sharing, joint R&D, industrial collaboration, and governance learning. In urban agglomerations and metropolitan areas, regional platforms for energy management, emissions monitoring, and low-carbon services may help amplify the broader environmental gains of digital–intelligent innovation.
Sixth, fiscal support for digital–intelligent innovation should be better aligned with environmental performance. Local governments should not evaluate digital projects only by input indicators such as subsidies, infrastructure investment, or patent quantity. Instead, fiscal support for digital infrastructure, smart manufacturing, green R&D, and environmental monitoring should also be linked to measurable outcomes, including energy efficiency improvement, pollution and carbon reduction, green technology commercialization, and gains in urban pollution–carbon synergistic efficiency. This would help ensure that digital–intelligent innovation is translated into substantive environmental governance capacity.
Seventh, local fiscal performance evaluation systems could incorporate digital-enabled green governance indicators. Since cities and their subordinate jurisdictions often differ in fiscal capacity, human capital, and financial technology support, their ability to apply digital–intelligent tools in pollution and carbon governance may also vary. Therefore, evaluation systems could gradually include indicators related to energy-saving renovation, digital environmental monitoring, green finance support, and cross-regional pollution–carbon governance. For areas with weaker foundations, transfer payments and special funds could support shared digital platforms, technical training, environmental data services, and regional cooperation, thereby improving the inclusiveness of the green transition.
Overall, the findings suggest that digitalization and green transition are complementary but not automatically aligned. The environmental gains of digital–intelligent technology innovation depend on effective links with green innovation, financial support, local absorptive capacity, and practical application scenarios, while also avoiding potential rebound effects from rising electricity demand and data-intensive expansion.


Author Contributions

Conceptualization, Y.L.; Writing—Original Draft Preparation, Y.L.; Writing—Review and Editing, Y.L., Z.M., H.Y., and J.H.; Investigation, Z.M.; Project Administration, Z.M.; Funding Acquisition, Z.M.; Data Curation, H.Y.; Resources, H.Y.; Visualization, J.H. All authors have read and agreed to the published version of the manuscript.

Funding

This research was funded by the National Social Science Foundation of China, grant number 22BJY065, and the Fundamental Research Funds for the Central Universities (No. 31920240095), Northwest Minzu University “Investment Management” Innovation Team Project.

Institutional Review Board Statement

Not applicable.

Informed Consent Statement

Not applicable.

Data Availability Statement

The raw data supporting the conclusions of this article will be made available by the authors on request.

Conflicts of Interest

The authors declare no conflicts of interest.

References

  1. Zhu, J.; Wu, S.; Xu, J. Synergy between pollution control and carbon reduction: China’s evidence. Energy Econ. 2023, 119, 106541. [Google Scholar] [CrossRef]
  2. Zhu, Y.; Xu, Y.; Yin, S. How does digital technology innovation drive synergies for reducing pollution and carbon emissions? Sustain. Cities Soc. 2024, 116, 105932. [Google Scholar] [CrossRef]
  3. Shen, Y.; Yang, Z. Chasing green: The synergistic effect of industrial intelligence on pollution control and carbon reduction and its mechanisms. Sustainability 2023, 15, 6401. [Google Scholar] [CrossRef]
  4. Lu, J.; Li, H. Can digital technology innovation promote total factor energy efficiency? Firm-level evidence from China. Energy 2024, 293, 130682. [Google Scholar] [CrossRef]
  5. Hu, J. Synergistic effect of pollution reduction and carbon emission mitigation in the digital economy. J. Environ. Manag. 2023, 337, 117755. [Google Scholar] [CrossRef]
  6. Tan, X.; Jiao, J.; Jiang, M.; Chen, M.; Wang, W.; Sun, Y. Digital policy, green innovation, and digital-intelligent transformation of companies. Sustainability 2024, 16, 6760. [Google Scholar] [CrossRef]
  7. Xie, X.; Yan, J. How does artificial intelligence affect productivity and agglomeration? Evidence from China’s listed enterprise data. Int. Rev. Econ. Financ. 2024, 94, 103408. [Google Scholar] [CrossRef]
  8. Cho, J.; DeStefano, T.; Kim, H.; Kim, I.; Paik, J.H. What’s driving the diffusion of next-generation digital technologies? Technovation 2023, 119, 102477. [Google Scholar] [CrossRef]
  9. Zha, Q.; Liu, Z.; Wang, J. Spatial pattern and driving factors of synergistic governance efficiency in pollution reduction and carbon reduction in Chinese cities. Ecol. Indic. 2023, 156, 111198. [Google Scholar] [CrossRef]
  10. Kilinc-Ata, N.; Rahman, M.P. Digitalization and financial development contribution to the green energy transition in Malaysia: Findings from the BARDL approach. Nat. Resour. Forum 2025, 49, 2775–2793. [Google Scholar] [CrossRef]
  11. Cohen, W.M.; Levinthal, D.A. Absorptive capacity: A new perspective on learning and innovation. Adm. Sci. Q. 1990, 35, 128–152. [Google Scholar] [CrossRef]
  12. Cao, B.; Li, L.; Zhang, K.; Ma, W. The influence of digital intelligence transformation on carbon emission reduction in manufacturing firms. J. Environ. Manag. 2024, 367, 121987. [Google Scholar] [CrossRef] [PubMed]
  13. Li, J.; Yang, H.; Zhong, S.; Zhong, Y. Exploring the effect of integration development of digital intelligence on green technology innovation quantity and quality. Sustainability 2025, 17, 4339. [Google Scholar] [CrossRef]
  14. Zhao, Q.; Jiang, M.; Zhao, Z.; Liu, F.; Zhou, L. The impact of green innovation on carbon reduction efficiency in China: Evidence from machine learning validation. Energy Econ. 2024, 133, 107525. [Google Scholar] [CrossRef]
  15. Li, C.; Wang, Y.; Zhou, Z.; Wang, Z.; Mardani, A. Digital finance and enterprise financing constraints: Structural characteristics and mechanism identification. J. Bus. Res. 2023, 165, 114074. [Google Scholar] [CrossRef]
  16. Kaack, L.H.; Donti, P.L.; Strubell, E.; Kamiya, G.; Creutzig, F.; Rolnick, D. Aligning artificial intelligence with climate change mitigation. Nat. Clim. Chang. 2022, 12, 518–527. [Google Scholar] [CrossRef]
  17. David, A.; Yigitcanlar, T.; Li, R.Y.M.; Corchado, J.M.; Cheong, P.H.; Mossberger, K.; Mehmood, R. Understanding local government digital technology adoption strategies: A PRISMA review. Sustainability 2023, 15, 9645. [Google Scholar] [CrossRef]
  18. Razzaq, A.; Sharif, A.; Ozturk, I.; Skare, M. Asymmetric influence of digital finance, and renewable energy technology innovation on green growth in China. Renew. Energy 2023, 202, 310–319. [Google Scholar] [CrossRef]
  19. Wang, H.; Li, Y.; Lin, W.; Wei, W. How does digital technology promote carbon emission reduction? Empirical evidence based on e-commerce pilot city policy in China. J. Environ. Manag. 2023, 325, 116524. [Google Scholar] [CrossRef]
  20. Fang, X.; Liu, M. How does the digital transformation drive digital technology innovation of enterprises? Evidence from enterprise’s digital patents. Technol. Forecast. Soc. Change 2024, 204, 123428. [Google Scholar] [CrossRef]
  21. Song, M.; Xiao, Y.; Zhou, Y. How does the smart city policy influence digital infrastructure? Spatial evidence from China. Land 2023, 12, 1381. [Google Scholar] [CrossRef]
  22. Gu, Q.; Song, Z.; Sun, Y.I.; Yu, X. Digital infrastructure investment and corporate debt concentration: Evidence from a quasi-natural experiment. Pac. Basin Financ. J. 2024, 86, 102429. [Google Scholar] [CrossRef]
  23. Fan, M.; Liu, J.; Tajeddini, K.; Khaskheli, M.B. Digital technology application and enterprise competitiveness: The mediating role of ESG performance and green technology innovation. Environ. Dev. Sustain. 2025, 27, 21195–21225. [Google Scholar] [CrossRef]
  24. Wang, L.; Shao, J. The energy saving effects of digital infrastructure construction: Empirical evidence from Chinese industry. Energy 2024, 294, 130778. [Google Scholar] [CrossRef]
  25. Zhang, W.; Fan, H.; Zhao, Q. Seeing green: How does digital infrastructure affect carbon emission intensity? Energy Econ. 2023, 127, 107085. [Google Scholar] [CrossRef]
  26. Li, X.; Yue, S. Blessing or curse? The role of digital technology innovation in carbon emission efficiency. J. Environ. Manag. 2024, 365, 121579. [Google Scholar] [CrossRef]
  27. He, G.; Jiang, H.; Zhu, Y. The effect of digital technology development on the improvement of environmental governance capacity: A case study of China. Ecol. Indic. 2024, 165, 112162. [Google Scholar] [CrossRef]
  28. Wang, H.; Gu, K.; Sun, H.; Xiao, H. Reconfirmation of the symbiosis on carbon emissions and air pollution: A spatial spillover perspective. Sci. Total Environ. 2023, 858, 159906. [Google Scholar] [CrossRef] [PubMed]
  29. Shen, Y.; Yang, Z.; Zhang, X. Impact of digital technology on carbon emissions: Evidence from Chinese cities. Front. Ecol. Evol. 2023, 11, 1166376. [Google Scholar] [CrossRef]
  30. National Intellectual Property Administration. Classification System for Key Digital Technology Patents; National Intellectual Property Administration: Beijing, China, 2023. Available online: https://www.cnipa.gov.cn/art/2023/9/25/art_75_187769.html (accessed on 25 May 2026).
  31. Ma, P.; Zhang, M.; Wu, W.; Zhu, B. Synergistic efficiency in pollution and carbon reduction: Measurement, evolution, and pathways in Chinese cities. Environ. Impact Assess. Rev. 2025, 113, 107879. [Google Scholar] [CrossRef]
  32. Chung, Y.H.; Färe, R.; Grosskopf, S. Productivity and undesirable outputs: A directional distance function approach. J. Environ. Manag. 1997, 51, 229–240. [Google Scholar] [CrossRef]
  33. Zhou, P.; Ang, B.W.; Poh, K.L. A survey of data envelopment analysis in energy and environmental studies. Eur. J. Oper. Res. 2008, 189, 1–18. [Google Scholar] [CrossRef]
  34. Zhou, P.; Ang, B.W.; Wang, H. Energy and CO2 emission performance in electricity generation: A non-radial directional distance function approach. Eur. J. Oper. Res. 2012, 221, 625–635. [Google Scholar] [CrossRef]
  35. Oh, D.H. A global Malmquist-Luenberger productivity index. J. Product. Anal. 2010, 34, 183–197. [Google Scholar] [CrossRef]
  36. Hu, J.; Zhang, H.; Irfan, M. How does digital infrastructure construction affect low-carbon development? A multidimensional interpretation of evidence from China. J. Clean. Prod. 2023, 396, 136467. [Google Scholar] [CrossRef]
  37. Shi, Y.; Wang, Y. Possibilities for mitigating the Matthew effect in low-carbon development: Insights from convergence analysis. Energy 2024, 289, 130003. [Google Scholar] [CrossRef]
  38. Xiao, X.; Liu, C.; Li, S. How the digital infrastructure construction affects urban carbon emissions: A quasi-natural experiment from the “Broadband China” policy. Sci. Total Environ. 2024, 912, 169284. [Google Scholar] [CrossRef]
  39. Peng, H.R.; Ling, K.; Zhang, Y.J. The carbon emission reduction effect of digital infrastructure development: Evidence from the broadband China policy. J. Clean. Prod. 2024, 434, 140060. [Google Scholar] [CrossRef]
Figure 1. Overall research framework. Notes: This figure summarizes the overall research framework of this study, including the research problem, core variables and data, empirical and identification strategies, extended analyses, and main findings regarding the relationship between digital–intelligent technology innovation and urban pollution–carbon synergistic efficiency.
Sustainability 18 05486 g001
Figure 2. Transformation channels linking digital–intelligent technology innovation to urban pollution–carbon synergistic efficiency. Notes: This figure illustrates the transformation channels through which digital–intelligent technology innovation may influence urban pollution–carbon synergistic efficiency. Green technological innovation, digital inclusive finance, and AI firm agglomeration are presented as the main transformation channels, while human capital and financial technology serve as boundary conditions that strengthen this process. The figure also highlights the extended features of the relationship, including threshold or stage-dependent effects, temporal persistence, and spatial spillovers.
Sustainability 18 05486 g002
Figure 3. Event study estimates of the “Broadband China” policy. Notes: This figure reports the dynamic treatment effects from the event study specification. The dots represent the estimated coefficients for each lead and lag relative to the policy implementation year, and the vertical bars indicate the corresponding 95% confidence intervals. The horizontal dashed line marks the zero-effect benchmark. The pre-treatment coefficients are close to zero, supporting the parallel trend assumption.
Sustainability 18 05486 g003
Figure 4. Placebo test results. Notes: This figure reports the placebo test results based on repeated random assignments of the treatment group. Each point represents one placebo estimate and its corresponding p-value. The vertical dashed line indicates the actual DID estimate, and the horizontal dashed line marks the 5% significance level. Most placebo estimates are concentrated around zero, whereas the actual DID estimate lies clearly to the right of the placebo estimates. This pattern suggests that the benchmark DID result is unlikely to be driven by random treatment assignment or spurious correlation.
Sustainability 18 05486 g004
Figure 5. Spatial distribution of average urban pollution–carbon synergistic efficiency in Chinese prefecture-level cities, 2012–2023. Notes: The figure maps the city-level average urban pollution–carbon synergistic efficiency in Chinese prefecture-level cities from 2012 to 2023. Different colors indicate different ranges of average pollution–carbon synergistic efficiency, while gray areas denote missing observations.
Sustainability 18 05486 g005
Table 1. Descriptive statistics of the main variables.
VariableObsMeanStd. Dev.MinMax
SDCL33360.2680.976−0.6256.816
Kinva33361.8034.323063.638
fintech3336123.736104.8775.4691803.529
open33360.1770.27302.491
diginfra333628.93520.2172.872355.47
humcap33360.0190.01900.121
urban33360.5820.1490.1810.990
fiscal33360.2050.1020.0440.872
popagg33363.4224.6890.03860.972
Notes: SDCL denotes urban pollution–carbon synergistic efficiency. K i n v a denotes digital–intelligent technology innovation. f i n t e c h denotes financial technology; o p e n denotes the degree of openness; d i g i n f r a denotes digital infrastructure; h u m c a p denotes human capital; u r b a n denotes the urbanization level; f i s c a l denotes fiscal capacity; and p o p a g g denotes population agglomeration. Obs. refers to the number of city-year observations, and Std. Dev. refers to the standard deviation. The sample covers 278 prefecture-level cities in China from 2012 to 2023.
Table 2. Baseline regression results.
(1)(2)(3)
SDCLSDCLSDCL
Kinva0.128 ***0.119 ***0.173 ***
(7.65)(6.80)(6.54)
fintech −0.0010.002
(−1.12)(1.23)
open −0.2510.252
(−1.41)(0.52)
diginfra 0.003 **−0.004 ***
(2.35)(−2.83)
humcap −1.703−1.511
(−0.74)(−0.23)
urban −0.472 ***−1.393 ***
(−2.80)(−3.10)
fiscal 0.547 **1.131 *
(2.14)(1.93)
popagg 0.052 ***0.221 *
(4.45)(1.79)
ControlsNOYESYES
City FENONOYES
Year FENONOYES
Observations333633363336
R-squared0.3220.3610.593
Notes: t statistics are reported in parentheses. *, **, and *** denote significance at the 10%, 5%, and 1% levels, respectively.
Table 3. Robustness tests.
(1)(2)(3)(4)(5)(6)(7)(8)
SDCLSDCLSDCLSDCLSDCLSDCLSDCLSDCL
Kinva0.061 ***0.165 *** 0.199 ***0.145 *** 0.164 ***0.153 **
(4.24)(4.36) (6.44)(6.66) (4.29)(2.51)
Ln(1+Kinva) 0.868 ***
(4.34)
Kinvg 0.324 ***
(5.87)
ControlsYESYESYESYESYESYESYESYES
City FEYESYESYESYESYESYESYESYES
Year FEYESYESYESYESYESYESYESYES
Observations33363288333633363336333632713043
R-squared0.1480.5650.5390.62920.5470.6040.5740.507
Notes: Column (1) uses an alternative S D C L measure constructed under the sequential frontier. Column (2) excludes municipalities directly under the central government. Column (3) replaces the core explanatory variable with l n ( 1 + K i n v a ) . Column (4) reconstructs S D C L as 0.4 × d e p + 0.6 × d e c o 2 . Column (5) reconstructs S D C L as 0.6 × d e p + 0.4 × d e c o 2 . Column (6) replaces the core explanatory variable with the per capita number of granted patents in key digital technology fields. Column (7) excludes observations in the bottom 1% of pollution reduction efficiency ( P R E ) or carbon mitigation efficiency ( C R E ) to alleviate denominator sensitivity concerns in the ratio-based S D C L construction. Column (8) excludes observations in the bottom 5% of P R E or C R E . t statistics are reported in parentheses. **, and *** denote significance at the 5%, and 1% levels, respectively.
Table 4. Instrumental variable estimation results.
(1)(2)(3)(4)(5)
First StageSecond StageCF First StageCF Second StageIV with Province × Year FE
Ruggedness × telecom growth3.839 *** 3.839 ***
(5.39) (5.391)
Kinva 0.476 *** 0.476 ***0.131 ***
(4.15) (4.85)(3.11)
First-stage residual −0.305 ***
(−3.19)
ControlsYESYESYESYESYES
City FEYESYESYESYESYES
Year FEYESYESYESYESYES
Province×Year FENONONONOYES
Observations33363336333633363336
K-P rk LM 23.768 ***
K-P rk Wald F 29.074
Notes: t statistics are reported in parentheses. *** denote significance at the 1% levels, respectively. The dependent variable in the first-stage regressions is K i n v a , and the dependent variable in the second-stage regressions is S D C L . Ruggedness×telecom growth is used as the instrumental variable for digital–intelligent technology innovation. CF denotes the control-function approach. Column (5) further controls for province-by-year fixed effects. K-P rk LM and K-P rk Wald F denote the Kleibergen–Paap under-identification and weak-instrument test statistics, respectively.
Table 5. DID results based on the “Broadband China” policy.
(1)(2)(3)
SDCLSDCLKinva
Broadband China × Post0.382 ***0.222 ***0.774 ***
(10.40)(2.67)(2.89)
ControlsNOYESYES
City FENOYESYES
Year FENOYESYES
Observations333633363336
R-squared0.0310.4300.868
Notes: Columns (1) and (2) use S D C L as the dependent variable, while Column (3) uses K i n v a as the dependent variable. B r o a d b a n d C h i n a × P o s t is the DID interaction term, where Broadband China equals 1 for treated cities and 0 otherwise, and Post equals 1 for the post-policy period and 0 otherwise. Column (1) reports a parsimonious specification without additional controls or two-way fixed effects. Columns (2) and (3) include control variables, city fixed effects, and year fixed effects. t statistics are reported in parentheses. *** denote significance at the 1% levels, respectively.
Table 6. Threshold effect tests of K i n v a .
ThresholdF-Statisticp-Value10%5%1%
SDCLSingle104.250.00029.18234.57843.311
Double45.950.01028.07533.00144.715
Notes: This table reports the bootstrap test results for the threshold effects of K i n v a . The dependent variable is S D C L . “Single” and “Double” denote the single-threshold and double-threshold tests, respectively. The bootstrap F-statistics, p-values, and the corresponding critical values at the 10%, 5%, and 1% levels are reported in the table. Since both the single-threshold and double-threshold tests are statistically significant, the double-threshold specification is adopted in the subsequent analysis.
Table 7. Double-threshold regression results of K i n v a on SDCL.
(1)
Double-Threshold Model
Low regime−0.269 ***
(−2.98)
Middle regime0.018
(0.42)
High regime0.153 ***
(6.60)
ControlsYES
City FEYES
Year FEYES
Observations3336
R-squared0.546
Notes: The dependent variable is S D C L . K i n v a is both the explanatory variable and the threshold variable. The reported coefficients represent the marginal effects of K i n v a on S D C L in different threshold regimes. Specifically, the low, middle, and high regimes are defined as K i n v a ≤ 1.2565, 1.2565 < K i n v a ≤ 7.7053, and K i n v a > 7.7053. t statistics are reported in parentheses. *** denote significance at the 1% levels, respectively.
Table 8. Contemporaneous mechanism test results.
(1)(2)(3)(4)(5)(6)
Green PatentsSDCLDigital Inclusive FinanceSDCLAI Firm AgglomerationSDCL
Kinva339.287 ***0.114 ***0.6001 ***0.160 ***2177.603 ***0.057 *
(11.08)(3.86)(3.55)(6.32)(6.59)(1.76)
Green patents 0.0002 **
(2.45)
Digital inclusive finance 0.0199 ***
(6.18)
AI firm agglomeration 0.0001 ***
(4.87)
ControlsYESYESYESYESYESYES
City FEYESYESYESYESYESYES
Year FEYESYESYESYESYESYES
Observations333633363336333633363336
R-squared0.9380.6020.9920.6080.8410.632
Notes: t statistics are reported in parentheses. *, **, and *** denote significance at the 10%, 5%, and 1% levels, respectively.
Table 9. Lagged mechanism test results.
(1)(2)(3)(4)(5)(6)
Lagged Green PatentsSDCLLagged Digital Inclusive FinanceSDCLLagged AI Firm AgglomerationSDCL
Kinva431.102 ***0.0240.554 ***0.166 ***1737.018 ***0.073 *
(10.16)(0.55)(3.26)(6.21)(5.69)(1.86)
Lagged green patents 0.0004 ***
(3.99)
Lagged digital inclusive finance 0.023 ***
(6.41)
Lagged AI firm agglomeration 0.0001 ***
(4.02)
ControlsYESYESYESYESYESYES
City FEYESYESYESYESYESYES
Year FEYESYESYESYESYESYES
Observations305830583058305830583058
R-squared0.9530.6390.9920.6260.8520.638
Notes: t statistics are reported in parentheses. * and *** denote significance at the 10%, and 1% levels, respectively.
Table 10. Decomposition of pollution–carbon synergy.
(1)(2)(3)
SDCLPollution Reduction Synergy GainCarbon Mitigation Synergy Gain
Kinva0.172 ***0.036 ***0.309 ***
(6.54)(5.22)(6.20)
ControlsYESYESYES
City FEYESYESYES
Year FEYESYESYES
Observations333633363336
R-squared0.5930.6530.697
Notes: t statistics are reported in parentheses. *** denote significance at the 1% levels, respectively.
Table 11. Effects on energy efficiency and energy consumption.
(1)(2)
Energy EfficiencyEnergy Consumption
Kinva0.036 ***−0.029 ***
(3.78)(−3.98)
ControlsYESYES
City FEYESYES
Year FEYESYES
Observations33363336
R-squared0.7670.887
Notes: t statistics are reported in parentheses. *** denote significance at the 1% levels, respectively.
Table 12. Effects on pollution and carbon emission outcomes.
(1)(2)(3)(4)
PM2.5SO2Total CO2 EmissionsCO2 Intensity
Kinva−0.006 ***−0.031 ***−0.038 ***−0.045 ***
(−6.73)(−3.85)(−4.68)(−4.45)
ControlsYESYESYESYES
City FEYESYESYESYES
Year FEYESYESYESYES
Observations3336333633363336
R-squared0.9720.8600.9110.819
Notes: t statistics are reported in parentheses. *** denote significance at the 1% levels, respectively.
Table 13. Heterogeneity analysis by initial human capital and financial technology.
(1)(2)(3)(4)
Human CapitalFinancial Technology
LowHighLowHigh
Kinva0.0560.165 ***0.103 *0.153 ***
(0.92)(6.14)(1.89)(5.44)
ControlsYESYESYESYES
City FEYESYESYESYES
Year FEYESYESYESYES
Observations1668166816681668
R-squared0.5800.6270.4100.678
Notes: t statistics are reported in parentheses. * and *** denote significance at the 10%, 1% levels, respectively. Cities are divided into low- and high-level groups according to the median values of initial human capital and initial financial technology in 2012.
Table 14. Interaction tests for boundary conditions.
(1)(2)
Human CapitalFinancial Technology
Kinva−0.047−0.004
(−0.56)(−0.06)
High human capital × Kinva0.221 **
(2.48)
High financial technology × Kinva 0.187 ***
(2.95)
ControlsYESYES
City FEYESYES
Year FEYESYES
Observations33363336
R-squared0.6050.599
Notes: t statistics are reported in parentheses. **, and *** denote significance at the 5%, and 1% levels, respectively.
Table 15. Dynamic effects of digital–intelligent technology.
(1)(2)(3)(4)
CurrentLag 1Lag 2Lag 3
Kinva0.172 ***
(6.54)
Kinvat−1 0.181 ***
(6.23)
Kinvat−2 0.190 ***
(5.32)
Kinvat−3 0.179 ***
(4.38)
ControlsYESYESYESYES
City FEYESYESYESYES
Year FEYESYESYESYES
Observations3336305827802502
R-squared0.5930.6100.6360.673
Notes: t statistics are reported in parentheses. *** denote significance at the 1% levels, respectively.
Table 16. Spatial spillover effects under alternative spatial weight matrices.
(1)(2)(3)
Adjacency MatrixGeographical Distance MatrixEconomic–Geographic Nested Matrix
Kinva0.161 ***0.161 ***0.134 ***
(24.05)(23.93)(18.95)
W × Kinva0.031 **0.245 ***0.093 ***
(2.29)(4.07)(7.21)
ρ0.228 ***0.783 ***0.197 ***
(10.10)(13.85)(6.77)
Direct effect0.165 ***0.168 ***0.138 ***
(24.09)(23.68)(19.45)
Indirect effect0.083 ***1.878 ***0.146 ***
(6.02)(2.73)(12.08)
Total effect0.248 ***2.046 ***0.283 ***
(15.73)(2.97)(22.52)
ControlsYESYESYES
City FEYESYESYES
Year FEYESYESYES
Observations333633363336
Notes: The dependent variable is urban pollution–carbon synergistic efficiency ( S D C L ). Columns (1)–(3) report the results under the adjacency matrix, geographical distance matrix, and economic–geographic nested matrix, respectively. All spatial weight matrices are row-standardized. ρ denotes the spatial autoregressive coefficient. Direct, indirect, and total effects are computed based on the spatial Durbin model. z statistics are reported in parentheses. **, and *** denote significance at the 5%, and 1% levels, respectively.
Disclaimer/Publisher’s Note: The statements, opinions and data contained in all publications are solely those of the individual author(s) and contributor(s) and not of MDPI and/or the editor(s). MDPI and/or the editor(s) disclaim responsibility for any injury to people or property resulting from any ideas, methods, instructions or products referred to in the content.