Article

Environmental Performance of Circular Cascade Hydroponic Systems: A PEFCR-Based Comparative Life Cycle Assessment of Greenhouse Cucumber and Melon Production


by
Styliani Konstantinidi
1,
Anna Vatsanidou
1,*,
Vasileios Anestis
2,
Nikolaos Katsoulas
3 and
Thomas Bartzanas
2
1
Department of Agricultural Development, Agri-Food & Natural Resources Management, National and Kapodistrian University of Athens, Evripos Campus, 34400 Psachna, Greece
2
Department of Natural Resources Development and Agricultural Engineering, Agricultural University of Athens, 75 Iera Odos Street, 11855 Athens, Greece
3
Department of Agriculture, Crop Production and Rural Environment, University of Thessaly, 38446 Volos, Greece
*
Author to whom correspondence should be addressed.
Sustainability 2026, 18(11), 5477; https://doi.org/10.3390/su18115477 (registering DOI)
Submission received: 5 May 2026 / Revised: 24 May 2026 / Accepted: 26 May 2026 / Published: 29 May 2026

Abstract

Conventional hydroponic systems, although resource-efficient, face significant sustainability challenges due to the discharge of nutrient-rich effluents, resulting in severe environmental pressures. In alignment with the European Union’s “Farm to Fork” strategy, innovative circular economy approaches are required to decouple crop production from environmental degradation. This study evaluates a novel Cascade Hydroponic System (CHS), designed to maximize resource utility by recovering and reusing the drainage from a primary salt-sensitive crop (cucumber) to a secondary, more salt-tolerant cultivation (melon). A comparative Life Cycle Assessment (LCA) is performed in accordance with the Product Environmental Footprint Category Rules (PEFCRs), utilizing primary operational data and direct monitoring of nutrient concentrations in the system’s effluent. The convergence of these elements establishes the novelty of this study. The CHS is benchmarked against a conventional Separated Hydroponic System (SHS) for a functional unit (FU) defined as “the simultaneous production of 1.0 kg of cucumber and 1.0 kg of melon”. The CHS demonstrated lower characterized impacts compared to SHS across all 16 assessed Environmental Footprint categories under the examined pilot-scale conditions. The key findings include reductions of 65.7%, 41.8%, and 30% in Water Use, Climate Change, and Freshwater Eutrophication scores, respectively. Based on the normalization results, the CHS revealed a 58% lower total environmental footprint score compared to SHS. Process contribution analysis indicates that the marked decrease in the environmental burden is associated with the use of fertilizers. While these inputs represent a significant share of the conventional system’s impact scores, their contribution was substantially lower in the CHS. Although based on pilot-scale operational data from a single crop cycle, the results highlight the considerable environmental potential of cascading nutrient reuse configurations, thus enhancing resource use efficiency and mitigating the associated environmental impacts while also contributing novel empirical knowledge to a field that has been limitedly studied.

1. Introduction

Through the European Green Deal and the related Farm to Fork Strategy, the European Union has set ambitious goals to transform its food systems into global benchmarks for sustainability. The goals include a significant reduction in the environmental and climate footprint of the agricultural sector, with a reduction in nutrient losses of at least 50% and in fertilizer use of at least 20% by 2030 [1]. Achieving these goals requires a fundamental change in how resources are managed in the food supply chain, placing the circular economy at the heart of agricultural production. By prioritizing resource efficiency and the valorisation of waste streams, agricultural systems can shift from linear models to circular processes, where the value of each input is maximized.
On a global scale, agriculture accounts for approximately 70% of total freshwater consumption [2], making efficient usage of water for irrigation an urgent need, especially in arid areas like the Mediterranean [3]. Within the Mediterranean basin, the sustainability of water resources is severely challenged by acute water scarcity, high irrigation needs, and escalating structural demands driven by tourism, industrialization, and population growth—pressures expected to intensify under projected regional climate change [4]. Within this context of resource intensity, hydroponic systems have emerged as a superior alternative to conventional agriculture. The independence of cultivation from the soil, together with the precise control over the production process, makes hydroponics offer higher yields with significantly lower land requirements, reduced resource consumption, and more efficient control of pathogens [5,6,7,8,9]. Soilless cultivation systems are emerging as a promising solution to address the critical issues of declining available arable land and the simultaneous increase in global food demand [10] through technologies that enhance productivity and efficient input management [9,11]. However, despite these advantages, hydroponics still faces sustainability challenges. Most commercial systems operate as “open” or “semi-closed” systems, where a significant volume of nutrient solution is ultimately discharged as waste to the environment [12]. This method of waste management is a common practice; however, it is associated with a significant loss of valuable resources and poses a serious risk to local ecosystems through leaching and subsequent eutrophication [13,14,15,16].
The cascade hydroponic systems are based on the sequential reuse of drainage solution from a primary, salt-sensitive crop to a secondary, more salt-tolerant crop [17,18,19]. This cascading approach effectively converts a potential pollutant into a high-value input for the secondary crop. With the “sequential” flow of nutrients, the system aims to drastically reduce the demand for virgin water and inorganic fertilizers without sacrificing crop yields [20].
Sustainable development, particularly sustainable production and consumption within the agri-food sector, has been a paramount global priority since the 2000s. Within this framework, numerous international initiatives that have been developed, aim at mitigating the environmental burdens of food systems [21]. LCA has emerged as a robust and widely accepted methodology for quantifying and evaluating the comprehensive environmental impacts of agricultural production systems, thereby driving sustainability advancements and informed decision making. Methodologically, LCA is recognized as an effective tool for the quantitative analysis of agricultural inputs and operational activities [22], enabling both producers and consumers to objectively evaluate and compare product sustainability [23]. Its utility is particularly evident in its capacity to identify hotspots of maximum environmental impact and contrast different mitigation strategies within diverse agricultural systems [24].
Assessing the real benefits of such an innovative system as the cascade hydroponic system presented in this study requires a holistic approach that goes beyond simple performance measurements. LCA is the most reliable methodology for this purpose, as it quantifies the environmental performance of a product system throughout its whole life cycle. Unlike individual indicator measurements, LCA provides a comprehensive environmental assessment while allowing the identification of the points of greatest environmental impact [25,26].
This study presents a comprehensive, comparative LCA grounded in primary data derived from a pilot-scale experimental study conducted in Velestino, Volos, Greece [17]. The objective is to quantify and compare the environmental performance of a prototype cascade-type hydroponic system with a conventional separated hydroponic setup, both evaluated at the same experimental scale. The comparison centres on the simultaneous production of cucumber and melon crops. The simultaneous production was facilitated by an interconnected irrigation network linking two separate greenhouse structures at the University of Thessaly. The nutrient solution effluent from the primary crop (cucumber) was collected and transferred to the secondary crop (melon) [17]. Cucumber cultivation, which was chosen as the primary crop, is characterized as highly sensitive to salinity, especially during germination and seedling stages [27]. On the other hand, melon was used as the secondary crop as it demonstrates a higher tolerance to salinity than cucumber, classifying it as a moderately salt-tolerant crop [17]. It can tolerate soil salinity of about 1.5–2.7 dS/m before its yield begins to decline [28]. By utilizing the primary data from the direct measurement system of effluents, this research aims to assess the potential environmental effect of implementing the cascade configuration and provide insights for the future of sustainable greenhouse horticulture.
The LCA utilizes the empirical findings of the experimental work performed from the two systems, which established that the CHS achieved a 22% increase in Water Use Efficiency (WUE) and substantial increases in nutrient use efficiency, specifically 21.7% for Nitrogen (NUE) and 21.8% for Phosphorus (PUE), compared to the monoculture system [17]. The implementation of an LCA provides an essential advancement beyond these metrics by translating physical resource savings into comprehensive environmental scores. Unlike efficiency metrics that focus primarily on the operational cultivation phase, the nature of LCA is to account for the environmental burdens embedded across the entire life cycle of a product. By considering the broader spectrum of upstream and downstream stages, the methodology quantifies the “hidden” impacts that occur outside the greenhouse gates. This means that the benefit of saving 21.7% Nitrogen (N) is not only measured as a reduction in field leaching but is also quantified in terms of the avoided energy, fossil fuel consumption, and greenhouse gas (GHG) emissions generated during the industrial manufacturing of those mineral fertilizers. Furthermore, LCA integrates these savings into a comprehensive environmental profile, covering and quantifying a wide range of environmental issues [29], thus providing a holistic overview of environmental sustainability that cannot be captured by a typical measurement of the efficiency of resource use.

2. Materials and Methods

2.1. Systems Description

The analysis focuses on two distinct soilless cultivation configurations, at the same type of greenhouses, that utilize perlite slabs as a growing medium. These configurations were located at the University of Thessaly’s facilities in Velestino, Greece.
System 1: Conventional Separated Hydroponic System (SHS): This system represents a baseline practice, consisting of two independent, conventional hydroponic units, one optimized for cucumber and one optimized for melon cultivation. Both units are supplied with fresh nutrient solutions. The nutrient solution runoff (effluent) from both units is collected separately and discharged, representing the reference practice where residual nutrients and water are wasted. This configuration serves as the reference control system for quantifying the environmental burden of open-loop fertigation systems that are frequently seen in greenhouse cultivations, where the discharge of nutrient-rich effluent remains a significant environmental challenge.
System 2: Cascade Hydroponic System (CHS): The CHS was designed as an integrated circular system consisting of a donor crop (cucumber) and a receiver crop (melon). This novel system utilizes cascade hydroponics, in which the nutrient solution effluent from the primary crop (cucumber) is collected, adjusted to a desired pH, and then supplied as the input nutrient solution for the secondary crop (melon). The system operates on a nutrient recovery logic, where the receiving crop utilizes the residual N, P, and K loads from the donor crop’s effluent. This arrangement maximizes resource utilization by recovering and recycling nutrients and water, reducing the need for new fertilizer and water inputs for the secondary crop [17].

2.2. Goal and Scope Definition

This study is an important addition to the literature, as it addresses a specific and under-researched area of environmental assessment of protected horticulture. While the existing research has extensively evaluated greenhouse crops and classic hydroponic systems (open or closed ones), the literature has been centred on a limited range of techniques. Furthermore, the novelty of this research is underscored by its alignment with the Fresh Produce, PEFCR framework [30]. Overall, this study couples an innovative cascading nutrient recovery technology with the robust framework of PEFCR and on-site effluent measurements, thereby providing a significant addition for the research field of sustainable horticulture that is so far under-represented.
This LCA study adheres to both the ISO 14040/44 standards and the methodological requirements of the PEFCR for Fresh Produce [30,31,32]. The primary goal is to recognize, assess, and estimate the potential environmental benefits and resource savings of the novel CHS compared to the SHS. This comparative study quantifies and assesses differences in environmental impacts associated with the cultivation of cucumber and melon, with a specific focus on fertilizers and water use efficiency.
The two systems are compared under the defined FU, which is “The (simultaneous) production of 1 kg of fresh cucumber and 1 kg of fresh melon at the greenhouse gate”. This FU ensures a direct comparison of the environmental performance of the two systems in delivering the same functional output. The selected FU considered to be the most appropriate, since the cascade system intrinsically generates two marketable outputs from one interconnected nutrient flow; therefore, evaluating the systems on a single-crop basis would artificially partition the environmental benefits of nutrient reuse and underestimate the integrated functionality of the cascading architecture.
The study employs a Cradle-to-Gate system boundary (Figure 1). In line with the comparative nature of this LCA, only the unit processes that differ significantly between the SHS and the CHS are included in the modelling. This focused approach isolates the resource savings achieved by the CHS. The processes included in the modelling cover the stages of production and supply of inputs, the stage of cultivation and harvesting, as well as the stage of the nutrient solution disposal. More specifically, fertilizer production and water and energy supply are modelled as their consumption varies significantly between the two systems. The nutrient solution discharges are also modelled as a critical flow that differs significantly between the two systems, both in terms of the quantity discharged and the way it is managed. On the other hand, several burdens are excluded from the life cycle inventory modelling because they were assumed to be identical for both systems, SHS and CHS. The excluded elements include the following: the infrastructure of the greenhouse, the basic hydroponic system components, the production and application of plant protection products, and the downstream processes of packaging, transportation to retail/consumer, consumer use, and end-of-life disposal of the final produce. Including them in the assessment would not affect the relative comparative performance, since they would add the same impact on both systems. The justification for these exclusions is summarized in Table S1.

2.3. Allocation Procedures

To address the multi-functional nature of the production process, this study follows the decision hierarchy outlined in the Product Environmental Footprint (PEF) method [33] by employing system expansion. As the cascading nutrient flow utilizes a singular input stream to generate two distinct products, the system boundaries are broadened to include both crops. Consequently, the FU is defined as “the simultaneous production of 1.0 kg of fresh cucumber and 1.0 kg of fresh melon”. By modelling all inputs and emissions within the expanded system, the methodology reflects the actual resource use efficiency of the integrated cascading cycle and eliminates the need for partitioning environmental burdens between the two crops.

2.4. Life Cycle Inventory (LCI)

The inventory data are compiled to quantify the inputs and outputs required to meet the FU requirements (the production of 1.0 kg of cucumber and 1.0 kg of melon) for both the SHS and the CHS, according to PEFCR guidelines [30].
Primary data are collected for the operational phase, including precise consumption figures for fertilizers, water volume, and specific electricity use for pumping and monitoring equipment. These primary data are scaled proportionally to meet the combined production of 1.0 kg of cucumber and 1.0 kg of melon. The cultivation cycles analysed are 98 days for cucumber and 32 days for melon. These data have been collected from the pilot greenhouse facility of the University of Thessaly, located in Velestino, Volos, Greece. The primary data collected for yield, fertilizer application, and energy use for the measured period are used to model the systems. Secondary data related to the production of background materials and energy carriers (e.g., manufacturing of fertilizers, electricity generation, transport of inputs) are sourced from the Ecoinvent 3 [34] and Agri-footprint [35] databases. To ensure high geographical representativeness for the evaluated site, these background datasets were adapted to the specific operational circumstances of the present study. Specifically, the modelling of operational electricity explicitly utilizes the Greek energy grid mix dataset, while regional European average datasets were applied as the closest technological proxies where Greek-specific data were unavailable.
The emissions associated with the use of fertilizers (N and P compounds) are modelled using a preference level approach described in PEFCR guidelines (Table 1) [30]. For waterborne nutrient discharges, the study leverages Preference Level 1 (Direct Measurement). The precise mass of Nitrate (NO3), Ammonium (NH4), and Phosphate (PO4) measured in the effluent volume from each system is modelled as an emission into the freshwater compartment. Furthermore, the potassium (K) content of the effluent is also measured and modelled as an emission to the Freshwater, although K is not a mandatory Environmental Footprint (EF) impact category emission [27]. Conversely, for emissions to air, the study adhered to Preference Level 3 (Default Modelling), mandating the use of the Intergovernmental Panel on Climate Change (IPCC) guidelines [36,37]. This means that airborne emissions related to the application of fertilizer inputs, specifically Ammonia (NH3) and Nitrogen Oxides (NOx), are calculated using the IPCC Tier 1 default emission factors. Similarly, direct and indirect Nitrous Oxide (N2O) emissions are calculated using the IPCC 2019 Tier 1 guidelines [37]. Table 1 and Table S2 summarize the approaches followed to model the systems’ emissions.
The inventory results for the key inputs, outputs, and emissions of the two systems, normalized to the production of the 1.0 kg cucumber and 1.0 kg melon combined, are summarized in Table 2. Table 2 summarizes the foreground data for both SHS and CHS configurations, normalized to the FU. For the SHS, the values represent the cumulative sum of the individual resource inputs and emissions from the separate cucumber and melon cultivation units. For the CHS, the values represent a single, integrated system flow. The inventory covers all inputs introduced to the cycle, including the primary fertigation supply and any additional nutrient flow supplements that the secondary crop can require. The emission data are derived solely from the final discharge point after the solution passes through the entire sequence.

2.5. Life Cycle Impact Assessment (LCIA)

The environmental impacts of the two cultivation systems are calculated using the EF v3.1 method [33,34,35]. The EF v3.1 method, launched by the European Commission, provides a detailed and comprehensive set of technical rules ensuring that outcomes are robust, verifiable, and comparable. The environmental impacts are calculated using the 16 mandatory impact categories of the EF v3.1 methodology, implemented in Sima Pro software [36]. The results are reported and characterized, normalized, and weighted as required by the PEFCR. The following list of impact categories, mandated by the Fresh Produce PEFCR guidelines, are calculated and reported (Table 3) [24]. The characterisation results express the magnitude of the contribution of each input and output to the respective impact categories. They are derived using the EF v3.1 characterisation factors that are specific to each substance or resource. In the normalization stage, the results of the LCIA are multiplied by normalization factors; therefore, the magnitude of their contribution to the EF impact categories is normalized in relation to a reference unit. In the PEF method, the normalization factors are based on a global value and are stated per capita. Finally, during the weighting phase, which is a mandatory step in PEF studies, the normalized results are multiplied by weighting factors that reflect the perceived relative importance of the life cycle impact categories examined. During this step, the weighted results across different impact categories can be compared to evaluate their relative importance. At this stage, it is possible to aggregate the impacts to obtain a single score for each scenario and assess their performance [35].

2.6. Limitations of the Study

A recognized limitation of this research is the temporal scope of the data collection phase, which utilized a period of 98 days for the primary crop and 32 days for the secondary crop. In accordance with the Fresh Produce PEFCR, cultivation activity data shall ideally be collected and averaged for at least three consecutive years to account for seasonal fluctuations and ensure long-term representativeness [19]. While formal data quality and uncertainty assessments were not performed, the reliance on primary data derived from direct measurements ensures a high level of data quality and provides a transparent foundation for the environmental assessment.

3. Results

3.1. Characterization Results

The results of the comparative LCA are presented with the primary objective of identifying, evaluating, and assessing the potential environmental benefits and resource savings achieved with the innovative CHS compared to SHS. The presentation of the data is structured to focus on the environmental benefits of CHS, specifically quantifying the improvement in resource efficiency (fertilizers and water) and the consequent reduction in related environmental impacts, in accordance with the comparative objective defined in the study’s Goal and Scope.
The environmental performance of both CHS and SHS, normalized to the FU of “the production of 1.0 kg cucumber and 1.0 kg melon” (Characterization Results), is presented in Table 4. The results demonstrate that the resource efficiency achieved by CHS leads to a quantifiable reduction in environmental impact across all 16 impact categories.
The net water savings achieved by using the cucumber effluent as input for melon cultivation in the CHS system led to a remarkable 65.7% reduction in the WU impact category. Furthermore, the decrease in primary fertilizer consumption, combined with the reduction in nutrient flows to the environment, is the key driver for the 85.9% improvement in ECF impact. Moreover, the reduced nutrient losses are translated into important savings for the two eutrophication impact categories: EF and EM impacts are reduced by approximately 30% and 34.2%, respectively.
The decreased need for inputs leads to savings for crucial environmental impact categories, including CC, RUF, and RUMM. The overall CC impact is improved by 41.8%, an improvement attributed to the CCF sub-category reduction, which accounts for approximately 99% of the total CC impact. This correlation confirms that CHS’s reduced need for primary fertilizer inputs is translated into avoided upstream energy consumption in the highly energy-intensive fertilizer manufacturing processes. The RUMM impact category shows the highest improvement, a fact that reflects the significant savings in the mining and production of mineral resources required for the fertilizer mix production.

3.2. Normalization Results

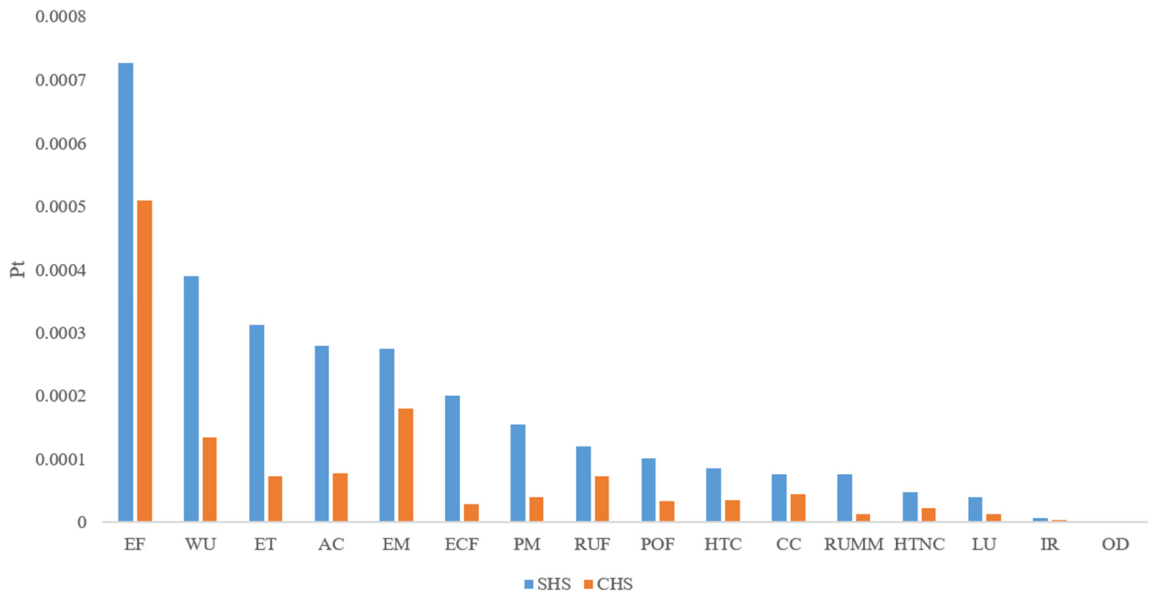
The normalization phase aims to identify the most significant environmental impacts by scaling the impact results to a common reference unit (Pt), thereby allowing for a direct comparison across diverse categories. As shown in Figure 2, the results are presented in decreasing order of impact to highlight which categories contribute most heavily to the overall environmental profile. This analysis reveals that EF, WU, and ET are the most significant impact categories for both systems. From this normalized perspective, the CHS demonstrates a consistent reduction in environmental pressure across the evaluated indicators. Most notably, the CHS effectively addresses the significant impacts identified, achieving declines in water use, eutrophication, and acidification potentials (Figure 2). These findings provide a transparent and justified basis for the comparative assertion that cascading architectures have the potential to significantly reduce the environmental footprint of protected horticulture compared to conventional ones.
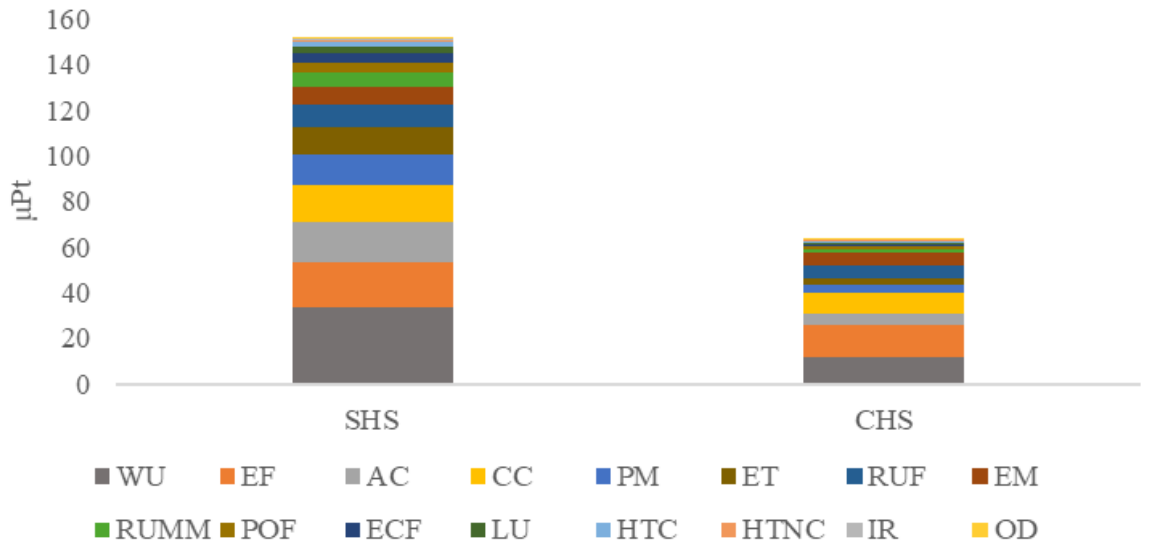
Following normalization, the weighting phase was conducted to prioritize the environmental impacts according to their perceived severity and to calculate a single environmental score for each system. The objective of this step is to consolidate the 16 normalized impact categories into a single, comparable value (expressed in micro-points, μPt), thereby providing a definitive measure of the overall environmental performance of the CHS relative to the SHS. As illustrated in the weighted results (Figure 3), this aggregated perspective confirms the systemic efficiency of the cascading model. The CHS achieved a total weighted score of approximately 63.1 μPt, representing a 58% reduction in the total environmental footprint compared to the 151.1 μPt generated by the reference system. This single score highlights that the most significant contributions to the total footprint come from WU, EF, CC, and AC. By effectively mitigating these specific significant categories, the CHS appears to be a more effective configuration over the traditional system for sustainable intensification, decoupling crop production from the most critical environmental pressures.

3.3. Process Contribution Analysis

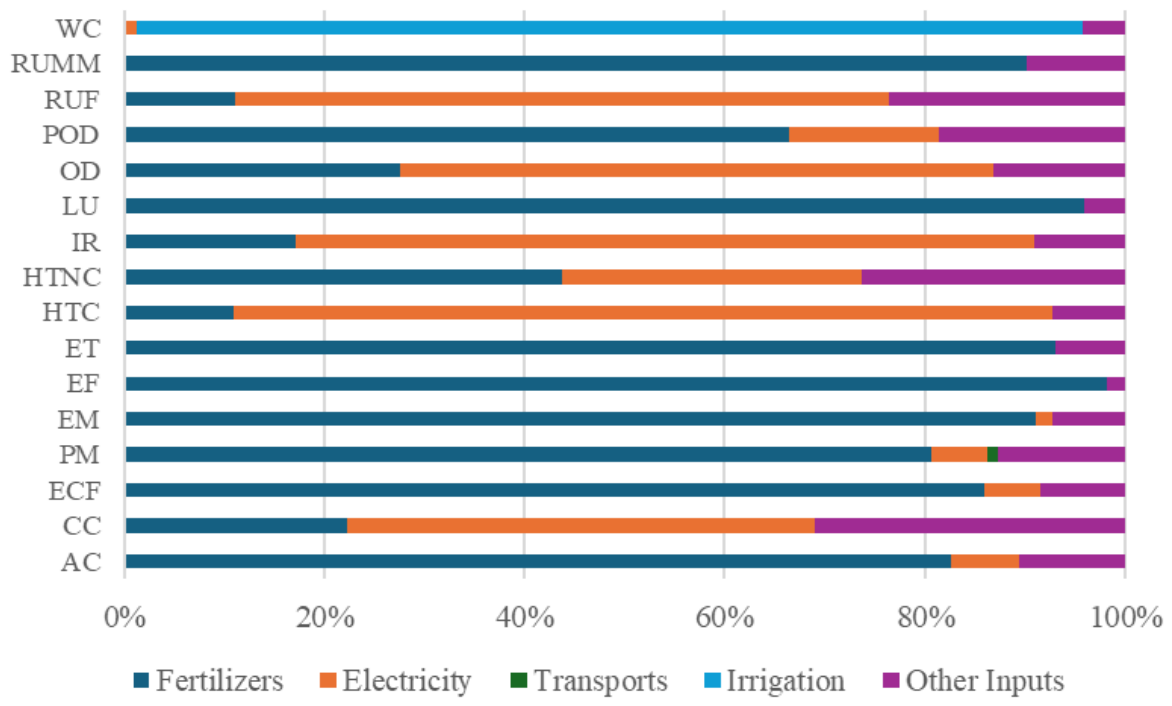
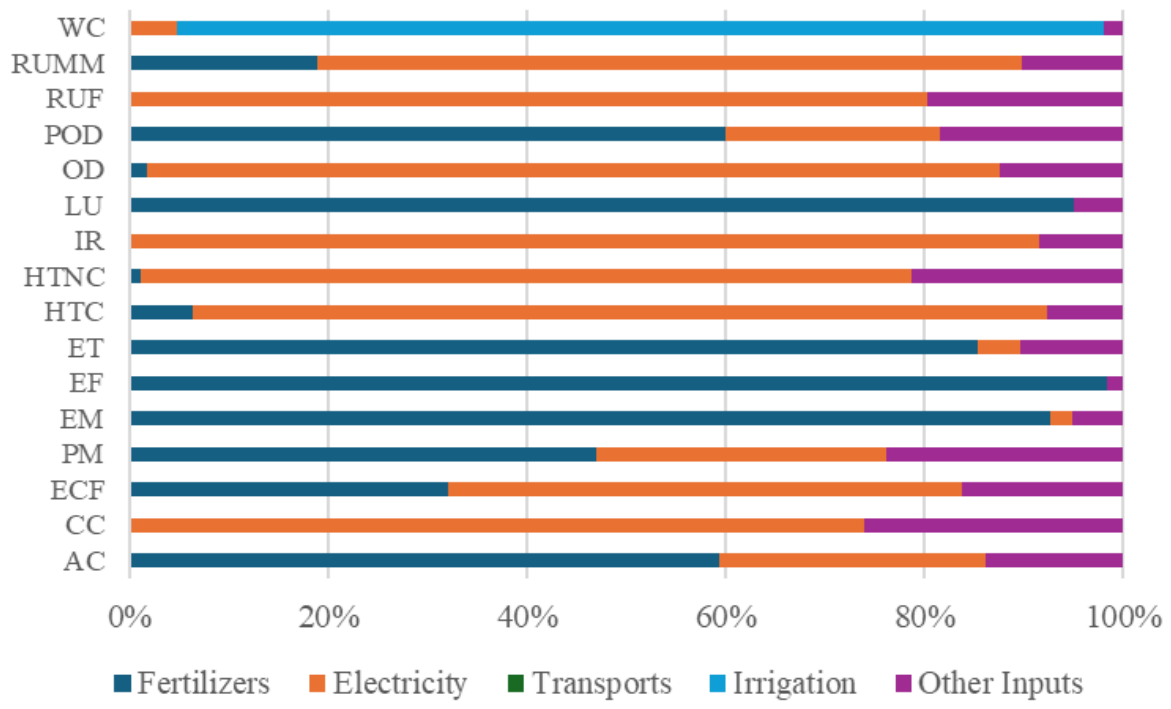
To identify the primary drivers of the environmental profile for both systems, a process contribution analysis is performed for all 16 assessed impact categories using an 1% cut-off rule; thus, only individual processes (inputs or emissions) contributing at least 1% to the total impact of a category are explicitly presented. All processes falling below this threshold are grouped under the “Other Inputs” category to ensure focus on the most significant environmental hotspots (Figure 4 and Figure 5). Due to the vast differences in the absolute magnitude of impact scores across the 16 categories, the results are presented using normalized 100% stacked bar charts. This visualization format is essential to ensure that the relative internal contributions of each process remain visible and comparable.
For the total CC impact in the conventional SHS, the production and supply of fertilizers is a major hotspot, contributing over 20% to the category impact (Figure 4). In contrast, the fertilizer contribution in the CHS drops so significantly that it falls below the 1% cut-off threshold. Consequently, fertilizer’s contribution is no longer a visible parameter in the CHS profile and is grouped under the “Other Inputs” category. This suggests that by recycling the nutrient solution, CHS effectively decouples GHG emissions from the fertilizer supply chain, allowing energy inputs to become the primary remaining factor. A similar trend is observed in the RUMM impact category, where fertilizers account for approximately 90% of the impact in SHS (Figure 4), but it falls under 20% in CHS (Figure 5). This change highlights the high mineral energy intensity required for the synthesis of mineral salts and demonstrates that by reducing the demand for these raw materials, CHS significantly reduces the system’s overall mineral footprint. For the IR category, which is usually associated with the energy mix used in manufacturing and mining processes, the contribution of fertilizers to SHS exceeds 15% (Figure 4). In CHS, this contribution is again reduced to a negligible level and is grouped under the category “Other Inputs” due to the reduced dependence on primary raw materials (Figure 5).
The process contribution analysis further reveals that electricity is a primary environmental hotspot for both systems, particularly across categories such as RUF, OD, IR, HTC, and CC (Figure 4 and Figure 5). In the conventional SHS, electricity already represents a significant share of these impacts. This significance is directly rooted in the fossil-fuel-intensive energy mix used to model the systems’ operational requirements. The upstream extraction and combustion of these fossil fuels serve as the primary driver for the observed impacts in these categories. However, in the CHS profile, electricity appears to become the sole dominant hotspot. It is critical to note that this shift is a result of relative dominance rather than an increase in absolute impact. In the SHS, the massive environmental burden of mineral fertilizer production often competes with or obscures the energy component. By effectively eliminating the fertilizer hotspot through nutrient recycling, the CHS leaves electricity as the largest remaining contributor. In absolute terms, the energy-related pressure per FU at CHS is actually lower than at SHS, as the system achieves higher overall productivity per unit of energy consumed (Table 2). Therefore, while electricity is identified as the priority area for future optimization, its significance in the CHS profile is evidence of the successful reduction in the system’s dependence on virgin fertilizers.
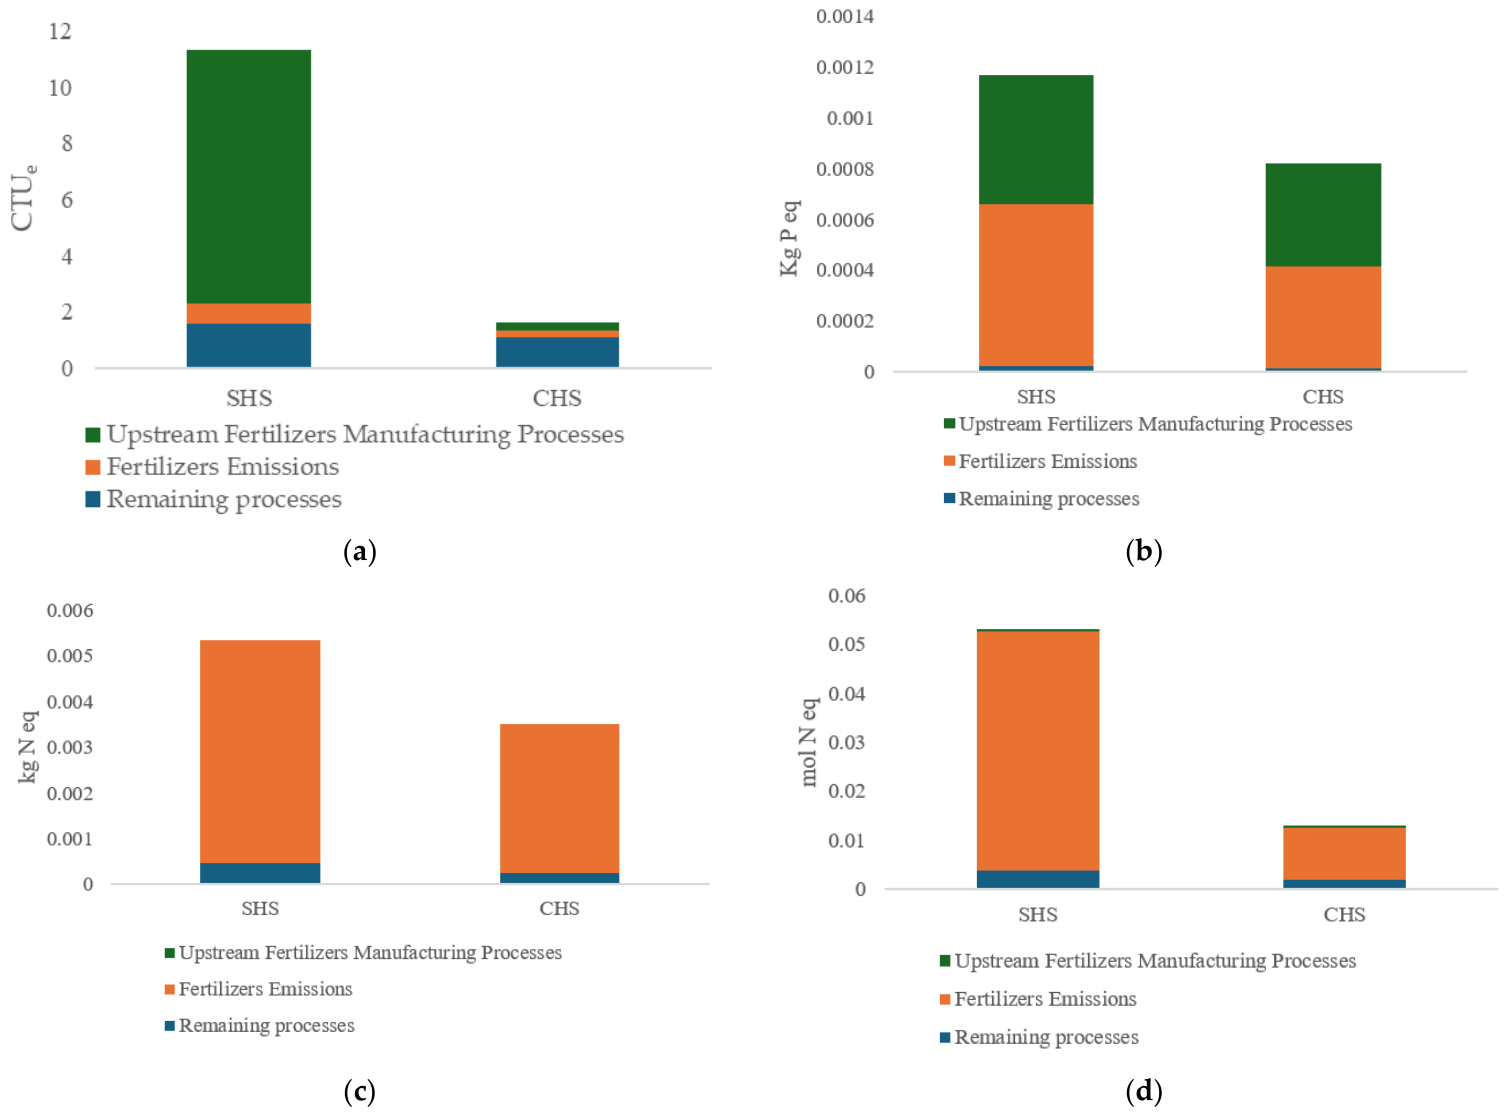
The environmental benefits of the CHS are most prominent in the categories governed by nutrient cycling. For these, the results are analysed by isolating the contributions of direct fertilizer emissions and upstream fertilizer production processes. In the ECF category, the SHS profile is dominated by upstream fertilizer manufacturing, which contribute 9.04 CTUe out of the total 11.30 CTUe impact score, a contribution around 80% of the total impact (Figure 6). In the CHS, this contribution drops to just 10%, an improvement that is a direct consequence of the cascade concept, which relies on the recycling of the nutrient solutions by the secondary melon crop rather than the constant introduction of primary inputs (Figure 6). The eutrophication categories further highlight how the system design benefits the different environmental indicators. Regarding EF, the reduction in the impact is the result of a dual improvement in both the production and emissions phases of the fertilizer inputs (Figure 6). In the EM and ET categories, the substantial improvement in the overall scores is driven primarily by the reduction in direct fertilizer emissions (Figure 6). For the SHS, the high volume of nutrient-rich drainage leads to significant nitrogen-related pressure on both marine and terrestrial compartments. However, in CHS, the reduction in the mass of nitrate and ammonium reaching the environment is the ultimate driver for the enhanced performance in these categories.

3.4. Sensitivity Analysis

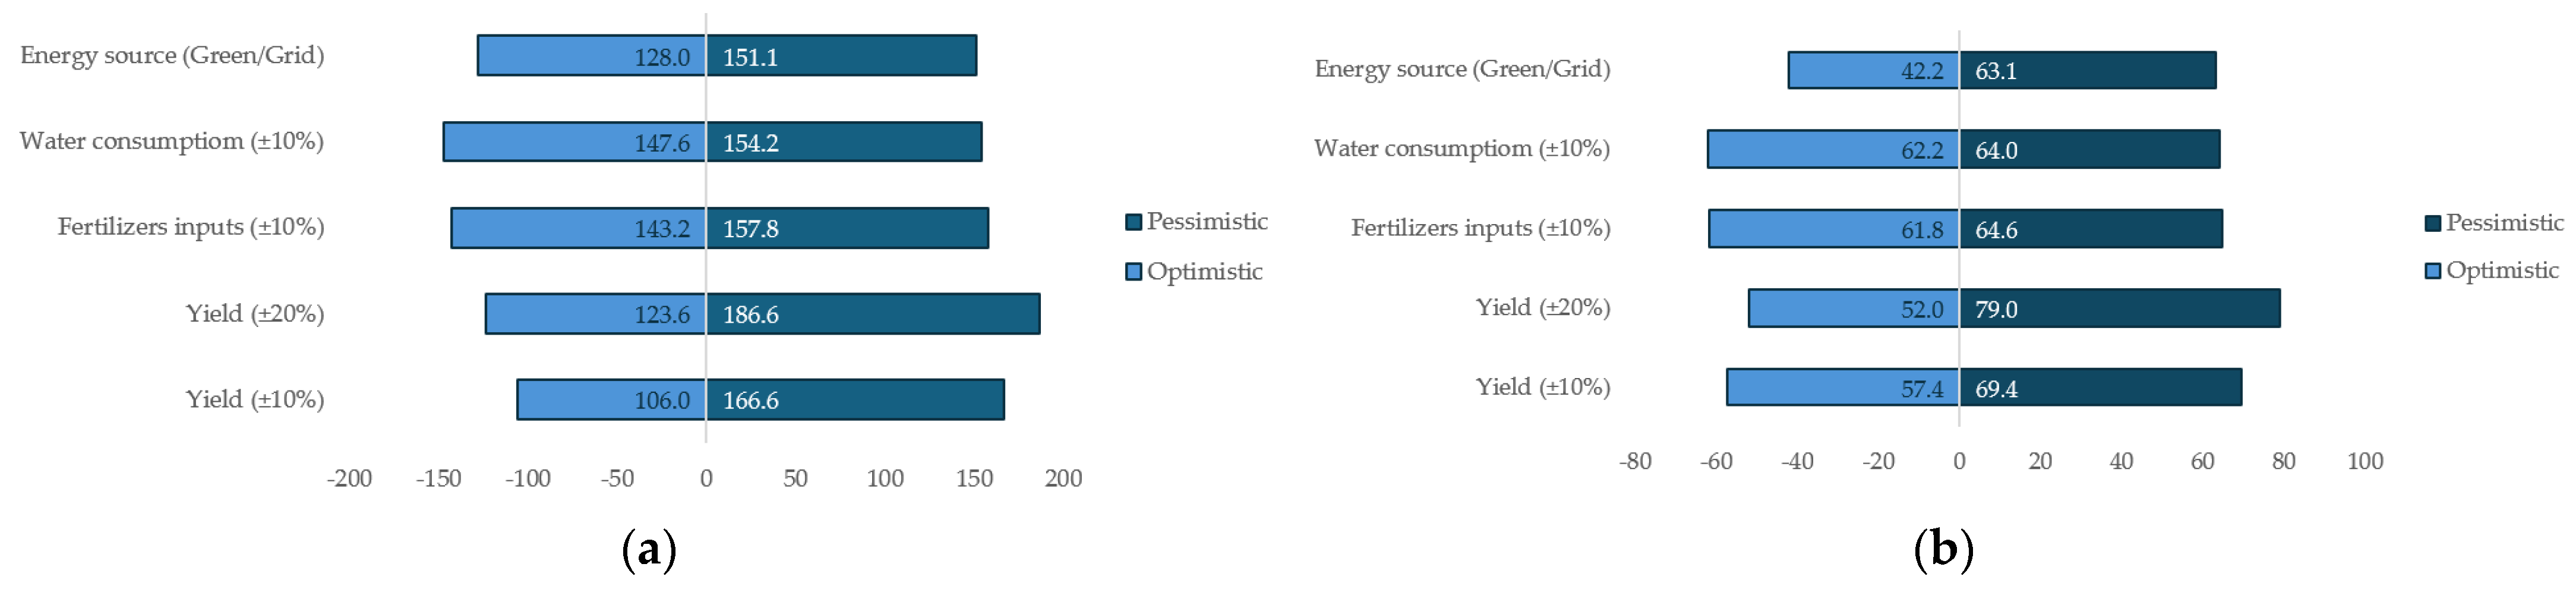
A sensitivity analysis was performed to evaluate the robustness of the study’s environmental findings. The primary objective was to determine whether the observed environmental superiority of the CHS remains stable under fluctuating operational conditions relative to the baseline weighting scores of 151.1 μPt for the SHS and 63.1 μPt for the CHS. The parameters were evaluated under “Optimistic” and “Pessimistic” scenarios to capture the range of potential environmental outcomes, as described in Table 5.
Yield was identified as the most critical parameter for assessment, as the FU is defined by the mass of produce; consequently, productivity fluctuations directly influence the environmental burden associated with every unit of output. To test the system’s resilience, yield was subjected to variations of ±10% and ±20%. Subsequently, fertilizer and water consumption were tested at a ±10% variation to evaluate how changes in nutrient recovery efficiency and irrigation intensity affect the overall impact. Finally, an alternative energy scenario was modelled to assess the transition from the national grid (pessimistic) to renewable energy sources, specifically solar energy (optimistic), as electricity use was identified as a critical environmental hotspot for both configurations during the process contribution phase.
The comparative results, summarized in the tornado plots (Figure 7), reveal a distinct difference in the stability of the Weighting Score impact results. The SHS exhibits high volatility, particularly under yield fluctuations. A 20% yield reduction increases its environmental pressure from a baseline of 151.1 μPt to 186.6 μPt. In contrast, the CHS maintains a remarkably buffered profile. Notably, even in the most pessimistic CHS scenario (−20% yield), the resulting impact score of 79.0 μPt remains 47% lower than the baseline performance of the conventional SHS. Furthermore, the narrow variation ranges for fertilizer and water inputs in the CHS scores indicate a decoupling of the environmental performance from resource input variability. While these factors shift the SHS score by an average of approximately 14.6 μPt (±9.7%), they only alter the CHS score by approximately 2.8 μPt (±4.4%). Finally, the “green energy” scenario identifies a major optimization pathway. This transition reduces the CHS footprint from 63.1 μPt to 42.2 μPt, a 33% reduction in total impact. Such a result can highlight the potential benefits arising from a synergy between circular nutrient management and energy transition.

4. Discussion

The results of this study underscore the capacity of the CHS to enhance resource efficiency. While the drainage solution from the CHS is eventually discharged after the secondary melon cultivation due to high salinity levels, the cascading design ensures the maximum possible exploitation of the nutrient solution, evidenced by an approximately 22% efficiency increase in both NUE and PUE over the SHS [17]. Such improvements in nutrient uptake significantly relieve the environmental burdens associated with mineral runoff. This strategy aligns with the observations of Incrocci et al. (2003), who studied a cascade cropping system where a tomato crop was the effluent-donor and a cherry tomato crop was the effluent-receiver, and noted that while drainage discharge is sometimes necessary for salinity management, the resulting environmental burden is substantially less harmful than the nutrient-rich runoff characteristic of semi-closed systems [38]. The most prominent evidence of this efficiency in the present study is the 81.9% reduction in the RUMM category (Table 4). This drop is primarily attributed to the sequential utilization of the same nutrient solution for two consecutive crops, which practically “halves” the requirement for primary mineral inputs compared to the SHS. Similar benefits of resource maximization have been identified in other recent studies. For instance, Fathelrahman et al. (2025) explored closed hydroponic systems, which are also based on the concept of maximizing resource utilization, and found that transitioning toward more circular hydroponic models resulted in consistent improvements across all assessed environmental categories, including 11% reduction in abiotic depletion and 9% improvement in global warming potential [8]. Furthermore, the CHS addresses the key challenge of hydroponic cultivations by significantly improving the efficiency of water and nutrients use. Specifically, the improvement of 65.7% in the WU category (Table 4) and the significant reduction in the scores for categories driven by fertigation processes align conceptually with the findings of Savvas (2002), who indicated that the reuse of drainage solutions could result in fertilizer savings of 40–50% [39]. The results of the present study demonstrate the broader environmental implications of such a reduction across the entire life cycle. The decrease in primary material consumption also leads to a reduction in environmental impact scores observed in this study, as the system avoids not only the physical loss of nutrients but also the high energy and resource burdens associated with the upstream manufacturing of those fertilizers. This is a critical contribution as synthetic fertilizer use accounts for approximately 15% of global agricultural GHG emissions [9], and CHS addresses this burden by reducing both the application-related emissions and the demand for energy-intensive mineral manufacturing.
The cascading architecture of the CHS demonstrates notable environmental benefits in mitigating impacts across land and water compartments. The substantial improvements observed in AC (72.2% reduction), ET (76.5% reduction), EM (34.2% reduction), and EF (29.9% reduction) (Table 4) highlight the system’s ability to address the fertigation problem related to N inputs that is discussed in the literature. As noted by Li et al. (2018), the intensification of fertilizer use has led to widespread soil deterioration and the acidification of freshwater ecosystems [40]. Their research explains that extensive nitrogen fertilization results in significant nitrogen loss through leaching and NH3 emissions, which drive eutrophication via atmospheric deposition into terrestrial and aquatic ecosystems. Furthermore, NH3 and NOx emissions stemming from fertilizer use serve as the main catalysts for acidification phenomena. The significant reductions in eutrophication impacts observed in this study align with the findings of Gava et al. (2023), who compared four drainage management technologies in a greenhouse tomato production—open-loop, wastewater treatment, cascade cropping, and closed-loop systems—and concluded that cascade cropping provides the highest environmental benefit [20]. Specifically, their research demonstrated that cascade systems can achieve substantial improvements by reducing freshwater eutrophication by up to 48% and marine eutrophication by 69% compared to traditional open-loop configurations.
In conventional systems, excess nitrogen is the fundamental driver of soil and water degradation [41]. By minimizing these outputs, the CHS directly counters the environmental pressures of eutrophication and acidification. Furthermore, the environmental burden of nitrogenous fertilizers extends beyond the water compartment to the atmosphere, and the prolonged use of these inputs affects air quality through the release of various nitrogen oxides (NOx) [42,43]. By maximizing nitrogen use efficiency, the CHS also reduces precursors for nitrification and denitrification processes, thereby avoiding emissions of N2O, a GHG with a global warming potential much stronger than that of CO2 [44,45]. Consequently, the present study’s findings in the CC category (41.8% reduction) and POF (67.2% reduction) (Table 4) are linked to this lower nitrogen intensity. Ultimately, by converting a potential pollutant into a nutrient source, the CHS mitigates the broader threats to ecosystem and human health, a conclusion discussed by Khan et al. (2018) as consequences of long-term nitrogen pollution [46].
The environmental advantages of the CHS are most prominent in its capacity to mitigate climate change impacts. The significance of this finding is underscored by a recent systematic review of LCA studies, which identified Global Warming as the most frequently evaluated impact category in the soilless sector. In these systems, synthetic fertilizers represent a critical input. Licastro et al. (2024) [9] highlight these substances as a primary environmental hotspot, noting that approximately 15% of total agricultural GHG emissions (roughly 9.3 billion tonnes of CO2 eq) are directly attributable to synthetic fertilizer use. This global burden is further detailed by Torrellas et al. (2012) [47] in their LCA of greenhouse tomato production. Their findings revealed that fertilizers accounted for 32% of the total contribution to global warming, due to the emissions generated during both their manufacture and their application to the crop. Notably, more than 60% of the fertilizer-related climate impact was specifically tied to the manufacturing phase, with the remainder resulting from on-site application [47]. These findings are consistent with those of Hasler et al. (2015) [48], who demonstrated that the production of mineral fertilizers causes large-scale GHG emissions, mainly as CO2, due to the intensive use of fossil fuels in their production. Furthermore, they emphasize that N2O emissions during both production and post-application represent 50% or more of the total emissions in the climate change category for nitrogenous fertilizers [48].
A direct comparative discussion of this study’s findings with other cascade hydroponic LCA studies was not feasible, as the application of LCA specifically to cascading nutrient configurations remains significantly under-represented in the literature. Consequently, the lack of LCA data for this specific technology makes a direct cross-study comparison difficult. By adhering to the PEFCR framework and utilizing primary on-site measurements, this research seeks to narrow this gap and provide a transparent, methodologically robust baseline for future comparative studies within the specialized field of cascade hydroponics.
The robustness of this sustainability assessment is fundamentally supported by its alignment with the PEFCR. The primary objective of the PEFCR framework is to establish a consistent set of rules for calculating environmental information, which ensures that products that fall within the same category can be evaluated through a standardized set of rules [49]. By adhering to these rules, this study facilitates meaningful comparisons and comparative assertions with literature findings that are also derived from PEFCR utilization. Furthermore, the current research utilizes direct measurements and on-site monitoring of nutrient concentrations to ensure high data quality. This granular approach to the scope and benchmarks aligns with the PEFCR requirement for transparency and justification in key methodological decisions. Moreover, the on-site monitoring of the effluent volumes and composition allows for a precise mass balance estimation of water and nutrients. Consequently, the reliance on primary data provides more accurate and reliable results, setting a robust foundation for transitioning toward more sustainable and input-optimized horticultural practices. Overall, the study’s novelty relies on methodological and technological convergence as it is the first to evaluate the environmental performance of a cascade hydroponic system over a conventional one while adhering to the requirements of PEFCR and utilizing primary, on-site measurements.
While the environmental profiles quantified in this work provide a reliable baseline for the evaluated site and crop-cycle conditions, expanding the temporal, operational, and commercial boundaries of the Life Cycle Inventory (LCI) remains a critical objective for future research. Transitioning from a pilot-scale validation to a widely applicable industrial model requires testing the system within large-scale commercial greenhouses to account for real-world operational complexities and broader macro-climatic stressors. For instance, shifting cultivation across different seasons introduces fluctuations in solar radiation and ambient temperature, which directly alter crop evapotranspiration, transpirational dynamics, and nutrient uptake rates [50], thereby modifying greenhouse operational energy and water demands. These factors can also alter the overall environmental profile.
The performance of cascade hydroponic systems may also differ in long-cycle crops. Longer cultivation periods could increase the opportunity for nutrient recovery and improve cumulative resource-use efficiency, but they may also intensify salinity build-up, nutrient imbalance, and disease-management challenges. These factors could affect both crop productivity and the frequency with which drainage solution must be discharged or supplemented. Consequently, the environmental performance of CHS under long-cycle production should be evaluated using continuous monitoring of nutrient composition, crop yield, water consumption, and discharge quality.
Relying on single-cycle data from a single crop pairing introduces inherent deterministic limitations, as it cannot capture temporal or multi-season variability. To mitigate these data limitations and verify the stability of the system against short-term operational fluctuations, a comprehensive sensitivity analysis was integrated into this study. While this analysis confirms the robustness of the current environmental baseline, acquiring multi-year continuous data remains a necessary step to fully validate the system’s long-term environmental behaviour under commercial agricultural conditions.
Beyond temporal constraints, expanding the operational boundaries of the LCI to evaluate alternative, agronomically compatible crop configurations is essential for widespread commercial adoption. The literature findings indicate that the cascading logic can be strategically extended across the horticultural industry by pairing a primary “donor” crop that generates usable drainage with a secondary “receiver” crop capable of tolerating the elevated electrical conductivity (EC) and compatible pH levels of that effluent [17]. Viable commercial configurations include combining tomato with various leafy greens, such as spinach, lettuce, or parsley [50,51], or pairing cucumber with aromatic herbs like basil, rosemary, or mint [52,53]. Within this framework, LCA will serve as a pivotal predictive tool to systematically model these diverse configurations over consecutive cycles in large-scale setups to ensure quantifiable environmental benefits and resource-use efficiency.
While this study provides a robust environmental assessment based on a PEFCR-compliant LCA, general sustainability considerations extend beyond environmental performance. The adoption of cascade hydroponic systems is also influenced by socio-technical factors, including farmer acceptance, technical complexity, labour requirements, and access to technology. Although such systems may enhance resource security and production stability, particularly in water-scarce regions like the Mediterranean, their implementation may pose challenges related to monitoring needs and initial investments. Therefore, the environmental benefits identified here should be interpreted within a broader sustainability context. Future research should integrate complementary approaches, such as Social Life Cycle Assessment (S-LCA) and Life Cycle Costing (LCC), to provide a more holistic evaluation.

5. Conclusions

The present study represents a significant addition in the field of environmental evaluation of soilless cultivation by bringing cascade hydroponic systems to the forefront of sustainable horticulture. The research demonstrates that cascading architectures have the potential to offer a superior alternative to conventional open-loop systems, aligning closely with circular economy principles to decouple intensive crop production from environmental degradation. By reusing the nutrient-rich drainage from a salt-sensitive primary crop for a more resilient secondary one, CHS proves to be a validated strategy for resource management that maximizes the utility of water and mineral inputs.
The empirical results demonstrate the enhanced environmental performance of the CHS relative to the SHS, which exhibited improved scores across all sixteen impact categories evaluated. Specifically, the system achieved substantial reductions in CC (41.8%), WU (65.7%), EF (29.9%), and ECF (75.6%). These improvements are largely attributed to the mitigation of fertilizer-related hotspots. By maximizing resource efficiency, the cascading model introduces an approach to mitigate the inefficiencies in effluent management, often found in modern greenhouse production.
The methodological robustness of this work, achieved through the alignment with the PEFCR framework, establishes a transparent foundation for comparative assertions within the horticultural sector. Unlike many studies that rely on theoretical approaches, this research utilized primary operational data and direct on-site monitoring of effluent concentrations to ensure the highest data quality and justify the level of detail of the scope.
From a technical perspective, greenhouse designers and operators should consider integrating infrastructure that facilitates nutrient solution recovery and redistribution between crops with different salinity tolerances and nutrient requirements. The incorporation of automated monitoring systems for EC, pH, and nutrient composition, together with modular irrigation and storage configurations, may enhance the operational stability and scalability of cascade hydroponic systems under commercial conditions. Furthermore, combining cascading nutrient management with renewable energy technologies could further improve overall environmental performance, particularly given the importance of electricity-related impacts identified in this study.
From a policy perspective, the results support the development of agricultural policies promoting circular nutrient management and resource-efficient greenhouse production. Incentive schemes encouraging nutrient recycling technologies, water-saving irrigation systems, and low-emission greenhouse practices could accelerate the adoption of circular hydroponic systems within the horticultural sector. In addition, integrating circular hydroponic strategies into sustainability certification frameworks and environmental compliance policies may contribute to achieving broader objectives associated with the European Green Deal and Farm to Fork Strategy.
Moving forward, ongoing research into scaling up this technology, combined with comprehensive LCC and S-LCA analyses to evaluate the long-term economic feasibility and social impact of the cascade infrastructure, will be essential to further promoting the expansion of cascade systems. Furthermore, experimental testing with alternative crop combinations will remain vital. Ultimately, this study provides an evidence-based framework for the potential sustainable intensification of agriculture, supporting the goals of a circular economy.

Supplementary Materials

The following supporting information can be downloaded at: https://www.mdpi.com/article/10.3390/su18115477/s1, Table S1: Justification for exclusion of specific life cycle stages and components; Table S2: Emissions and Calculation Methodologies.

Author Contributions

Conceptualization, S.K. and A.V.; methodology, S.K. and A.V.; software, S.K. and A.V.; validation, S.K., A.V. and V.A.; formal analysis, S.K. and A.V.; investigation, S.K., A.V. and V.A.; resources, S.K. and A.V.; data curation, S.K. and A.V.; writing—original draft preparation, S.K. and A.V.; writing—review and editing, S.K., A.V. and V.A.; visualization, S.K., A.V. and V.A.; supervision, A.V., V.A., T.B. and N.K.; project administration, A.V., V.A., T.B. and N.K.; funding acquisition, A.V., V.A., T.B. and N.K. All authors have read and agreed to the published version of the manuscript.

Funding

This work was partially (foreground data) supported by the European Union Horizon Europe Innovation program [Grant Agreement No. 101081858], titled “ECONUTRI: Innovative concepts and technologies for Ecologically sustainable Nutrient management in agriculture aiming to prevent, mitigate and eliminate pollution in soils, water and air.

Institutional Review Board Statement

Not applicable.

Informed Consent Statement

Not applicable.

Data Availability Statement

The data presented in this study are not publicly available due to confidentiality agreements within the framework of an EU project involving research centers and private partners. Data may be available on reasonable request, subject to approval by the project coordinator.

Acknowledgments

The authors would like to thank Ioannis Naounoulis and Sofia Faliagka for their valuable support and contribution to the data collection process.

Conflicts of Interest

The authors declare no conflicts of interest.

Abbreviations

The following abbreviations are used in this manuscript:
ACAcidification
CCClimate Change
CHSCascade Hydroponic System
ECElectrical Conductivity
ECFEcotoxicity, Freshwater
EFEutrophication, Freshwater
EMEutrophication, Marine
ETEutrophication, Terrestrial
FUFunctional Unit
GHGGreenhouse Gases
HTCHuman Toxicity, Cancer
HTNCHuman Toxicity, Non-Cancer
IPCCIntergovernmental Panel on Climate Change
IRIonizing Radiation
LCALife Cycle Assessment
LCILife Cycle Inventory
LCIALife Cycle Impact Assessment
LCCLife Cycle Costing
LULand Use
NUENitrogen Use Efficiency
ODOzone Depletion
PEFProduct Environmental Footprint
PEFCRProduct Environmental Footprint Category Rules
PMParticulate Matter
POFPhotochemical Ozone Formation
PUEPhosphorus Use Efficiency
RUFResource Use, Fossils
RUMMResource Use, Minerals and Metals
SHSSeparated Hydroponic System
S-LCASocial Life Cycle Assessment
WUEWater Use Efficiency

References

  1. European Commission. A Farm to Fork Strategy for a Fair, Healthy and Environmentally-Friendly Food System. COM(2020) 381 Final. 2020. Available online: https://eur-lex.europa.eu/EN/legal-content/summary/farm-to-fork-strategy-for-a-fair-healthy-and-environmentally-friendly-food-system.html (accessed on 6 April 2026).
  2. Gruère, G.; Ashley, C.; Cadilhon, J. Reforming Water Policies in Agriculture: Lessons from Past Reforms; OECD Food, Agriculture and Fisheries Papers; OECD Publishing: Paris, France, 2018; Volume 113. [Google Scholar]
  3. Anagnostopoulos, C.D.; Platis, D.P.; Siomos, A.S.; Menexes, G.C.; Kalburtji, K.L.; Mamolos, A.P. Agri-Environmental Indicators Regarding Broccoli Cultivation: A Case Study in Pella, Greece. Environ. Dev. 2025, 56, 101243. [Google Scholar] [CrossRef]
  4. Laraus, J. The Problems of Sustainable Water Use in the Mediterranean and Research Requirements for Agriculture. Ann. Appl. Biol. 2004, 144, 259–272. [Google Scholar] [CrossRef]
  5. Savvas, D.; Gruda, N. Application of Soilless Culture Technologies in the Modern Greenhouse Industry—A Review. Eur. J. Hortic. Sci. 2018, 83, 280–293. [Google Scholar] [CrossRef]
  6. Giannothanasis, E.; Ntanasi, T.; Karavidas, I.; Spyrou, G.P.; Neocleous, D.; Ntatsi, G.; Savvas, D. Exploring Nutrient Reduction Strategies without Yield Losses in Hydroponic Lettuce Production. Sci. Hortic. 2025, 352, 114458. [Google Scholar] [CrossRef]
  7. Pomoni, D.I.; Koukou, M.K.; Vrachopoulos, M.G.; Vasiliadis, L. A Review of Hydroponics and Conventional Agriculture Based on Energy and Water Consumption, Environmental Impact, and Land Use. Energies 2023, 16, 1690. [Google Scholar] [CrossRef]
  8. Fathelrahman, E.; Osman, R.; Haris, S.; Maraqa, M.; Gebiso, T.; Degefa, B.; Neumann, E.; Hoag, D. Life Cycle Assessment of Open and Closed Hydroponic Systems for Vegetable (Tomato and Cucumber) Production in Arid Lands. J. Clean. Prod. 2025, 534, 146920. [Google Scholar] [CrossRef]
  9. Licastro, A.; Salomone, R.; Mondello, G.; Calabrò, G. Assessing the Environmental Impacts of Soilless Systems: A Comprehensive Literature Review of Life Cycle Assessment Studies. Int. J. Life Cycle Assess. 2024, 29, 1053–1074. [Google Scholar] [CrossRef]
  10. Parajuli, R.; Thoma, G.; Matlock, M.D. Environmental Sustainability of Fruit and Vegetable Production Supply Chains in the Face of Climate Change: A Review. Sci. Total Environ. 2019, 650, 2863–2879. [Google Scholar] [CrossRef]
  11. Manos, D.-P.; Xydis, G. Hydroponics: Are We Moving towards That Direction Only Because of the Environment? A Discussion on Forecasting and a Systems Review. Environ. Sci. Pollut. Res. 2019, 26, 12662–12672. [Google Scholar] [CrossRef]
  12. Katsoulas, N.; Savvas, D.; Kitta, E.; Bartzanas, T.; Kittas, C. Extension and Evaluation of a Model for Automatic Drainage Solution Management in Tomato Crops Grown in Semi-Closed Hydroponic Systems. Comput. Electron. Agric. 2015, 113, 61–71. [Google Scholar] [CrossRef]
  13. Abd-Elmoniem, E.M.; Abdrabbo, M.A.; Farag, A.A.; Medany, M.A. Hydroponics for Food Production: Comparison of Open and Closed Systems on Yield and Consumption of Water and Nutrient. In Proceedings of the 2nd International Conference on Water Resources & Arid Environment, Riyadh, Saudi Arabia, 26–29 November 2006. [Google Scholar]
  14. Qasim, W.; Xia, L.; Lin, S.; Wan, L.; Zhao, Y.; Butterbach-Bahl, K. Global Greenhouse Vegetable Production Systems Are Hotspots of Soil N2O Emissions and Nitrogen Leaching: A Meta-Analysis. Environ. Pollut. 2021, 272, 116372. [Google Scholar] [CrossRef] [PubMed]
  15. Zhang, M.; Wang, L.; Wang, Q.; Chen, D.; Liang, X. The Environmental and Socioeconomic Benefits of Optimized Fertilization for Greenhouse Vegetables. Sci. Total Environ. 2024, 908, 168252. [Google Scholar] [CrossRef] [PubMed]
  16. Incrocci, L.; Thompson, R.B.; Fernandez-Fernandez, M.D.; De Pascale, S.; Pardossi, A.; Stanghellini, C.; Rouphael, Y.; Gallardo, M. Irrigation Management of European Greenhouse Vegetable Crops. Agric. Water Manag. 2020, 242, 106393. [Google Scholar] [CrossRef]
  17. Naounoulis, I.; Faliagka, S.; Levizou, E.; Katsoulas, N. Cascade Hydroponics Enhanced Water and Nutrients Use Efficiency in a Greenhouse Cucumber-Melon Crop Combination. Sci. Hortic. 2024, 338, 113822. [Google Scholar] [CrossRef]
  18. Elvanidi, A.; Benitez Reascos, C.; Gourzoulidou, E.; Kunze, A.; Max, J.; Katsoulas, N. Implementation of the Circular Economy Concept in Greenhouse Hydroponics for Ultimate Use of Water and Nutrients. Horticulturae 2020, 6, 83. [Google Scholar] [CrossRef]
  19. García-Caparrós, P.; Llanderal, A.; Maksimovic, I.; Lao, M. Cascade Cropping System with Horticultural and Ornamental Plants under Greenhouse Conditions. Water 2018, 10, 125. [Google Scholar] [CrossRef]
  20. Gava, O.; Antón, A.; Carmassi, G.; Pardossi, A.; Incrocci, L.; Bartolini, F. Reusing Drainage Water and Substrate to Improve the Environmental and Economic Performance of Mediterranean Greenhouse Cropping. J. Clean. Prod. 2023, 413, 137510. [Google Scholar] [CrossRef]
  21. Notarnicola, B.; Tassielli, G.; Renzulli, P.A.; Lo Giudice, A. Life Cycle Assessment in the Agri-Food Sector: An Overview of Its Key Aspects, International Initiatives, Certification, Labelling Schemesand Methodological Issues. In Life Cycle Assessment in the Agri-Food Sector; Notarnicola, B., Salomone, R., Petti, L., Renzulli, P.A., Roma, R., Cerutti, A.K., Eds.; Springer International Publishing: Cham, Switzerland, 2015; pp. 1–56. ISBN 978-3-319-11939-7. [Google Scholar]
  22. Fan, J.; Liu, C.; Xie, J.; Han, L.; Zhang, C.; Guo, D.; Niu, J.; Jin, H.; McConkey, B.G. Life Cycle Assessment on Agricultural Production: A Mini Review on Methodology, Application, and Challenges. Int. J. Environ. Res. Public Health 2022, 19, 9817. [Google Scholar] [CrossRef]
  23. Sieverding, H.; Kebreab, E.; Johnson, J.M.F.; Xu, H.; Wang, M.; Grosso, S.J.D.; Bruggeman, S.; Stewart, C.E.; Westhoff, S.; Ristau, J.; et al. A Life Cycle Analysis (LCA) Primer for the Agricultural Community. Agron. J. 2020, 112, 3788–3807. [Google Scholar] [CrossRef]
  24. Caffrey, K.R.; Veal, M.W. Conducting an Agricultural Life Cycle Assessment: Challenges and Perspectives. Sci. World J. 2013, 2013, 472431. [Google Scholar] [CrossRef]
  25. Hauschild, M.; Jeswiet, J.; Alting, L. From Life Cycle Assessment to Sustainable Production: Status and Perspectives. CIRP Ann. 2005, 54, 1–21. [Google Scholar] [CrossRef]
  26. Curran, M.A. Life Cycle Assessment: A Review of the Methodology and Its Application to Sustainability. Curr. Opin. Chem. Eng. 2013, 2, 273–277. [Google Scholar] [CrossRef]
  27. Shaik, A.; Karthikeyan, R.; Kousik, C.S. Growth Stage-Specific Responses of Cucumber to Salinity Stress: Germination, Seedling Establishment, and Vegetative Development. Front. Plant Sci. 2025, 16, 1617809. [Google Scholar] [CrossRef] [PubMed]
  28. Huang, C.H.; Zong, L.; Buonanno, M.; Xue, X.; Wang, T.; Tedeschi, A. Impact of Saline Water Irrigation on Yield and Quality of Melon (Cucumis melo Cv. Huanghemi) in Northwest China. Eur. J. Agron. 2012, 43, 68–76. [Google Scholar] [CrossRef]
  29. Hauschild, M.Z.; Rosenbaum, R.; Olsen, S.I. (Eds.) Life Cycle Assessment: Theory and Practice; Springer: Cham, Switzerland, 2018; ISBN 978-3-319-56474-6. [Google Scholar]
  30. Weststrate, J.; Broekema, R.; Vieira, M.; Williams, E.; Schumacher, L.; Hopman, M.; Lucherini, D.; Bonekamp, Q.; Verweij-Novikova, I. Product Environmental Footprint of the Representative Product for Fruits; Wageningen Social & Economic Research: Wageningen, The Netherlands, 2025. [Google Scholar]
  31. ISO 14044; International Standard. Environmental Management—Life Cycle Assessment—Requirements and Guidelines. International Organization for Standardization: Geneva, Switzerland, 2006.
  32. ISO 14040; International Standard. Environmental Management—Life Cycle Assessment—Principles and Framework. International Organization for Standardization: Geneva, Switzerland, 2006.
  33. Directorate-General for Environment. Recommendation on the Use of Environmental Footprint Methods. Annexes 1 to 2. 2021. Available online: https://environment.ec.europa.eu/publications/recommendation-use-environmental-footprint-methods_en (accessed on 4 April 2026).
  34. Wernet, G.; Bauer, C.; Steubing, B.; Reinhard, J.; Moreno-Ruiz, E.; Weidema, B. The Ecoinvent Database Version 3 (Part I): Overview and Methodology. Int. J. Life Cycle Assess. 2016, 21, 1218–1230. [Google Scholar] [CrossRef]
  35. Van Paassen, M.; Braconi, N.; Kuling, L.; Durlinger, B.; Gual, P. Agri-Footprint 5.0; Agri-Footprint: Gouda, The Netherlands, 2019. [Google Scholar]
  36. IPCC. N2O Emissions from Managed Soils and CO2 Emissions from Lime and Urea Application. In IPCC Guidelines for National Greenhouse Gas Inventories; Eggelston, S., Buendia, L., Miwa, K., Ngara, T., Tanabe, K., Eds.; IPCC: Geneva, Switzerland, 2006; Volume 4. [Google Scholar]
  37. IPCC. 2019 Refinement to the 2006 IPCC Guidelines for National Greenhouse Gas Inventories; Buendia, E.C., Tanabe, K., Kranjc, A., Baasansuren, J., Fukuda, M., Ngarize, S., Osako, A., Pyrozhenko, Y., Shermanau, P., Federici, S., Eds.; IPCC: Geneva, Switzerland, 2019; Volume 4. [Google Scholar]
  38. Incrocci, L.; Pardossi, A.; Malorgio, F.; Maggini, R.; Campiotti, C.A. Cascade cropping system for greenhouse soilless culture. Acta Hortic. 2003, 609, 297–300. [Google Scholar] [CrossRef]
  39. Savvas, D. Nutrient Solution Recycling. In Hydroponic Production of Vegetables and Ornamentals; Embryo Publications: Athens, Greece, 2002; pp. 299–343. [Google Scholar]
  40. Li, L.; Wu, W.; Giller, P.; O’Halloran, J.; Liang, L.; Peng, P.; Zhao, G. Life Cycle Assessment of a Highly Diverse Vegetable Multi-Cropping System in Fengqiu County, China. Sustainability 2018, 10, 983. [Google Scholar] [CrossRef]
  41. Wallace, A. Soil Acidification from Use of Too Much Fertilizer. Commun. Soil Sci. Plant Anal. 1994, 25, 87–92. [Google Scholar] [CrossRef]
  42. Ghaly, A.; Ramakrishnan, V. Nitrogen Sources and Cycling in the Ecosystem and Its Role in Air, Water and Soil Pollution: A Critical Review. J. Pollut. Eff. Control 2015, 3, 2. [Google Scholar] [CrossRef]
  43. Tyagi, J.; Ahmad, S.; Malik, M. Nitrogenous Fertilizers: Impact on Environment Sustainability, Mitigation Strategies, and Challenges. Int. J. Environ. Sci. Technol. 2022, 19, 11649–11672. [Google Scholar] [CrossRef]
  44. Reay, D.S.; Davidson, E.A.; Smith, K.A.; Smith, P.; Melillo, J.M.; Dentener, F.; Crutzen, P.J. Global Agriculture and Nitrous Oxide Emissions. Nat. Clim. Change 2012, 2, 410–416. [Google Scholar] [CrossRef]
  45. Danny Harvey, L.D. A Guide to Global Warming Potentials (GWPs). Energy Policy 1993, 21, 24–34. [Google Scholar] [CrossRef]
  46. Khan, M.N.; Mobin, M.; Abbas, Z.K.; Alamri, S.A. Fertilizers and Their Contaminants in Soils, Surface and Groundwater. In Encyclopedia of the Anthropocene; Springer: Berlin/Heidelberg, Germany, 2018; pp. 225–240. [Google Scholar]
  47. Torrellas, M.; Antón, A.; López, J.C.; Baeza, E.J.; Parra, J.P.; Muñoz, P.; Montero, J.I. LCA of a Tomato Crop in a Multi-Tunnel Greenhouse in Almeria. Int. J. Life Cycle Assess. 2012, 17, 863–875. [Google Scholar] [CrossRef]
  48. Hasler, K.; Bröring, S.; Omta, S.W.F.; Olfs, H.-W. Life Cycle Assessment (LCA) of Different Fertilizer Product Types. Eur. J. Agron. 2015, 69, 41–51. [Google Scholar] [CrossRef]
  49. European Commission. PCR Guidance Document Guidance for the Development of Product Environmental Footprint Category Rules (PCRs), Version 6.3; European Commission: Brussels, Belgium, 2017. [Google Scholar]
  50. Ramírez, T.; Elvanidi, A.; Katsoulas, N.; Körner, O. Evapotranspiration Prediction for Suitable Combinations of Cascade Hydroponic Systems. Acta Hortic. 2025, 1426, 259–266. [Google Scholar] [CrossRef]
  51. Karatsivou, E.; Elvanidi, A.; Faliagka, S.; Naounoulis, I.; Katsoulas, N. Performance Evaluation of a Cascade Cropping System. Horticulturae 2023, 9, 802. [Google Scholar] [CrossRef]
  52. Avdouli, D.; Max, J.F.J.; Katsoulas, N.; Levizou, E. Basil as Secondary Crop in Cascade Hydroponics: Exploring Salinity Tolerance Limits in Terms of Growth, Amino Acid Profile, and Nutrient Composition. Horticulturae 2021, 7, 203. [Google Scholar] [CrossRef]
  53. Katsoulas, N.; Demmelbauer-Benitez, C.M.; Elvanidi, A.; Gourzoulidou, E.; Max, J.F.J. Reuse of Cucumber Drainage Nutrient Solution in Secondary Crops in Greenhouses: Initial Results. Acta Hortic. 2020, 1296, 767–774. [Google Scholar] [CrossRef]
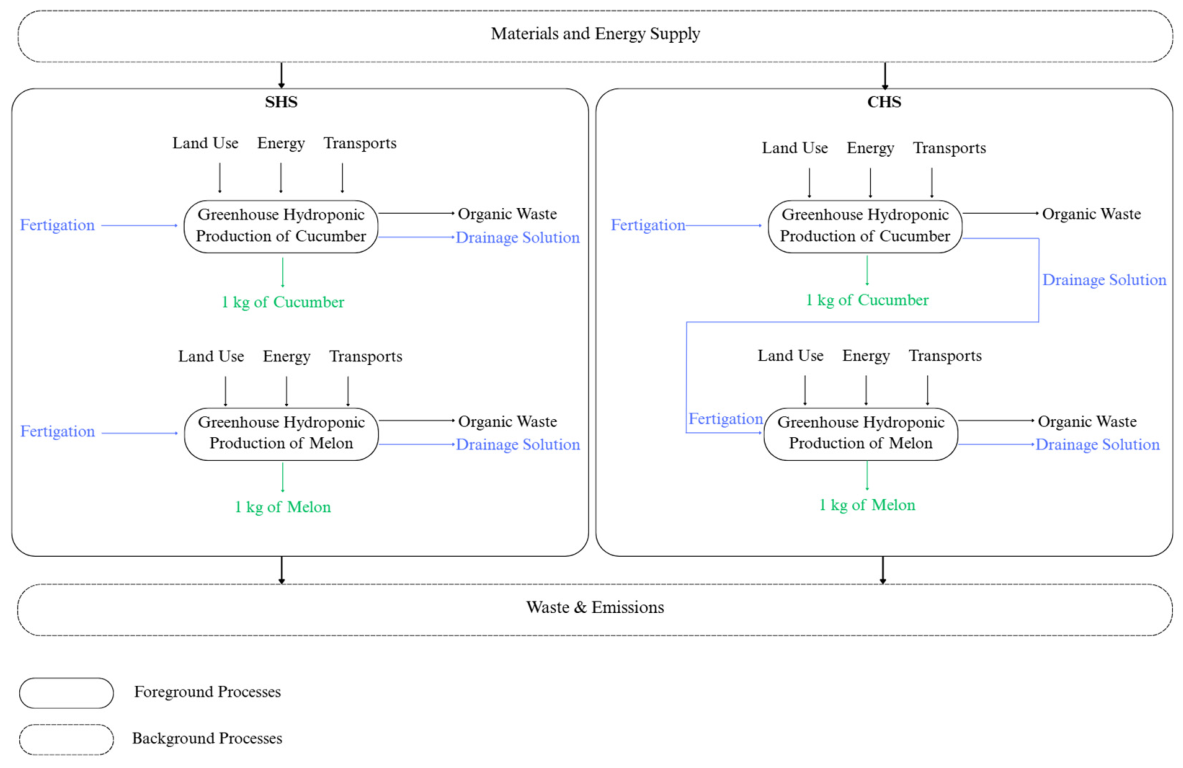
Figure 1. Cradle-to-gate system boundaries.
Sustainability 18 05477 g001
Figure 2. Normalization results of SHS and CHS (y-axis unit “Pt” denotes dimensionless environmental impact points).
Sustainability 18 05477 g002
Figure 3. Weighting results of the SHS and CHS (y-axis unit μPt denotes dimensionless micro-points).
Sustainability 18 05477 g003
Figure 4. SHS: process contribution analysis.
Sustainability 18 05477 g004
Figure 5. CHS: process contribution analysis.
Sustainability 18 05477 g005
Figure 6. Process contribution analysis of SHS and CHS: (a) ECF impact category; (b) EF impact category; (c) EM impact category; (d) ET impact category.
Sustainability 18 05477 g006
Figure 7. Sensitivity analysis of the total environmental impact (Weighting Score) for the two hydroponic configurations: (a) SHS and (b) CHS. Baseline values are 151.1 μPt and 63.1 μPt, respectively.
Sustainability 18 05477 g007
Table 1. Summary of emission modelling approach.
Emission FlowEmission
Compartment
PEFCR
Preference Level
Description of Calculation Method
Nitrate (NO3)Freshwater1 (Direct
Measurement)
Measured concentration in effluent ×
Discharged effluent volume.
Ammonium (NH4+)Freshwater1 (Direct
Measurement)
Measured concentration in effluent ×
Discharged effluent volume.
Phosphate (PO43−)Freshwater1 (Direct Measurement)Measured concentration in effluent ×
Discharged effluent volume.
Nitrous Oxide (N2O)Air3 (Default Modelling)2019 Refinement to the 2006 IPCC Guidelines (Tier 1) for direct and indirect N2O emissions.
Ammonia
(NH3)
Air3 (Default Modelling)2019 Refinement to the 2006 IPCC Guidelines (Tier 1) default factors applied to virgin N-fertilizer inputs (volatile N loss).
Table 2. Foreground inventory data for the SHS and CHS systems per FU.
SHSCHS
Productskg1 kg Cucumber and
1 kg Melon
1 kg Cucumber and
1 kg Melon
Inputs from Nature
Land Usem20.16560.1667
Water Usem30.06200.0213
Inputs from Technosphere
Ca(NO3)2kg0.06960.0104
NH4NO3kg0.00530.0016
KNO3kg0.03580.0129
KH2PO4kg0.01720.0030
K2SO4kg0.02090.0006
Energy from grid (GR)kWh0.51200.4646
Transport processestkm0.00260.0005
Emissions and Waste
Organic wastekg0.32100.3102
Waterm30.01990.0161
NO3kg0.01570.0130
NH4kg0.00016.6 × 10−5
Pkg0.00060.0004
Kkg0.00580.0050
NH3kg0.00280.0006
NOxkg0.00240.0005
N2Okg0.00049.74 × 10−5
Table 3. Environmental footprint v3.1 impact categories assessed.
Impact CategoryAbbreviationUnitImpact Category Indicator
Climate change (total) (Sub-categories: Fossil, Biogenic, Land use and LU change)CC
(CCF, CCB, CCL)
kg CO2 eqRadiative forcing as Global Warming Potential (GWP 100)
Ozone depletionODkg CFC eqOzone Depletion Potential (ODP)
Human toxicity, cancerHTCCTUhComparative Toxic Unit for humans (CTUh)
Human toxicity, non-cancerHTNCCTUhComparative Toxic Unit for humans (CTUh)
Particulate matterPMdisease incidenceImpact on human health
Ionising radiation, human healthIRkBq U 235 eqHuman exposure efficiency relative to U-235
Photochemical ozone formationPOFkg NMVOC eqTropospheric ozone concentration increase
AcidificationACmol H+eqAccumulated Exceedance (AE)
Eutrophication, terrestrialETmol N eqAccumulated Exceedance (AE)
Eutrophication, freshwaterEFkg P eqFraction of nutrients reaching freshwater end compartment (P)
Eutrophication, marineEMkg N eqFraction of nutrients reaching marine end compartment (N)
Ecotoxicity, freshwaterECFCTUeComparative Toxic Unit for ecosystems (CTUe)
Land useLUptSoil quality index
Water useWUm3 world eqUser deprivation potential (deprivation weighted water consumption)
Resource use, minerals and metalsRUMMkg Sb eqAbiotic resource depletion (ADP ultimate reserves)
Resource use, fossilsRUFMJAbiotic resource depletion (ADP-fossil)
Table 4. Potential characterization results.
Impact CategoryUnitSHSCHSReduction
ACmol H+ eq0.01550.004372.2%
CC 0.57820.336741.8%
CCBkg CO2 eq0.00030.000245.8%
CCF 0.57740.336341.8%
CCL 0.00050.000257.1%
ECFCTUe11.30801.598885.9%
PMdisease inc.9.2 × 10−82.3 × 10−874.4%
EMkg N eq0.00530.003534.2%
EFkg P eq0.00120.000829.9%
ETmol N eq0.05500.012976.5%
HTCCTUh1.4 × 10−96.1 × 10−1058.3%
HTNCCTUh6.1 × 10−92.8 × 10−954.3%
IRkBq U-235 eq0.02520.013148.1%
LUPt32.532010.574867.5%
ODkg CFC11 eq1.8 × 10−89.0 × 10−951.7%
POFkg NMVOC eq0.00420.001467.2%
RUFMJ7.79864.752739.1%
RUMMkg Sb eq4.8 × 10−68.7 × 10−781.9%
WUm3 depriv.4.48291.539065.7%
Table 5. Parameters and variation ranges used for sensitivity analysis.
ParameterOptimistic ScenarioPessimistic Scenario
Yield+10%−10%
Yield+20%−20%
Fertilizers Consumption−10%+10%
Water Consumption−10%+10%
Energy UseGreen Energy UseEnergy From the Grid (Baseline Scenario)
Disclaimer/Publisher’s Note: The statements, opinions and data contained in all publications are solely those of the individual author(s) and contributor(s) and not of MDPI and/or the editor(s). MDPI and/or the editor(s) disclaim responsibility for any injury to people or property resulting from any ideas, methods, instructions or products referred to in the content.